1. Introduction
Due to their high conversion efficiency, long cycle life, and high energy density, lithium-ion batteries have been widely used in electric vehicles and energy storage stations [
1,
2]. However, as complex nonlinear time-varying electrochemical energy storage devices, lithium-ion batteries may present safety risks during operation. Specifically, electrical abuse [
3], mechanical abuse [
4], and thermal abuse [
5] during the operation of lithium-ion batteries can lead to performance degradation or ISC faults, which may even escalate into severe thermal runaway [
6]. Additionally, to meet the energy and power requirements in various scenarios, dozens or even thousands of lithium-ion cells need to be connected in series and parallel, significantly increasing the complexity and failure probability of lithium-ion battery systems [
7].
The types of faults within battery systems are numerous and complex, with internal short-circuit (ISC) faults being a common cause of battery thermal runaway [
8,
9]. Over 40% of electric vehicle fires are attributed to ISC faults [
10]. ISC faults are generally caused by battery abuse (overcharging and over-discharging) or manufacturing defects (impurities and burrs), which is a gradually evolving process [
11]. In the early stages of an ISC, the short circuit occurs only at a few localized points within the battery, and the external characteristic is slight self-discharge. If the ISC fault progresses to a later stage, a significant amount of heat will be released quickly, causing the battery temperature to rise rapidly. This further triggers a series of chain reactions, such as the melting of the internal separator and the decomposition of the electrolyte, eventually leading to thermal runaway [
12,
13]. Therefore, it is crucial to diagnose the ISC fault as early as possible before it evolves into a thermal runaway for the safe operation of the lithium battery system. Currently, many researchers have focused on ISC diagnosis. According to the differences in diagnostic principles and approaches, the research can be categorized into model-based methods [
14,
15], data-driven methods [
16,
17], and data analysis-based methods [
18,
19].
The model-based method generally extracts fault characterization parameters from the equivalent circuit model, such as open-circuit voltage [
20], state of charge (SOC) [
21], internal resistance [
22], etc., and then compares them with the measured parameter values or normal parameter values to generate residuals, and finally evaluates the residuals to determine whether the system is faulty. For example, Yang et al. [
21] detected ISC faults by comparing the difference between the SOC estimated using an extended Kalman filter and the SOC calculated using Coulomb counting, and then further identified the short-circuit resistance to assess the fault severity. Xu et al. [
15] constructed an H∞ nonlinear observer based on an enhanced state-space battery model to estimate the SOC and short-circuit current, and then detected faults by evaluating the difference between the SOC estimated by the observer and that calculated using Coulomb counting. Another approach for model-based methods is to establish a battery pack mean-difference model, that is, to calculate the difference between the average state parameters and the worst state parameters of the battery pack for diagnosis [
23]. For example, Feng et al. [
24] used the voltage and temperature of the average battery and the worst battery in the battery pack as model input, obtained the battery’s SOC and internal resistance parameters through parameter identification and state estimation methods, and then comprehensively evaluated the difference in voltage, temperature, SOC and internal resistance between the average battery and the worst battery to determine the ISC fault and the severity of the fault. Ma et al. [
25] first sorted the voltages in the battery pack in ascending order to obtain the median cell and the minimum cell, then estimated the SOC difference between the two by extended Kalman filtering, and finally calculated the short-circuit current and resistance by linearly fitting the SOC curve. The above model-based method can accurately perform fault diagnosis. However, this method is easily affected by interference and noise in practical applications. In addition, its high requirements for model accuracy will cause a sharp increase in the amount of calculation, which is a huge challenge to the real-time computing capabilities of the hardware [
26].
With the development of machine learning technology, many studies have applied data-driven methods to battery fault diagnosis. This method focuses on exploring the regularity of battery parameters, directly extracting features from monitoring data, and using machine learning algorithms to diagnose faults [
27,
28,
29]. For example, Zhang et al. [
30] used a temporal convolutional network to estimate normal voltage, then computed the residual between the estimated voltage and the measured voltage, comparing it with an adaptive threshold to detect ISC faults. Zhao et al. [
31] developed a big data statistical method that combines machine learning algorithms with a 3R multi-layer screening strategy (3R-MSS) to detect anomalies in battery terminal voltage. Cai et al. [
32] proposed a multi-fault detection method for series-connected battery packs based on domain-adaptive neural networks, incorporating attention mechanisms and the characteristics of domain-adaptive neural networks. Data-driven methods can provide accurate diagnostic results and do not require specialized knowledge to build models. However, these methods need a large amount of real fault data for training, which incurs high training costs. Additionally, the significant computational load involved hinders their practical application [
33].
The above two types of fault diagnosis methods are based on different research ideas and can both accurately diagnose ISC faults for single cells or small battery packs. However, considering the amount of data at the energy storage power station level, which consists of thousands of lithium-ion battery cells connected in series and parallel, the above methods are still difficult to apply in real time due to the computational complexity [
34,
35]. In contrast, data analysis-based methods, which do not require identifying complex model parameters or training with large amounts of real fault data, offer simpler computations and can significantly reduce the operational pressure on the battery management system (BMS), making them highly promising for practical applications. Common approaches include those based on entropy [
36], local outlier factor [
37], and correlation coefficient [
38]. For example, Yuan et al. [
19] used the local gravity outlier detection algorithm to detect the normalized voltage to realize the diagnosis of ISC faults. Li et al. [
39] proposed to detect and locate battery faults by calculating the sample entropy value of the voltage features extracted by empirical mode decomposition. Xia et al. [
40] detected faults based on the correlation coefficient between the voltages of each cell in the battery pack and used recursive moving windows to ensure the sensitivity of fault detection. In principle, the above data analysis-based method identifies abnormal voltage data by analyzing the difference (confusion, distance, or standard deviation) between the voltages of each cell in the battery pack. However, the cells with an early micro ISC fault only show a slight decrease in voltage, and the slight difference between them and the normal cells can easily be covered by factors such as inconsistency or measurement noise, resulting in missed diagnosis. Therefore, there is still a certain degree of challenge for the diagnosis of early micro ISC faults with small fault characteristics and strong concealment.
Aiming at the problem of internal short circuit faults, this paper develops a fault diagnosis method for early micro-internal short circuits. Specifically, the main contributions of this paper are summarized as follows:
In this paper, a fault diagnosis method based on an accumulated correlation coefficient is proposed, which does not need to establish complex models. This method first uses the accumulated voltage value in the time window as the input feature, and then constructs the adjustment factor according to the distance difference of the accumulated voltage value to amplify the difference between the fault voltage correlation coefficient and the normal voltage correlation coefficient, and finally realizes the fault diagnosis.
Based on the decrease of the fault voltage correlation coefficient, a hierarchical diagnosis and early warning mechanism are established. It can quantitatively evaluate the severity of the fault in real time and track the evolution process of the fault to provide early warning support for the battery management system.
The fault experiments with different severity show that the proposed method can effectively diagnose the micro internal short circuit fault of 0.02 C size.
The remains of this paper are organized as follows. In
Section 2, the methodology is introduced in detail, including the principle of the correlation coefficient method, research progress, and the method proposed in this paper.
Section 3 introduces the design of the early micro ISC fault experiment.
Section 4 shows the experiment and analysis of different severity of early micro ISC fault diagnosis.
Section 5 summarizes the conclusions.
2. Methodology
2.1. The Principle of Correlation Coefficient Method
Lithium-ion battery energy storage power stations typically comprise thousands of cells. Taking a 3.44 MWh energy storage power station as an example, the energy storage power station is composed of 3840 3.2 V/280 Ah square LiFePO4 batteries in a combination of 10 parallel and 384 series. Specifically, the system consists of 10 battery clusters in parallel, each battery cluster is composed of 10 battery packs in series, and the battery pack is composed of 48 cells in series. Each battery pack is equipped with a battery management unit responsible for collecting the voltage and temperature of the cells in the battery pack. It can be seen that in the actual application of energy storage power stations, the series connection is the most basic combination of battery cells. Therefore, focusing on a series of connected battery packs can achieve fault diagnosis at the cell level.
The characteristic of the series-connected battery pack is that the current of each cell is the same under any normal charging and discharging conditions. Under ideal conditions, the voltage of each battery cell will be the same due to the same current input. In reality, due to inconsistencies such as the manufacturing process, heat dissipation conditions, and measurement errors of each cell, the voltage of each cell will vary in value, but the changing trend is similar. If a cell in the series module fails, its voltage value and change trend will be different from other normal cells. Therefore, by capturing the similarity changes in the voltage curves between cells, the fault in the battery pack can be determined [
41].
The correlation coefficient, which is the ratio of the covariance of the two variables to their standard deviation, is often used to measure the linear correlation between the two sets of variables
X and
Y. When applied to measure the voltage similarity coefficient between two cells,
X and
Y represent the discrete voltage data of two cells, respectively, and the calculation formula can be expressed as Equation (1):
where
is the correlation coefficient of two cells, cov (
x,
y) is the covariance of two sets of voltage data
x and
y, σ
x and σ
y represent the standard deviation of the two sets of voltage data, respectively,
n is the total number of sampling points of voltage data,
i represents the serial number of the sampling point of the voltage data, and
and
represent the means of two sets of voltage data, respectively.
The correlation coefficient is essentially a normalized measure of the covariance, and its value range [
41]. The greater the absolute value of the correlation coefficient, the higher the linear correlation between the two variables. If the correlation coefficient is 0, it shows that there is no linear correlation between the two variables. If the correlation coefficient is ±1, it indicates that the two variables are completely positive or negative linear correlations. From the definition of the correlation coefficient, as shown in Equation (1), it can be seen that the correlation coefficient has the property of a linear operation invariant, that is, the translation of the two variable positions and the scaling of the scale do not affect the correlation coefficient between them [
40]. That is to say, if the variable
x is moved to
ax +
b and the variable y is moved to
cy +
d, it will not change the correlation coefficient of the two variables
x and
y. The simple proof is shown in Equation (2):
where
x and
y are two sets of variable data.
a,
b,
c, and
d are constants, with
a and
c having the same sign.
This linear operation invariant characteristic of the correlation coefficient can eliminate the influence of inconsistency between batteries to a certain extent. Specifically, the inconsistency between batteries is mainly reflected in the differences between SOC, capacity, and internal resistance. For series-connected battery packs, the input (current) of the system is the same, and the inconsistency of SOC between batteries is manifested as the difference of open circuit voltage, which is equivalent to the translation of voltage occurrence position (corresponding to constants b and d). The inconsistency between capacity and internal resistance is manifested as the difference in the degree of voltage fluctuation at different times, which is equivalent to the scaling of the voltage generation scale (corresponding to constants a and c).
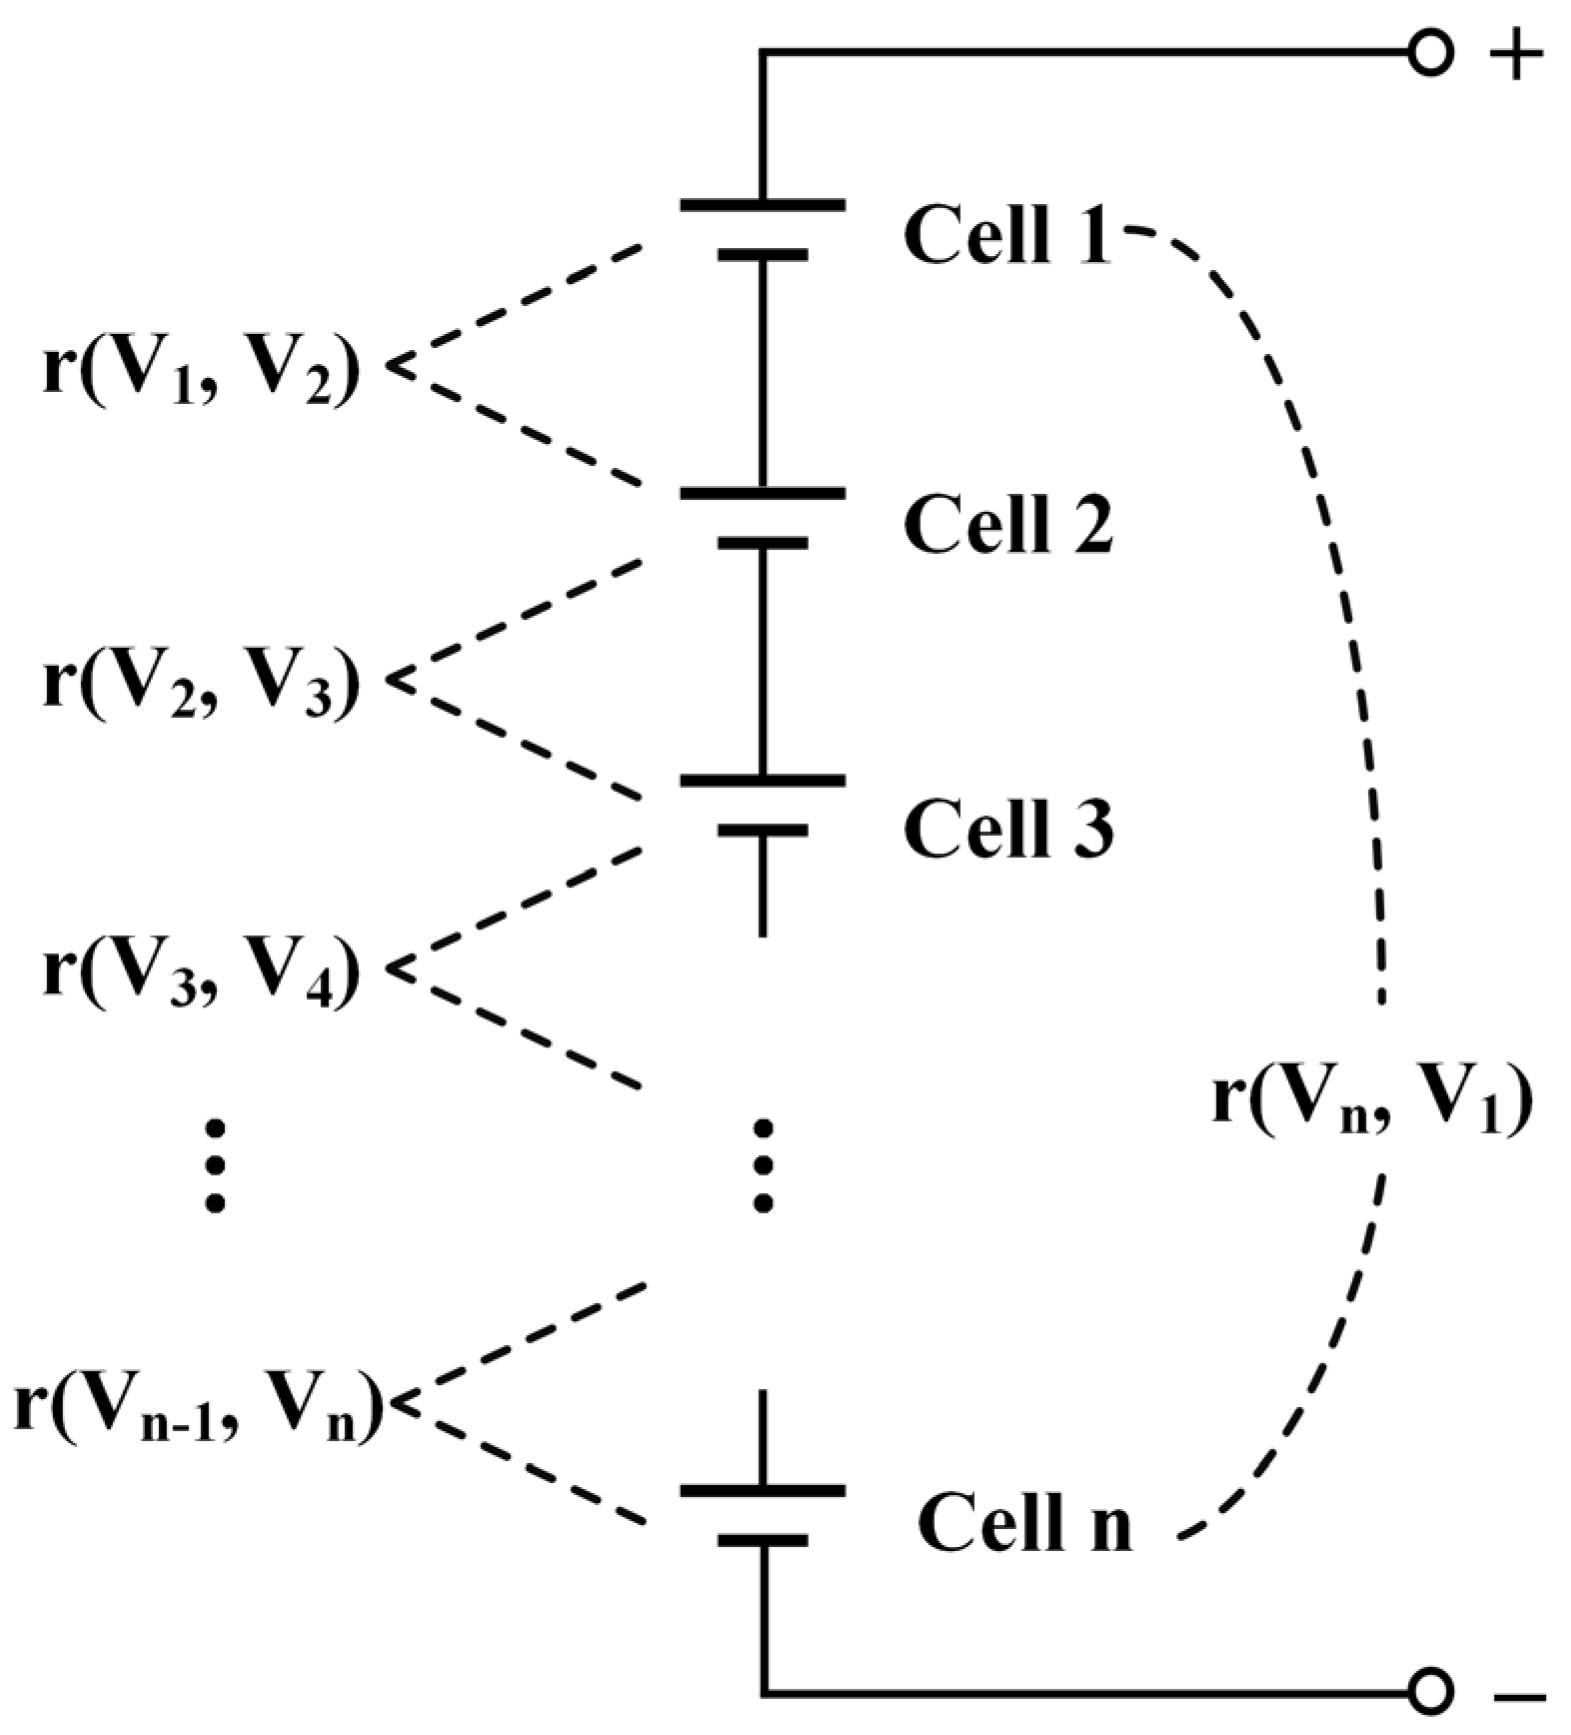
To diagnose the fault state of all cells in the series battery pack, the voltage correlation coefficient between two adjacent cells needs to be calculated, as shown in
Figure 1. When there is no fault, the voltage variation trend of the two adjacent cells is consistent, and the voltage correlation coefficient should be close to 1. However, when a battery cell fails, the voltage correlation coefficient between it and the adjacent two cells will abnormally decrease to the threshold. In addition, the fault location is located by the overlapped index number of the abnormal voltage correlation coefficient. For example, when r (V
2, V
3) and r (V
3, V
4) decrease abnormally at the same time, it indicates that cell 3 fails.
As mentioned above, the faulty battery in the series-connected battery pack will show abnormal voltage changes, and its voltage correlation coefficient will also decrease abnormally. Then, the fault diagnosis and location can be achieved by evaluating the abnormal voltage correlation coefficient. In addition, the mathematical properties of the linear operation of the correlation coefficient can greatly eliminate the influence of battery inconsistency. Therefore, the method of calculating the voltage correlation coefficient has great advantages in fault diagnosis.
2.2. Traditional Correlation Coefficient Method
Considering the interference of measurement noise and computational complexity in the application process, relevant research work has been conducted to promote the practical application of the correlation coefficient method [
40,
42], which will be introduced in detail in
Section 2.2.
2.2.1. Discrete Square Wave Correction
The voltage sampling accuracy of the battery management system configured in the actual energy storage power station or electric vehicle has an error of 0.3% to 0.1%. In addition, voltage sampling generally adopts the principle of spatial multiplexing, that is, the data of each channel is collected and updated in the time domain in sequence. Therefore, the voltage data of different batteries are not perfectly aligned in the time domain, and may occasionally shift and misalignment may occur. The existence of the above measurement errors will cause the voltage correlation coefficient to drop abnormally even under normal circumstances, which may further cause misdiagnosis.
In order to eliminate the influence of measurement error on fault diagnosis, a discrete square wave signal with a certain amplitude is generally added to the raw voltage data. The discrete square wave signal can filter out the measurement noise, improve the original similarity, and eliminate the voltage correlation decrease caused by the measurement error to a certain extent. The discrete square wave signal can be expressed as Equation (3):
where
s represents the amplitude of the discrete square wave signal,
T is the period of the discrete square wave signal, and
i represents the time.
2.2.2. Time Window Forgetting Mechanism
The voltage sampling frequency of an actual battery management system is usually 1–10 Hz, and a large amount of data will be accumulated during long-term operation. Therefore, in order to control the storage of massive data and reduce the computational complexity, a voltage data processing strategy with a time window forgetting mechanism is introduced. That is, when calculating the voltage correlation coefficient, only the voltage data within the time window is considered, and the old data beyond the time window is forgotten. In this case, the calculation of the voltage correlation coefficient at different times can be transformed from Equation (1) to Equation (4):
where
x and
y are the voltage data after discrete square wave correction;
is the space of correlation coefficients of
x and
y;
n is the total amount of data of
x and
y;
k de-notes the size of the time window;
and
denote the data vectors of the two voltages from the moment i to the moment
k +
i, respectively; and
ri denotes the correlation coefficients of the two voltages at the moment
i.
2.3. Accumulated Correlation Coefficient Method
In
Section 2.2, the previous research work on the correlation coefficient is clarified, and the design principle and necessity of the time window forgetting mechanism and discrete square wave signal are elaborated in detail. By processing the raw voltage signal, the above research work can greatly reduce the amount of calculation and the influence of measurement error, which is of positive significance to the online fault diagnosis of battery packs. However, the traditional correlation coefficient method still has insufficient diagnostic capability for ISC fault diagnosis of battery packs [
42,
43].
Specifically, for hard faults with obvious fault characteristics (such as external short circuit faults and connection faults), the voltage correlation coefficient of the faulty battery drops significantly, and it is easy to set a threshold to distinguish it from the normal voltage correlation coefficient. In this case, the ordinary correlation coefficient method has a good diagnostic effect. However, for soft faults with a slight severity of fault (such as early micro-ISC faults), the weak fault characteristics shown are easily obscured by factors such as inconsistency, measurement errors, and corrected square wave signals. In this case, the diagnostic results of the traditional correlation coefficient method are not ideal. In order to improve the performance of the correlation coefficient method in the diagnosis of early micro-short circuit faults, this paper proposes an accumulated correlation coefficient method, and its principle will be explained in detail in this summary.
2.3.1. Accumulated Voltage Value
The essence of diagnosing a battery failure by the correlation coefficient method is to calculate the similarity between the voltages of each battery, i.e., the voltage correlation coefficient. If the voltage correlation coefficients between a battery and its two neighboring batteries all drop abnormally to a threshold value, the battery is judged to be faulty. For the early micro-ISC faults, the trend of the voltage change after the fault is still consistent with the normal battery, with only a slight decrease in the value. Therefore, the voltage correlation coefficient of the faulty battery obtained by directly using the raw voltage data is still very close to 1, which means that it is difficult to set a suitable threshold to distinguish the faulty battery, resulting in misdiagnosis or missed diagnosis. For this reason, this paper adopts the accumulated voltage value instead of the raw voltage as the input feature of the correlation coefficient analysis for the diagnosis of micro ISC faults.
Under any working condition (charging, discharging, or static), the voltage of the battery with an ISC fault will always be slightly lower than the voltage of the normal battery due to internal self-discharge. By calculating the accumulated voltage value in the time window as the input of the correlation coefficient analysis, the difference in voltage values between the faulty battery and the normal battery can be amplified, that is, the ISC fault characteristics can be amplified. In this case, the voltage input characteristics at the
i-th moment within the time window can be expressed as Equation (5):
where
xj and
yj represent the original voltage measurement values at the
j-th moment;
Xi and
Yi represent the accumulated voltage values at the
i-th moment in the time window.
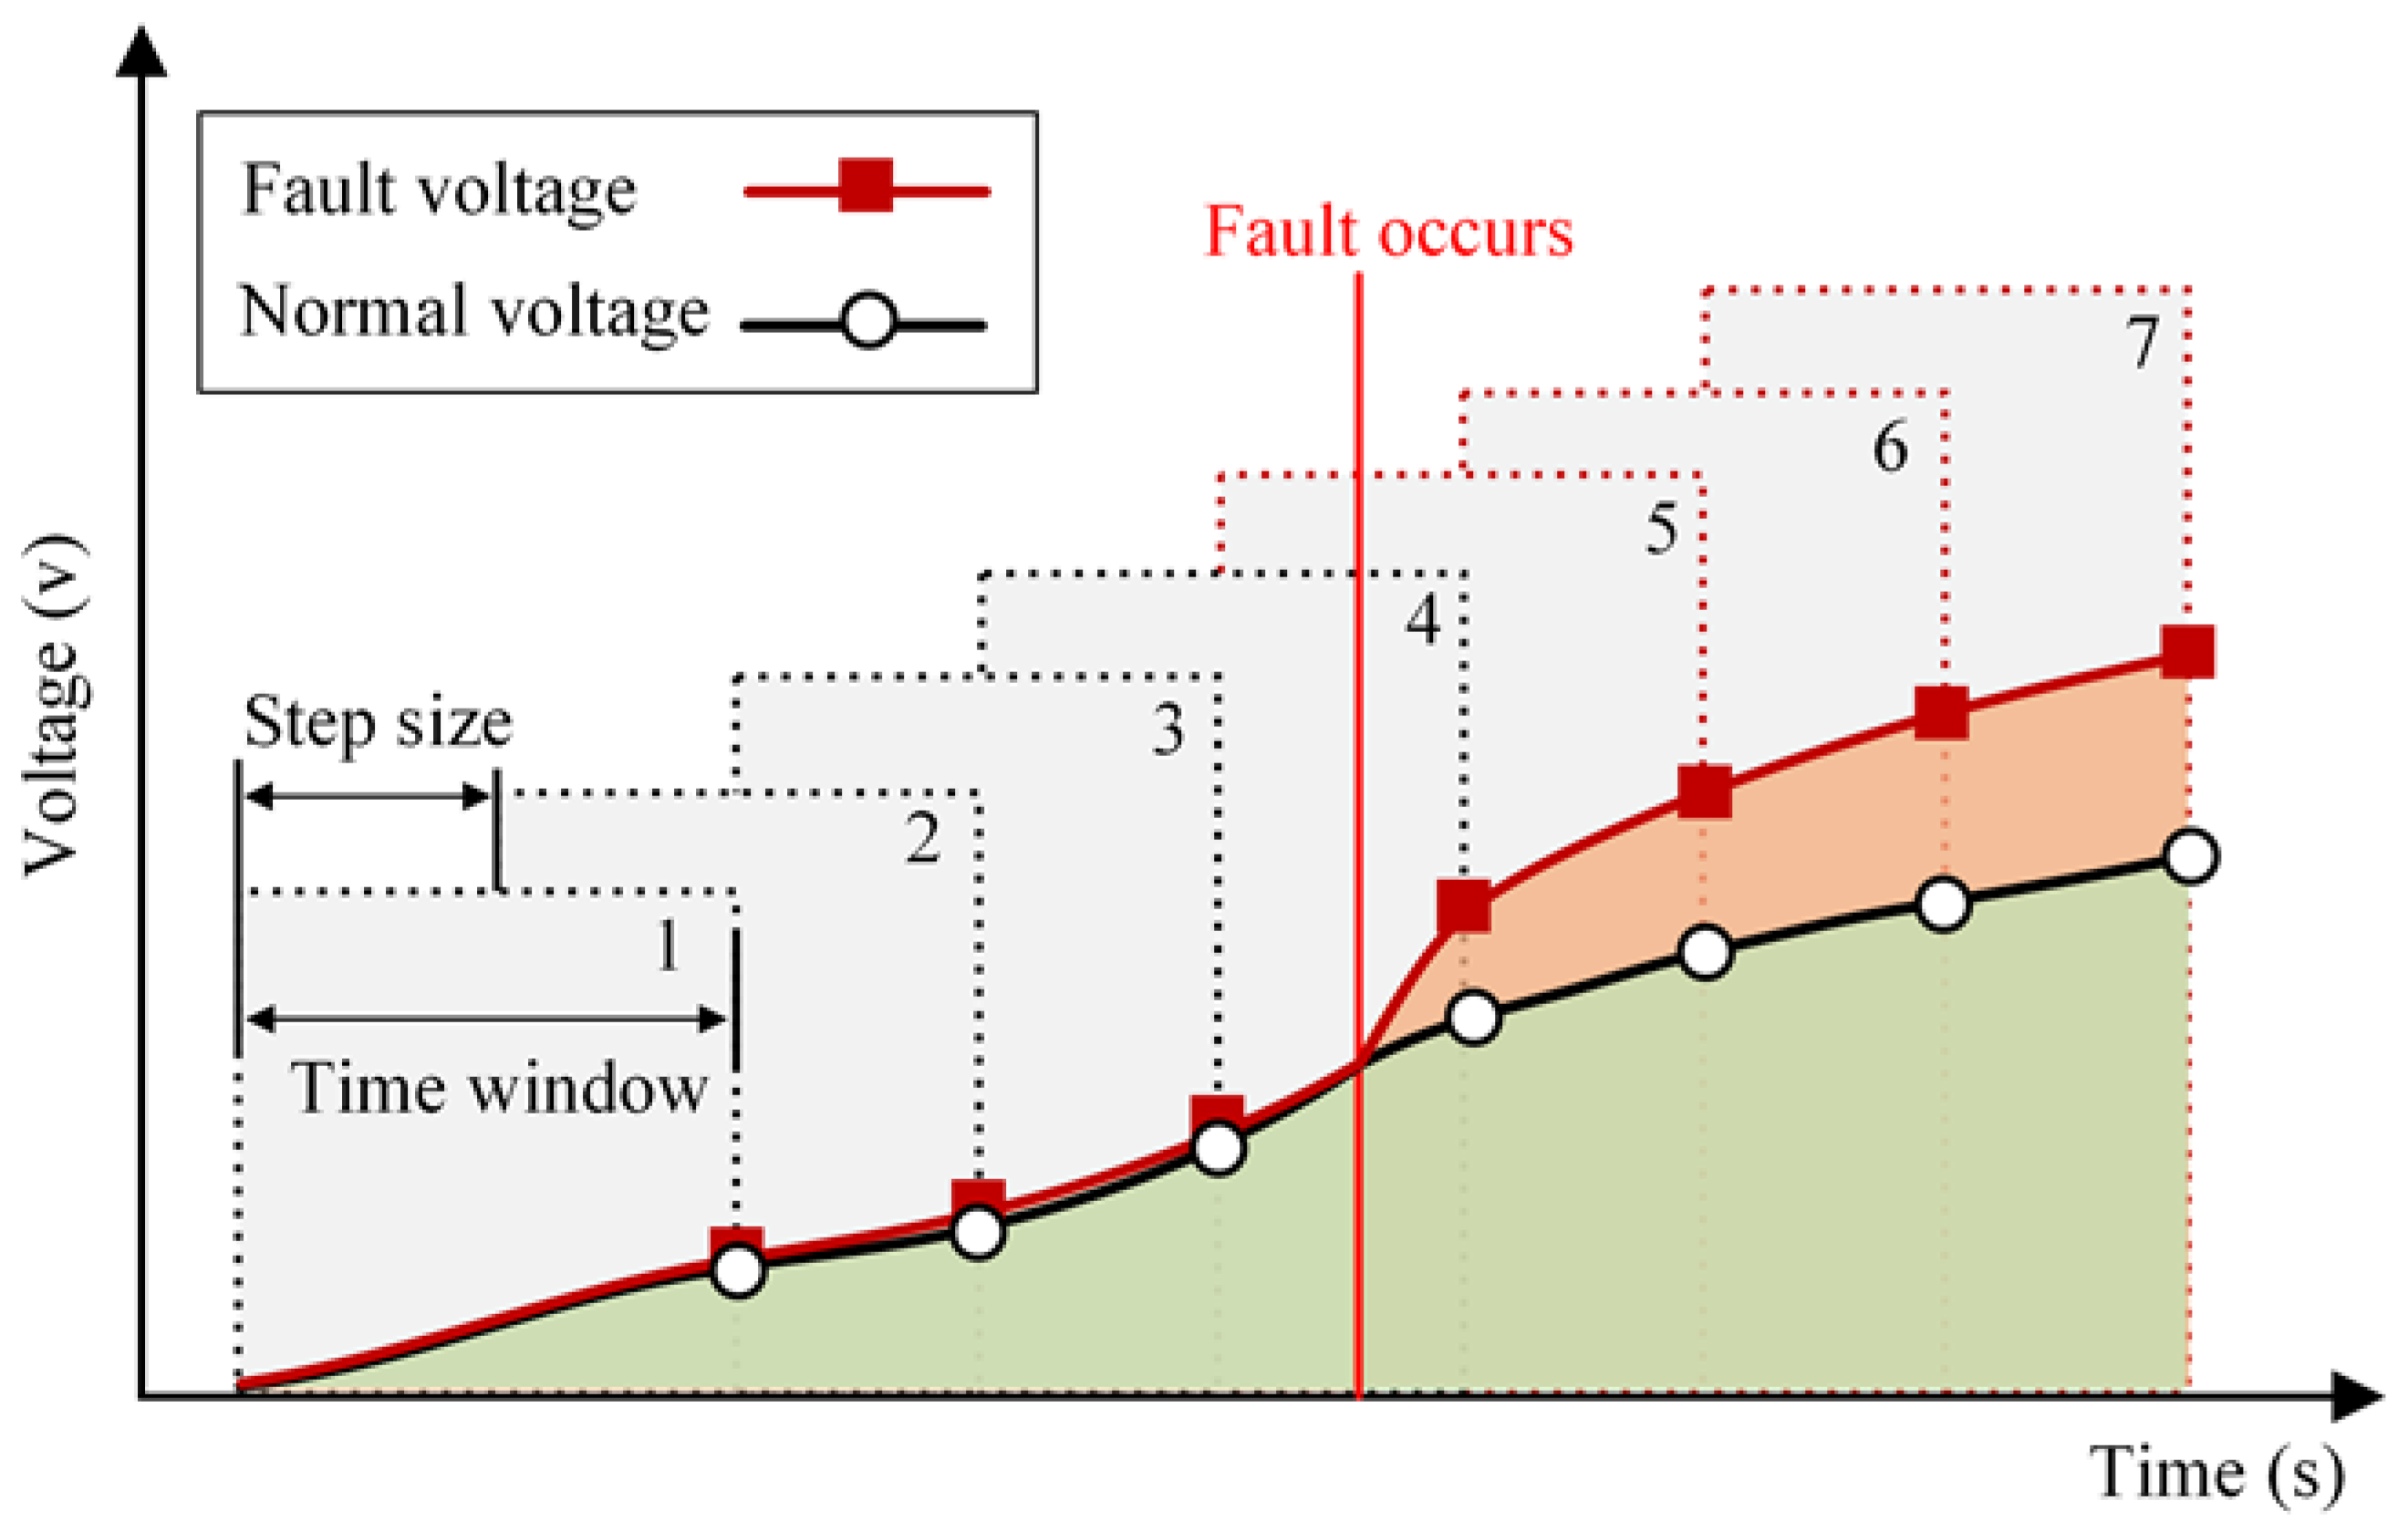
The idea of the proposed method is not to directly use the voltage value (red and black lines, but to use the accumulated voltage value (red and green shadow area) in the time window as the input of the correlation coefficient analysis to obtain the similarity of the two sets of voltages. The schematic diagram of this idea is shown in
Figure 2. It can be seen that before the micro internal short circuit fault occurs (time windows 1, 2, 3), the two sets of voltage values and trends show a high degree of similarity. And when the internal short-circuit fault occurs (time window 5/6/7), the numerical trends of the two sets of voltages are still consistent. If the voltage value is directly used as the input of the correlation coefficient analysis at this time, a high similarity may be obtained and the fault cannot be diagnosed. Compared with the difference in the numerical change trend between the fault voltage and the normal voltage, their accumulated value difference in the time window is more obvious. Taking the accumulated voltage value as the input of the correlation coefficient analysis, it is more likely to diagnose the micro internal short circuit fault.
2.3.2. Adjustment Factor
The traditional correlation coefficient method is insensitive to the magnitude of the values, and its calculation results will still show a high degree of correlation in cases where the voltage values are weakly different but the rate of change of voltage is essentially the same. Therefore, it is likely to fail in the early ISC fault diagnosis. In order to eliminate the interference caused by the same voltage change trend between the faulty battery and the normal battery, the adjustment factor based on the accumulated voltage value difference is constructed, which is expressed as Equation (6):
where
λ is the adjustment factor,
Xj and
Yj are the two sets of accumulated voltage values at time
j within the time window;
θ is the average of the absolute value of the difference between
Xj and
Yj in the time window;
k is the time window size.
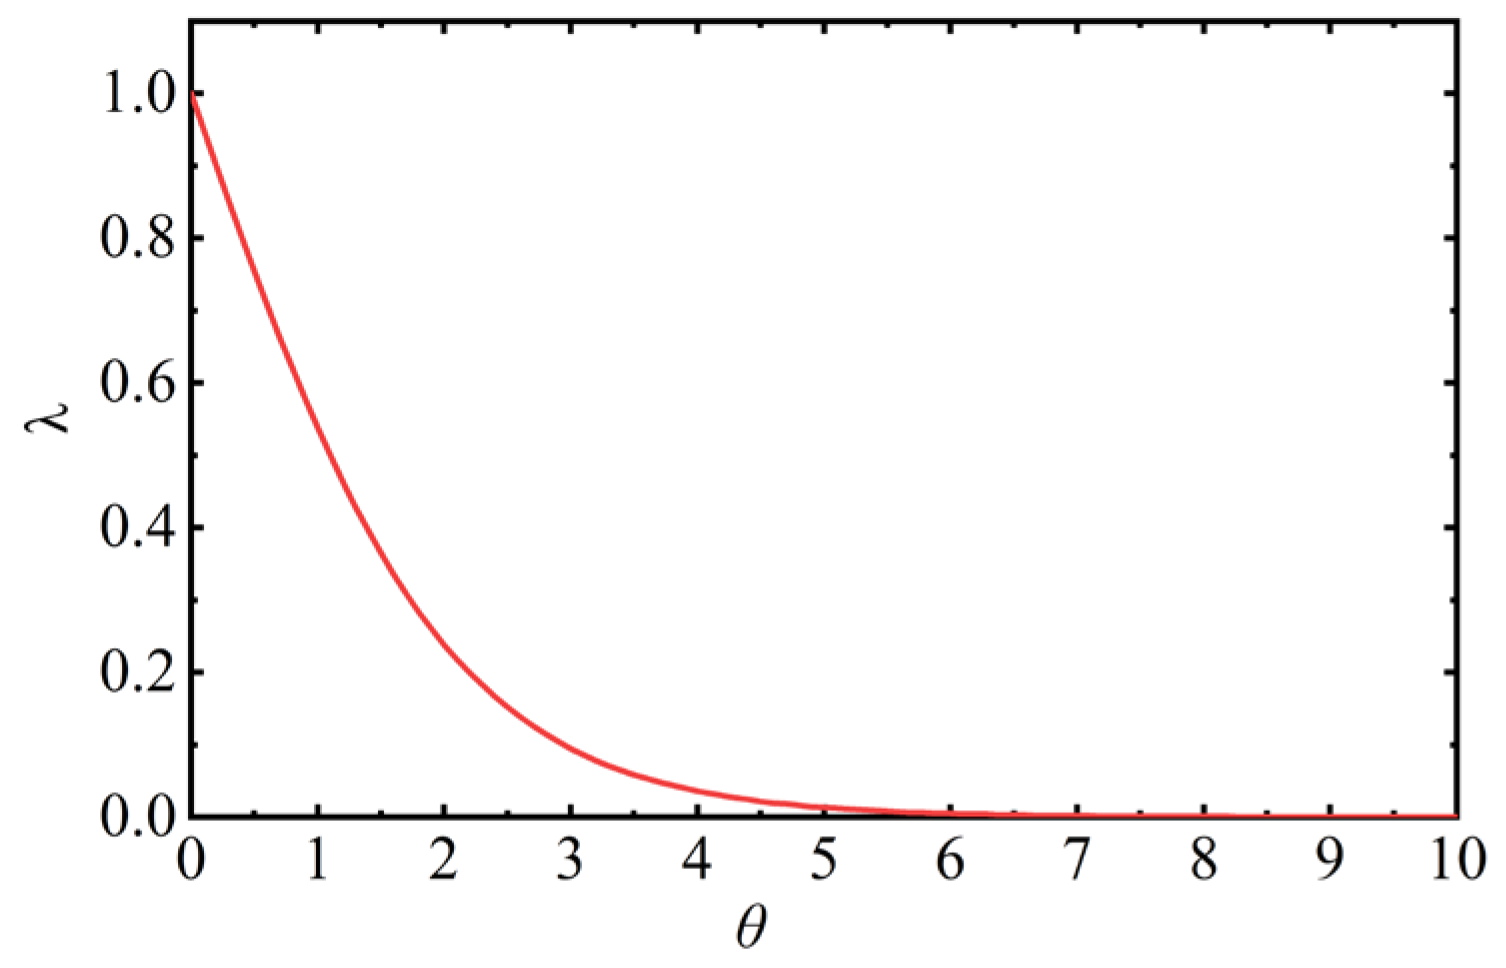
The range of the adjustment factor
λ is (0,1], and its value is determined by the θ. The change of the adjustment factor
λ with the size of θ is shown in
Figure 3. The larger the θ value, the smaller the
λ value, that is, the
λ value decreases as the average value of the difference between the two sets of voltage data accumulation values increases.
Finally, the accumulated voltage correlation coefficient
rλ (
X,
Y) can be expressed as Equation (7):
From Equation (7), it can be seen that the advancement of the accumulated correlation coefficient is shown in two aspects. First, the voltage correlation coefficient between the faulty battery cell and the normal cell is indirectly reduced by using the accumulated voltage value as an input feature. For the micro-short-circuit faulty cell, even though the trend of voltage change is the same as that of the normal cell, the difference in voltage values will be amplified by the time-scale accumulation. Second, the voltage correlation coefficient between the faulty and normal cells is directly reduced by constructing the adjustment factor λ. As the micro-inner short-circuit fault time proceeds, the numerical difference in the accumulated voltage values between the faulty and normal cells becomes larger, and the value of the regulation factor λ becomes smaller. Thereby, the difference between the fault voltage correlation coefficient and the normal voltage correlation coefficient can be increased to highlight the faulty cell by the above two points.
4. Experimental Results and Analysis
4.1. Diagnostic Results Under Different Short-Circuit Resistance
In this section, the diagnostic results of the traditional correlation coefficient method and the proposed accumulated correlation coefficient method under different short-circuit resistances are compared and analyzed. In addition, the bounds of the diagnostic capability of the proposed method are determined. For all voltage correlation coefficient calculations, the amplitude S of the discrete square wave is set to 0.05 and the time window k is set to 200.
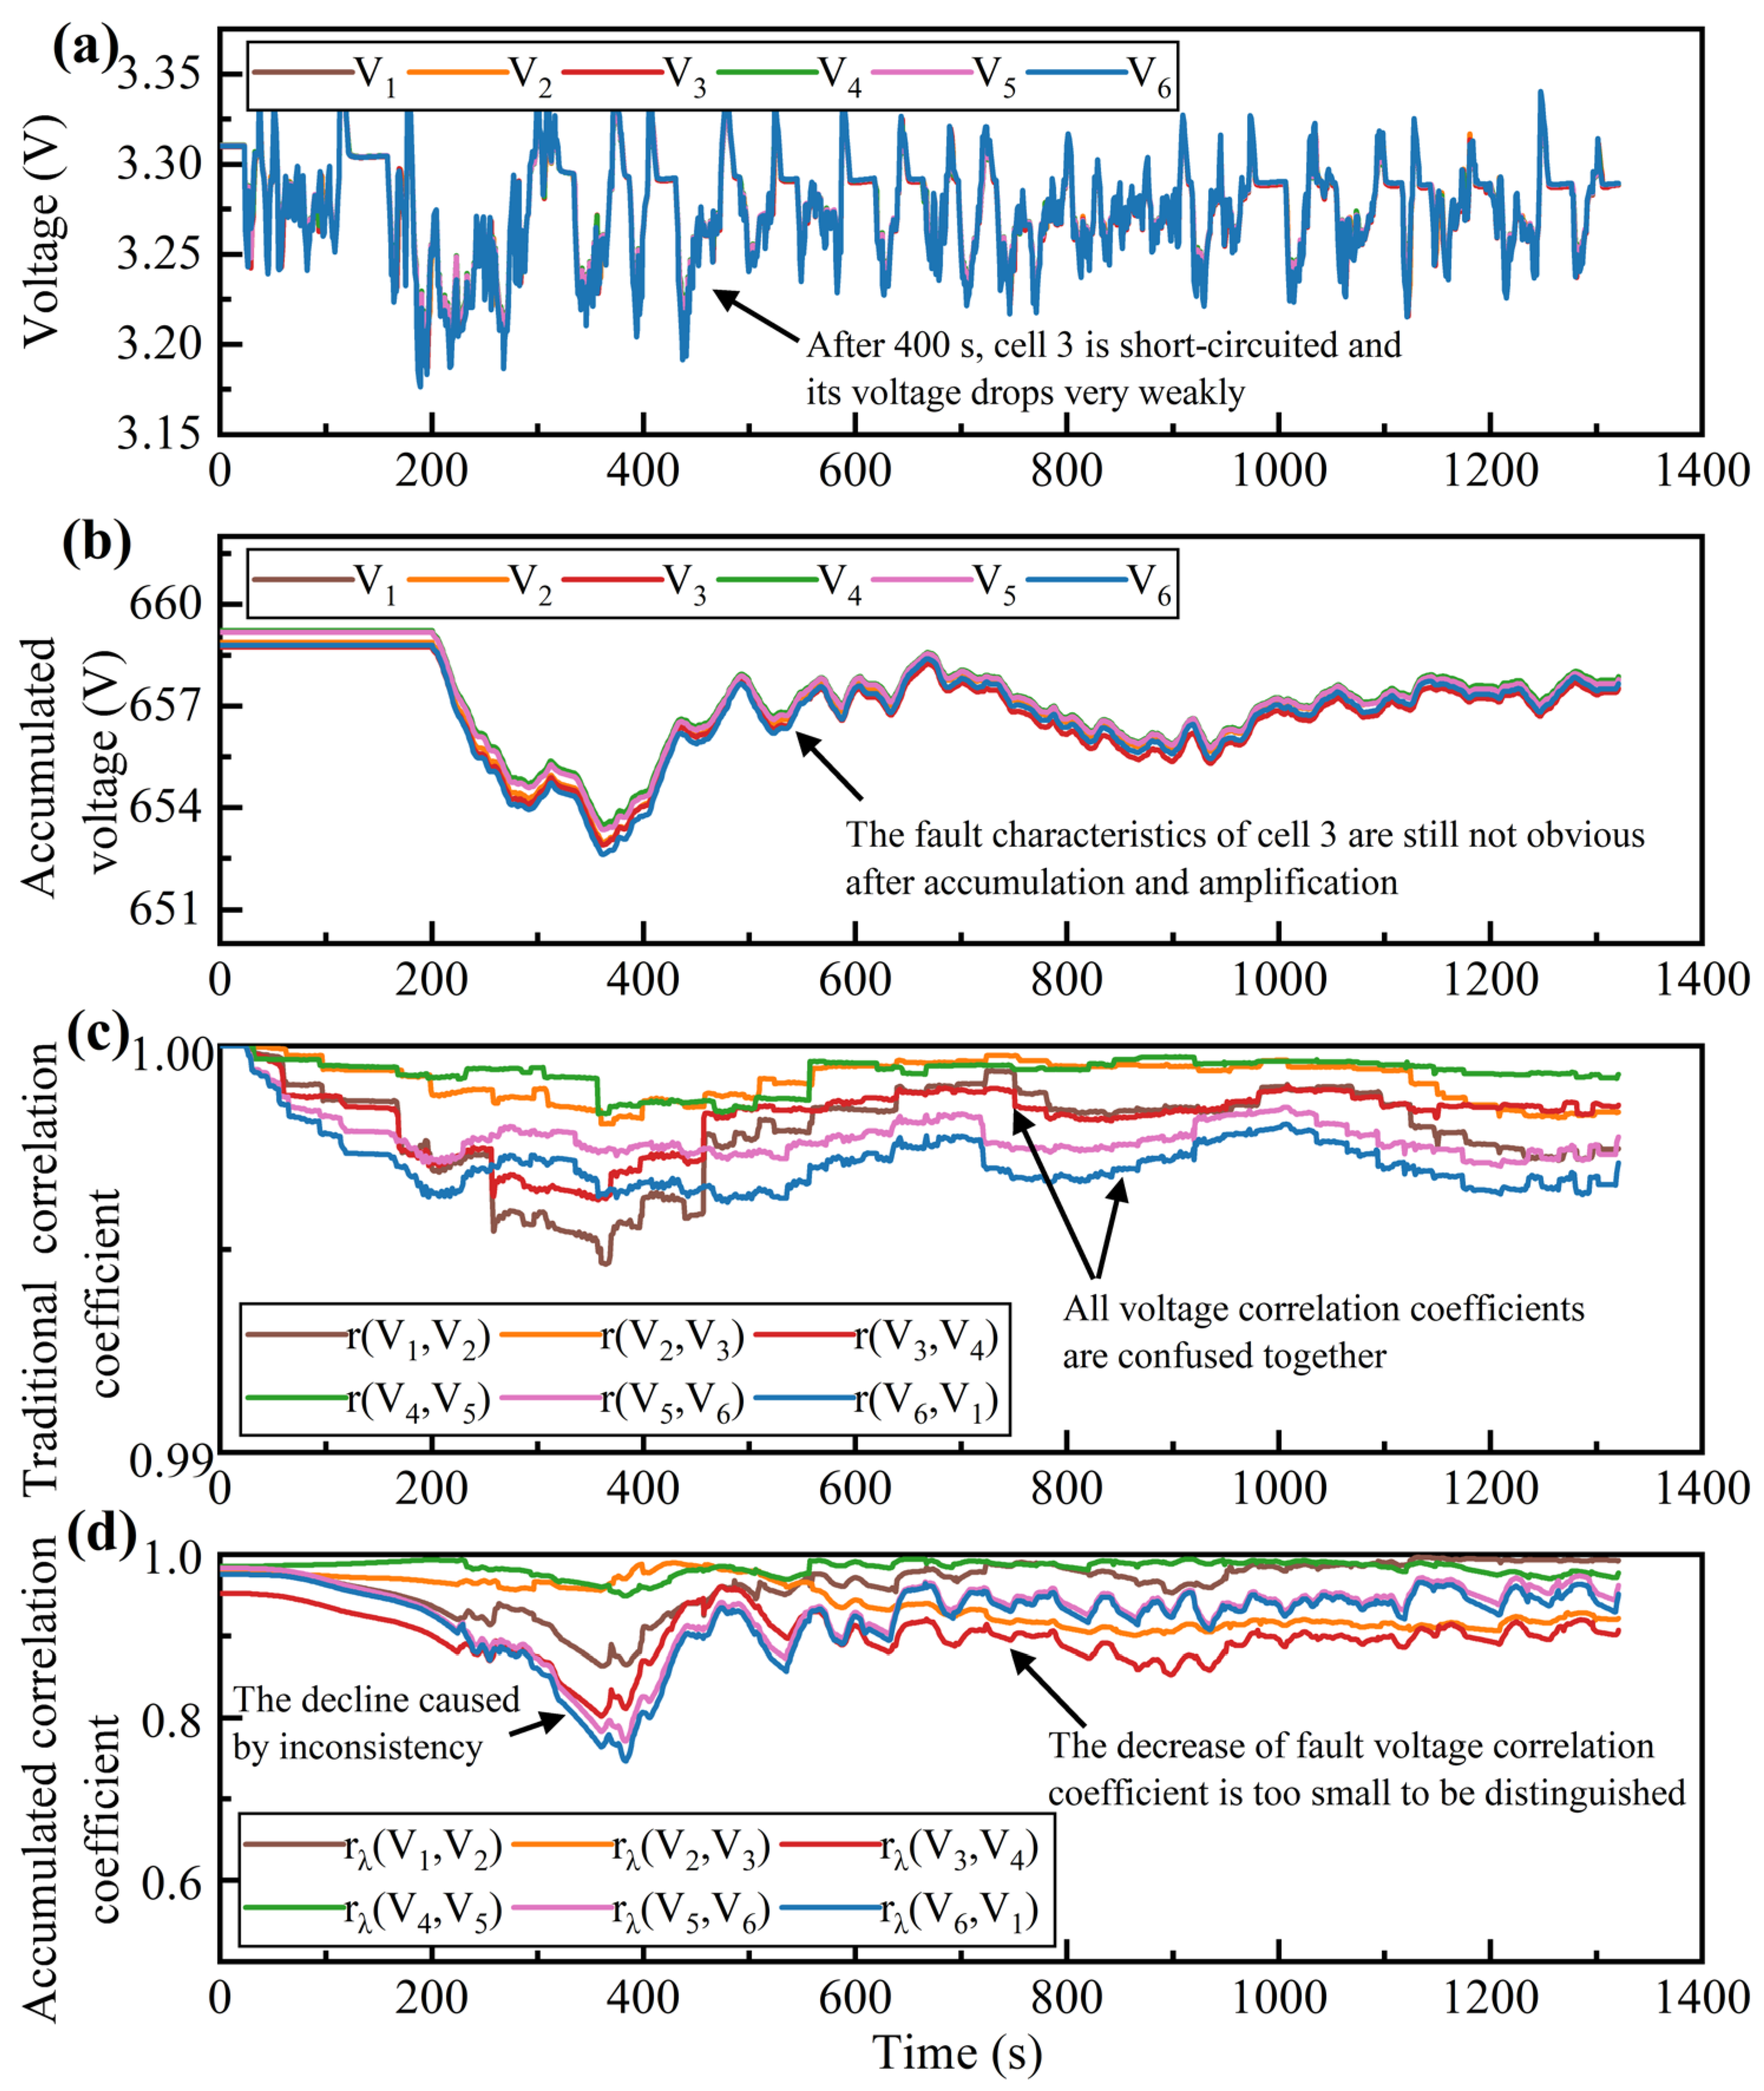
The diagnostic results for a short circuit resistance of 0.5 Ω are shown in
Figure 5.
Figure 5a shows the voltages of cell 1 to cell 6 under the UDDS cycle, and it can be seen that after the ISC occurred in cell 3 in the 400 s, its voltage V
3 decreased slightly and remained slightly lower than the voltage of the normal cell during the period of the ISC fault (from 400 s to the end of this cycle). However, due to the small short-circuit resistance, the voltage V
3 of cell 3 is still within the upper and lower cutoff voltage range (2 V~3.65 V).
Figure 5b shows the accumulated voltage value of cell 1 to cell 6 in the time window. Comparing
Figure 5a,b, it can be seen that the accumulated voltage value can numerically amplify the voltage difference between the faulty and normal cells to a great extent, highlighting the short-circuit fault characteristics more clearly.
The diagnostic results of the traditional correlation coefficient method are shown in
Figure 5c. Where r (V
2, V
3) and r (V
3, V
4) represent the traditional voltage correlation coefficients between the faulted cell 3 and its neighboring cells 2 and 4, respectively, it can be seen that the values of the two remain normal (close to 1) even after the fault occurs in the 400th s. In addition, the value variations of r (V
2, V
3) and r (V
3, V
4), as the fault voltage correlation coefficients, have been confused with the normal voltage correlation coefficients throughout the UDDS cycle and cannot be effectively differentiated, which means that the fault thresholds cannot be set for effective diagnosis.
The diagnostic results of the accumulated correlation coefficient method are shown in
Figure 5d. The fault voltage correlation coefficients r
λ (V
2, V
3) and r
λ (V
3, V
4) dropped significantly at 400 s and stabilized below 0.5 after 200 s (i.e., a time window), which is significantly different from the normal voltage correlation coefficients. In this case, if the fault threshold is set to 0.5, the ISC fault can be effectively diagnosed. It should be noted that during normal working conditions from 200 to 400 s, all voltage correlation coefficients also dropped. This is because the voltage inconsistency caused by the large current during this period increased, resulting in a decrease in voltage similarity. However, this drop is much smaller than the fault threshold of 0.5, and will not interfere with subsequent fault diagnosis and cause misdiagnosis. Therefore, taking the accumulated voltage value within the time window as the input feature and introducing the adjustment factor according to the distance difference of the accumulated voltage value can effectively distinguish the fault characteristics. And further, by setting an appropriate fault diagnosis threshold, the proposed method can effectively diagnose the short circuit fault within a time window.
The diagnosis result of the short-circuit resistance of 5 Ω is shown in
Figure 6. From
Figure 6d, it can be seen that even after the short-circuit fault occurs in the 400th s, the fault voltage correlation coefficients r
λ (V
2, V
3) and r
λ (V
3, V
4) are always close to 1 and are confused with the normal voltage correlation coefficients, making it difficult to define the threshold for diagnosis. Analyzing the changes in the terminal voltages of each cell in
Figure 6a,b, it can be seen that the voltage V
3 of cell 3 after the fault is almost the same as that of other normal cells in terms of the trend and magnitude of the value. This indicates that the characteristics of the ISC fault caused by the 5 Ω short-circuit resistor are too small, and even after the amplification of the proposed method, they are still easily masked by the inconsistency of the cells and the measurement error. The above discussion shows that even though the proposed method can amplify the fault characteristics to identify the micro faults, there is a diagnostic limit.
Taking the accumulated correlation coefficient between the voltage of faulty cell 3 and its adjacent cells 2 and 4 as an example, the diagnostic comparison results under four short-circuit fault severity are shown in
Figure 7. Obviously, as the short-circuit resistance decreases, that is, the short-circuit severity becomes heavier, and the magnitude of the decrease in the accumulated correlation coefficient gradually increases. When the short-circuit resistance is 2/1/0.5 Ω (the corresponding equivalent short-circuit current is 1.6/3.2/6.4 A, respectively, which is converted into a multiple of approximately 0.02/0.03/0.06 C, respectively), the accumulated correlation coefficient result drops significantly to below 0.8. This shows that the proposed method can effectively amplify the fault characteristics of cell 3 and can easily define the threshold to achieve fault diagnosis. However, when the short-circuit resistance is 5 Ω (the short-circuit current is only 0.6 A, equivalent to 0.006 C), the voltage of the short-circuit fault cell 3 is almost the same as that of the normal cell, and the accumulated correlation coefficient only decreases slightly. This shows that at this time, the fault characteristics of cell 3 cannot be clearly distinguished from the normal cell after amplification, and the proposed method fails. Therefore, it can be considered that the 0.02 C short-circuit current is the fault diagnosis boundary of the proposed accumulated correlation coefficient method.
In fact, the severity of the fault is proportional to the decrease of the fault correlation coefficient (or the fault threshold). Therefore, by monitoring the change of the voltage correlation coefficient r
λ, the evolution process of the ISC fault can be effectively diagnosed and predicted. As shown in
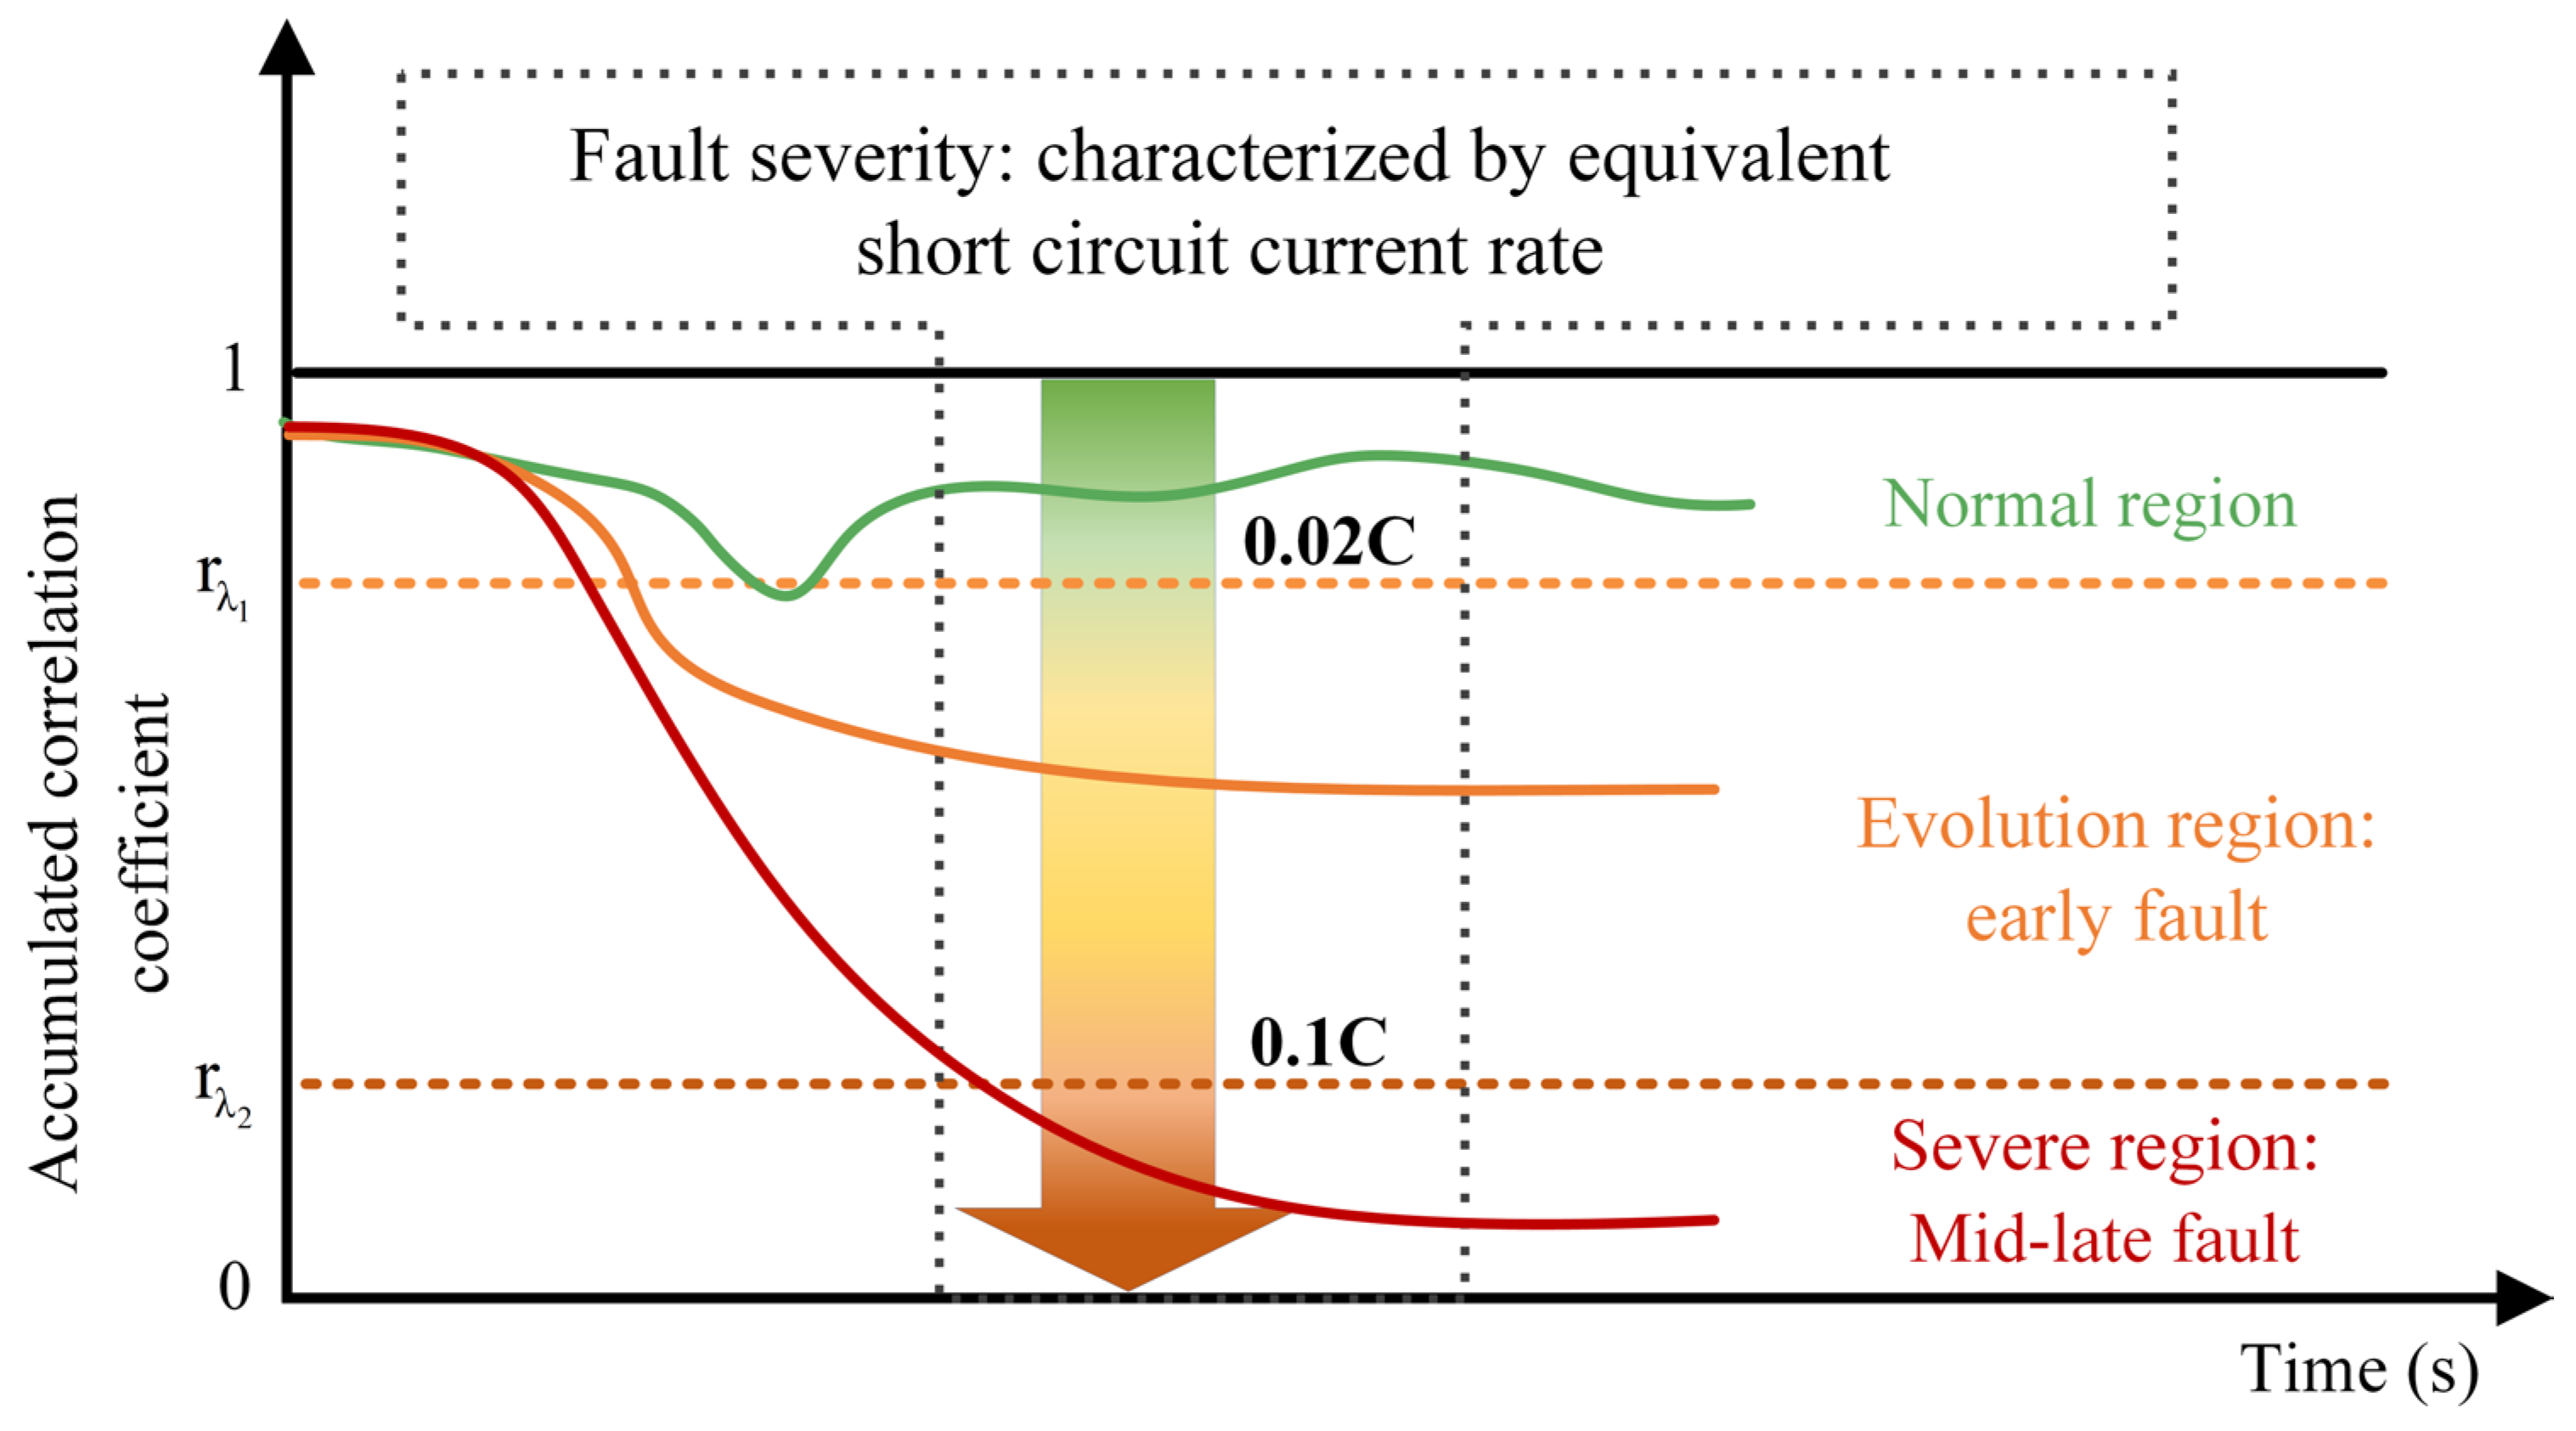
Figure 8, the diagnosis results of the fault voltage correlation coefficient are divided into three regions: normal region, evolution region, and severe region. For normal batteries, the voltage correlation coefficient only fluctuates in the normal region or occasionally fluctuates briefly near the critical value of the evolution region, which may be caused by coupling factors such as battery inconsistency, measurement error, and fault threshold setting. If the voltage correlation coefficient drops to the evolution zone and remains stable, it indicates that the battery has experienced an early ISC fault. In this case, timely maintenance and replacement of the battery should be considered. If the voltage correlation coefficient continues to decline and stabilizes in the severe area, it indicates that the battery has an obvious temperature rise, and continuous charging and discharging may lead to thermal runaway. In this case, the battery should be stopped immediately for maintenance and replaced. In general, the greater the short-circuit current, the more serious the ISC fault, and the greater the decrease in the correlation coefficient. Therefore, according to the value of the fault voltage correlation coefficient, a multi-level diagnosis and early warning mechanism can be established to diagnose the occurrence and evolution of ISC faults.
The critical short-circuit current of the evolution region and the severe region is determined by the type and capacity of the lithium-ion battery. For quantitative comparison, the short-circuit current is expressed in the form of charge–discharge rate (the ratio of short-circuit current to rated capacity). For the 100 Ah lithium iron phosphate battery tested in this paper, when the short-circuit current is greater than 0.02 C (the short-circuit resistance is 2 Ω), the proposed method can effectively diagnose the fault. When the short-circuit current reaches 0.1 C (short-circuit resistance is 0.3 Ω), the battery has a significant temperature rise, which is considered to have developed into a mid-to-late fault. For different types and capacities of lithium-ion batteries, the critical short-circuit current is different, which should be determined by specific experiments.
4.2. Diagnostic Analysis Under Different Time Window Sizes
The time window size determines the sensitivity of fault diagnosis. If the time window is too large, the diagnostic method will be slow to respond, and short-term and minor fault information may be covered by normal data, thus resulting in untimely or missed fault diagnosis. On the contrary, if the time window is too small, the diagnostic method will be too sensitive, and it is easy to diagnose the decrease in the correlation coefficient caused by factors such as battery inconsistency and measurement error as a fault, thereby resulting in misdiagnosis. Therefore, the setting of the time window size should comprehensively consider multiple factors such as measurement accuracy, fault type, and fault characteristics to achieve the best diagnostic effect.
Taking the fault diagnosis of short-circuit resistance of 1 Ω as an example, the diagnosis results under different time window sizes are shown in
Figure 9. It can be seen that the decline of fault voltage correlation coefficients r
λ (V
2, V
3) and r
λ (V
3, V
4) increases with the increase of time window size, and the difference with normal voltage correlation coefficients is becoming more and more obvious, which means that it is easier to set the fault threshold clearly to avoid missed diagnosis. However, it should be emphasized that the fault threshold should not only be able to clearly distinguish faulty cells from normal cells after the fault occurs but also avoid misdiagnosis of normal cells as much as possible. As shown in the diagnosis result at T = 100 s in
Figure 9a, the three groups of normal voltage correlation coefficients r
λ (V
3, V
4), r
λ (V
5, V
6), and r
λ (V
6, V
1) briefly dropped to 0.85 at 300 s due to battery inconsistency. This situation where the normal voltage correlation coefficient is lower than the fault threshold is very likely to lead to misdiagnosis of normal cells.
To solve the misdiagnosis problem, the time window size can be increased appropriately. The increase in the time window size will make the accumulated fault characteristics larger (Equation (5)) as well as the regulation factor smaller (Equation (6)), which can cause the fault voltage correlation coefficient to decrease more dramatically and increase the difference between the fault threshold and the normal voltage correlation coefficient, so as to avoid misdiagnosis. As shown in
Figure 9b–d, when the time window is larger than 200 s, the fault voltage correlation coefficient or fault threshold is significantly lower than the normal voltage correlation coefficient in the whole domain time because the accumulated voltage fault characteristics in a large time window will “mask” the negative effects caused by inconsistency and measurement error.
In fact, the increase in the size of the time window leads to some degree of diagnostic delay. However, the diagnostic delay due to the increase in the time window can be accepted because the severity of the early ISC fault is mild and this diagnostic delay time is insignificant compared to the evolution process of the ISC. Therefore, for the continuous slow evolution type faults (e.g., early micro ISC faults) with mild fault severity and small fault characteristics, in order to avoid misdiagnosis due to inconsistency and measurement errors, a certain diagnostic sensitivity can be sacrificed and the time window can be increased appropriately.
4.3. Comparison of the Proposed Method with Other Methods
In order to further verify the effectiveness of the proposed method, three other methods in the recent literature were selected to compare with the proposed method. The diagnostic speed, diagnostic ability, and advantages and disadvantages of the four methods were used as evaluation indicators.
Table 2 lists the comparison of different diagnostic methods.
Table 2.
Comparison of different diagnostic methods.
Table 2.
Comparison of different diagnostic methods.
| | Diagnostic Capability | Diagnostic Speed | Advantage | Shortcoming |
|---|
The proposed
method | 0.02 C | Minute level | Strong diagnostic capability
No modeling required | Slower diagnostic speed |
| Reference [34] | 0.17 C | Second level | No modeling required
Fast diagnosis | Weak sensitivity to micro-short-circuit faults |
| Reference [19] | 0.09 C | Second level | No modeling required
Fast diagnosis | Sensitive to the noise Sensitive to parameter selection |
| Reference [44] | 0.03 C | Second-Hour level | High accuracy
Fast diagnosis of severe faults | The model is complex
Parameter calibration is affected by aging |
The method based on cosine similarity in ref. [
34] diagnoses the internal short-circuit fault by calculating the voltage cosine similarity of adjacent cells in the battery module. The experimental results show that the method can realize the rapid diagnosis of internal short-circuit faults in a few seconds. This method has the advantages of a fast, small amount of calculation and non-modeling, but it can only diagnose short-circuit faults greater than 0.17 C, and the diagnostic ability is less than that of the proposed method. The method based on local outlier detection in ref. [
19] uses the local gravity outlier detection algorithm to detect the normalized voltage to achieve early diagnosis of ISC faults. The experimental results of ISC faults of different severity show that this method can accurately and quickly diagnose faults even when the fault characteristics are not obvious. Its diagnostic speed is at the second level, and the diagnostic capability is improved to 0.09 C. Ref. [
44] proposed a comprehensive fault diagnosis method based on the electrothermal consistency deviation model. Fault experiments showed that this method has strong adaptability to fault diagnosis of different severity and time scales, which is an advantage that the method proposed in this article does not have. Specifically, for severe faults with small equivalent internal resistance and short time scale, it can achieve second-minute level diagnosis based on the voltage–temperature consistency deviation. For micro faults with high equivalent internal resistance and undetectable temperature rise, this method can still achieve 0.03 C level micro fault diagnosis within a few hours through the consistency difference of SOC, when the voltage and temperature consistency deviation diagnosis fails. In comprehensive comparison, the proposed method has stronger fault diagnosis capability, which can diagnose a 0.02 C micro internal short circuit fault. However, it is slower in diagnostic speed. In fact, the calculation of the method proposed in this paper is not complicated, but the data in the minute-level time window is needed to accumulate faults.
4.4. Limitations of the Current Study and Directions for Future Work
Although the micro internal short circuit fault diagnosis method for lithium-ion batteries proposed in this study based on the accumulated correlation coefficient shows significant diagnostic capability, there are still some limitations that require further research.
The limitations of the experimental environment: The experiment in this study was completed in a laboratory-controlled environment, which eliminated the effects of many complex actual conditions (such as severe temperature fluctuations, vibration, humidity changes, and mechanical stress). However, in practical applications, batteries may be exposed to more complex external conditions, which may introduce noise signals and interfere with diagnostic accuracy.
The singularity of the fault mode: The method in this paper is aimed at the specific fault mode of micro internal short circuit, and the experimental data and verification are mainly focused on this kind of fault. In actual battery operation, there may be multiple types of faults (such as overcharge and discharge, connection faults, etc.) at the same time. The complexity and interaction effects of these faults may put forward higher requirements for the universality of diagnostic methods. Therefore, it is still an important research direction to further expand the diagnostic capability of the method to cover a wider range of fault modes.
The selection of time window: The length of time window is one of the key parameters of the method performance. This paper adopts a fixed window diagnosis strategy but fails to fully consider the possibility of dynamically adjusting the window length. The fixed window may have an insufficient amplification effect on fault features under certain conditions, or cause the normal signal to be misjudged as a fault signal. In addition, for fault signals with rapid changes or strong randomness, a fixed time window may limit the real-time and accuracy of diagnosis. Therefore, the selection of an adaptive time window or multi-scale analysis method is worth further exploration.


