Article

Simulating Water Invasion Dynamics in Fractured Gas Reservoirs

1
Research Institute of Exploration and Development, Southwest Oilfield Company, PetroChina, Chengdu 610500, China
2
State Key Laboratory of Reservoir Geology and Development, Southwest Petroleum University, Chengdu 610500, China
*
Authors to whom correspondence should be addressed.
Energies 2024, 17(23), 6055; https://doi.org/10.3390/en17236055
Submission received: 27 October 2024 / Revised: 26 November 2024 / Accepted: 29 November 2024 / Published: 2 December 2024

Abstract

:
The Longwangmiao Formation gas reservoir in the Moxi block of the Sichuan Basin is a complex carbonate reservoir characterized by a low porosity and permeability, strong heterogeneity, developed natural fractures, and active water bodies. The existence of natural fractures allows water bodies to easily channel along these fractures, resulting in a more complicated mechanism and dynamic law of gas-well water production, which seriously impacts reservoir development. Therefore, a core-based simulation experiment was designed for oil–water two-phase flow. Three main factors influencing the water production of the gas reservoir, namely fracture permeability, fracture penetration, and water volume multiple, were analyzed using the orthogonal test method. The experimental results showed that the influences of the experimental parameters on the recovery factor and average water production can be ranked as water volume multiple > fracture penetration > fracture permeability, with the influence of the water volume multiple being slightly greater than that of the other two parameters. It provides a certain theoretical basis for water control of the gas reservoir.

1. Introduction

Pore structures in carbonate reservoirs consist of three basic types: fracture vugs, fractures, and pores [1]. Fractures play a significant role in reservoirs. On the one hand, the existence of fractures improves the seepage conditions; on the other hand, edge-bottom water channeling along fractures can cause premature flooding in production wells, leading to adverse effects on gas recovery rate [2,3,4,5,6]. Fracturing or drilling processes can also affect the water output of gas well [7,8]. The Longwangmiao Formation gas reservoir in the Moxi block of the Sichuan Basin is characterized by developed faults and fractures, with the reservoir type being primarily the fracture type. There exists well-developed bottom water in the gas field, with active water body energy in local areas. Some wells of the gas reservoir have encountered water production issues in the initial stage of operation, which have severely restricted efficient development of the reservoir. Therefore, it is necessary to research the water invasion law for the fractured gas reservoir.
Currently, there is relatively little research on the water invasion mechanism in naturally fractured gas reservoirs, and most studies are conducted through numerical simulation [9,10,11,12,13,14,15]. In physical experimental studies, glass models or cast thin sections are utilized to carry out microscopic water flooding experiments to understand the micro-seepage mechanism [16,17,18,19,20,21], while the studies on macroscopic water invasion laws and development effects are mainly conducted through long-core physical experiments [22,23,24]. Shen Weijun [22] studied water invasion mechanisms under the conditions of various fracture widths using a whole-fracture core experiment, but did not consider the different degrees of fracture penetration. He Jialin [23] took into account fracture penetration, but more cores were required for his experiment. However, the gas well of the target reservoir was approximately 4000 m deep, resulting in high costs for core sampling and difficulties in obtaining complete carbonate long cores. Given this situation, a rational experimental method was designed. Under the core-limited conditions, it is possible to carry out an efficient and reliable experiment with a small number of core samples by optimizing the experimental sequence and combining the core cutting and fracturing, along with the orthogonal test method. This allows for analyses and a sensitivity study on fracture permeability, fracture penetration, and water volume multiple.

2. Experimental Objective

A simulation experiment of water invasion was conducted using carbonate cores with fractures that were obtained by artificially fracturing full-diameter reservoir core samples to simulate the depletion of fractured carbonate gas reservoirs with edge-bottom water. It aimed to evaluate the impacts of fracture permeability, fracture penetration, and water body volume on the water invasion law of gas wells, thereby providing a theoretical basis for water control.

3. Experimental Setup and Procedure

3.1. Experimental Setup

In accordance with the experimental requirements, the experimental setup for the study on water invasion mechanism was designed as shown in Figure 1. This setup consisted of a confining pressure pump, core holder, pressure gauge, flowmeter, back pressure controller, and so on. The core holder is a critical component in a core displacement device, which was positioned vertically to simulate a gas reservoir. The intermediate container was connected to the bottom of core holder and filled with formation water to simulate bottom water. The back pressure controller and the gas flowmeter were used for production regulation.

3.2. Experiment Conditions

3.2.1. Experimental Temperature and Pressure

The experimental temperature was set at 142 °C according to the reservoir temperature of the Longwangmiao Formation gas reservoir.
The experimental internal pressure and confining pressure were 75 MPa and 85 MPa, respectively, according to the formation pressure of the Longwangmiao Formation gas reservoir.

3.2.2. Experimental Fluids

Natural gas and formulated formation water were chosen as the experimental fluids. The natural gas was sampled on site (Table 1), while the formation water for experimental use was prepared in the laboratory based on an analysis report of the field water samples (Table 2).

3.2.3. Experimental Cores

Carbonate cores that met the requirements were selected from full-diameter reservoir core samples. Artificial fractures were created to obtain the experimental fractured carbonate cores. In this study, cylindrical carbonate cores with a length of 18.23 cm and diameter of 9.92 cm were utilized, which had a porosity of 4.2% and permeability of 0.97 mD under an overburden pressure of 75 MPa. The artificial fractures were created by splitting the cores in the middle and filling them with quartz.

3.3. Experimental Scheme Design

A sensitivity analysis was conducted in this experiment using three parameters, fracture permeability, fracture penetration, and water volume multiple, to determine their effects on water invasion in gas wells. The upper and lower limits of the experimental parameters were set according to the actual situation of the gas reservoir. An orthogonal design method was adopted for the experimental schemes to carry out the corresponding physical simulation tests. The schemes are detailed in Table 3, where the fracture permeability refers to the permeability under an overburden pressure of 75 MPa.

3.4. Experimental Procedure

In line with the purpose of the physical simulation experiment for the depletion of a bottom-water carbonate gas reservoir and the schematic diagram of the experimental setup, the specific experimental procedure was as follows:
(1)
Create artificial fractures in a core sample according to the fracture permeability and penetration in one experimental scheme.
(2)
Install the artificially fractured core into the core holder and apply a confining pressure up to 85 MPa.
(3)
Saturate the core model with gas, ensuring that the gas saturation is complete once the reservoir pressure is balanced at 75 MPa.
(4)
Fill the high-pressure resistance intermediate container with the simulated formation water and pressurize it to 75 MPa.
(5)
Connect the water in the intermediate container with the gas-saturated core model.
(6)
Utilize the constant temperature chamber to heat both the core holder and the intermediate container and maintain it at a constant temperature of 142 °C.
(7)
Gradually reduce the internal pressure at intervals of 2 Mpa; record the average gas and water production rates, as well as the pressure at water breakthrough for each 2 MPa pressure drop. Terminate the experiment when the internal pressure reaches 5 MPa.
The core samples were replaced with samples with different fracture parameters and water volume multiples in the intermediate container were used; the above steps were repeated until all the experimental schemes were executed.

4. Experiment Result Analysis

The simulation experiment to study the effect of fracture permeability, fracture penetration, and water volume multiple on the water production mechanism and water breakthrough performance was carried out using the orthogonal test method. Five indicators were taken into account in the simulation, including the recovery factor, average water–gas ratio, pressure at water breakthrough, average gas production, and average water production. The results are shown in Table 4.

4.1. Analysis of Water Production Types

A double-logarithmic coordinate was adopted for displaying the simulation results of the above experimental schemes, with the water–gas ratio on the vertical axis and the recovery factor on the horizontal axis, to obtain the diagnostic curves of the water production patterns (see Figure 2). The upward segment after water breakthrough can intuitively reflect the water invasion law. The slope of the straight line of the upward segment, denoted by α, was used to characterize the rate at which the water–gas ratio increased with the recovery factor. Referring to the water production classification standard of Cheng Youyou [14], the water production was divided into three patterns based on the α value: Pattern 1 (1 ≤ α < 2), Pattern 2 (2 ≤ α < 3), and Pattern 3 (α > 3).
When 1 ≤ α < 2, it indicates a water invasion performance in a fracture-free reservoir, representing the normal dynamic characteristics of water cresting and water coning.
When 2 ≤ α < 3, it indicates the development of semi-penetrating or low-angle fractures that do not directly connect with the wellbore or bottom water, indicating a fractured carbonate reservoir.
When α > 3, it indicates the existence of fully penetrating large fractures, large vugs, or penetrative fracture networks; bottom water directly connects with the production well through fractures and vugs, leading to rapid water invasion and water channeling during development [14].
By analyzing the diagnostic curves of the water production pattern of each designed experimental scheme, the following conclusions were drawn.
Due to the presence of fractures in all the schemes, the slopes were relatively steep, indicating that the water production patterns basically belong to Pattern 2 and Pattern 3.
The experimental results showed that the greater the fracture penetration, the fracture permeability, and the water volume multiple, the steeper the slopes in the water invasion diagnostic curves and the lower the recovery factor. This indicates that the greater the fracture penetration, the fracture permeability, and the water volume multiple, the more severe the water invasion and water channeling.
The comparison of Scheme 1 with Scheme 2 showed that Scheme 1 had a larger water volume multiple (10 times for Scheme 1 and 5 times for Scheme 2), a lower penetration rate (75% for Scheme 1 and 100% for Scheme 2), and a higher α value (3.5 for Scheme 1 and 2.8 for Scheme 2), indicating that the water volume had a greater impact on water invasion than the fracture penetration.

4.2. Analysis of Effects of Experimental Parameters on Water Invasion Indicators

The key experimental parameters included fracture permeability, fracture penetration, and water volume multiple. The water invasion indicators mainly included the recovery factor, average water–gas ratio, pressure at water breakthrough, average gas production, and average water production. The influence of each experimental parameter on the water invasion indicators was evaluated by conducting a range analysis on the results of the orthogonal test. According to the principle of the orthogonal test, the larger the range value, the greater the influence of the parameters. A summary of the results is shown in Table 5.

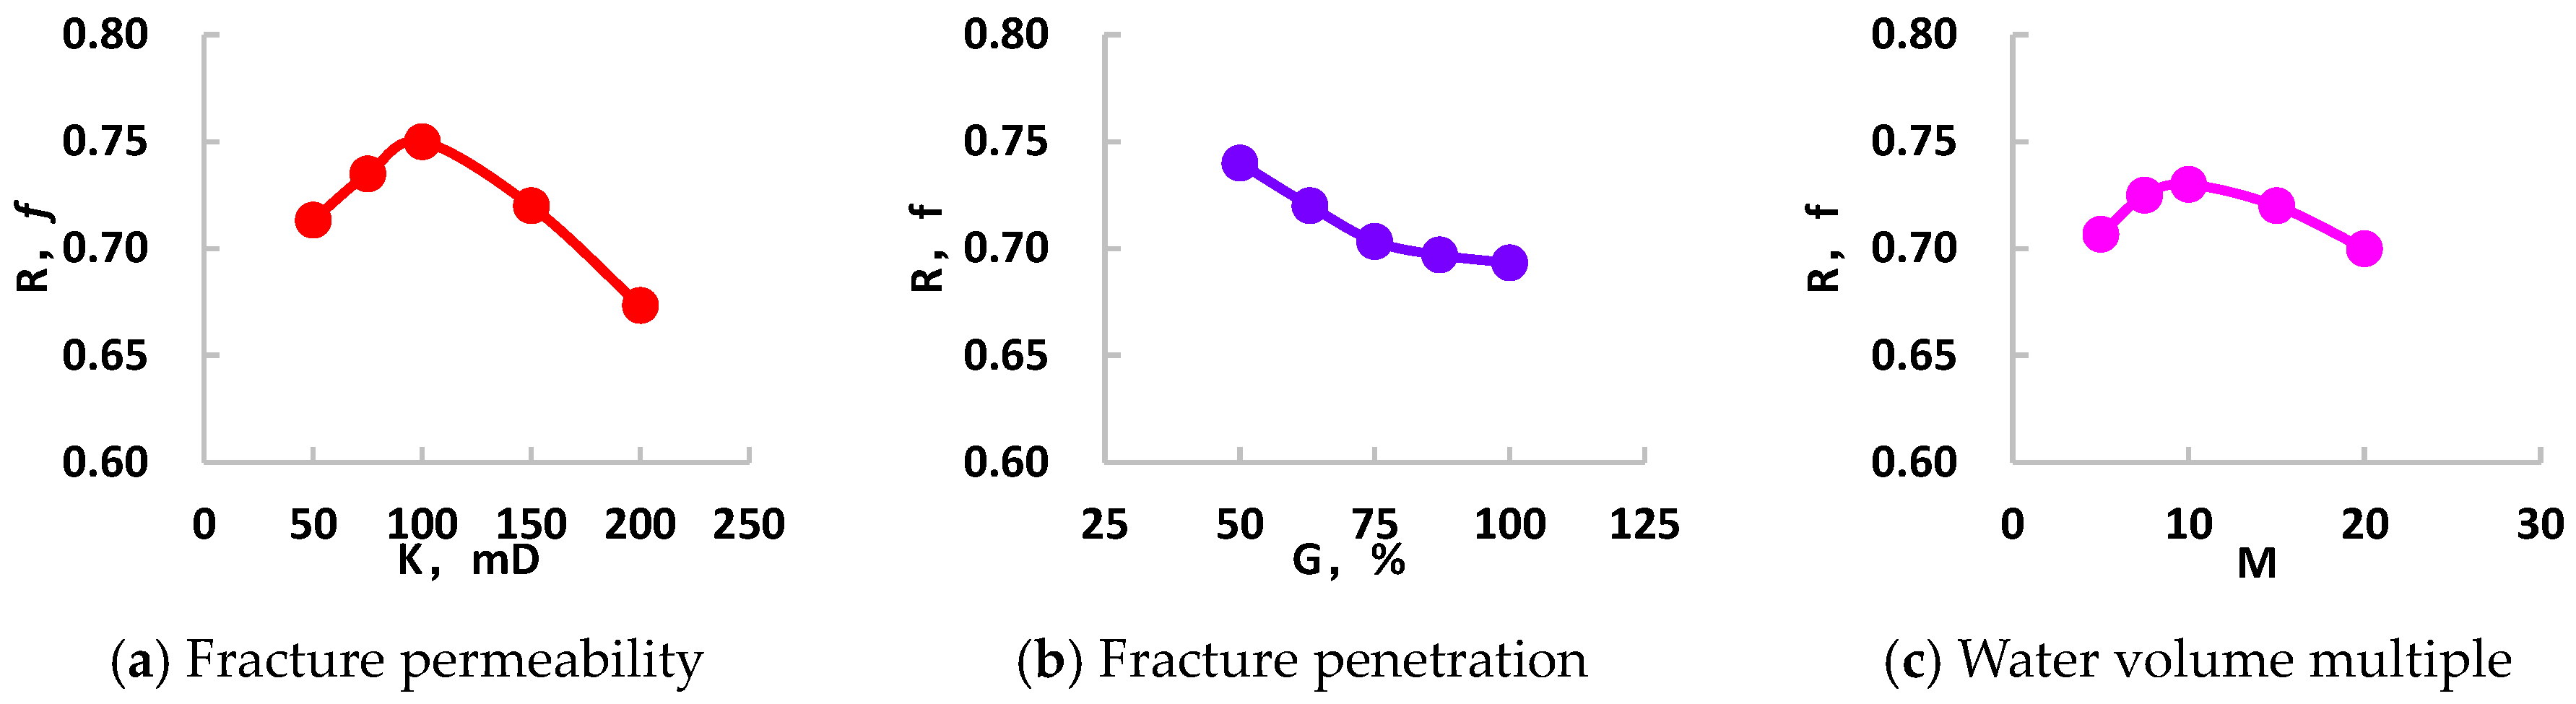
4.2.1. Recovery Factor

Based on the range value, the three experimental parameters were ranked in order of their influence on the recovery factor: water volume multiple > fracture penetration > fracture permeability; however, the strengths of the influence were not very different. When impacted by the fractured water breakthrough, the recovery factor was relatively high with a fracture permeability of 100 mD, fracture penetration of 50%, and moderate water volume multiple of 10 times. A fracture permeability that is too low limits the gas flow, and both a great fracture penetration and a large water volume multiple are not conducive to improving the recovery rate (Figure 3).

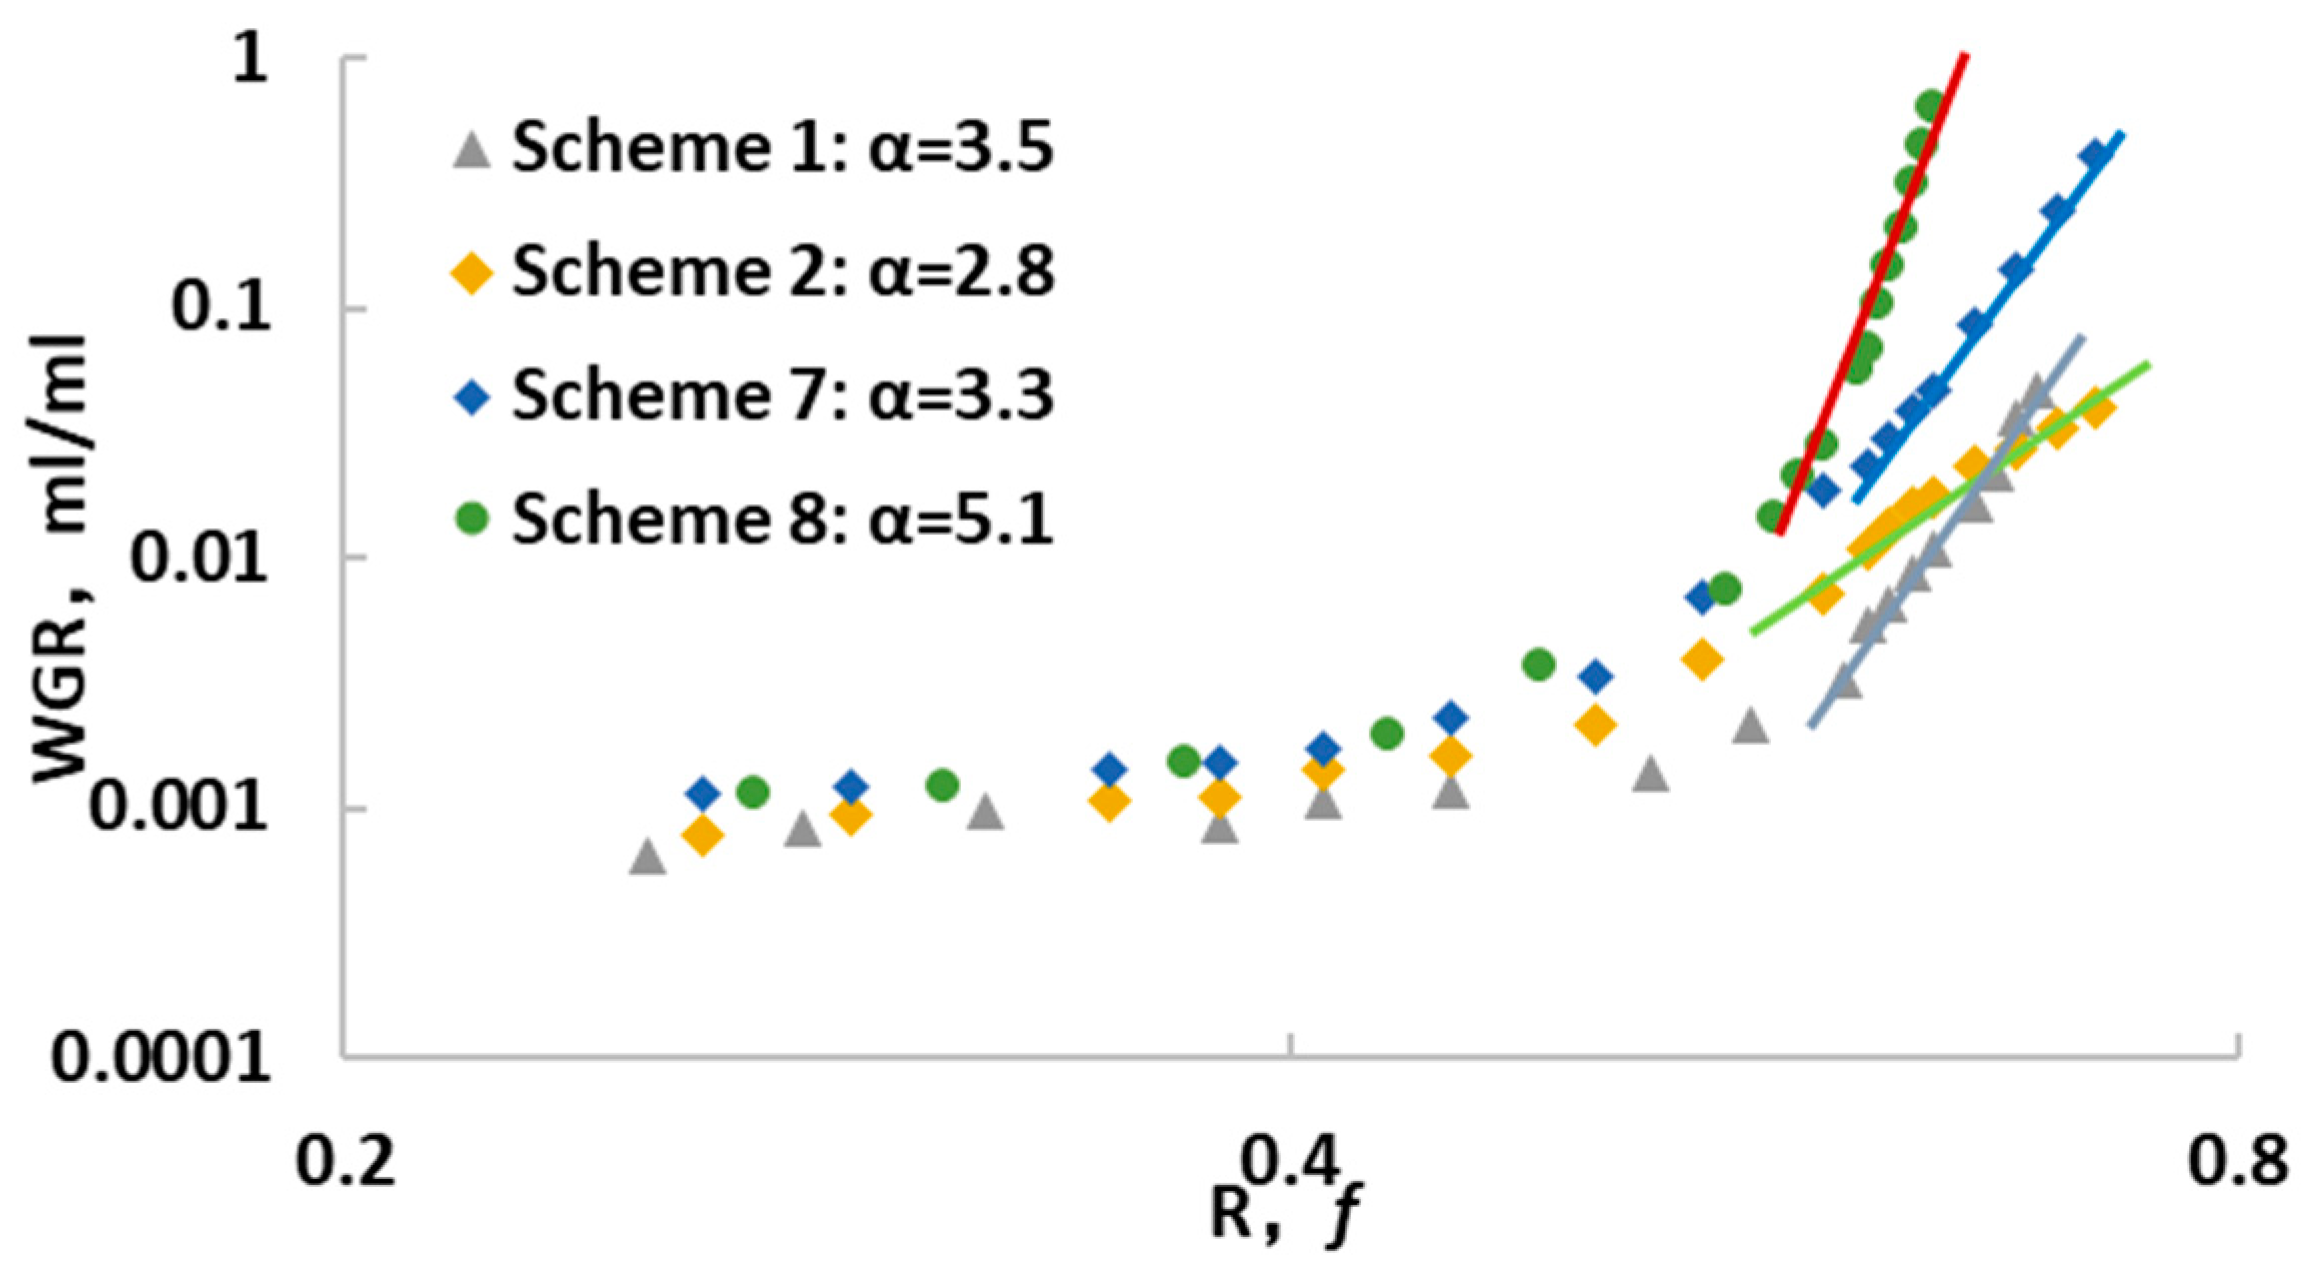
4.2.2. Average Water–Gas Ratio

Based on the range value, the three parameters were ranked in order of their influence on the average water–gas ratio: fracture penetration > water volume multiple > fracture permeability. Within the selected range of mean values, the water volume multiple and the fracture permeability were comparable in terms of influence on the average water–gas ratio, whereas the fracture penetration had a significantly greater influence than the other parameters. Under the impact of fractured water breakthrough, the greater the fracture penetration and the water volume multiple, the higher the average water–gas ratio (Figure 4).

4.2.3. Pressure at Water Breakthrough

Based on the range value, the three parameters were ranked in order of their influence on the pressure at water breakthrough: fracture permeability > water volume multiple > fracture penetration. The pressure at water breakthrough corresponds to the timing of water breakthrough. Within the selected range of mean values, the influence of fracture permeability on the pressure was much greater than that of the other two parameters. Under the impact of fractured water breakthrough, the greater the permeability, the fracture penetration, and the water volume multiple, the higher the pressure point at water breakthrough and the earlier the water breakthrough time (Figure 5).

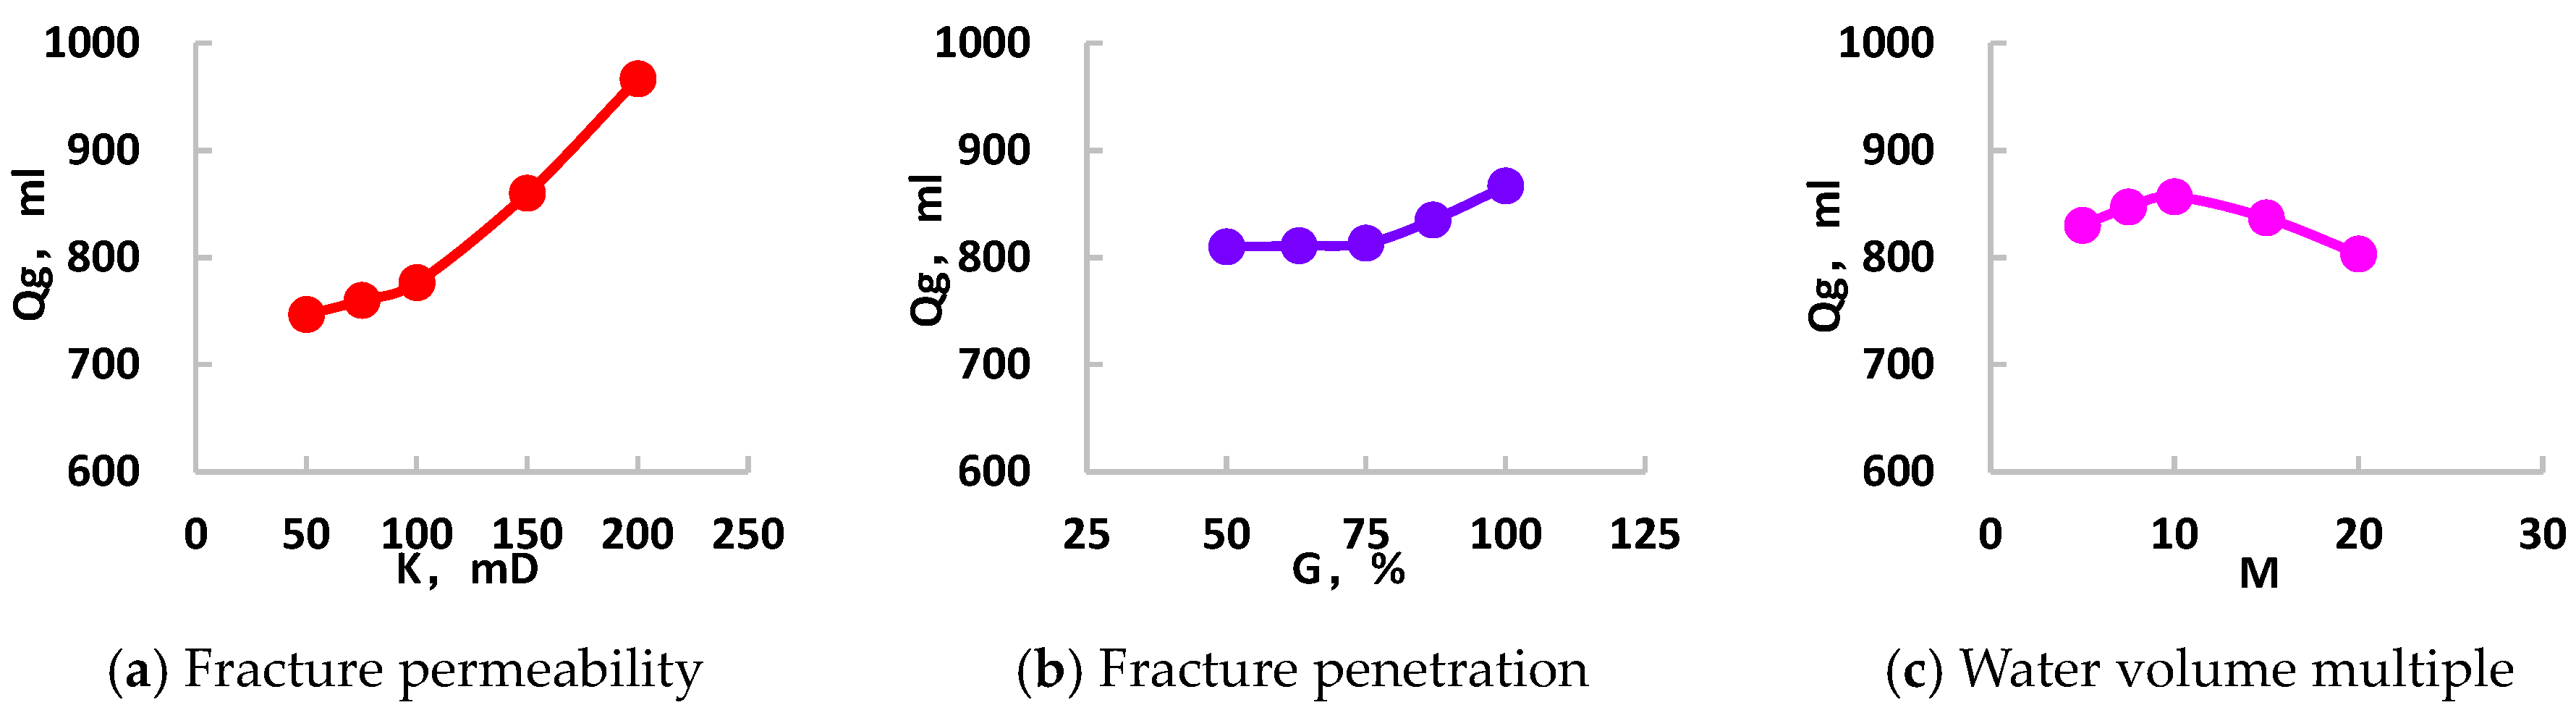
4.2.4. Average Gas Production

Based on the range value, the three parameters were ranked in order of their influence on the average gas production: fracture permeability > fracture penetration > water volume multiple. The fracture permeability had the greatest influence. Driven by the fractured bottom water, the average gas recovery rate in the initial stage before water breakthrough was positively correlated with the fracture permeability. The greater the fracture penetration, the larger the average gas production; the average gas recovery rate was relatively high when the water volume multiple was moderate, but its impact was limited (Figure 6).

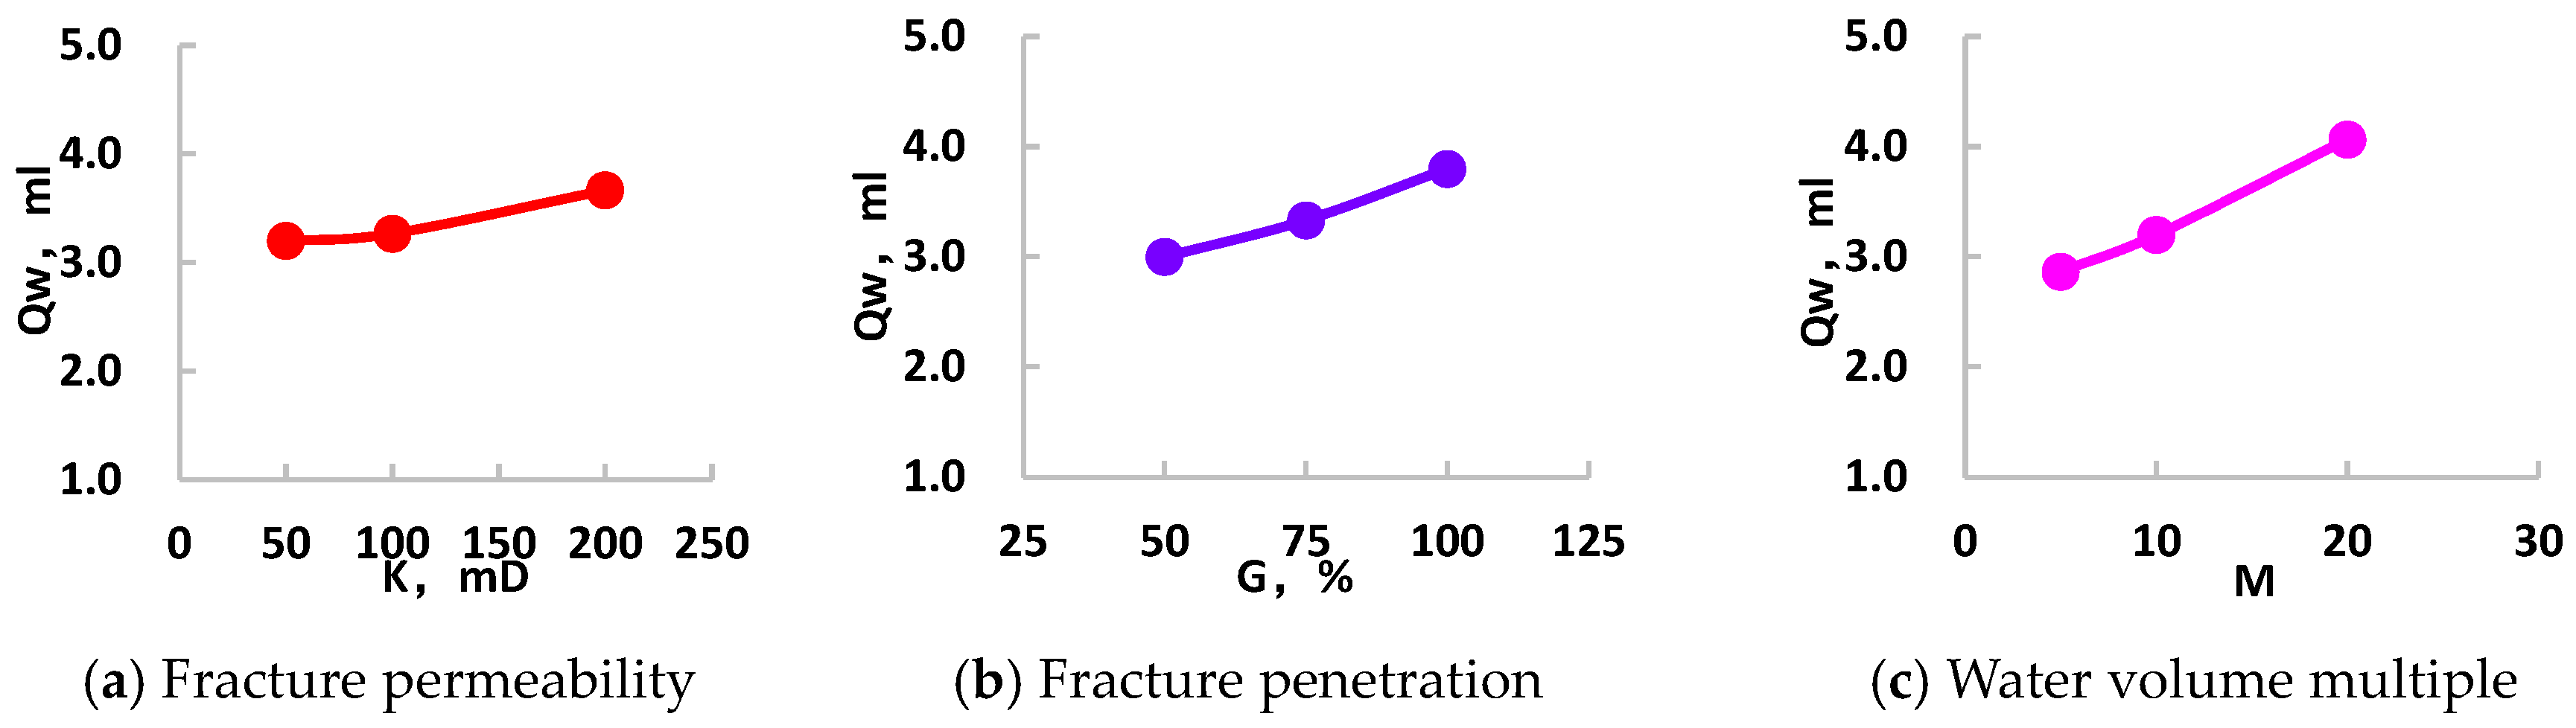
4.2.5. Average Water Production

Based on the range value, the three parameters were ranked in order of their influence on the average water production: water volume multiple > fracture penetration > fracture permeability. The water volume multiple had the greatest influence. Driven by the fractured bottom water, the average water production rate after water breakthrough exhibited a positive correlation with the fracture permeability, fracture penetration, and water volume multiple. The higher the parameter values, the greater the average water production (Figure 7).

5. Conclusions

(1)
By optimizing the experimental sequence and utilizing the orthogonal test method, it is possible to carry out more effective and comprehensive experimental research with a smaller number of core samples.
(2)
The core size was sufficient to obtain the diagnostic curve pattern of water production. The greater the fracture permeability, the fracture penetration, and the water volume multiple, the larger the slope of diagnostic curves and the more severe the water invasion and water channeling.
(3)
The experimental results showed that the effects of the experimental parameters on the recovery factor and average water production can be ranked as water volume multiple > fracture penetration > fracture permeability, with the influence of the water volume multiple being slightly greater than that of the other two parameters. For the average water–gas ratio, the fracture penetration exhibited a stronger sensitivity and more significant influence; in the case of the water breakthrough time and average gas production, the fracture permeability had a stronger sensitivity and greater influence.
(4)
For fracture-pore-type gas reservoirs, if there are through-fractures between the gas well and the edge and bottom water during the development process, the edge and bottom water will rapidly advance into the wellbore along the fractures. The advancing speed of the fracture water invasion front is closely related to the reservoir permeability and edge and bottom water. There was a positive correlation between the size of the water body, that is, the higher the reservoir permeability and the larger the water body, the faster the front advance speed, which will lead to a significant decrease in gas well production and final recovery volume.

Author Contributions

Conceptualization, methodology, validation, formal analysis, project administration, and funding acquisition, P.Y. and Y.L.; software, data curation, visualization, and writing—original draft preparation, Z.X.; investigation, H.Z.; resources, W.L.; writing—review and editing, E.Z.; supervision, P.Y. All authors have read and agreed to the published version of the manuscript.

Funding

This project was supported by the Key Program of the National Natural Science Foundation of China (No. U24B200683) and the Scientific Research Foundation of the Education Department of Sichuan Province, China (No. 2024NSFSC2012).

Data Availability Statement

The original contributions presented in this study are included in the article. Further inquiries can be directed to the corresponding author.

Conflicts of Interest

Authors Yueyang Li, Enli Zhang, Han Zhao, Wei Liu were employed by Research Institute of Exploration and Development, Southwest Oilfield Company, PetroChina. The remaining authors declare that the research was conducted in the absence of any commercial or financial relationships that could be construed as a potential conflict of interest.

References

  1. Zhang, B.; Zheng, R.; Liu, H.; Lei, W.; Chen, R. Characteristics of Carbonate Reservoir in Callovian-Oxfordian of Samandepe Gasfield, Turkmenistan. Acta. Geol. Sin. 2010, 84, 117–126. [Google Scholar]
  2. Cheng, Y.; Mu, L.; Zhu, E.; Zhang, P.; Guo, C.; Leng, Y.; Wei, Z.; Chen, Y.; Xing, Y.; Cheng, M.; et al. Water producing mechanisms of carbonate reservoirs gas wells: A case study of the Right Bank Field of Amu Darya, Turkmenistan. Pet. Explor. Dev. 2017, 44, 89–96. [Google Scholar] [CrossRef]
  3. Song, H.; Cheng, H.; Yuan, F.; Cheng, L.; Yue, P. Prediction and Application of Drilling-Induced Fracture Occurrences under Different Stress Regimes. Processes 2024, 12, 1874. [Google Scholar] [CrossRef]
  4. Sun, Z. Production characteristics and the optimization of development schemes of fractured gas reservoir with edge or bottom water. Pet. Explor. Dev. 2002, 29, 69–71. [Google Scholar] [CrossRef]
  5. Hu, Y.; Li, X.; Wan, Y.; Jiao, C.; Xu, X.; Guo, C.; Jing, W. The experimental study of water invasion mechanism in fracture and the influence on the development of gas reservoir. Nat. Gas. Geo. 2016, 5, 910–917. [Google Scholar] [CrossRef]
  6. Tang, J.R. Gas Reservoir Engineering Technology; Petroleum Industry Press: Beijing, China, 2011. [Google Scholar]
  7. Qiang, L.; Li, Q.; Wang, F.; Wu, J.; Wang, Y. The Carrying Behavior of Water-Based Fracturing Fluid in Shale Reservoir Fractures and Molecular Dynamics of Sand-Carrying Mechanism. Processes 2024, 12, 2051. [Google Scholar] [CrossRef]
  8. Li, Q.; Li, Q.; Han, Y. A Numerical Investigation on Kick Control with the Displacement Kill Method during a Well Test in a Deep-Water Gas Reservoir: A Case Study. Processes 2024, 12, 2090. [Google Scholar] [CrossRef]
  9. Zhang, L.; He, W. Single well water invasion model for fractured bottom water gas reservoirs. Nat. Gas. Ind. 1994, 14, 48–50. [Google Scholar]
  10. Tao, L.; Yong, F. Numerical simulation study on water coning of large-fractured gas well with finite volume method. J. Southwest Pet. Univ. Sci. Technol. Ed. 2001, 23, 19–22. [Google Scholar] [CrossRef]
  11. Xu, X.; Wan, Y.; Chen, Y.; Hu, Y.; Mei, Q.; Jiao, C.-Y. Physical simulation of water invasion and water control for the fractured water-bearing gas reservoirs. Nat. Gas. Geosic. 2019, 30, 1508–1518. [Google Scholar] [CrossRef]
  12. Hu, Y.; Le, P.; Guo, C.; Chen, P.; Xiao, Y.; Qu, S.; Wang, X. Experimental Study on Water Invasion in Full-Diameter Cores from Fractured Carbonate Reservoirs. Xinjiang Pet Geo. 2023, 4, 479–484. [Google Scholar]
  13. Zhang, X.; Zhang, L.; Li, Y.; Zhou, Q. A new method for water invasion performance prediction in the early stage of fractured and water-carrying gas reservoir development. J. Southwest Pet. Univ. Sci. Technol. Ed. 2007, 29, 82–85. [Google Scholar] [CrossRef]
  14. Peng, X.; Du, Z. Percolation model and numeral simulation of bottom water gas reservoirs with big fractures. Nat. Gas. Ind. 2004, 24, 116–119. [Google Scholar] [CrossRef]
  15. Wang, X.; Tian, J.; Zhu, G.; Liang, B. A 3D numerical simulation of gas-water biphase for fractured gas reservoirs with low permeability. China Offshore Oil Gas 2010, 22, 168–171. [Google Scholar] [CrossRef]
  16. Persoff, P.; Pruess, K. Two-phase flow visualization and relative permeability measurement in natural rough-walled rock fractures. Water Resour. 1995, 31, 1175–1186. [Google Scholar] [CrossRef]
  17. Zhou, K.; Li, N.; Zhang, Q.; Tang, X. Experimental research on gas-water two phase flow and confined gas for mation mechanism. Nat. Gas. Ind. 2002, 22, 122–125. [Google Scholar]
  18. Fan, H.; Zhong, B.; Li, X.; Liu, Y.; Yang, H.; Feng, X.; Zhang, Y. Studies on water invasion mechanism of fractured-watered gas reservoir. Nat. Gas. Geo. 2012, 23, 1179–1184. [Google Scholar]
  19. Hu, Y.; Li, X.; Wan, Y.; Lu, J.; Zhu, H.; Zhang, Y.; Zhu, Q.; Yang, M.; Niu, L. Physical simulation on gas percolation in tight sandstone. Pet. Explor. Dev. 2013, 40, 580–584. [Google Scholar] [CrossRef]
  20. Fang, F.; Li, X.; Gao, S.; Xue, H.; Zhu, X.; Liu, H.; An, W.; Li, C. Visual simulation experimental study on water invasion rulesof gas reservoir with edge and bottom water. Nat. Gas. Geo. 2016, 27, 2246–2252. [Google Scholar] [CrossRef]
  21. Wang, L.; Yang, S.; Peng, X.; Deng, H.; Li, L.; Meng, Z.; Kun, Q.; Wang, Q. Visual experiments on the occurrence characteristics of multi-type reservoir water in fracture-cavity carbonate gas reservoir. Acta. Pet. Sin. 2018, 39, 686–696. [Google Scholar] [CrossRef]
  22. Shen, W.; Li, X.; Liu, X.; Lu, J.; Jiao, C. Physical simulation of water influx mechanism in fractured gas reservoirs. J. Cent. South Univ. Sci. Technol. 2014, 45, 3283–3287. [Google Scholar]
  23. He, G. Experimental study on EOR of gas reservoir with different penetrating level. Pet. Ind. Tech. 2016, 23, 79. [Google Scholar]
  24. Li, C. Recovering technology of fractured and watered gas reservoirs. Nat. Gas. Ind. 2003, 23, 123–126. [Google Scholar] [CrossRef]
Figure 1. Experimental setup for water invasion mechanism.
Energies 17 06055 g001
Figure 2. Diagnostic curves of water production patterns.
Energies 17 06055 g002
Figure 3. Effects of experimental parameters on recovery factor (R).
Energies 17 06055 g003
Figure 4. Effects of experimental parameters on average water–gas ratio (WGR).
Energies 17 06055 g004
Figure 5. Effects of experimental parameters on pressure at water breakthrough.
Energies 17 06055 g005
Figure 6. Effects of experimental parameters on average gas production (Qg).
Energies 17 06055 g006
Figure 7. Effects of experimental parameters on average water production (Qw).
Energies 17 06055 g007
Table 1. Natural gas composition.
ComponentMolar Percentage (%)ComponentMolar Percentage (%)
O2 + Ar0.0000iC4H100.1670
He0.0092nC4H100.2111
H20.0985iC5H120.0920
N20.5265nC5H120.0776
CO24.1874C6H140.1313
H2S0.0218C7H160.1115
CH489.6571C8H180.0653
C2H63.7082C9H200.0279
C3H80.9044C10H220.0032
relative density = 0.6399compression factor = 0.9970
hydrogen sulfide = 313 g/m3carbon dioxide = 82,271 mg/m3
molecular weight = 18.58 g/mol
Table 2. Formation water salinity.
DensitypH ValueHCO3− (mg/L)Cl (mg/L)SO42− (mg/L)Ca2+ (mg/L)
1.0556.1433.144,792.1751.55010
Mg2+ (mg/L)K+/Na+(mg/L)Total Anion (mg/L)Total Cation (mg/L)Surin ClassificationTotal Mineralization (mg/L)
60822,854.445,976.728,662.3chloride calcium type74,639.0
Table 3. Design of orthogonal experimental schemes.
Scheme No.Fracture Permeability (mD)Fracture Penetration (%)Water Volume Multiple
1501005
2507510
3505030
41007530
5100505
610010010
72005010
820010030
9200755
Table 4. Experimental results of the dynamic simulation of water invasion mechanism.
Scheme No.Parameter ValueExperimental Results
Fracture Permeability
(mD)
Fracture Penetration
(%)
Water Volume MultipleRecovery Factor
f
Average Water–Gas Ratio
(mL/mL)
Pressure at Water Breakthrough
(MPa)
Average Gas Production
(mL)
Average Water Production
(mL)
15010050.690.0035407902.8
25075100.720.0040427503
35050200.730.0054467003.8
410075200.730.0049507403.6
51005050.770.0032407502.4
6100100100.750.0045498403.8
720050100.720.0029489802.8
8200100200.640.0049529704.8
92007550.660.0036469503.4
Table 5. Summary of the evaluation results for the dynamic simulation experiment of water invasion mechanism.
Evaluation IndicatorParameterFracture Permeability
K, mD
Fracture Penetration
G, %
Water Volume Multiple
M
ValueResultValueResultValueResult
Recovery Factor
R, f
Mean value 1500.713500.74050.707
Mean value 2750.735630.7217.50.725
Mean value 31000.750750.703100.730
Mean value 41500.721870.697150.720
Mean value 52000.6731000.693200.700
Range 0.077 0.047 0.030
Average Water–Gas Ratio
WGR, mL/mL
Mean value 1500.0043500.003850.0034
Mean value 21000.0042750.0041100.0038
Mean value 32000.00381000.0043200.0051
Range 0.0005 0.0005 0.0017
Pressure at Water Breakthrough
P, MPa
Mean value 15042.75044.7542.0
Mean value 210046.37546.01046.3
Mean value 320048.710047.02049.3
Range 6.0 2.3 7.3
Average Gas Production
Qg, mL
Mean value 150747508105830
Mean value 275760638117.5847
Mean value 31007777581310857
Mean value 41508608783515837
Mean value 520096710086720803
Range 220 57 54
Average Water Production
Qw, mL
Mean value 1503.20503.0052.87
Mean value 21003.27753.33103.20
Mean value 32003.671003.80204.07
Range 0.47 0.80 1.20
Disclaimer/Publisher’s Note: The statements, opinions and data contained in all publications are solely those of the individual author(s) and contributor(s) and not of MDPI and/or the editor(s). MDPI and/or the editor(s) disclaim responsibility for any injury to people or property resulting from any ideas, methods, instructions or products referred to in the content.

