Article

Dedicated HVAC Technology in the Renovation of Historic Buildings on the Example of the Marshal Pilsudski Manor in Sulejówek

1
Faculty of Civil Engineering and Architecture, Lublin University of Technology, Nadbystrzycka 40, 20-618 Lublin, Poland
2
Sanitary Engineer “WAKAD”, 20-250 Lublin, Poland
3
Institute of Agrophysics, Polish Academy of Sciences, Doświadczalna 4, 20-290 Lublin, Poland
*
Author to whom correspondence should be addressed.
Energies 2024, 17(23), 5946; https://doi.org/10.3390/en17235946
Submission received: 26 October 2024 / Revised: 16 November 2024 / Accepted: 22 November 2024 / Published: 26 November 2024
(This article belongs to the Special Issue Thermal Environment and Energy Saving in Buildings)

Abstract

:
The article investigates HVAC (heating, ventilation, and air conditioning) technologies aimed at mitigating Primary Energy (PE) consumption in renovated buildings. This research is part of a broader initiative focused on enhancing air quality and reducing the carbon footprint within the fields of architecture and urban planning. Conducted since 2018 by a team from the Institute of Architectural Design at the Department of Contemporary Architecture, Faculty of Civil Engineering and Architecture, University of Technology in Lublin, the study exemplifies the application of these technologies at the historic Marshal Piłsudski’s “Milusin” Manor House in Sulejówek, near Warsaw. The primary objective of this research is to present HVAC solutions, particularly a free cooling and heating system, which are specifically tailored for the renovation of historic structures. This technology effectively recovers thermal energy from groundwater, achieving low energy consumption levels while simultaneously minimizing CO2 emissions.

1. Introduction

The building sector, according to the EU, is responsible for nearly 40% of energy consumption and 36% of CO2 emissions [1].
In this context, cooling and heating systems are considered the main factors in energy consumption by buildings, accounting for nearly 80%, which in turn contributes to global warming. Therefore, actions are needed to reduce energy consumption and the environmental impact of these systems. Undoubtedly, these figures are significantly influenced by historic buildings in which the traditional heating method using coal stoves is used.
Replacing traditional systems with more efficient solutions is a solution to this problem. More energy-efficient cooling and heating systems can reduce the impact on the environment by reducing energy consumption and direct and indirect CO2 emissions.
According to current regulations and technical provisions (TP), every building must meet maximum Primary Energy requirements (PE) [2] specified by legislation [3], as outlined in the Regulation of the Minister of Infrastructure dated 12 April 2002 regarding the technical provisions to be met by buildings and their location [4]. To achieve these maximum energy performance (EP) rates, it is essential to establish new policies through collaboration among urban planners, architects, builders, medical professionals, installers, and other stakeholders involved in shaping development trends over the next 50 years [5,6].
This article presents a solution for harnessing energy from Renewable Energy Sources (RES), specifically energy stored in groundwater, which can be utilized in HVAC systems designed for low-carbon building developments and renovations [7]. This solution was developed by a research team at Lublin University of Technology [8,9]. Another aim of this article is to initiate public consultations that reflect the perspectives of stakeholders, including representatives from academia, non-governmental organizations, and leaders in the energy sector, as well as other industries related to environmental and climate protection [9,10,11]. The proposed low-carbon technology for extracting energy from groundwater addresses shifts in the European and global energy landscape [12,13,14,15]. It may serve as a foundational component of emerging energy-saving solutions currently being implemented, which aim to phase out conventional fuels and reduce CO2 emissions [16,17].
The current dynamics of the energy market present an opportunity for low-carbon technologies to play a pivotal role in a modern, environmentally sustainable economy [18,19,20]. Challenges associated with energy storage, such as those related to photovoltaic systems or wind farms, highlight the potential for recovering energy from groundwater [21,22,23]. This form of energy could be crucial in the decarbonization process, a central element of global and European initiatives to transition to renewable energy sources [24]. It is anticipated that total HVAC energy demand will remain stable or even decline in heating-dominated climates, primarily due to a significant reduction in heating demand in the future [25].
This article directly promotes the application of the technological, scientific, and research potential of modern Free Cooling and Heating (FCH) technologies and the emergence of a branch of economy [26] based on energy accumulated in groundwater, eliminating the use of the recently highly popular heat pumps, whose parameters are compared in Table 1. Traditional installations using a heat pump system (Table 1) with a consumption of 1 MWh will emit 831 kg of CO2, while FCH installations with an electricity consumption of 100 kWh will emit 83 kg of CO2. The difference is tenfold, based on data from an area in a facility in Mielec with a volume of 33,000 m2. Analysis (Table 1) shows the differences that occur when implementing HVAC installations using traditional heat pump technology (H.P.) and FCH HVAC technology. The basic differences, in favor of FCH, while maintaining the same power, are as follows: drilling less by 93%; investment cost by 82%; electricity consumption less by 90%; operating costs less by 85%; and the CO2 emission less by 80%.
The results leave no doubt that if we are to reduce CO2 emissions by 2050, then we must abandon the installation (H.P.) and recover the energy we need using FCH HVAC technology from groundwater using renewable energy. Energy can be recovered from groundwater for direct use in HVAC installations in processes comprised of FCH technology. It will gradually become one of the key energy carriers used in HVAC systems in the European Union [27]. Undoubtedly, the FCH market will develop dynamically [28,29].
Numerous investments are changing cities into very modern European places where living, working, and leisure time are becoming increasingly attractive. This is supported by their innovative architecture, extensive infrastructure of roads and highways, as well as trade, gastronomy, and culture, which create friendly public spaces with access to local services, jobs, and greenery. Urban sprawl has a measurable effect in the consumption of energy required for its operation [30]. Modern housing construction fits the surroundings. Similarly, historic buildings [31,32,33] can be a good example of synergy in renovation, as in the case of the Potocki Palace in Radzyń Podlaski and the Marshal Piłsudski Museum in Sulejówek presented in this publication. The age of a building can also be an indicator for energy consumption [32,34].
The “Milusin” Manor House was built by the army and handed over to Marshal Piłsudski’s family in 1923. Currently, the Manor House is one of the two core locations of the Marshal Piłsudski Museum in Sulejówek, next to the museum and educational building.
The object of the investment (Revitalization of Marshal Piłsudski’s “Milusin”s Manor House with the use of the FCH HVAC technology) is a real estate with a total area of 598.7 m2 and cubature of 1704.5 m3, including the basement (275.9 m3), the ground floor (874.0 m3), and the first floor, with a non-habitable attic (554.6 m3). The pre-war functional layout and the residential function of the rooms have been preserved. The Manor House has ceased to function as a museum, as a new facility was built on the estate for this purpose, i.e., “Marshal Piłsudski Museum”.
To ensure appropriate internal conditions, air exchange, and temperature in each room, ecological FCH HVAC installations were adapted to the historical interior furnishings, which have been faithfully restored to fulfill the residential function of the rooms. Brick stoves were built in the (reconstructed) rooms, and a tiled stove was built in the kitchen. Each of these pieces of equipment was adapted at the design stage to modern, ecological, and energy-saving installations [35].

2. Materials and Methods

2.1. FCH Technology for Recovery of Groundwater Energy

FCH technology is based on a set of renewable energy devices that extract heat and cooling energy from groundwater and transfer it to heaters or coolers in modern and environmentally friendly FCH control stations Figure 1. The technology has been described in detail in the patent documents in the Republic of Poland and Europe [36,37,38,39].
The technology described in this article is based on the use of drilling to extract energy from groundwater. Scientific research in recent years has emphasized the significant impact that large and dense drilling resistance has on soil stability. Depending on the drilling technology, it may have negative effects on the surrounding ground [40,41,42]. These studies confirm more than just theoretical risks. However, the greatest impact in this area is observed for oil extraction using large-diameter wells [43].
Groundwater in the region covered by the study is located at a depth of several to a dozen or so meters below the ground. This means that boreholes made using this technology of small diameter (20 cm) do not significantly affect the environment. Mitigation measures are then applied, such as leveling the land to restore the existing contour, thus maintaining the overall slope of the site. After drilling the borehole and then filling it with bentonite, the soil is properly stabilized. Any loss of drainage should be compensated for by providing alternative drainage. Thus, excavation and drilling associated with mining activities can lead to slope damage due to both physical changes in the terrain and changes in groundwater flow.
The FCH technology scheme Figure 1 includes (1) the FCH HVAC control station with (7) a heater and (9) a cooler feed with 35% glycol from the ground heat exchanger system heating or cooling the air, which (11) is supplied into the air-conditioned room. Fresh air transferred from (10) the intake vent to (11) the supply and the exhaust system consisting of (13) a room exhaust fan and (12) the air exhaust vent ensures proper indoor conditions and proper ventilation. Glycol is transferred from (30) the head through (28) (29) the supply and return installation via (25) the manifold in the room or in the external manhole to the node, where, by means of (23) the circulator pump, it is pumped further to (1) the control station and either to (7) the heater or to (9) the cooler, depending on the need. By using 35% glycol, the system can withstand temperatures as low as −35 °C, which is perfectly adequate for the conditions in the geographical area under study and prevents the system from freezing. It is also possible to use a glycol mixture that prevents freezing at higher temperature extremes.
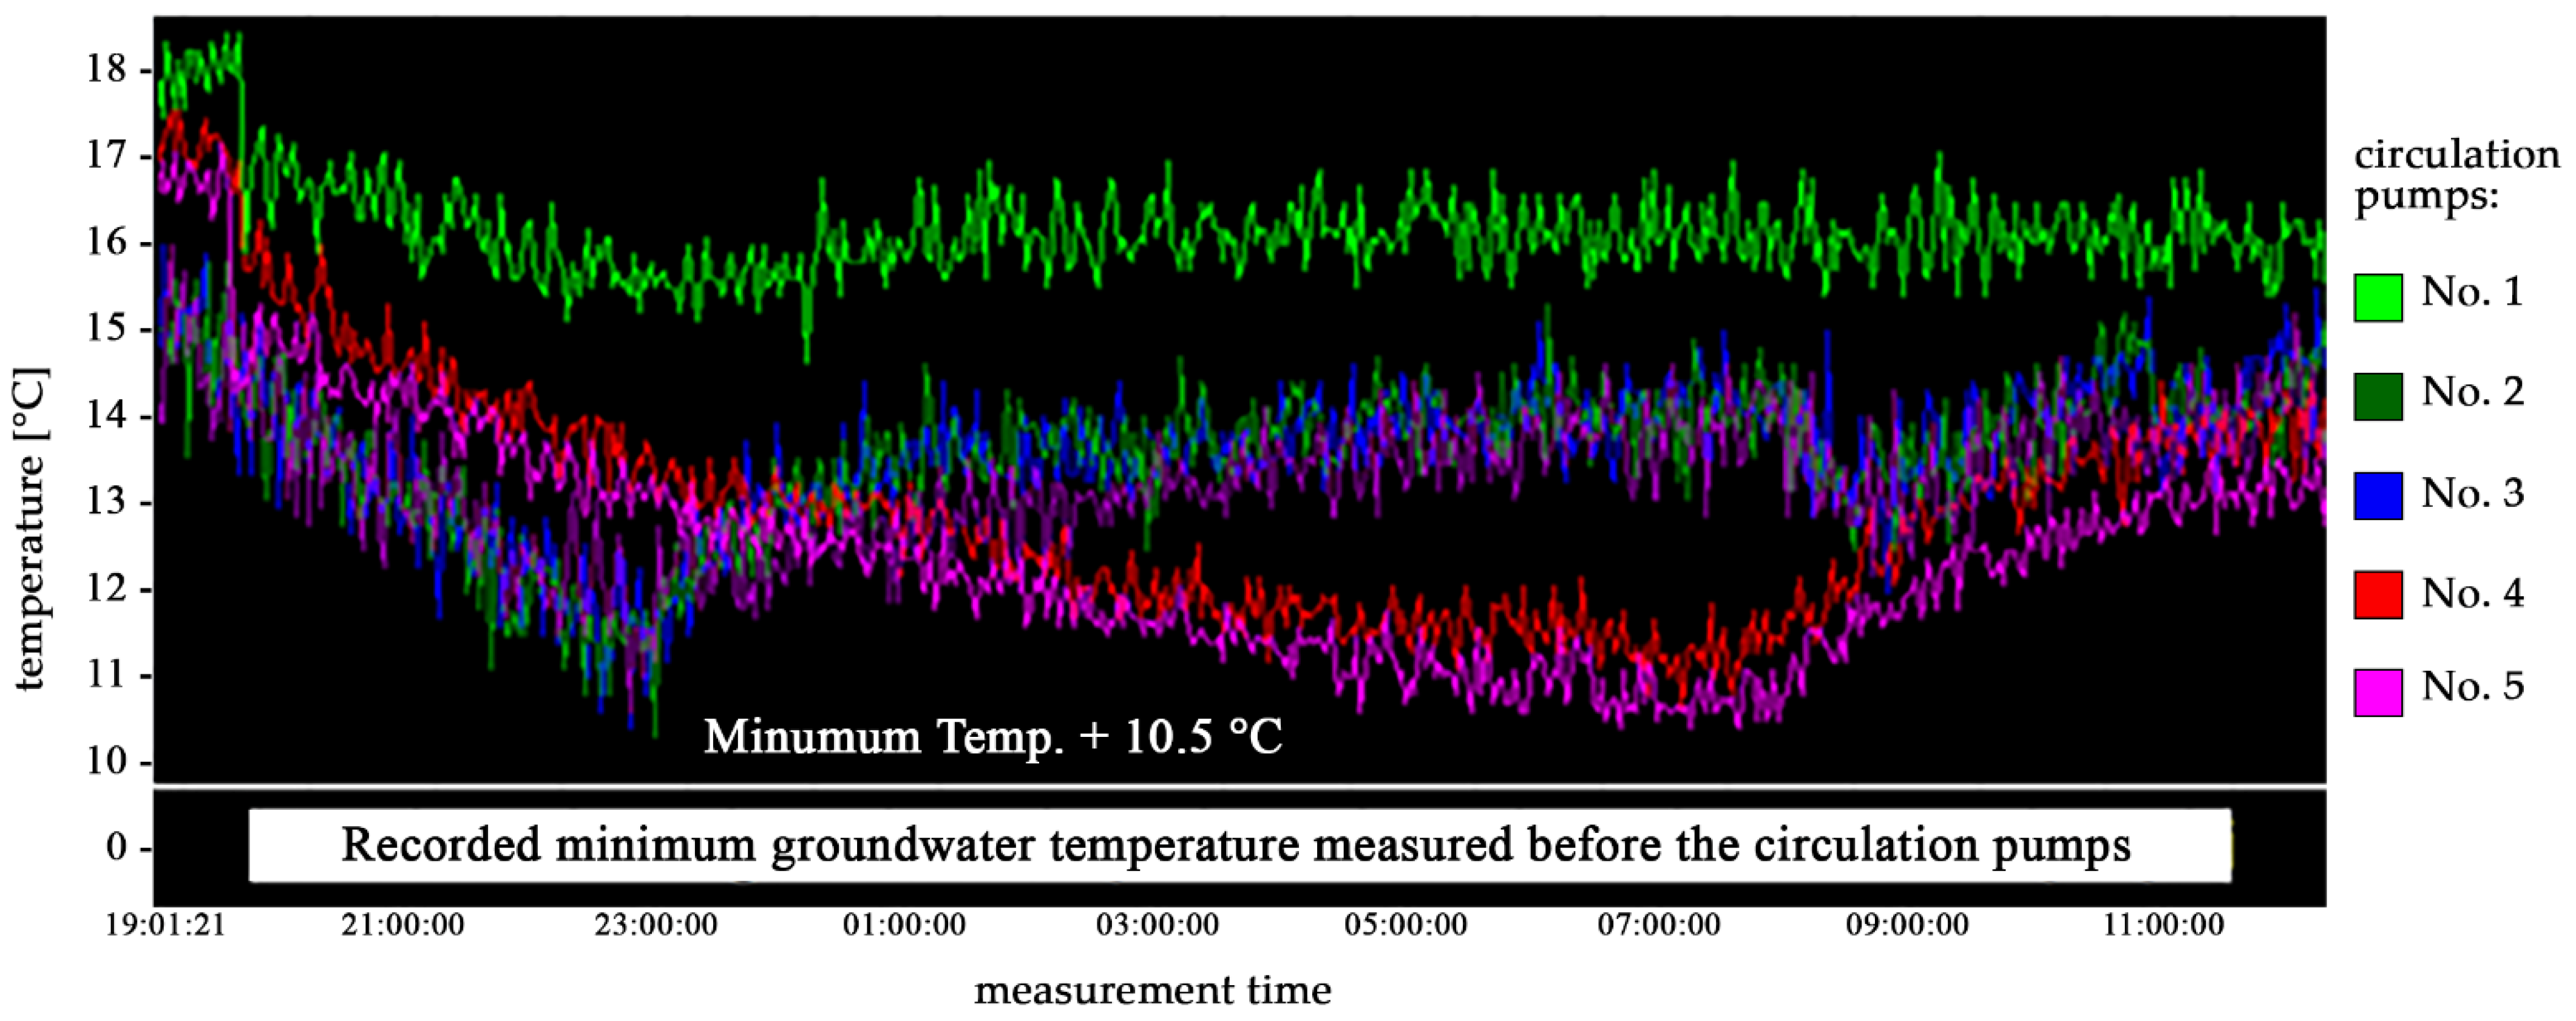
The energy generated can be used to heat or cool fresh air in HVAC systems. The ratio of input power to energy recovered from groundwater is greater than 1:20. Input power is the electrical energy needed to drive the circulator motor. The rest of the energy is completely free, as it comes from heat or cold stored in the groundwater and is completely independent of weather conditions. The entire system is controlled electronically and is highly reliable. FCH technology can reduce the cost of heating buildings by 200–400%, compared to traditional heating methods (gas boilers, oil radiators, or currently popular heat pumps). It is calculated that the payback period for the purchase of heat pumps, for example, is 4–9 years for equipment use, while for circulators it is a maximum of six months. Thus, the use of heat pumps is not only uneconomical but also environmentally unfriendly. The temperatures that we can obtain from energy storage per year are presented in Figure 2.
It is notable that the stable parameter of groundwater temperature at a depth of 10 m remains constant at 10 °C, regardless of the outside temperature [8]. This parameter in FCH technology allows optimization of HVAC operating costs in winter and summer with a significant 70% reduction in CO2 emissions.
In the following Section, the authors will present, in addition to the above-mentioned temperature stability at 10 m, the study of groundwater temperature from Figure 2, which is obtained in the FCH installation in pumping stations before the circulation pumps, see Figure 1 description of item 23—recorded minimum groundwater temperature measured before the circulation pumps.
The results that can be achieved when the recovered energy in HVAC is introduced are presented in Figure 3. According to the scheme (Figure 1) description item (7) in the pre-heater, the outside air is heated from –20 °C to +7 °C, then, after entering the rotary exchanger (Figure 1 item 2), it is heated without external energy to a temperature of 16.6 °C. The ventilation air parameters described are a very good, currently underestimated source of renewable heat and cold.
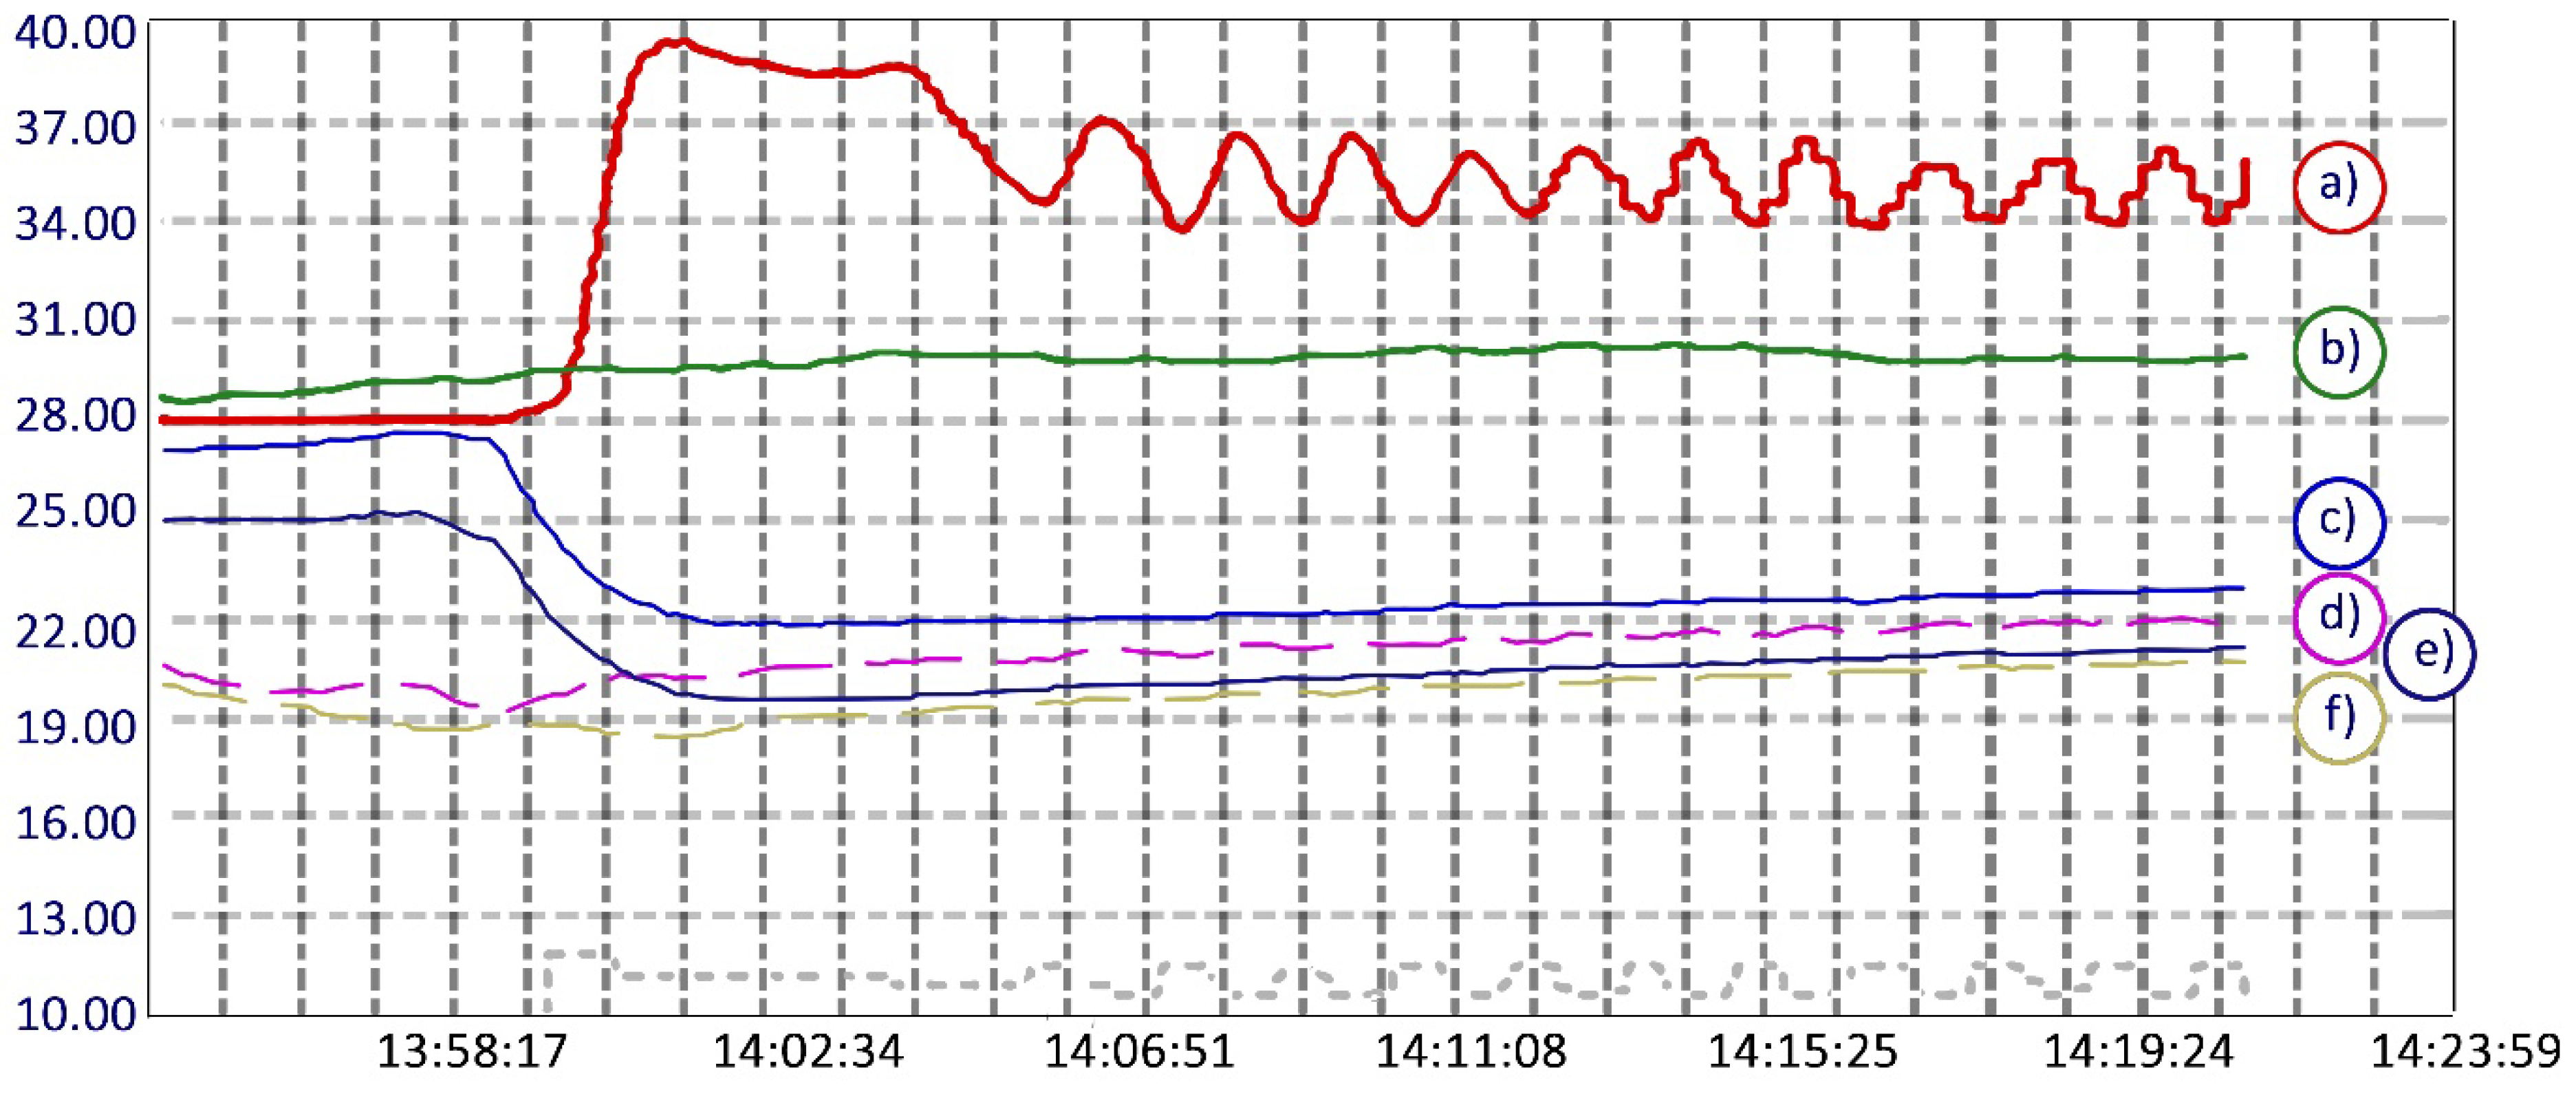
The task of ventilation is to replace air from enclosed spaces and remove gases, organic compounds, bacteria, and fungi. Ventilation and air conditioning are major components of operation costs in any building. High operating costs entail high final energy (FE) and primary energy (PE) costs. The FCH technology described here provides a method to reduce these costs while reducing CO2 emissions. This very attractive solution effectively reduces CO2 emissions [44,45,46,47,48,49] and offers a very simple way to obtain heating and cooling energy from groundwater. Figure 4 presents the results of simulation measurements of a facility of similar volume in the region of eastern Poland due to similar climatic conditions. The following temperatures [°C] are recorded in the tests: (a) air downstream of the electric heater; (b) outdoor air; (c) blue—air downstream of the cooler air supply to the room—design; (d) FCH return temperature (out of the cooler); (e) room air—design; and (f) FCH supply temperature (into the cooler). The figure shows the specific power of the borehole, the measurements were made using the direct efficiency method, and the reference unit with full load with a capacity of 1500 m3/h of ventilation air. This measurement shows the energy consumption from groundwater at a specific time at the tested location. The graph presents partial measurement results. At an external temperature above 35 °C, the temperature of the air supply is at the level of 20–24 °C. The stability of this study confirms the significant power of the FCH ground heat exchanger. Determining the borehole power using the simplified method from the temperature difference, we have the result of 1500 m3/h of air supply × 0.34 × 12/delta 35 °C–23 °C. / = 6.12 kW. and this is the specific power of energy recovered from each borehole.

2.2. FCH HVAC Technology Project

The FCH HVAC installations were designed based on the analysis of soil and water conditions, which facilitated the selection of the location of boreholes and the FCH heads (Figure 4). The boreholes were located near a pond in the western part of the estate. The other parameters included the groundwater level of 2–4 m b.g.l., the 12–18 m aquifer, and six cascade-arranged boreholes with a power of 10 kW each, which ensured 60 kW power.
The following parameters were adopted to determine the capacity of the boreholes:
Basement: technical facilities for the HVAC installation machine room 50 W/m2 × 100 m2 = 5 kW.
Ground floor: living room, dining room, hall, kitchen, room, and study 100 W/m2 × 300 m2 = 30 kW.
First floor: study and bedrooms 125 W/m2 × 200 m2 = 25 kW.
Total power (demand) = 60 kW.
The power of the boreholes was assumed to be 44 kW/6 = 7.33 per head and heat exchanger (calculations in Section 3. Results). The designated ratios will cover 73% of energy needs. Alternatively, after testing, it is possible to replace the cascade system (as in Figure 5) with a system with one four-pipe head. Details of the location of the boreholes are shown in Figure 5.
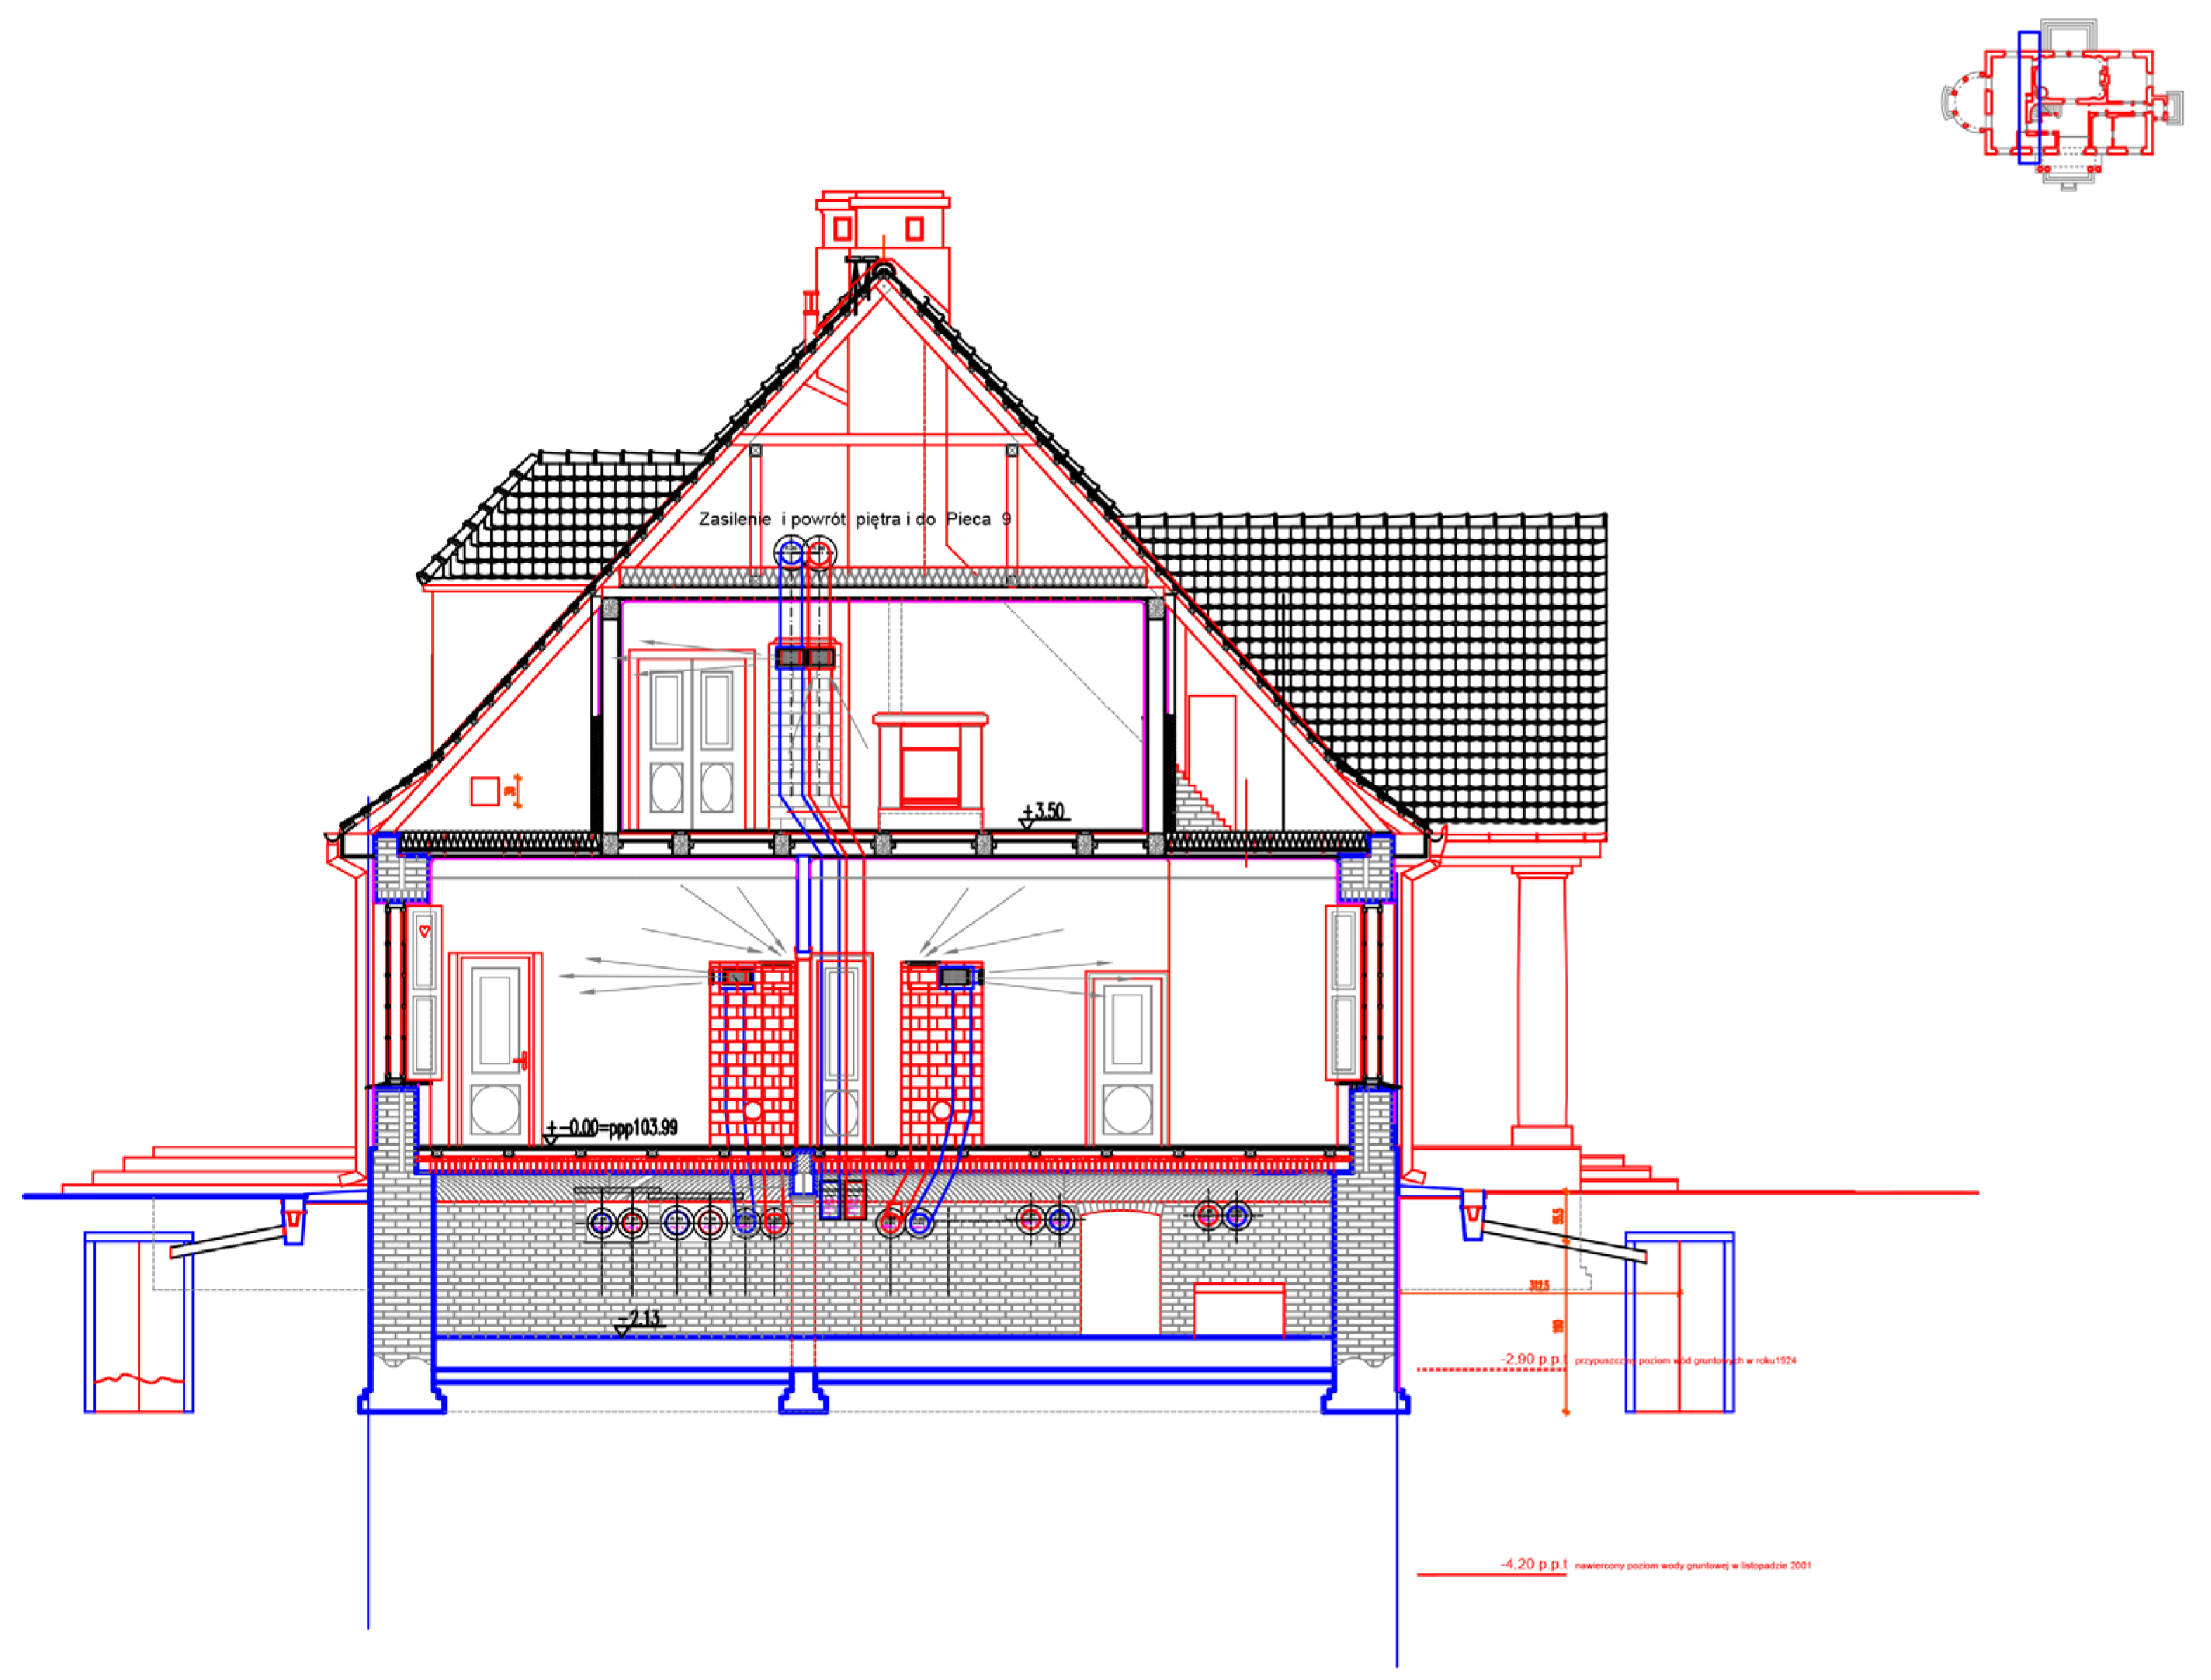
Installation in the historic building: the ground floor plan shows the FCH HVAC installation and the location of suppliers and exhausts in the stoves from individual installations made of acid steel with porcelain grilles (Figure 6). Vertical Section A-A: The entire FCH HVAC installation is concealed within the existing stoves (Figure 7).

3. Results

3.1. Expected Results of the FCH HVAC Technology

The indoor temperature in winter (Figure 8), i.e., from October 2018 to the end of October 2019, provided by the FCH HVAC installation located in the same region and in similar conditions (Mielec). Results from the BMS FCH HVAC were prepared based on readings of temperature sensors located in the FCH HVAC control station. The graph shows the outside temperature (blue) compared to measurements in three independent rooms (red, green, and yellow) to illustrate fluctuating temperatures while maintaining a constant inside temperature. This measurement proves the stability of the system during use with outside temperature differences of up to 50 °C. Only slight jumps or drops in indoor temperature are noticed (range up to 3 °C) with extremely large momentary jumps in outdoor temperatures of up to 15 °C. Thus, replacing the source from the traditional heating system in the facility (coal-fired boiler) with a renewable source of energy that does not produce CO2 into the atmosphere reduces the harmful emissions originally produced by the analyzed building.
As mentioned before, the system was installed in a 33,000 m2 facility and has been in operation since 2016. The basic annual results maintain a constant indoor temperature of +19 to +22 °C with outdoor temperatures of –15 °C in winter and +37 °C in summer. Based on these results, the FCH HVAC system can easily be considered environmentally friendly and energy efficient, while reducing CO2 emissions. This ensures stable internal temperatures even when external temperatures vary significantly.
According to the results published by team Wrana et al. [8,9,11] presenting internal conditions in rooms ventilated using the FCH HVAC system in Poland, the minimum temperature difference (between outside and inside temperature) was observed in Gdańsk (Pomerania region) 2.6 °C, with the average temperature differences being in Warsaw (center of Poland) 6.1 °C and Sosnowiec (Silesia region) 9.2 °C, and the maximum temperature difference being in Olsztyn (Masuria region) 16.3 °C. In calculating the expected reduction in cold energy, and assuming that the tested objects have an area of over 10,000 m2, we took as a basis for calculating the heat power FCH HVAC obtained from the groundwater of the facility as follows: area served by the FCHHVAC units—10,000 m2, an indicator of the amount of supplied ventilation air 8 m3/h/m2, so:
V = 10,000   m 2 · 8 m 3 h m 2 = 80   000 m 3 h = 22.22 m 3 s
Borehole capacity based on the temperature differences by simplified method (Equation (1)):
Q = V · ρ · C p · T   k W
  • V is the volumetric air flow rate m3/s.
  • ρ is the air density = 1.2 kg/m3.
  • Cp is the specific heat of air = 1.005 kJ/kg·K.
  • T is the difference in the air temperature upstream and downstream of the heater (39.80–23.5 °C).
Indicators of energy assurance in summer and winter, respectively:
Q S u m m e r = F C H = 22.22 · 1.2 · 1.005 · 39.8 23.5 = 436.79   k W
so, per 1 m2 of surface area in summer: 436.79   k W / 10000   m 2   44   W m 2
Q W i n t e r = F C H = 22.22 · 1.2 · 1.005 · 20.0 + 7.6 = 739.60   k W
so, per 1 m2 of surface area in winter: 436.79 739.60   k W / 10000   m 2   74   W m 2
An example area of the Olsztyn facility, researched in 2016, with an area of approximately 10,000 m2 will reduce 436.79 kW of cooling energy. The result shows differences in energy reduction in different climate zones on similar facilities and with comparable areas.
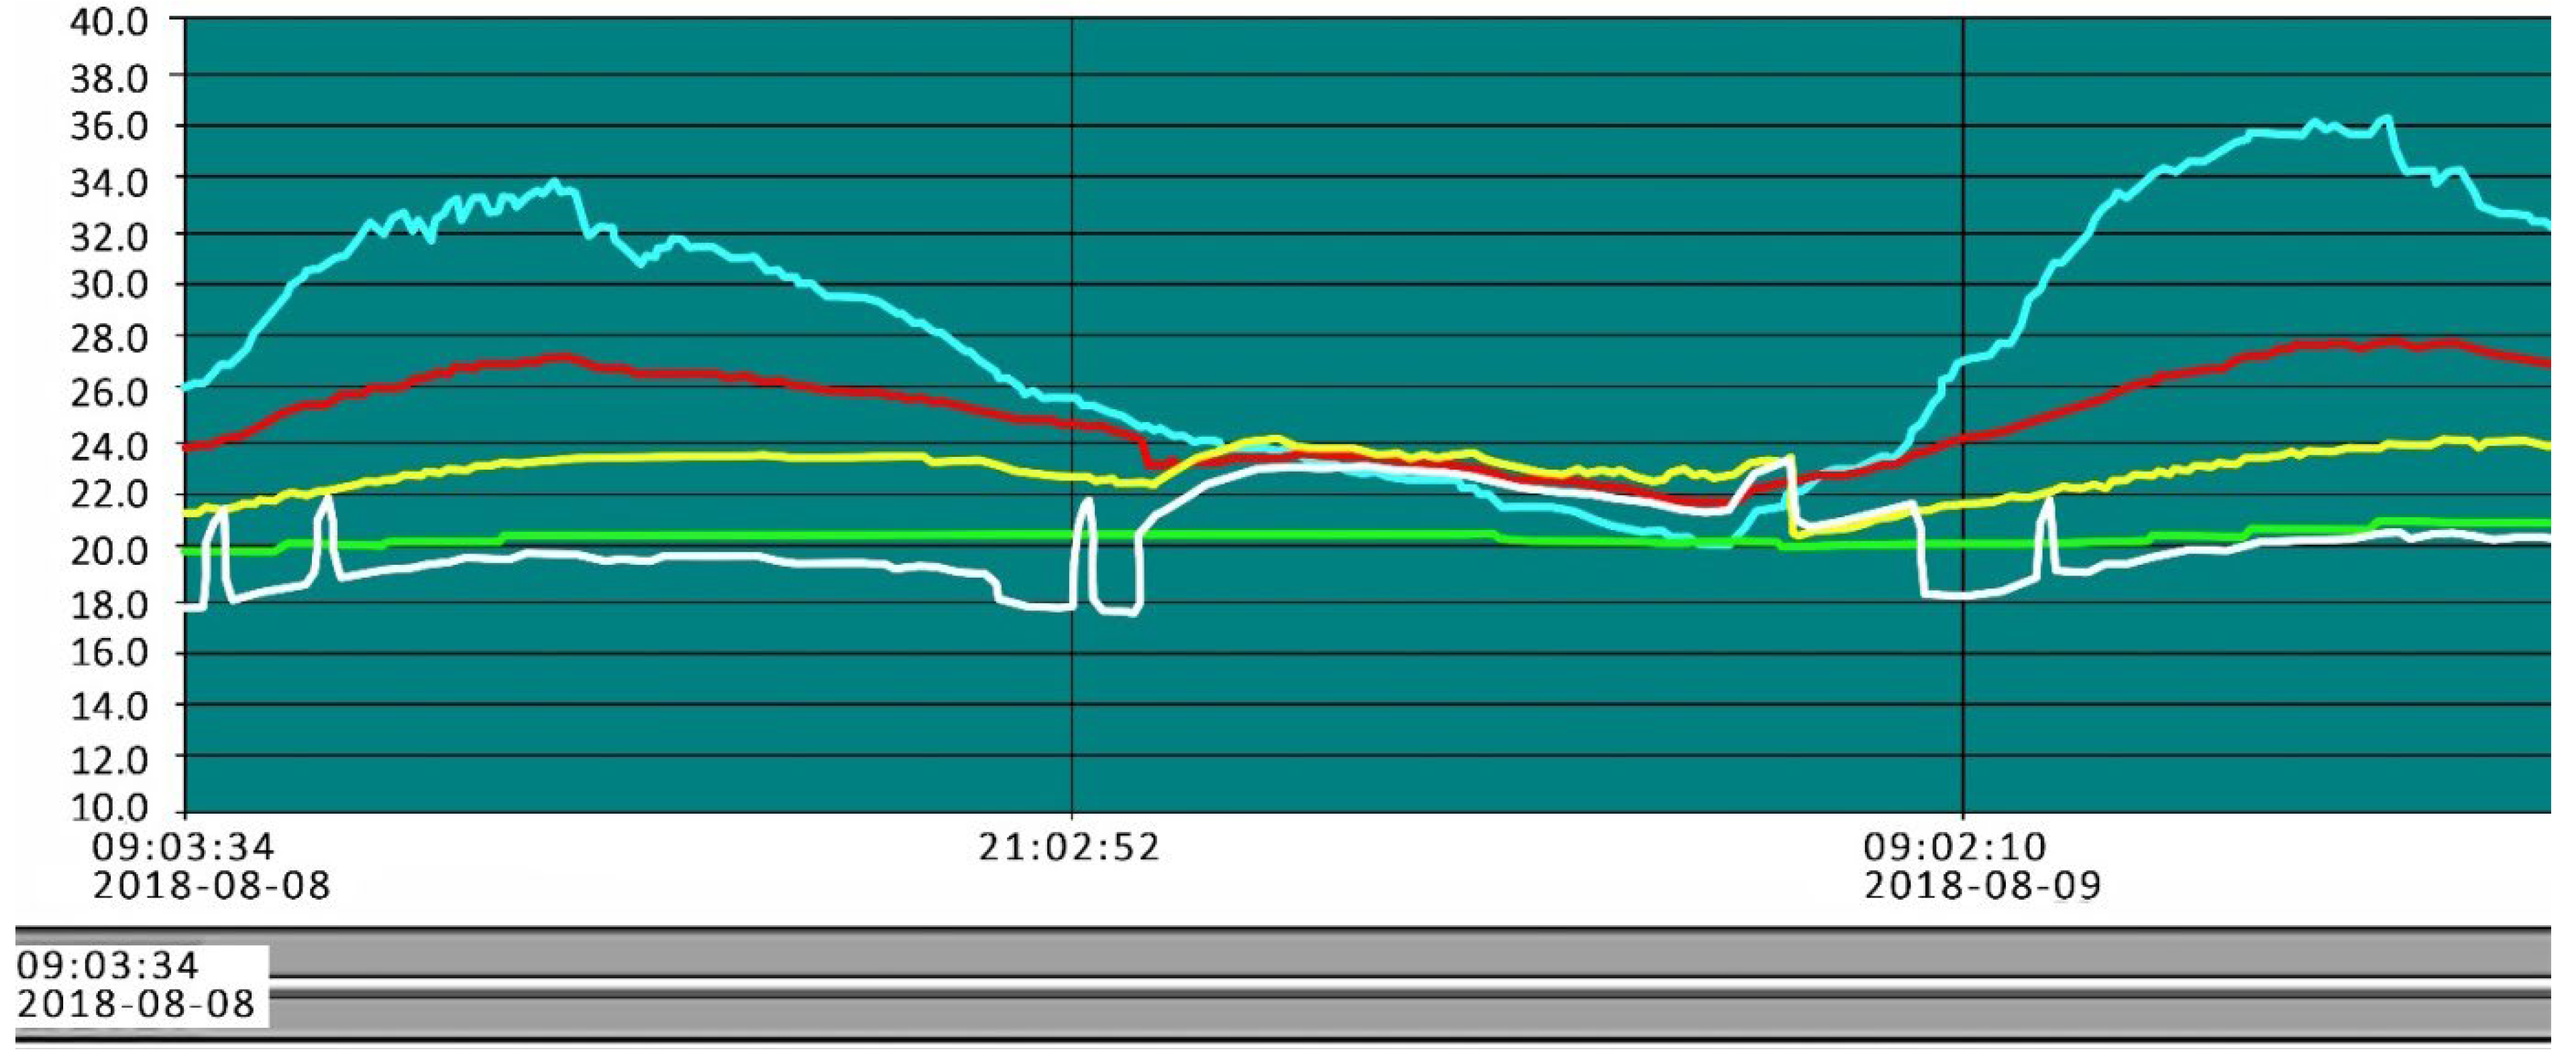
During the daily measurement in the summer (Figure 9), one can notice, among other things, a constant internal temperature (green line) in the room with a variable external temperature (blue line). With large temperature drops in the summer from +34 °C to +20 °C, only a slight increase in temperature was noticeable both on the FCH supply (yellow and white lines) and a drop in temperature behind the cooler.
As shown in the diagram (Figure 9), the FCH installation has high efficiency throughout the year, not only in winter but also in summer. The graph shows temperatures from summer 2018 with the temperature downstream of the FCH cooler at 27.9 °C. The analysis of this graph reveals the stabilization of the indoor temperature, which can be reduced to 20.9 °C at the outdoor temperature of 37.2 °C. The annual, weekly, and daily results presented in this chapter show the great power of ground heat exchangers throughout Poland and the real reduction in energy consumption per year, week, and day.

3.2. Financial Aspect of the Use of FCH HVAC

The presented FE consumption of the FCH HVAC installation gives promising information about this energy technology. The results confirm the advisability of using these solutions in accordance with the applicable Technical Provisions and EU Directives. The analysis of three historic buildings (Table 2): (i) the Marshal Piłsudski Museum (Poland) with a surface area of 500 m2, (ii) the Palace in Radzyń Podlaski (Poland) (1800 m2), and (iii) the Palace in Lublin [9] (Poland) (5585 m2) proves the suitability of these innovative installations to be implemented in historical buildings. This technology not only preserves the character of buildings but also ensures comfortable conditions inside, reducing operating costs and reducing CO2 emissions. The efficiency of the HVAC system brings benefits in terms of various factors, such as energy consumption, CO2 emissions, and annual operating costs and payback period compared to traditional heating systems used in historic buildings in Poland. Research on HVAC technology confirms the conclusion that replacing traditional systems with HVAC systems significantly reduces CO2 emissions [10,44,45,50,51,52,53]. Traditional technical solutions such as crossflow exchangers do not allow for greater energy recovery, which results in large losses in each device, which causes unnecessary costs and additional CO2 emissions. High operating costs mean high values of final energy and initial energy. The described FCH Technology, which easily transfers heat and cold energy from groundwater to FCH HVAC units using FCH exchangers, allows for cost reduction while reducing CO2. By introducing the described FCH technology, ecological heat and cold energy are obtained for HVAC installations, equipping the facility with solutions in accordance with technical requirement indicators.
The basis for this conclusion is the scientific research conducted in 2018 in Warsaw whose results are presented in a BMS temperature chart (Figure 9). The results were confirmed by computer simulations carried out using Energy Plus v. 8.1 software based on the hourly building simulation methodology. Design Builder v4.2.0.054 software using the Energy Plus v. 8.1 calculation engine mentioned above was applied to enter the data and interpret the results. Both Energy Plus v. 8.1 and Design Builder v4.2.0.054 meet the requirements for simulation software in accordance with ASHRAE 90.1 Appendix G. The simulations were performed for the building of the Museum in Sulejówek near the “Milusin” Manor House.
The value of utility costs (UC) was 28.80 PLN/m2/year/4.7 EUR/PLN = 6.12 EUR/m2/year; the comparison of these values with the UC of other facilities (22.0 EUR/m2/year) shows a 3.59-fold reduction in the utility costs, which account for 80% of all energy costs.

3.3. The Impact of FCH HVAC Technology on Reducing CO2 Emissions

FCH reduces three parameters:
1.
Electricity is at least 50% necessary for the operation of the fans.
2.
Cooling energy that is generated in condensers or AWL in 50%.
3.
Heat energy in the range of 50% to 70%.
In the case of electrical systems, it is possible to reduce their demand for this energy, which is the key to reducing CO2.
As a result of research carried out on three objects similar in volume and similar thermal conditions supplied with different energy sources. The graphs (Figure 10, Figure 11 and Figure 12) below show the percentage and quantity of energy demand for the tested objects. The analyzed facilities had an air handling unit of 22,000 m3/h. The results of the annual measurements of heating, cooling, and fan energy show a significant reduction in energy demand using FCH HVAC technology.
The presented cost structure for the analyzed technologies in PLN allows us to illustrate both the financial aspects of the FCH HVAC technology as well as the CO2 reduction.
  • Facility no. 1 (Figure 10): the total cost for the control panel is PLN 218,055.7.
  • Facility no. 2 (Figure 11): the total cost for the head office is PLN 179,697.3.
  • Facility no. 3 (Figure 12): the total cost for the head office is PLN 77,911.4.
The difference in costs for central no. 1 and 3 is PLN 140,144.0 and for central no. 2 and 3 PLN 10,785.0.
Figure 13 shows the annual CO2 emissions in three facilities using different heating technologies. The comparative studies lasted 12 months and covered passages, general areas, service premises, warehouses, and offices. The studies were conducted from December 2022 to November 2023. A significant difference is noticeable in all three systems. The FCH HVAC system used in facility no. 3 is characterized by both low emission and a constant level of emission regardless of the outside temperature. The trend line of CO2 emissions for the traditional cross system used in facility no. 1 was at an average annual level of 7.9 tons. In facility no. 2, with gas heating technology, it was 11.04 tons. Whereas the average for the FCH HVAC system was 2.98 tons.
To determine the cost difference, a coefficient was introduced. The air difference coefficient determined from the M1, M2, M3, M4 M5, and M6 units (total) is as follows.
  • Lower facility operating costs:
PLN 140,144.00 × 9.18 = PLN 1,323,242.00.
  • Lower CO2 emissions:
132.12 t CO2–35.77 t CO2 = 96.35 t CO2 × 9.18 = 884.49 t CO2.
  • Lower heating costs:
PLN 58,000.00 × 9.18 = PLN 532,440.00.
  • Lower cooling costs:
PLN 16,324.00 × 9.18 = PLN 149,854.32.
  • Lower fan operating costs:
PLN 65,821.00 × 9.18 = PLN 604,237.00.
Considering the economic benefits and environmental impact, it is justified to use this technology, especially in old buildings with still functioning technology related to coal combustion.

4. Conclusions

This technology harnesses the natural energy stored in groundwater. It is a sustainable and alternative approach to energy production. This renewable energy source is available around the clock, regardless of time of day or weather conditions, and has the potential to reduce CO2 emissions. Unlike traditional energy sources, which often require significant financial investment while increasing pollution and greenhouse gas emissions, this technology offers a cleaner alternative. In addition, studies have shown that it can be applied to virtually any facility, including old, historic buildings.
Furthermore, the approach is an example of a promising direction in global efforts to reduce CO2 emissions, using resources available in different regions. The study was carried out in Poland, where over the past 80 years temperatures have ranged from −40 °C in winter to +40 °C in summer. These conditions are indicative of the extreme temperature differences that the heating system must cope with. Studies have shown that FCH HVAC technology is able to operate successfully in these conditions, maintaining a stable temperature in the building at low energy consumption. Technology is also expected to soon play a key role in achieving significant reductions in CO2 emissions while keeping the financial outlay extremely low.
The study also led to the creation of a detailed numerical model for the proposed Marshal Pilsudski Museum building in Sulejówek. The model enabled the identification of critical energy parameters for building design. The main results included an operating energy consumption (UE) of 221.9 kWh/m2/year, a final energy consumption (FE) of 72.16 kWh/m2/year, a renewable energy efficiency (RE) of 139.6 kWh/m2/year, and an operating cost (UC) of 28.80 PLN/m2/year. These metrics highlight the efficiency and sustainability of the building and demonstrate its potential to serve as a model for future energy-efficient historic architecture.
The energy analyses were based on hourly modeling of thermal and flow processes, as well as functional HVAC systems. The results confirmed the low energy consumption of the system. A comparison of the cost of use (UC) of FCH technology shows that it accounts for 80% of total energy costs, while other facilities showed that these costs were 3.59 times lower. The question remains whether this energy should be abandoned. Without this clean and green energy, which is available worldwide, CO2 emissions cannot be reduced, which could lead to further environmental degradation.
The results show that FCH technology for HVAC is very promising and can be implemented not only in small historic buildings but also in large buildings such as palaces, castles, and museums. The technology has very low running costs of EUR 6/m2/year and reduces electricity consumption by more than 50%. In addition, 100% of the energy is extracted from groundwater, making this technology one of the leading innovations in reducing energy consumption.
Current research on FCH HVAC in historic buildings enables activities related to environmental impact analysis in the context of sustainable development. It is therefore necessary to carry out a detailed study of the impact and significance of this technology on CO2 emissions.

Author Contributions

Conceptualization, J.W., W.S., and P.G.; methodology, W.S. and P.G.; software, W.S.; validation, J.W., W.S., P.G., and K.J.-G.; formal analysis, P.G. and K.J.-G.; investigation, P.G. and K.J.-G.; resources, W.S. and J.W.; data curation, W.S.; writing—original draft preparation, W.S., P.G., and K.J.-G.; writing—review and editing, P.G., K.J.-G., and W.S.; visualization, W.S., P.G., and K.J.-G.; supervision, J.W.; project administration, J.W.; funding acquisition, J.W. All authors have read and agreed to the published version of the manuscript.

Funding

This research received no external funding.

Data Availability Statement

The original contributions presented in the study are included in the article, further inquiries can be directed to the corresponding author.

Conflicts of Interest

Author Wojciech Struzik was employed by the company Sanitary Engineer “WAKAD”. The remaining authors declare that the research was conducted in the absence of any commercial or financial relationships that could be construed as a potential conflict of interest.

References

  1. Tagliapietra, S.; Zachmann, G.; Edenhofer, O.; Glachant, J.-M.; Linares, P.; Loeschel, A. The European Union Energy Transition: Key Priorities for the next Five Years. Energy Policy 2019, 132, 950–954. [Google Scholar] [CrossRef]
  2. Lowe, R. Policy and Strategy Challenges for Climate Change and Building Stocks. Build. Res. Inf. 2009, 37, 206–212. [Google Scholar] [CrossRef]
  3. European Union. Directive 2012/27/EU of the European Parliament and of the Council of 25 October 2012 on Energy Efficiency, Amending Directives 2009/125/EC and 2010/30/EU and Repealing Directives 2004/8/EC and 2006/32/EC Text with EEA Relevance; European Union: Brussels, Belgium, 2012; Volume 315. [Google Scholar]
  4. Skiba, M.; Bazan-Krzywoszańska, A.; Mrówczyńska, M.; Łączak, A. Economic Conditions for the Development of Energy Efficient Civil Engineering Using RES in the Policy of Cohesion of the European Union (2014–2020). Case Study: The Town of Zielona Gora. Energy Build. 2016, 118, 170–180. [Google Scholar] [CrossRef]
  5. Egging, R. Drivers, Trends, and Uncertainty in Long-Term Price Projections for Energy Management in Public Buildings. Energy Policy 2013, 62, 617–624. [Google Scholar] [CrossRef]
  6. Zhu, K.; Victoria, M.; Andresen, G.B.; Greiner, M. Impact of Climatic, Technical and Economic Uncertainties on the Optimal Design of a Coupled Fossil-Free Electricity, Heating and Cooling System in Europe. Appl. Energy 2020, 262, 114500. [Google Scholar] [CrossRef]
  7. Ferdyn-Grygierek, J.; Grygierek, K. HVAC Control Methods for Drastically Improved Hygrothermal Museum Microclimates in Warm Season. Build. Environ. 2019, 149, 90–99. [Google Scholar] [CrossRef]
  8. Wrana, J.; Struzik, W.; Gleń, P. Natural Energy Stored in Groundwater Deposits as a New Way of Obtaining Green Energy for Urban Planners, Architects and Environmentalists. Energies 2022, 15, 4716. [Google Scholar] [CrossRef]
  9. Wrana, J.; Struzik, W.; Kwiatkowski, B.; Gleń, P. Release of Energy from Groundwater/with Reduction in CO2 Emissions of More Than 50% from HVAC in the Extension and Revitalization of the Former Palace of the Sobieski Family in Lublin. Energies 2022, 15, 6627. [Google Scholar] [CrossRef]
  10. Hou, F.; Ma, J.; Kwok, H.H.L.; Cheng, J.C.P. Prediction and Optimization of Thermal Comfort, IAQ and Energy Consumption of Typical Air-Conditioned Rooms Based on a Hybrid Prediction Model. Build. Environ. 2022, 225, 109576. [Google Scholar] [CrossRef]
  11. Wrana, J.; Struzik, W. Research for Achieving High Quality Air in Architecture and Urban Planning on the Example of the Educational and Sports Center in Józefów near Warsaw, Poland. In Current Perspectives and New Directions in Mechanics, Modelling and Design of Structural Systems; CRC Press: Boca Raton, FL, USA, 2022; ISBN 978-1-00-334845-0. [Google Scholar]
  12. Cramton, P.; Kerr, S. Tradeable Carbon Permit Auctions: How and Why to Auction Not Grandfather. Energy Policy 2002, 30, 333–345. [Google Scholar] [CrossRef]
  13. Jaan, S. ReFuelEU Aviation Initiative: Sustainable Aviation Fuels and the Fit for 55 Package; European Parliamentary Research Service: Brussels, Belgium, 2022. [Google Scholar]
  14. Parker, L. Carbon Tax and Greenhouse Gas Control: Options and Considerations for Congress; Library of Congress: Washington, DC, USA, 2009. [Google Scholar]
  15. Thisted, E.V.; Thisted, R.V. The Diffusion of Carbon Taxes and Emission Trading Schemes: The Emerging Norm of Carbon Pricing. Environ. Politics 2020, 29, 804–824. [Google Scholar] [CrossRef]
  16. PBL Trends in Global CO2 and Total Greenhouse Gas Emissions; 2020 Report. Available online: https://www.pbl.nl/en/publications/trends-in-global-co2-and-total-greenhouse-gas-emissions-2020-report (accessed on 21 June 2022).
  17. Rutz, D.; Ball, I.; Di Costanzo, B.; Janssen, R.; Tretter, H.; Knaus, K.; Drexlmeier, S.; Baumann, C.; Puente, F.; Šegon, V.; et al. An Urgent Call for the Phase-out of Fossil Space Heating Systems and for the Support of Renewables in the Heating Sector; ETA-Florence Renewable Energies: Florence, Italy, 2020; pp. 930–932. [Google Scholar]
  18. Bao, Y.; Bing, S.; Fu, X.; Anbang, L.; Kehua, L.; Shen, L.; Rui, Y.; Qiuzhuang, L.; Ao, L.; Yuanyang, L.; et al. Energy-Oriented Control Retrofit for Existing HVAC System Adopting Data-Driven MPC—Methodology, Implementation and Field Test. Energy Build. 2023, 295, 113286. [Google Scholar] [CrossRef]
  19. Coma, J.; Maldonado, J.M.; de Gracia, A.; Gimbernat, T.; Botargues, T.; Cabeza, L.F. Comparative Analysis of Energy Demand and CO2 Emissions on Different Typologies of Residential Buildings in Europe. Energies 2019, 12, 2436. [Google Scholar] [CrossRef]
  20. Pachano, J.E.; Fernández-Vigil Iglesias, M.; Saiz, J.C.; Fernández Bandera, C. Two-Stage Multi-Step Energy Model Calibration of the Cooling Systems of a Large-Space Commercial Building. Appl. Therm. Eng. 2023, 230, 120638. [Google Scholar] [CrossRef]
  21. Abualigah, L.; Zitar, R.A.; Almotairi, K.H.; Hussein, A.M.; Abd Elaziz, M.; Nikoo, M.R.; Gandomi, A.H. Wind, Solar, and Photovoltaic Renewable Energy Systems with and without Energy Storage Optimization: A Survey of Advanced Machine Learning and Deep Learning Techniques. Energies 2022, 15, 578. [Google Scholar] [CrossRef]
  22. Mitali, J.; Dhinakaran, S.; Mohamad, A.A. Energy Storage Systems: A Review. Energy Storage Sav. 2022, 1, 166–216. [Google Scholar] [CrossRef]
  23. Stemmle, R.; Blum, P.; Schüppler, S.; Fleuchaus, P.; Limoges, M.; Bayer, P.; Menberg, K. Environmental Impacts of Aquifer Thermal Energy Storage (ATES). Renew. Sustain. Energy Rev. 2021, 151, 111560. [Google Scholar] [CrossRef]
  24. Salat, S. Energy Loads, CO2 Emissions and Building Stocks: Morphologies, Typologies, Energy Systems and Behaviour. Build. Res. Inf. 2009, 37, 598–609. [Google Scholar] [CrossRef]
  25. Rodrigues, E.; Fernandes, M.S.; Carvalho, D. Future Weather Generator for Building Performance Research: An Open-Source Morphing Tool and an Application. Build. Environ. 2023, 233, 110104. [Google Scholar] [CrossRef]
  26. Shook, P.; Choi, J.-K.; Kissock, K. Analyzing the Multiscale Impacts of Implementing Energy-Efficient HVAC Improvements Through Energy Audits and Economic Input–Output Analysis. J. Energy Resour. Technol. 2022, 145, 1–20. [Google Scholar] [CrossRef]
  27. Skoczkowski, T.; Bielecki, S. Efektywność energetyczna—Polityczno-formalne uwarunkowania rozwoju w Polsce i Unii Europejskiej. Polityka Energetyczna / Energy Policy J. 2016, 19, 5–20. [Google Scholar]
  28. Maroufmashat, A.; Fowler, M. Transition of Future Energy System Infrastructure; through Power-to-Gas Pathways. Energies 2017, 10, 1089. [Google Scholar] [CrossRef]
  29. Zhang, X.; Chan, S.H.; Ho, H.K.; Tan, S.-C.; Li, M.; Li, G.; Li, J.; Feng, Z. Towards a Smart Energy Network: The Roles of Fuel/Electrolysis Cells and Technological Perspectives. Int. J. Hydrogen Energy 2015, 40, 6866–6919. [Google Scholar] [CrossRef]
  30. Zerefos, S.C.; Tessas, C.A.; Kotsiopoulos, A.M.; Founda, D.; Kokkini, A. The Role of Building Form in Energy Consumption: The Case of a Prismatic Building in Athens. Energy Build. 2012, 48, 97–102. [Google Scholar] [CrossRef]
  31. Dolšak, J. Determinants of Energy Efficient Retrofits in Residential Sector: A Comprehensive Analysis. Energy Build. 2023, 282, 112801. [Google Scholar] [CrossRef]
  32. Filippín, C.; Ricard, F.; Flores Larsen, S. Evaluation of Heating Energy Consumption Patterns in the Residential Building Sector Using Stepwise Selection and Multivariate Analysis. Energy Build. 2013, 66, 571–581. [Google Scholar] [CrossRef]
  33. Qin, H.; Yu, Z.; Li, T.; Liu, X.; Li, L. Energy-Efficient Heating Control for Nearly Zero Energy Residential Buildings with Deep Reinforcement Learning. Energy 2023, 264, 126209. [Google Scholar] [CrossRef]
  34. Aksoezen, M.; Daniel, M.; Hassler, U.; Kohler, N. Building Age as an Indicator for Energy Consumption. Energy Build. 2015, 87, 74–86. [Google Scholar] [CrossRef]
  35. Rey-Hernández, J.M.; San José-Alonso, J.F.; Velasco-Gómez, E.; Yousif, C.; Rey-Martínez, F.J. Performance Analysis of a Hybrid Ventilation System in a near Zero Energy Building. Build. Environ. 2020, 185, 107265. [Google Scholar] [CrossRef]
  36. Struzik, W. Air handling unit with the system forcing the air circulation in the rooms ventilation and air conditioning in various climate conditions . 2015. Available online: https://ewyszukiwarka.pue.uprp.gov.pl/search/pwp-details/P.415163?lng=pl (accessed on 15 November 2024).
  37. Struzik, W. Arrangement of Devices for Obtaining Hot Water from the Underground Water Installation for the Air Conditioning and Ventilation Equipment. 2015. Available online: https://ewyszukiwarka.pue.uprp.gov.pl/search/pwp-details/P.425437?lng=pl (accessed on 15 November 2024).
  38. Struzik, W. System of Devices for Acquiring Hot Water from the Underground Water System Intended for the Air Conditioning and Ventilation Equipment. 2013. Available online: https://ewyszukiwarka.pue.uprp.gov.pl/search/pwp-details/P.406309?lng=pl (accessed on 15 November 2024).
  39. Struzik, W. System Equipment to Obtain Ice Water from the Ground Water System for Air Conditioning, Refrigeration. 2012. Available online: https://ewyszukiwarka.pue.uprp.gov.pl/search/pwp-details/P.398322?lng=pl (accessed on 15 November 2024).
  40. Lande, E.J.; Ritter, S.; Karlsrud, K.; Nordal, S. Understanding Effects from Overburden Drilling of Piles—A Rational Approach to Reduce the Impacts on the Surroundings. Can. Geotech. J. 2024, 61, 2206–2222. [Google Scholar] [CrossRef]
  41. Asadimehr, S. Examining Drilling Problems and Practical Solutions Regarding Them. Eurasian J. Chem. Med. Pet. Res. 2024, 3, 552–562. [Google Scholar]
  42. Capuano, L.E., Jr. 5—Geothermal Well Drilling. In Geothermal Power Generation, 2nd ed.; DiPippo, R., Gutiérrez-Negrín, L.C.A., Chiasson, A., Eds.; Woodhead Publishing Series in Energy; Elsevier: Amsterdam, The Netherlands, 2024; pp. 125–158. ISBN 978-0-443-24750-7. [Google Scholar]
  43. Ghanitoos, H.; Goharimanesh, M.; Akbari, A. Prediction of Drill Penetration Rate in Drilling Oil Wells Using Mathematical and Neurofuzzy Modeling Methods. Energy Rep. 2024, 11, 145–152. [Google Scholar] [CrossRef]
  44. Al-Waked, R.; Nasif, M.S.; Groenhout, N.; Partridge, L. Energy Performance and CO2 Emissions of HVAC Systems in Commercial Buildings. Buildings 2017, 7, 84. [Google Scholar] [CrossRef]
  45. Verma, V.; Meena, C.S.; Thangavel, S.; Kumar, A.; Choudhary, T.; Dwivedi, G. Ground and Solar Assisted Heat Pump Systems for Space Heating and Cooling Applications in the Northern Region of India—A Study on Energy and CO2 Saving Potential. Sustain. Energy Technol. Assess. 2023, 59, 103405. [Google Scholar] [CrossRef]
  46. Obiuto, N.C.; Ebirim, W.; Ninduwezuor-Ehiobu, N.; Ani, E.C.; Olu-lawal, K.A.; Ugwuanyi, E.D. Integrating Sustainability Into HVAC Project Management: Challenges and Opportunities. Eng. Sci. Technol. J. 2024, 5, 873–887. [Google Scholar] [CrossRef]
  47. Ebirim, W.; Olu-lawal, K.A.; Ninduwezuor-Ehiobu, N.; Montero, D.J.P.; Usman, F.O.; Ani, E.C. Leveraging Project Management Tools for Energy Efficiency in HVAC Operations: A Path to Climate Resilience. Eng. Sci. Technol. J. 2024, 5, 653–661. [Google Scholar] [CrossRef]
  48. Karimi, H.; Adibhesami, M.A.; Bazazzadeh, H.; Movafagh, S. Green Buildings: Human-Centered and Energy Efficiency Optimization Strategies. Energies 2023, 16, 3681. [Google Scholar] [CrossRef]
  49. Ebirim, W.; Usman, F.O.; Montero, D.J.P.; Ninduwezuor-Ehiobu, N.; Ani, E.C.; Olu-lawal, K.A. Assessing the Impact of Climate Change on HVAC System Design and Project Management. Int. J. Appl. Res. Soc. Sci. 2024, 6, 173–184. [Google Scholar] [CrossRef]
  50. Yildiz, O.F.; Yilmaz, M.; Celik, A. Reduction of Energy Consumption and CO2 Emissions of HVAC System in Airport Terminal Buildings. Build. Environ. 2022, 208, 108632. [Google Scholar] [CrossRef]
  51. Farouk, N.; El-Rahman, M.A.; Sharifpur, M.; Guo, W. Assessment of CO2 Emissions Associated with HVAC System in Buildings Equipped with Phase Change Materials. J. Build. Eng. 2022, 51, 104236. [Google Scholar] [CrossRef]
  52. Pylsy, P.; Lylykangas, K.; Kurnitski, J. Buildings’ Energy Efficiency Measures Effect on CO2 Emissions in Combined Heating, Cooling and Electricity Production. Renew. Sustain. Energy Rev. 2020, 134, 110299. [Google Scholar] [CrossRef]
  53. Khadra, A.; Akander, J.; Myhren, J.A. Greenhouse Gas Payback Time of Different HVAC Systems in the Renovation of Nordic District-Heated Multifamily Buildings Considering Future Energy Production Scenarios. Buildings 2024, 14, 413. [Google Scholar] [CrossRef]
Figure 1. Scheme of the lower-source FCH installation for obtaining groundwater energy with a system of vertical heat and cold exchangers. Source: authors’ data.
Energies 17 05946 g001
Figure 2. Groundwater temperature measurement results in the engine room of the FCH HVAC node before introducing the medium into the pumping room. Source: authors’ data *. * Installation tests performed in March 2017, Galeria facility in Mielec, by WAKAD Sp. z o. o. Results from the BMS of the FCH HVAC installation.
Energies 17 05946 g002
Figure 3. Chart of heat energy recovery in the HVAC installation according to diagram Figure 1. Orange line—temperature behind the rotary exchanger—which without the FCH heater has values of 9.5 °C. Red line—temperature after the FCH exchanger, and rotary exchanger with a value of 16.6 °C. Source: authors’ data*. * Installation tests performed in March 2017, Galeria facility in Mielec, performed by WAKAD Sp. z o. o. Results from the BMS of the FCH HVAC installation.
Energies 17 05946 g003
Figure 4. Results of the installation performance test, Eastern Poland Region 2022. Source: authors’ data.
Energies 17 05946 g004
Figure 5. Location of FCH HVAC installation boreholes. “Milusin” Manor House, Marshal Piłsudski Museum in Sulejówek. Source: authors’ data.
Energies 17 05946 g005
Figure 6. Example of FCH HVAC installation. Ground floor plan—“Milusin” Manor House, Marshal Piłsudski Museum in Sulejówek. Source: authors’ data.
Energies 17 05946 g006
Figure 7. Vertical Section A-A of the FCH HVAC installation. “Milusin” Manor House, Marshal Piłsudski Museum in Sulejówek. Source: authors’ data.
Energies 17 05946 g007
Figure 8. Indoor temperature distribution throughout the year in winter and summer. Source: The authors. Blue line—outdoor temperature, green—room temp (no. 1), red—room temp (no. 2), yellow—room temp (no. 3).
Energies 17 05946 g008
Figure 9. Temperature distribution in summer. Location: Warsaw (Poland). Source: authors’ data. Green line—indoor temperature, blue—outdoor temperature, red—downstream of the FCH cooler; yellow—supply temperature at FCH radiator, white—supply temperature current value.
Energies 17 05946 g009
Figure 10. Costs generated by traditional cross-technology. Source: authors’ data.
Energies 17 05946 g010
Figure 11. Cost generated by Gas spinner technology. Source: authors’ data.
Energies 17 05946 g011
Figure 12. Cost generated by FCH HVAC technology. Source: authors’ data.
Energies 17 05946 g012
Figure 13. CO2 emissions in three technologies. Source: authors’ data.
Energies 17 05946 g013
Table 1. Comparison of heat pumps, which are widely regarded as an ecological HVAC system, with FCH HVAC installations. Source: authors’ data. Source: authors’ data.
ParameterTraditional Ground Water Heat Pump aFCH Installations b
Installation power3.3 MW3.0 MW
Number of boreholes825 set285 set
Depth of boreholes100 m20 m
Cost of drillingEUR 1,968,085EUR 147,606
Electric energy consumption855 kWh0 kWh
Electricity consumption distribution100 kWh100 kWh
Total electric energy consumption955 kWh100 kWh
Cost of pumpsEUR 404,255EUR 21,276
Coefficient of performance3.8520
Investment cost cEUR 2,372,340EUR 425,532
Operation cost20 EUR/m2/year3.0 EUR/m2/year
Carbon footprint d100%20%
a according to the traditional groundwater heat pump—Construction Design of the Center Navigator in Mielec prepared by BP Niebudek; app. 8 Analysis of alternative renewable energy sources heat pump offer 2011. b according to the FCH installations Measurements of the FCH installation Centrum Navigator in Mielec, made by WAKAD Sp. z o. o. (Lublin, Poland); March 2017. c the investment cost is the result of two components: the cost of the pump wells is EUR 1,968,085 with the cost of the pump equipment is EUR 404. d Carbon footprint—means only the CO2 emissions that occurred during the manufacture of the Heat Pump and FCH system.
Table 2. List of operating costs of the FCH technology in relation to the traditional technology. * The sum of the costs results from the components: electricity, district heating, gas, and others.
ObjectCubic Capacity [m2]FCH
[EUR] *
Traditional
[EUR]
Marshal Piłsudski Museum5006.115.2
Palace in Radzyń Podlaski18006.716.9
Palace in Lublin55856.516.3
Disclaimer/Publisher’s Note: The statements, opinions and data contained in all publications are solely those of the individual author(s) and contributor(s) and not of MDPI and/or the editor(s). MDPI and/or the editor(s) disclaim responsibility for any injury to people or property resulting from any ideas, methods, instructions or products referred to in the content.