Article

A Study on the Effect of Toroidal Propeller Parameters on Efficiency and Thrust

1
School of Technology, Beijing Forestry University, No. 35 Qinghua East Road, Haidian District, Beijing 100083, China
2
Weihai Hydrogen Tritium Power Equipment Co., Ltd., No. 186-1 Hexing Road, Huancui District, Weihai 266000, China
*
Author to whom correspondence should be addressed.
Energies 2024, 17(23), 5938; https://doi.org/10.3390/en17235938
Submission received: 4 November 2024 / Revised: 21 November 2024 / Accepted: 25 November 2024 / Published: 26 November 2024

Abstract

:
This paper delves into the effects of a toroidal propeller’s geometrical characteristics on its thrust and efficiency. The focus is on three distinct numerical distributions: the outward inclination angle, the pitch angle, and the number of blades. The Reynolds-Averaged Navier–Stokes (RANS) method is employed to analyze the propeller’s open-water performance, taking into account cavitation flow, and a test bed was constructed to verify the rationality of CFD simulation. The findings reveal that the toroidal propeller’s efficiency and thrust coefficient initially increase with the outward inclination angle, followed by a decline; the angle of maximum efficiency is identified at 23.25°. A reduction in the pitch angle leads to a temporary rise in efficiency, which subsequently falls, accompanied by a continuous decrease in the thrust coefficient. The optimal selection angle should consider this to prevent negative thrust at lower advance coefficients, which could further impact overall efficiency. An increased number of blades elevates the thrust coefficient and reduces the force on each blade, yet has a minimal effect on efficiency. Additionally, the orthogonal test method was utilized to explore the interactions between these three parameters. The outcomes indicate that, in terms of final power, there is no significant interaction among the three parameters under investigation. However, notable interactions are observed between the pitch angle and the number of blades, the outward inclination angle and the pitch angle, and the outward inclination angle and the number of blades. Consequently, the study’s findings facilitate the selection of parameter combinations that yield higher efficiency or thrust coefficients.

1. Introduction

The International Maritime Organisation has made the Energy Efficiency Design Index for ships, or EEDI, mandatory due to the shipping industry’s significant greenhouse gas emissions and the unprecedented attention that global warming has brought to environmental protection in recent years. In this regard, ships should operate with the least amount of greenhouse gas emissions possible and steadily increase fuel economy in order to fully execute environmental protection regulations. Humanity has relied on the high-speed spinning propeller with radial blades to propel itself through the air or water for ages, ever since Archimedes created it around 200 BC. Conventional propeller development has reached a dead end in terms of increasing propulsion efficiency and lowering hydrodynamic noise, while there are still some unresolved issues. People started experimenting with a lot of different kinds of propellers. Zhang conducted numerical analyses of wake dynamics and continuously optimized the conduit propeller [1], which has been around for a while. Sanchez looked into the structural design of the shaftless rimmed propeller [2]. A toroidal propeller has been the subject of research in recent years due to its potential to increase propulsion efficiency and decrease vibration and noise. It has been investigated and used in the shipbuilding industry globally. In 2013, Sharrow Marine patented the ring propeller and developed a marine propeller [3], which it claims improves the performance of boats, increases the propulsion efficiency of ships, and reduces noise [4]. In 2017, the Massachusetts Institute of Technology (MIT) renewed and reapplied for a patent on an annular propeller, which was granted in 2020 [5]. The impacts that the geometric parameters of toroidal propellers will bring are still unknown, and worldwide theoretical research on toroidal propellers is still in its early stages. Thankfully, the CFD technique has advanced to a point where it is now possible to directly examine the dynamic performance of toroidal propellers by utilizing the tools provided by the CFD, which can summarize the effects of each parameter on the toroidal propeller dynamics.
In order to reduce meshing errors and increase computational efficiency in the simulation, Zhang looked into the mesh-independent solution approach [6], which has been the subject of numerous research articles on the CFD modeling of propellers. Rhee studied the cavitation flow around a ship propeller using the unstructured mesh-based Reynolds-Averaged Navier–Stokes computational hydrodynamic approach [7].
Regarding turbulence modeling, Sikirica examined the impact of modeling turbulence on propeller simulation results based on the RANS method for ship propeller performance study and assessed various models of turbulence [8]. Using a RANS solver, Peng examined how turbulence modeling affected the prediction of vortex dynamics at the top of the blades and the open-water performance [9]. Helal looked into how a propeller model affected the blades when both laminar and turbulent transition flows were present [10]. Warjito evaluated three turbulence models for the purpose of predicting the performance of small hydraulic propeller turbines [11]. The models were based on two Reynolds-Averaged Navier–Stokes (RANS) equations: the standard k-e, the group normalized (RNG) k-e, and the shear stress transfer (SST) k-w.
Cavitation has been the subject of numerous research. Subhas and Zhu successfully replicated water flow and bubbles using mixed multiphase flow [12,13]. SHI compared the accuracy of two cavitation models [14], Schnerr–Sauer (S-S) and Zwart–Gerber–Belamri (ZGB), and the results showed that the former had higher cavitation intensities than the latter.
Ghasemi used the RANS method to analyze the scaling effect of a toroidal propeller [15], which is a modified version of a conventional propeller that still refers to its dynamic characteristics. The analysis focused on the effects of factors like blade deflection, blade load, and blade area ratio on the scaling effect.
Based on the original design of a standard propeller, Belhenniche constructed 14 propeller variations by modifying the number of blades [16], extending the area, and geometric pitch ratio. This allowed him to explore the impact of propeller geometry on hydrodynamic performance. The ability of boundary element method and boundary element method propeller solvers to characterize propeller performance during maneuvering was examined by Gaggero [17].
Boucetta used numerical analysis to examine the impact of blade number parameters on propeller hydrodynamic performance [18]. In order to assess how well various propeller types performed in aft and open-water settings, Tadros examined how well they performed under hydrostatic conditions [19]. Pawar designed propellers in SOLIDWORKS and conducted additional structural analysis in ANSYS [20]. By adjusting the forward–outward inclination angle of the B-series propellers with a variation to produce the rotor thrust, Jadmiko obtained the propeller thrust [21]. Mathematical formulas for the geometrical parameters of the toroidal propeller, including the outward inclination angle, have recently been obtained by YE and others [22]. These expressions will be very useful for studying the impacts of toroidal propeller characteristics.
In this study, the CFD method is used to simulate the toroidal propeller model with fluid–solid coupling, calculate the open-water data of the propeller under different advance coefficients, and compare and analyze the efficiency and thrust results of each parameter, aiming to explore the influence of the lateral inclination angle, pitch angle, and the number of blades on the kinetic performance of the toroidal propeller, on the basis of which the optimal parameter configurations of the propeller are obtained, which can provide some references for subsequent research on the toroidal propeller.

2. Materials and Methods

2.1. Geometry and Mesh Generation

The model propeller is situated within a larger computational domain to simulate its operation in open water. Two computational domains are established in the SpaceClaim modeling software version 2022R1: a static domain to simulate the ship’s travel conditions and a rotational domain to simulate the propeller’s rotating conditions. The overall computational domain is configured as depicted in Figure 1, wherein the stationary domain represents the portion of the fluid around the propeller that does not rotate with the propeller. In the stationary domain, the flow of fluid is described relative to a fixed reference system. This domain typically includes the fluid in front of and behind the propeller, as well as the fluid around the propeller. The rotational domain represents the propeller itself as well as the portion of the fluid immediately surrounding the propeller. In the rotational domain, the flow of fluid is described relative to a rotational reference system. This region is set up to simulate the effect on the surrounding fluid as the propeller rotates. Dealing with this kind of interface by using a Sliding Mesh Model can ensure the efficiency and accuracy of the simulation. The total domain is a cylinder with a height of 1 m and a radius of 0.15 m. The rotational domain is also a cylinder with a height of 0.08 m and a radius of 0.05 m. In order to ensure the accuracy of computation and to reduce the computational difficulty, the static domain, the rotational domain, and the propeller are, respectively, characterized by the use of different grid sizes.
Grid size significantly influences the accuracy of the final calculations; while a smaller grid typically offers greater accuracy, it also presents a significant computational challenge. Therefore, selecting an appropriate grid size is crucial. This paper calculates the thrust of the toroidal propeller under five different grid resolutions. In Figure 2, propellers with various meshes are displayed. Table 1 displays the base grid size, the propeller-thrust-coefficient calculation results, and the relative deviation. Using a minimum grid of 0.0005 m as the benchmark, it is evident that when the grid size is less than 0.04 m, the relative deviation is less than 1%. The base grid size of 0.002 m is chosen as the final calculation grid after the accuracy of the calculation results and the necessary computation cost are balanced. The mesh type is a hexahedral mesh.

2.2. Numerical Modeling

According to Sikirica’s research findings, the toroidal propeller has a better advantage in lowering the influence of the cavitation phenomena; the simulation should take this into account, in addition to the Reynolds number and turbulence model. Among them are the turbulence models, which are mathematical models used to simulate and analyze the turbulence effects that occur when a propeller moves through a fluid. These models are essential for understanding and predicting propeller performance, especially in ship and aircraft design. Commonly used turbulence models include the standard k-ε model, the RNG k-ε model, and the Realizable k-ε model. Using the Zwart–Gerber–Belamri to calculate the cavitation flow also produced superior findings, as also achieved by Yang and others, who used a realistic turbulence model to obtain results that were more consistent with the experimental results [23]. TAN have also studied multiphase flow and cavitation, and in this paper [24], the Realizable turbulence model and ZGB model integrated in Fluent are used for simulation calculations.
The control equations of the Realizable k ε   are in the form of:
( ρ k ) t + ( ρ u j k ) x j = G k + G b ρ ε Y M + S k + x j [ ( μ + μ t σ k ) k x j ]
( ρ ε ) t + ( ρ u j ε ) x j = C ε 1 ε k C ε 3 G b + S ε + ρ C ε 1 S ε C ε 2 ρ ε 2 k + v ε + x j [ ( μ + μ t σ ε ) ε x j ]
where ρ is the fluid density; k is the turbulent kinetic energy; u j is the fluid velocity component; μ is the dynamic viscosity of the fluid; μ t is the turbulent viscosity; ε is the turbulent dissipation rate; Y M is the compressibility correction term, which is related to the pulsation expansion in the compressible turbulent flow;   G k is the turbulent kinetic energy due to the mean velocity gradient; G b   is the generation term of the turbulence energy caused by buoyancy; S k and S ε are the source terms of the k equation and ε equation, respectively; C ε 1   a n d   C ε 2 are model constants; C ε 3 is the coefficient related to buoyancy; v is the fluid kinematic viscosity; and σ k and σ ε are turbulent Prandtl numbers for turbulent kinetic energy and dissipation rate. The ZGB model, known as the Zwart–Gerber–Belamri model, is a mathematical model used to simulate the phenomenon of cavitation. Cavitation is the formation of vapor or gas-filled vacuoles in a fluid as a result of a pressure reduction below the vapor pressure. This phenomenon is very common in marine propellers, hydraulic turbines, pumps, and other hydraulic machinery, and has a significant impact on the performance and life of these devices. The ZGB model assumes that the radii of the bubbles in the system are the same, and the mass transfer rate is calculated from the bubble density using the following formula:
m = n × ( 4 π R B 2 ρ v D R B D t )
where R B is the radius of the bubble, taken as 1 0 6 m; ρ v is the density of gaseous water. The volume fraction of gaseous water α v   is calculated by the formula:
α v = n × ( 4 3 π R B 3 )
where P B   is the bubble surface pressure; P is the far-field pressure; ρ 1 is the liquid density; and s i g n ( P B P ) is the sign function, which is used to determine the positive or negative of the pressure difference P B P . The 2 3 ( P B P ρ 1 ) term in this equation represents the effect of the pressure difference on the bubble growth rate, while s i g n ( P B P ) ensures that at pressures below the bubble pressure P B the bubble grows and collapses at pressures higher than P B . The whole equation combines these factors to calculate the mass transfer rate during cavitation. From this, the following can be obtained:
m = F 3 α v ρ v R B 2 3 ( P B P ρ 1 ) s i g n ( P B P )
where F   is an empirical constant. The above equation is only applicable to the early gas core growth stage; to overcome this problem, the researcher used α n u c ( 1 α v ) instead of α v , and the cavitation model is obtained as follows:
m + = F v a p 3 α n u c ( 1 α v ) R B 2 3 P v P ρ 1 P P v m = F c o n d 3 α v ρ v R B 2 3 P v P ρ 1 P > P v
where m + and m are the bubble growth and collapse related to the mass transfer source term; α n u c represents the gas core volume fraction, taken as 5 × 1 0 4 ; P v represents the saturated vapor pressure; F v a p represents the vaporization coefficient, taken as 50; and F c o n d represents the coefficient of condensation, taken as 0.01. The liquid phase in the Fluent calculation was water at 25 °C; its density was 997 k g / m 3 ; and the kinetic viscosity was 8.899 × 1 0 4 k g / m · s . When cavitation occurs, the vapor phase is water vapor at 25 °C; its density is 0.02308 k g / m 3 ; and the saturated vapor pressure is set to 3169 Pa. The number of time steps is set to 1000, the time-step size is set to 0.01, the residual value is set to be less than 1 0 5 , and the result is judged to be converged. The relative difference between the calculated inlet and outlet mass flow rates is less than 0.0002%, and the residual difference is stable and meets the requirements of the convergence settings.
In order to determine the thickness of the 1st boundary layer grid, the Reynolds number of the flow at the propeller needs to be calculated first. According to the regulations made by the International Ship Model Test Cell Conference (ITTC) in 1978, the Reynolds number of a ship’s propeller should be calculated according to the data at 0. 75R of the propeller blade, and the formula of the Reynolds number of the propeller is as follows.
Re = ρ b 0.75 R v 2 + ( 0.75 π n D ) 2 μ
where b 0.75 R is the tangent chord length of the propeller at 0. 75R; ρ is the fluid density; v   is the inlet velocity; n is the rotational speed; D is the diameter; and μ is the dynamic viscosity. Measured, b 0.75 R is about 0.24 m. By replacing the data, the propeller Reynolds number can be found to be Re ≈ 2.2153 × 10 6 . It is also necessary to calculate the wall shear stress τ w ; in order to facilitate the calculation, the wall friction coefficient C f is introduced, and the expression is shown below.
C f = 2 τ w / ρ u 2
Since the flow rate v is assumed to be 0, here u = 0.75πnD can be taken for calculation. The wall friction coefficient C f can be calculated in a number of ways; here, it is taken as C f = 0.026 / Re 1 / 7 and the calculation can be further obtained as C f = 2.2787 × 10 3 , τ w 127.9751 . The wall friction velocity u τ 0.3072 m/s can be found from u + = u u τ = u τ w / ρ .
The grid thickness y of the 1st boundary layer is given by:
y = y + μ u τ ρ
where the dimensionless distance y + value needs to be provided by the researcher. For a high Reynolds number, the model should be adjusted correspondingly. If the value of y + is taken to be 30, y = 0.08717 mm can be calculated, the thickness of the boundary layer mesh in layer 1 is taken to be 0.088 mm for the simulation, and the growth rate is taken to be 1.2.

2.3. Propeller Hydrodynamic Theory

The hydrodynamic properties are a series of dimensionless coefficients that define the relative performance of a propeller with respect to its mechanical and fluid properties. Among these, four important physical quantities are involved in propellers, listed as follows: the advance coefficient J , the thrust coefficient K T , the torque coefficient K Q , and the open-water efficiency η 0 .
J = V A n D
K T = T ρ n 2 D 4
K Q = Q ρ n 2 D 5
η 0 = K T K Q J 2 π
where J   is the advance coefficient, which is a dimensionless number used to describe the loop volume effect in fluid dynamics; V A is the forward speed; n is the paddle speed; D is the paddle diameter; K T is the thrust coefficient; T is the thrust generated by the propeller; ρ   is the water density; K Q is the torque coefficient; Q is the torque generated by the propeller; and η 0 is the open-water efficiency. K T and K Q describe the ability of a propeller or pump to generate thrust and torque, respectively, at a given speed and diameter.
This paper focuses on the effect of propeller parameters on thrust and efficiency, so we need to compare the thrust coefficient K T and open-water efficiency η 0 under different parameters.

2.4. Additional Definitions

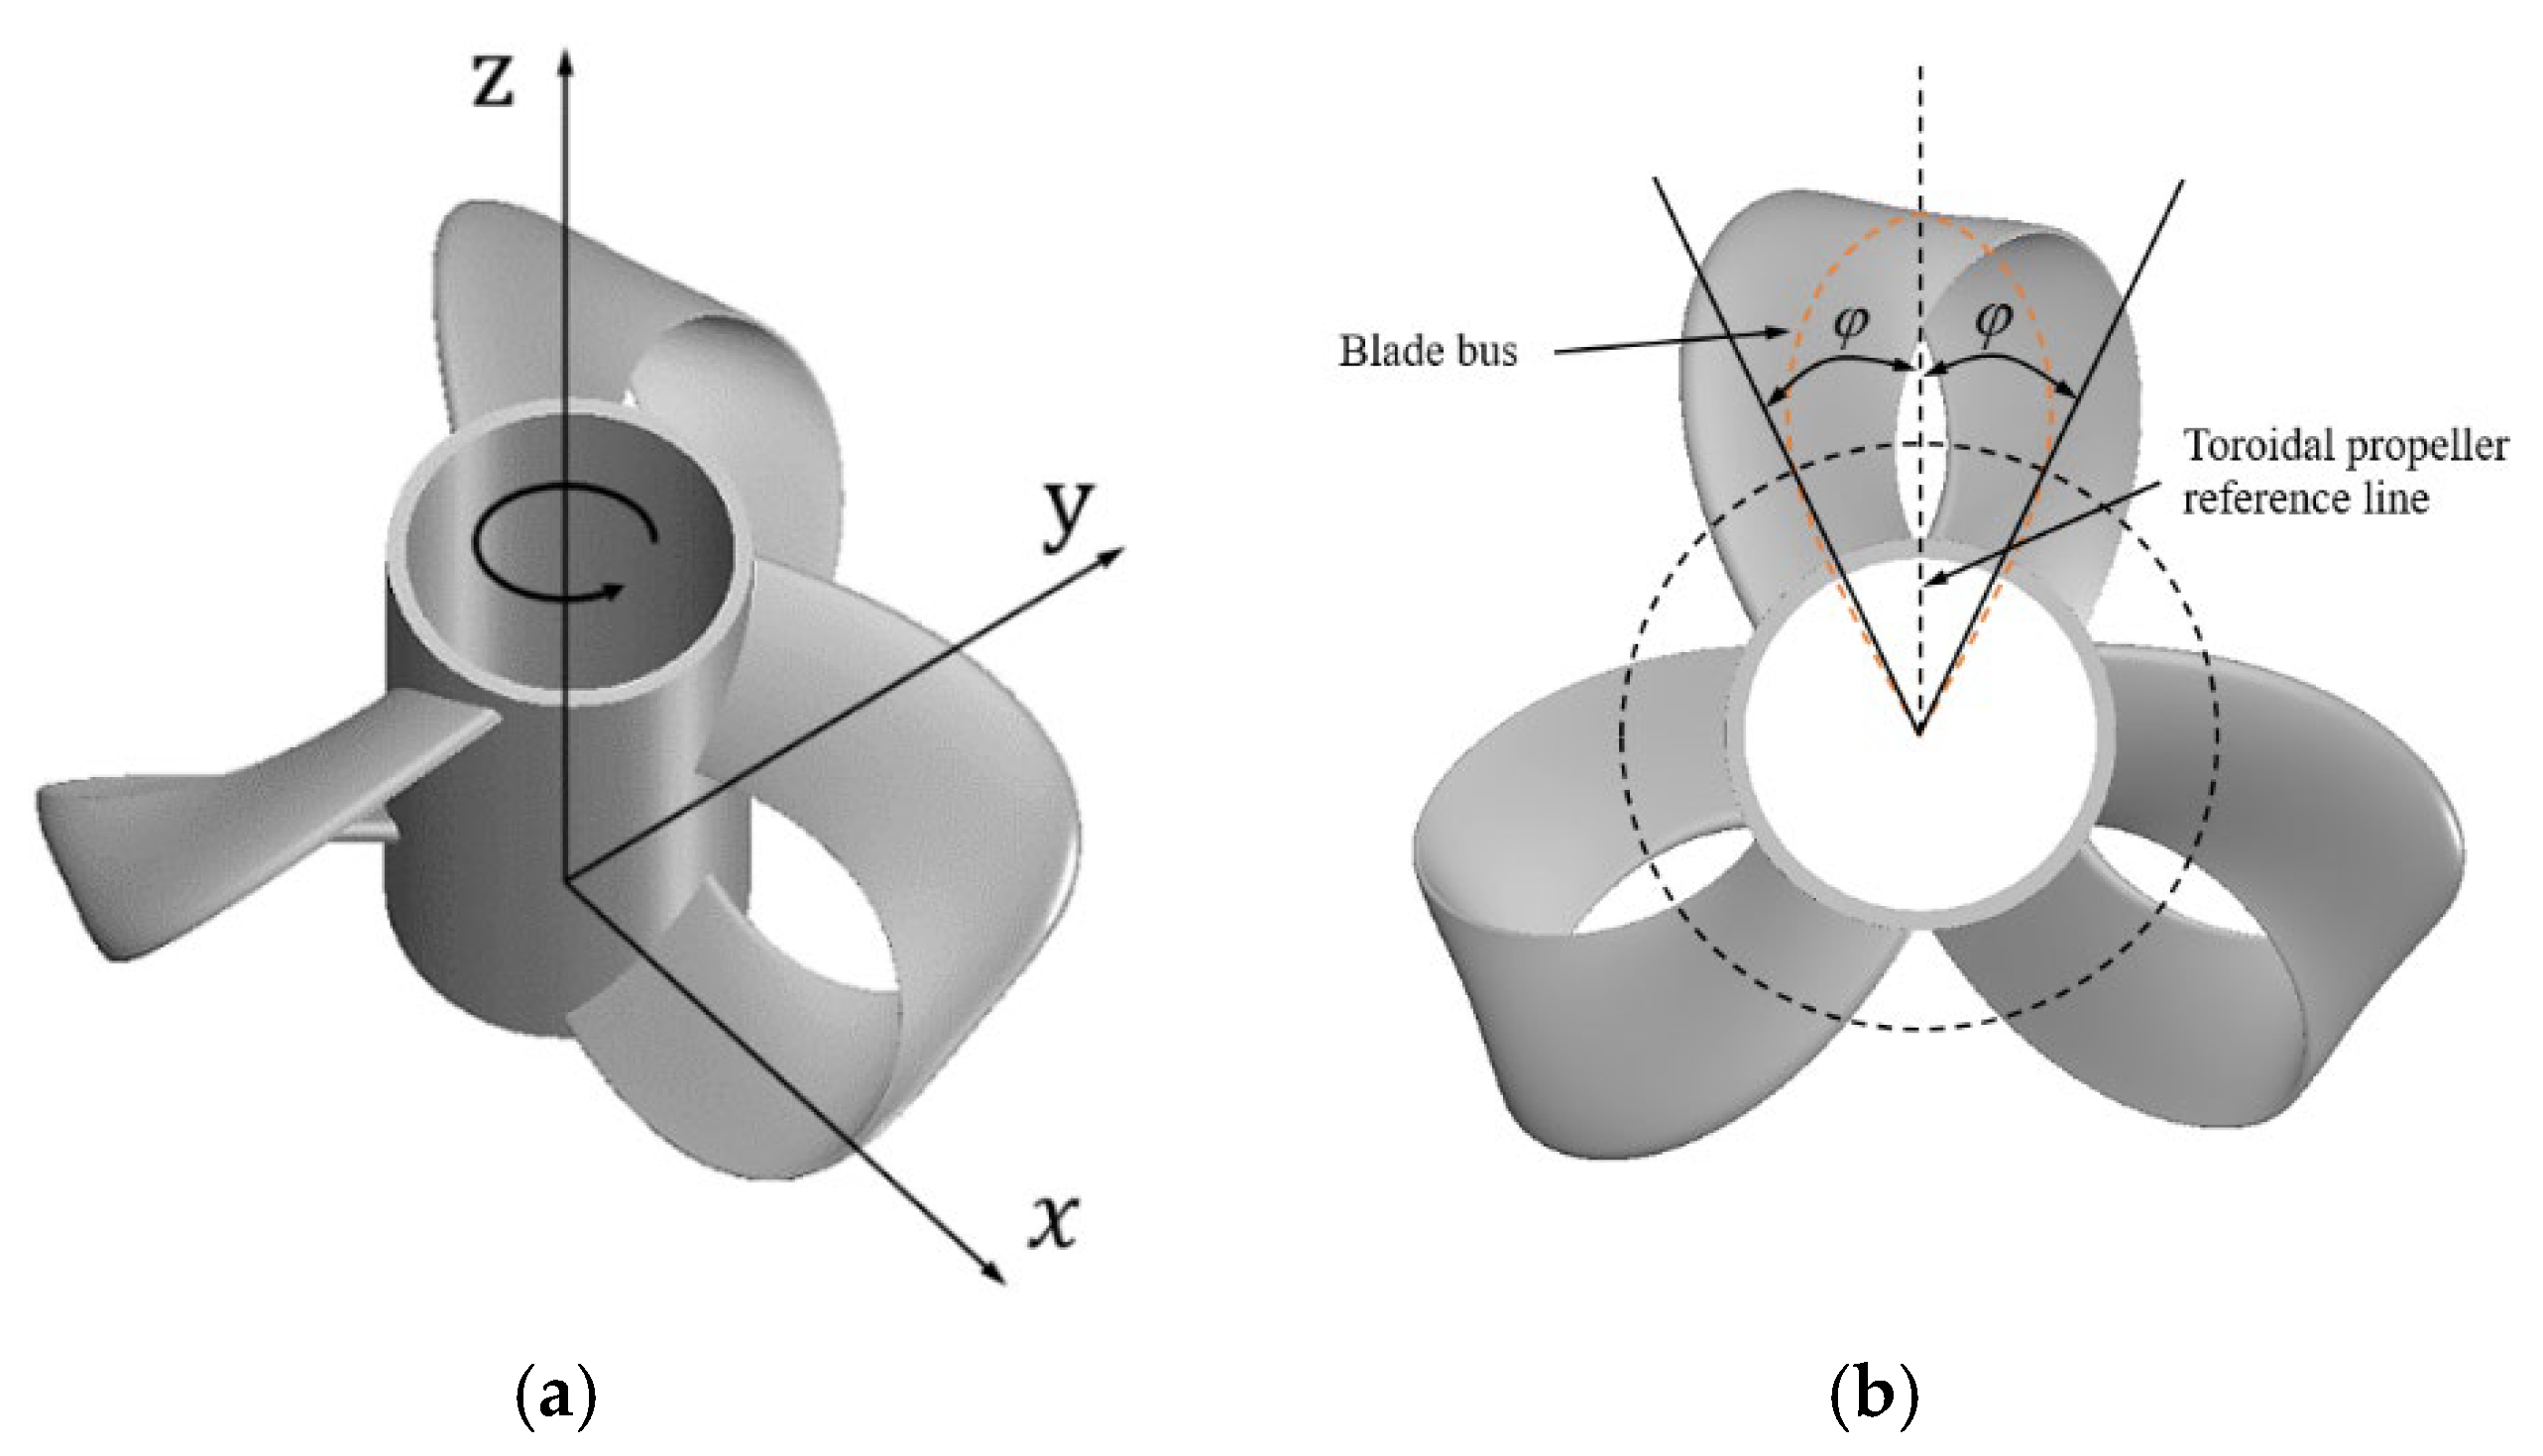
Conventional propellers have geometric characteristics, such as chord length, pitch, longitudinal inclination, side slope, and the airfoil’s thickness and arch. Accordingly, each parameter’s value varies in the radius’s direction, meaning that it is connected to the functional relationship’s radius. However, for the toroidal propeller, the blade is a closed structure; if the toroidal propeller co-axial cylindrical surface and propeller blade are truncated, it will be intercepted by the two-leaf profile, and the functional relationship is equivalent to the same radius. There are two geometric parameter variables. The closed-loop structure also leads to a new geometrical parameter, which has been defined in research papers as the outward inclination angle φ, which is the angle that causes the blade profile to rotate in the circumferential direction. This angle can be expressed by the angle between the radial line of the pitch in the projected profile and the reference line of the toroidal propeller, similar to the blade stagger angle of the front and rear blades in a tandem propeller. The front and rear sections of the toroidal propeller blades are spaced apart, and because the rear section is located in the wake of the front section, the feed rate of the rear section is greater than that of the front section. In order to realize the best match of propulsion efficiency, the outward inclination angle of the front and rear sections should be selected reasonably. The propeller coordinate axis and rotation direction are shown in Figure 3a, and the outward inclination angle is shown in Figure 3b.

2.5. Test Verification

In order to ensure the reliability of the simulation, the test validation method is used to compare the difference between the simulation and the test, and the test bench contains the drive motor. The torque sensor model used is MCK-HOOL, with an accuracy of 0.3%, and the thrust sensor is CYMH-1, with an accuracy of 0.3%. The sensor is shown in Figure 4.
The working method of the test bench is to use the partition plate to create a circulating water flow in the water tank, open the propeller to make the water flow into the tank, observe the flow meter, and fix the flow rate; at this time, start the motor and use the controller to fix the rotational speed. The propeller will be rotating in the water with a certain flow rate, and the thrust force and torque can be obtained by the propeller at this time, according to the dynamic torque transducer and pressure transducer. The layout of the test bench is shown in Figure 5.
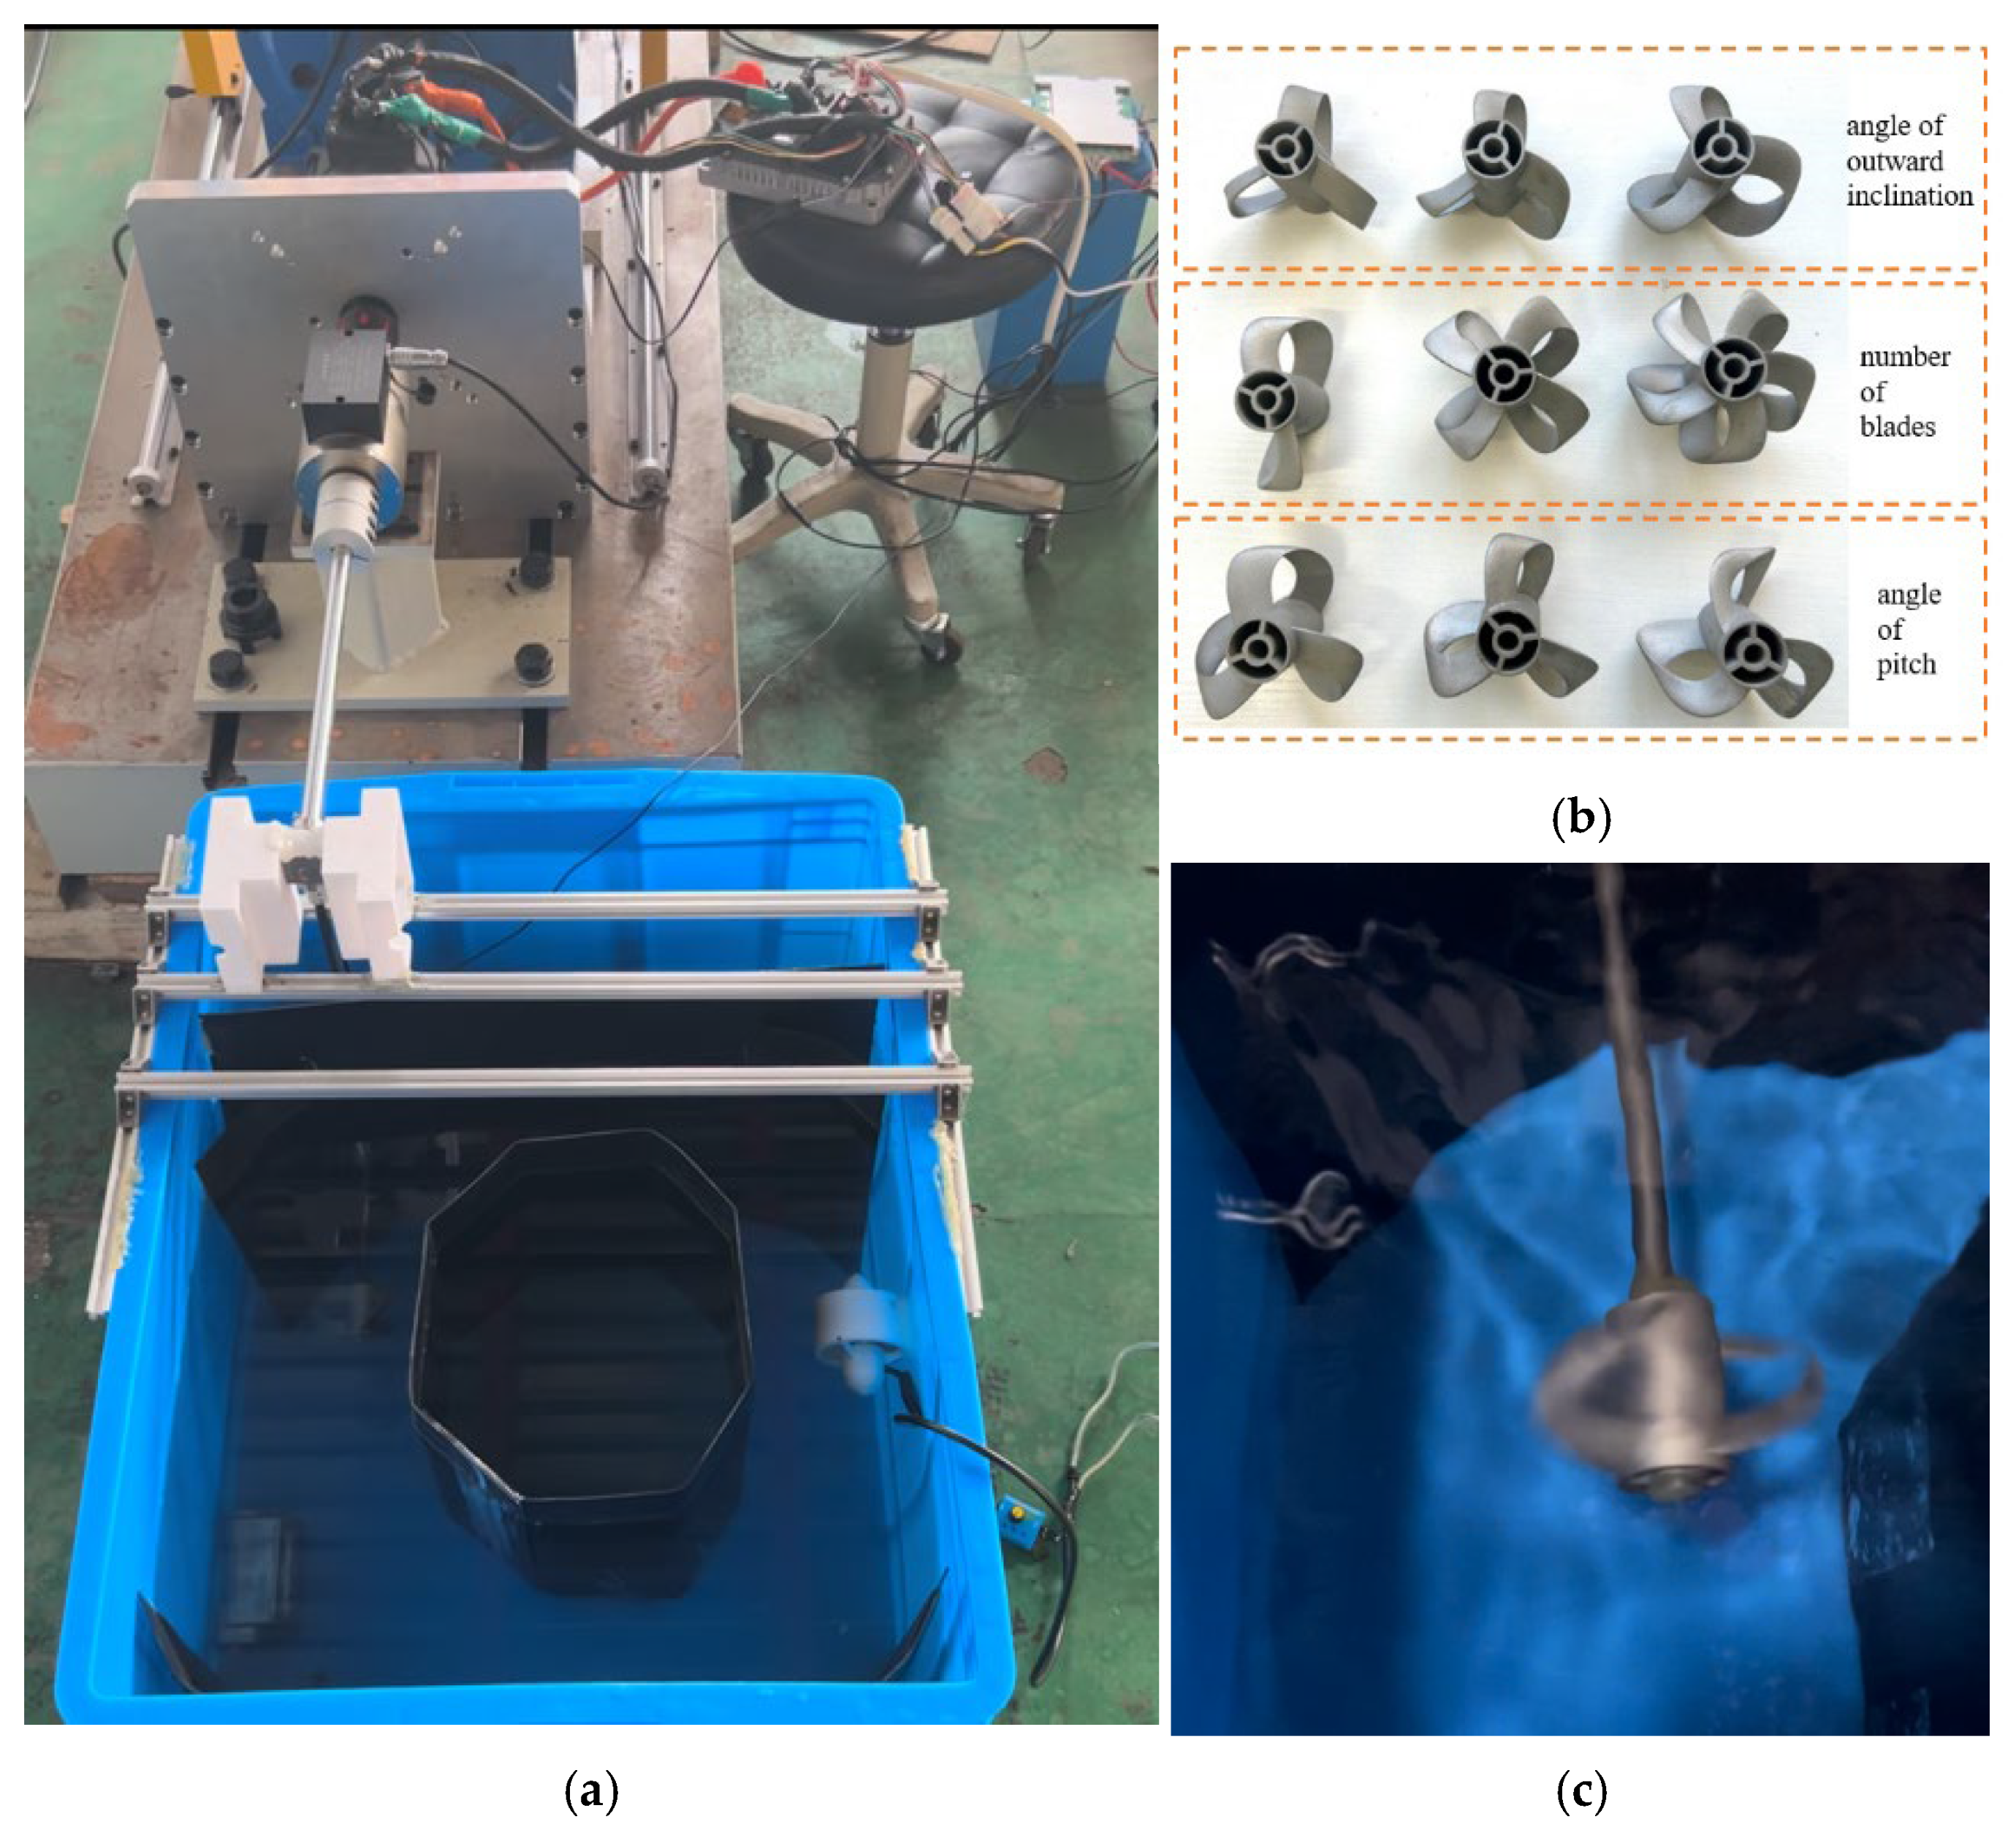
The test is a validation test; three propellers are selected under each research factor, built with metal materials, and then mounted on the shaft. The test site is shown in Figure 6. The thrust, torque, and other data are recorded, the thrust coefficient and efficiency are calculated, and compared with the simulation. The following table, Table 2, shows the comparison data between the test and simulation of the propeller with two blades; the error between the test and simulation is within 10%, which belongs to a reasonable range. The test of nine kinds of propellers is finally completed, and the error between each propeller and the simulation results after averaging by several groups is within 10%, which meets the requirements, proving that it is feasible to use CFD for propeller research.

3. Results

3.1. Effect of Outward Inclination Angle

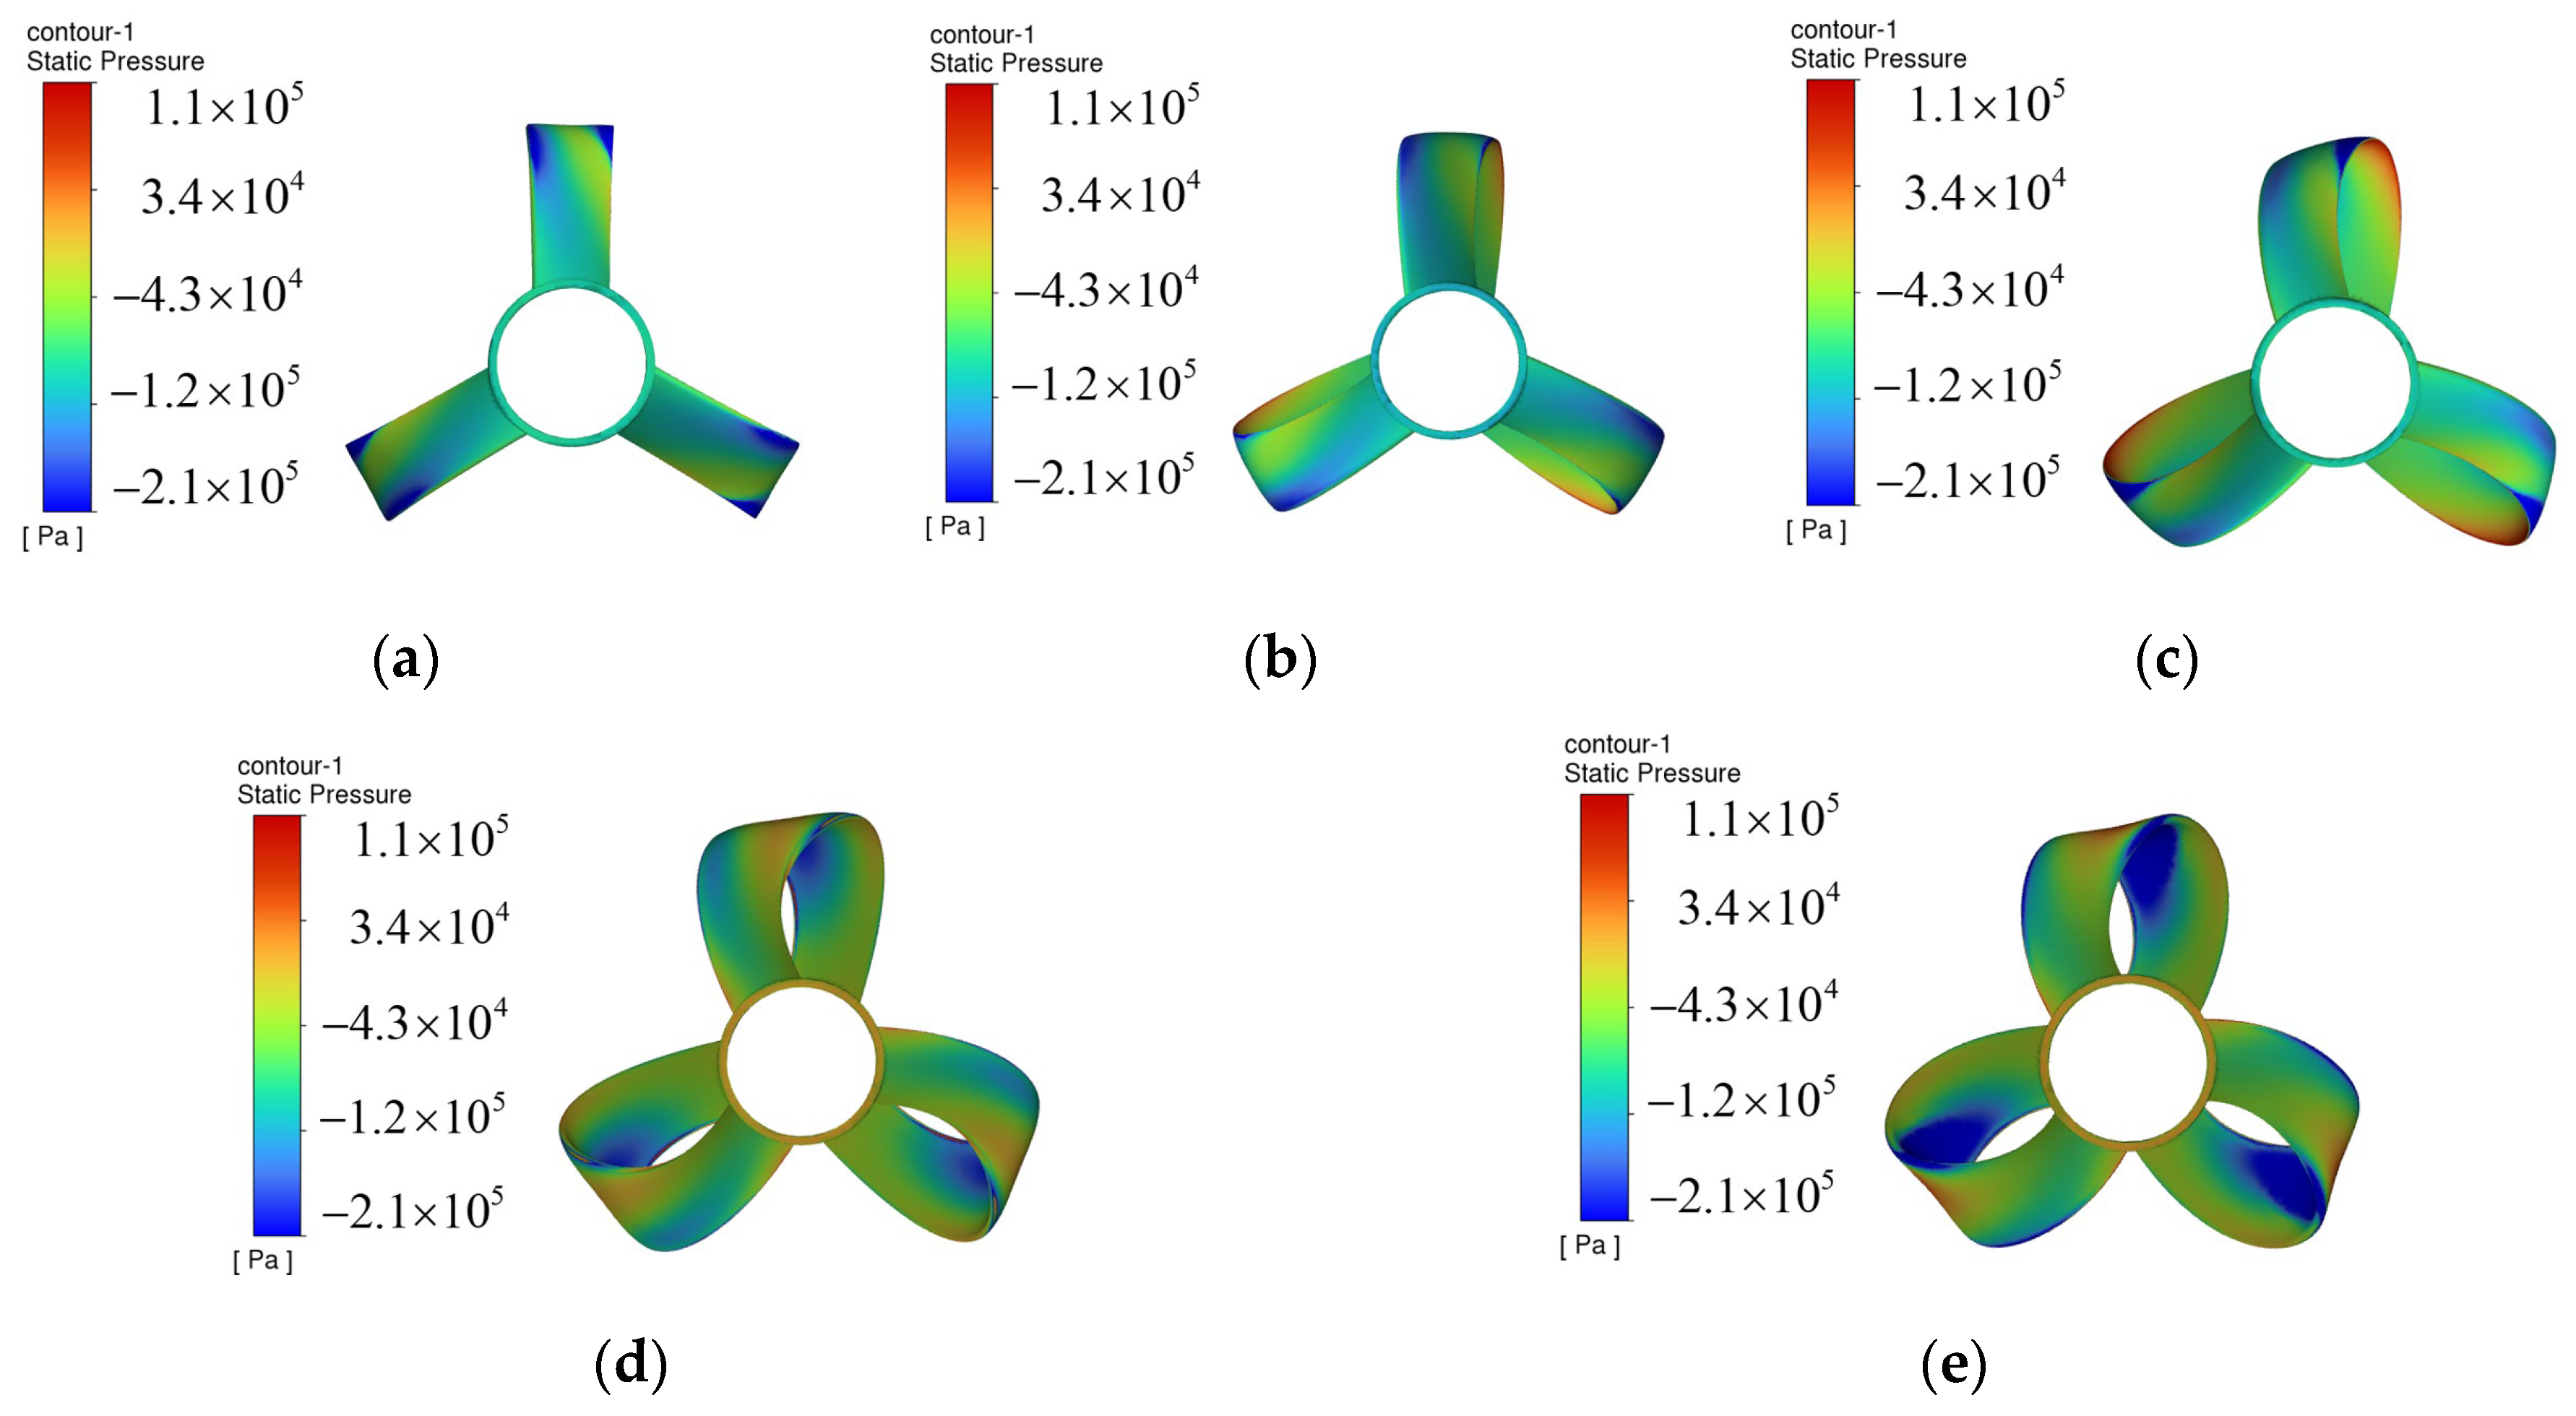
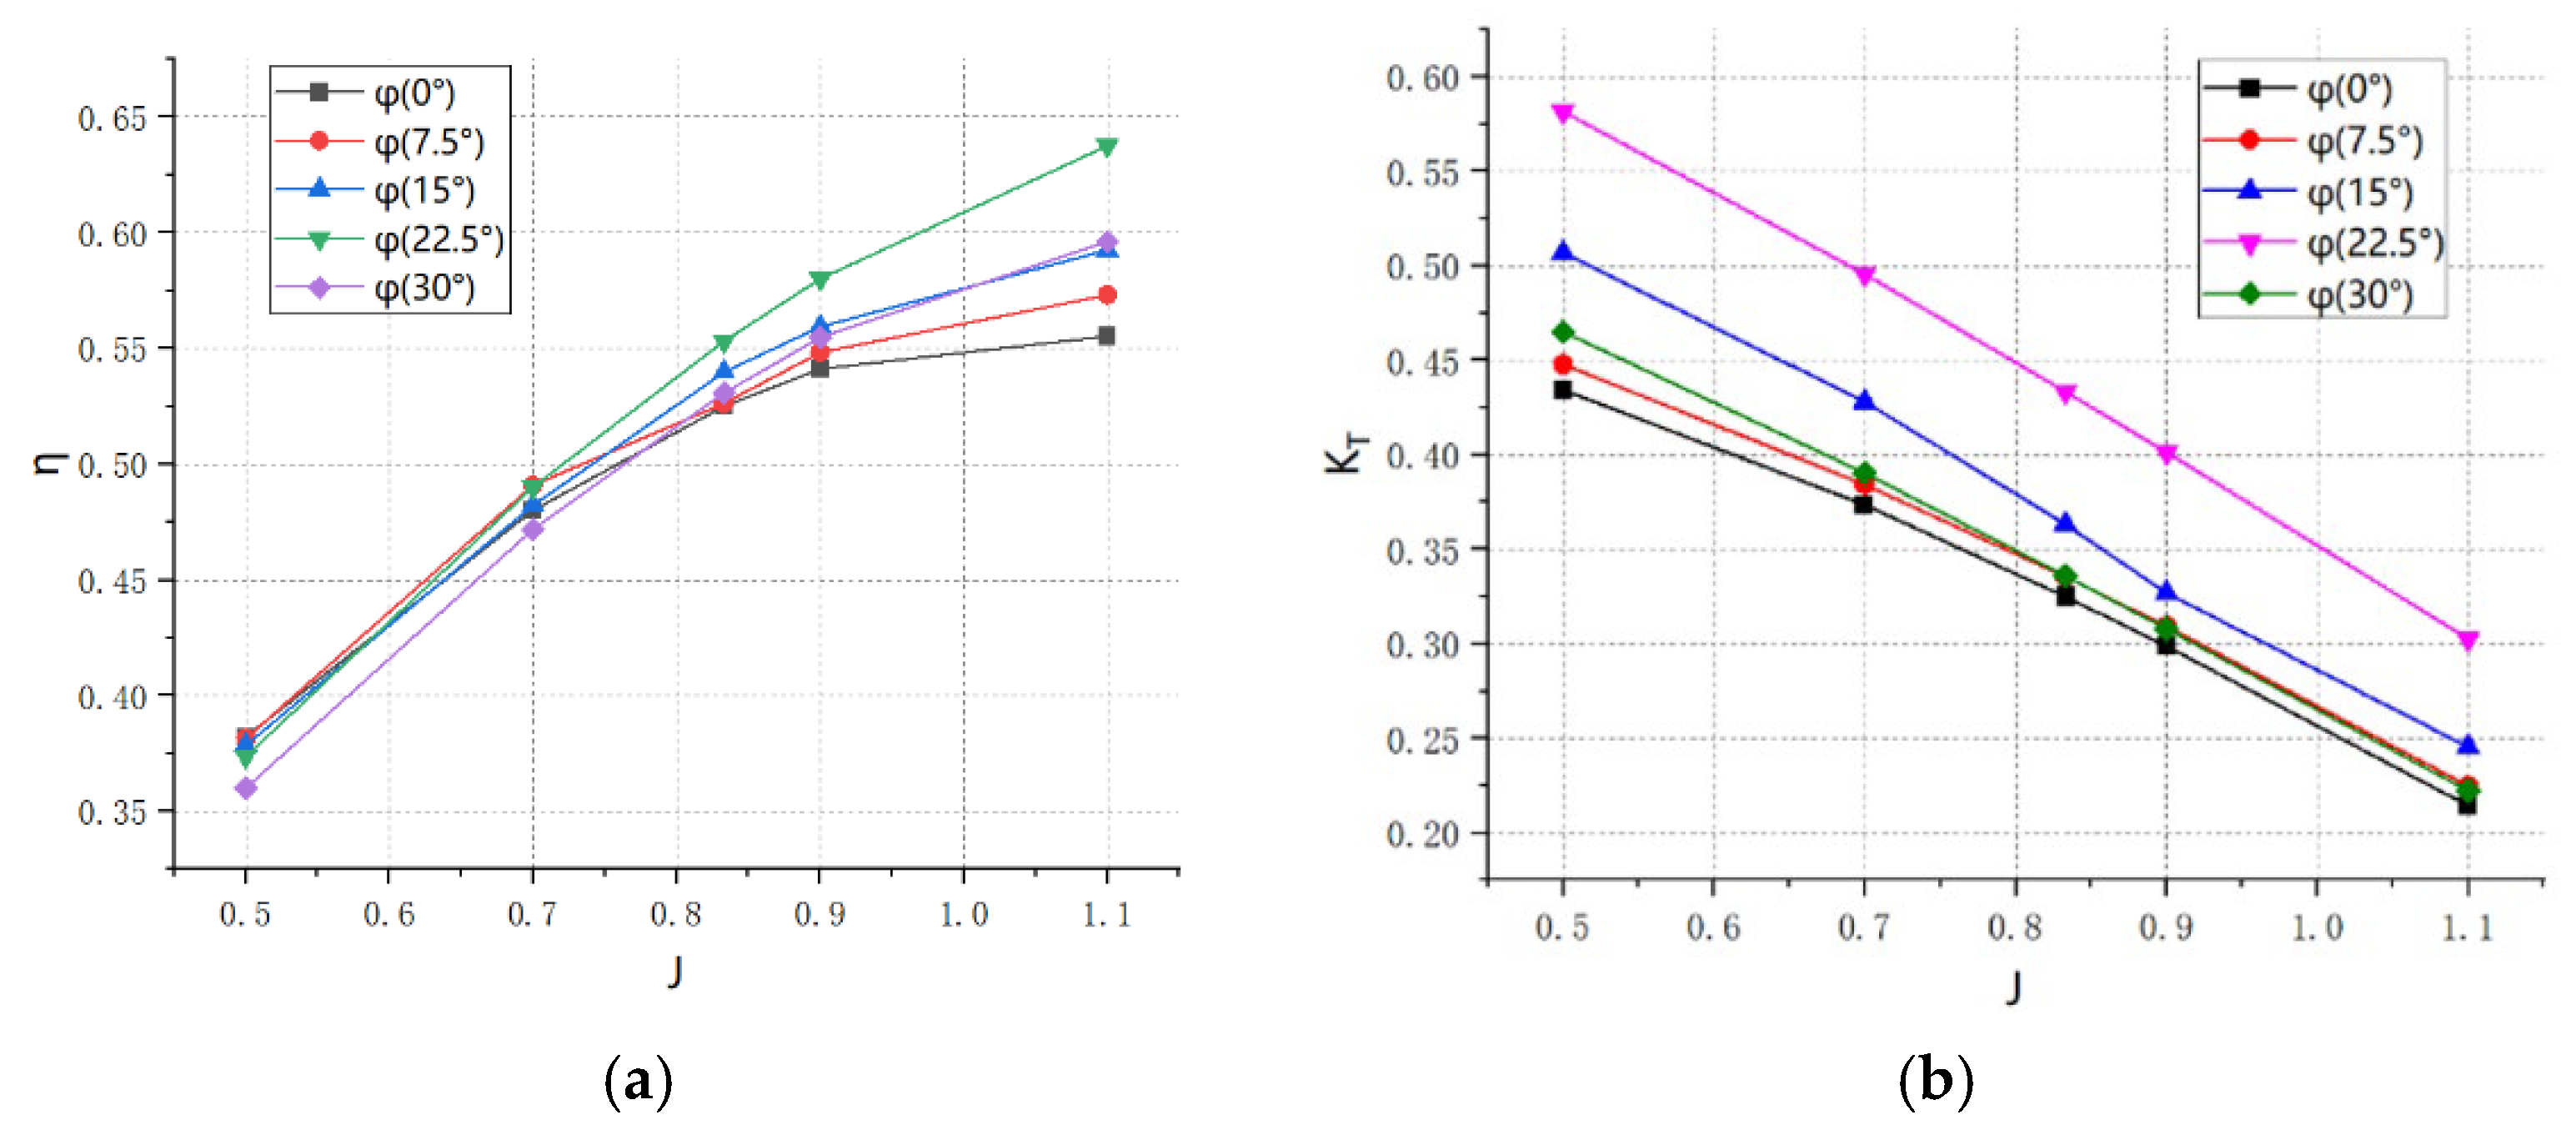
This simulation will take five different angles of 0°, 7.5°, 15°, 22.5°, and 30° as the research object; the advance coefficient of the propellers are taken as 0.5, 0.7, 0.833, 0.9, and 1.1, respectively, and the other parameters are kept unchanged, so as to maximally avoid the influence of the other parameters on the efficiency of the toroidal propeller and the thrust. The pressure cloud is shown in Figure 7, where the ranges are standardized in order to visualize the difference in pressure on different propeller shapes. The parameters for each cloud simulation have been standardized, all rotational speeds are 1200 RPM, and all feed speeds are 1 m/s. The results show that the pressure increases and then decreases as the angle increases. The obtained graphs of the relationship between the advance coefficient and efficiency are shown in Figure 8a. The relationship between the advance coefficient and thrust coefficient are shown in Figure 8a.
When the actual running time is long enough, the propeller thrust, torque, and other data fluctuate in a small range, and the data of a certain moment in this stage can be taken as the simulation results. The data are organized into a graph, from which it can be seen that when the advance coefficient is less than 0.7, the efficiency of the 0° and 7.5° outward inclination angles is higher, while, after the advance coefficient is greater than 0.7, the efficiency of the 22.5° outward inclination angle is higher, the thrust coefficient of the propeller is also relatively high at 22.5°, and the overall assessment is that, with the increase in the outward inclination angle, the maximum efficiency of the propeller and the coefficient of the propeller thrust first increase and then decrease. This fits the data.
η = 0.548459 + 0.005483 φ 0.000118 φ 2
The optimum outward inclination angle of 23.25° can be derived from the fitting equation.
Observe the cavitation of the propeller at each outward inclination angle when the advance coefficient is 0.9; as shown in Figure 9, the cavitation position of the conventional propeller is located at the tip of the blade and the edge of the guide edge, each blade of the toroidal propeller bends back to the rear root from the root of the front section, and it is made up of closed blades ringed together. This closed structure can reduce the vortex to lower the degree of cavitation significantly, and it can be seen in the figure that when the outward inclination angle is 0, the blade cavitation exists on both sides of the transition section. When the outward inclination angle is increased to 7.5°, the degree of cavitation is reduced; when the outward inclination angle is increased to 15°, the inner side of the paddle transition section of the cavitation phenomenon nearly disappears; when the outward inclination angle is increased to 22.5° and 30° again, the degree of cavitation of the outer side of the transition section of the blade is reduced again; and, regarding the inner side of the cavitation once again, the appropriate outward inclination angle helps to reduce the cavitation phenomenon greatly, so that the advantages of the toroidal propeller can be realized.

3.2. Effect of Pitch Angle

The pitch angle of a propeller is the angle between the helix formed by the propeller blade around the rotation axis and the horizontal plane, and it affects the thrust and efficiency of the propeller in conventional propeller species. Although there is still no authoritative geometrical expression of pitch angle in toroidal propellers in terms of theoretical parameters, certain rules can be summarized through CFD simulation. The value of the geometric parameters of the toroidal propeller is similar to that of the conventional propeller, which also changes along the radius direction. Under the premise that the parameters of the transition section of the propeller blade remain unchanged, the pitch angle of the pitch angle has the greatest influence on the overall shape of the propeller blade, and it is also the parameter that should be considered first; the dynamics of the toroidal propeller with five pitch angles, namely, 25°, 35°, 45°, 55°, and 65°, are investigated, respectively, in this paper.
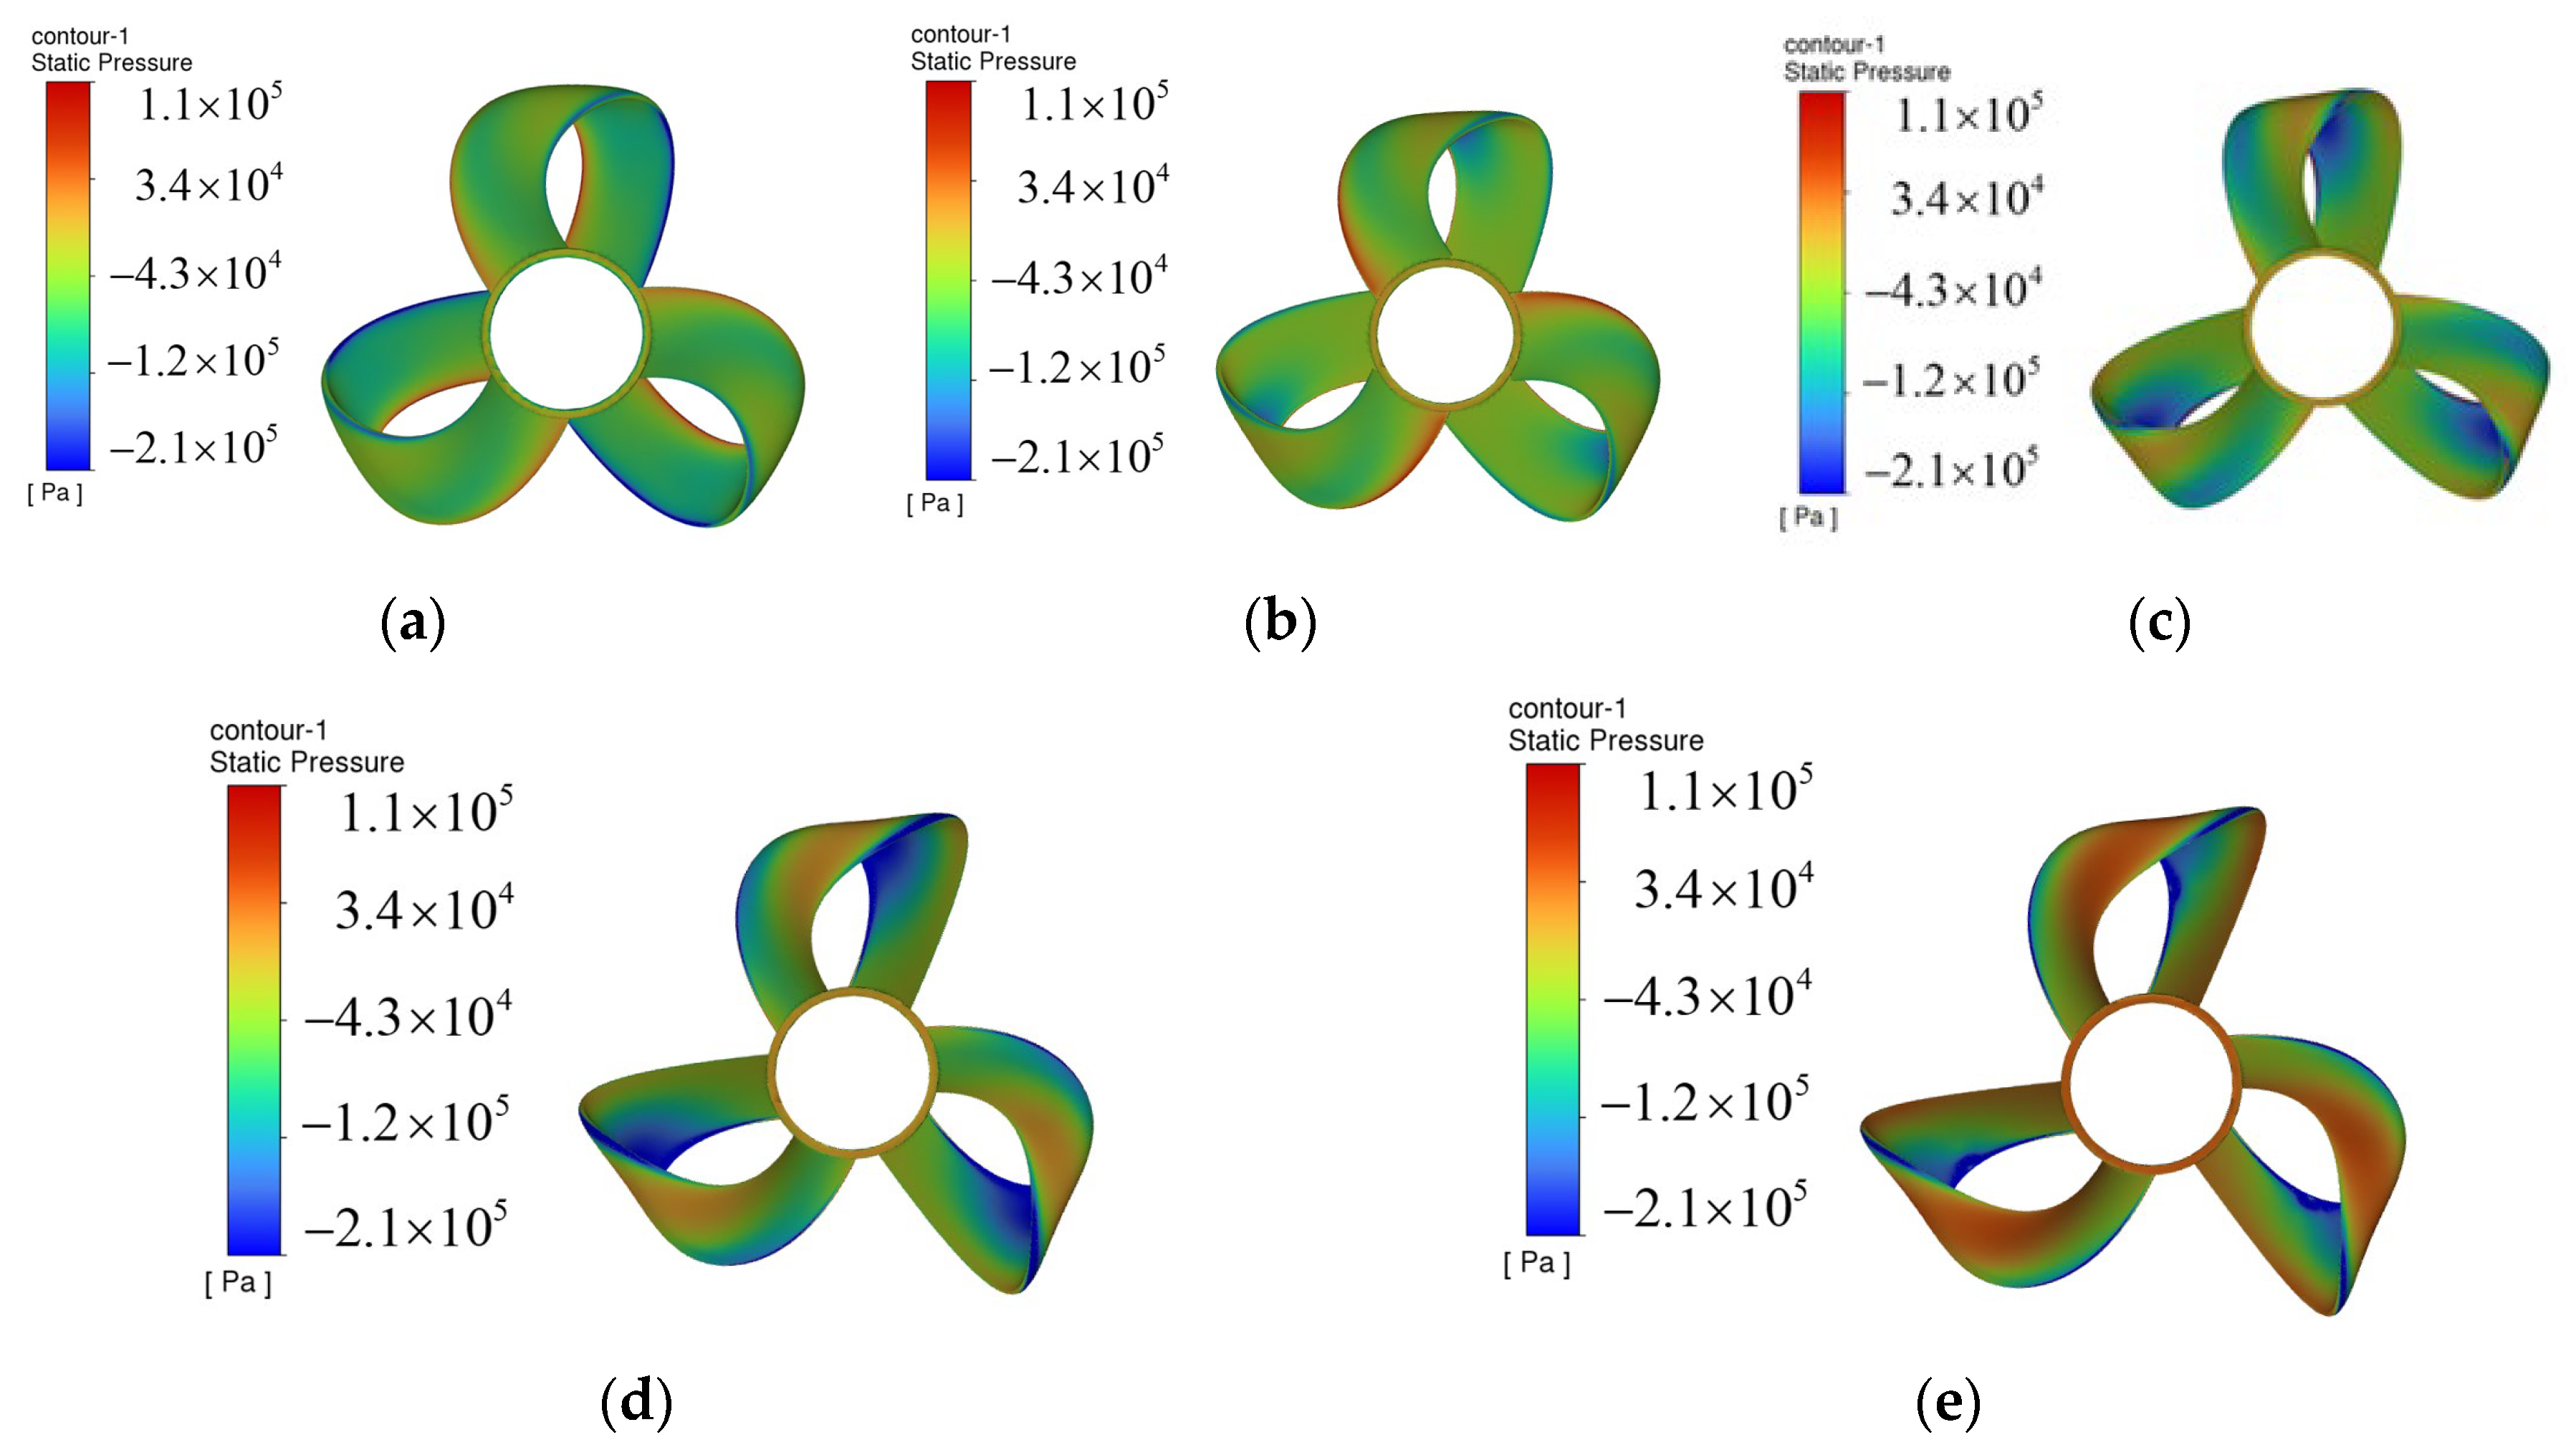
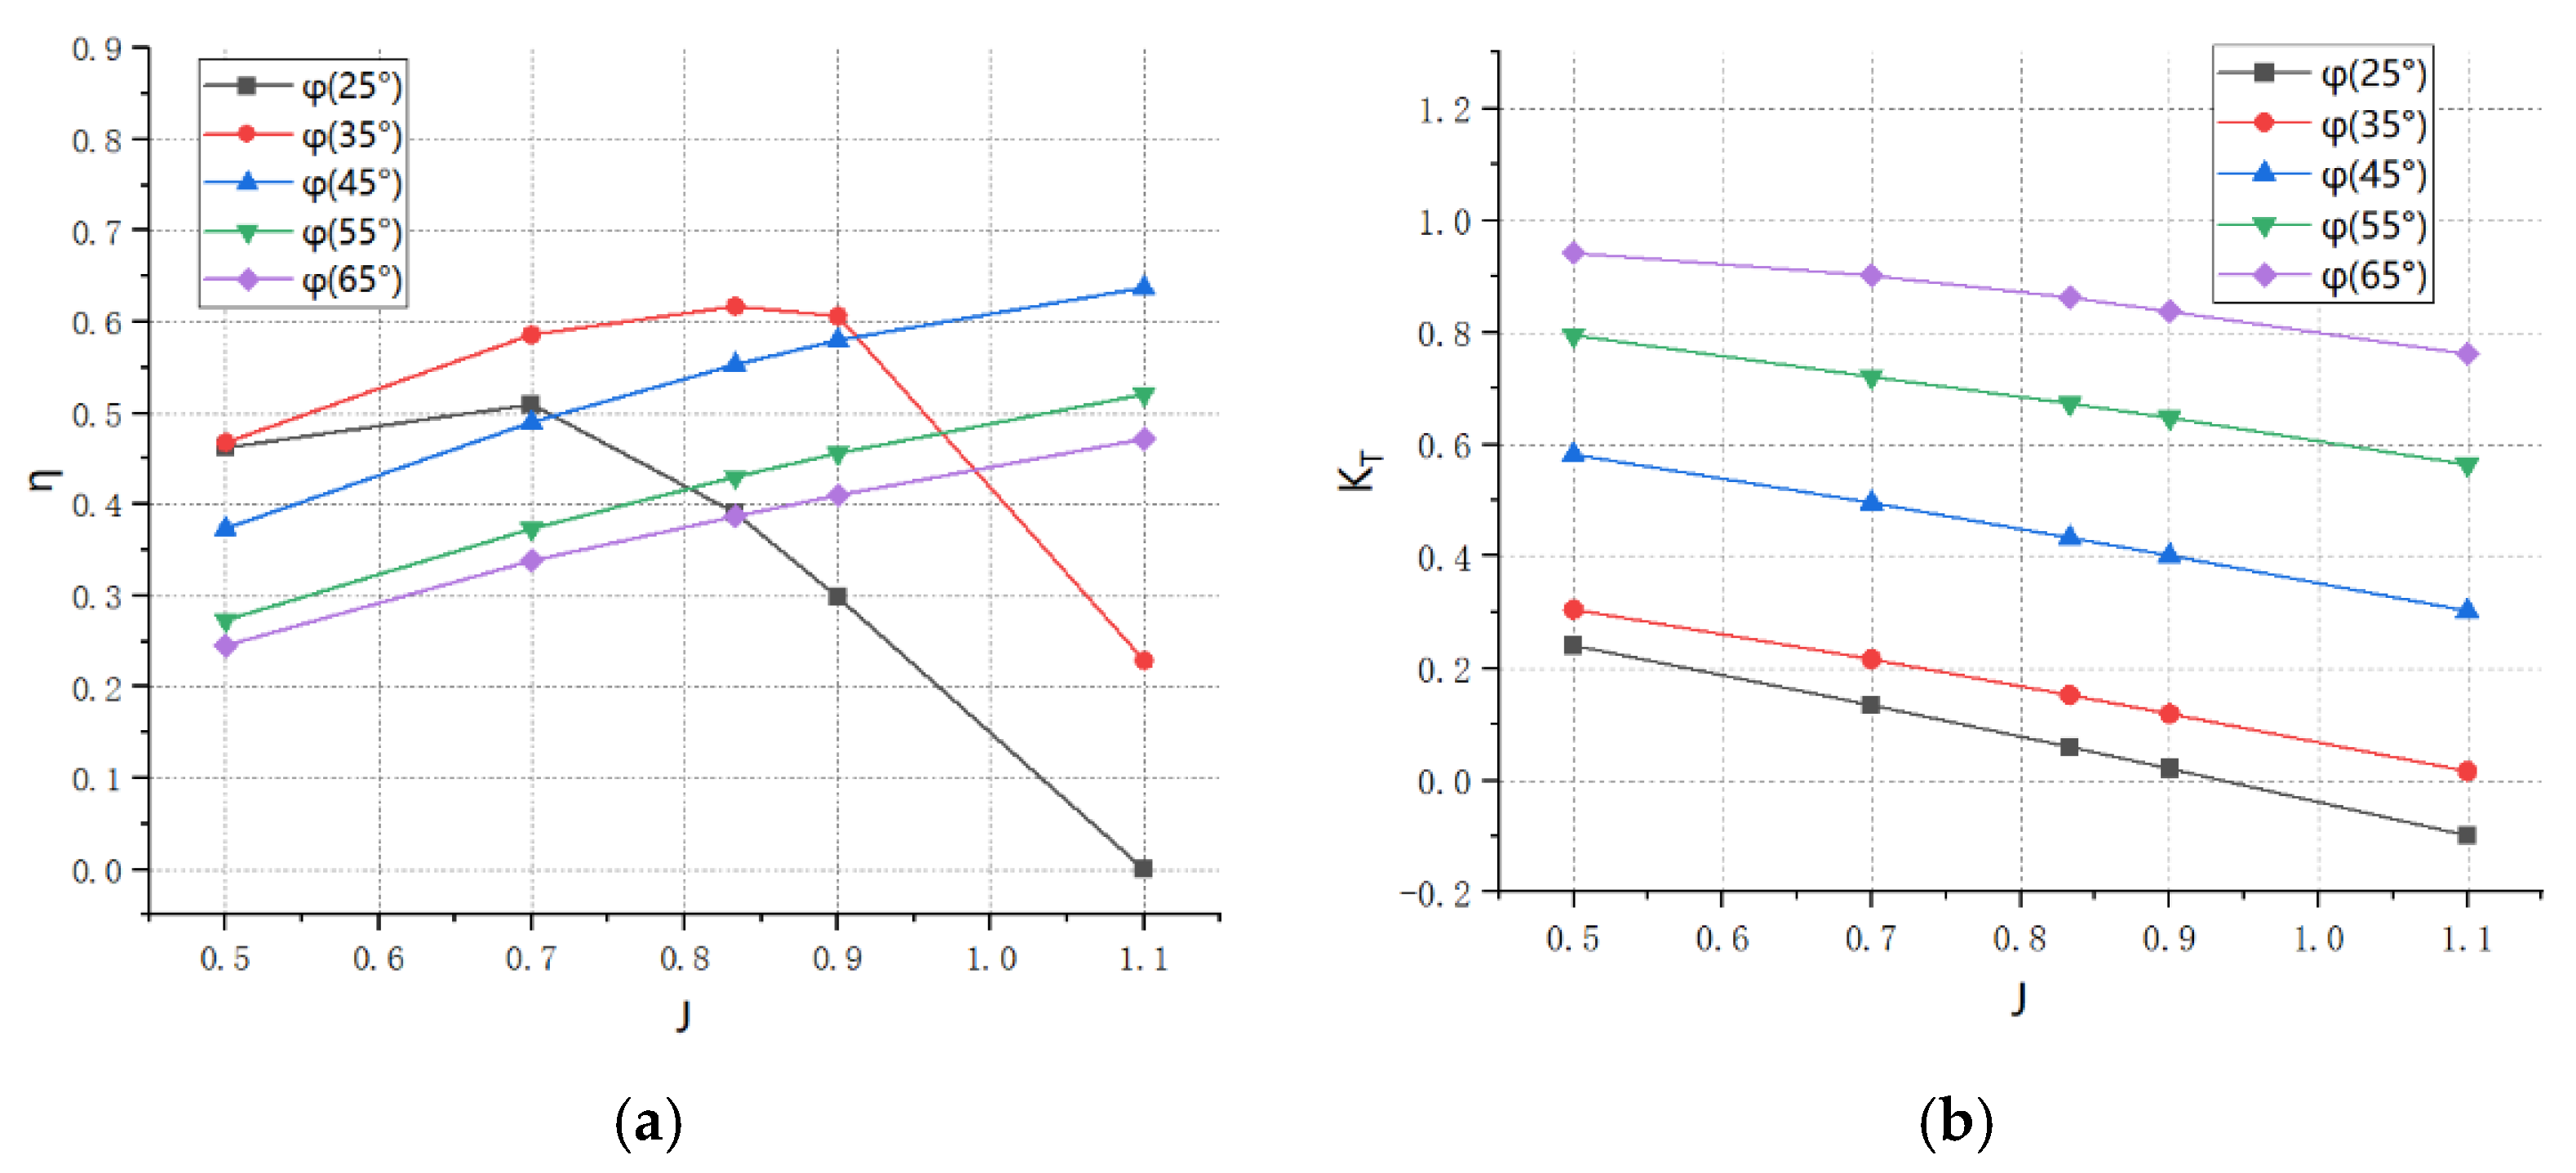
The simulated pressure cloud image is shown in Figure 10. From the pressure cloud graph it looks like the pressure is increasing as the angle increases. As shown in Figure 11a,b, if the advance coefficient is less than 0.7, the 35° pitch angle has the highest efficiency, and as the feed coefficient increases, the efficiency of the propeller below a 45° pitch angle will begin to decrease. The reason for this can be ascertained from the thrust coefficient; as the pitch angle decreases, the coefficient of thrust decreases, and the propeller advances in the water with an advance coefficient equivalent to the countercurrent flow. Increasing the advance coefficient will make the reverse flow faster and faster, eventually exceeding the thrust generated by the propeller rotation, at which point the efficiency plummets. For propellers with a pitch angle higher than 45°, as the pitch angle continues to increase, the thrust coefficient will increase, but the efficiency will also continue to decrease.

3.3. Effect of the Number of Paddles

The number of paddles will directly affect the thrust of the propeller, but many papers have different conclusions regarding the effect of efficiency, indicating that the number of paddles will affect the vibration of the propeller, cavitation, etc., and the single and double numbers will also affect the overall resonance.
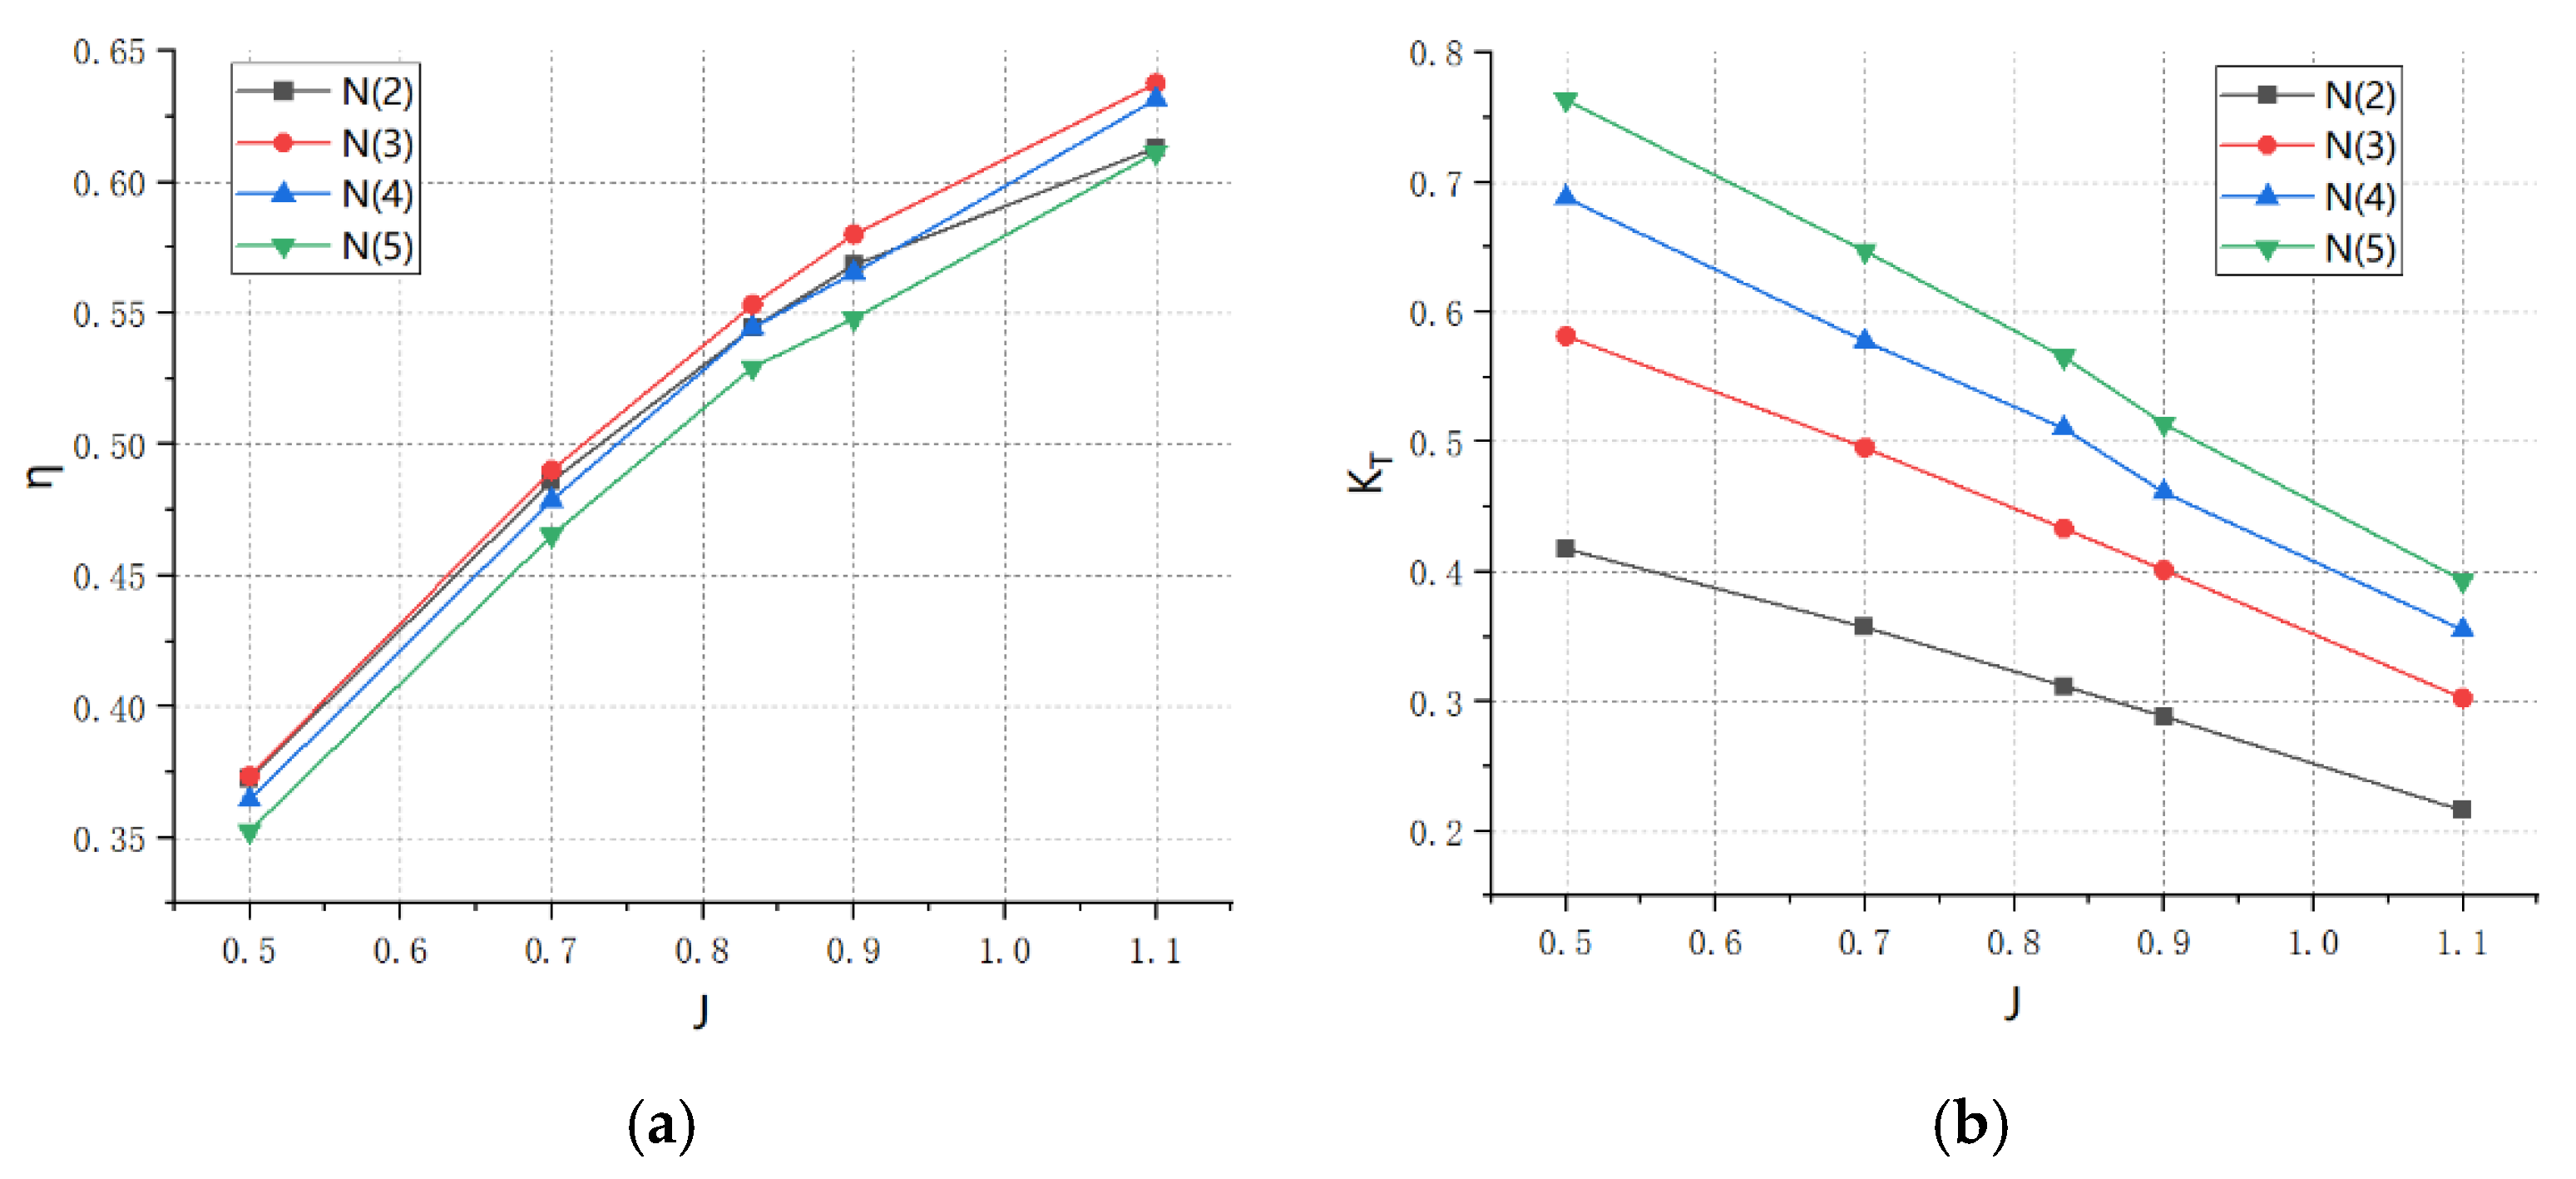
The simulated pressure cloud image is shown in Figure 12. According to the pressure cloud, each paddle has a similar force, but the total pressure increases with more paddles. The calculation results are shown in Figure 13a,b; the comprehensive view indicates that the paddle blade has a small impact on the efficiency of the propeller, whereby the efficiency is the highest with two propeller blades, the efficiency of the propeller is similar with two blades and four blades, and increasing the number of paddles can improve the thrust coefficient.

3.4. Multi-Factor Research

In order to further study the comprehensive effect of the outward inclination angle, pitch angle, and number of blades on the hydrodynamic performance of the toroidal propeller, this study designed a multi-factor simulation program using SPSS v. 22 and Design-Expert v. 12 software. The multifactor simulation program and the results are shown in Table 3.
According to the three-dimensional response surface plot in Figure 14, regarding the efficiency of the propeller and the interaction between outward inclination angle and pitch angle, the interaction pitch angle and the number of blades is more obvious, and the interaction between outward inclination angle and the number of blades is relatively weak; the software is utilized to fit the function of the outward inclination angle φ , the pitch angle θ , the number of blades N , and the efficiency η :
η = 1.84483 + 0.013551 φ + 0.111144 θ 0.175771 N 0.000751 φ θ + 0.00719 φ N 0.000438 θ N 0.000095 φ 2 0.000971 θ 2 + 0.002812 N 2
The software was used to fit the camber angle φ , pitch angle θ , and the number of lobes N as a function of the thrust coefficient K T :
K T = 0.402577 + 0.005682 φ + 0.010771 θ + 0.018885 N
From the fitting results, increasing the camber angle φ , pitch angle θ , and number of blades N all lead to an increase in thrust coefficient K T , which is somewhat inconsistent with the one-factor results. In the one-factor study of the effect of camber angle on the thrust coefficient of the propeller, the conclusion is that the thrust coefficient first increases with the increase in camber angle, and then decreases with the increase in camber angle, which is presumed to be due to the reason that the sample size of the simulation is still relatively small.
According to the analysis results of Design-Expert, if focusing on high efficiency, the combination of a camber angle of 19°, a pitch angle of 48.5° and three blades can be selected; if focusing on high propulsion coefficient, the maximum value can be selected as much as possible after coordinating the three parameters, but it should be noted that the increase in the number of blades and the camber angle will be conflicting.

4. Discussion

In this paper, the effects brought about by the geometric parameters of a new type of toroidal propeller are investigated; this kind of propeller has been discussed continuously since it was proposed, and many reports have introduced the kind of propeller that reduces the fuel consumption rate, but there is a lack of research on the effects brought about by the geometry of the propeller. We take the theory of the lifting surface of the traditional propeller as the basis, refer to the theory of the tandem propeller to put forward a few geometric parameters affecting the hydrodynamic performance of the propeller, and we conduct single- and multi-factor simulation studies based on these influences. These influencing factors are investigated in single-factor and multi-factor simulations, and the results prove that outward inclination angle, pitch angle, and blade number have different degrees of influence. The simulation process found that a camber angle from 0 degrees to 30 degrees will first increase the efficiency and then decrease it, meaning that about 20 degrees of camber is more appropriate; the pitch angle of the impact is also obvious in terms of effect, as more than 45 degrees of pitch angle can increase thrust, but the change in the blade will also lead to a reduction in the efficiency, as does the number of paddles. The impact of the thrust is also obvious; according to the demand of the thrust, three to five paddles can be selected. In addition, this study shows that there is a complex interrelationship between outward inclination angle, pitch angle, and blade number. The combinations of different parameters may have offsetting or enhancing effects on each other, so the combined performance of thrust and efficiency can be further enhanced by optimizing the combinations of each parameter. The effect results and empirical formulas summarized in the study are useful for the subsequent design of toroidal propellers.
Sharrow’s test shows that the toroidal propeller can significantly reduce the tip vortex cavitation phenomenon; in order to simulate the effect, this paper adopts the ZGB model to calculate the cavitation of the propeller, and observes the degree of cavitation under changing the camber angle, which proves that the different geometrical parameters also affect the final number of cavitation. According to the simulation, a camber angle of 15 to 22.5 degrees helps to reduce the tip vortex cavitation, but unfortunately the in-depth investigation is not complete, and fails to eliminate the tip vortex and cavitation phenomenon of the blade tip. In addition, in the process of research, we found that the blade at the transition also has a great influence on the hydrodynamic performance of the propeller, but the complex shape is difficult to quantify, and there is no further research for the time being, which may mean that the final optimized propeller is still not the optimal combination. There is still a lot of upward space, and we will also carry out an analysis of it in the future.

5. Conclusions

This paper, leveraging the Fluent fluid–solid coupling method, explores the effects of various parameters on the thrust and efficiency of toroidal propellers by adjusting their geometrical parameters. The three most influential parameters—outward inclination angle, pitch angle, and the number of propeller blades—were subject to single-factor simulation studies. Subsequently, a multi-factor orthogonal test was designed based on these results, leading to the following conclusions:
  • The one-factor study showed that both the efficiency and thrust coefficient of the toroidal propeller increased and then decreased with the increase in the outward inclination angle, and the efficiency and thrust coefficient of the toroidal propeller were optimal at the outward inclination angle of 23.25°.
  • Decreasing the pitch angle improves efficiency at advance coefficients less than 0.7, but the 45° pitch angle is the most efficient in conditions where the advance coefficient is greater. In contrast, increasing the pitch angle increases the thrust coefficient.
  • The number of blades has a small effect on the efficiency of the propeller, and increasing the number of blades increases the thrust coefficient of the propeller.
  • Cavitation in toroidal propellers occurs in the blade transition section, and adjusting the outward inclination angle will change the location of the cavitation concentration.
  • For the efficiency of the propeller, the interaction between outward inclination angle and pitch angle is more obvious, as is the interaction between the pitch angle and the number of blades, and the interaction between outward inclination angle and the number of blades is relatively weak.
The toroidal propeller’s distinct feature over conventional designs is the additional blade section, which is significantly influenced by changes in the outward inclination angle. Other parameters, like the transition section angle and airfoil, also play a role. However, due to time constraints, these parameters were not investigated in this study. Future research will explore these impacts and conduct experimental validation.

Author Contributions

Conceptualization, J.W.; methodology, Q.W., J.H. and H.D.; software, J.W.; validation, Q.W., J.H. and H.D.; formal analysis, J.W.; investigation, J.W.; resources, Q.W.; data curation, H.D.; writing—original draft preparation, J.W.; writing—review and editing, Q.W.; visualization, J.W.; supervision, H.D.; project administration, J.W.; funding acquisition, Q.W. All authors have read and agreed to the published version of the manuscript.

Funding

This research was funded by the National Natural Science Foundation of China, grant number 51475255.

Data Availability Statement

The data that support the findings of this study are available from the corresponding author, [Qingchun Wang], upon reasonable request.

Conflicts of Interest

Author Hugh Deasy was employed by the company Weihai Hydrogen Tritium Power Equipment Co., Ltd. The remaining authors declare that the research was conducted in the absence of any commercial or financial relationships that could be construed as a potential conflict of interest.

References

  1. Zhang, Q.; Jaiman, R.K. Numerical analysis on the wake dynamics of a ducted propeller. Ocean Eng. 2019, 171, 202–224. [Google Scholar] [CrossRef]
  2. Sanchez Santiago, P. Rim-Jet-A Mechanical Design for a Shaft-Less Propulsor. Master’s Thesis, KTH, Stockholm, Sweden, 2019. [Google Scholar]
  3. Sharrow, G.C. Propeller. U.S. Patent 9,926,058, 27 March 2018. [Google Scholar]
  4. Sharrow-Propeller. Available online: https://boattest.com/Sharrow-Propeller (accessed on 10 March 2024).
  5. Sebastian, T.; Strem, C. Toroidal Propeller. U.S. Patent 10836466B2, 17 November 2020. [Google Scholar]
  6. Zhang, Q.; Jaiman, R.K.; Ma, P.; Liu, J. Investigation on the performance of a ducted propeller in oblique flow. J. Offshore Mech. Arct. Eng. 2020, 142, 011801. [Google Scholar] [CrossRef]
  7. Rhee, S.H.; Kawamura, T.; Li, H. Propeller cavitation study using an unstructured grid based navier-stoker solver. J. Fluids Eng. 2005, 127, 986–994. [Google Scholar] [CrossRef]
  8. Sikirica, A.; Čarija, Z.; Kranjčević, L.; Lučin, I. Grid type and turbulence model influence on propeller characteristics prediction. J. Mar. Sci. Eng. 2019, 7, 374. [Google Scholar] [CrossRef]
  9. Peng, H.H.; Qiu, W.; Ni, S. Effect of turbulence models on RANS computation of propeller vortex flow. Ocean Eng. 2013, 72, 304–317. [Google Scholar] [CrossRef]
  10. Helal, M.M.; Ahmed, T.M.; Banawan, A.A.; Kotb, M.A. Numerical prediction of sheet cavitation on marine propellers using CFD simulation with transition-sensitive turbulence model. Alex. Eng. J. 2018, 57, 3805–3815. [Google Scholar] [CrossRef]
  11. Warjito, W.; Nasution, S.B.; Syahputra, M.F.; Budiarso, B.; Adanta, D. Study of turbulence model for performance and flow field prediction of pico hydro types propeller turbine. CFD Lett. 2020, 12, 26–34. [Google Scholar] [CrossRef]
  12. Subhas, S.; Saji, V.F.; Ramakrishna, S.; Das, H.N. CFD analysis of a propeller flow and cavitation. Int. J. Comput. Appl. 2012, 55, 26–33. [Google Scholar]
  13. Zhu, Z.; Fang, S. Numerical investigation of cavitation performance of ship propellers. J. Hydrodyn. 2012, 24, 347–353. [Google Scholar] [CrossRef]
  14. Shi, J.; Zhang, D.; Xu, S.; Chen, Y.; Qin, S.; Liu, X.; Hou, G. Comparative study on related models of propeller cavitation numerical simulation. Chin. J. Ship Res. 2023, 18, 30–38. [Google Scholar]
  15. Ghasemi, H. The effect of wake flow and skew angle on the ship propeller performance. Sci. Iran. 2009, 16, 149–158. [Google Scholar]
  16. Belhenniche, S.; Aounallah, M.; Omar, I.; Çelik, F. Effect of geometric configurations on hydrodynamic performance assessment of a marine propeller. Brodogr. Int. J. Nav. Archit. Ocean Eng. Res. Dev. 2016, 67, 31–48. [Google Scholar] [CrossRef]
  17. Gaggero, S.; Dubbioso, G.; Villa, D.; Muscari, R.; Viviani, M. Propeller modeling approaches for off–design operative conditions. Ocean Eng. 2019, 178, 283–305. [Google Scholar] [CrossRef]
  18. Boucetta, D.; Imine, O. Numerical simulation of the flow around marine propeller series. J. Phys. Sci. Appl. 2016, 6, 55–61. [Google Scholar]
  19. Tadros, M.; Ventura, M.; Guedes Soares, C. Design of propeller series optimizing fuel consumption and propeller efficiency. J. Mar. Sci. Eng. 2021, 9, 1226. [Google Scholar] [CrossRef]
  20. Pawar, A.B.; Petkar, T.S.; Pitale, P.S.; Salagare, S.S. Design and simulation of marine propeller with different blade geometry. Int. J. Innov. Sci. Res. Technol. 2019, 4, 109–117. [Google Scholar]
  21. Jadmiko, E.; Gurning, R.O.S.; Zaman, M.B.; Widjiati, E. Variations Rake Angle Propeller B–Series Towards Performance and Cavitation with CFD Method. J. Adv. Res. Fluid Mech. Therm. Sci. 2023, 106, 78–86. [Google Scholar] [CrossRef]
  22. Liyu, Y.E.; Chao, W.A.N.G.; Cong, S.U.N.; Chunyu, G.U.O. Mathematical expression method for geometric shape of toroidal propeller. Chin. J. Ship Res. 2023, 18, 224–233. [Google Scholar]
  23. Yang, J.; Zhou, L.J.; Wang, Z.W. Numerical investigation of the cavitation dynamic parameters in a Francis turbine draft tube with columnar vortex rope. J. Hydrodyn. 2019, 31, 931–939. [Google Scholar] [CrossRef]
  24. Tan, Y.; Ni, Y.; Xu, W. Key technologies and development trends of the soft abrasive flow finishing method. J. Zhejiang Univ.-Sci. A 2023, 24, 1043–1064. [Google Scholar] [CrossRef]
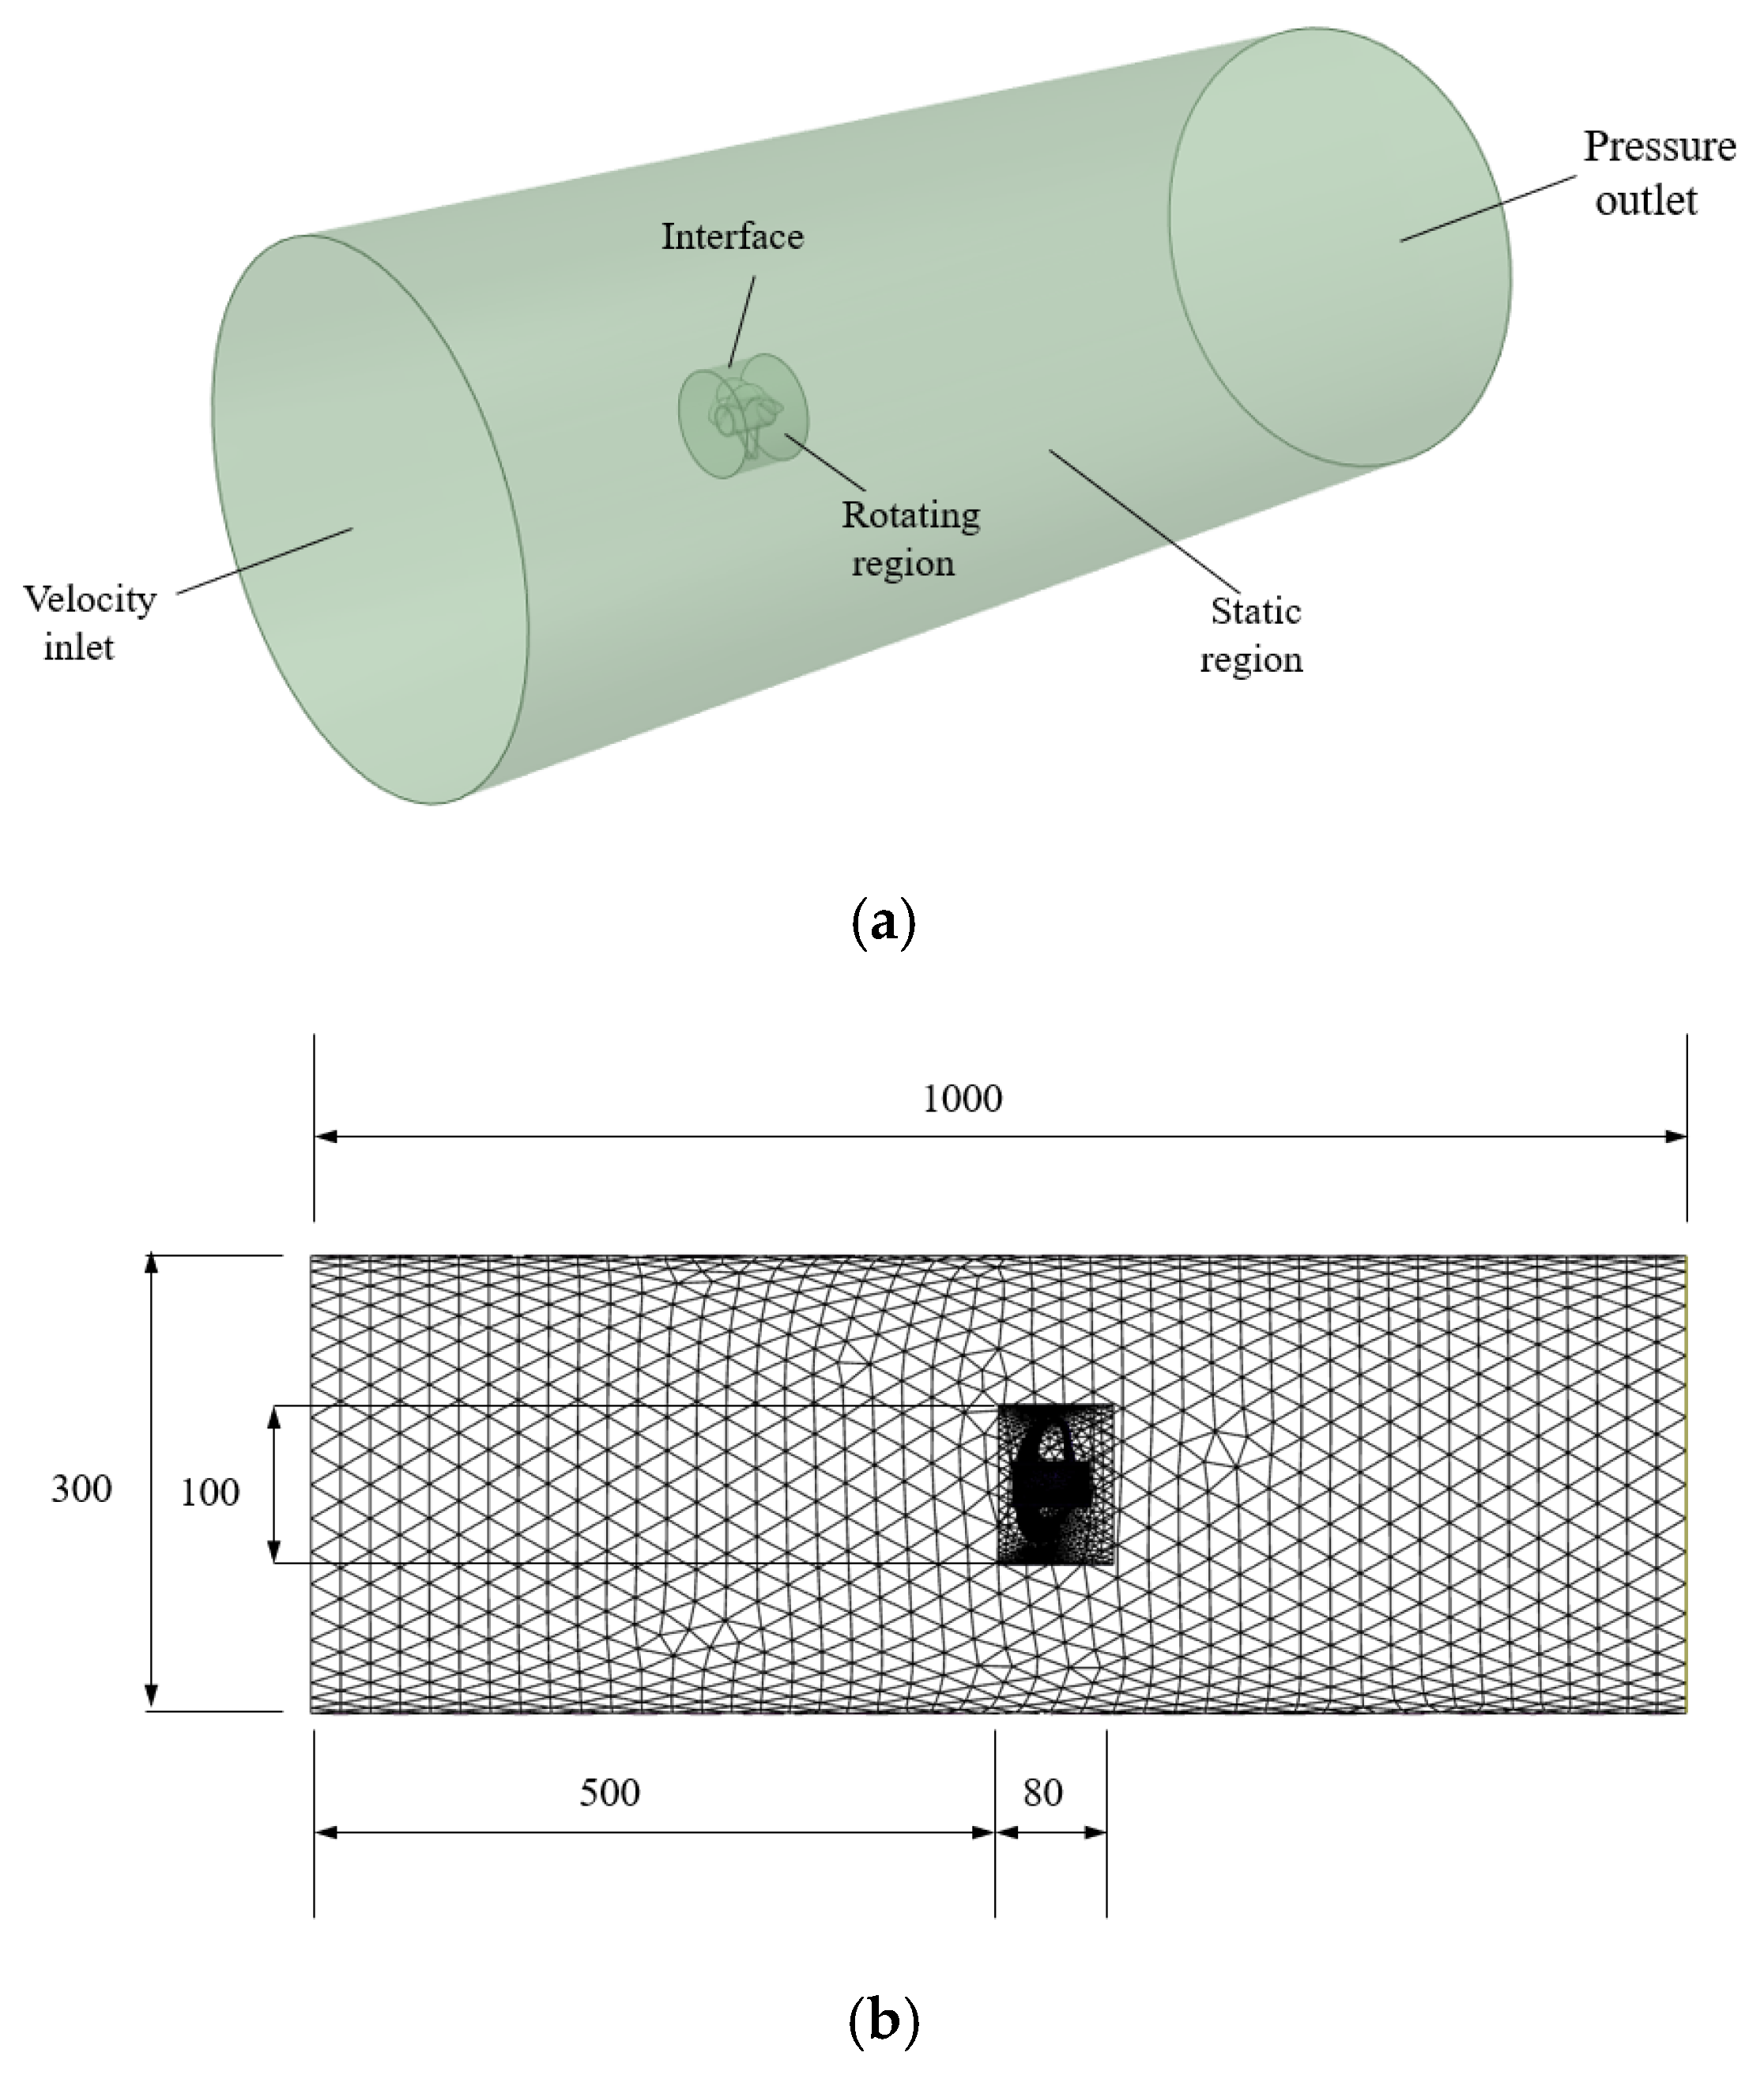
Figure 1. (a) Calculation domain; (b) boundary size.
Energies 17 05938 g001
Figure 2. Grids of different sizes; the sizes from left to right are 0.004 m, 0.002 m, 0.001 m.
Energies 17 05938 g002
Figure 3. (a) Propeller coordinates; (b) angle of outward inclination.
Energies 17 05938 g003
Figure 4. (a) Dynamic torque transducers; (b) thrust sensor.
Energies 17 05938 g004
Figure 5. Validation of the open-water test program.
Energies 17 05938 g005
Figure 6. Verification of open-water test site: (a) verification of open-water test site; (b) nine types of ring propellers for testing; (c) underwater propeller.
Energies 17 05938 g006
Figure 7. Pressure cloud: (a) 0 degrees; (b) 7.5 degrees; (c) 15 degrees; (d) 22.5 degrees; (e) 30 degrees.
Energies 17 05938 g007
Figure 8. The relation curve of propeller advance coefficient with (a) efficiency and (b) thrust coefficient, incorporating changes in the angle of outward inclination.
Energies 17 05938 g008
Figure 9. Cavitation flow phenomenon when the outward inclination angle is (a) 0 degrees; (b) 7.5 degrees; (c) 15 degrees; (d) 22.5 degrees; (e) 30 degrees ( J = 0.9 , r p s = 20 ).
Energies 17 05938 g009
Figure 10. Pressure cloud: (a) 25 degrees; (b) 35 degrees; (c) 45 degrees; (d) 55 degrees; (e) 65 degrees.
Energies 17 05938 g010
Figure 11. The relation curve of the propeller advance coefficient with (a) efficiency and (b) thrust coefficient, regarding changes in the angle of pitch.
Energies 17 05938 g011
Figure 12. Pressure cloud: (a) 2 blades; (b) 3 blades; (c) 4 blades; (d) 5 blades.
Energies 17 05938 g012
Figure 13. The relation curve of propeller advance coefficient with (a) efficiency and (b) thrust coefficient, regarding changes in the angle of pitch.
Energies 17 05938 g013
Figure 14. Three-dimensional response surface diagram. (a) Angle of outward inclination and angle of pitch; (b) number of blades and angle of pitch; (c) angle of outward inclination and number of blades.
Energies 17 05938 g014
Table 1. Results of different mesh sizes.
Mesh Size/mThrust CoefficientRelative Eviation
0.0080.21922.914%
0.0040.22271.364%
0.0020.22470.451%
0.0010.22540.168%
0.00050.2257
Table 2. Comparison of some propeller tests and simulations.
JKT-EXP10KQ-EXPKT-CFD10KQ-CFDERR-KTERR-10KQ
0.50.2910.6350.2880.5950.87%6.31%
0.70.2530.5860.2470.5462.44%6.78%
0.8330.2330.5490.2160.5077.64%7.72%
0.90.1830.4640.1990.485−8.92%−4.58%
1.10.1430.4030.1490.411−4.63%−2.12%
Table 3. Orthogonal test design.
Serial Number φ (°) θ (°) N (Piece) K T η
115.004540.235 0.522
215.003530.114 0.486
318.754520.2710.570
422.502530.0130.136
526.254530.4140.554
622.506520.5640.426
722.504550.5200.551
826.255540.7540.470
930.005520.4860.457
1018.755530.4420.547
1122.505520.4470.511
1226.25252−0.0180.000
1330.003550.1970.553
1430.004520.2170.576
1518.756540.8380.410
1630.006530.8620.420
1715.0.5550.5600.498
1815.006520.1780.610
1915.00252−0.0270.000
2026.256550.9410.440
2130.002540.0640.352
2218.753520.1120.622
2322.503540.1250.567
2426.253520.1390.632
2518.75255−0.0630.000
Disclaimer/Publisher’s Note: The statements, opinions and data contained in all publications are solely those of the individual author(s) and contributor(s) and not of MDPI and/or the editor(s). MDPI and/or the editor(s) disclaim responsibility for any injury to people or property resulting from any ideas, methods, instructions or products referred to in the content.