Article

Study on Long-Term Stability of Lined Rock Cavern for Compressed Air Energy Storage

1
Institute of Rock Mechanics, Ningbo University, Ningbo 315000, China
2
Ningbo Key Laboratory of Energy Geostructure, Ningbo University, Ningbo 315000, China
3
College of Civil Engineering and Communications, North China University of Water Resources and Electric Power, Zhengzhou 450000, China
*
Author to whom correspondence should be addressed.
Energies 2024, 17(23), 5908; https://doi.org/10.3390/en17235908
Submission received: 11 October 2024 / Revised: 13 November 2024 / Accepted: 20 November 2024 / Published: 25 November 2024
(This article belongs to the Section D: Energy Storage and Application)

Abstract

A rock mass is mainly subjected to a high internal pressure load in the lined rock cavern (LRC) for compressed air energy storage (CAES). However, under the action of long-term cyclic loading and unloading, the mechanical properties of a rock mass will deteriorate, affecting the long-term stability of the cavern. The fissures in the rock mass will expand and generate new cracks, causing varying degrees of damage to the rock mass. Most of the existing studies are based on the test data of complete rock samples and the fissures in the rock mass are ignored. In this paper, the strain equivalence principle is used to couple the initial damage variable caused by the fissures and the fatigue damage variable of a rock mass to obtain the damage variable of a rock mass under cyclic stress. Then, based on the ANSYS 17.0 platform, the ANSYS Parametric Design Language (APDL) is used to program the rock mass elastic modulus evolution equation, and a calculation program of the rock mass damage model is secondarily developed. The calculation program is verified by a cyclic loading and unloading model test. It is applied to the construction project of underground LRC for CAES in Northwest China. The calculation results show that the vertical radial displacement of the rock mass is 8.39 mm after the 100th cycle, which is a little larger than the 7.53 mm after the first cycle. The plastic zone of the rock mass is enlarged by 4.71 m2, about 11.49% for 100 cycles compared to the first cycle. Our calculation results can guide the design and calculation of the LRC, which is beneficial to the promotion of the CAES technology.

1. Introduction

In order to protect the environment and reduce carbon emissions, renewable energy, represented by wind and solar energies, has developed rapidly [1]. However, this type of energy has intermittent and fluctuating characteristics, and its large-scale grid connection threatens the stability of the power grid [2]. Hence, there is a need to develop supporting energy storage technologies.
The CAES technology utilizes excess electrical energy to drive an air compressor to store high-pressure air in an underground storage cavern. Then, it releases the high-pressure air to drive a turbine generator to generate electricity during peak electricity consumption [3,4]. Compared with other energy storage methods, such as pumped hydro energy storage [5,6] and chemical energy storage [7,8,9], it has the advantages of wide site selection conditions, a large scale, and a long lifespan. It can effectively solve the problems of intermittency and fluctuation in the process of wind and photovoltaic power generation [10,11,12]. Currently, commercially operated CAES power stations use salt caverns as underground gas storage, such as the Huntorf Power Station (290 MW) built in Germany in 1978 [13], the McIntosh Power Station (110 MW) built in the United States in 1991 [14], the Jintan Power Station (60 MW) built in 2022 in Jiangsu, China [15],1 and the Yingcheng Power Station (300 MW) built in 2024 in Hubei, China [16]. Salt caverns are special geological structures that may not necessarily exist in areas with abundant wind and solar energies or a high demand for electricity. Manually excavated underground LRCs do not require special geological structures, and the site selection conditions are more extensive and flexible, which is an important direction for the development of large-scale CAES power stations.
The LRC has received widespread attention from researchers. Many countries have made many attempts at the possibility of the LRC. For example, two small test caverns were built by the Korea Institute of Geology and Mineral Resources [17]. The diameter of the caverns is 5 m, and the depth is about 100 m. Japan conducted two small-scale tests of a CAES underground LRC [18]. The LRC has a volume of 1600 m3 and the air pressure is 4–8 MPa. A small, shallowly buried cavern was built in Pingjiang City, Hunan Province, by the Power Construction Corporation of China [19,20]. The test cavern is about 110 m deep, 5 m long, and 2.9 m in inner diameter, and it has a clearance volume of about 28.8 m3. The maximum operating pressure of the cavern is 10 MPa. The Yungang Mine in Datong, Shanxi, is using existing tunnels to transform into an underground LRC for CAES [21]. The depth is about 300 m.
The CAES power stations generally adopt a charging and deflating cycle operation mode per day. Under operating conditions that last for decades, the rock mass of the cavern is subject to cyclic loading and unloading, and the damage to the rock mass will gradually accumulate. In severe cases, it can lead to the damage and instability of the rock mass. Hence, the study of rock mass damage under cyclic loading and unloading is very important to ensure the stability of the cavern for CAES. In recent years, scholars have conducted extensive research in this area. For example, Xu X L et al. [22] proposed a damage constitutive model based on the Weibull distribution with nonlinear coupling of the full damage parameters, and the proposed model was validated by using the results of conventional triaxial tests of granite under different temperatures and circumferential pressure conditions. Zhou S W et al. [23,24] established a statistical damage constitutive model by extending the Weibull distribution and using the M-C failure criterion. Sheng-jun M et al. [25] conducted cyclic loading and unloading tests on siltstone and established a model that can represent the fatigue rheological damage of siltstone under cyclic loading. Zongze Li et al. [26] conducted discontinuous cyclic loading tests on sandstone. The test results showed that the fatigue life of sandstone in discontinuous fatigue tests is much shorter than that in traditional fatigue tests. Jiang Zhongming et al. [27] established a rock cumulative damage model under various cyclic loading and unloading conditions and considered the damage evolution of Poisson’s ratio.
In actual engineering, the rock mass contains defects such as joints, fissures, and holes. Under the action of a cyclic, high internal pressure, the fissures in the rock mass will expand and generate new cracks, causing varying degrees of damage to the rock mass, which is ignored by the above studies. Hence, when conducting research on the damage characteristics of a rock mass under cyclic stress, the initial damage to the rock mass caused by macroscopic fissures and the fatigue damage caused by cyclic stress should be considered at the same time.
In this paper, the initial damage variable and the fatigue damage variable are coupled by the strain equivalent principle, and the damage variable of a rock mass under cyclic stress in the LRC is obtained. Based on the ANSYS platform, the APDL language was used to program the rock mass elastic modulus evolution equation, and a calculation program of a rock mass damage model was secondarily developed and applied to an LRC project in the northwest of China. The calculation results can guide the design and calculation of the LRC, which is beneficial to the promotion of the CAES technology.

2. Methods

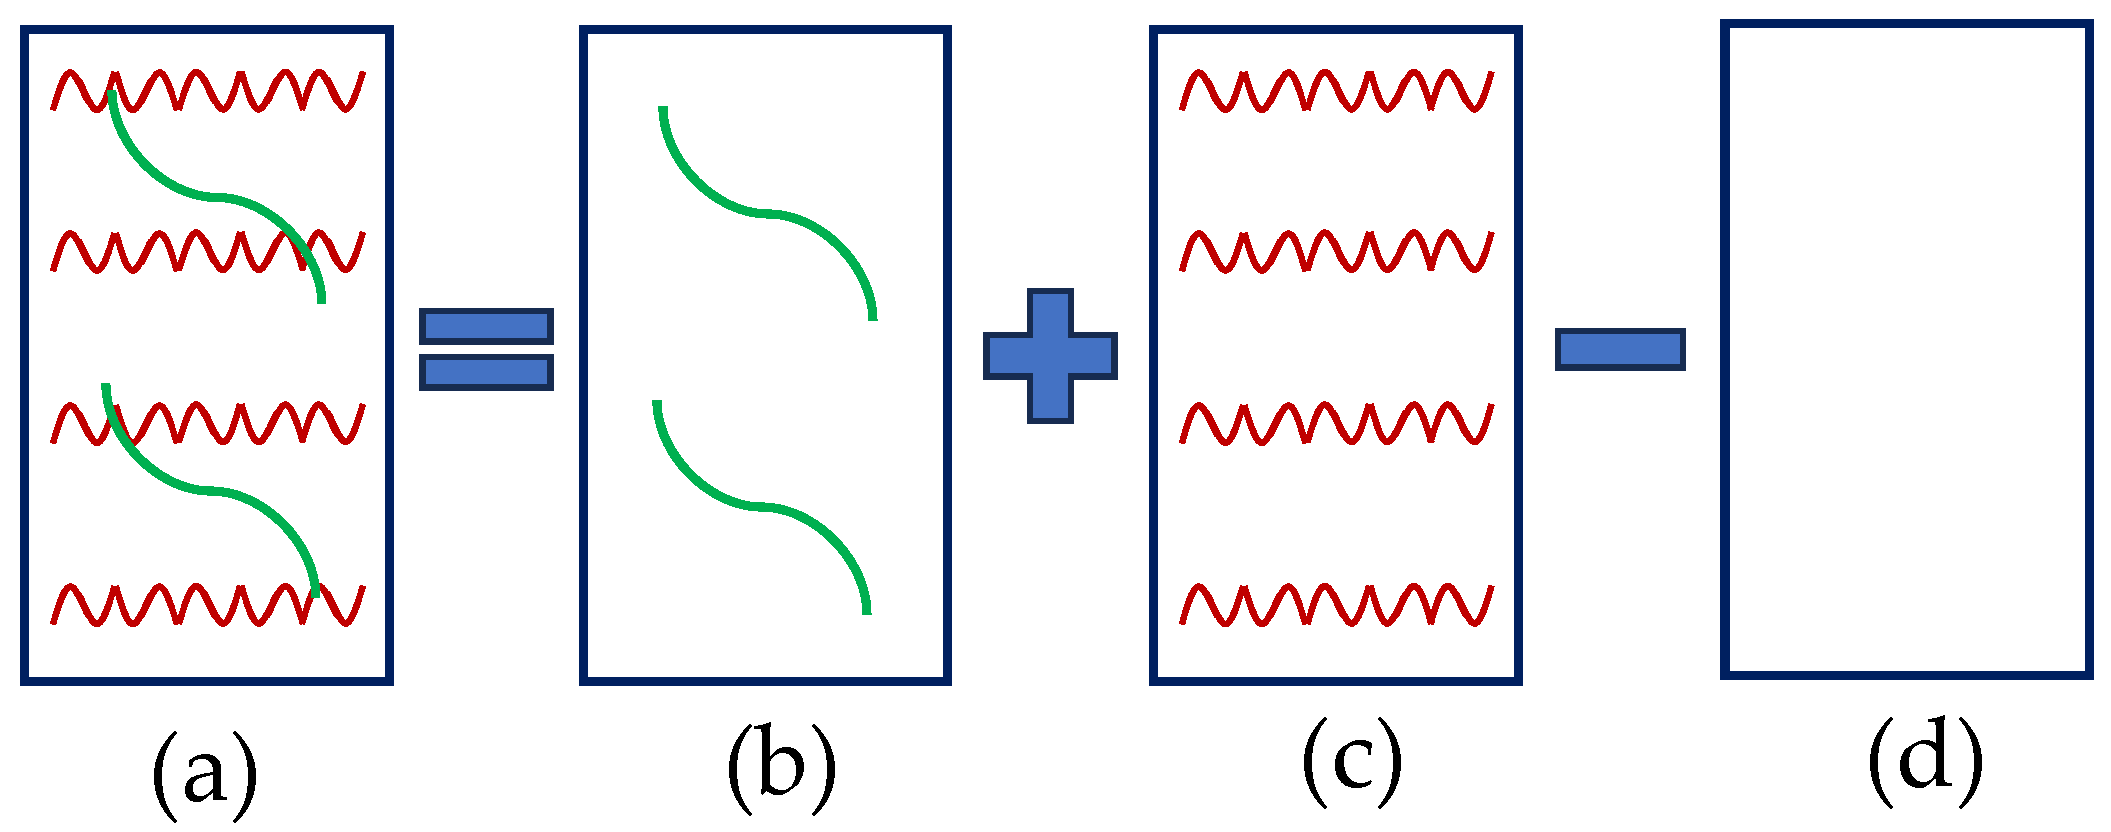
2.1. Damage Variable of Rock Mass

The initial damage variable D1 of the rock mass caused by macroscopic fissures was obtained by [28]. If a single set of multirow fractures is considered, it can be expressed as follows:
D 1 = 1 1 1 + 18.86 ρ v m 0 l 2 h f 2 sec ( π l w )
where m0 = cos 2α(sin α − cos α tan φ)2, α is the fissure inclination angle, φ is the friction angle of the fissure surface, ρv is the average volume density of fissures, l is the half length of the fissures, h is the depth of the fissures, f is the coefficient reflecting the mutual influence of fissures, and w is the width of the plate.
The fatigue damage Dn caused by cyclic stress was established by [29,30], and it can be written as follows:
D n = 1 1 n N f 1 c 1 1 + b
where n is the number of cyclic loading and unloading, Nf is the number of cycles for the rock mass to reach fatigue failure, and c and b are calculation parameters.
Firstly, we assume that the initial damage and the fatigue damage of the rock mass are uniform and isotropic [31]. Then, this paper proposes that the initial damage variable D1 and the fatigue damage variable Dn are coupled by the strain equivalence principle to obtain the damage variable D1n of the rock mass under cyclic stress. As shown in Figure 1, it is assumed that Figure 1a to Figure 1d are a rock containing both initial damage and fatigue damage, a rock containing only initial damage, a rock containing only fatigue damage, and a rock containing no damage at all, respectively. The elastic moduli of the rock are E1n, E1, En, and E0, respectively, and the strains produced under the action of stress σ are ε1n, ε1, εn, and ε0, respectively.
According to the strain equivalence principle [32], there is
ε 1 n = ε 1 + ε n ε 0
It is assumed that the initial damage and the fatigue damage in the stress direction are D1 and Dn, respectively, and their coupling damage is D1n. Then, we can obtain
σ E 1 n = σ E 1 + σ E n σ E 0
According to the Lemaitre assumption [32],
E 1 n = E 0 ( 1 D 1 n ) E 1 = E 0 ( 1 D 1 ) E n = E 0 ( 1 D n )
Substituting Equation (5) into Equation (4), we can obtain
D 1 n = 1 ( 1 D 1 ) ( 1 D n ) 1 D 1 D n
By connecting Equations (1) and (2), the damage variable of a rock mass considering the fissures and the cyclic stress can be obtained.

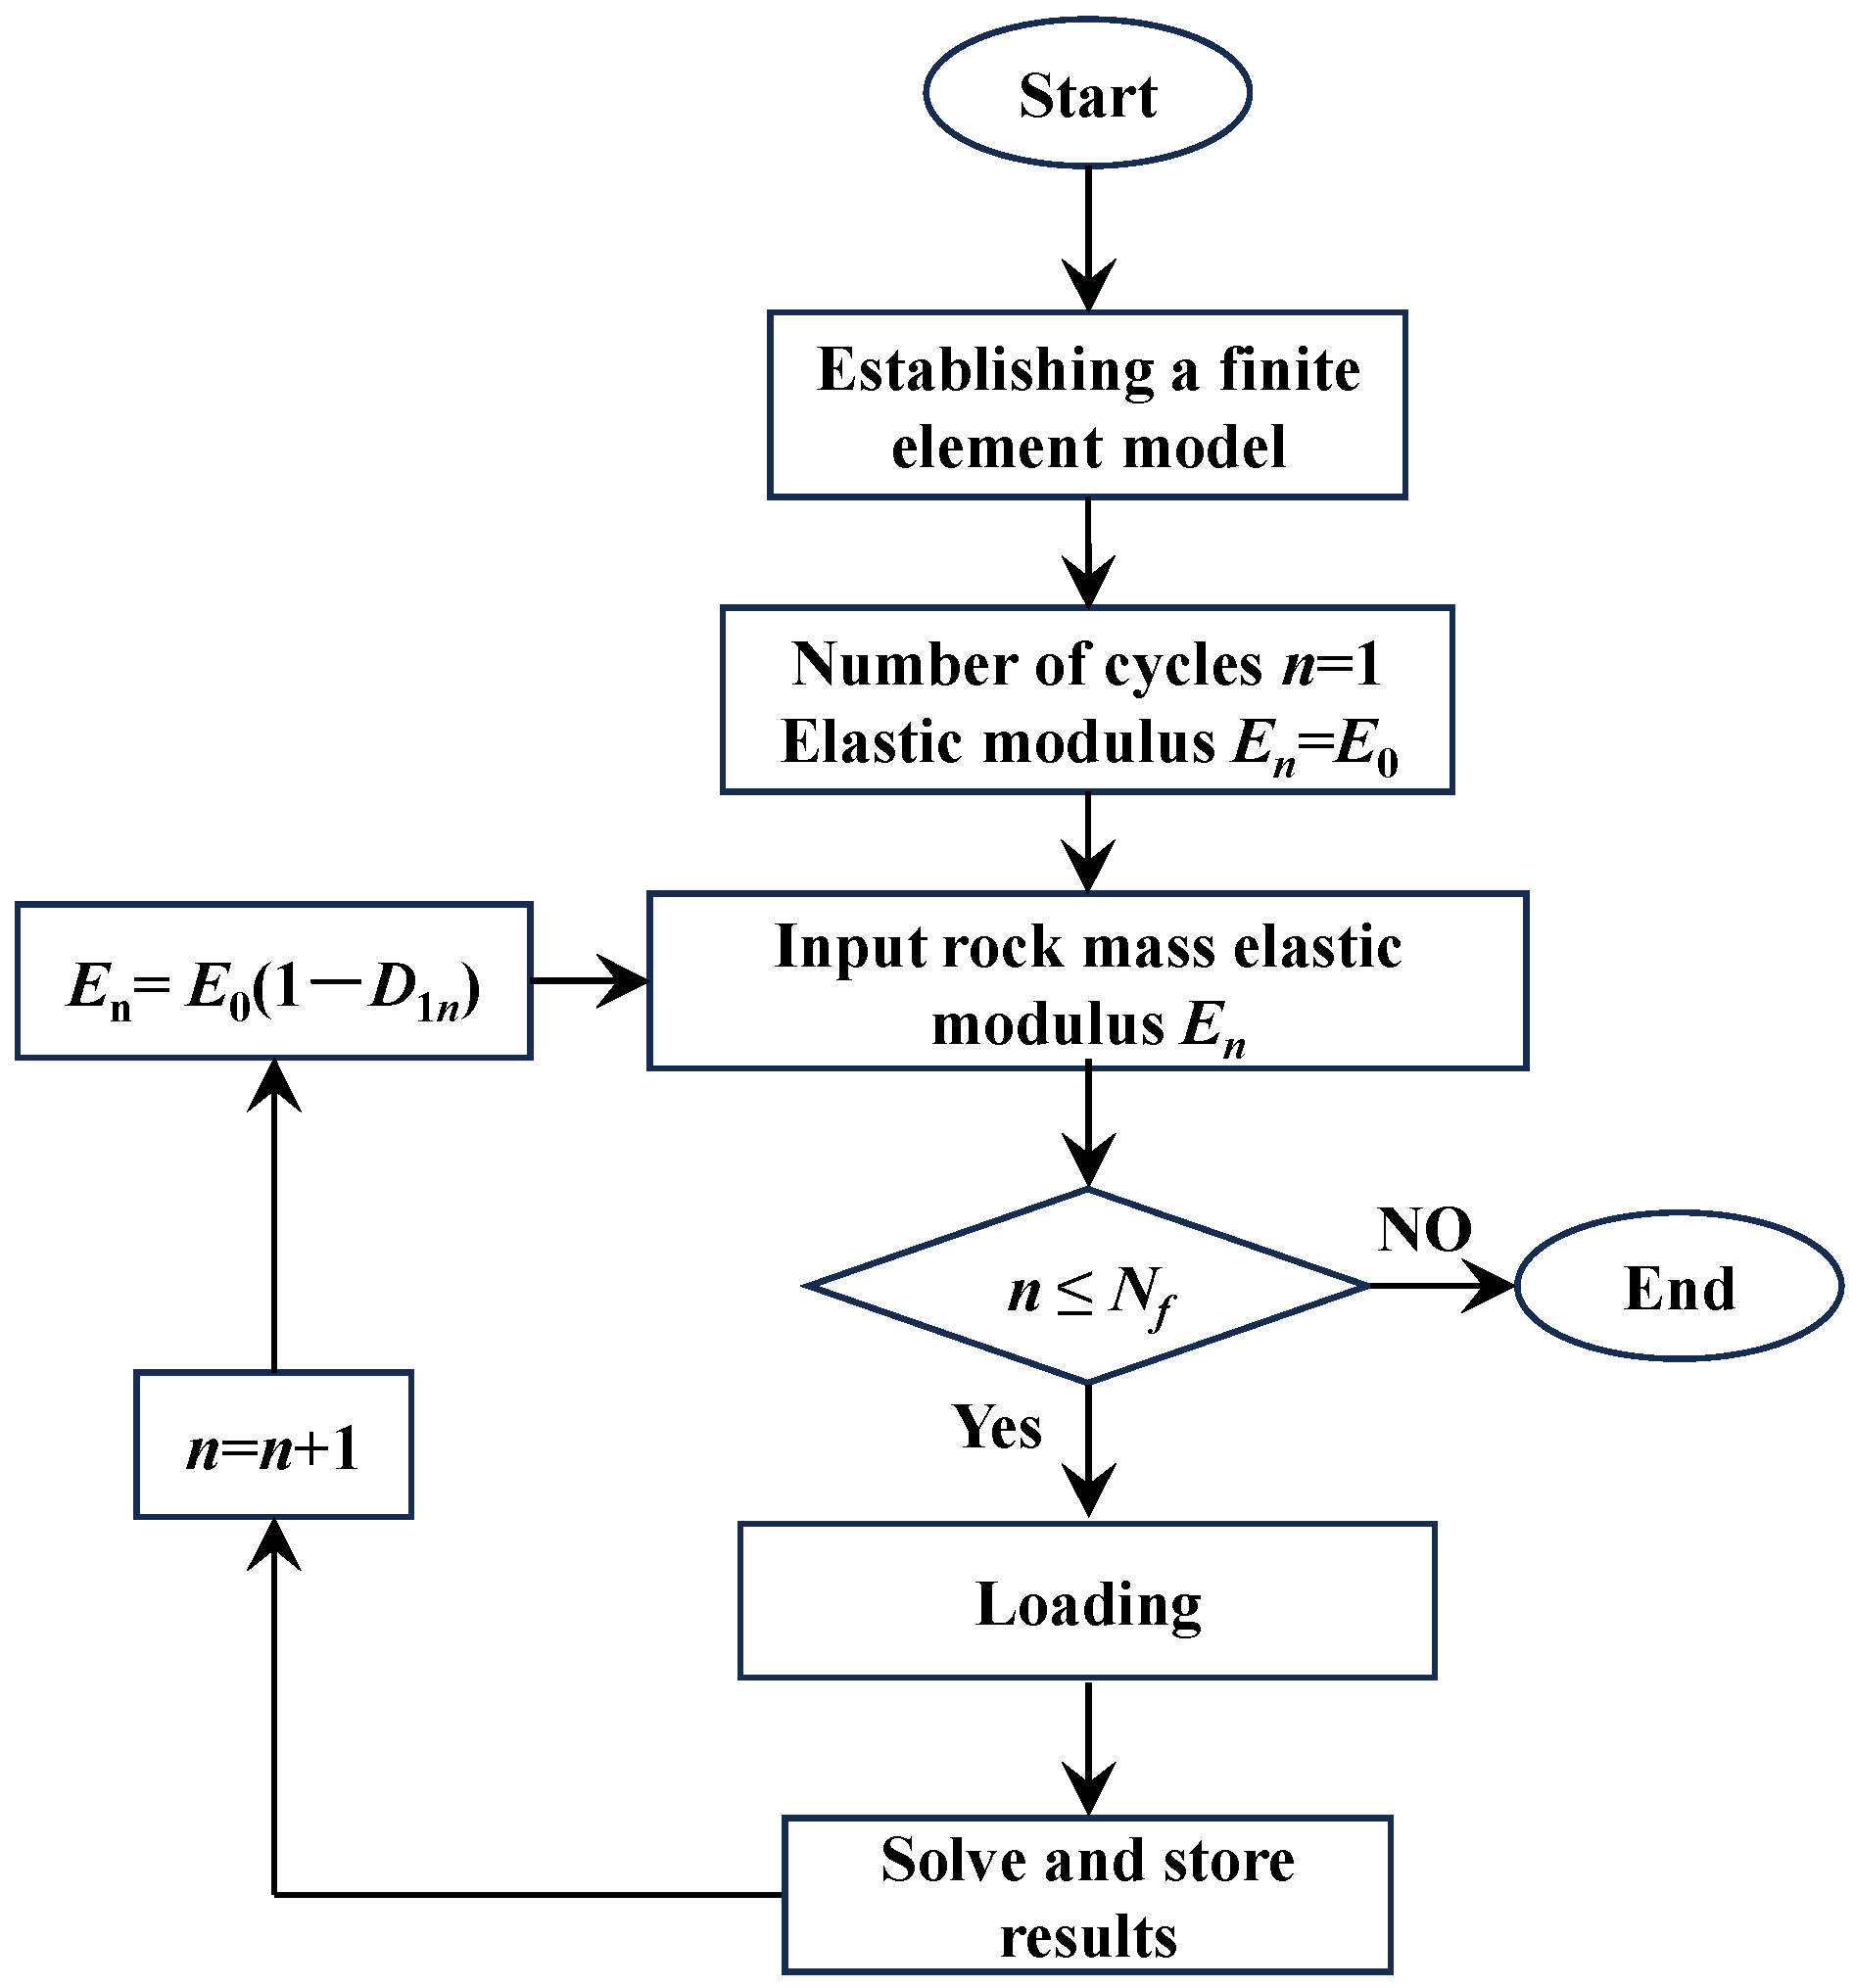
2.2. Numerical Implementation
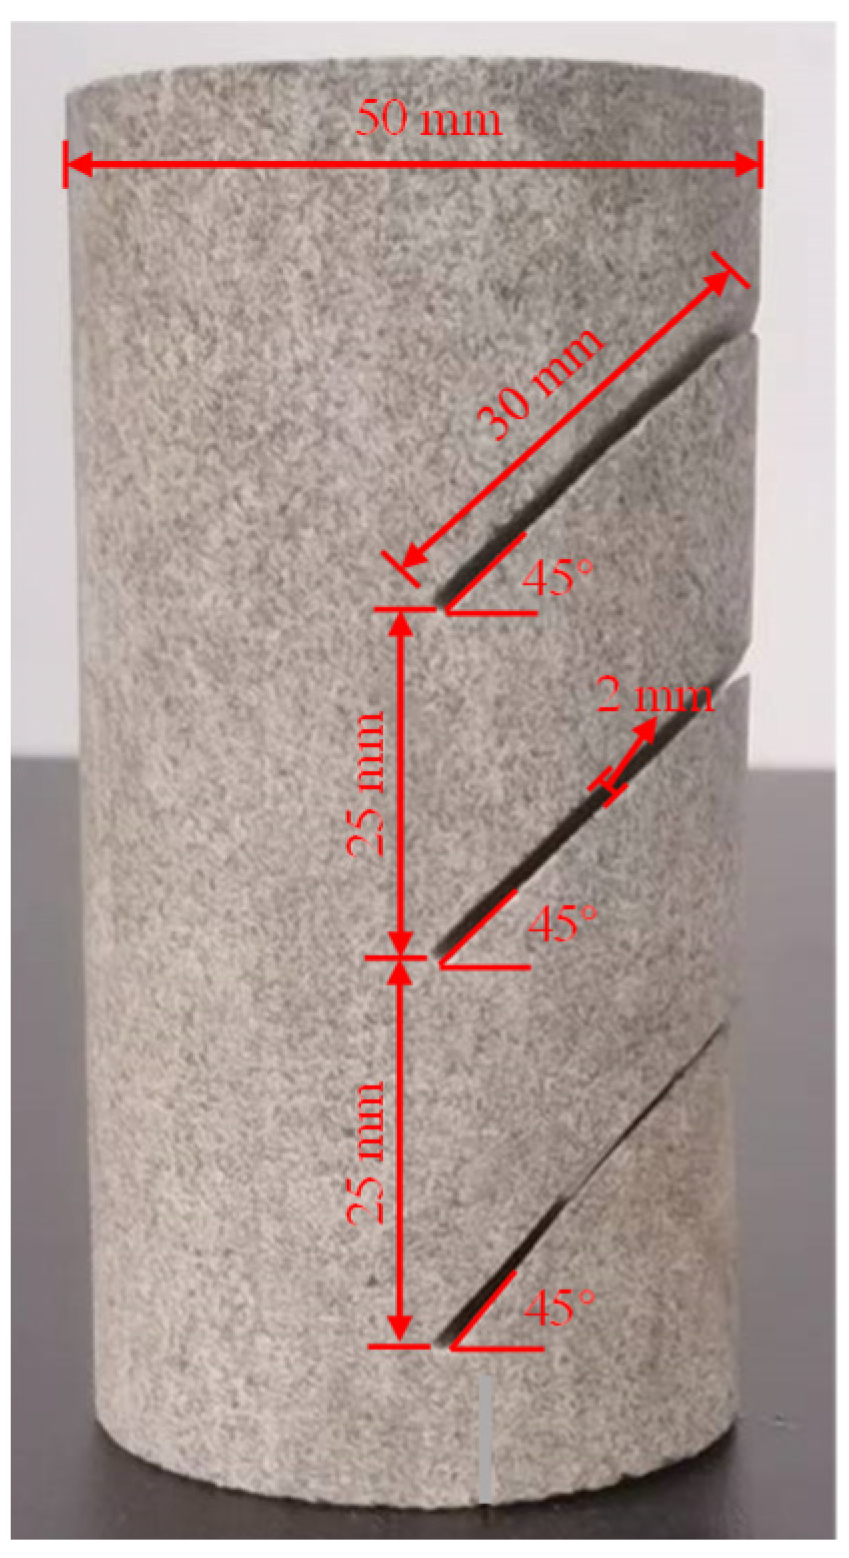
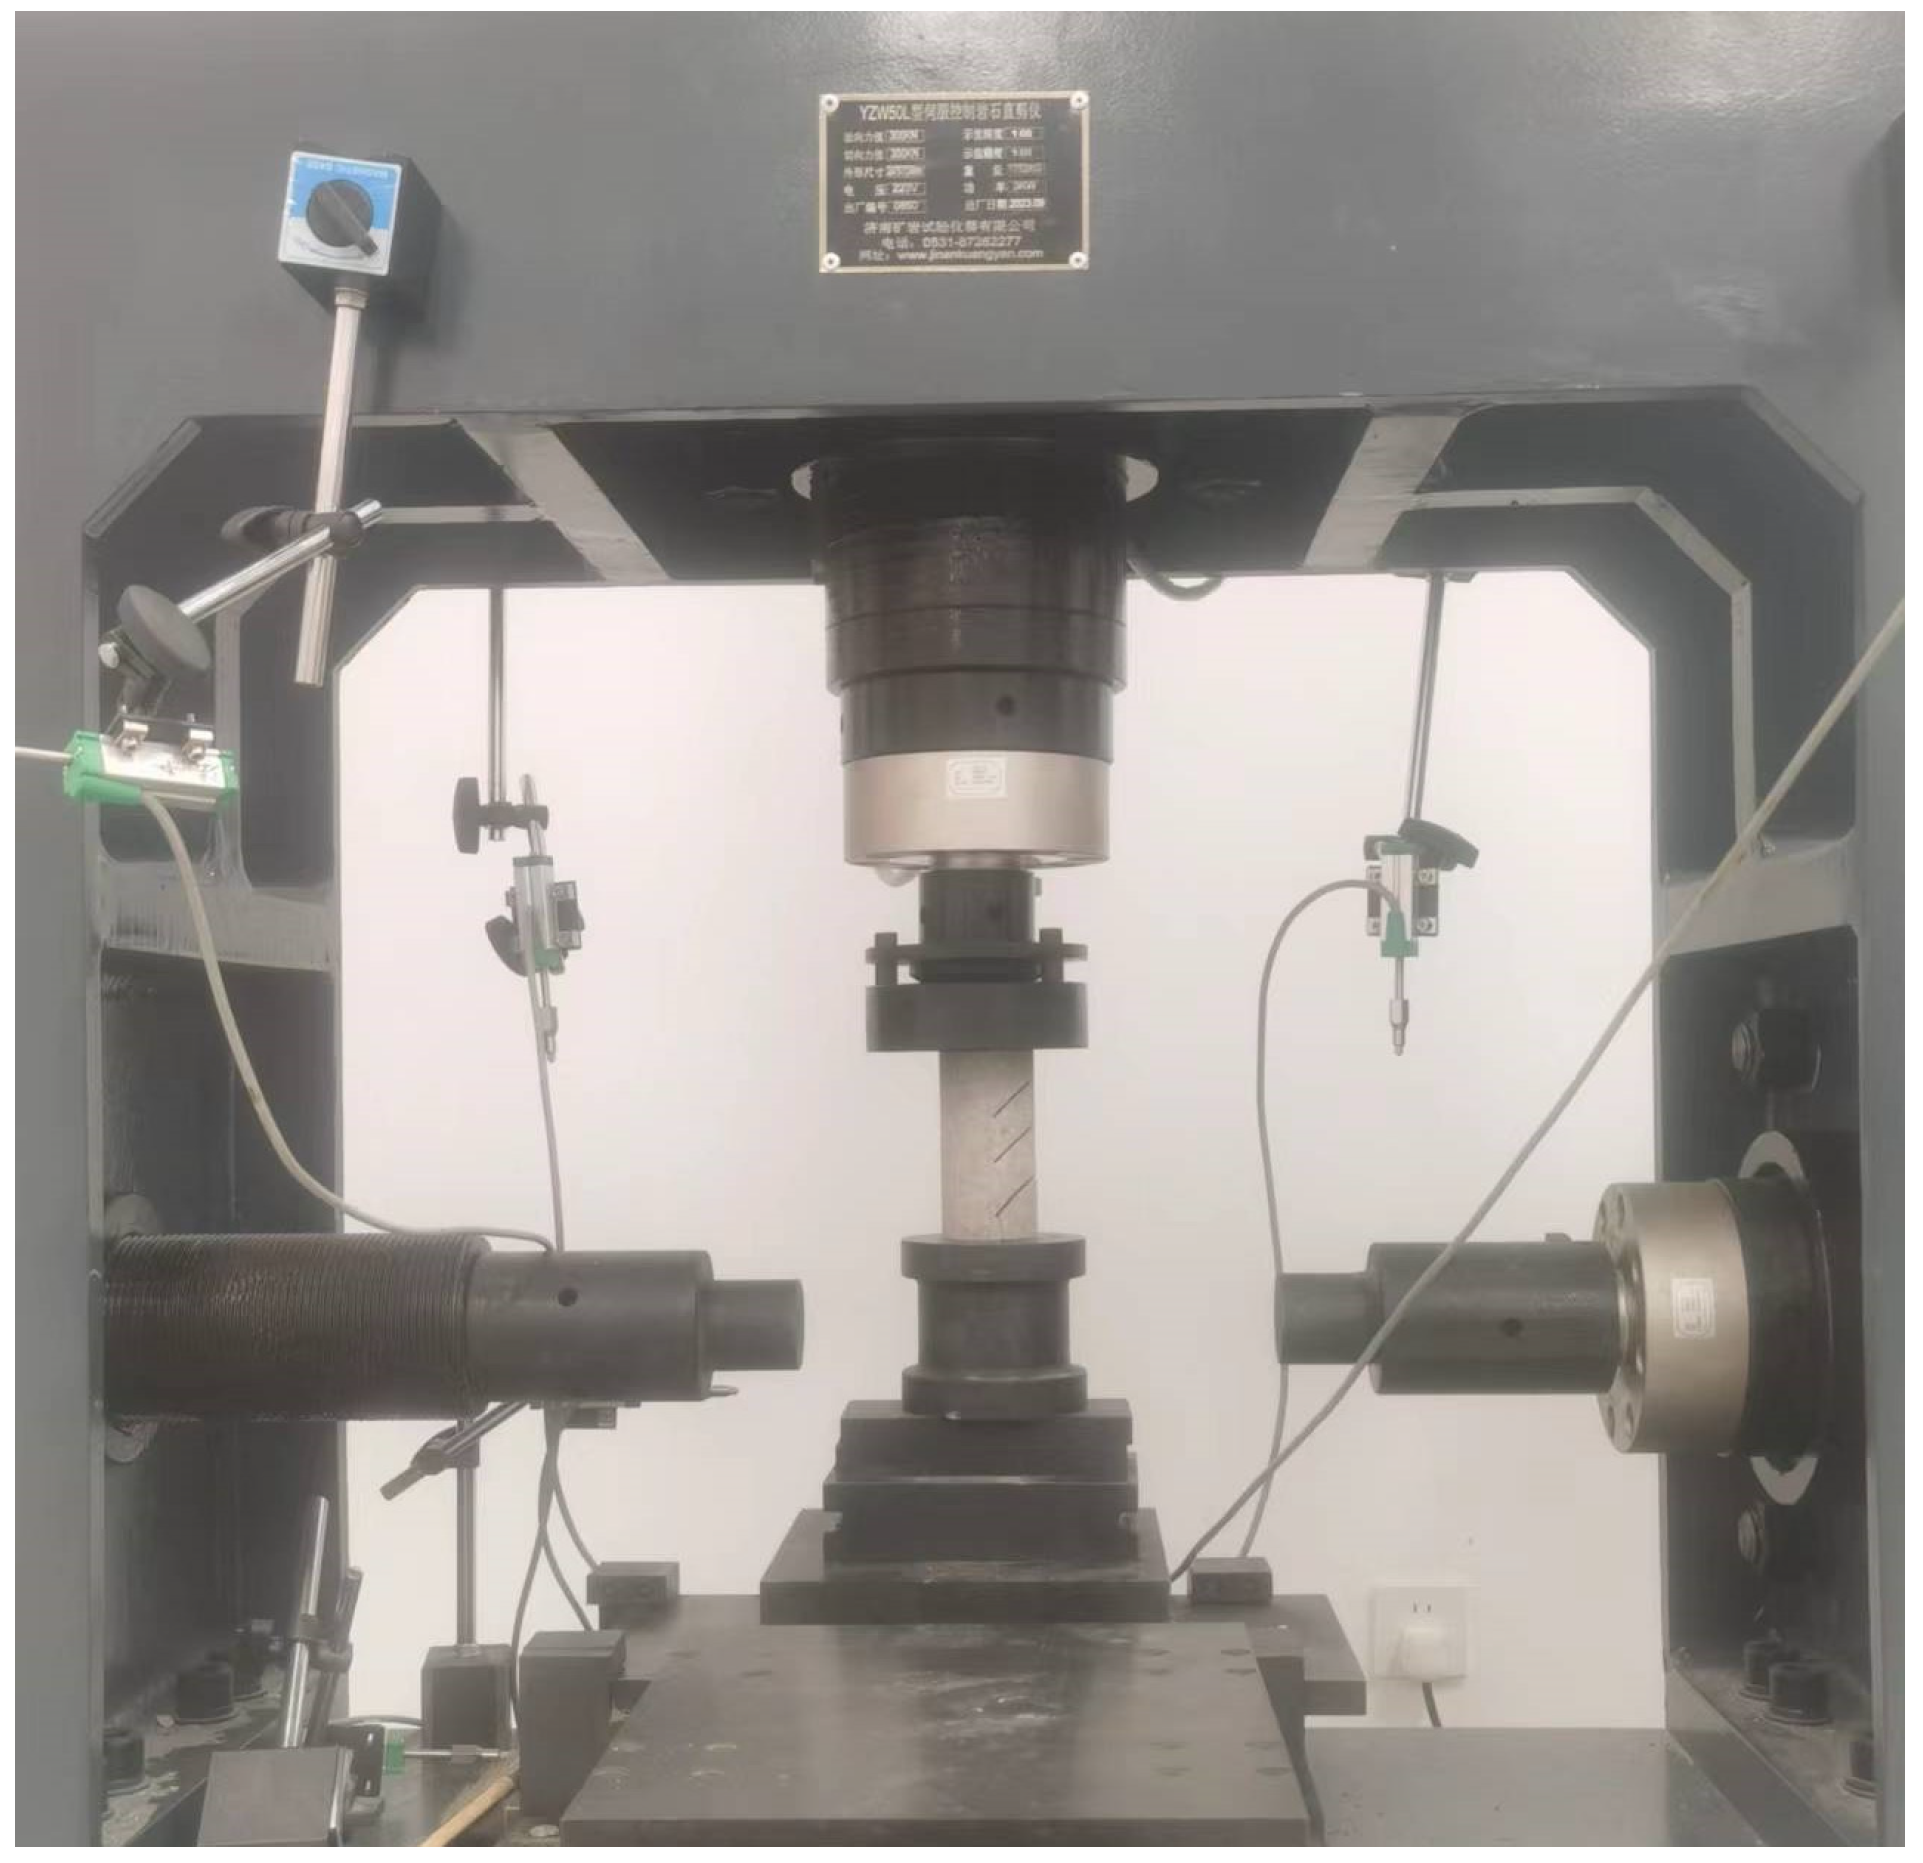
In order to analyze the cumulative damage characteristics of the rock mass in the LRC, the APDL language was used to program the evolution equation of the rock mass elastic modulus based on the ANSYS platform. During the calculation process, the elastic modulus of the rock mass unit material is dynamically modified, thereby realizing the secondary development of the rock mass damage model. The numerical calculation process of the rock mass under cyclic stress is shown in Figure 2.

3. Validation

To verify the correctness of the rock damage numerical calculation program developed in this paper, a three-dimensional cumulative damage numerical model of the rock specimen was established according to the numerical calculation flowchart in Figure 2. The uniaxial compression cyclic loading and unloading test was conducted on the rock mass containing fissures by the YZW50L servo-controlled rock straight shear instrument, which was manufactured by Jinan Mining and Rock Testing Instrument Co., Ltd. in Jinan, China.
Because the lithology information of the CAES power station built in Section 4 was sandstone, the rock sample for the physical test was sandstone. Equation (1) shows the damage variable calculation formula for a single set of multirow fissures. However, if the fissures are numerous and dense, the rock sample is prone to break during the uniaxial compression cycle test, and the elastic modulus damage of the rock sample cannot be accurately obtained. Hence, the rock sample with a smooth surface was cut with a water jet to produce three fractures, and the fracture spacing was controlled to 25 mm, as shown in Figure 3. The rock sample was processed by wet processing into a standard cylindrical specimen with a diameter of 50 mm and a height of 100 mm, with a cross-section flatness of less than 0.02 mm.
Before the fatigue test, in order to eliminate the influence of moisture content, the rock sample was dried at a temperature of 105–110 °C for 24 h. Then, it was put into a desiccator and cooled to room temperature before conducting the uniaxial compressive strength test. The numerical calculation parameters adopt the measured rock sample parameters, as shown in Table 1.
The model fatigue test was performed using a stress loading control mode as shown in Figure 4. Firstly, the axial stress was loaded to 0.5 kN at a loading rate of 0.1 kN/s, so that the indenter was in full contact with the specimen. Then, the axial stress was loaded to 80% of the uniaxial compressive strength at a loading rate of 2 kN/s and subsequently unloaded to nearly 10% of the uniaxial compressive strength at an unloading rate of 2 kN/s. Then, adding and uninstalling were performed repeatedly.
The comparison between the numerical calculation results and the physical test results is shown in Figure 5. As can be seen from Figure 5, the results calculated using the cumulative damage numerical model are basically consistent with the stress–strain curve obtained from the physical model test, which shows that the cumulative damage model of the rock mass proposed in this paper is reasonable and the calculation program of the secondary development is correct. However, whether the model can calculate the damage variable of a rock mass with other types of fissures is uncertain and needs further verification.

4. Engineering Application

China plans to build a CAES demonstration power station with an installed capacity of 60 MW in the northwest, with a design life of 30 years. Preliminary calculations require the construction of an underground gas storage cavern with a total volume of 2.6 × 10⁴ m3 and a burial depth of 146 m. The lithology of the formation is sandstone.

4.1. Calculation Model

The numerical calculation was conducted by ANSYS, and the rock mass damage calculation model developed in this paper was adopted. The finite element model established is shown in Figure 6. The model is 100 m long, 204 m high, and 1 m in the axial direction.
The cavern is composed of a rubber sealing layer, a plain concrete lining, and initial support from the inside to the outside. The diameter of the cavern is 10 m, the thickness of the rubber sealing layer is 0.37 cm, the thickness of the plain concrete lining is 50 cm, and the thickness of the initial support is 18 cm. The bottom nodes of the model are fully fixed, the left and right boundary is only fixed with the horizontal direction translational degree of freedom, the front and rear boundaries are only fixed with the axial direction translational degree of freedom, and the top boundary is a free boundary condition.
The damage model parameters are shown in Table 2. Figure 7 shows the relationship between the elastic modulus of the rock mass and cycle time, based on the calculation parameters in Table 2. Table 3 shows the physical and mechanical parameters of the cavern materials.
Under high-pressure gas storage conditions, the air leakage rate is high. Therefore, in order to improve the energy conversion efficiency, an operating mode with long low-pressure gas storage time and short high-pressure gas storage time was adopted. The daily operating condition of the gas storage cavern is shown in Figure 8, with stable inflation for 8 h to 10 MPa, high-pressure gas storage for 2 h, stable deflation of 4 h to 4 MPa, and low-pressure gas storage for 10 h. We repeated the charging and deflating cycle in this way. The numerical model calculation applies the same loading pattern.

4.2. Calculation Results

Concrete lining is an important component of the structural system of the LRC, which plays the role of transmitting internal pressure and protecting the sealing layer. Figure 9a shows the variation curve of the maximum tensile stress of the concrete lining under cyclic loading and unloading, and Figure 10 shows the distribution of cracks in concrete lining. As can be seen from Figure 9a, the maximum tensile stress of 1.51 MPa occurs in the concrete lining during the first inflation process, and the maximum tensile stress decreases during the subsequent inflation and deflation process, steadying at about 1.18 MPa. This is because the C30 concrete material used has a low tensile strength of only 1.43 MP. The concrete lining cracks during the first inflation process, which can be seen from Figure 10. The resulting cracks release the circumferential deformation of the lining and simultaneously reduce the tensile stress.
Figure 9b shows the variation curve of the maximum compressive stress of the concrete lining under cyclic loading and unloading. As can be seen from Figure 9b, unlike the change in the maximum tensile stress of the concrete lining, the maximum compressive stress of the concrete lining is stable at 8.66 MPa during the cyclic inflation and deflation process. This is because the compressive strength of concrete materials is high, and the maximum internal pressure of 10 MPa in the gas storage cavern is less than the design compressive strength value of 14.3 MPa of the C30 concrete material used. Hence, the maximum compressive stress of the lining does not change much during the subsequent filling and deflation process.
Figure 11 shows the radial displacement variation curve of the concrete lining measuring points under the cyclic loading and unloading. As can be seen from Figure 11, the maximum radial displacement of the top lining is stable at 10.50 mm, which is larger than the maximum radial displacement of the lateral lining of 8.60 mm. It shows that the deformation at the top of the LRC is greater than the deformation at the lateral sides, which will have a negative impact on the sealing of the cavern. Hence, the lining should take relevant measures to limit concrete cracking, such as adding fibers, using ribbed steel bars, increasing the reinforcement ratio, etc.
Figure 12a,b show the variation curve of tensile stress and compressive stress at the measured points of the rock mass under cyclic loading and unloading, respectively. As can be seen from Figure 12a, the tensile stress mainly appears at the top of the LRC when the cavern is inflated. The maximum tensile stress of the rock mass at the top of the cavern is 1.53 MPa when the cavern reaches the maximum internal pressure. This is because the hoop deformation occurs on the top of the rock mass, causing the hoop tensile stress to increase during the inflation process. It can be seen from Figure 12b that the lateral compressive stress of the rock mass is greater than the top compressive stress. During the inflation and deflation process, the maximum lateral compressive stress of the rock mass is 6.54 MPa, and the minimum compressive stress is 3.66 MPa. The maximum compressive stress at the top of the rock mass is 5.64 MPa, and the minimum compressive stress is 2.82 MPa.
Figure 13 shows the radial displacement variation curve of the rock mass measuring points under the action of cyclic loading and unloading. It can be seen from Figure 13 that the radial displacement at the top of the rock mass is greater than the lateral displacement. This is because tensile stress will occur at the top of the LRC, resulting in plastic deformation, as shown in Figure 12a. The radial displacement of the rock mass at the top slowly increases during the cyclic charging and deflating process. When the gas storage cavern operates in a normal charging and deflating cycle for 500 h, the radial displacement of the top of the rock mass is 7.91 mm; when it operates for 1000 h, the radial displacement of the top of the rock mass is 8.06 mm; when it operates for 2000 h, the radial displacement of the top of the rock mass is 8.39 mm. This is because during the cyclic filling and deflation process of the gas storage cavern, as the number of cycles increases, the elastic modulus of the rock mass appears damaged, causing the deformation to increase. Hence, some strengthening measures need to be taken for the rock mass at the top and bottom of the cavern during the construction, such as decreasing the spacing of the rockbolt [33], special material grouting [34,35], thickening the initial lining, etc.
Figure 14 shows the changes in the area of the plastic zone of the rock mass under cyclic loading and unloading. It can be seen from Figure 14 that the plastic zone mainly appears at the top and bottom of the rock mass and becomes larger as the number of cycles of gas filling and deflation increases. The area of the plastic zone after 50 cycles of inflation and deflation increases by 2.54 m2 compared with the area of the plastic zone after the first inflation and deflation. The area of the plastic zone after 100 cycles increases by 2.17 m2 compared to the area of the plastic zone after the 50th cycle. In total, the plastic zone of the rock mass is enlarged by 4.71 m2, about 11.49%, for 100 cycles compared to the first cycle.

5. Conclusions

This paper couples the initial damage and the fatigue damage of a rock mass to obtain the damage variable of the rock mass under cyclic stress. The APDL language was used to program the rock mass elastic modulus evolution equation, and a rock mass damage model calculation program was secondarily developed based on the ANSYS platform. Applying it to a CAES underground LRC construction project in the northwest of China, the following conclusions are drawn:
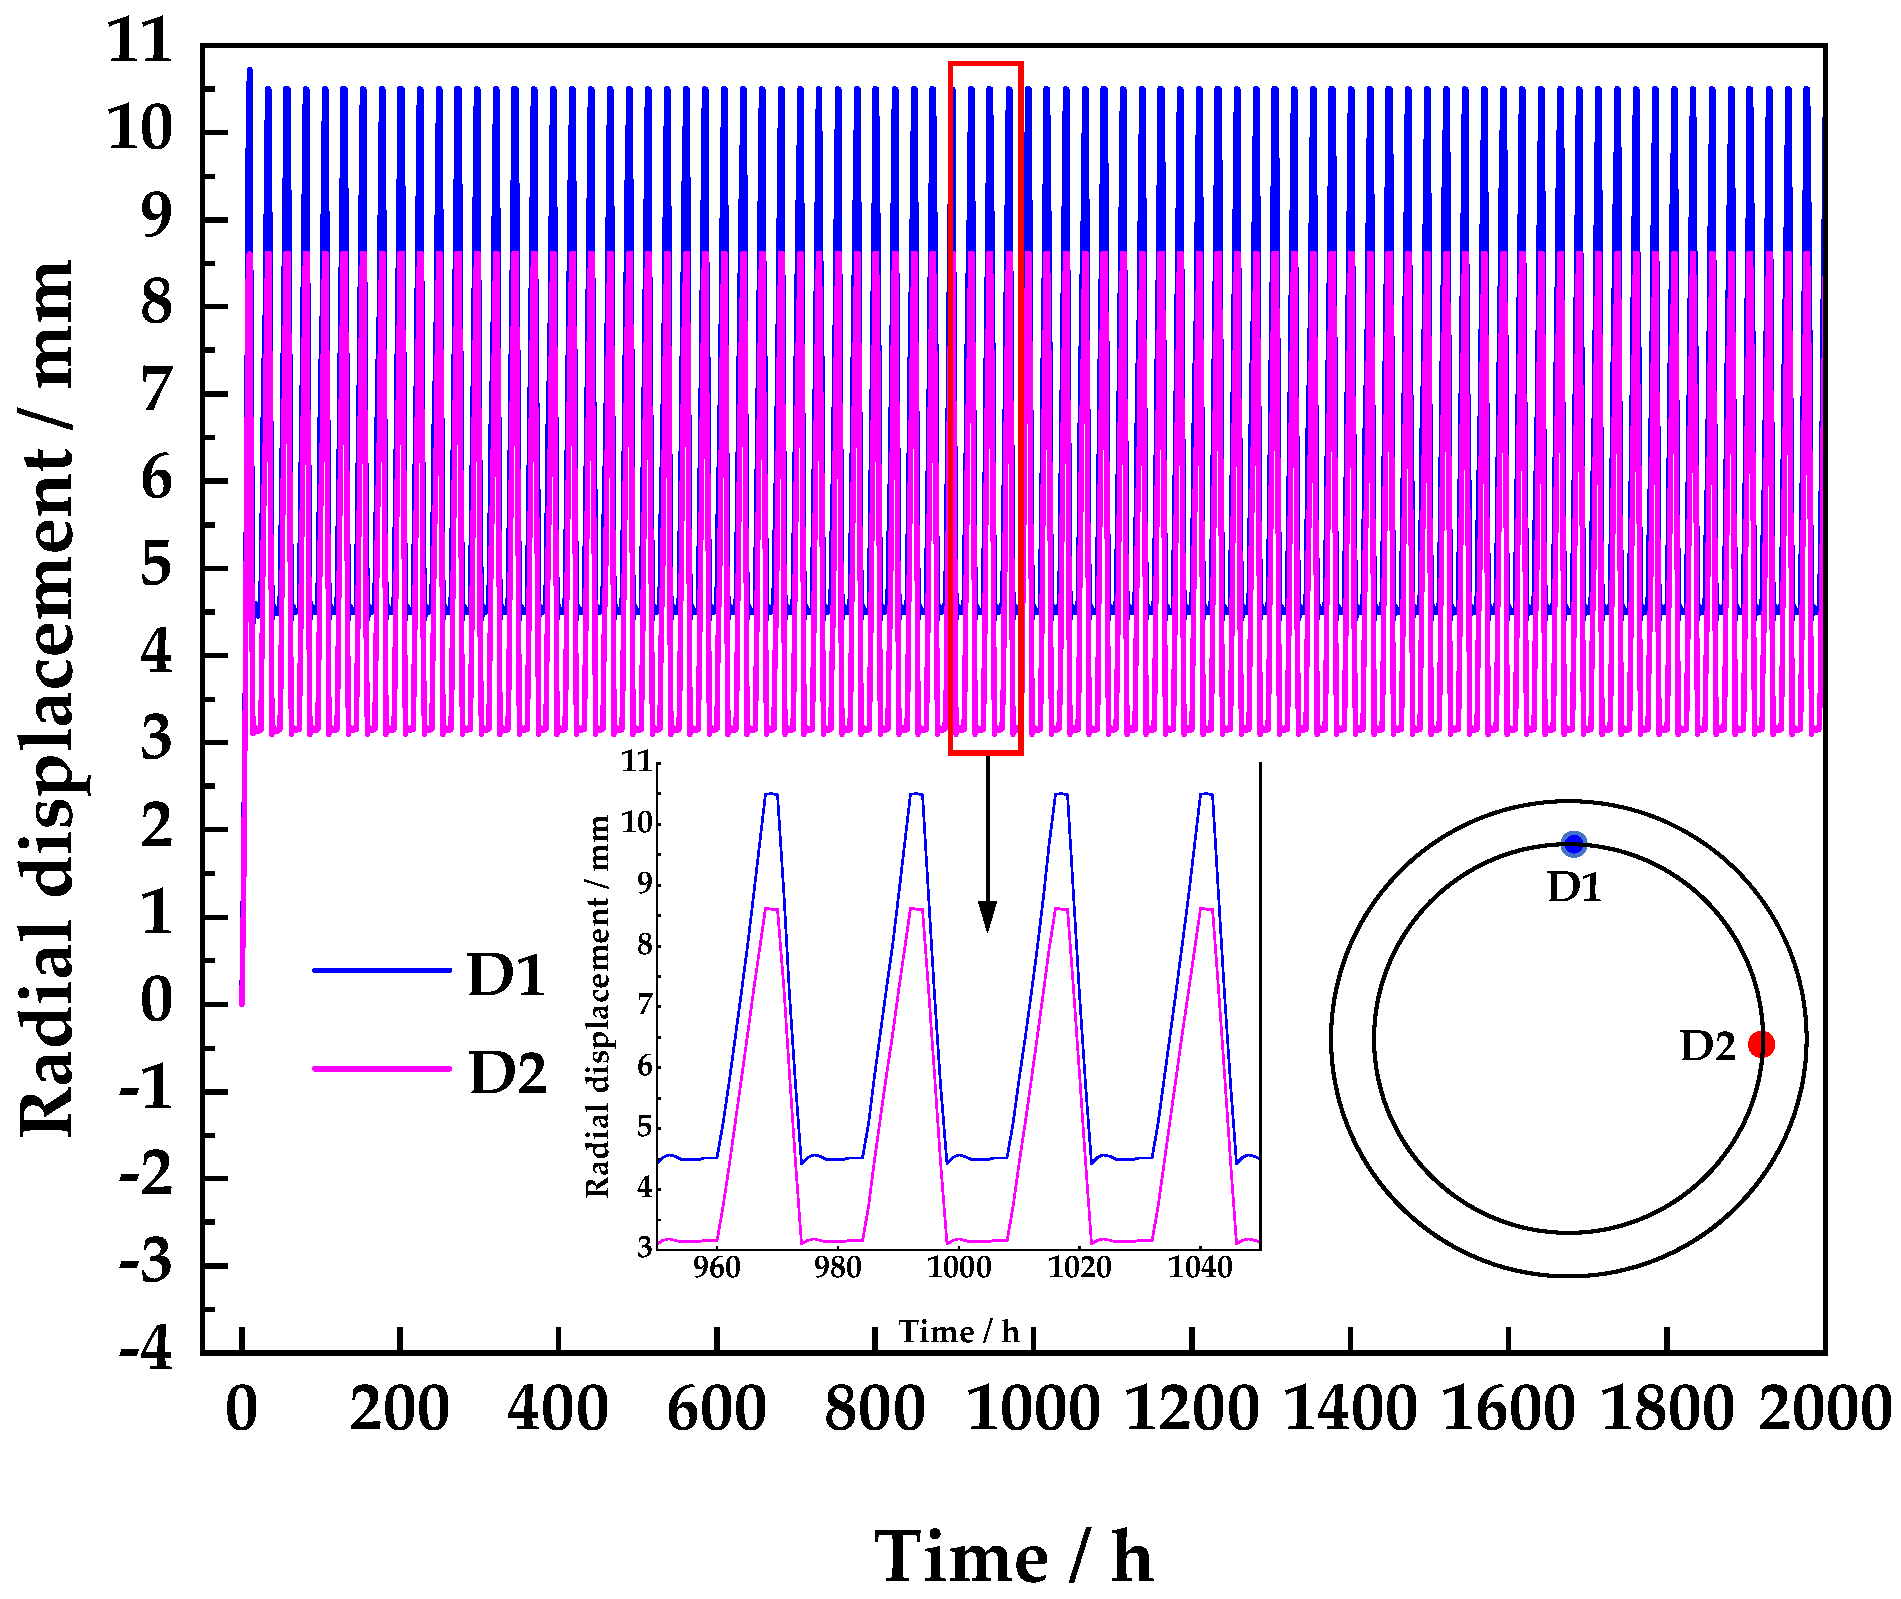
  • During the first inflation process, the concrete lining will crack and cause a large displacement. During the subsequent filling and deflation process, the maximum displacement of the top lining of the LRC is stable at 10.50 mm, which will have a negative impact on the sealing of the cavern. Hence, the lining should take relevant measures to limit concrete cracking, such as adding fibers, using ribbed steel bars, increasing the reinforcement ratio, etc.
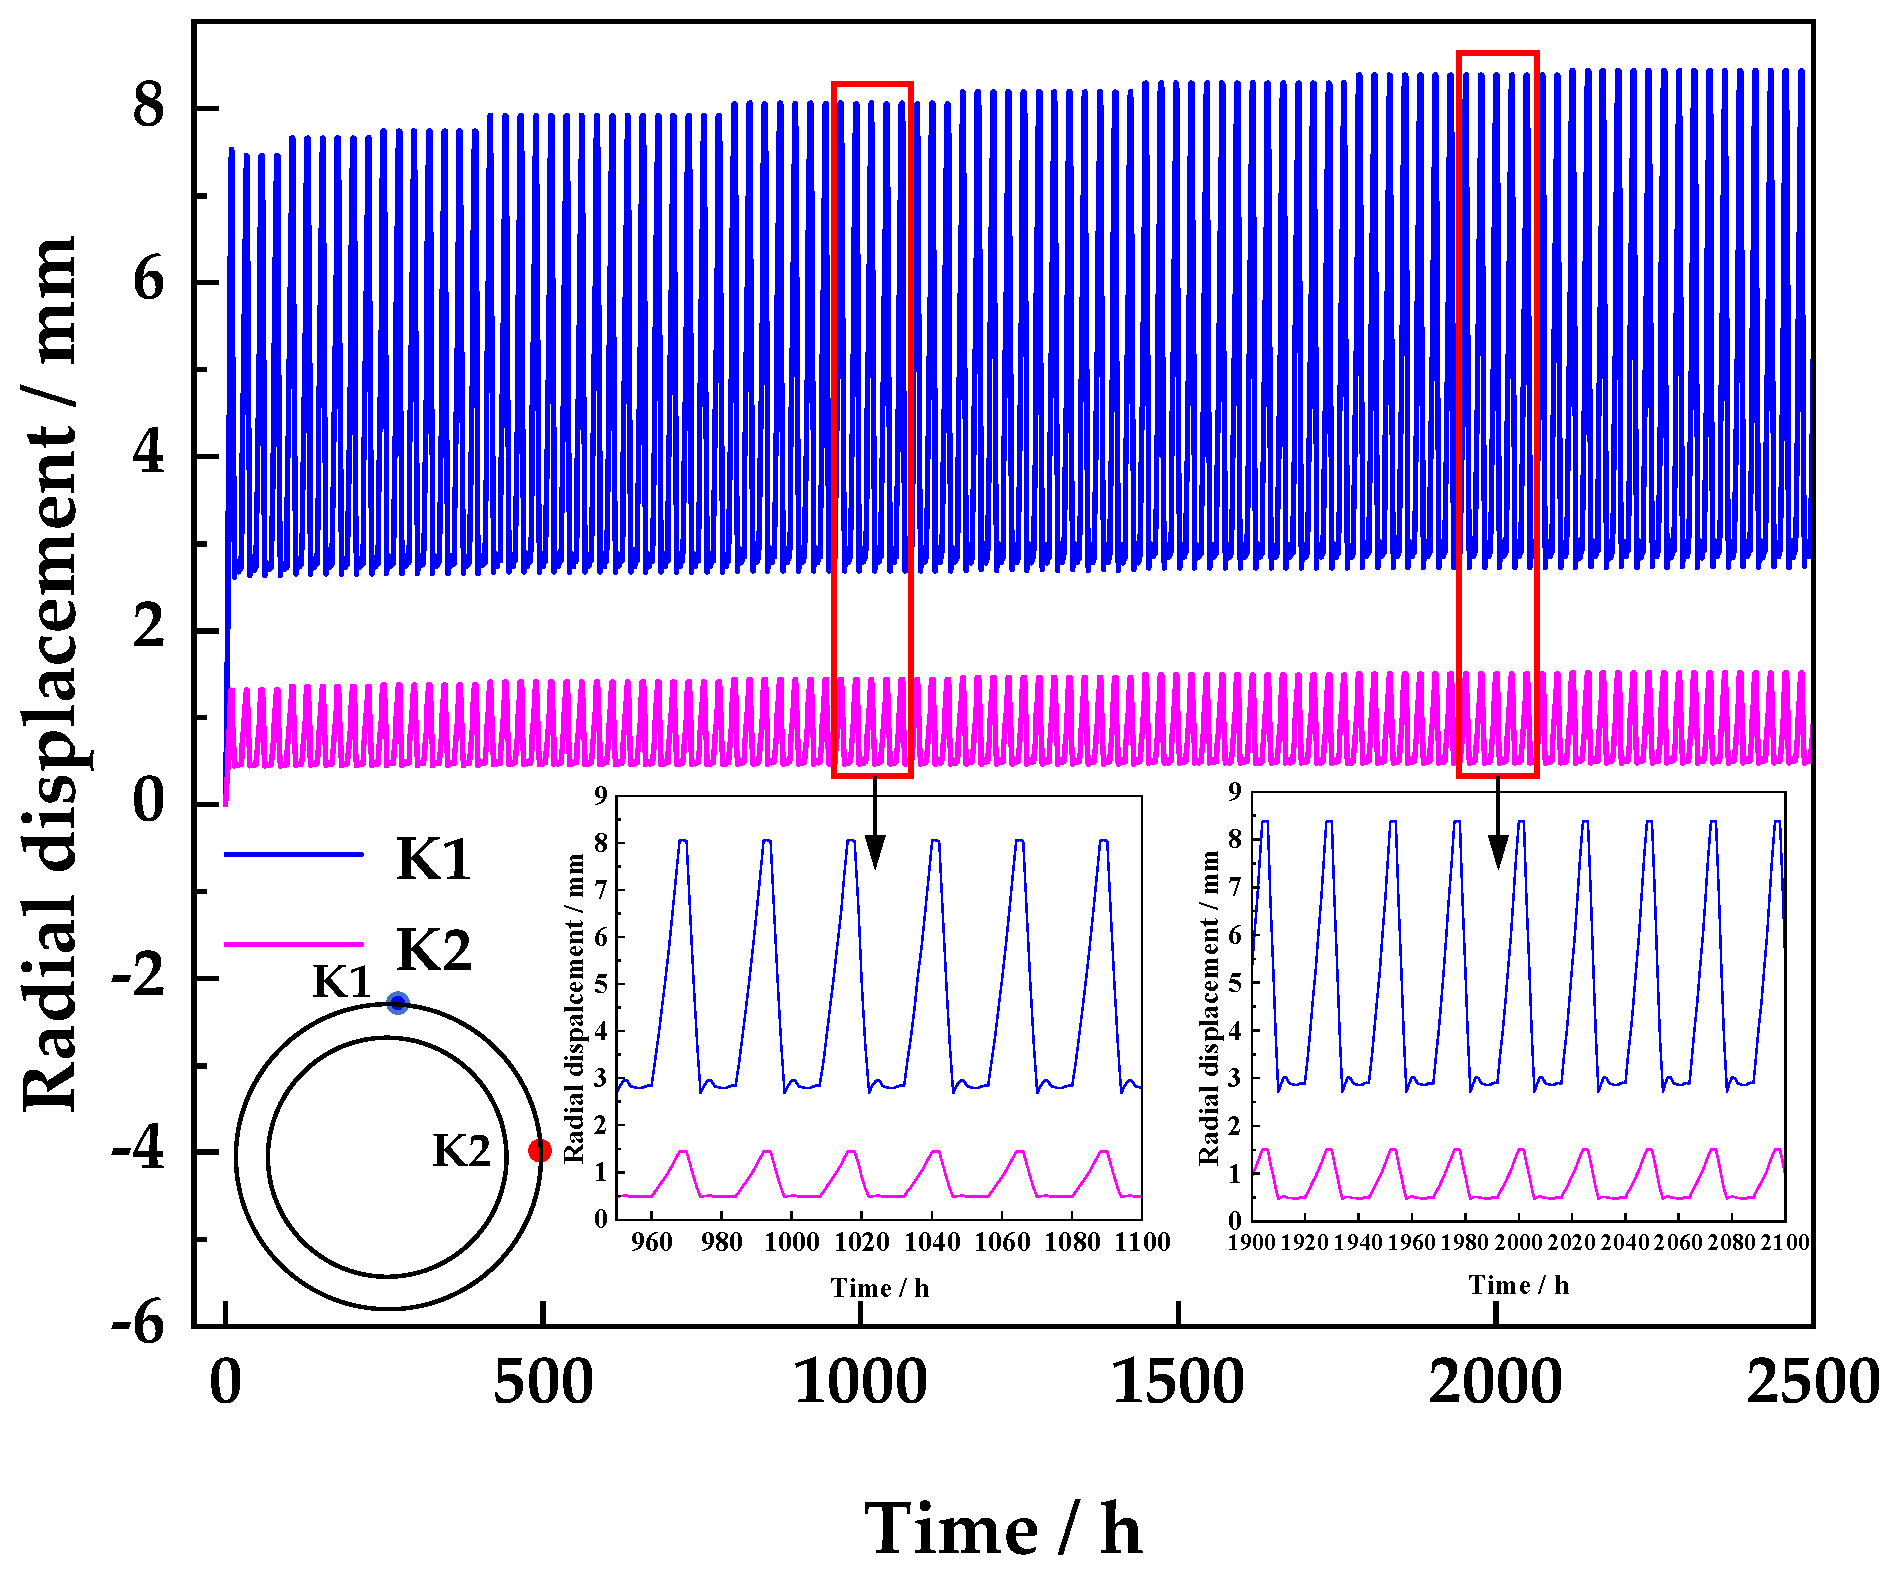
  • During the cyclic charging and deflating process, the vertical displacement of the LRC will slowly increase. When the charging and deflating cycle is calculated 100 times, the vertical radial displacement of the rock mass is 8.39 mm, which is greater than the 7.53 mm during the first inflation. This indicates that the deformation of the rock mass of the LRC is a dynamically increasing process during the long-term cyclic filling and deflating process. In the process of designing and calculating the LRC, the calculated value of the last charging and deflating cycle of the design life should be used.
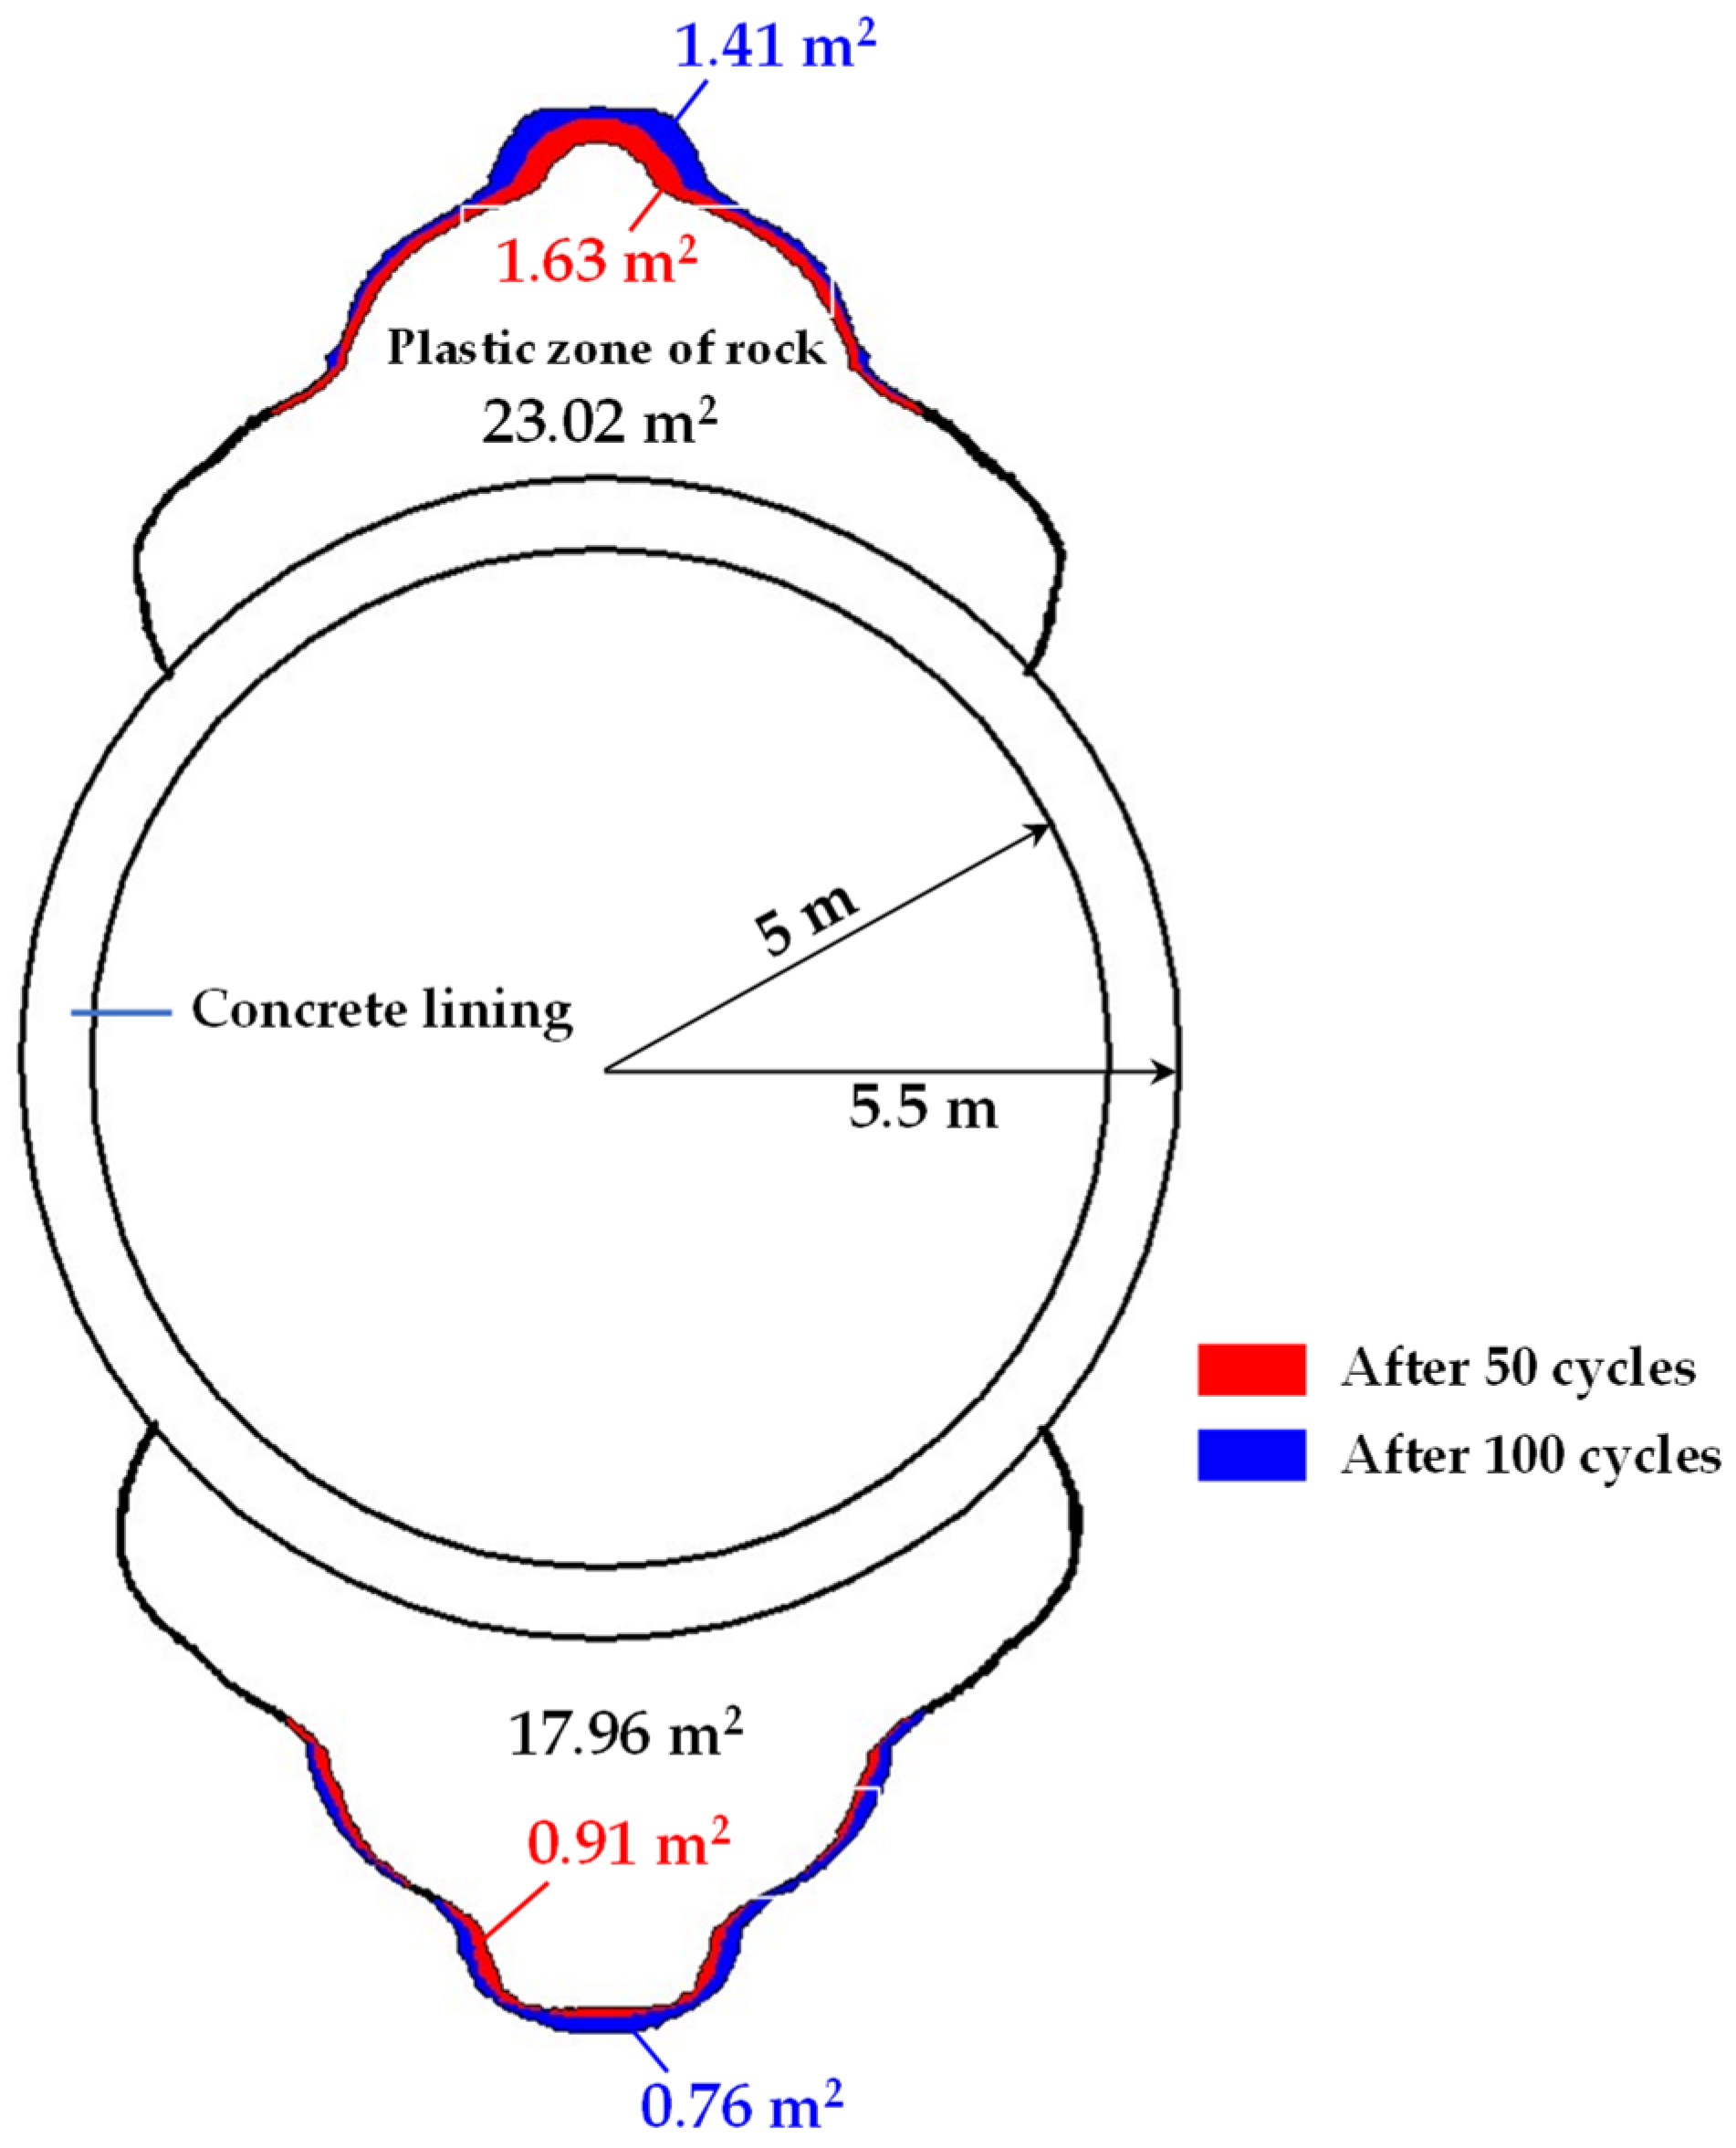
  • The vertical displacement of the rock mass is greater than the horizontal direction. The vertical direction of the rock mass will generate a hoop tensile stress and produce plastic deformation. The plastic zone of the rock mass increases with the number of cycles, and the plastic zone of the rock mass is enlarged by 4.71 m2, about 11.49% for 100 cycles compared to the first cycle.

Author Contributions

Methodology, Software, Validation, Formal analysis, Writing—original draft, S.L.; Conceptualization, Resources, Writing—review and editing, D.Z. All authors have read and agreed to the published version of the manuscript.

Funding

This work was funded by the Graduate Student Scientific Research and Innovation Project of Ningbo University (Grant No. IF2024039).

Data Availability Statement

The original contributions presented in the study are included in the article, further inquiries can be directed to the corresponding author.

Conflicts of Interest

The authors declare no conflicts of interest.

References

  1. Si, X.; Li, Z.; Yang, H. Auxiliary decision making method for energy storage configuration under uncertainty. Sci. Technol. Eng. 2021, 21, 2699–2704. [Google Scholar]
  2. Zhang, L.; Ye, T.; Xin, Y. Problems and measures of power grid accommodating large scale wind power. Proc. Chin. Soc. Electr. Eng. 2010, 30, 1–9. [Google Scholar]
  3. Bazdar, E.; Sameti, M.; Nasiri, F.; Haghighat, F. Compressed air energy storage in integrated energy systems: A review. Renew. Sustain. Energy Rev. 2022, 167, 112701. [Google Scholar] [CrossRef]
  4. Budt, M.; Wolf, D.; Span, R.; Yan, J. A review on compressed air energy storage: Basic principles, past milestones and recent developments. Appl. Energy 2016, 170, 250–268. [Google Scholar] [CrossRef]
  5. Wang, Z.; Fang, G.; Wen, X.; Tan, Q.; Zhang, P. Coordinated operation of conventional hydropower plants as hybrid pumped storage hydropower with wind and photovoltaic plants. Energy Convers. Manag. 2023, 277, 116654. [Google Scholar] [CrossRef]
  6. Rehman, S.; Al-Hadhrami, L.M.; Alam, M.M. Pumped hydro energy storage system: A technological review. Renew. Sustain. Energy Rev. 2015, 44, 586–598. [Google Scholar] [CrossRef]
  7. Sun, Z.; Zhang, J.; Luo, H.; Yao, Y.; Wang, N. Superior capacitive energy-storage performance in Pb-free relaxors with a simple chemical composition. J. Am. Chem. Soc. 2023, 145, 6194–6202. [Google Scholar] [CrossRef] [PubMed]
  8. Gu, H.; Chen, Y.; Yao, X.; Huang, L.; Zou, D. Review on heat pump (HP) coupled with phase change material (PCM) for thermal energy storage. Chem. Eng. J. 2023, 455, 140701. [Google Scholar] [CrossRef]
  9. Liu, K.; Yuan, Z.F.; Zhao, H.X.; Shi, C.H.; Zhao, F. Properties and applications of shape-stabilized phase change energy storage materials based on porous material support—A review. Mater. Today Sustain. 2023, 21, 100336. [Google Scholar] [CrossRef]
  10. Tong, Z.; Cheng, Z.; Tong, S. A review on the development of compressed air energy storage in China: Technical and economic challenges to commercialization. Renew. Sustain. Energy Rev. 2021, 135, 110178. [Google Scholar] [CrossRef]
  11. Razmi, A.R.; Soltani, M.; Ardehali, A.; Gharali, K. Design, thermodynamic, and wind assessments of a compressed air energy storage (CAES) integrated with two adjacent wind farms: A case study at Abhar and Kahak sites, Iran. Energy 2021, 221, 119902. [Google Scholar] [CrossRef]
  12. Olabi, A.G.; Wilberforce, T.; Ramadan, M.; Abdelkareem, M.A.; Alami, A.H. Compressed air energy storage systems: Components and operating parameters—A review. J. Energy Storage 2021, 34, 102000. [Google Scholar] [CrossRef]
  13. Jafarizadeh, H.; Soltani, M.; Nathwani, J. Assessment of the Huntorf compressed air energy storage plant performance under enhanced modifications. Energy Convers. Manag. 2020, 209, 112662. [Google Scholar] [CrossRef]
  14. Davis, L.; Schainker, R. Compressed air energy storage (caes): Alabama electric cooperative mcintosh plant-overview and operational history. In Proceedings of the Electricity Storage Association Meeting, Washington, DC, USA, 2–3 November 2006. [Google Scholar]
  15. Yang, C.; Wang, T. Advance in deep underground energy storage. Chin. J. Rock Mech. Eng. 2022, 41, 1729–1759. [Google Scholar]
  16. Wan, M.; Ji, W.; Shang, H. Key issues and treatment technologies of underground salt cavern prospecting for compressed air energy storage. South. Energy Constr. 2023, 10, 26–31. [Google Scholar]
  17. Kim, H.M.; Rutqvist, J.; Jeong, J.H.; Choi, B.H. Characterizing excavation damaged zone and stability of pressurized lined rock caverns for underground compressed air energy storage. Rock Mech. Rock Eng. 2013, 46, 1113–1124. [Google Scholar] [CrossRef]
  18. Shidahara, T.; Nakagawa, K.; Ikegawa, Y. Demonstration Study for the Compressed Air Energy Storage Technology by the Hydraulic Confining Method at the Kamioka Testing Site; Abiko Research Laboratory: Abiko, Japan, 2001. [Google Scholar]
  19. Li, P.; Jiang, Z.; Xia, C. Research on Key Technologies for the Construction of High-Pressure Sealed Underground Gas Storage for Compressed Air Energy Storage Power Stations; China Power Construction Group Zhongnan Survey and Design Institute Co., Ltd.: Changsha, China, 2018. [Google Scholar]
  20. Jiang, Z.-M.; Li, P.; Zhao, H.-B. Experimental study on performance of shallow rock cavern for compressed air energy storage. Rock Soil Mech. 2020, 41, 235–241. [Google Scholar]
  21. Xu, Y.J.; Zhou, S.W.; Xia, C.C.; Zhao, H.; Xue, X. Three-dimensional thermo-mechanical analysis of abandoned mine drifts for underground compressed air energy storage: A comparative study of two construction and plugging schemes. J. Energy Storage 2021, 39, 102696. [Google Scholar] [CrossRef]
  22. Xu, X.L.; Karakus, M. A coupled thermo-mechanical damage model for granite. Int. J. Rock Mech. Min. Sci. 2018, 103, 195–204. [Google Scholar] [CrossRef]
  23. Zhou, S.W.; Xia, C.C.; Hu, Y.S.; Zhou, Y.; Zhang, P.Y. Damage modeling of basaltic rock subjected to cyclic temperature and uniaxial stress. Int. J. Rock Mech. Min. Sci. 2015, 77, 163–173. [Google Scholar] [CrossRef]
  24. Zhou, S.W.; Xia, C.C.; Zhao, H.B.; Mei, S.H.; Zhou, Y. Statistical damage constitutive model for rocks subjected to cyclic stress and cyclic temperature. Acta Geophys. 2017, 65, 893–906. [Google Scholar] [CrossRef]
  25. Miao, S.J.; Yang, P.J.; Hui, W.; Liang, M.; Wang, Y. Study on fatigue rheological damage model of siltstone under cyclic loading. Eng. Mech. 2022, 39, 70–80. [Google Scholar]
  26. Li, Z.; Yang, F.; Fan, J.; Jiang, D.; Ambre, J. Fatigue effects of discontinuous cyclic loading on the mechanical characteristics of sandstone. Bull. Eng. Geol. Environ. 2022, 81, 336. [Google Scholar] [CrossRef]
  27. Jiang, Z.; Qin, S.; Tang, D. Numerical study on cumulative damage characteristics of surrounding rock of compressed air energy storage underground gas storage. Chin. J. Geotech. Eng. 2020, 42, 230–238. [Google Scholar]
  28. Yuan, X.; Liu, H.; Liu, J. Constitutive model of non-penetrating fractured rock mass based on macro-mesoscopic damage coupling. Rock Soil Mech. 2015, 36, 2804–2814. [Google Scholar]
  29. Huang, Z.Y.; Wagner, D.; Bathias, C. Cumulative fatigue damage in low cycle fatigue and gigacycle fatigue for low carbon–manganese steel. Int. J. Fatigue 2011, 33, 115–121. [Google Scholar] [CrossRef]
  30. Li, S.; Xu, J.; Tao, Y. Rock low-cycle fatigue damage model and damage variable expression method. Rock Soil Mech. 2009, 30, 1611–1614+1619. [Google Scholar]
  31. Yang, G.; Xie, D. Coupling analysis on the macro-damage and meso-damage of rock masses. In Proceedings of the Sixth National Conference on Rock Mechanics and Engineering, Wuhan, China, 2 October 2000; Volume 10. [Google Scholar]
  32. Lemaitre, J. A Course on Damage Mechanics; Springer Science & Business Media: Berlin/Heidelberg, Germany, 1996. [Google Scholar]
  33. Jing, H.; Wu, J.; Yin, Q.; Wang, K. Deformation and failure characteristics of anchorage structure of surrounding rock in deep roadway. Int. J. Min. Sci. Technol. 2020, 30, 593–604. [Google Scholar] [CrossRef]
  34. Wu, J.; Jing, H.; Gao, Y.; Meng, Q.; Yin, Q.; Du, Y. Effects of carbon nanotube dosage and aggregate size distribution on mechanical property and microstructure of cemented rockfill. Cem. Concr. Compos. 2022, 127, 104408. [Google Scholar] [CrossRef]
  35. Wu, J.; Wong, H.S.; Zhang, H.; Yin, Q.; Jing, H.; Ma, D. Improvement of cemented rockfill by premixing low-alkalinity activator and fly ash for recycling gangue and partially replacing cement. Cem. Concr. Compos. 2024, 145, 105345. [Google Scholar] [CrossRef]
Figure 1. Schematic diagram of strain equivalent calculation: (a) A rock containing both initial damage and fatigue damage; (b) A rock containing only initial damage; (c) A rock containing only fatigue damage; (d) A rock containing no damage at all.
Energies 17 05908 g001
Figure 2. Flowchart of numerical calculation.
Energies 17 05908 g002
Figure 3. Fissure rock sample.
Energies 17 05908 g003
Figure 4. Uniaxial compression fatigue test.
Energies 17 05908 g004
Figure 5. Comparison of the results.
Energies 17 05908 g005
Figure 6. Finite element model.
Energies 17 05908 g006
Figure 7. Elastic modulus of the rock mass changes with cycle time.
Energies 17 05908 g007
Figure 8. Air pressure changes with time.
Energies 17 05908 g008
Figure 9. Variation curve of stress of concrete lining: (a) Variation curve of maximum tensile stress of concrete lining; (b) Variation curve of maximum compressive stress of concrete lining.
Energies 17 05908 g009
Figure 10. Distribution of cracks in concrete lining.
Energies 17 05908 g010
Figure 11. Variation curve of radial displacement at lining measurement points.
Energies 17 05908 g011
Figure 12. Variation curve of stress of rock: (a) Variation curve of tensile stress at rock measurement points; (b) Variation curve of compressive stress at rock measurement points.
Energies 17 05908 g012
Figure 13. Variation curve of radial displacement at rock measurement points.
Energies 17 05908 g013
Figure 14. Changes in areas of plastic zone.
Energies 17 05908 g014
Table 1. Numerical calculation parameters.
NameParameter Data
Density2350 kg/m3
Initial elastic modulus6.0 GPa
Poisson’s ratio0.28
Internal friction angle45°
Cohesion1.5 MPa
Compressive strength60.8 MPa
Table 2. Damage model parameters [27].
SymbolParameter Data
ρv0.16 cm−3
α45°
φ
l0.5 cm
h2 cm
f1.258
w5 cm
Nf20,000
b0.72
c0.65
Table 3. Physical and mechanical parameters of cavern materials.
MaterialsYield CriteriaElastic Modulus
E/GPa
Poisson’s Ratio
v
Density
ρ/(kg·m3)
Cohesion
c/MPa
Internal Friction Angle ψ/(°)Thickness
d/cm
Rubber sealing layerLinear elasticity10.600.45920--0.37
Plain concrete (C30)W-W five parameters300.202500--50
Initial supportW-W five parameters250.202500--18
Rock massD-P6.200.2826201.545-
Disclaimer/Publisher’s Note: The statements, opinions and data contained in all publications are solely those of the individual author(s) and contributor(s) and not of MDPI and/or the editor(s). MDPI and/or the editor(s) disclaim responsibility for any injury to people or property resulting from any ideas, methods, instructions or products referred to in the content.

