Article

Alternative Analyzers for the Measurement of Gaseous Compounds During Type-Approval of Heavy-Duty Vehicles

by
Ricardo Suarez-Bertoa
1,*,
Roberto Gioria
1,*,
Christian Ferrarese
1,2,
Lorenzo Finocchiaro
1 and
Barouch Giechaskiel
1
1
European Commission, Joint Research Centre (JRC), 21027 Ispra, Italy
2
ETSI Minas y Energía, Universidad Politécnica de Madrid, c/Rios Rosas 21, 28003 Madrid, Spain
*
Authors to whom correspondence should be addressed.
Energies 2024, 17(22), 5676; https://doi.org/10.3390/en17225676
Submission received: 16 October 2024 / Revised: 30 October 2024 / Accepted: 8 November 2024 / Published: 13 November 2024
(This article belongs to the Section B: Energy and Environment)

Abstract

:
Emissions standards describe the fuels, the procedures, and, among others, the analyzers to be used for the measurement of the different compounds during the type-approval of heavy-duty engines and vehicles. Traditionally, NOx, CO, hydrocarbons, and CO2 were the gaseous compounds measured within the Euro standard, with the later addition of CH4 and NH3. Euro 7, introduced in early 2024, expanded those compounds, requiring the measurement of N2O and HCHO. With an increasing number of molecules that need to be measured and introducing carbonless fuels, such as hydrogen, that present different requirements compared to carbon-based fuels, the test procedure needs to be updated. The performances of three laboratory-grade instruments and three portable emissions measurement systems based on Fourier-transformed infrared (FTIR) or quantum cascade laser infrared (QCL-IR) technologies were investigated while measuring from the tailpipe of a Diesel engine and a compressed natural gas (CNG) vehicle. All instruments presented good agreement when emissions of NOx, CO, CH4, NH3, N2O, HCHO, and CO2 were compared using: Z-score, F-test and two tail t-test of student. Water concentration measured by the four FTIRs was also in good agreement. Moreover, the dry emissions of CO2 and CO measured by the laboratory non-dispersive infrared (NDIR) and corrected using water were a few percentages different from those obtained using the regulated carbon-based approach. The results indicate that all the investigated systems are suitable for the measurement of the investigated gaseous compounds, including CO2 and H2O.

1. Introduction

Pollutant emissions from road transport have been regulated in Europe since the early 1970s [1,2,3]. Heavy-duty vehicles, which are defined as those with a gross vehicle weight rating (GVWR) exceeding 3.5 tons or designed to carry more than nine people with a GVWR over 5 tons, are subject to engine-based regulations. To ensure compliance, engines are tested in a laboratory setting under standardized conditions using predefined duty cycles [4,5,6,7]. This approach is used because the same engine can be installed in various types of vehicles with differing operational profiles, such as a refuse collection truck or a long-haul truck, highlighting the need for a standardized testing protocol. The exhaust emitted by the engine is transferred into a constant volume dilution tunnel, sampled into Tedlar bags from which the measurements of gaseous components are performed. Over time, the procedures for heavy-duty vehicles have evolved, and today gaseous pollutants are also allowed to be measured directly from the systems’ tailpipe. Since the introduction of the emission standard Euro VI [7], emissions from vehicles are also measured on-road during the homologation phase and the in-service control using portable emissions measurement systems (PEMS). The recent introduction of the Euro 7 extended the list of criteria pollutants (i.e., NOx, CO, hydrocarbons, CH4, and NH3) to be measured in the laboratory from engines and on-road from vehicles. Euro 7 requires the measurement of N2O and HCHO (used to calculate the emissions of non-methane organic gases). It also requires the on-road measurement of NH3 that for Euro VI vehicles was only measured in the laboratory from the engines.
The Euro VI regulation prescribes a number of techniques to be used for the measurement of the different gaseous components in the laboratory and/or using PEMS. It includes a chemiluminescence detector (CLD) and a non-dispersive ultraviolet (NDUV) to measure NOx; a flame ionization detector (FID) to measure hydrocarbons (THC) and methane; a non-dispersive infrared (NDIR) to measure CO and CO2; and Fourier-transformed infrared (FTIR) [8] and laser-based technologies, including quantum cascade laser—QCL-IR, to measure NH3. While for the criteria pollutants there are many studies in the literature [9], for NH3 and other non-regulated pollutants less [10]. Furthermore, there is a lack of studies that have evaluated the measurement uncertainty of PEMS for heavy-duty applications [11,12].
The techniques used to measure the concentrations of these compounds can be wet and/or dry, i.e., with or without removed water from the exhaust [13]. When the measurements are performed under dry conditions, the measured concentrations have to be corrected to wet conditions. This is commonly known as the dry-to-wet correction (see Equation (1)), and the regulation allows to perform it using correcting formulae (EU 582/2009), the most common of which is the carbon-based equation (see Equation (2)). This equation corrects the measured concentrations from dry to wet bases using the fuel’s carbon content and the concentration of CO2 and CO measured from the exhaust. It assumes that no condensation or evaporation is taking place at the system’s tailpipe [14].
cw = kw × cd
where cd is the dry concentration (in ppm or percent volume) and kw is the dry/wet correction factor (kw,r or kw,e, depending on the respective equation used)
k w , r = 1 1 + α × 0.005 × ( c C O 2 + c C O ) k w 1 × 1.008
where kw,r is the carbon-based dry/wet correction factor; α is the molar hydrogen ration of the fuel; cCO2 is the CO2 concentration (percent); and cCO is the CO concentration (percent) and
k w 1 = 1.608 × H a 1000 + ( 1.608 × H a )
where Ha is the intake air humidity, g water per kg dry air.
The techniques described in the Euro VI standard allow for the wet measurement of all compounds using PEMS and most of the criteria pollutants in the laboratory. However, CO2 measurement is only allowed using dry exhaust gas. While this does not pose a problem for carbon fuels (e.g., Diesel and natural gas but also ethanol, fatty acid methyl ester (FAME), or hydrogenated vegetable oil (HVO) [15]), because Equation (1) can be used for the dry-to-wet correction, the same does not hold true when using carbonless energy vectors, such as hydrogen or ammonia [16,17,18]. Hence, two elements could be improved in the regulation: (i) include other wet-based measurement techniques and (ii) use other approaches to correct dry measurement, the most obvious of which would be the use of Equation (4), which requires the simultaneous measurement of water from the exhaust.
k w , e = 1 c H 2 O 100
where kw,e is the dry/wet water-based correction factor; cH2O is the concentration of H2O in the raw exhaust gas (percent).
Despite significant progress in the field, the majority of gaseous measurement techniques present in the regulations have remained largely unchanged since the introduction of the Euro standards, with the exception of the measurement of ammonia (NH3) and solid particle number (PN), which were introduced as part of the Euro VI standard. Furthermore, the new European emission standard, Euro 7, requires N2O and HCHO to be measured from heavy-duty engines and vehicles’ exhaust. Therefore, the regulation will need to include the analyzers that can be used in Euro 7. In this study, a number of instruments, laboratory-grade and PEMS, using measurement principles based on the two most common technologies used in the emissions research and development departments, FTIR [19,20] and QCL-IR [21,22], were investigated to assess their potential use during homologation of heavy-duty engines and vehicles for the measurement of NOx, CO, CH4, CO2, N2O, and HCHO. NH3 was also measured, but as already indicated, both FTIR and QCL-IR are among the techniques prescribed for the measurement of this compound during type-approval of heavy-duty engines. To this end, two heavy-duty systems, a Diesel engine and a CNG vehicle, using the two most common fuels, were tested in the laboratory under different duty and environmental conditions.
The studied instruments will allow measuring of all the Euro VI and Euro 7 criteria gaseous pollutants using one single system, except for THC that will need to be measured by FID. It should be noted that THC were excluded from the analysis because FTIR and QCL-IR do not appear suitable for the measurement of what regulation defines as THC, i.e., all the carbon-containing molecules detected by the FID at 191 °C, because this would entail: (a) fix, and known, composition of the fuel; (b) consistent emissions across temperatures; (c) and, among other, previous knowledge of the species to be measured so that the QCL-IRs will include the lasers measuring the relevant compounds and the FTIRs include them in their deconvolution libraries. In this regard, previous studies have shown that there can be a high level of variability when comparing emissions measured with an FTIR with those measured with the FID [23].
Finally, the concentrations of water measured with the different FTIR instruments were compared, and the results were used to evaluate the differences in correcting dry CO and CO2 measurements using Equation (4) instead of Equation (2). In case of agreement between these two approaches, it would be possible to suggest introducing Equation (4) in the current regulations to allow correcting dry measurements from the exhaust of engines running on carbonless fuels.
Section 2 (materials and methods) describes the experimental setup, the analyzers used, and the equivalency criteria used for the instrument’s equivalency. Section 3 (Results and Discussion) has two main parts: Section 3.1, measurement of gaseous pollutants and CO2, focuses on the performance of the instruments against the reference instrumentation using the F-test and the two-sided Student test and using the Z-score criteria; Section 3.2, H2O measurement and dry-to-wet correction, presents the agreement between the FTIRs when measuring water concentration from the exhaust together with the impact of this measurement to correct dry measurements of CO and CO2. Findings are summarized in Section 4 with the conclusions.

2. Materials and Methods

Gaseous exhaust emissions of a heavy-duty diesel engine and a heavy-duty CNG vehicle certified under the Euro VI standard were investigated using measurement devices that were either equipped with technologies prescribed by the Euro VI regulation (i.e., CLD, NDUV, NDIR, and FID) and others currently not included for the criteria pollutants, FTIR or QCL-IR. The gaseous compounds investigated included NOx, CO, CH4, CO2, NH3, N2O, HCHO, and H2O. The instruments used and the corresponding molecules measured are summarized in Table 1.
The HD Diesel engine, designed to meet the Euro VI step E standard, was tested on an engine dynamometer under standard conditions (at 25 ± 5 °C and relative humidity of 40–80%) over the regulatory cycle world harmonized transient cycle (WHTC) under cold and hot conditions (i.e., with the oil and coolant temperature below 30 °C and above 70 °C, respectively) and a transposition of an on-road duty cycle meeting the in-service conformity requirements for the engine type (hereinafter referred to as ISC). The main engine features are described in Table 2 together with those of the CNG HD vehicle. The emissions of gaseous compounds were measured undiluted using the laboratory equipment: a CLD HORIBA CLD-02OV-3 to measure NOx, a NDIR HORIBA AIA-11COL to measure CO, a NDIR HORIBA AIA-32CO2 to measure CO2, a laboratory-grade FTIR (IAG Versa06 LP—hereinafter LABFTIR-2), a laboratory-grade QCL-IR (HORIBA MEXA-ONE-XL-NX—hereinafter LABQCL-IR), a PEMS FTIR (AVL MOVE FT—hereinafter PEMSFTIR-1) and a PEMS QCL-IR (HORIBA VERIDRIVE—hereinafter PEMSQCL-IR).
The CNG truck, type-approved as Euro VI step E, was tested at the European Commission Joint Research Centre’s vehicle laboratories in a heavy-duty climatic test cell on a chassis dynamometer. The vehicle was tested under the World harmonized vehicle cycle (WHVC), a rearrangement of the WHTC for vehicle testing. The WHVC were performed under cold and hot conditions. Similar to the engine test, the truck was tested under a laboratory transposition of an on-road test meeting the N3 ISC requirements. The vehicle was tested with the test cell temperature at 23 °C and 0 °C. The vehicle’s oil and coolant temperatures were at the laboratory temperature (±3 °C) at the beginning of the WHVCCold and the ISC tests. Each cycle and ambient condition was tested once with the engine and/or vehicle. The tests performed using the ISC cycles and the different ambient temperatures allowed expanding the performance assessment of the systems under a wider variety of real-world conditions.
The gaseous emissions were measured from the tailpipe using the laboratory equipment, AVL AMA i60, two laboratory-grade FTIRs, the LABFTIR-2, and an AVL SESAM (hereinafter LABFTIR-1), the LABQCL-IR, three PEMS systems: the PEMSQCL-IR, the PEMSFTIR-1, and a portable FTIR (IAG OPS—hereinafter PEMSFTIR-2). During the tests at 0 °C, the laboratory-based instruments were kept out of the test cell, and the PEMS were kept inside the test cell exposed to the same ambient temperature as the vehicle.
The FTIR analyzers measured all the compounds under investigation, including H2O. The PEMSQCL-IR did not measure H2O; and the LABQCL-IR measured the nitrogen-containing molecules, i.e., NO, NO2, NH3, and N2O.
The laboratory instruments were used as reference methods for NOx, CO, CH4, and CO2. In the case of NH3 and N2O, the laboratory-grade FTIRs (FTIR-1 and FTIR-2) and the LABQCL-IR were used as references to compare the PEMSs.
While the detailed technical specifications of the other instruments were not available, they did meet the linearity criteria outlined in the regulation, including a slope of 0.99–1.01, an offset ≤0.5% maximum, R2 ≥ 0.998, and a standard error of estimate ≤1% maximum. In all cases, the t10–90 was between 2 and 2.5 s. Some general features are summarized in Table 3.
The reference analyzer LABNDIR measured CO and CO2 concentrations in dry bases. For the calculation of the emission factors that were used in the comparison and analysis, these concentrations were converted into wet bases using Equations (1)–(3). Moreover, Equation (4) was also used to compare the potential differences that could result when using a different approach for the dry-to-wet correction. For this, water concentrations were measured using the FTIR instrument present in each laboratory (i.e., FTIR-1 in the case of the CNG vehicle tests and FTIR-2 for the Diesel engine).
The emission rates (g/s) for the different gaseous compounds were calculated based on the concentration (ppm) measured with each instrument and the exhaust flow rate (m3/s) calculated by subtracting the dilution air flow introduced into the tunnel, determined with a Venturi system, from the total flow of the dilution tunnel measured by a critical flow Venturi.
The determination of the FTIR and QCL-IR systems equivalency to the reference instruments when measuring NOx, CO, and CO2 was investigated using the F-test and the two-sided Student t-test, with a minimum number of seven tests, as prescribed in UN Regulation 49 (hereinafter UNR 49). The analysis deviates from the regulation because the tests were performed on one engine and one vehicle instead of one single engine, and instead of cycle-weighted emission values, the single values were used. Using the emissions factors from the WHTCCold and the WHTCHot can be considered the worst case because the emissions from WHTCCold usually present higher variability than WHTCHot [28], and using weighted results decreases its contribution as it is weighted at 14%.
The analyses were performed on these compounds because (i) N2O and HCHO are not currently regulated in the EU, and therefore do not have a reference method; and, (ii) in the case of NH3, both analyzers used (FTIR and QCL-IR) are already allowed by the regulation.
The measurements of the molecules using the different instruments and technologies were assessed by investigating the performance of the instruments using the Z-score as an indicator. The Z-score is an indicator used to compare analytical results during laboratory comparisons. It assesses the deviation of each laboratory’s result, which in this study is considered to be each analyzer’s, from the “true” value by comparing it with a standard deviation. Z-score is defined as follows:
Z s c o r e = x i X s
where, for each molecule measured, xi is the measurement of the instrument, X is the consensus value (in this case the average resulting from all the instruments measuring a given molecule), and s is the standard deviation of the consensus value (ISO 17043) [29]. The instrument performance was deemed satisfactory if the absolute value of the Z-score was below 2, uncertain if it fell between 2 and 3, and unsatisfactory if it exceeded 3.

3. Results and Discussion

The Euro VI emissions standard requires measuring NOx emissions using CLD or NDUV, CO, and CO2 emissions using NDIR, CH4 using FID, and NH3 using FTIR or laser-based analyzers, such as QCL-IR. These techniques are used in the laboratory and also during PEMS testing, with the exception of NH3, which for this standard is only measured in the laboratory. The following figures illustrate the brake-specific emissions (g/kWh) of the different compounds measured with the laboratory-grade and PEMS equipment based on FTIR and QCL-IR technologies, along with their absolute difference (mg/kWh) compared to the laboratory instrument of reference. As it will be discussed in more detail for each component in the next paragraphs, the data show relatively small deviations from the instruments prescribed by the current regulations. The absolute Z-score was lower than 2 for all instruments and molecules investigated, indicating that, under this criteria, the performance of the instruments was acceptable. Moreover, according to the results obtained from the F-test and the two-sided Student t-test using the criteria prescribed by the UN R49, the FTIR and QCL-IR systems were found equivalent to the reference systems measuring NOx, CO, and CO2 (see Table S1 in the Supplementary Material).

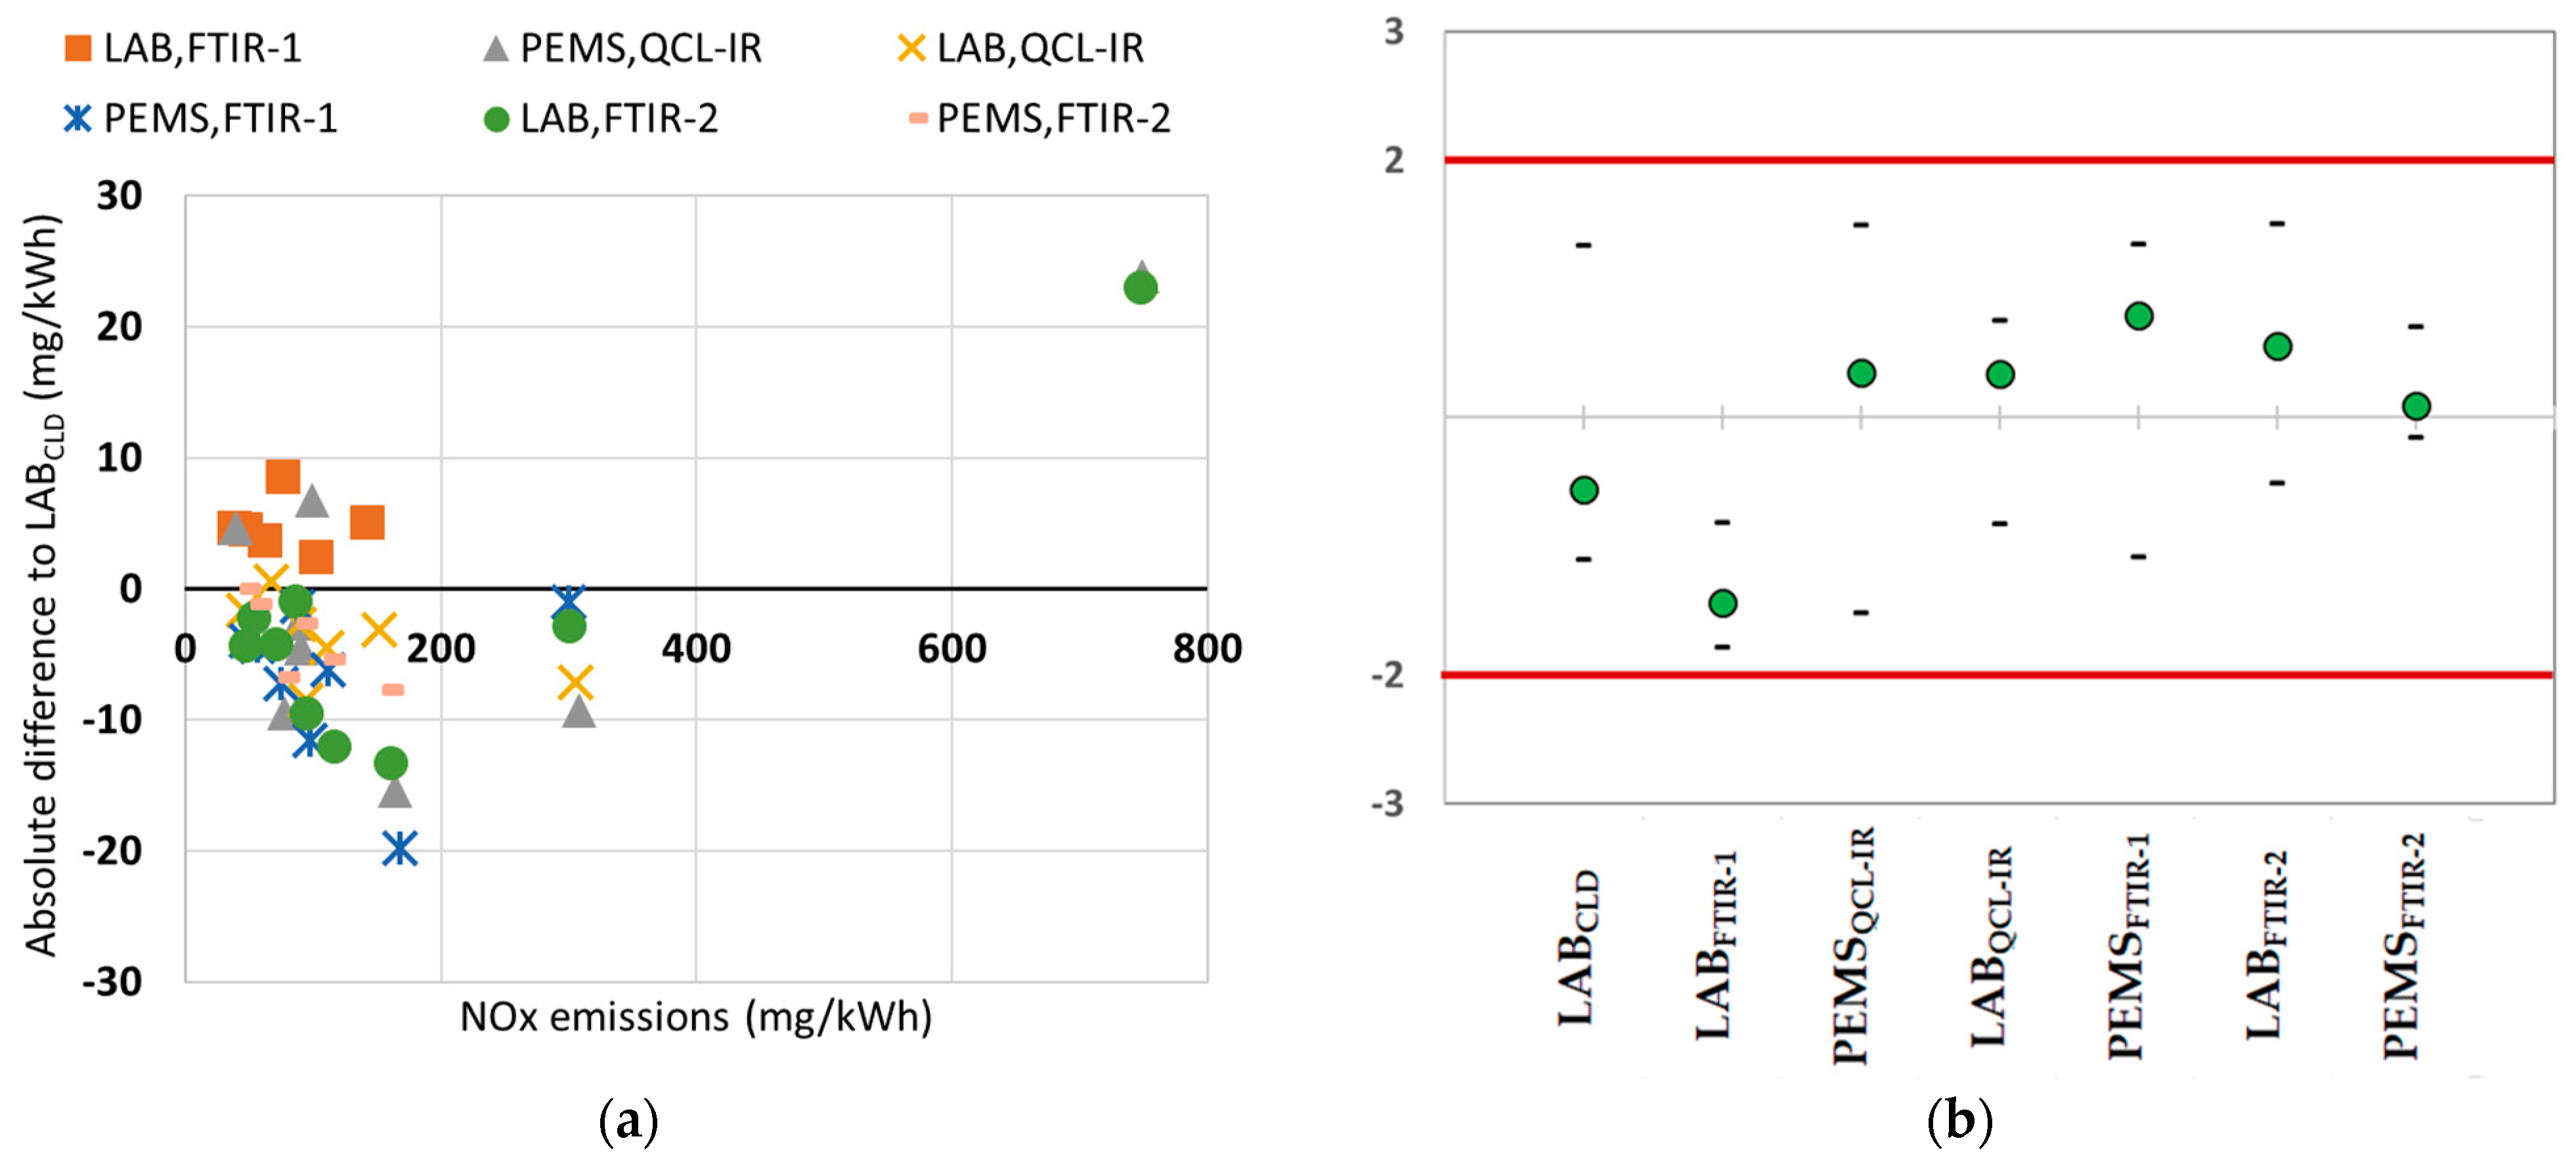
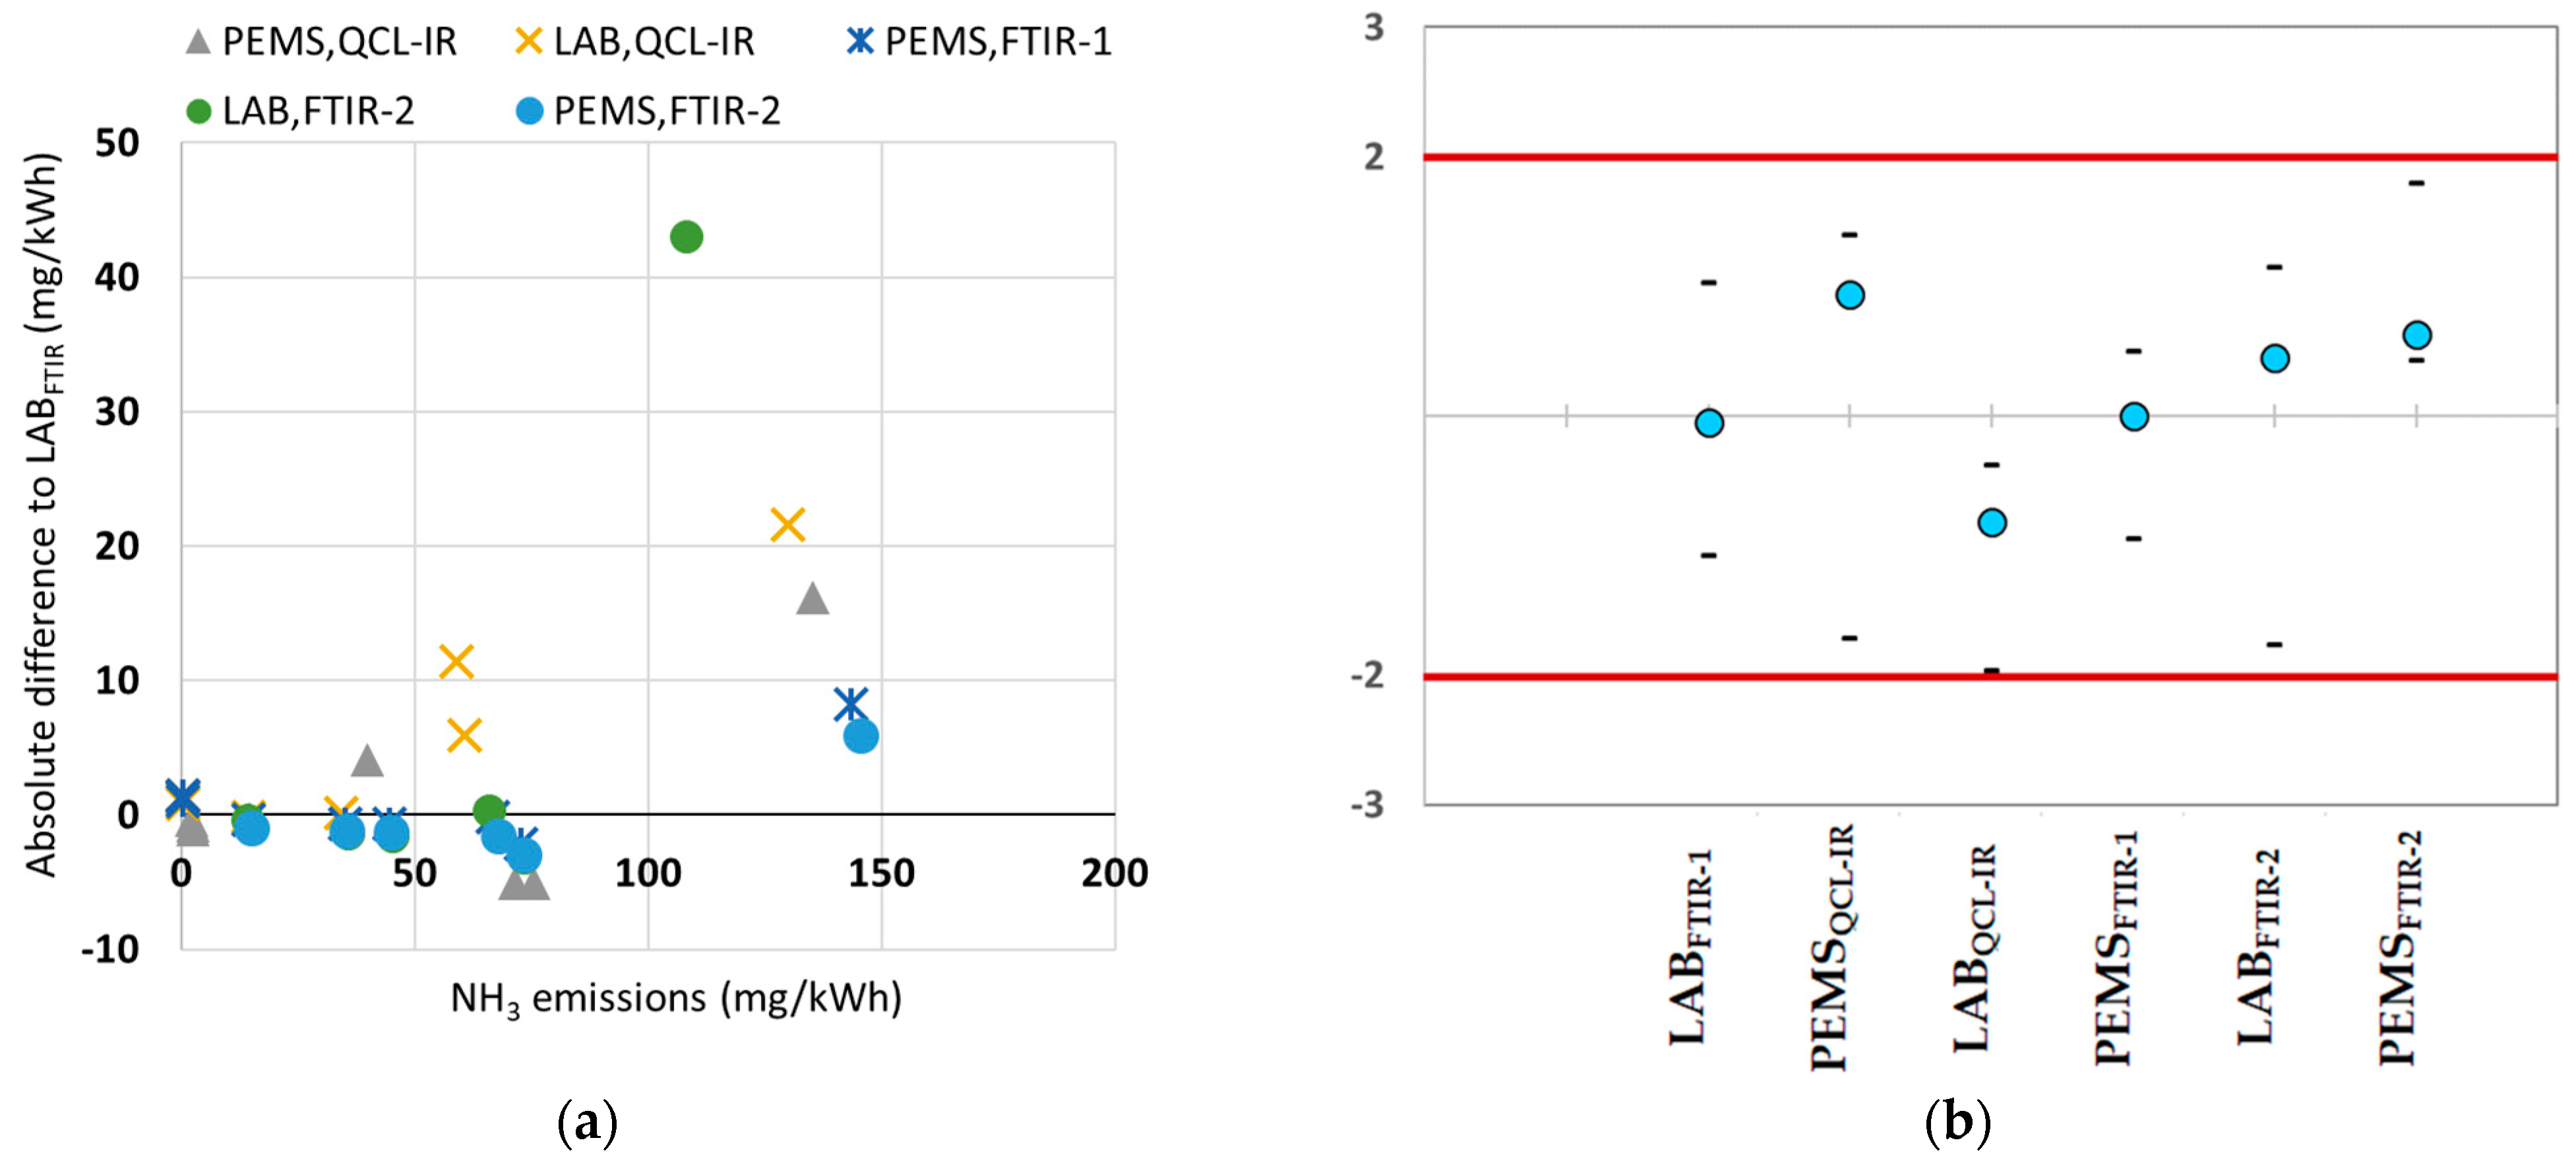
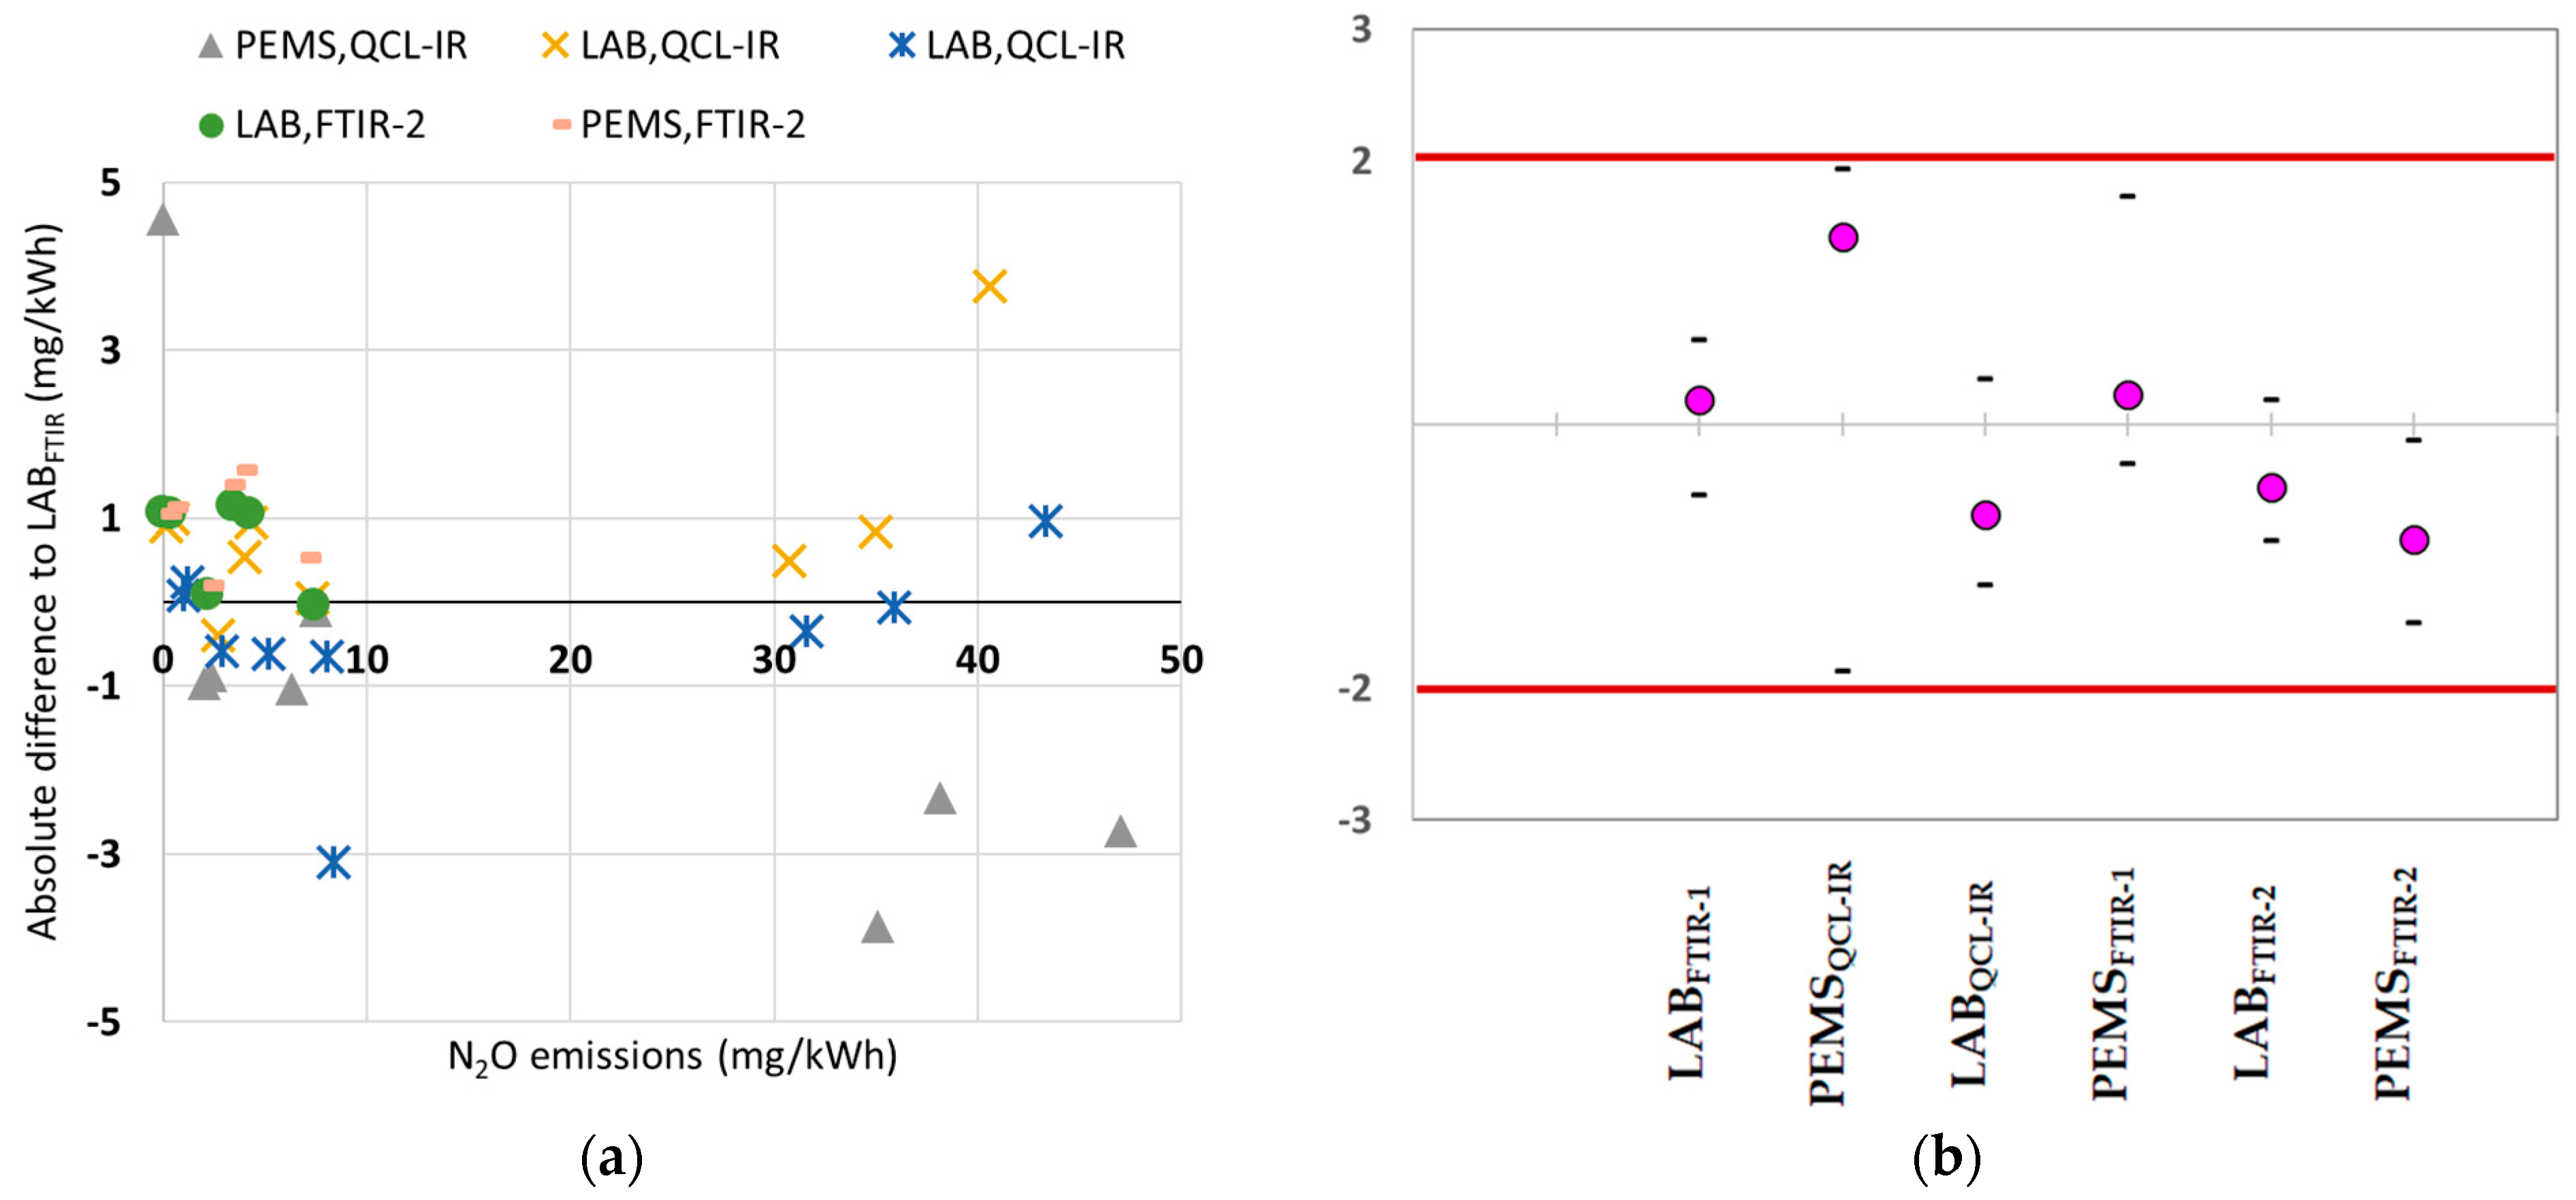
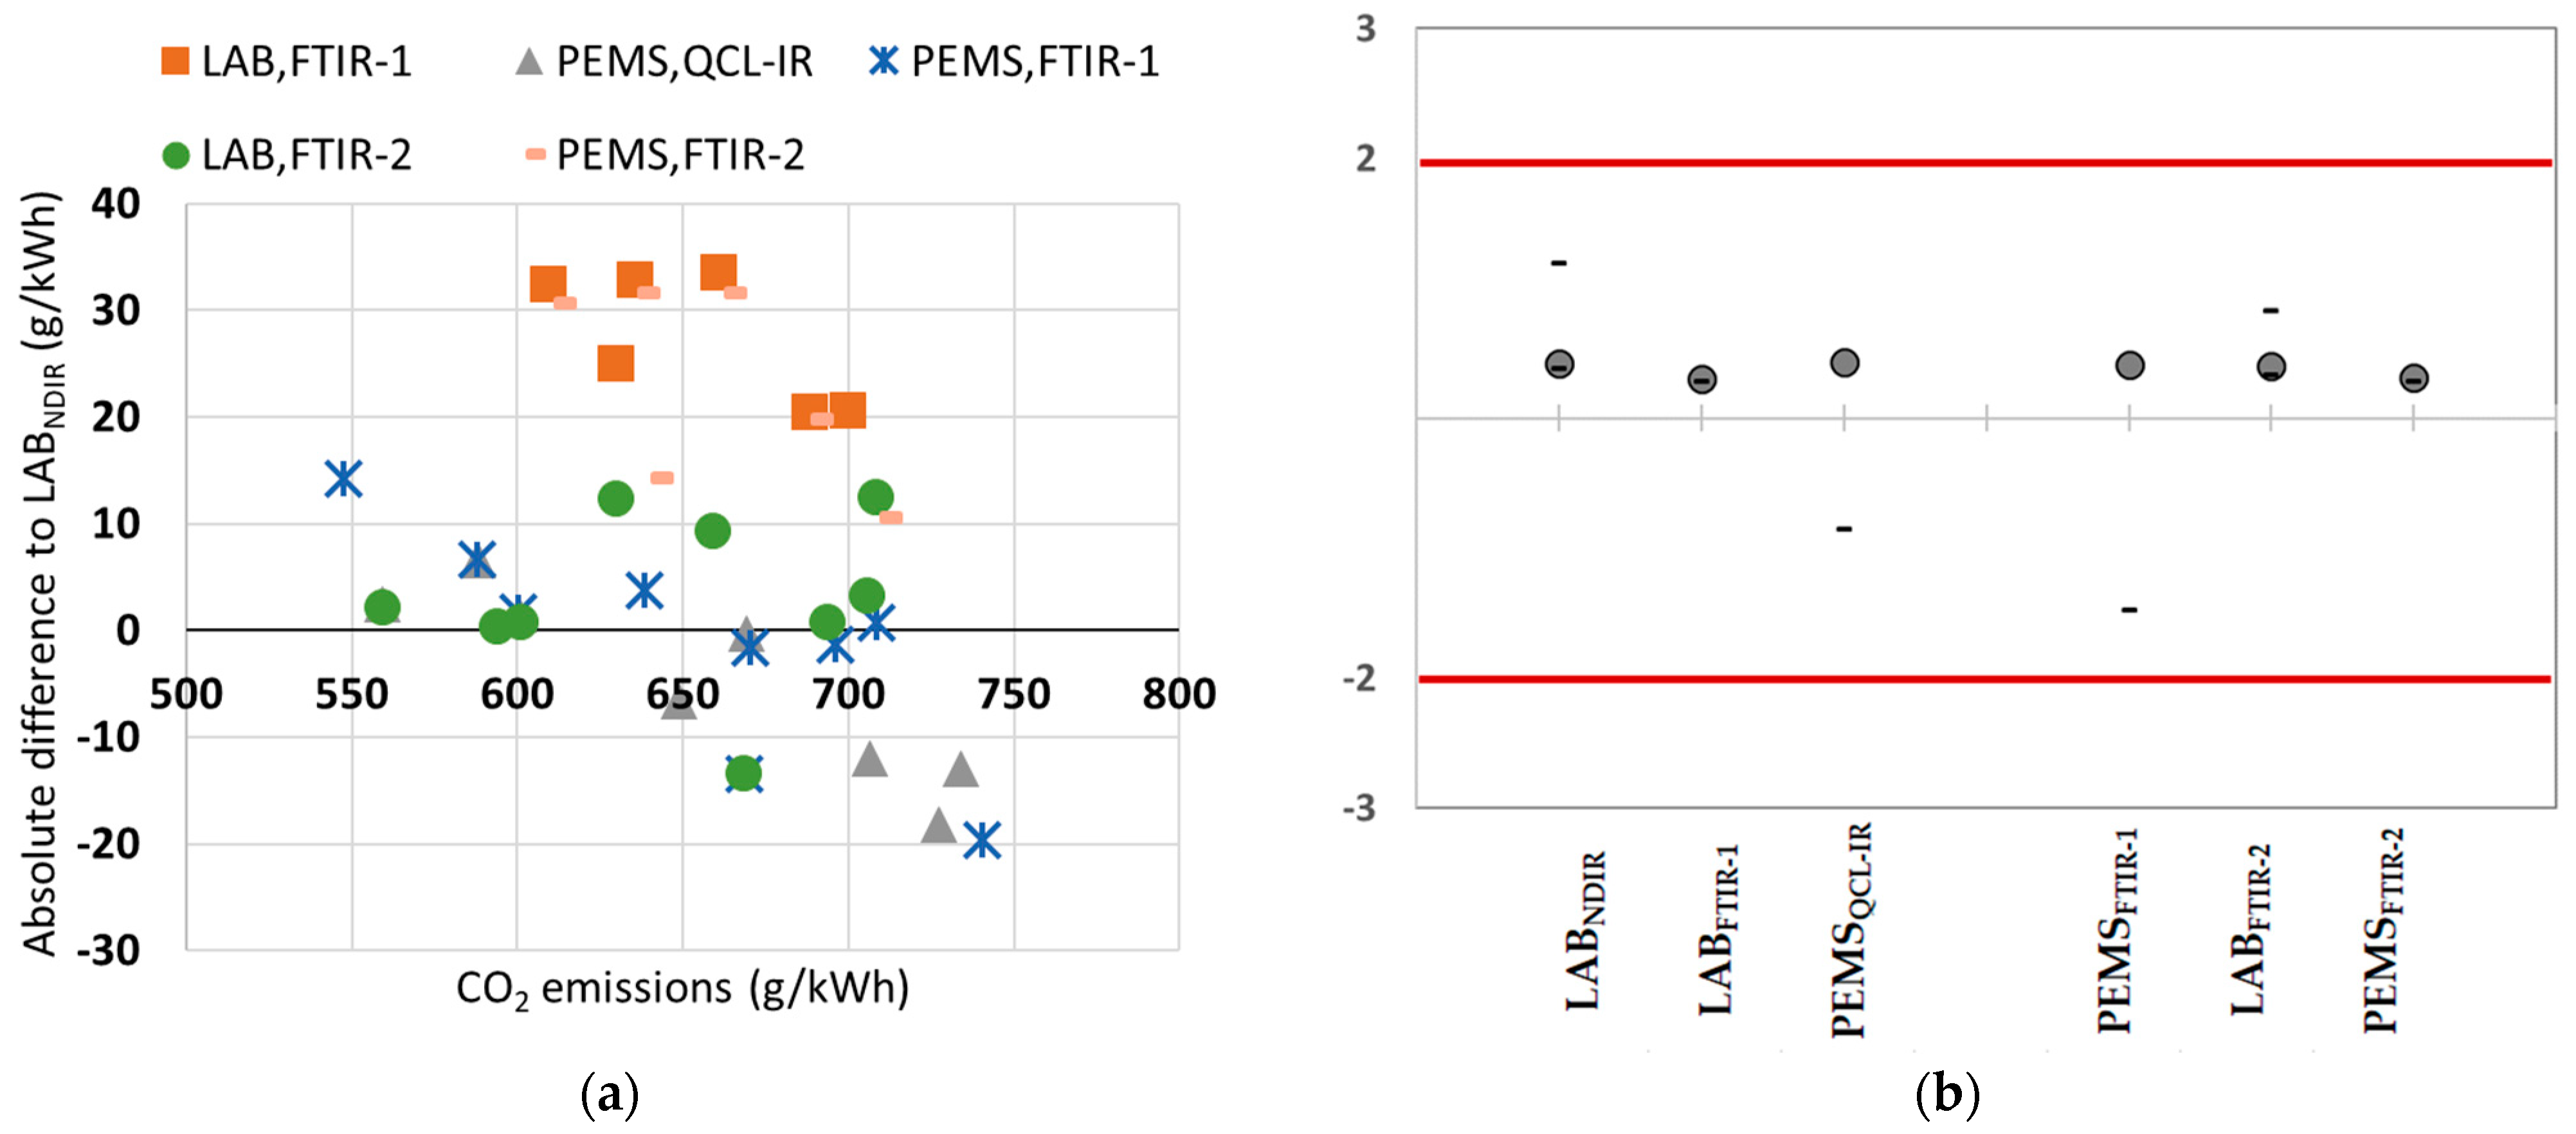
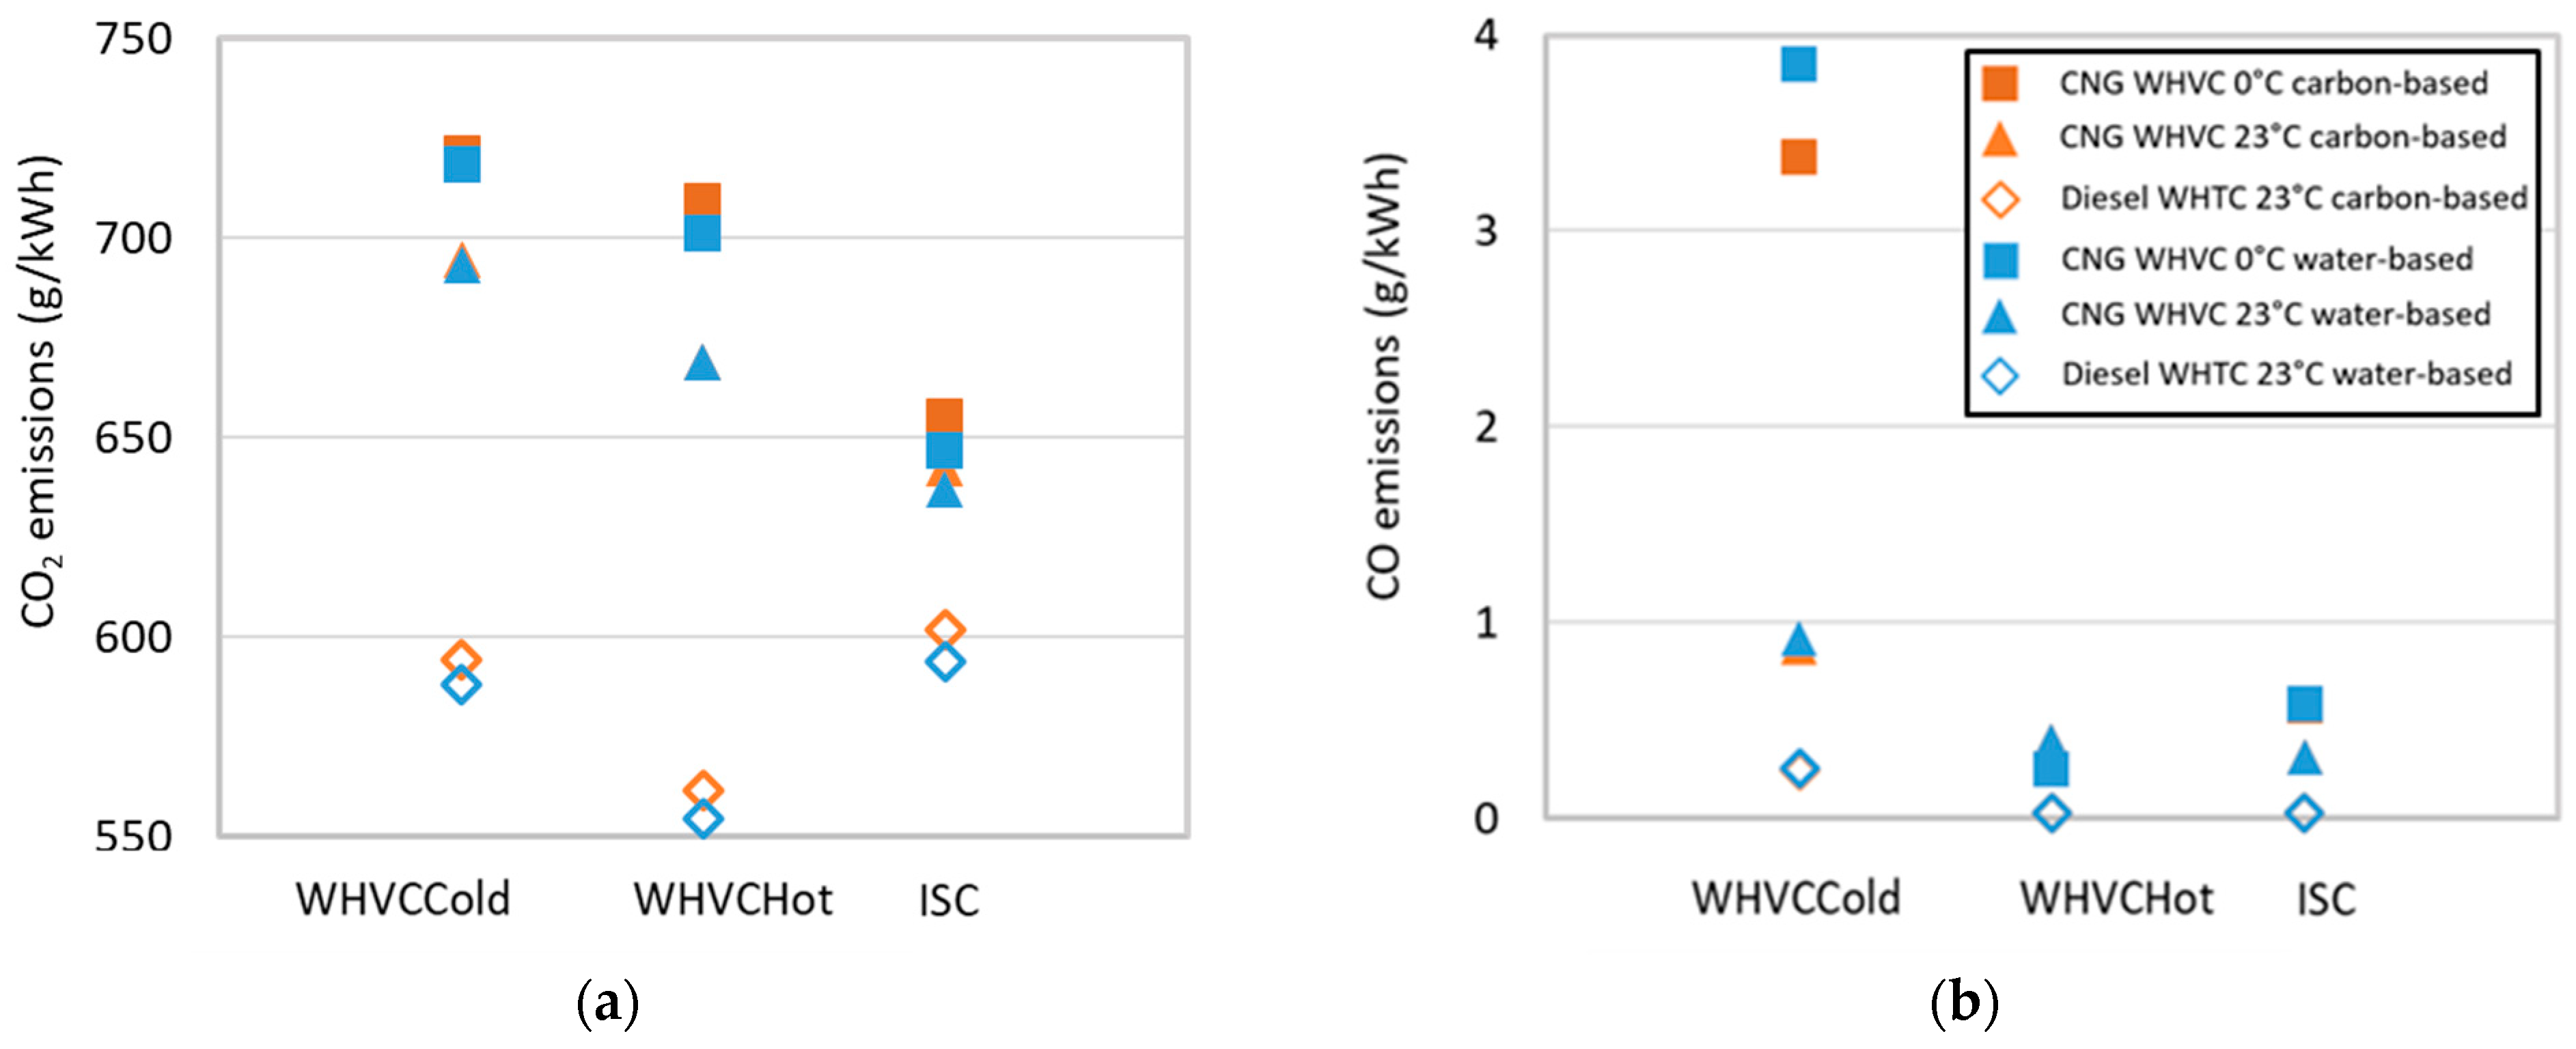
3.1. Measurement of Gaseous Pollutants and CO2

The absolute NOx emissions covered a wide emission range going from 0.05 g/kWh (well below the limits set by Euro VI (0.460 g/kWh) and Euro 7 (0.200 g/kWh for engines and 0.260 g/kWh for vehicles) standards) to 0.750 mg/kWh (above Euro VI and 7 limits), with intermediate values at around 0.1 g/kWh (see Figure 1a and Table S2 in the Supplementary Materials). As expected, lower emissions were measured during hot tests, WHTCHot (~0.09 g/kWh) and WHVCHot (~0.04–0.09 g/kWh) than over the WHTCCold (~0.7 g/kWh) and WHVCCold (~0.1 g/kWh) tests. The relative deviations were low for all instruments and, in all cases, below 14%. Mean absolute deviations were 0.007 g/kWh, with the maximum deviation (0.038 g/kWh) being recorded during the Diesel’s WHVCCold (~0.7 g/kWh). Relative deviations for the measurements performed on the Diesel engine’s exhaust were ≤5%, including during the WHTCHot, test where the emissions were <0.09 g/kWh. The higher relative deviations recorded for the CNG vehicle compared to the Diesel (even if these deviations are not high) may be attributed to the presence of higher water content in the exhaust of the former [30]. High concentrations of water could affect the measurement of the investigated compounds as they present signals in the same spectral area. The higher water concentration in the CNG’s exhaust is due to the higher hydrogen-to-carbon ratio of the fuel (methane) used by this system compared to the hydrocarbon mixture used in Diesel and the lower air/fuel of the CNG compared to Diesel. As also shown in Figure S1, water concentrations are typically higher during cold cycles (e.g., WHVCCold) compared to hot cycles (e.g., WHVCHot). It was also observed that the concentration increased as the temperature of the system and environment decreased. Nonetheless, the relative deviations from the reference instruments were not affected. The performance of PEMS was equivalent to the laboratory systems. The deviations of the three PEMS were up to 14% (or 0.038 g/kWh) and the three laboratory systems were up to 11% (or 0.023 g/kWh). The z-scores were on average between 0.1 and 1.4, in all cases similar to the Z-score of the reference instrument (LABCLD 0.6), except the LABFTIR-1, which had a Z-score of 1.4. In general, the differences of the instruments are in the expected range, as also other studies found for heavy-duty [26] or light-duty [31] vehicles. It should be noted that Z-scores close to zero indicate excellent agreement with the mean value.
CH4 emissions from CNG vehicles take place when the fuel, whose main component is methane, is not fully combusted by the engine and the three-way catalyst (TWC) struggles to oxidize this molecule [32]. In the case of Diesel, CH4 is a fragment of the molecules present in the Diesel fuel resulting from its incomplete combustion [33]. In this case, the Diesel oxidation catalyst (DOC) presents similar limitations as TWC in the CNG.
The CH4 emission factors ranged from levels close to zero for the Diesel engine to ~0.3 g/kWh for the WHVCCold tests performed with the CNG vehicle, with intermediate values ranging from 0.07 to 0.15 g/kWh during the CNG’s ISC and WHVCHot, respectively. Mean absolute deviations were 0.015 g/kWh, with the maximum deviation (0.035 g/kWh) being recorded during the CNG’s WHVCCold at 23 °C (~0.25 g/kWh). The relative deviations were in all the CNG tests below 11%. Euro VI only regulates CH4 emissions for CNG engines. For that reason, the FID was not used during the tests performed with the Diesel engine. Nonetheless, the other instruments used (FTIR and PEMSQCL-IR) were in good agreement, showing consistently very low emissions of this pollutant. Also, in this case the Z-score indicates an acceptable performance for the instruments used to measure CH4. See Figure 2 and Table S2 in the Supplementary Materials for additional information.
Emissions of CO varied greatly between cold and hot tests. Going from ~0.3 g/kWh during the WHVCHot to >3 g/kWh to WHVCCold for the CNG vehicle and from ~0.03 g/kWh during the WHTCHot to ~0.3 g/kWh to WHTCCold for the Diesel engine. Hence, covering ranges throughout the Euro VI (1.5 g/kWh) and 7 limits (1.5 g/kWh for engines and 1.95 g/kWh for vehicles). Mean absolute deviations were 0.1 g/kWh, with the maximum deviation (0.67 g/kWh) being recorded during the CNG’s WHVCCold at 23 °C (~3.4 g/kWh). The maximum relative variations (~30%) were recorded at very low emission levels (~0.03 g/kWh). Otherwise, the differences remain below 20% even for low emissions for both CNG and Diesel systems.
CO emissions from CNG HDVs are associated with air-to-fuel control [28,34,35], with higher emissions taking place during rich events, cold ambient temperatures, and during cold starts. This would explain the high emissions reported for the WHTCCold test at 0 °C. According to the Z-score evaluation, the measurements from all instruments were acceptable for all the tests performed. The z-scores were on average between 0.3 and 0.9 (see Figure 3b). The median Z-score of the reference instrument (LABNDIR 0.9) may arise because, as explained below, this is the only dry-based measurement that was then dry-to-wet corrected.
In Europe, NH3 emissions are regulated at engines based on the Euro VI standard. The emissions are regulated in concentration with a limit of 10 ppm average over the WHTC. Euro 7 introduced on-road verification testing and changed the limit to brake-specific emissions (0.060 g/kWh for engines and 0.085 g/kWh for vehicles). The emissions of this pollutant (toxic [36] and important precursor of PM2.5 [37]) are of catalytic nature, i.e., NH3 is not formed in the combustion chamber [38,39]. The emissions of NH3 of spark ignition engines equipped with TWC are linked to the reactions between NO, CO, and H2, which is formed by the reforming of unburned hydrocarbons after the TWC’s light-off [40,41]. The NH3 emissions from Diesel vehicles are linked to the use of SCR and Diesel exhaust fluid [42]. CNG heavy-duty vehicles control the emissions of NH3 by air-to-fuel control strategies [19]. Diesel vehicles use ASC, which can very efficiently reduce NH3. In fact, NH3 emissions from the studied Diesel vehicle were always below 0.003 g/kWh. With such low absolute emissions, the relative differences among the instruments were high. The results are in agreement with other studies for heavy-duty [26] or light-duty [28,31] vehicles. NH3 emissions from the CNG vehicle varied from ~0.01 g/kWh to ~0.1 g/kWh, with intermediate points at ~0.04 and ~0.07 g/kWh. In most cases, relative differences were well below 10%. Mean absolute deviations were 0.004 g/kWh, with the maximum deviation (0.04 g/kWh) being recorded during the CNG’s WHVCCold at 0 °C (~0.15 g/kWh). As expected for technologies that are already allowed by the regulation during laboratory testing (such as FTIR and QCL-IR), the Z-score absolute values were below 2 (i.e., acceptable performance) for both laboratory and PEMS equipment (see Figure 4b). There were no differences between PEMS and LAB equipment.
Similar to NH3 emissions, the emissions of N2O from CNG and Diesel heavy-duties are mainly of a catalytic nature, i.e., the emissions detected at the tailpipe are not engine related and have increased over the years [28]. In the case of the CNG, N2O is formed during the TWC light-off and below 250 °C when NO, CO, and HC are present [43]. Modern Diesel systems present N2O from different catalytic sources, including the DOC, the selective catalytic reduction system (SCR), and the ammonia slip catalyst (ASC). The list of reactions resulting on the N2O emissions can be found in the specialized literature [44].
N2O emissions have been recently set as a criteria pollutant for heavy-duty engines and vehicles in Europe with the Euro 7 standard [45]. The limits for this ozone-depleting molecule and greenhouse gas [46] are fixed at 0.200 g/kWh for engines and 0.260 g/kWh for vehicles.
In line with previous studies, N2O emissions from the CNG vehicle were non-negligible but low (up to 0.007 g/kWh). Also, these emissions were lower than those measured from the Diesel engine under all the conditions studied. The relative difference for the emissions of the Diesel vehicle, calculated in the absence of a reference method using laboratory-based instruments as a reference, was low considering the emission levels and the limits. They varied from ~2% to ~15%. For the CNG, the differences were slightly higher, albeit the very low absolute emissions (Figure 5a). Mean absolute deviations were 0.001 g/kWh, with a maximum deviation of 0.005 g/kWh. Good agreement between the N2O measurements from heavy-duties performed with FTIR and QCL-IR techniques was also reported in previous studies [26,47]. Once more, the Z-score indicated that the performance of all instruments was acceptable for all the tests performed.
HCHO emissions from heavy-duty engines have been associated with incomplete combustion from different fuels, including, but not limited to, the following: CNG [48,49], fatty acid methyl esters (FAME) [50], and methanol [51,52]. The United Nations Global Technical Regulation No. 15 prescribes a series of techniques to measure HCHO from the diluted exhaust of light-duty vehicles, including FTIR [53]. While regulated in other regions (e.g., USA, Brazil, and China), this Type I carcinogenic compound [54] is not regulated by the Euro standards. However, a close in the Euro 7 resolution from the EU co-legislators (the European Parliament and the Council) requests a report on the heavy-duty HCHO emissions that considers the different fuels and their representation in the EU market by 2027. Moreover, although HCHO is not directly regulated at the moment, the measurement of HCHO is needed for the calculation of the non-methane organic gases (NMOG), now included in Euro 7. The Equation (6) has been proposed as a simplified alternative to the approach used by the US EPA for the NMOG determination [55] and also to account for other oxygenated fuels than ethanol.
m N M O G = 1 0 % 100 1 × m T H C + ( d O x y d T H C ) d T H C × 0 % 100 × m T H C 1.04 × m C H 4 + m H C H O
where mNMOG stand for mass emissions of non-methane hydrocarbons and oxygenated organic compounds; mTHC stands for the mass emissions of total hydrocarbon; mCH4 stands for mass emissions of methane; mHCHO stands for the mass emissions of formaldehyde; 0% stands for the oxygen content of the fuel (% (m/m)), considering that oxygen bound in water is excluded; dOxy stands for the density of oxygenated fuel or its oxygenated fuel component; dTHC stands for the density of THC (with standardized values for petrol and Diesel). This equation takes into consideration a correction to the response of the FID to oxygenated molecules and adds the emissions of HCHO because the FID has no response [56].
For the engines and conditions investigated, the emission factors of HCHO were <0.002 g/kWh (see Figure 6a and Table S2). Mean absolute deviations were <0.001 g/kWh, and the maximum deviation was 0.004 g/kWh. Despite the low emissions, there was a very good agreement between the different instruments measuring this molecule with a Z-score below 2 in all cases (see Figure 6b). Satisfactory results have also been previously reported for the performance of a laboratory-grade FTIR and a QCL-IR when measuring HCHO from a Diesel heavy-duty, and gasoline and Diesel light-duty vehicles under different ambient conditions [24].
CO2 emissions are requested to be measured both in the laboratory and during on-road testing for heavy-duty engines and vehicles, respectively. These CO2 emissions factors are used for conformity assessment during on-road testing but also by other regulatory frameworks like the one addressing CO2 emissions from HDV [57].
The CO2 emissions factors from the Diesel engine during the different tests were 550–600 g/kWh and those from the CNG vehicle 650–720 g/kWh. The relative difference to the reference instruments was less than 5%. It is worth noting that while one FTIR presented a maximum relative difference of 2%, the other two FTIRs underestimated the emissions by 3–5% as they consistently measured lower CO2 concentrations than the reference instrument. Nonetheless, as shown in Figure 7b, the Z-score indicated that the performance of all instruments was acceptable for all the tests performed.

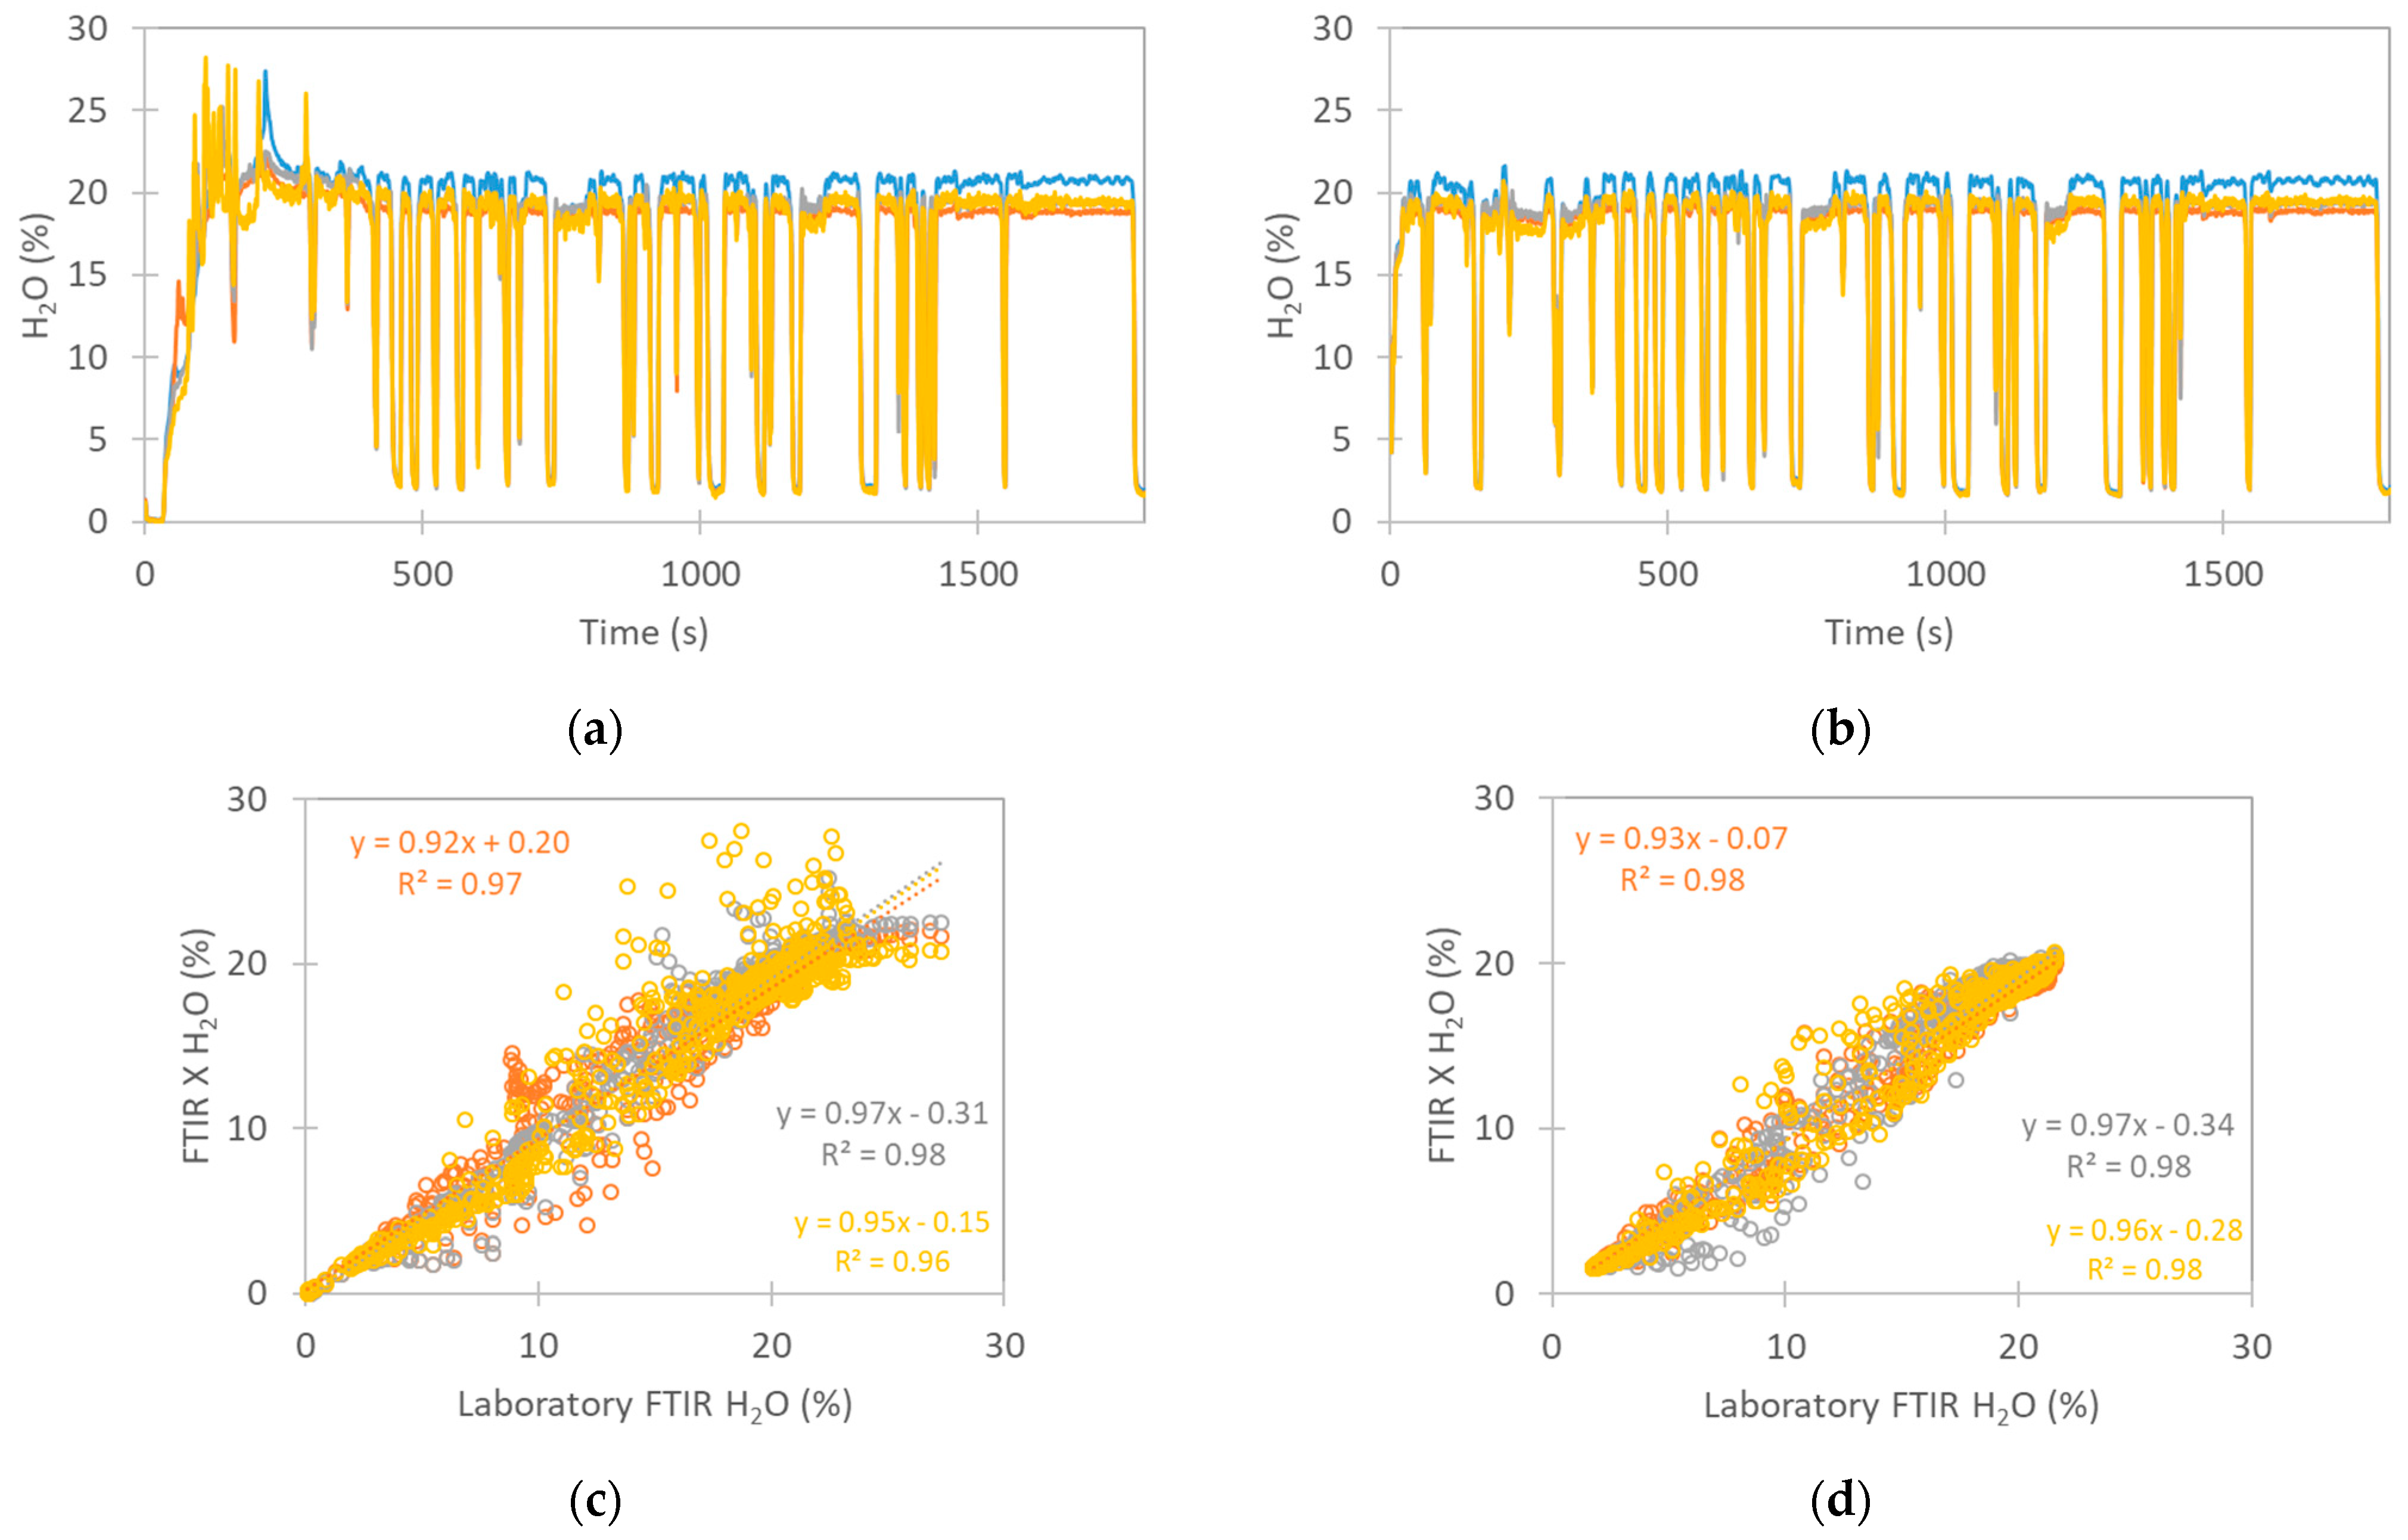
3.2. H2O Measurement and Dry-to-Wet Correction

At type-approval, the CO2 emissions from engines are measured using dry-based NDIR during the laboratory testing. This poses an important obstacle for the certification of engines running on carbonless fuels, e.g., H2, NH3, and their dual-fuel engines, because the dry concentrations measured cannot be corrected to wet bases using the carbon-based approaches prescribed by the current regulation (carbon-based Equations (1)–(3) shown above) due to the very low concentrations of CO2 and CO in the exhaust. Although on-road measurement can also be performed on wet bases, the same constraint holds true for dry-based PEMS.
In order to overcome this limitation, the H2O concentration in the exhaust was investigated using the FTIR analyzers. Knowing the concentration of water in the exhaust at the same point where the compound to be corrected is measured would allow correcting to wet bases using the water-based approach (Equation (4) above). This has been recently introduced by the US EPA in their legal framework [58].
As expected, water concentrations measured were higher for the CNG vehicle compared to the Diesel engines. Moreover, the emissions were higher during the WHVCCold than over the WHVCHot, especially during the first 350 sections (Figure 8). During these tests, the agreement between the different FTIRs for Diesel (PEMSFTIR-1 vs. LABFTIR-2) and CNG (i.e., PEMSFTIR-1 vs. LABFTIR-1, PEMSFTIR-2 vs. LABFTIR-1, and LABFTIR-2 vs. LABFTIR-1) was excellent, with R2 > 0.95 and deviations < 7%. The H2O concentrations from the CNG vehicle increased further at cold ambient conditions, reaching up to 30% during the first section of the WHVCCold (see Figure S1 of the Supplementary Materials). Under these conditions, the R2 > 0.92 and deviations < 10%.
The water concentrations measured by the laboratory FTIR were used to correct the dry measurements of CO2 and CO using the water-based approach, according to Equation (4). When these emissions factors were compared to those obtained using the carbon-based approach (Equation (2)), the maximum deviation for the CO2 was <1% for all the tests and conditions (Figure 9a). In the case of CO, for the tests with emission factors near or below the regulatory limits, the deviations were from none to 5%. For the WHVCCold at 0 °C, where the CO emissions were more than twice the limits, the deviation reached 14% (Figure 9b). The results are similar to the conclusions for passenger cars and two-wheelers [15]. The study [15] found that applying the regulated conversion factor instead of the water-based correction resulted in up to 13% lower CO2 and CO mass emissions during cold start. However, the overall underestimation was minimal (<1%) for the entire test (lasting 20–30 min), with the exception of CO emissions (1–10%) in tests where the majority of emissions occurred during cold start.

4. Conclusions

The performances of six gas measurement instruments, comprising four FTIR and two QCL-IR devices, were evaluated against reference instruments that meet heavy-duty emissions regulations. The study assessed their ability to accurately measure NOx, CO, CH4, CO2, and NH3 emissions, as well as their agreement in measuring N2O and/or HCHO emissions using exhaust gas from a Diesel engine and a CNG vehicle.
The results from the F-test and t-test, required for equivalency by the heavy-duty emissions regulation, as well as the Z-score analysis performed, indicate that under these criteria all the investigated systems are suitable for the measurement of the gaseous compounds investigated. Therefore, laboratory-grade and PEMS using FTIRs or QCL-IR can be used as alternatives to conventional CLD, NDIR, and FID for the measurement of NOx, CO/CO2, and CH4, respectively. Moreover, the results add to the current state of knowledge indicating that FTIR and QCL-IR yield reliable results when measuring N2O and HCHO from tailpipe exhaust. The results obtained with the different analyzers also confirm the findings of previous studies using the same measurement principles using different vehicles and ambient conditions. Nevertheless, they should be confirmed with future fuels, engines, or instrument technologies once they reach the market in the future in the light of Euro 7.
The FTIRs presented good agreement for the measurement of water. This measurement allowed correcting dry-based measurements to wet-based measurements using water correction. The result from this correction was in excellent agreement (deviation < 1% for CO2 and <5% for CO) when compared to the carbon-based correction prescribed by the current heavy-duty regulation. This suggests that the water-based approach could be used in those cases where the carbon-based equation cannot be applied, e.g., internal combustion engines using H2 or NH3.

Supplementary Materials

The following supporting information can be downloaded at: https://www.mdpi.com/article/10.3390/en17225676/s1, Table S1. Results of F-test and t-test for NOx, CO2, and CO and the F or t criteria values for a given degree of freedom (n) to assess equivalency, as prescribed by the UN R49; Table S2. Emission factor for NOx, CH4, CO, NH3, N2O, HCHO, and CO2 measured during all tests using the instruments under study as well as the reference instruments; Figure S1. Example of (top panel) water, (center panel) CO and (bottom panel) NOx concentration in the CNG exhaust measured by the FTIR instruments.

Author Contributions

Conceptualization, R.S.-B.; methodology, R.S.-B., R.G. and B.G.; software, C.F. and L.F.; formal analysis, C.F., L.F. and R.S.-B.; investigation, C.F., L.F., and R.G.; data curation, C.F. and L.F.; writing—original draft preparation, R.S.-B.; writing—review and editing, all; supervision, R.S.-B. and B.G. All authors have read and agreed to the published version of the manuscript.

Funding

This research received no external funding.

Data Availability Statement

Data available upon request from the corresponding authors.

Acknowledgments

The authors would like to acknowledge Volvo Group Trucks Technology for providing the facilities, the engine, and the expertise supporting the test of the Diesel engine, to AVL GmbH, HORIBA, and IAG GmbH for providing the gaseous analyzers. Also, special acknowledgment to A. Bonamin, M. Cadario, P. Macri, and D. Zanardini, for the experimental support during the test at JRC.

Conflicts of Interest

The authors declare no conflicts of interest.

References

  1. EU. Council Directive 70/220/EEC of 20 March 1970 on the Approximation of the Laws of the Member States Relating to Measures to be Taken against Air Pollution by Gases from Positive-Ignition Engines of Motor Vehicles. Off. J. Eur. Union 1970, 76, 1–22. Available online: https://eur-lex.europa.eu/legal-content/EN/ALL/?uri=CELEX%3A31970L0220 (accessed on 10 October 2024).
  2. EU. Council Directive 74/290/EEC of 28 May 1974 Adapting to Technical Progress Council Directive No 70/220/EEC on the Approximation of the Laws of the Member States Relating to Measures to be Taken against Air Pollution by Gases from Positive-Ignition Engines of Motor Vehicles. Off. J. Eur. Union 1974, 159, 61–69. Available online: https://eur-lex.europa.eu/legal-content/en/TXT/?uri=CELEX%3A31974L0290 (accessed on 10 October 2024).
  3. EU. Council Directive 88/77/EEC of 3 December 1987 on the Approximation of the Laws of the Member States Relating to the Measures to be Taken against the Emission of Gaseous Pollutants from Diesel Engines for Use in Vehicles. Off. J. Eur. Union 1988, 36, 33–61. [Google Scholar]
  4. EU. Directive 96/1/EC of the European Parliament and of the Council of 22 January 1996 Amending Directive 88/77/EEC on the Approximation of the Laws of the Member States Relating to the Measures to be Taken against the Emission of Gaseous and Particulate Pollutants from Diesel Engines for Use in Vehicles. Off. J. Eur. Union 1996, 40, 1–9. Available online: https://eur-lex.europa.eu/legal-content/EN/TXT/?uri=CELEX%3A31996L0001 (accessed on 10 October 2024).
  5. EU. Directive 2005/55/EC of the European Parliament and of the Council of 28 September 2005 on the Approximation of the Laws of the Member States Relating to the Measures to be Taken against the Emission of Gaseous and Particulate Pollutants from Compression-Ignition Engines for Use in Vehicles, and the Emission of Gaseous Pollutants from Positive-Ignition Engines Fuelled with Natural Gas or Liquefied Petroleum Gas for Use in Vehicles (Text with EEA Relevance). Off. J. Eur. Union 2005, 275, 1–163. Available online: https://eur-lex.europa.eu/legal-content/EN/TXT/?uri=CELEX%3A32005L0055 (accessed on 10 October 2024).
  6. EU. Commission Directive 2008/74/EC of 18 July 2008 Amending, as Regards the Type Approval of Motor Vehicles with Respect to Emissions from Light Passenger and Commercial Vehicles (Euro 5 and Euro 6) and Access to Vehicle Repair and Maintenance Information, Directive 2005/55/EC of the European Parliament and of the Council and Directive 2005/78/EC (Text with EEA Relevance). Off. J. Eur. Union 2008, 192, 51–59. Available online: https://eur-lex.europa.eu/legal-content/en/ALL/?uri=CELEX%3A32008L0074 (accessed on 10 October 2024).
  7. EU. Commission Regulation (EU) No 582/2011 of 25 May 2011 Implementing and Amending Regulation (EC) No 595/2009 of the European Parliament and of the Council with Respect to Emissions from Heavy Duty Vehicles (Euro VI) and Amending Annexes I and III to Directive 2007/46/EC of the European Parliament and of the Council Text with EEA Relevance. Off. J. Eur. Union 2011, 167, 1–168. Available online: https://eur-lex.europa.eu/eli/reg/2011/582/oj (accessed on 10 October 2024).
  8. Balogun, F.; Wang-Alho, H.; Sirviö, K.; Mikulski, M. FTIR Analysis for Determining Stability of Methanol–HVO Blends for Non-Road Engine Application. Energies 2024, 17, 3921. [Google Scholar] [CrossRef]
  9. Su, S.; Hou, P.; Wang, X.; Lyu, L.; Ge, Y.; Lyu, T.; Lai, Y.; Luo, W.; Wang, Y. Evaluating the Measurement Uncertainty of On-Road NOx Using a Portable Emission Measurement System (PEMS) Based on Real Testing Data in China. Atmosphere 2023, 14, 702. [Google Scholar] [CrossRef]
  10. Miao, G.; Wang, X.; Xuan, G.; Liu, J.; Ma, W.; Zhang, L. Emission Characteristics of Nitrous Oxide (N2O) from Conventional Gasoline and Hybrid Vehicles. Atmosphere 2024, 15, 1142. [Google Scholar] [CrossRef]
  11. Cao, T.; Durbin, T.D.; Cocker, D.R.; Wanker, R.; Schimpl, T.; Pointner, V.; Oberguggenberger, K.; Johnson, K.C. A Comprehensive Evaluation of a Gaseous Portable Emissions Measurement System with a Mobile Reference Laboratory. Emiss. Control Sci. Technol. 2016, 2, 173–180. [Google Scholar] [CrossRef]
  12. Wang, G.; Qian, C.; Yang, G.L.; Nan, L.G.; Yu, H.G. Verification of PEMS measurement accuracy based on light vehicle emission test system. E3S Web Conf. 2021, 268, 11. [Google Scholar] [CrossRef]
  13. Broekaert, S.; Grigoratos, T.; Savvidis, D.; Fontaras, G. Assessment of waste heat recovery for heavy-duty vehicles during on-road operation. Appl. Therm. Eng. 2021, 191, 116891. [Google Scholar] [CrossRef]
  14. Giechaskiel, B.; Zardini, A.A.; Clairotte, M. Exhaust Gas Condensation during Engine Cold Start and Application of the Dry-Wet Correction Factor. Appl. Sci. 2019, 9, 2263. [Google Scholar] [CrossRef]
  15. Jamrozik, A.; Tutak, W. Alcohols as Biofuel for a Diesel Engine with Blend Mode—A Review. Energies 2024, 17, 4516. [Google Scholar] [CrossRef]
  16. Gandiglio, M.; Marocco, P. Mapping Hydrogen Initiatives in Italy: An Overview of Funding and Projects. Energies 2024, 17, 2614. [Google Scholar] [CrossRef]
  17. Muhssen, H.S.; Zöldy, M.; Bereczky, Á. A Comprehensive Review on the Hydrogen–Natural Gas–Diesel Tri-Fuel Engine Exhaust Emissions. Energies 2024, 17, 3862. [Google Scholar] [CrossRef]
  18. Baldinelli, A.; Francesconi, M.; Antonelli, M. Hydrogen, E-Fuels, Biofuels: What Is the Most Viable Alternative to Diesel for Heavy-Duty Internal Combustion Engine Vehicles? Energies 2024, 17, 4728. [Google Scholar] [CrossRef]
  19. Zhu, H.; Ma, T.; Toumasatos, Z.; Cao, S.; Karavalakis, G.; Johnson, K.C.; Durbin, T. On-road NOx and NH3 emissions measurements from in-use heavy-duty diesel and natural gas trucks in the South Coast air Basin of California. Atmos. Environ. 2024, 316, 120179. [Google Scholar] [CrossRef]
  20. Vojtíšek-Lom, M.; Beránek, V.; Klír, V.; Jindra, P.; Pechout, M.; Voříšek, T. On-road and laboratory emissions of NO, NO2, NH3, N2O and CH4 from late-model EU light utility vehicles: Comparison of diesel and CNG. Sci. Total Environ. 2018, 616–617, 774–784. [Google Scholar] [CrossRef]
  21. Onishi, Y.; Hamauchi, S.; Shibuya, K.; McWilliams-Ward, K.; Akita, M.; Tsurumi, K. Development of On-Board NH3 and N2O Analyzer Utilizing Mid-Infrared Laser Absorption Spectroscopy; SAE Technical Paper 2021-01-0610; SAE International: Warrendale, PA, USA, 2021. [Google Scholar]
  22. Shibuya, K.; Podzorov, A.; Matsuhama, M.; Nishimura, K.; Magari, M. High sensitivity and low interference gas analyzer with feature extraction from mid-infrared laser absorption-modulated signal. Meas. Sci. Technol. 2021, 32, 035201. [Google Scholar] [CrossRef]
  23. Ferrarese, C.; Franzetti, J.; Selleri, T.; Suarez-Bertoa, R. VOC emissions from Euro 6 vehicles. Environ. Sci. Eur. 2024, 36, 27. [Google Scholar] [CrossRef]
  24. Suarez-Bertoa, R.; Selleri, T.; Gioria, R.; Melas, A.D.; Ferrarese, C.; Franzetti, J.; Arlitt, B.; Nagura, N.; Hanada, T.; Giechaskiel, B. Real-Time Measurements of Formaldehyde Emissions from Modern Vehicles. Energies 2022, 15, 7680. [Google Scholar] [CrossRef]
  25. Selleri, T.; Gioria, R.; Melas, A.D.; Giechaskiel, B.; Forloni, F.; Mendoza Villafuerte, P.; Demuynck, J.; Bosteels, D.; Wilkes, T.; Simons, O.; et al. Measuring Emissions from a Demonstrator Heavy-Duty Diesel Vehicle under Real-World Conditions—Moving Forward to Euro VII. Catalysts 2022, 12, 184. [Google Scholar] [CrossRef]
  26. Giechaskiel, B.; Jakobsson, T.; Karlsson, H.L.; Khan, M.Y.; Kronlund, L.; Otsuki, Y.; Bredenbeck, J.; Handler-Matejka, S. Assessment of On-Board and Laboratory Gas Measurement Systems for Future Heavy-Duty Emissions Regulations. Int. J. Environ. Res. Public Health 2022, 19, 6199. [Google Scholar] [CrossRef]
  27. Giechaskiel, B.; Melas, A.; Franzetti, J.; Valverde, V.; Clairotte, M.; Suarez-Bertoa, R. Measurement of Light-Duty Vehicle Exhaust Emissions with Light Absorption Spectrometers. Technologies 2024, 12, 32. [Google Scholar] [CrossRef]
  28. Gioria, R.; Selleri, T.; Giechaskiel, B.; Franzetti, J.; Ferrarese, C.; Melas, A.; Forloni, F.; Suarez-Bertoa, R.; Perujo, A. Regulated and unregulated emissions from Euro VI Diesel and CNG heavy-duty vehicles. Transp. Res. Part D Transp. Environ. 2024, 134, 104349. [Google Scholar] [CrossRef]
  29. ISO 17043:2010; Conformity Assessment—General Requirements for Proficiency Testing. ISO: Geneva, Switzerland, 2010.
  30. Thiruvengadam, A.; Besch, M.; Carder, D.; Oshinuga, A.; Pasek, R.; Hogo, H.; Gautam, M. Unregulated greenhouse gas and ammonia emissions from current technology heavy-duty vehicles. J. Air Waste Manag. Assoc. 2016, 66, 1045–1060. [Google Scholar] [CrossRef]
  31. Valverde, V.; Kondo, Y.; Otsuki, Y.; Krenz, T.; Melas, A.; Suarez-Bertoa, R.; Giechaskiel, B. Measurement of Gaseous Exhaust Emissions of Light-Duty Vehicles in Preparation for Euro 7: A Comparison of Portable and Laboratory Instrumentation. Energies 2023, 16, 2561. [Google Scholar] [CrossRef]
  32. Ferri, D.; Elsener, M.; Kröcher, O. Methane oxidation over a honeycomb Pd-only three-way catalyst under static and periodic operation. Appl. Catal. B Environ. 2018, 220, 67–77. [Google Scholar] [CrossRef]
  33. Xin, Q. Diesel Engine System Design; Woodhead Publishing: Cambridge, UK, 2016. [Google Scholar]
  34. Mera, Z.; Fonseca, N.; López, J.M.; Casanova, J. Analysis of the high instantaneous NOx emissions from Euro 6 diesel passenger cars under real driving conditions. Appl. Energy 2019, 242, 1074–1089. [Google Scholar] [CrossRef]
  35. Zhu, H.; McCaffery, C.; Yang, J.; Li, C.; Karavalakis, G.; Johnson, K.C.; Durbin, T.D. Characterizing emission rates of regulated and unregulated pollutants from two ultra-low NOx CNG heavy-duty vehicles. Fuel 2020, 277, 118192. [Google Scholar] [CrossRef]
  36. Agency for Toxic Substances and Disease Registry. Toxicological Profile for Ammonia; US Department of Health and Human Services: Atlanta, GA, USA, 2004.
  37. Finlayson-Pitts, B.J.; Pitts, J.N. Chemistry of the Upper and Lower Atmosphere; Elsevier: New York, NY, USA, 1999. [Google Scholar]
  38. Suarez-Bertoa, R.; Zardini, A.A.; Lilova, V.; Meyer, D.; Nakatani, S.; Hibel, F.; Ewers, J.; Clairotte, M.; Hill, L.; Astorga, C. Intercomparison of real-time tailpipe ammonia measurements from vehicles tested over the new world-harmonized light-duty vehicle test cycle (WLTC). Environ. Sci. Pollut. Res. 2015, 22, 7450–7460. [Google Scholar] [CrossRef] [PubMed]
  39. Suarez-Bertoa, R.; Lähde, T.; Pavlovic, J.; Valverde, V.; Clairotte, M.; Giechaskiel, B. Laboratory and On-Road Evaluation of a GPF-Equipped Gasoline Vehicle. Catalysts 2019, 9, 678. [Google Scholar] [CrossRef]
  40. Whittington, B.I.; Jiang, C.J.; Trimm, D.L. Vehicle exhaust catalysis: I. The relative importance of catalytic oxidation, steam reforming and water-gas shift reactions. Catal. Today 1995, 26, 41–45. [Google Scholar] [CrossRef]
  41. Bradow, R.L.; Stump, F.D. Unregulated Emissions from Three-Way Catalyst Cars; SAE Technical Paper No. 770369; SAE International: Warrendale, PA, USA, 1977. [Google Scholar]
  42. Guan, B.; Zhan, R.; Lin, H.; Huang, Z. Review of state of the art technologies of selective catalytic reduction of NOx from diesel engine exhaust. Appl. Therm. Eng. 2014, 66, 395–414. [Google Scholar] [CrossRef]
  43. Brinklow, G.; Herreros, J.M.; Zeraati Rezaei, S.; Doustdar, O.; Tsolakis, A.; Kolpin, A.; Millington, P. Non-Carbon Greenhouse Gas Emissions for Hybrid Electric Vehicles: Three-Way Catalyst Nitrous Oxide and Ammonia Trade-Off. Int. J. Environ. Sci. Technol. 2023, 20, 12521–12532. [Google Scholar] [CrossRef]
  44. Colombo, M.; Nova, I.; Tronconi, E. Detailed kinetic modeling of the NH3–NO/NO2 SCR reactions over a commercial Cu-zeolite catalyst for Diesel exhausts after treatment. Catal. Today 2012, 197, 243–255. [Google Scholar] [CrossRef]
  45. EC. Regulation (EU) 2024/1257 of the European Parliament and of the Council of 24 April 2024 on Type-Approval of Motor Vehicles and Engines and of Systems, Components and Separate Technical Units Intended for Such Vehicles, with Respect to Their Emissions and Battery Durability (Euro 7), Amending Regulation (EU) 2018/858 of the European Parliament and of the Council and Repealing Regulations (EC) No 715/2007 and (EC) No 595/2009 of the European Parliament and of the Council, Commission Regulation (EU) No 582/2011, Commission Regulation (EU) 2017/1151, Commission Regulation (EU) 2017/2400 and Commission Implementing Regulation (EU) 2022/1362, OJ L, 2024/1257. 5 August 2024. Available online: https://eur-lex.europa.eu/eli/reg/2024/1257/oj (accessed on 10 October 2024).
  46. Ravishankara, A.R.; Daniel, J.S.; Portmann, R.W. Nitrous oxide (N2O): The dominant ozone-depleting substance emitted in the 21st century. Science 2009, 326, 123–125. [Google Scholar] [CrossRef]
  47. Suarez-Bertoa, R.; Gioria, R.; Selleri, T.; Lilova, V.; Melas, A.; Onishi, Y.; Franzetti, J.; Forloni, F.; Perujo, A. NH3 and N2O Real World Emissions Measurement from a CNG Heavy Duty Vehicle Using On-Board Measurement Systems. Appl. Sci. 2021, 11, 10055. [Google Scholar] [CrossRef]
  48. Ayala, A.; Gebel, M.; Okamoto, R.; Rieger, P.; Kado, N.Y.; Cotter, C.; Verma, N. Oxidation Catalyst Effect on CNG Transit Bus Emissions; SAE Technical Paper 2003-01-1900; SAE International: Warrendale, PA, USA, 2003. [Google Scholar] [CrossRef]
  49. Zeng, P.; Lyu, X.; Guo, H.; Cheng, H.; Wang, Z.; Liu, X.; Zhang, W. Spatial variation of sources and photochemistry of formaldehyde in Wuhan, Central China. Atmos. Environ. 2019, 214, 116826. [Google Scholar] [CrossRef]
  50. Karavalakis, G.; Durbin, T.; Russell, R. CRC Project No. AVFL—17b: Biodiesel and Renewable Diesel Characterization and Testing in Modern LD Diesel Passenger Cars and Trucks; Coordinating Research Council, Inc.: Alpharetta, GA, USA, 2014. [Google Scholar]
  51. Wei, L.; Yao, C.; Wang, Q.; Pan, W.; Han, G. Combustion and emission characteristics of a turbocharged diesel engine using high premixed ratio of methanol and diesel fuel. Fuel 2015, 140, 156–163. [Google Scholar] [CrossRef]
  52. Geng, P.; Zhang, H.; Yang, S.; Yao, C. Comparative study on measurements of formaldehyde emission of methanol/gasoline fueled SI engine. Fuel 2015, 148, 9–15. [Google Scholar] [CrossRef]
  53. UNECE. Global Technical Regulation No. 15 (Worldwide Harmonized Light Vehicles Test Procedure). Available online: https://unece.org/transport/standards/transport/vehicle-regulations-wp29/global-technical-regulations-gtrs (accessed on 10 October 2024).
  54. Baan, R.; Grosse, Y.; Straif, K.; Lauby-Secretan, B.; El Ghissassi, F.; Bouvard, V.; Benbrahim-Tallaa, L.; Guha, N.; Freeman, C.; Galichet, L.; et al. A review of human carcinogens—Part F: Chemical agents and related occupations. Lancet Oncol. 2009, 10, 1143–1144. [Google Scholar] [CrossRef]
  55. Available online: https://www.ecfr.gov/current/title-40/chapter-I/subchapter-U/part-1066/subpart-G/section-1066.635 (accessed on 10 October 2024).
  56. Wallner, T. Correlation between speciated hydrocarbon emissions and flame ionization detector response for gasoline/alcohol blends. J. Eng. Gas Turbines Power 2011, 133, 82801. [Google Scholar] [CrossRef]
  57. EU. Regulation (EU) 2024/1610 of the European Parliament and of the Council of 14 May 2024 Amending Regulation (EU) 2019/1242 as Regards Strengthening the CO2 Emission Performance Standards for New Heavy-Duty Vehicles and Integrating Reporting Obligations, Amending Regulation (EU) 2018/858 and Repealing Regulation (EU) 2018/956. OJ L, 2024/1610. 6 June 2024. Available online: https://eur-lex.europa.eu/eli/reg/2024/1610/oj (accessed on 10 October 2024).
  58. Available online: https://www.federalregister.gov/documents/2024/04/22/2024-06809/greenhouse-gas-emissions-standards-for-heavy-duty-vehicles-phase-3 (accessed on 10 October 2024).
Figure 1. Comparison of instruments measuring NOx. (a) Absolute difference (mg/kWh) of the NOx measurements by all instruments compared the reference NOx analyzer (i.e., LABCDL) vs. emission factor obtained from measurements made by the instruments during each test; (b) Median Z-score for all the tests performed by the analyzers measuring NOx: LABCDL, LABFTIR-1, PEMSQCL-IR, LABQCL-IR, PEMSFTIR-1, LABFTIR-2, and PEMSFTIR-2. Dashed black lines indicate the maximum and minimum Z-score value.
Energies 17 05676 g001
Figure 2. Comparison of instruments measuring CH4. Only data for CNG are illustrated because CH4 emissions from the Diesel engines were not measured as they are not regulated for Euro VI Diesel engines/vehicles. (a) Absolute difference of the CH4 measurements by all instruments from the CNG vehicle compared the reference CH4 analyzer (i.e., LABFID) vs. emission factor obtained from measurements made by the instruments during each test; (b) Median Z-score for all the tests performed by the analyzers measuring CH4: LABFID, LABFTIR-1, PEMSQCL-IR, PEMSFTIR-1, LabFTIR-2, and PEMSFTIR-2. Dashed black lines indicate the maximum and minimum Z-score value.
Energies 17 05676 g002
Figure 3. Comparison of instruments measuring CO. (a) Absolute difference of the CO measurements by all instruments compared the reference CO analyzer (i.e., LABNDIR) vs. emission factor obtained from measurements made by the instruments during each test; (b) Median Z-score for all the tests performed by the analyzers measuring CO: LABNDIR, LABFTIR-1, PEMSQCL-IR, PEMSFTIR-1, LABFTIR-2, and PEMSFTIR-2. Dashed black lines indicate the maximum and minimum Z-score value.
Energies 17 05676 g003
Figure 4. Comparison of instruments measuring NH3. (a) Absolute difference of the NH3 measurements by all instruments compared the reference laboratory NH3 analyzers (i.e., LabFTIR-1 for the tests performed with the CNG vehicle and LabFTIR-2 for the tests performed with the Diesel engine) vs. emission factor obtained from measurements made by the instruments during each test; (b) Median Z-score for all the tests performed by the analyzers measuring NH3: PEMSQCL-IR, LABQCL-IR, PEMSFTIR-1, LABFTIR-2, and PEMSFTIR-2. Dashed black lines indicate the maximum and minimum Z-score value.
Energies 17 05676 g004
Figure 5. Comparison of instruments measuring N2O. (a) Absolute difference of the N2O measurements by all instruments compared the laboratory-grade N2O analyzers (i.e., LabFTIR-1 for the tests performed with the CNG vehicle and LabFTIR-2 for the tests performed with the Diesel engine) vs. emission factor obtained from measurements made by the instruments during each test; (b) Median Z-score for all the tests performed by the analyzers measuring N2O: LABFTIR-1, PEMSQCL-IR, LABQCL-IR, PEMSFTIR-1, LABFTIR-2, and PEMSFTIR-2. Dashed black lines indicate the maximum and minimum Z-score value.
Energies 17 05676 g005
Figure 6. Comparison of instruments measuring HCHO. (a) Absolute difference of the HCHO measurements by all instruments compared the laboratory-grade HCHO analyzers (i.e., LabFTIR-1 for the tests performed with the CNG vehicle and LabFTIR-2 for the tests performed with the Diesel engine) vs. emission factor obtained from measurements made by the instruments during each test; (b) Median Z-score for all the tests performed by the analyzers measuring HCHO: LABFTIR-1, PEMSQCL-IR, PEMSFTIR-1, LABFTIR-2, and PEMSFTIR-2. Dashed black lines indicate the maximum and minimum Z-score value.
Energies 17 05676 g006
Figure 7. Comparison of instruments measuring CO2. (a) Absolute difference of the CO2 measurements by all instruments compared the reference CO2 analyzer (i.e., LABNDIR) vs. emission factor obtained from measurements made by the instruments during each test; (b) Median Z-score for all the tests performed by the analyzers measuring CO2: LABNDIR, LABFTIR-1, PEMSQCL-IR, LABQCL-IR, PEMSFTIR-1, LABFTIR-2, and PEMSFTIR-2. Dashed black lines indicate the maximum and minimum Z-score value.
Energies 17 05676 g007
Figure 8. Example of concentration of water in the CNG exhaust measured by the FTIR instruments: LABFTIR-1 (blue line and on the x axis of Figure c,d), PEMSFTIR-1 (orange line and marker), LABFTIR-2 (grey line and marker), and PEMSFTIR-2 (yellow line and marker) during: (a) WHVCCold; and (b) a WHVCHot; (c) Comparison of the concentrations measured by PEMSFTIR-1, LABFTIR-2, and PEMSFTIR-2 vs. LABFTIR-1 during a WHVCCold; (d) Comparison of the concentrations measured by PEMSFTIR-1, LABFTIR-2, and PEMSFTIR-2 vs. LABFTIR-1 during a WHVCHot.
Energies 17 05676 g008
Figure 9. Comparison of emissions factors resulting from the dry-to-wet correction using the carbon balance approach, i.e., Equation (2), (orange markers) and the water based correction, i.e., Equation (4), (blue markers), for all tests performed with the CNG vehicle (solid markers) and the Diesel engine (empty markers). The CNG vehicle was tested over the WHVCCold, WHVCHot, and ISC and the Diesel engine was tested over the WHTCCold, WHTCHot, and ISC. The square markers correspond to tests performed with the CNG at 0 °C and triangles at 23 °C. (a) CO2 emission factors; (b) CO emission factors.
Energies 17 05676 g009
Table 1. Gaseous compounds measured with the studied instruments.
InstrumentNOxCH4CONH3N2OHCHOCO2H2O
LABCLDX-------
LABNDIR--X---X-
LABFID-X------
LABFTIR-1XXXXXXXX
LABFTIR-2XXXXXXXX
LABQCL-IRX--XX*--
PEMSFTIR-1XXXXXXXX
PEMSFTIR-2XXXXXXXX
PEMSQCL-IRXXXXXXX-
* Not available in this study but covered by Suarez-Bertoa et al., 2022 [24]. “X” stands for Measured; “-“ stands for not measured.
Table 2. Main features of the CNG HD vehicle and the Diesel HD engine tested.
3CNG HD VehicleDiesel HD Engine
Vehicle categoryN3-
Emission standardEuro VI Step EEuro VI Step E
Fuel typeCNGDiesel
Length (mm)9765-
Vehicle mass in running order (kg)15,525-
Vehicle technically permissible max laden mass (kg)26,000-
Axle layout3 axis-6 wheels-8 tires-
Working principleSpark ignitionCompression ignition
Engine configuration6 cylinders in line6 cylinders in line
Engine size (cm3)871012,800
Maximum power251 kW @ 2000 rpm405 kW @ 1700 rpm
GearboxAutomatic-
After-treatment configurationTWCDOC + DPF + SCR/ASC
CNG: compressed natural gas; TWC: Three-way catalyst; DOC: Diesel oxidation catalyst; DPF: Diesel particulate filter; SCR: selective catalytic reduction system; ASC: ammonia slip catalyst. Dash line (-) indicates not applicable for the engine.
Table 3. Instruments main features.
Instrument CodeCommercial NameSampling Rate (L/min)Spectral Resolution (cm−1)Optical Path (m)Acquisition Frequency (Hz)
LABFTIR-1AVL SESAM 16.50.521
LABFTIR-2IAG Versa06 LP 280.55.115
LABQCL-IRHORIBA MEXA-ONE-XL-NX 18<0.0112.410
PEMSFTIR-1AVL MOVE FT5.50.551
PEMSFTIR-2IAG OPS 280.55.115
PEMSQCL-IRVERIDRIVE 33.3<0.01510
1 [25]; 2 [26]; 3 [27].
Disclaimer/Publisher’s Note: The statements, opinions and data contained in all publications are solely those of the individual author(s) and contributor(s) and not of MDPI and/or the editor(s). MDPI and/or the editor(s) disclaim responsibility for any injury to people or property resulting from any ideas, methods, instructions or products referred to in the content.

