Article

Multi-Criteria Optimization of the Paper Production Process Using Numerical Taxonomy Methods: A Necessary Condition for Predicting Heat and Electricity Output in a Combined Heat and Power (CHP) System

1
Polenergia Obrót S.A., ul. Krucza 24/26, 00-526 Warszawa, Poland
2
Faculty of Civil Engineering and Resources Management, AGH University of Krakow, al. Mickiewicza 30, 30-059 Krakow, Poland
3
Faculty of Electrical Engineering, Automatics, Computer Science and Biomedical Engineering, AGH University of Krakow, al. Mickiewicza 30, 30-059 Krakow, Poland
*
Author to whom correspondence should be addressed.
Energies 2024, 17(22), 5548; https://doi.org/10.3390/en17225548
Submission received: 21 October 2024 / Revised: 1 November 2024 / Accepted: 4 November 2024 / Published: 6 November 2024
(This article belongs to the Section J: Thermal Management)

Abstract

:
The subject of this study is the optimization of the paper production process in one of Poland’s leading paper mills. In addition to its primary objective of paper production, the company generates heat and electricity for internal consumption and external clients, including the local municipality. Surplus energy may be sold on the power exchange; however, this requires forecasting the quantity of energy to be sold 24 h in advance, which introduces an element of uncertainty. Production stoppages, often caused by random events such as paper breakage, force a power decrease in the CHP system, further complicating energy forecasting. To minimize the occurrence of such events, numerical taxonomy methods were employed to determine the optimal screen speed (Vs) and winding speed (Vn) for two paper machines, based on the type and weight of the paper produced. This analysis utilized detailed daily data collected by the company over the period 2015–2020. The findings contribute to minimizing the occurrence of paper roll tearing, thereby reducing the risk of inaccurate forecasts of the energy and heat produced by the CHP system. Furthermore, the methodology employed in this study may be effectively applied to other optimization problems in industrial processes.

1. Introduction

The term “taxonomy” is derived from the Greek word “taksis” (meaning ordering) and “nomos” (meaning principle). In the English-language literature, the term “taxonomy” or “numerical taxonomy” are commonly employed, while in American academic discourse, the term “cluster analysis” is more prevalent. The term “cluster analysis” is also found in the Polish literature [1,2].
Taxonomic methods are applied across various scientific fields. In medicine, for example, they support the classification of viruses and bacteria based on clinical characteristics [3,4] and have been used to organize healthcare guidelines during the COVID-19 pandemic [5,6,7]. In the natural sciences, these methods assist in modeling and visualizing phenomena such as cloud formation [8].
In the economic and social sciences [9], the topics addressed can vary widely, yet the methods employed remain rooted in taxonomy. This approach encompasses various analyses and classifications. For instance, one can analyze capital markets, economic strategies, spatial analyses, and quality of life [10]. In Slovenia, researchers group municipalities into socio-economically homogeneous clusters, revealing developmental differences between the Eastern and Western regions of the country [11]. Similarly, in Portugal, continental regions are classified by socio-economic indicators to inform regional development policies [12].
Furthermore, a multidimensional approach is used to assess regional disparities in Greece, uncovering uncovered the limited development convergence that occurred from 1995 to 2007 [13]. Global cluster policies are also investigated, with a focus on the socio-economic and institutional factors that influence regional clusters, as illustrated by a case study on Russia [14]. In the Volyn region of Ukraine, rural regions are classified based on their socio-economic conditions, employing spatial clustering to evaluate the development potential of farms [15]. Additionally, taxonomic methods are applied to analyze socio-economic factors in both social and economic research [16], and multidimensional analysis is utilized to assess and categorize socio-economic development levels across different regions [17].
Despite these diverse topics, these studies demonstrate a common methodological foundation in taxonomic analysis: to classify and understand socio-economic patterns across various contexts.
The authors of these studies focused on identifying and analyzing regional economic inequalities, employing cluster analysis to group territorial units according to different socio-economic indicators. These analyses helped to identify the factors that drive regional development and understand the differences between regions:
In capital market analysis, strategy building, space analysis, and quality-of-life analysis [9,18];
In the analysis of investment portfolios [19,20,21].
In investment portfolio analysis, taxonomic methods have been applied to classify assets for improved diversification. For example, one study clusters companies from the LQ-45 index to form optimized portfolios by grouping stocks with similar characteristics [19]. Another study employs an iterative algorithm to create a “fundamental portfolio” with minimized risk, using semivariance to enhance diversification [20]. Additionally, clustering methods applied to the Russell 1000® index demonstrate that clustered portfolios achieve greater stability and lower volatility compared to Mean-Variance Optimization [21].
Asset diversification has been demonstrated to be an effective strategy for reducing risk, and in certain cases, taxonomic methods have proven more efficient than traditional approaches [22,23]. Moreover, taxonomic methods have shown effectiveness as tools for product measurement and optimization [24].
In the realm of technical and engineering sciences, research has focused on the optimization of the enrichment process for different lithological types of Polish copper ore [25,26]. This study examined the impact of a four-dimensional vector of independent variables on a three-dimensional vector of flotation process outcomes, ultimately leading to process optimization through numerical taxonomy. Additionally, taxonomic methods have been combined with deep learning approaches for wind and solar energy forecasting [27]. In the energy sector, a chapter in a monograph utilized cluster analysis to conduct a statistical comparison of Poland’s energy security with other European Union countries [28]. Another study applied hierarchical methods based on the Euclidean metric and taxonomic grouping to evaluate European countries in terms of energy transition [29].
In military sciences, researchers have introduced a new approach to analyzing complex multivariate objects using numerical taxonomy. This method is illustrated through the example of a “master object”, which serves as a reference point for comparing other objects [30].
The research presented here was carried out on the basis of historical data collected for the years 2015–2020 from a large paper plant in Poland, which is also a combined heat and power plant producing heat and electricity not only for its own needs but also for external customers. In this plant, the necessity to manage the generation processes occurrs in a way that allows for the sale of surplus energy on the energy market. A key requirement for such sales is the accurate prediction of heat and electricity generation.
However, under the plant’s operational conditions, this process is hindered by unexpected disruptions in paper production, which result in a reduction in available heat in the gas–steam system. These disruptions arise from various factors, including sudden irregularities in the paper roll, which necessitate the release of steam by the paper machine, leading to periods of machine downtime. Consequently, minimizing these operational interruptions would substantially improve the accuracy of energy production forecasting at any given time. Such optimization can be accomplished by adjusting the paper production process based on the type and weight of the paper, as well as the machine’s primary operational parameters, specifically:
  • Screen speed Vs;
  • Winding speed Vn.
The objective of this study is to determine, for a given type and weight of paper, the optimal values of Vs and Vn that would minimize machine downtime, thereby enhancing the efficiency and continuity of the paper production process. Numerical taxonomy methods were applied to achieve this optimization.

2. Materials and Methods

In the paper mill under study, due to the significant energy demands of the paper production process, heat and electricity are generated using a gas–steam cogeneration system. This system offers several advantages, including increased efficiency of energy generation, reduced costs of energy production, and a corresponding decrease in the cost of purchasing emission allowances and minimized environmental impact [31].
In the CHP system, the desired operational parameters are achieved by configuring vents and reduction-cooling stations within the steam section.
Priority for heat utilization is given to the MP1 and MP2 paper machines, which operate continuously and require a steady supply of heat 24 h a day.

2.1. Paper Mill

The selected paper mill is one of the largest producers of offset paper in Poland. It specializes in the production of modern paper designed for high-speed inkjet printing technology, as well as uncoated, wood-free paper that is extensively used in various printing applications, such as the production of brochures, envelopes, books, and documents. The company employs over 400 individuals and continuously strives to improve cost efficiency, emphasizing the efficient use of natural resources and minimizing environmental footprint.
In addition to paper production, the plant’s economic activities encompass the generation of heat and electricity, as well as the selling of surplus energy to meet the demands of both internal and external customers. Heat, in the form of steam, is supplied to various end-users, including the following:
  • Pulping process;
  • MP1 paper machine;
  • MP2 paper machine;
  • External companies;
  • The plant’s own internal energy requirements;
  • Exchangers, which distribute hot water for heating purposes to a range of facilities, such as the following:
    The paper-processing department;
    The product and raw material preparation department;
    Paper machine exchangers;
    Finished product warehouse;
    Office buildings;
    On-site stores;
    The municipal heating network.
A challenge faced by the company is the instability of the system caused by sudden “jerks” in the paper machines, which occur when a roll of paper breaks. This results in an interruption to the machine’s operation, leading to the discharge of steam, which forces the machine to halt. To maintain the functioning of the steam turbines or to minimize their power output, steam must be diverted to specially designed blowout mechanisms. These sudden disruptions in the paper machines complicate the prediction of useful heat and electricity generated by the system. Therefore, minimizing the frequency of these “jerks” and the associated machine downtime is essential for improving system efficiency.

2.2. Numerical Taxonomy

Numerical taxonomy is based on a multidimensional comparative analysis, which involves the classification and ordering of multifeature statistical objects, each described by a specific set of variables (features) [30,32]. The application of the taxonomic method can be divided into several stages:
  • Stage I—Formation of the Diagnostic Feature Matrix
The first step involves constructing a matrix of diagnostic features, denoted as C:
C = C 11 C 12 C 21 C 22 C k 1 C k 2 C 1 n C 2 n C k n
where C i · = C i 1 , C i 2 , , C i n —feature vector of the i-th object in k objects, i 1 , , k ; C · j = C 1 j , C 2 j , , C k j —vector of the j-th feature, j 1 , , n .
  • Stage II—Normalization of Features
Next, to standardize the numerical values of features and normalize (or standardize) the vectors of individual features, the feature vectors (i.e., columns of matrix C) are normalized. Two common methods are as follows:
Normalization [25,26]:
x i j = C i j max i C i j , i 1 , , k j 1 , , n
Standardization [30]:
x i j = C i j C j ¯ σ j , i 1 , , k , j 1 , , n
where
C j ¯ = 1 k i = 1 k C i j
σ j = 1 k j = 1 k C i j C j ¯ 2
This process results in a new matrix X = x i j k x n .
  • Stage III—Determination of the Pattern Vector
For the matrix X, the coordinates of the pattern vector w are determined:
w = w 1 , , w n
The pattern vector coordinates can be determined, for example, as follows [30,33,34]:
For stimulants (features where higher values are better):
w j = max i x i j for   j 1 , , n
For destimulants (features where lower values are better):
w j = min i x i j    for j 1 , , n
In cases where the features are standardized, the following is assumed:
w j = 1 ,   j 1 , , n
  • Stage IV—Calculation of Distances
The distances of d x i · , w for each row of the matrix X (representing the studied objects) from the pattern vector w are calculated sequentially. The most commonly used distance metric is the Euclidean distance, though other distance metrics such as the Manhattan distance (formerly referred to as “taxi distance”), maximum distance, Mahalanobis distance, or the hyperbolic distance can also be employed [2,35,36,37]. By comparing these distances, the objects can be ranked in either ascending or descending order.
For stimulants, the optimal value is the largest value (i.e., the smallest distance from the pattern), whereas for destimulants, the optimal value is the smallest (i.e., the greatest distance from the pattern) [38].

2.3. Adopted Methodology

In this study, taxonomic methods based on the Euclidean metric were utilized for a multi-criteria analysis and classification of data based on their quantitative characteristics.
These methods were applied to optimize the smoothness of the paper production process, which has a direct impact on the accuracy of predicting the amount of heat and electricity produced by the plant. Taxonomic methods using Euclidean metrics facilitate the hierarchical ordering of the studied objects.

3. Experiment

In this analysis, for the given ranges of screen speed (Vs) and winding speed (Vn) during the year under review, for a specific type of paper, the following total times were recorded [2]:
  • Production time (T1);
  • Downtime (T2);
  • Assortment change time (T3);
  • Spurt time (i.e., machine jerking or stopping) (T4).
Subsequently, the probabilities of these events were calculated as follows:
  • Production probability:
    P 1 = T 1 T i
  • Downtime probability:
    P 2 = T 2 T i
  • Assortment change probability:
    P 3 = T 3 T i
  • Spurt probability:
    P 4 = T 4 T i
The goal was to find such configurations of Vs and Vn that would simultaneously yield P 1 ( m a x )   and P 2 ( m i n ) , P 3 ( m i n ) , and P 4 ( m i n ) .
Since P1 is a stimulant (higher values are better), and P2, P3, and P4 are destimulants (lower values are better), feature Q = 1 P 1 was introduced to transform P1 into a destimulant [39]. In this way, the task became one of minimizing Q, P2, P3, and P4.
In the first stage, based on historical data collected from 2015 to 2020, the full ranges of variability in Vs and Vn for each specific paper type produced each year were determined. These ranges were divided into six smaller classes (intervals) to create a matrix of probabilities for each event within the given speed ranges.
The next step involved normalizing the data (for Q, P2, P3, and P4) using the formula
v = Q Q m a x , P 2 P 2 m a x , P 3 P 3 m a x , P 4 P 4 m a x
The reference vector is w = 1 ,   1 ,   1 ,   1 .
Finally, the Euclidean distance D = d v , w was calculated as follows:
D = d v , w = 1 Q Q m a x 2 + 1 P 2 P 2 m a x 2 + 1 P 3 P 3 m a x 2 + 1 P 4 P 4 m a x 2
for each year, for each paper type, and for various ranges of Vs and Vn.
This study analyzed data collected from 2015 to 2020, covering various paper types: A-60, A-70, A-80, A-90, A-100, B-70, B-756, B-80, C-70, C-80, and C-90.
Table 1 presents the results of subsequent stages of calculations for the production of A-80 paper for 2020. A summary of the best results for subsequent years, paper types, and both paper machines (MP1 and MP2) is provided for comparison.
This analysis focuses on the probability matrix, which was developed for specific ranges of sieve speed (Vs) and winding speed (Vn) to evaluate the occurrence of particular phenomena during the paper production process. It was determined that only certain velocity ranges—those where specific types of production phenomena were observed—could be considered for analysis. Table 2 provides a comparison of the considered ranges for sieve speed (Vs) and winding speed (Vn) with the corresponding values of the probabilities of the key phenomena (production, downtime, assortment change, and spurt) and the Euclidean distance calculated for each range. This is exemplified using A-80 paper from the year 2020.
Based on the calculated distances, the objects can be ranked in either ascending or descending order. In descending order, the ranking is as follows: O9, O1, O7, O8, O5, O3, O6, O2, and O4. It is visualized in Figure 1.
By applying this method, a ranking of objects—specifically the velocity ranges of Vs and Vn—was obtained. The optimal configuration corresponds to the range with the greatest normalized distance from the reference vector. The comparative results are summarized in Table 3.
The aforementioned ranking demonstrates that the optimal results for P1(max), P2(min), P3(min), and P4(min) were achieved for object O9, corresponding to the range of 932–950 for Vs and 975–992 for Vn.
Similar calculations were performed for each type of paper considered across the years 2015 to 2020 for both paper machines. Using the same methodology, the optimal velocity ranges of Vs and Vn were determined for each case. The results are summarized in Table 4 and Table 5 (Table 4 pertains to the MP1 paper machine, while Table 5 pertains to the MP2 paper machine). The symbols A, B, C, D, and E represent specific types of paper, and the numerical values that follow (60, 70, 80, etc.) denote the weight of the paper.
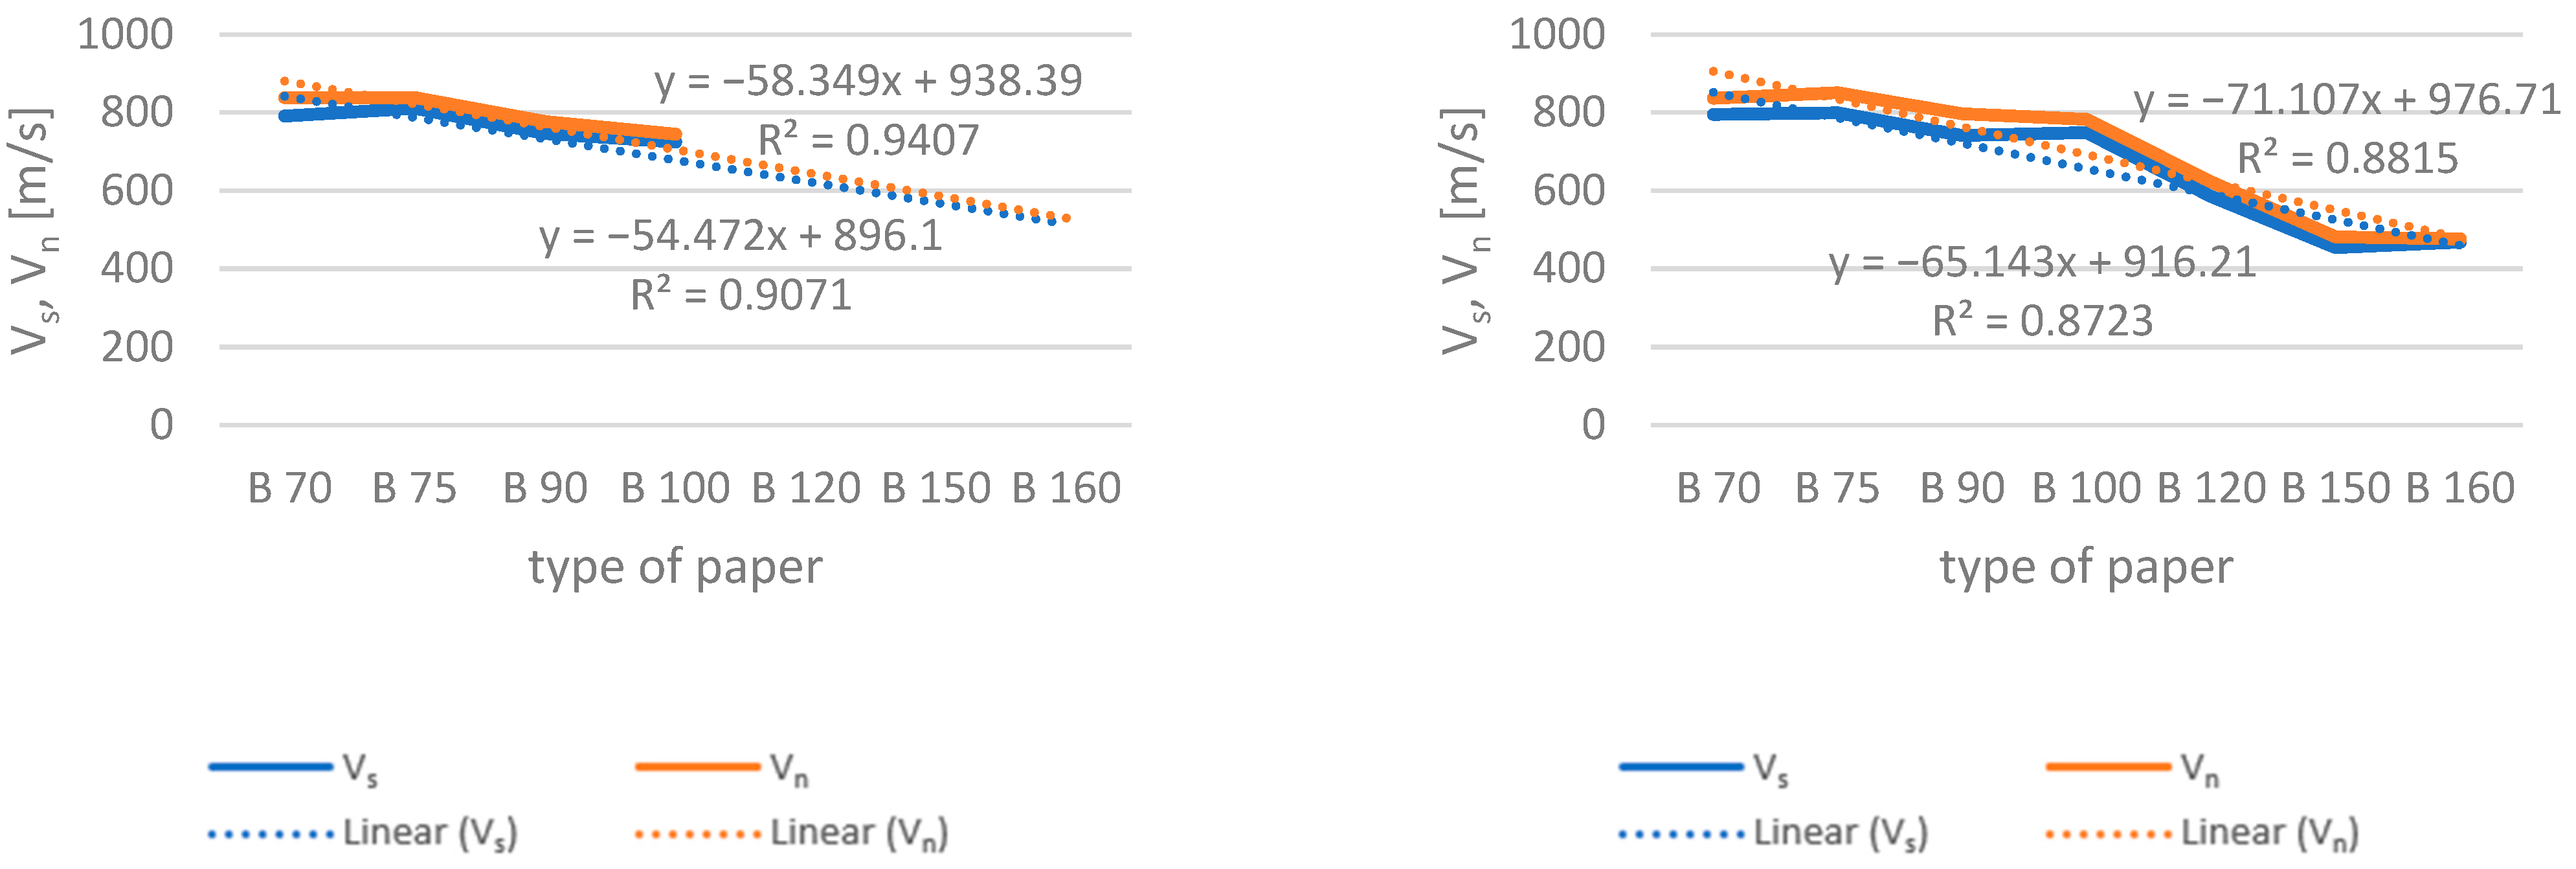
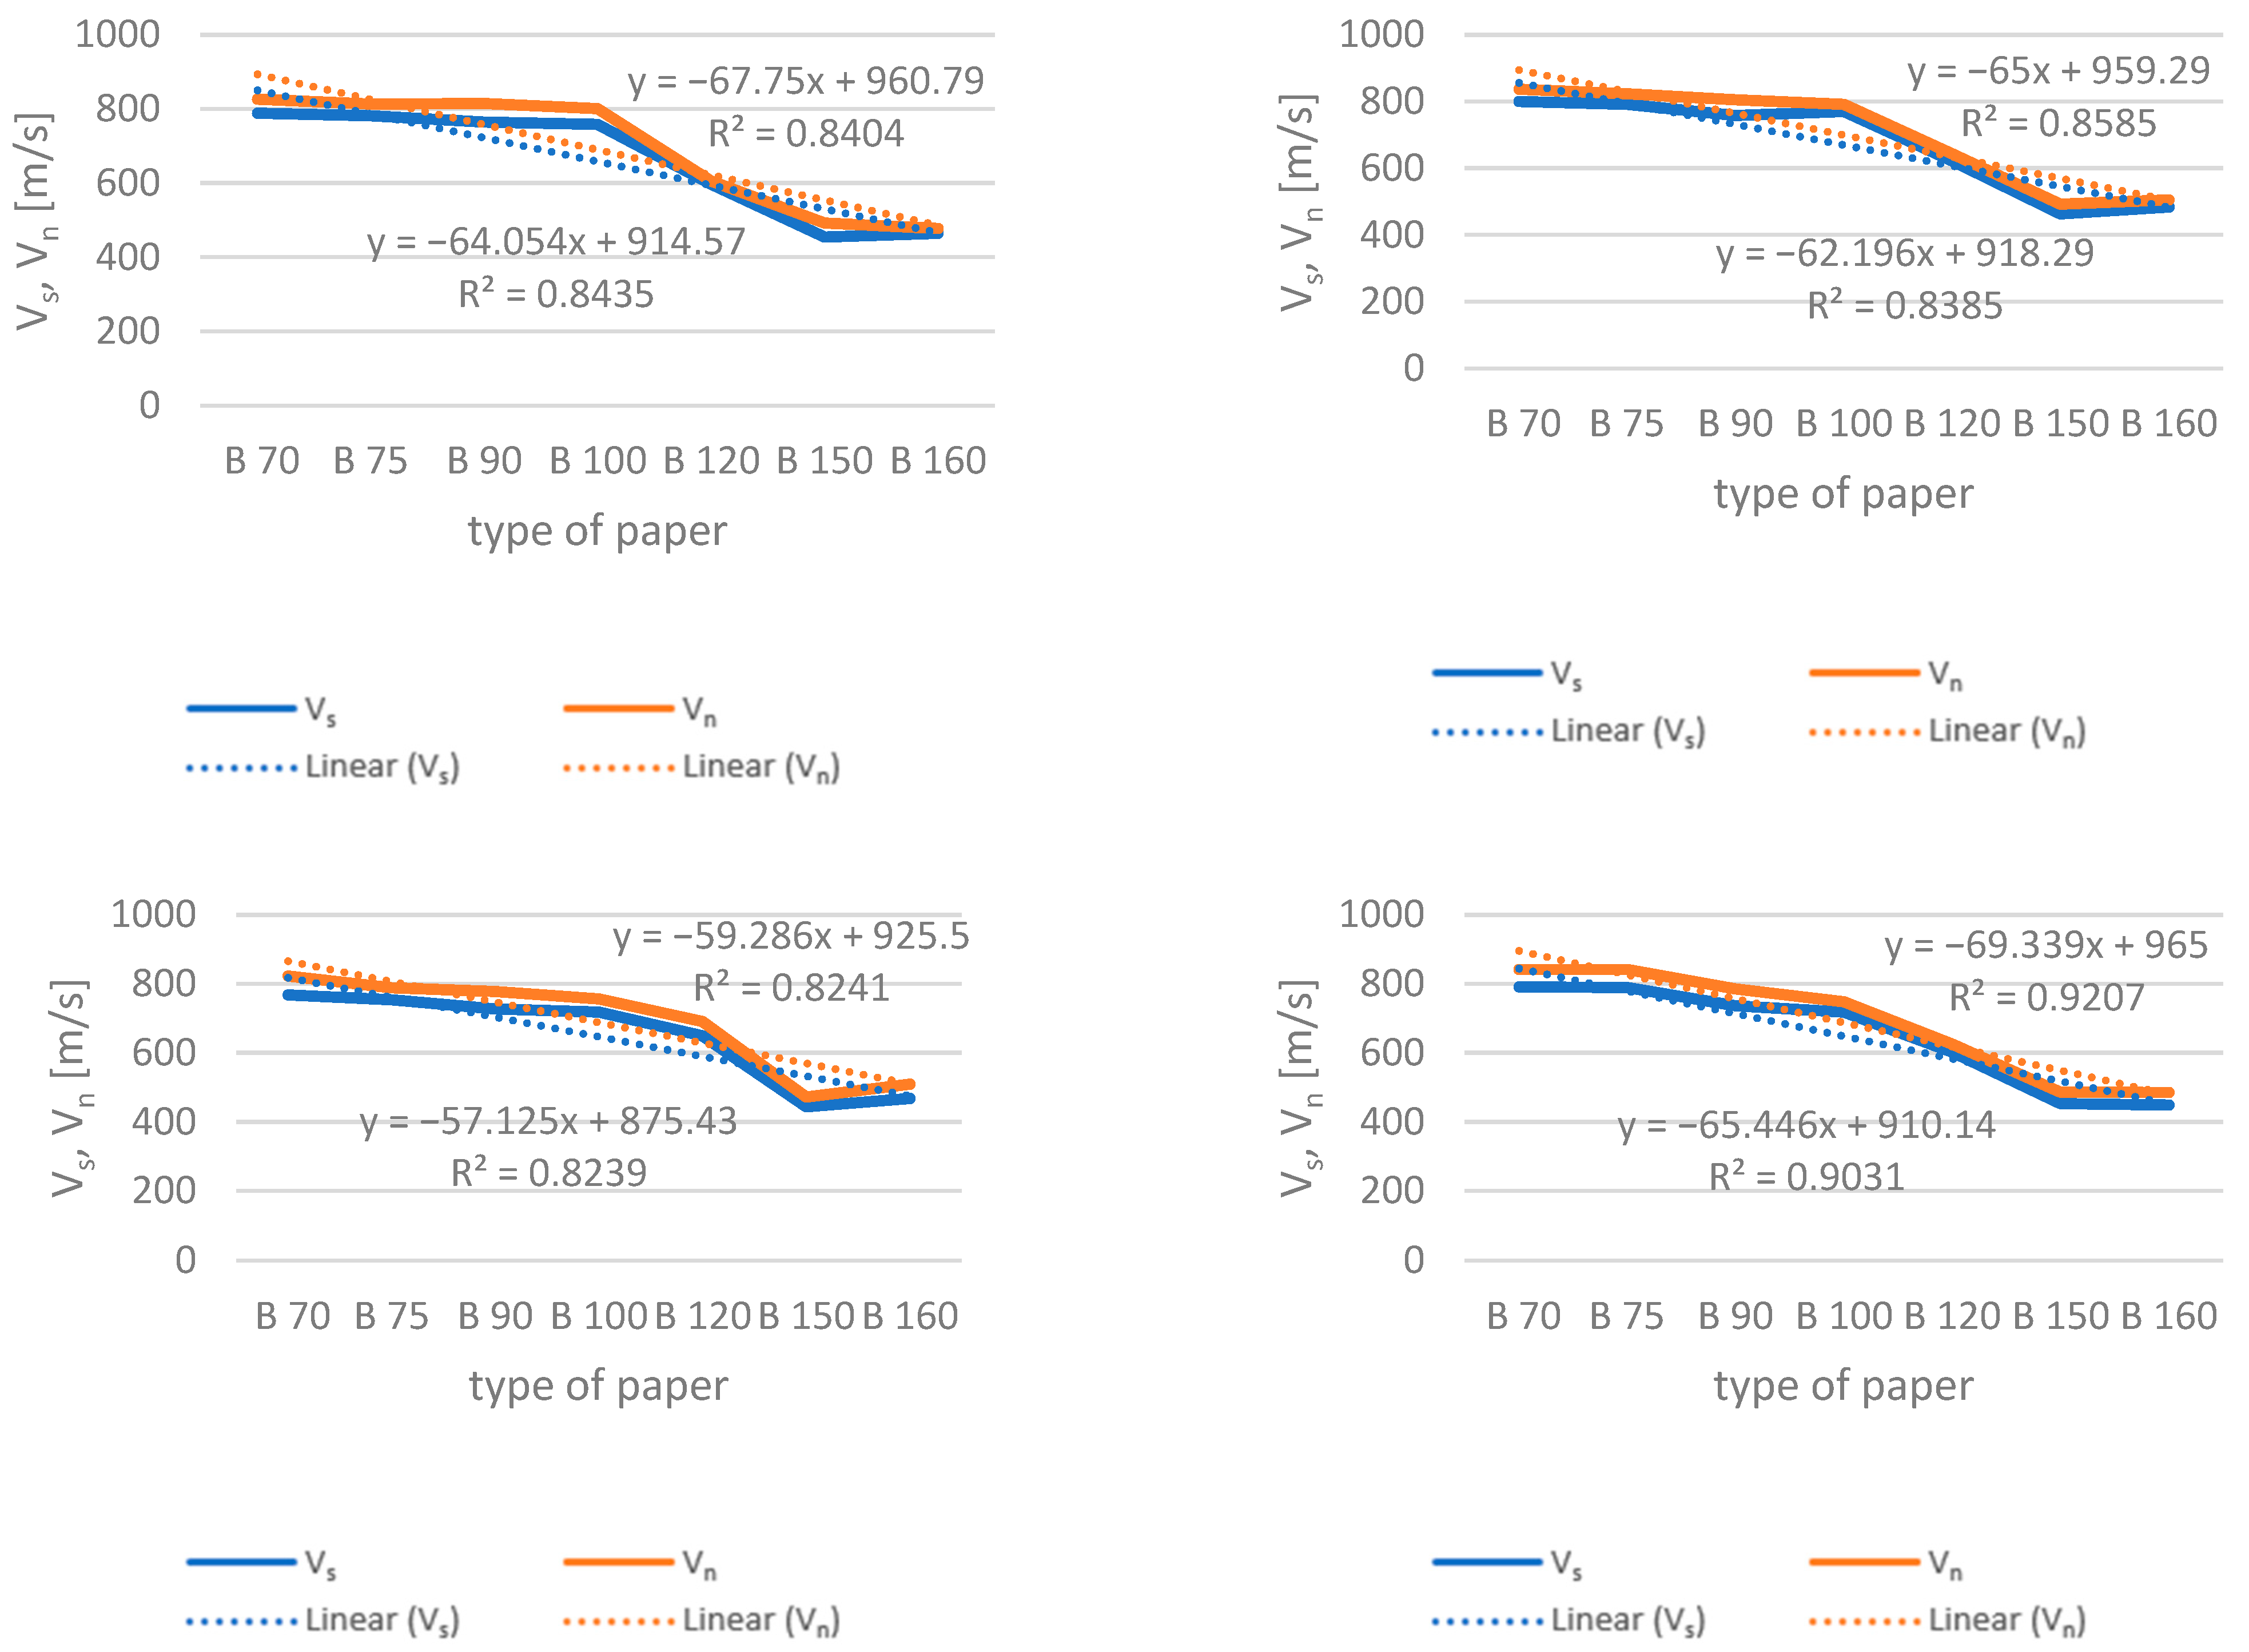
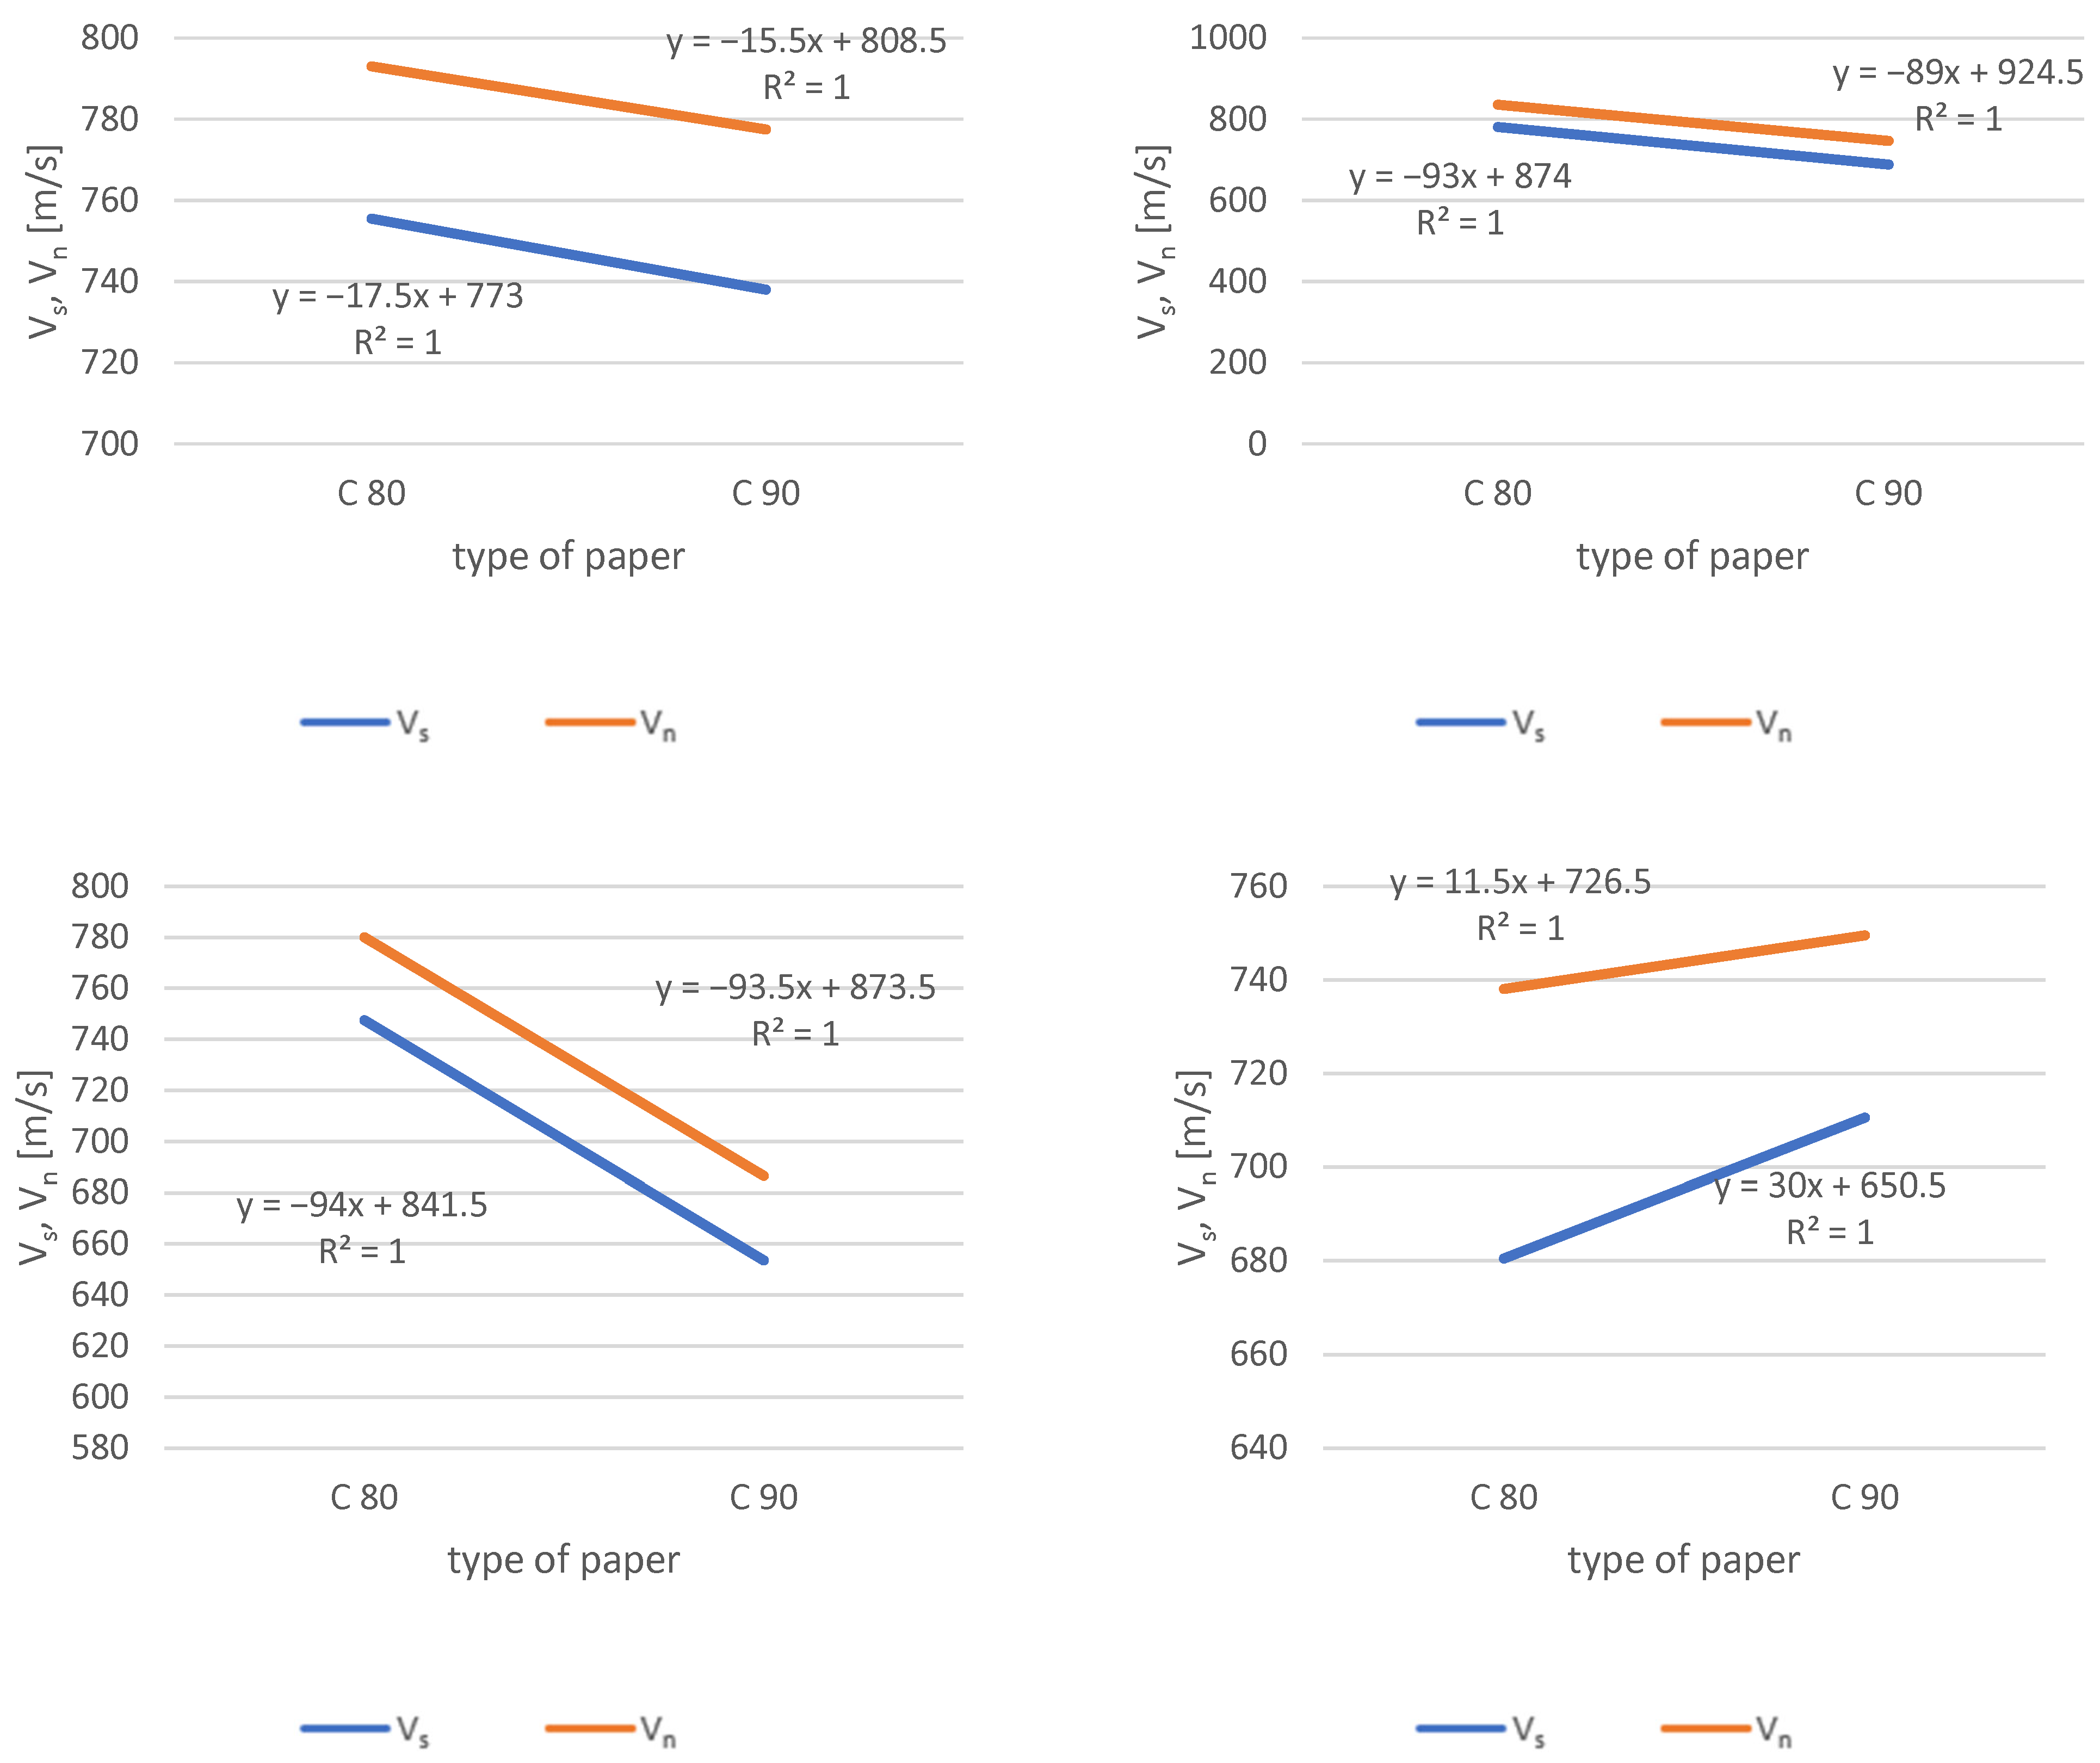
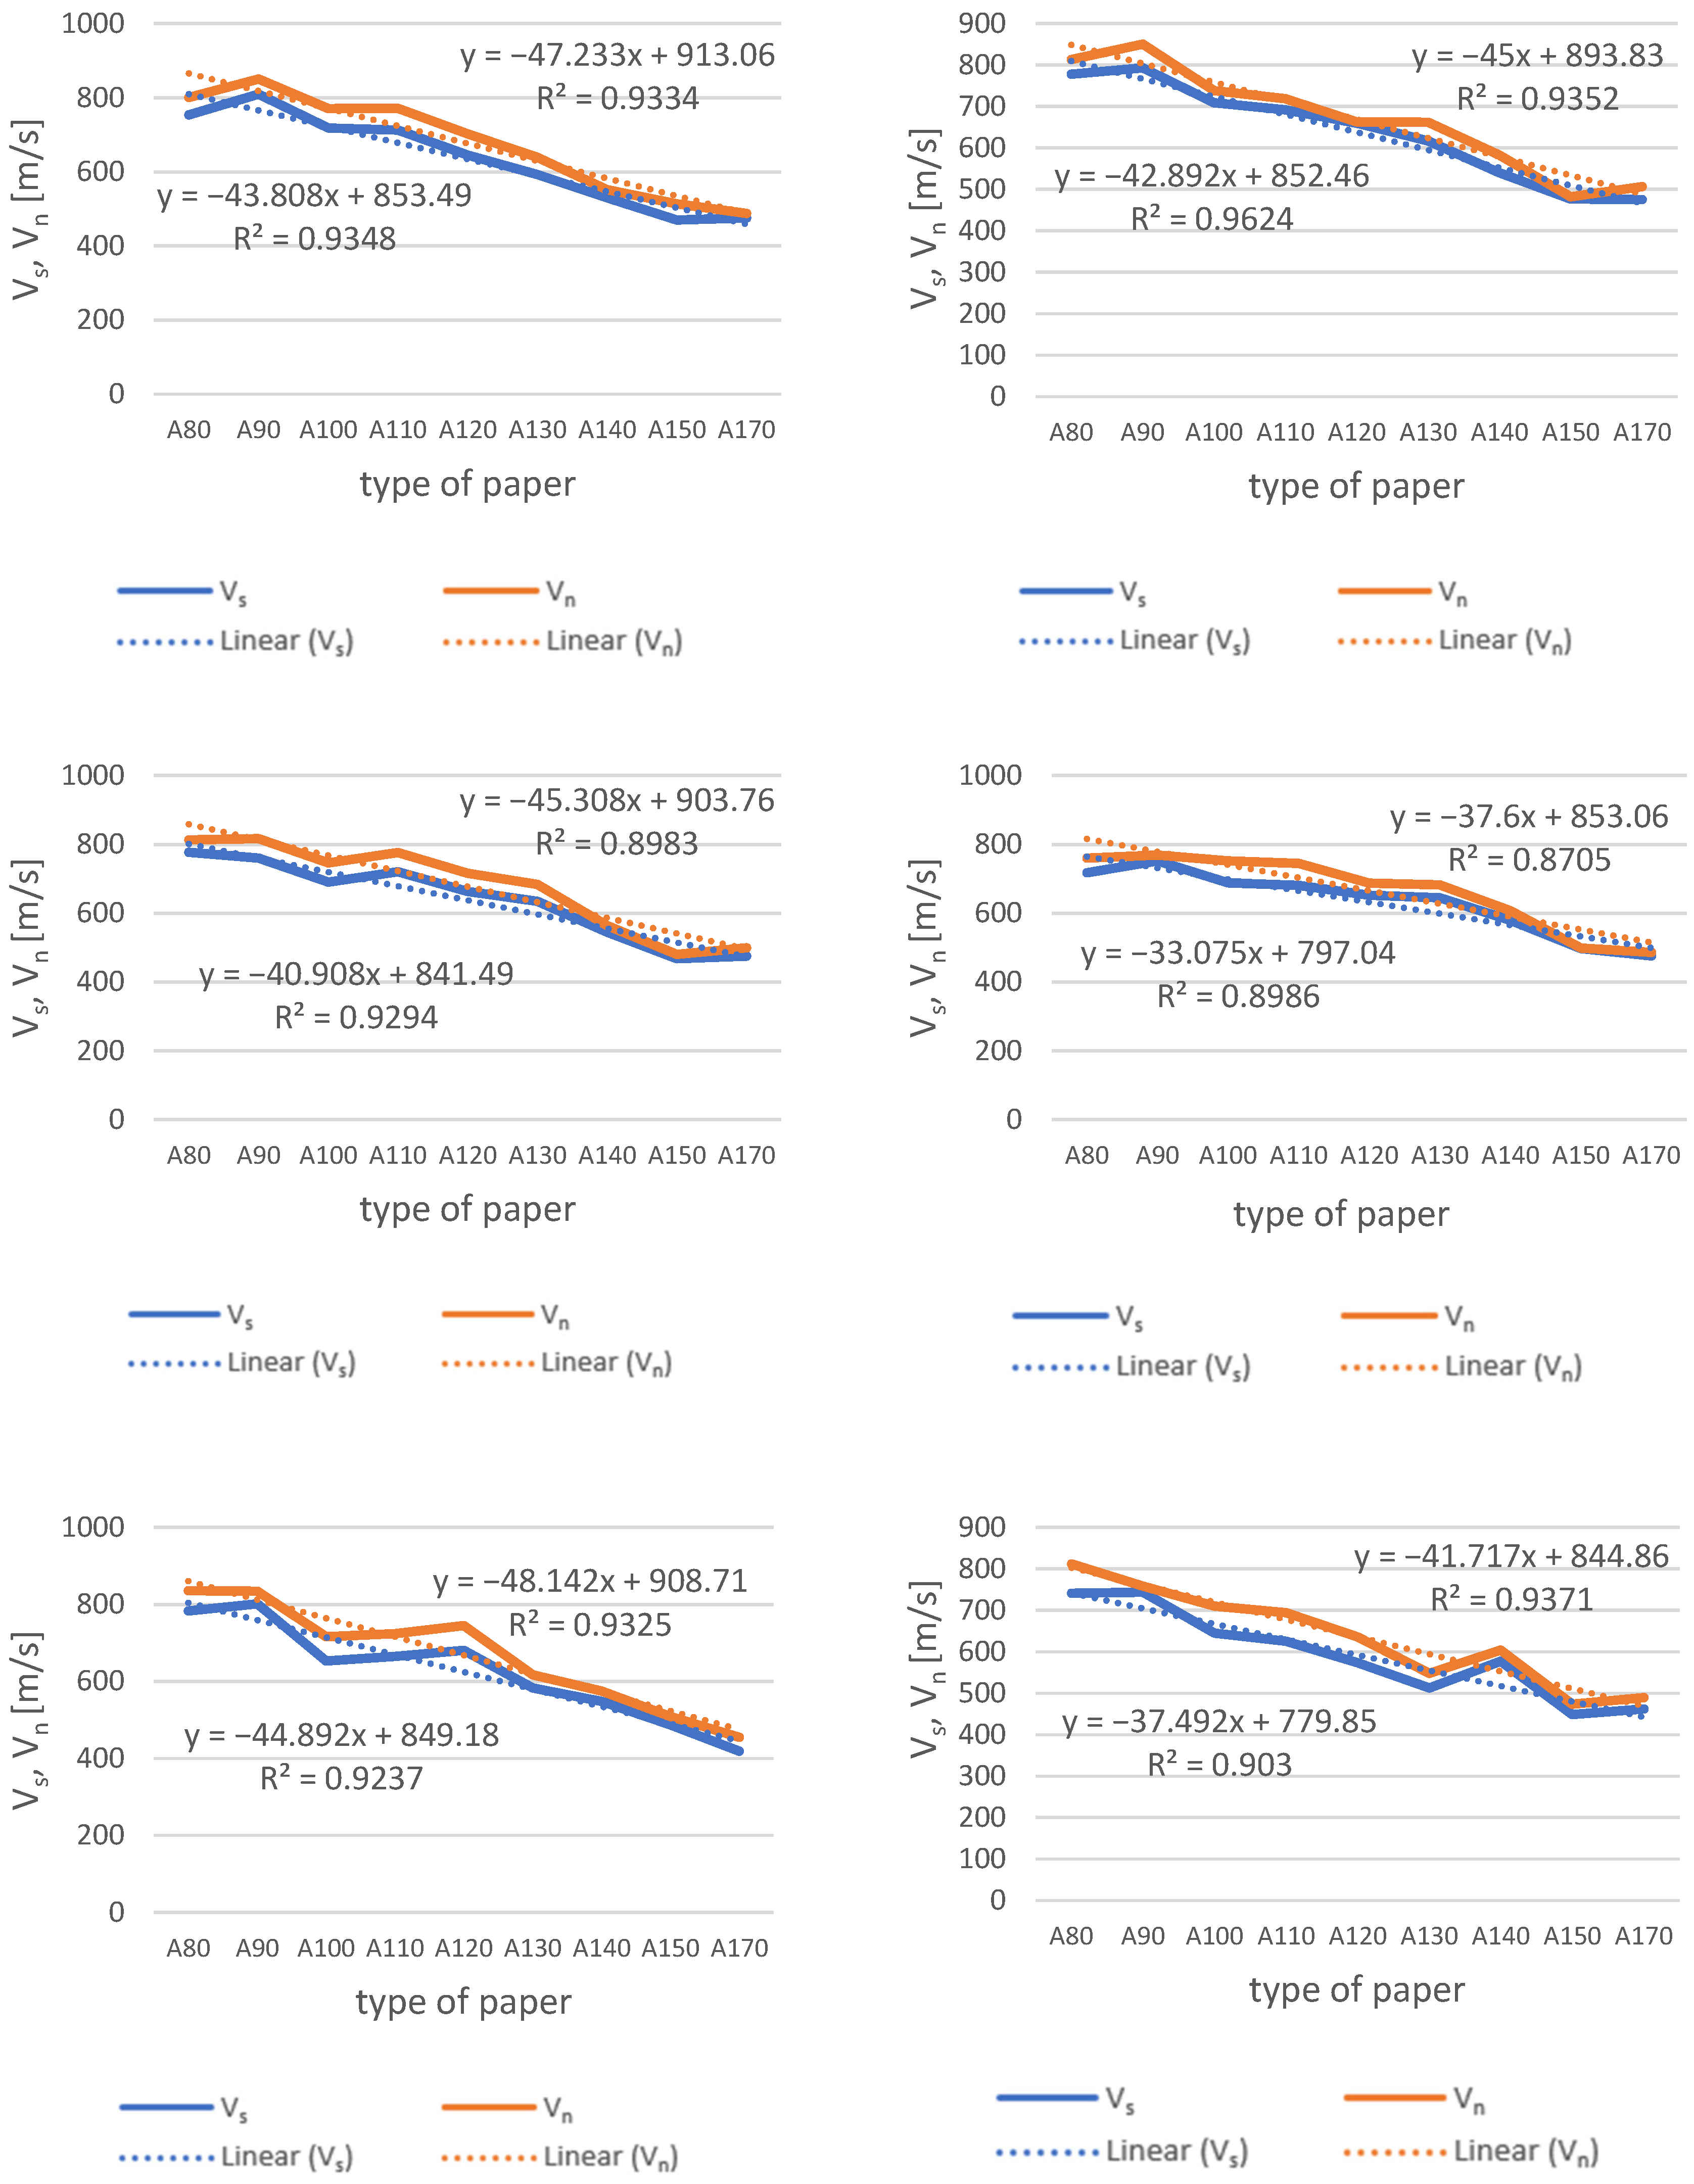
Based on the data presented in Table 4 and Table 5, trend equations were established to illustrate the variation in velocity Vs and Vn in relation to the type of paper for the years under consideration.
The graphs depicting these relationships for the MP2 paper machine, covering the years 2015 to 2020 for paper type A, are collectively summarized in Figure 2.
Analogous graphs were created for other types of paper machines and are included in Appendix A (Figure A1 and Figure A2). These visual representations facilitate a clearer understanding of how velocity adjustments correlate with the specific paper types produced during the examined period.
The graphs presented here illustrate a trend whereby the values of the optimal velocity ranges of Vs and Vn exhibit a decreasing pattern as the weight of the paper increases. The resulting R2 values for all regression equations are notably high, approximately 0.9, indicating a strong correlation between paper grammage and the optimal speed ranges. This suggests that as the grammage of a given type of paper increases, the corresponding values of the optimal speed ranges of Vs and Vn decline.
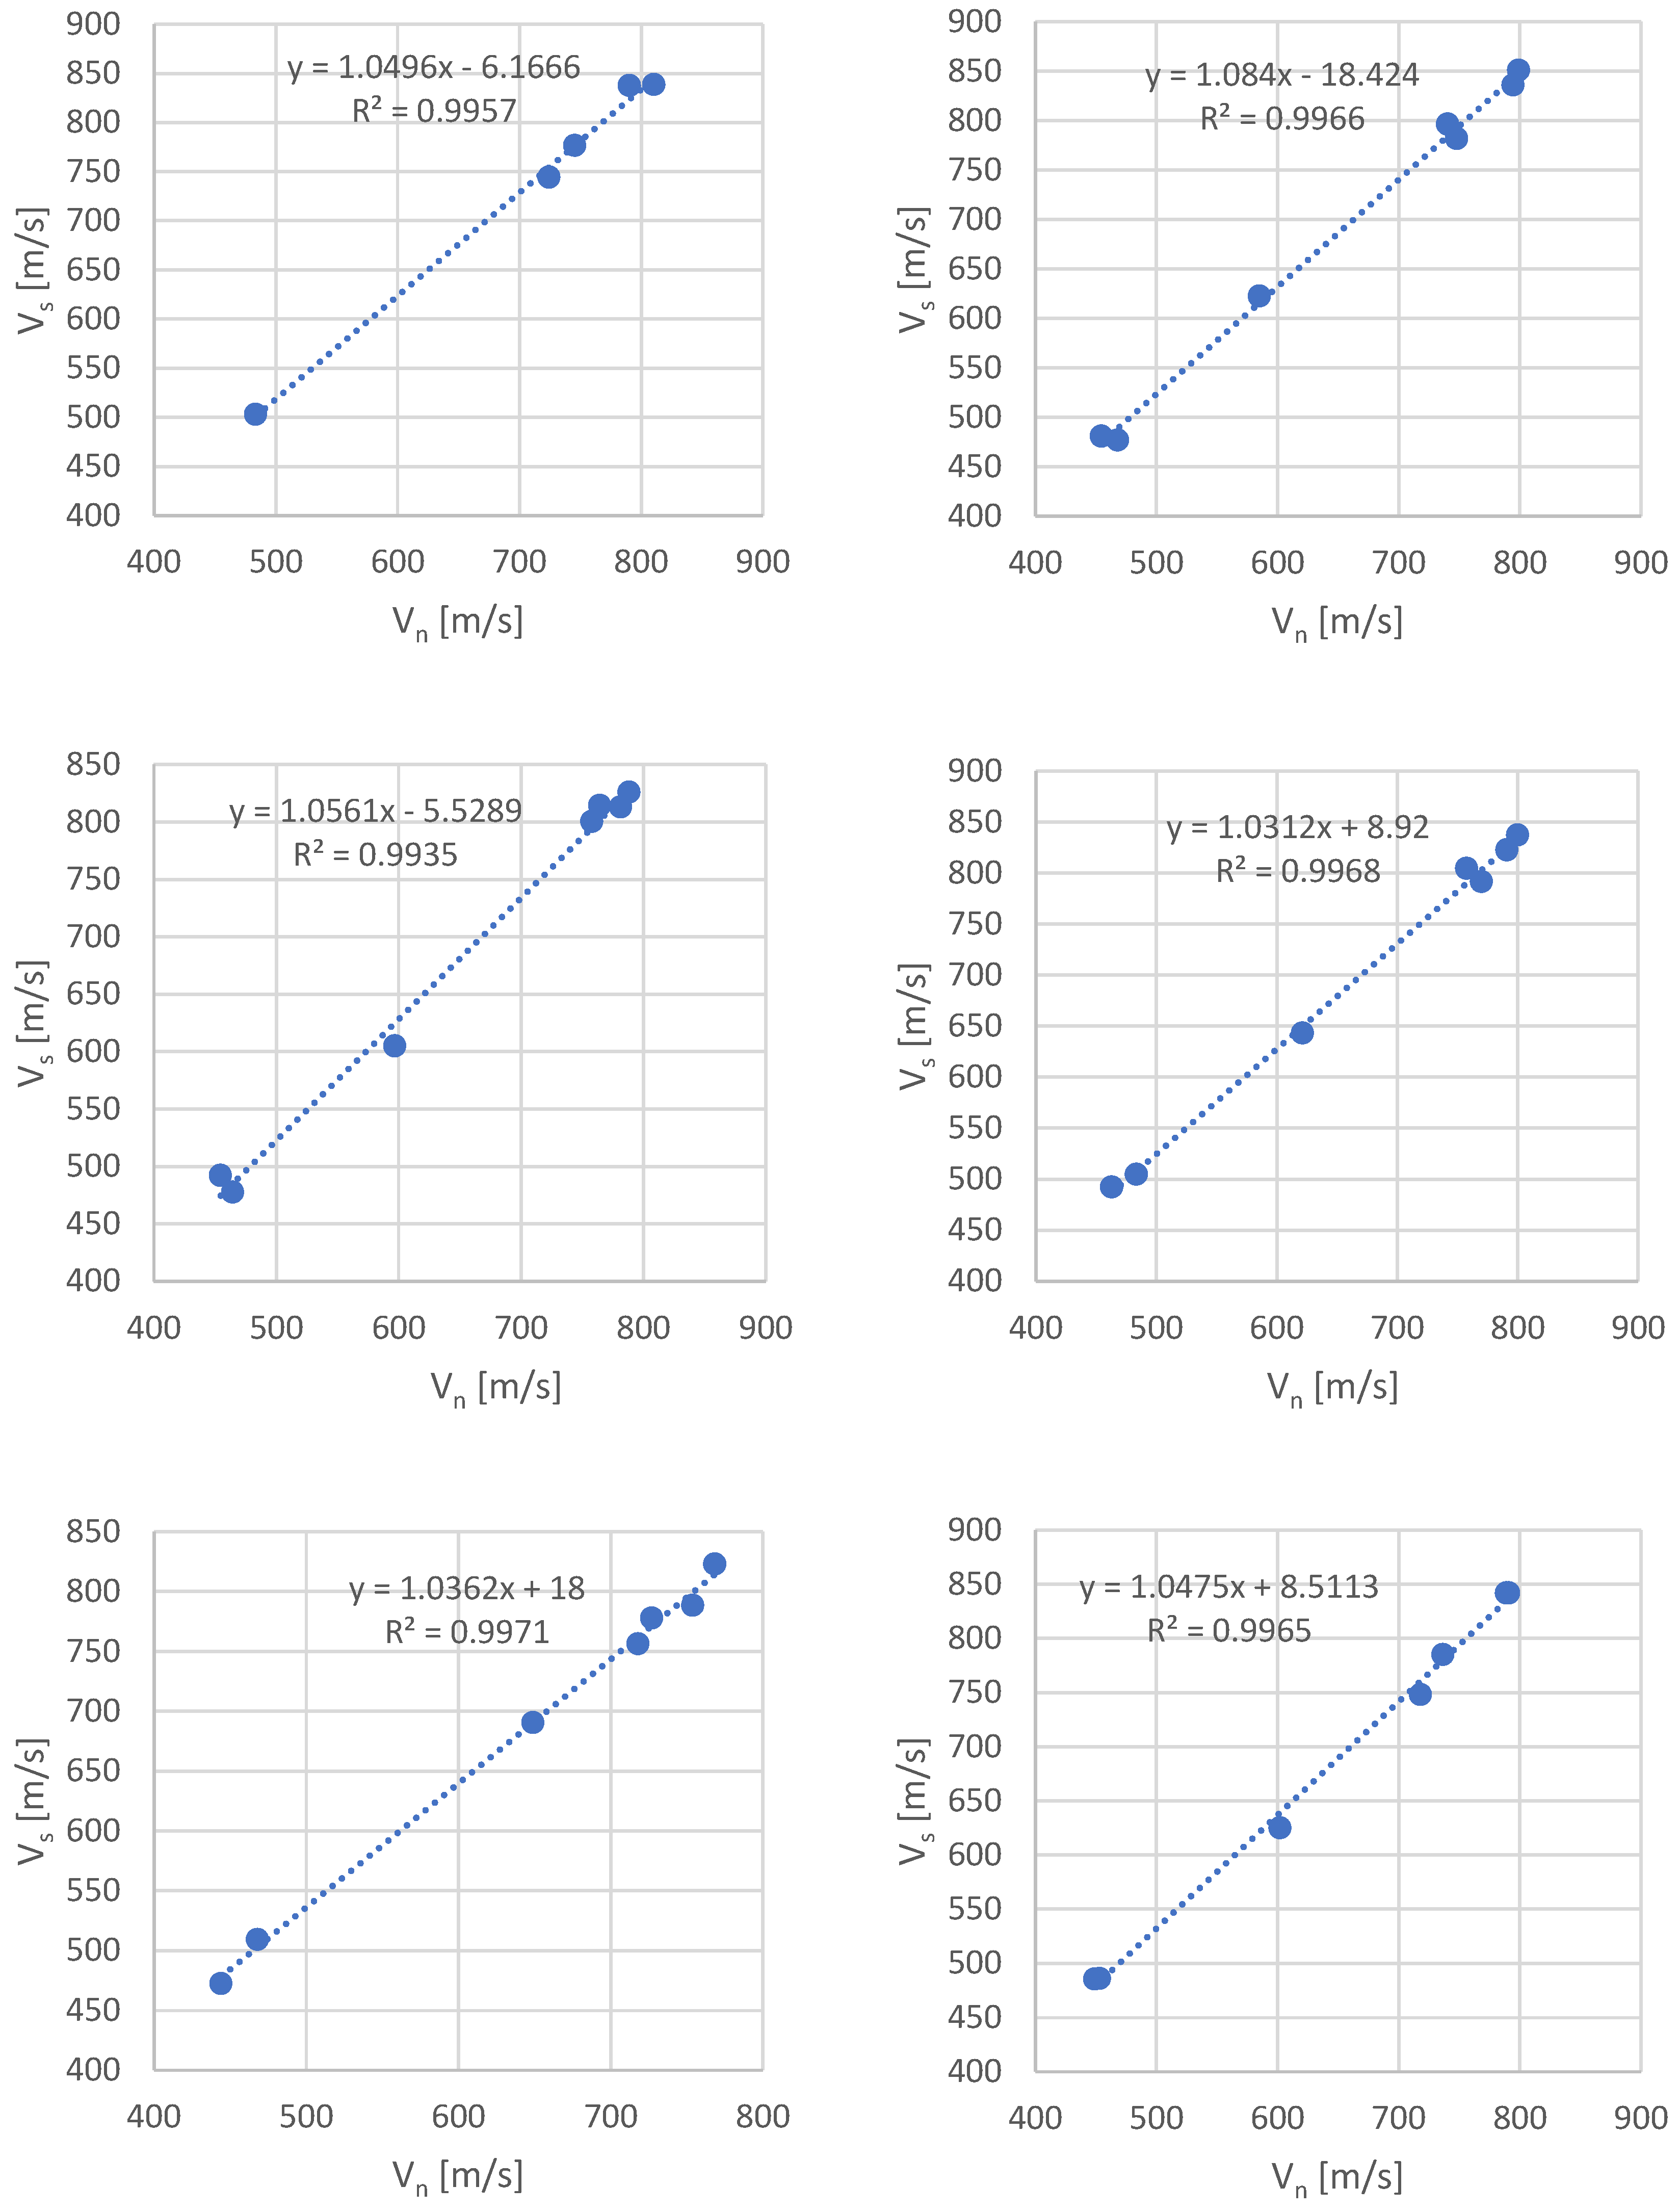
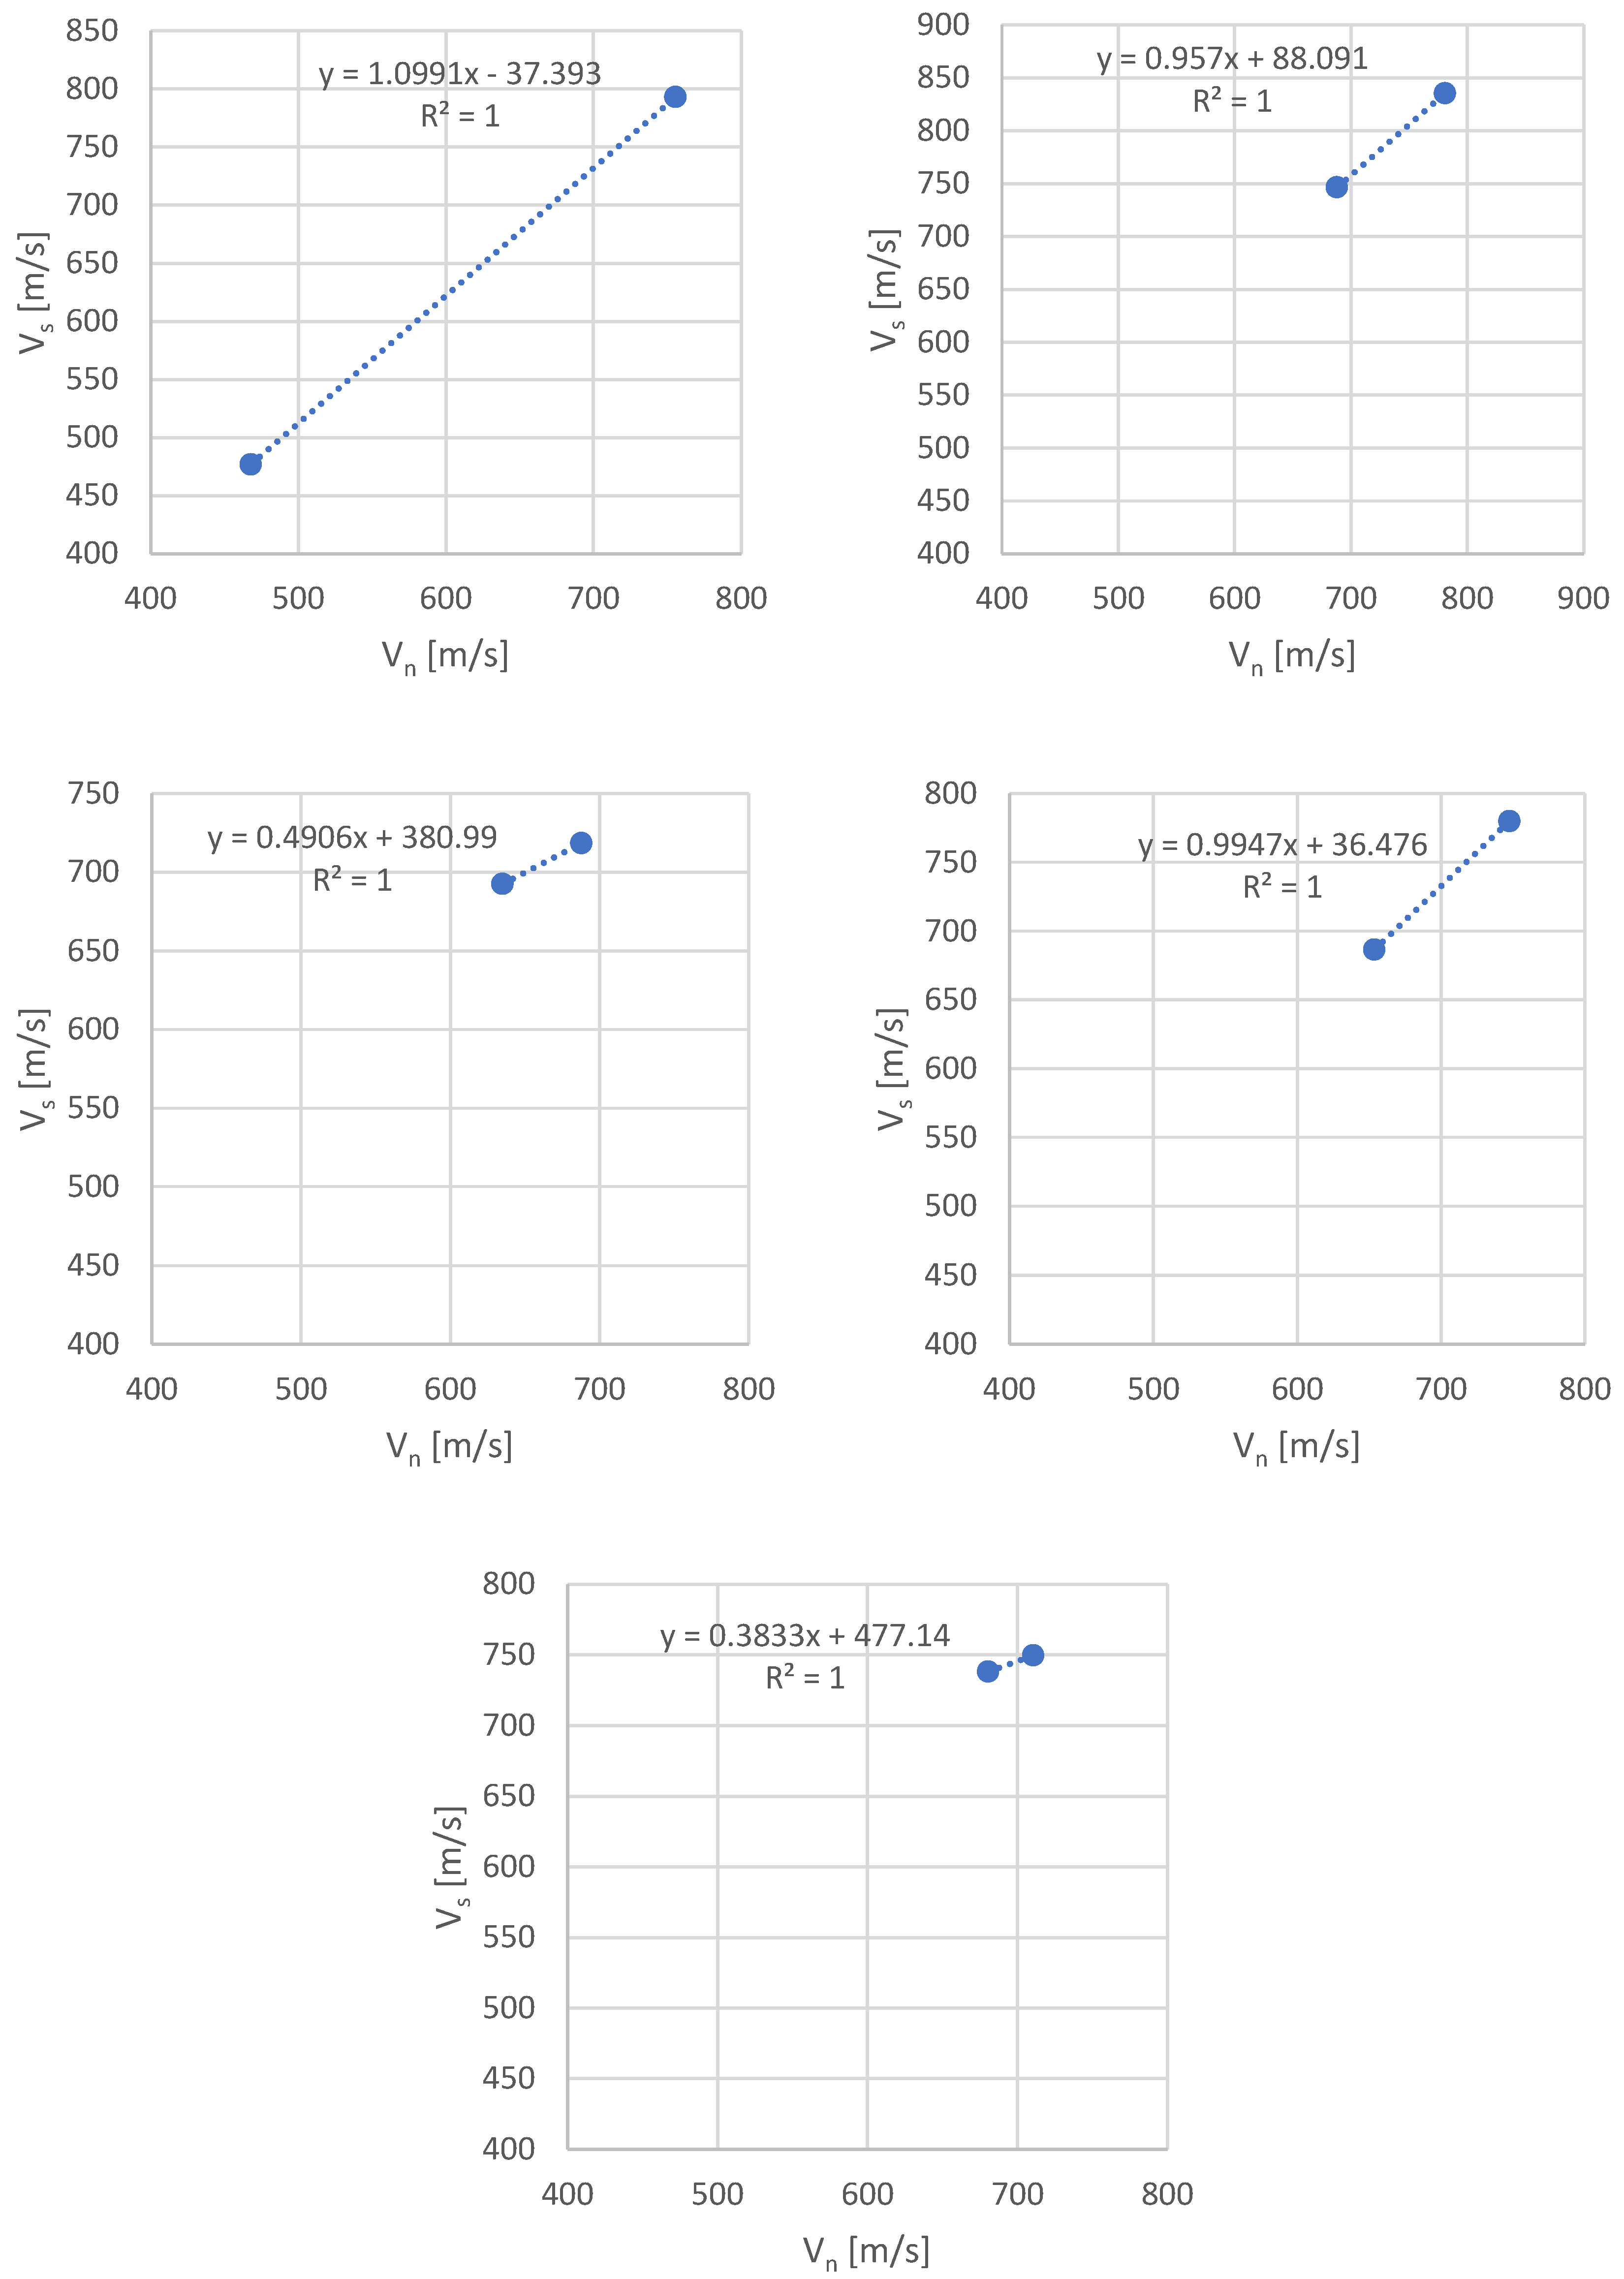
Furthermore, for each paper type (A, B, C, D, and E), the relationship between the screen and winding speed values (Vs and Vn) was examined for each year considered. These relationships are characterized by a linear course and a very high R2 value, confirming that these speeds are closely interrelated.
Figure 3 depicts the regression lines representing Vs as a function of Vn for type “A” paper over the years 2015 to 2020. Additional diagrams illustrating similar relationships for other paper types are included in Appendix A (Figure A3 and Figure A4).
The developed regression equations facilitate the determination of screen speed values based on winding speed values. These findings corroborate previously observed trends.
The presented analyses demonstrate that as the grammage of a given type of paper increases, the optimal values of the speed ranges of Vs and Vn decrease. Consequently, it is possible to select rigid velocities Vs and Vn in a manner that mitigates the risk of undesirable phenomena, such as spurts. Such spurts significantly affect the quality and continuity of production, and addressing them serves as both the starting point and a preliminary step toward a more accurate prediction of the amount of useful heat and electricity produced in the cogeneration process.

4. Conclusions

The application of the numerical taxonomy method utilizing Euclidean distance yielded the following outcomes:
  • Creation of a ranking of the ranges of screen speed Vs and winding speed Vn;
  • Determination of the optimal ranges of Vs and Vn, which maximize production probability while minimizing the probabilities of interruptions due to machine breaks, spurts, changes in assortment, and downtime.
The analysis of the optimal screen speeds (Vs) and winding speeds (Vn) obtained for individual types of paper and their grammage revealed the following:
  • As the grammage increases (for a given type of paper), the optimal values of the speed ranges of Vs and Vn decrease;
  • The optimal velocities Vs and Vn are strongly correlated;
  • The established regression equations enable the determination of screen speed based on a known winding speed value, thereby minimizing the risk of undesirable phenomena.
The identified optimal ranges of screen speeds Vs and winding speeds Vn ensure the following:
  • Minimization of the risk of undesirable phenomena (such as spurts);
  • Significant improvements in production quality and continuity;
  • The potential for developing a more accurate prediction of the amount of useful heat and electricity generated.
The authors intend to continue their research on the issues addressed in this study.

Author Contributions

Conceptualization and resources, D.P. and T.N.; software, formal analysis, and investigation, D.P.; data curation, methodology, supervision, and validation, T.N.; writing—original draft preparation, writing—review and editing, D.P., T.N. and D.J. All authors have read and agreed to the published version of the manuscript.

Funding

This research received no external funding.

Data Availability Statement

The data presented in this study is available on request from the corresponding author. The data were registered in the paper mill for 5 years time daily or per hour and created a huge database which contains many files with lots of data. All the files are on the corresponding author’s personal computer.

Conflicts of Interest

D.P. was employed by Polenergia Obrót S.A. The remaining authors declare that the research was conducted in the absence of any commercial or financial relationships that could be construed as a potential conflict of interest.

Appendix A

Figure A1. Summaries of Vs and Vn relationships for individual years (from 2015 to 2020) for paper type B produced on the MP2 machine.
Energies 17 05548 g0a1aEnergies 17 05548 g0a1b
Figure A2. Summaries of Vs and Vn relationships for individual years (from 2016 to 2020) for paper type C produced on the MP2 machine.
Energies 17 05548 g0a2
Figure A3. Summaries of regression Vs in the function Vn for the considered paper type B for the years 2015–2020, produced on the MP2 machine.
Energies 17 05548 g0a3
Figure A4. Summaries of Vs regression as a function of Vn for the considered paper type C for the years 2016–2020, produced on the MP2 machine.
Energies 17 05548 g0a4

References

  1. Pociecha, J. Development of Taxonomic Methods and Their Applications in Socio-Economic Research; Central Statistical Office: Warsaw, Poland, 2008. (In Polish) [Google Scholar]
  2. Polek, D. Optimization of Useful Heat and Electricity Production in the Steam-Gas System of a Commercial CHP Plant with its Potential Sale on the Power Exchange. Ph.D. Thesis, AGH University of Krakow, Krakow, Poland, 2024. (In Polish). [Google Scholar]
  3. Larski, Z. Taxonomy of vertebrate viruses. Vet. Med. 2008, 64, 851. (In Polish) [Google Scholar]
  4. Kmieciak, W.; Szewczyk, E. Coagulase-positive species of the genus Staphylococcus—Taxonomy, pathogenicity. Post. Microbiol. 2017, 56, 233–244. (In Polish) [Google Scholar] [CrossRef]
  5. Schriefer, A.E.; Cliften, P.F.; Hibberd, M.C.; Sawyer, C.; Brown-Kennerly, V.; Burcea, L.; Klotz, E.; Crosby, S.D.; Gordon, J.I.; Head, R.D. A multi-amplicon 16S rRNA sequencing and analysis method for improved taxonomic profiling of bacterial communities. J. Microbiol. Meth. 2020, 154, 6–13. [Google Scholar] [CrossRef] [PubMed]
  6. Vasquez, Y.M.S.C.; Gomes, M.B.; Sivla, T.R.; Duarte, A.W.F.; Rosa, L.H.; Oliveira, V.M. Cold-adapted chitinases from Antarctic bacteria: Taxonomic assessment and enzyme production optimization. Biocatal. Agric. Biotechnol. 2021, 34, 102029. [Google Scholar]
  7. Taber, P.; Staes, C.J.; Phengphoo, S.; Rocha, E.; Lam, A.W.; Fiol, G.D.; Maviglia, S.M.; Rocha, R.A. Developing a sampling method and preliminary taxonomy for classifying COVID-19 public health guidance for healthcare organizations and the general public. J. Biomed. Inform. 2021, 120, 103852. [Google Scholar] [CrossRef] [PubMed]
  8. Zamri, M.N.; Sunar, M.S. Atmospheric cloud modeling methods in computer graphics: A review, trends, taxonomy, and future directions. J. King Saud. Univ. Comput. Inf. Sci. 2020, 34, 3468–3488. [Google Scholar] [CrossRef]
  9. Grabiński, T. Methods of Taxonometry; Cracow University of Economics: Cracow, Poland, 1992. (In Polish) [Google Scholar]
  10. Dziekański, P. Taxonomic method in the assessment of the environmental competitiveness of the districts of the Świętokrzyskie Voivodeship. Res. Pap. Univ. Econ. Wrocław 2014, 348, 44–54. (In Polish) [Google Scholar]
  11. Rovan, J.; Sambt, J. Socio-economic Differences Among Slovenian Municipalities: A Cluster Analysis Approach. In Developments in Applied Statistics; Ferligoj, A., Mrvar, A., Eds.; FDV: Ljubljana, Slovenia, 2003; pp. 265–278. [Google Scholar]
  12. Soares, J.; Marquez, M.; Monteiro, C. A multivariate methodology to uncover regional disparities: A contribution to improve European Union and governmental decisions. Eur. J. Oper. Res. 2003, 145, 121–135. [Google Scholar] [CrossRef]
  13. Goletsis, Y.; Chletsos, M. Measurement of development and regional disparities in Greek periphery: A multivariate approach. Socio-Econ. Plan. Sci. 2011, 45, 174–183. [Google Scholar] [CrossRef]
  14. Vetrakova, J.; Risin, I. Clustering of Socio-Economic Space: Theoretical Approaches and Russian Experience, taxonomy, and future directions. Procedia Econ. Financ. 2015, 27, 538–547. [Google Scholar]
  15. Balaniuk, I.; Kyrylenko, V.; Chaliuk, Y.; Sheiki, Y.; Begun, S.; Diachenko, L. Cluster analysis of socio-economic development of rural areas and peasant farms in the system of formation of rural territorial communities: A case of study of Volyn Region, Ukraine. Sci. Papers Ser. Manag. Econom. Eng. Agric. Rural Dev. 2021, 21, 177–188. [Google Scholar]
  16. Podolec, B.; Zając, K. Econometric Methods of Determining Consumption Regions; Polskie Wydawnictwo Ekonomiczne: Warsaw, Poland, 1978. (In Polish) [Google Scholar]
  17. Wydymus, S. Methods of Multidimensional Analysis of Socio-Economic Development; Special Series: Monographs; Cracow University of Economics: Cracow, Poland, 1984. [Google Scholar]
  18. Nowińska-Łaźniewska, E.; Górecki, T. Convergence and divergence processes—Presentation of selected models used in regional analyses. Stud. Reg. Lokal. 2005, 2, 89–100. (In Polish) [Google Scholar]
  19. Fadilah, I.; Witiastuti, R. A clustering method approach for Portfolio Optimization. Manag. Anal. J. 2018, 7, 436–447. [Google Scholar] [CrossRef]
  20. Garsztka, P.; Rutkowska-Ziarko, A. Diversification of risk of a fundamental portfolio based on semi-variance. Econ. Bus. Rev. 2014, 14, 80–96. (In Polish) [Google Scholar]
  21. León, D.; Sandoval, J.; Aragón, A.; Hernández, G.; Arévalo, A.; Niño, J. Clustering Algorithms for Risk-Adjusted Portfolio Construction. Procedia Comput. Sci. 2017, 108, 1334–1343. [Google Scholar] [CrossRef]
  22. Marvin, K. Creating Diversified Portfolios Using Cluster Analysis, Independent Work Report Fall. 2015. Available online: https://www.cs.princeton.edu/sites/default/files/uploads/karina_marvin.pdf?fbclid=IwAR3QKvNdbmVMNLARTixVx0XtusCgxT_XCAcqd5qLHIZBjj4Vkx7B_t94OLs (accessed on 20 April 2024).
  23. Gubu, L.; Abdurakhman, A.; Rosadi, D. A New Approach for Robust Mean-Variance Portfolio Selection Using Trimmed k-Means Clustering. Ind. Eng. Manag. Syst. 2021, 20, 782–794. [Google Scholar] [CrossRef]
  24. Borys, T. Methods of normalizing traits in comparative statistical studies. Prz. Stat. 1978, 2, 363–372. (In Polish) [Google Scholar]
  25. Pięta, P.; Niedoba, T.; Surowiak, A. 2018. The Use of Taxonomy Methods to Assess the Enrichment of Individual Lithological Types of Polish Copper Ores. In Science, Research and Scientific Reports: Technical and Exact Sciences; Wysoczański, T., Ed.; Idea Knowledge Future: Świebodzice, Poland, 2018; pp. 229–237. (In Polish) [Google Scholar]
  26. Niedoba, T.; Pięta, P.; Surowiak, A.; Şahbaz, O. Multidimensional Optimization of the Copper Flotation in a Jameson Cell by Means of Taxonomic Methods. Minerals 2021, 11, 385. [Google Scholar] [CrossRef]
  27. Alkhayat, G.; Mehmood, R. A review and taxonomy of wind and solar energy forecasting methods based on deep learning. Energy AI 2021, 4, 100060. [Google Scholar] [CrossRef]
  28. Pach-Gargul, A. Single Electricity Market in the European Union in the Context of Polish’s Energy Security. Ph.D. Thesis, Cracow University of Economics, Kraków, Poland, 2012. (In Polish). [Google Scholar]
  29. Ivy, A.; Manowska, A. The Use of Hierarchical Agglomeration Methods in Assessing the Polish Energy Market. Energies 2021, 14, 3958. [Google Scholar] [CrossRef]
  30. Ficoń, K.; Krasnodębski, G. Study of multi-feature objects using numerical taxonomy using a reference object. Mil. Logist. Syst. 2016, 45, 91–107. [Google Scholar]
  31. Gawlik, L.; Mokrzycki, E. Effective Production and Use of Energy; IGSMiE PAN Publishing House: Krakow, Poland, 2021. (In Polish) [Google Scholar]
  32. Hellwig, Z. Applications of the taxonomic method to the typological division of countries according to the level of development. Prz. Stat. 1968, 25, 307–327. (In Polish) [Google Scholar]
  33. Borg, I.; Groenen, P.J.F. Modern Multidimensional Scaling, Theory and Application, 2nd ed.; Springer Science Business Media: New York, NY, USA, 2005. [Google Scholar]
  34. Walesiak, M. Visualization of Linear Ordering Results for Metric Data with the Application of Multidimensional Data Scaling. Econometrics 2016, 2, 9–21. (In Polish) [Google Scholar]
  35. Churski, P.; Herodowicz, T.; Konecka-Szydłowska, B.; Perdał, R. Spatial Differentiation of the Socio-Economic Development of Poland–“Invisible” Historical Heritage. Land 2021, 10, 1247. (In Polish) [Google Scholar] [CrossRef]
  36. Falniowski, A. Numerical Methods in Taxonomy; Jagiellonian University Press: Krakow, Poland, 2003. (In Polish) [Google Scholar]
  37. Pluta, W. Multidimensional Comparative Analysis in Economic Research; Polskie Wydawnictwo Ekonomiczne: Warsaw, Poland, 1977. (In Polish) [Google Scholar]
  38. Nowak, E. Taxonomic Methods in the Classification of Socio-Economic Objects; PWE: Warsaw, Poland, 1990. (In Polish) [Google Scholar]
  39. Dykas, P. Taksonomiczne wskaźniki przestrzennego zróżnicowania rozwoju powiatów województwa podkarpackiego. Stud. Praw.-Ekon. 2009, 80, 201–214. (In Polish) [Google Scholar]
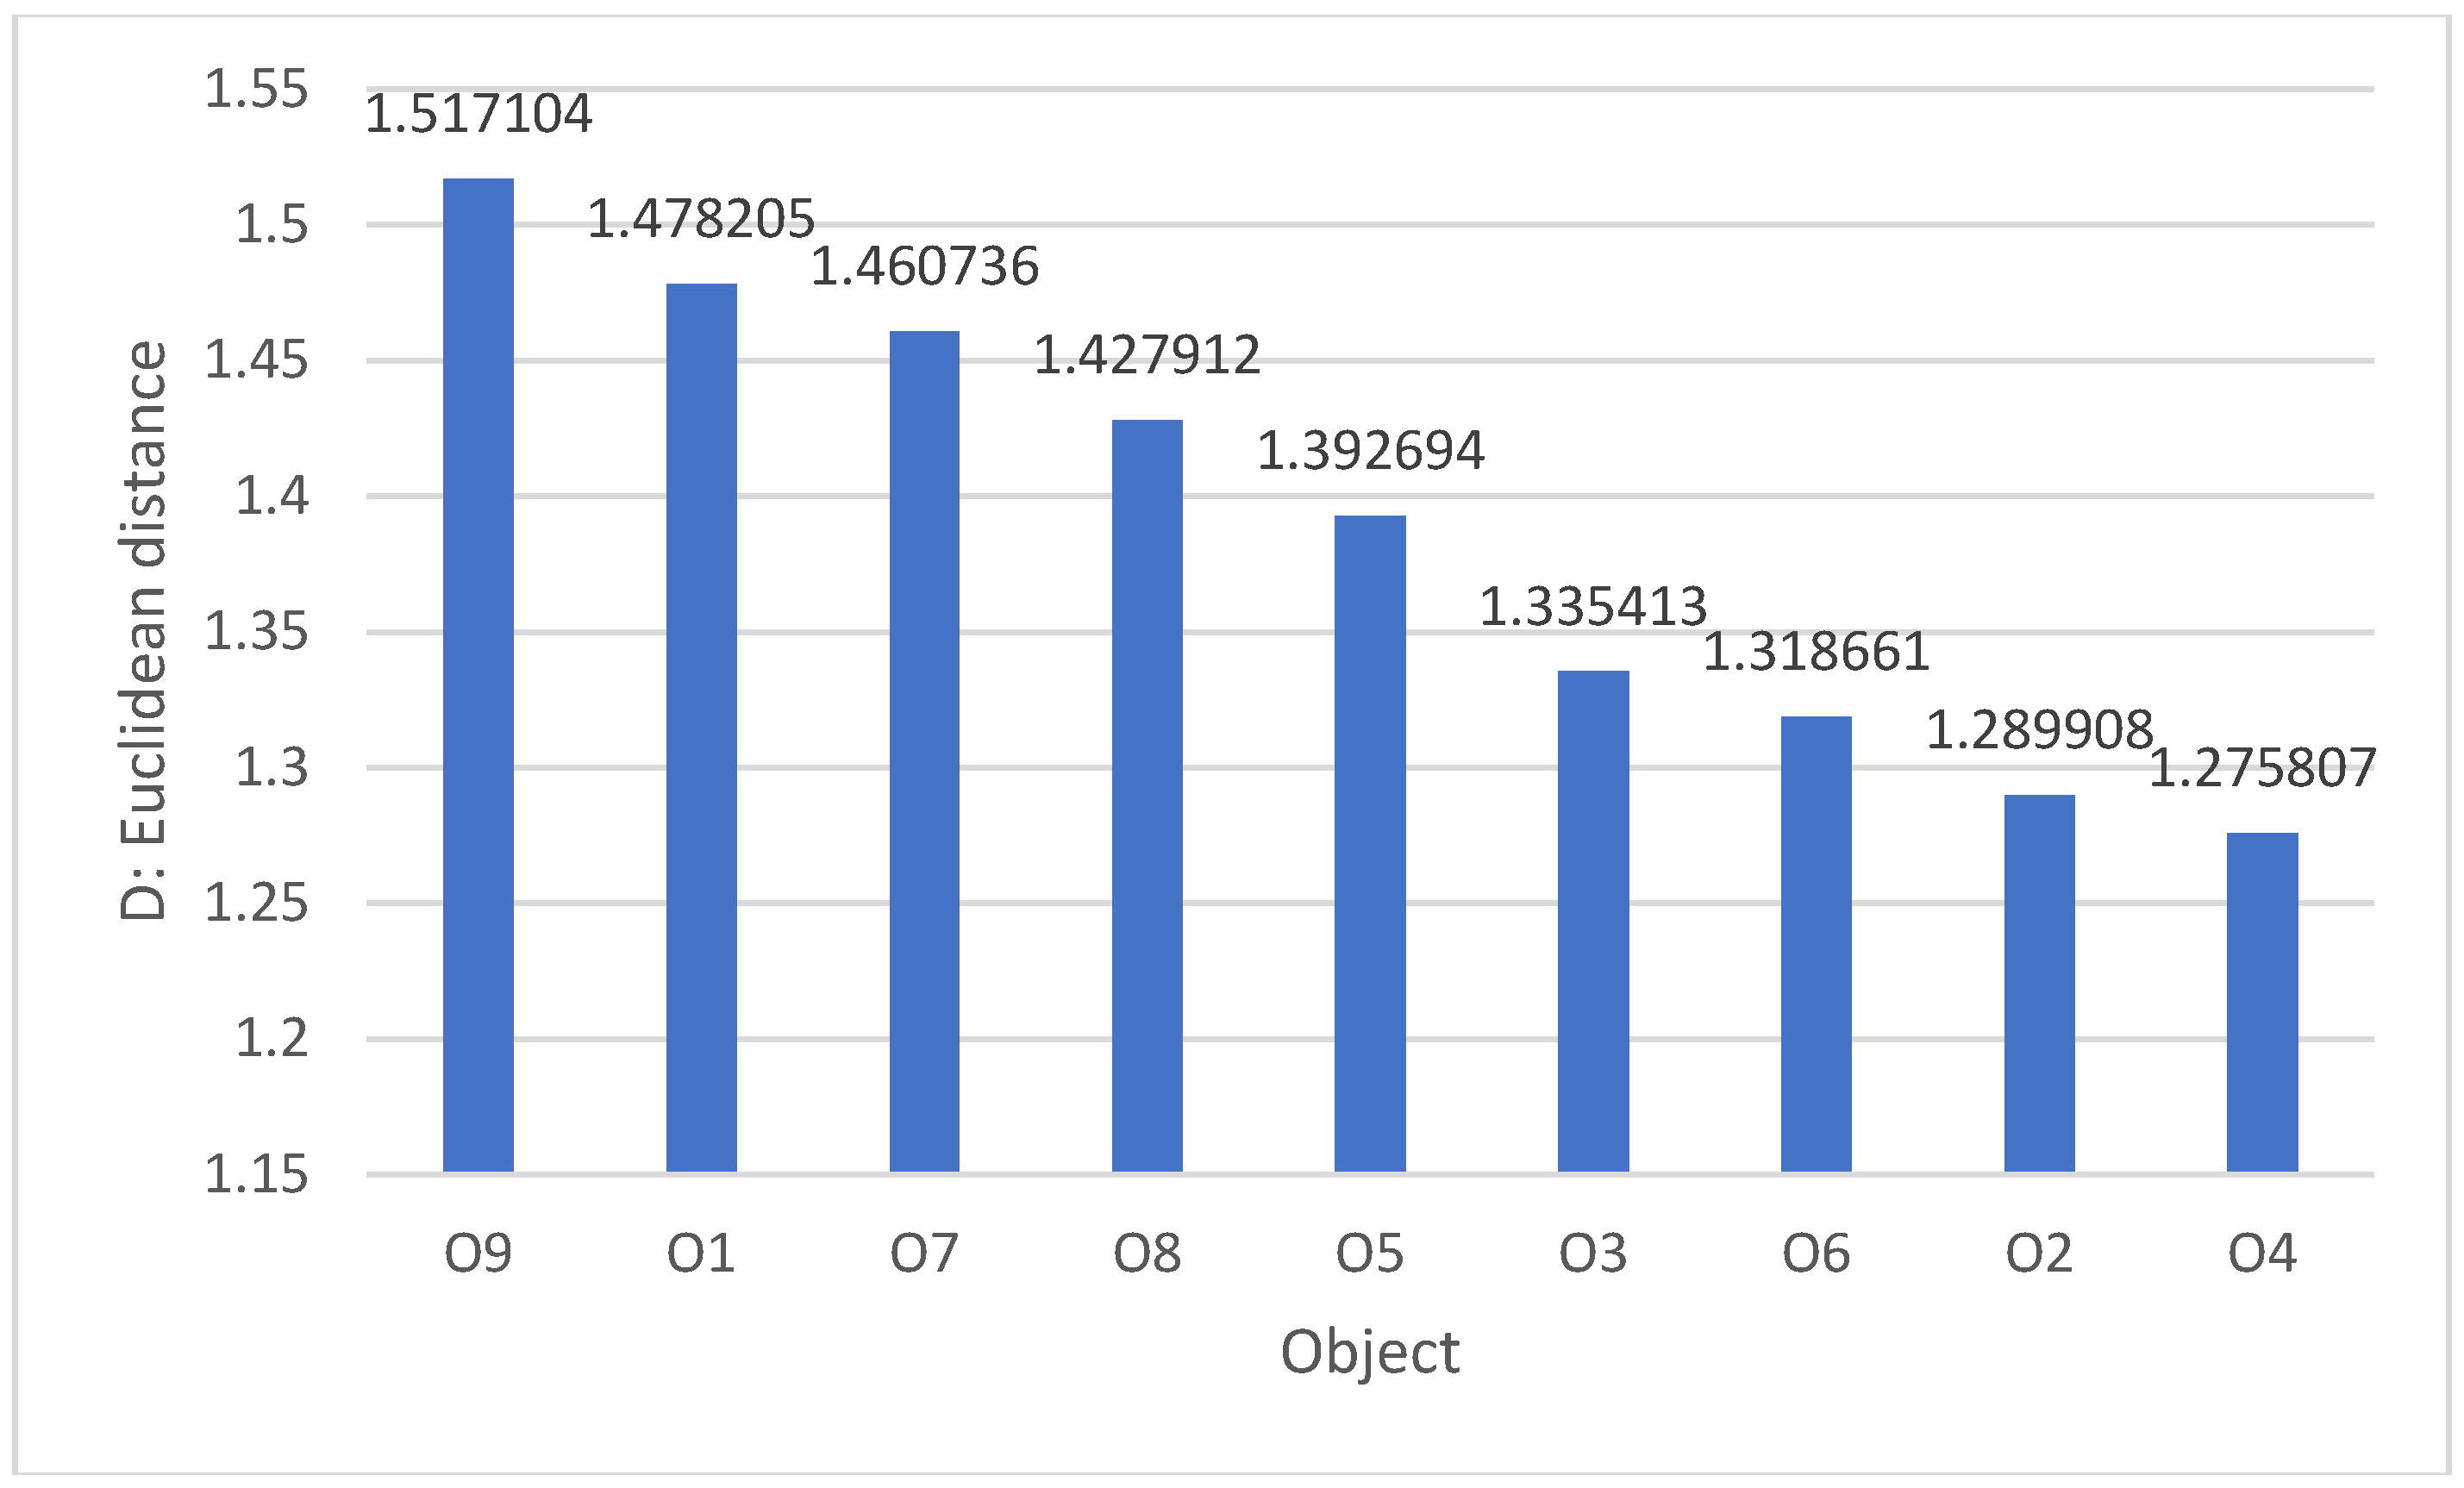
Figure 1. Ordering of the considered objects based on the calculated Euclidean distance from the reference vector [own elaboration].
Energies 17 05548 g001
Figure 2. Summaries of optimal Vs and Vn relationships for individual years (from 2015 to 2020) for paper produced on the MP2 machine [own elaboration].
Energies 17 05548 g002
Figure 3. Compilations of Vs regression as a function of Vn for the considered paper type A for the years 2015–2020, produced on the MP2 machine [own elaboration].
Energies 17 05548 g003
Table 1. Probability matrix for A-80 paper in 2020 [2].
A-80, Year 2020
Vs [m/s]
Vn [m/s]
I [835–854]II [855–874]III [875–893]IV [894–912]V [913–931]VI [932–950]
880–898 (1)P1 = 0.9324
P2 = 0.0389
P3 = 0.0056
P4 = 0.0231
899–917 (2) P1 = 0.8404
P2 = 0.0998
P3 = 0.0064
P4 = 0.0534
918–936 (3) P1 = 0.0882P1 = 0.5795
P2 = 0.9108P2 = 0.3948
P3 = 0.001P3 = 0.0046
P4 = 0P4 = 0.0211
937–955 (4) P1 = 0.7465
P2 = 0.2224
P3 = 0.0035
P4 = 0.0276
956–974 (5) P1 = 0.8689P1 = 0.8891
P2 = 0.0863P2 = 0.0697
P3 = 0.0074P3 = 0.0033
P4 = 0.0374P4 = 0.0379
975–992 (6) P1 = 0.8667P1 = 0.8978
P2 = 0.0913P2 = 0.0836
P3 = 0.0036P3 = 0.0087
P4 = 0.0384P4 = 0.0099
Table 2. Comparison of the considered velocity ranges of Vs and Vn with the values of the probabilities of the considered phenomena and the calculated distance for A-80 paper in 2020.
A-80 2020
ObjectClass VsClass VnP1 Q = 1 P 1 P2P3P4D
O1And(1)0.9321.0730.0390.0060.0231.478205
O2II(2)0.841.190.10.0060.0531.289908
O3II(3)0.08811.340.9110.00101.335413
O4III(3)0.581.7260.3950.0050.0211.275807
O5IV(4)0.7471.340.2220.0040.0281.392694
O6IV(5)0.8691.1510.0860.0070.0371.318661
O7V(5)0.8891.1250.070.0030.0381.460736
O8V(6)0.8671.1540.0910.0040.0381.427912
O9VI(6)0.8981.1140.0840.0090.011.517104
Table 3. Comparison of Vs and Vn based on the Euclidean distance criterion (ranked from best to worst).
ClassMid-Class
Vs [m/s]Vn [m/s]Vs [m/s]avgVn [m/s]avg
932–950975–992941983.5
835–854880–898844.5889
913–931956–974922965
913–931975–992922983.5
894–912937–955903946
855–874918–936864.5927
894–912956–974903965
855–874899–917864.5908
875–893918–936884927
Table 4. List of the best results for the MP1 paper machine [2].
201520162017201820192020Average
VsVnVsVnVsVnVsVnVsVnVsVnVsVn
A-60778.5838755.5810.5781824766827889934.5860.5929805.1860.5
A-70815869819869789.5860.5755801831.5856.5931.5981823.6872.8
A-80793841.5805.5875756819767.5828819.5886.5941983.5813.8872.3
A-90745.5797740.5802756781.5 772.5820952.5992.5793.4838.6
A-100705746.5688728 891922761.3798.8
B-70789835 799.5854.5782832890.5915883924.5828.8872.2
B-75 803846787.5842.5788846.5810.5872.5899946817.6870.7
B-80 764.5821.5800844.5870.5917.5899.5934833.6879.4
C-70764816825.5870779828808858839878 803.1850.0
C-80783811.5780.5823763.5813.5759810871.5910.5888953807.6853.6
C-90766.5814.5786.5807711747765.5816841881.5861.5903788.7828.2
Table 5. List of the best results for the MP2 paper machine [2].
201520162017201820192020Average
VsVnVsVnVsVnVsVnVsVnVsVnVsVn
A-80754801.5778813.5776.5813717.5759.5783.5836741.5812758.5805.9
A-90810851793.5851759.5816.5751.5768.5801.5834.5744758.5776.7813.3
A-100718.5771709738.5690745.5688752653.5716645710.5684.0738.9
A-110713771.5692.5719720.5776.5680744.5665.5724625.5694.5682.8738.3
A-120645.5703659.5663663716652687681745574635.5645.8691.6
A-130592.5639.5617662.5634.5684644682.5583617513548597.3638.9
A-140530.5552.5540.5582.5545563.5579.5607548575.5577604553.4580.8
A-150470514476.5482.5468480.5497498.5487.5509449474474.7493.1
A-170476488475.5507475.5499.5475.5486419455462.5489.5464.0487.5
B-70790.5837.5794.5836788.5826800837768.5823791842788.8833.6
B-75810.5838.5799851781.5813791822.5754788.5789842787.5825.9
B- 90745.5776.5740.5796.5764.5814.5757.5804.5727778736.5785745.3792.5
B-100724.5744.5748782758800.5770791.5718756.5718748739.4770.5
B-120 585622.5597605621.5643649690.5602625610.9637.2
B-150 454.5481454.5492463492444472.5453486453.8484.7
B-160483.5503468477464.5477.5483.5504.5468509.5449485.5469.4492.8
D-80 755.5793781835.5688718.5747.5780680.5738730.5773.0
D-90 738777.5688746.5635692.5653.5686.5710.5749.5685.0730.5
E-80 784833.5717.5752.5719.5754.5744800700.5737.5733.1775.6
E-90 670701616645679.5717.5655.2687.8
Disclaimer/Publisher’s Note: The statements, opinions and data contained in all publications are solely those of the individual author(s) and contributor(s) and not of MDPI and/or the editor(s). MDPI and/or the editor(s) disclaim responsibility for any injury to people or property resulting from any ideas, methods, instructions or products referred to in the content.