
Multi-Criteria Optimization of the Paper Production Process Using Numerical Taxonomy Methods: A Necessary Condition for Predicting Heat and Electricity Output in a Combined Heat and Power (CHP) System


Abstract
1. Introduction
- ‑
- ‑
- Screen speed Vs;
- Winding speed Vn.
2. Materials and Methods
2.1. Paper Mill
- Pulping process;
- MP1 paper machine;
- MP2 paper machine;
- External companies;
- The plant’s own internal energy requirements;
- Exchangers, which distribute hot water for heating purposes to a range of facilities, such as the following:
- ‑
- The paper-processing department;
- ‑
- The product and raw material preparation department;
- ‑
- Paper machine exchangers;
- ‑
- Finished product warehouse;
- ‑
- Office buildings;
- ‑
- On-site stores;
- ‑
- The municipal heating network.
2.2. Numerical Taxonomy
- Stage I—Formation of the Diagnostic Feature Matrix
- Stage II—Normalization of Features
- Stage III—Determination of the Pattern Vector
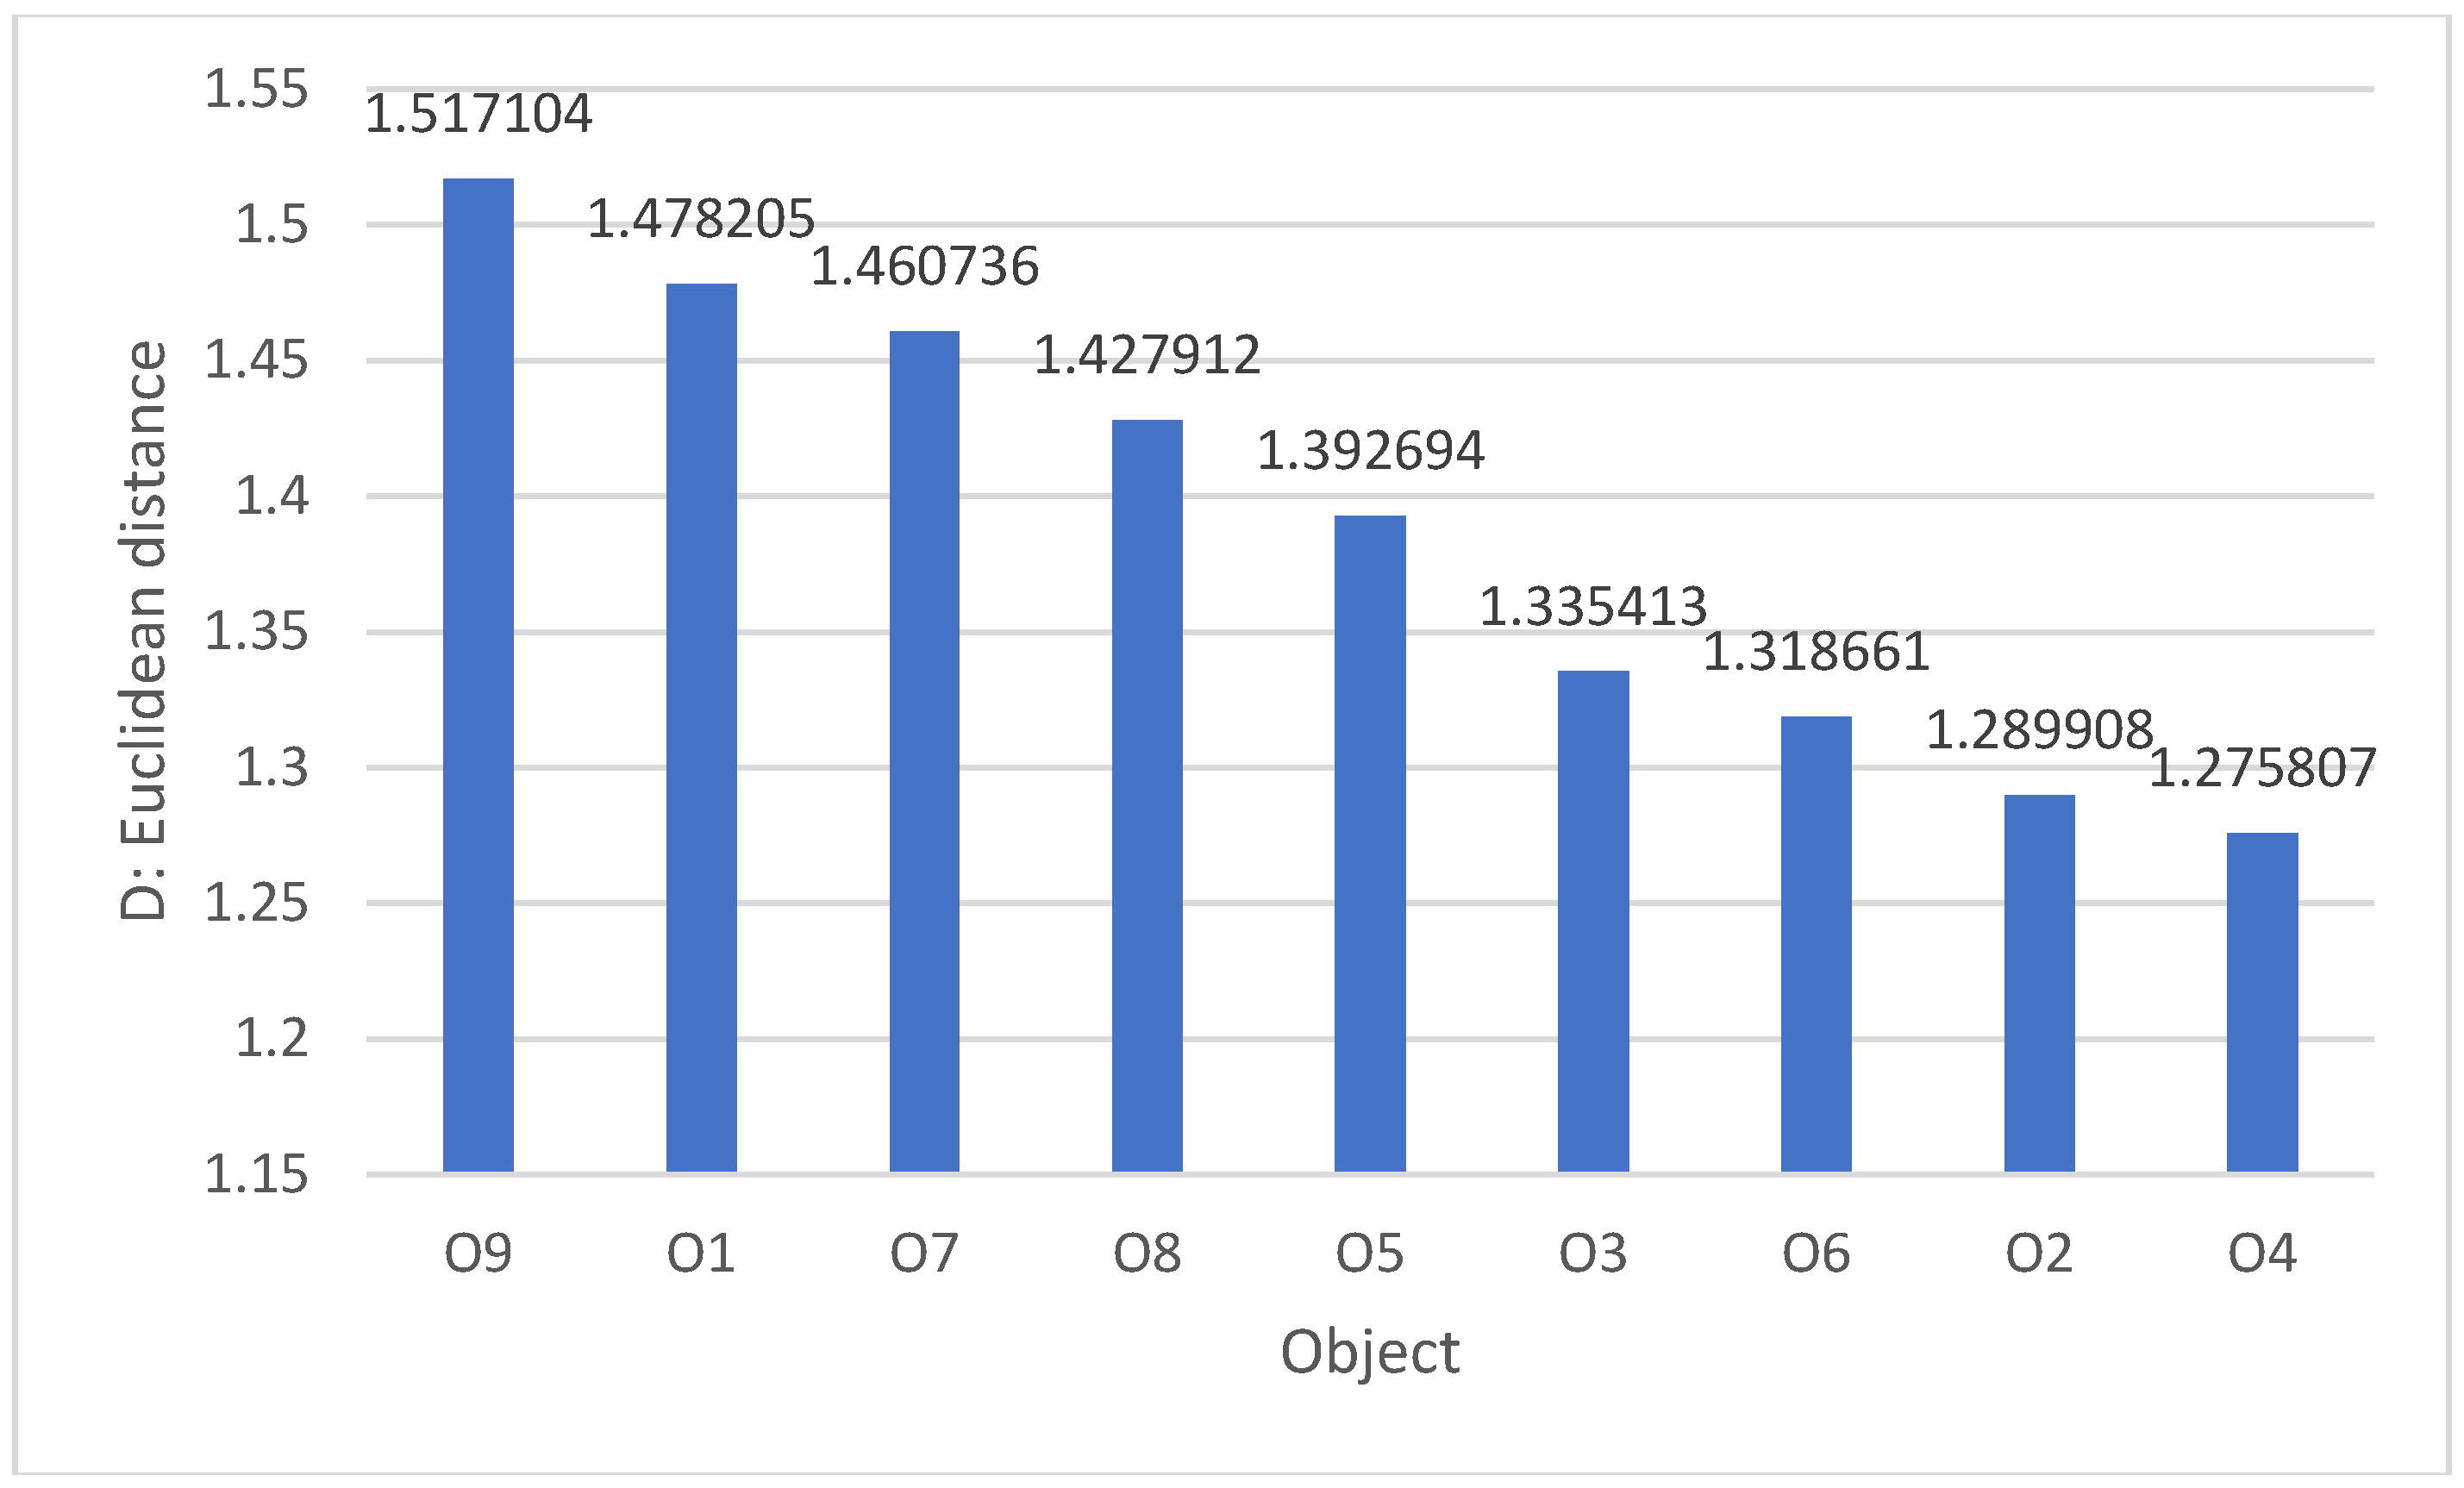
- Stage IV—Calculation of Distances
2.3. Adopted Methodology
3. Experiment
- Production time (T1);
- Downtime (T2);
- Assortment change time (T3);
- Spurt time (i.e., machine jerking or stopping) (T4).
- Production probability:
- Downtime probability:
- Assortment change probability:
- Spurt probability:
4. Conclusions
- Creation of a ranking of the ranges of screen speed Vs and winding speed Vn;
- Determination of the optimal ranges of Vs and Vn, which maximize production probability while minimizing the probabilities of interruptions due to machine breaks, spurts, changes in assortment, and downtime.
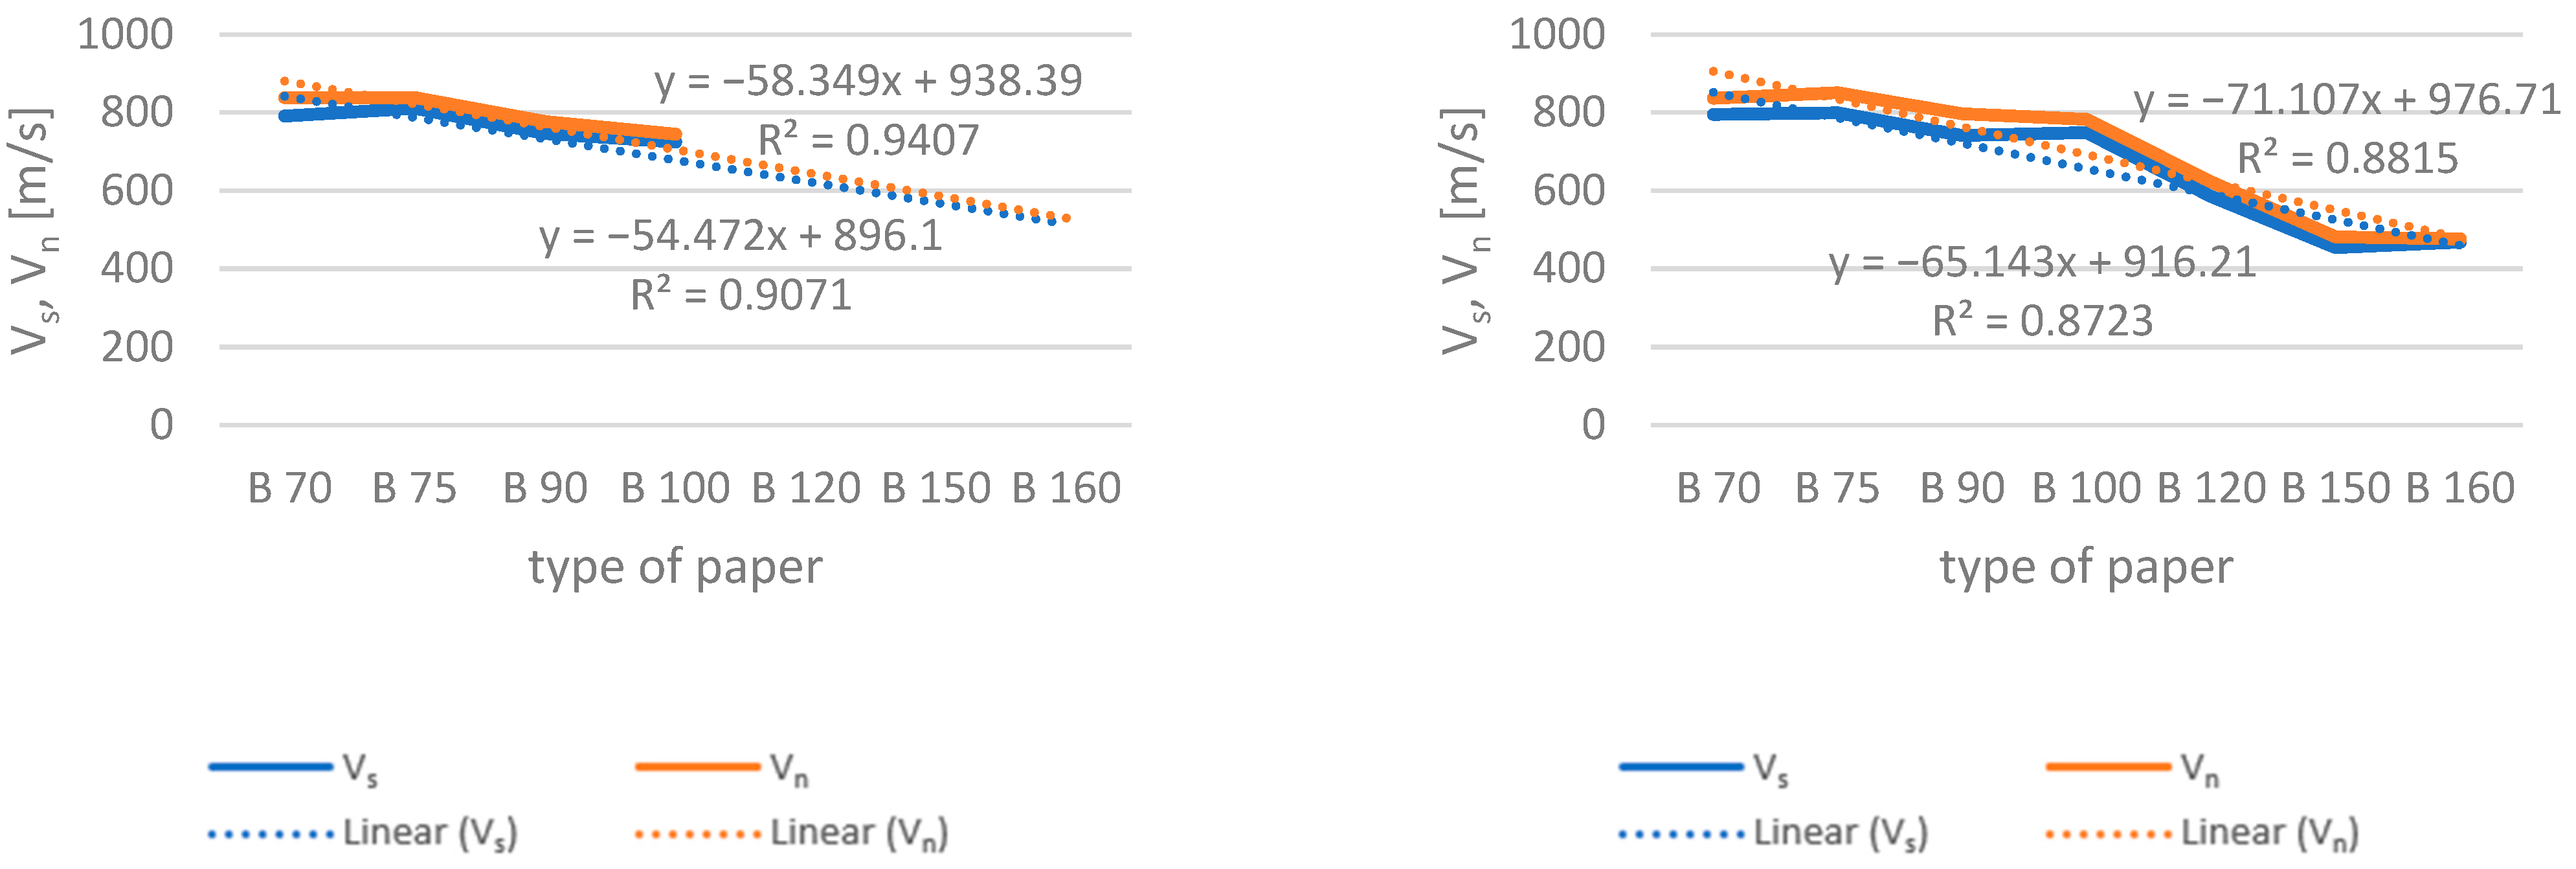
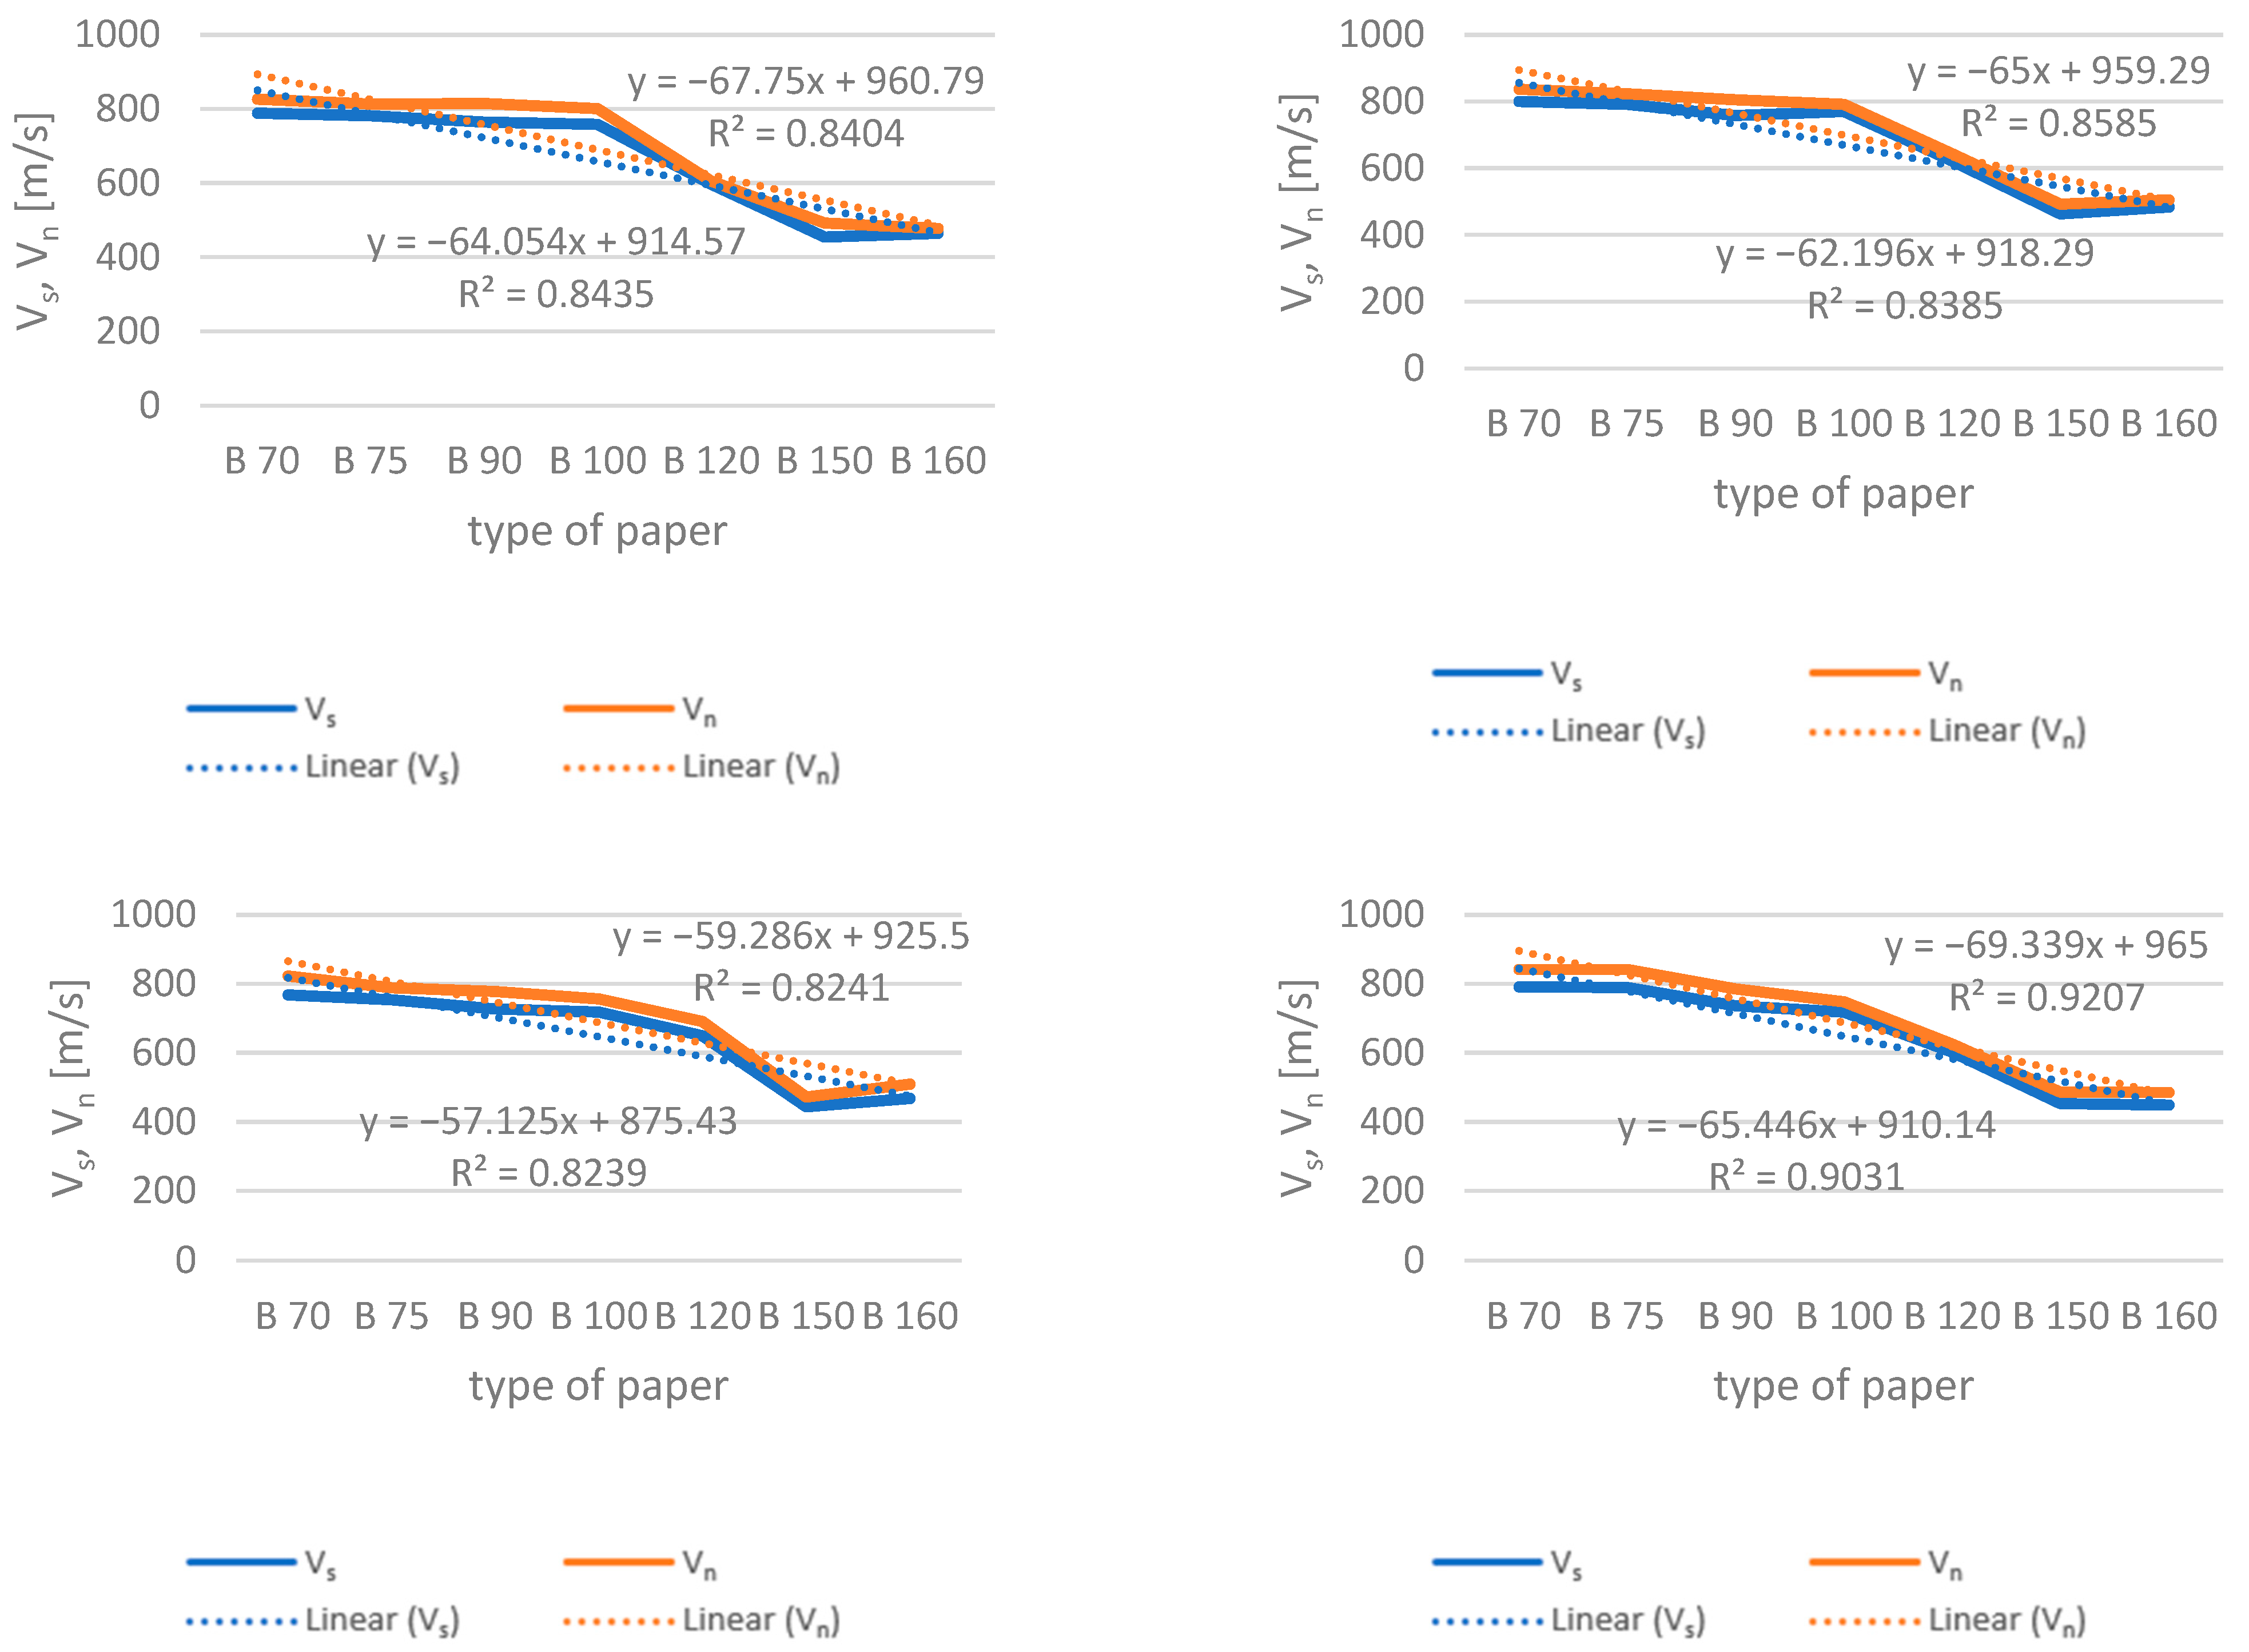
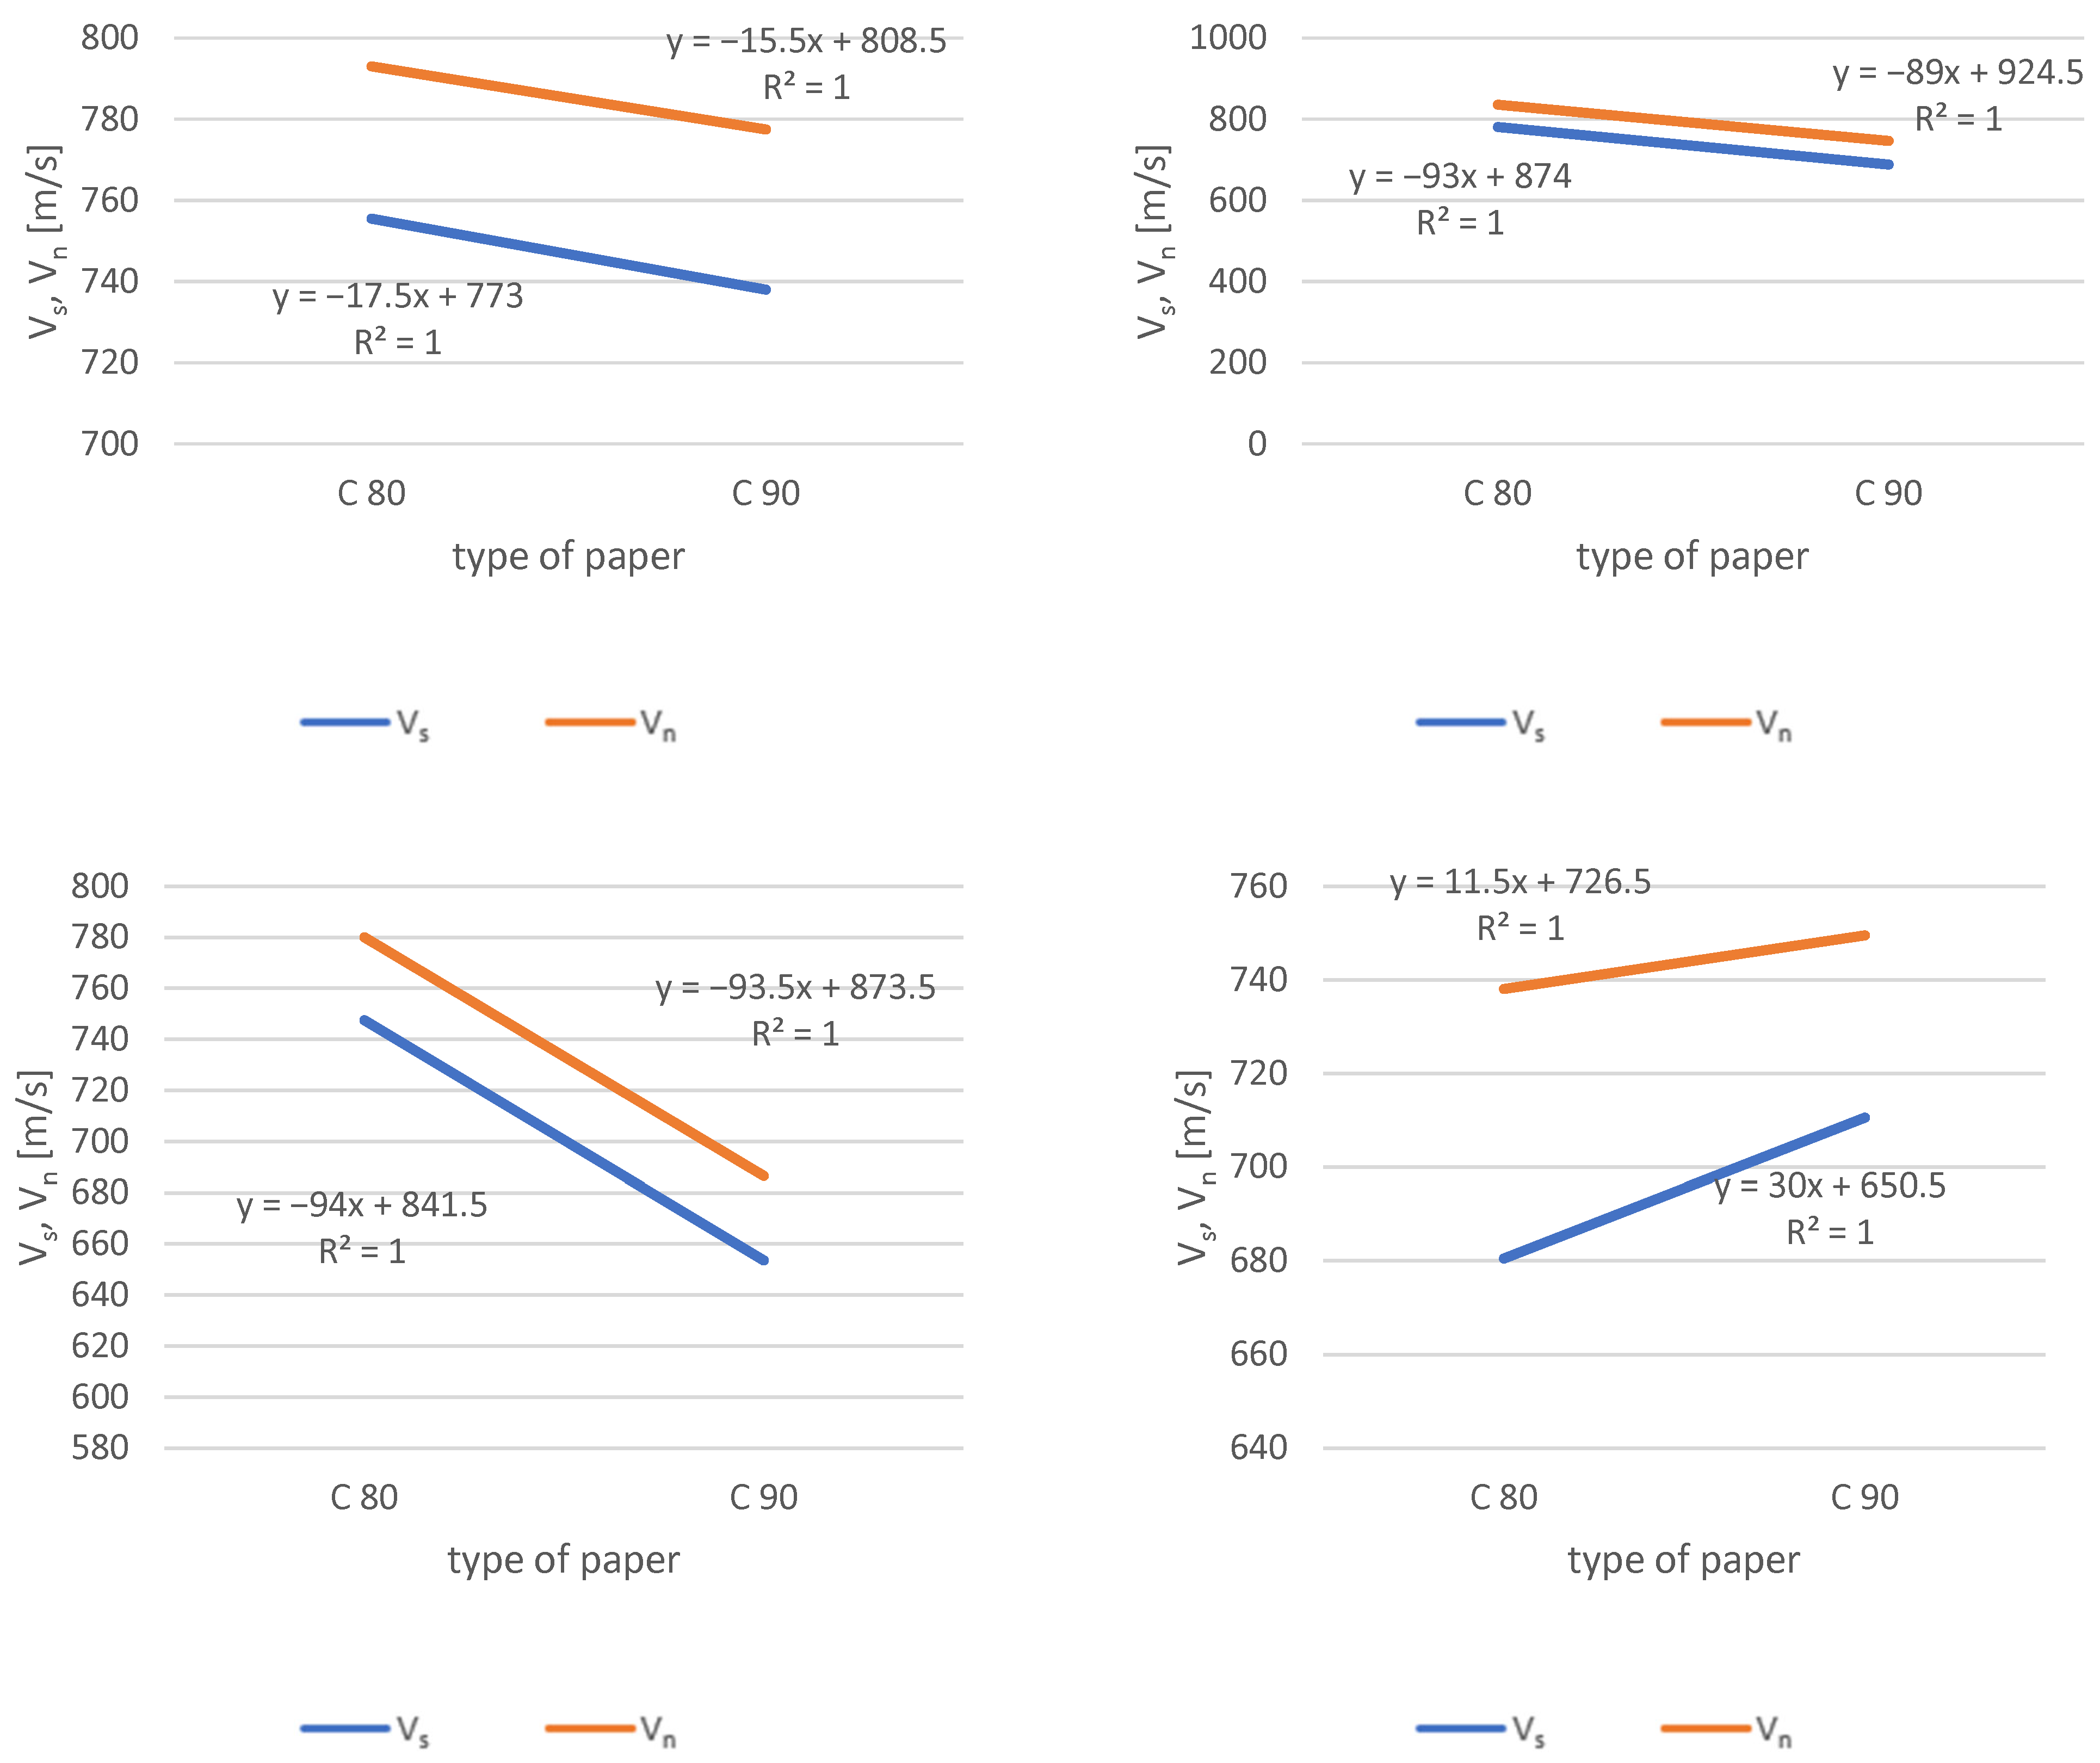
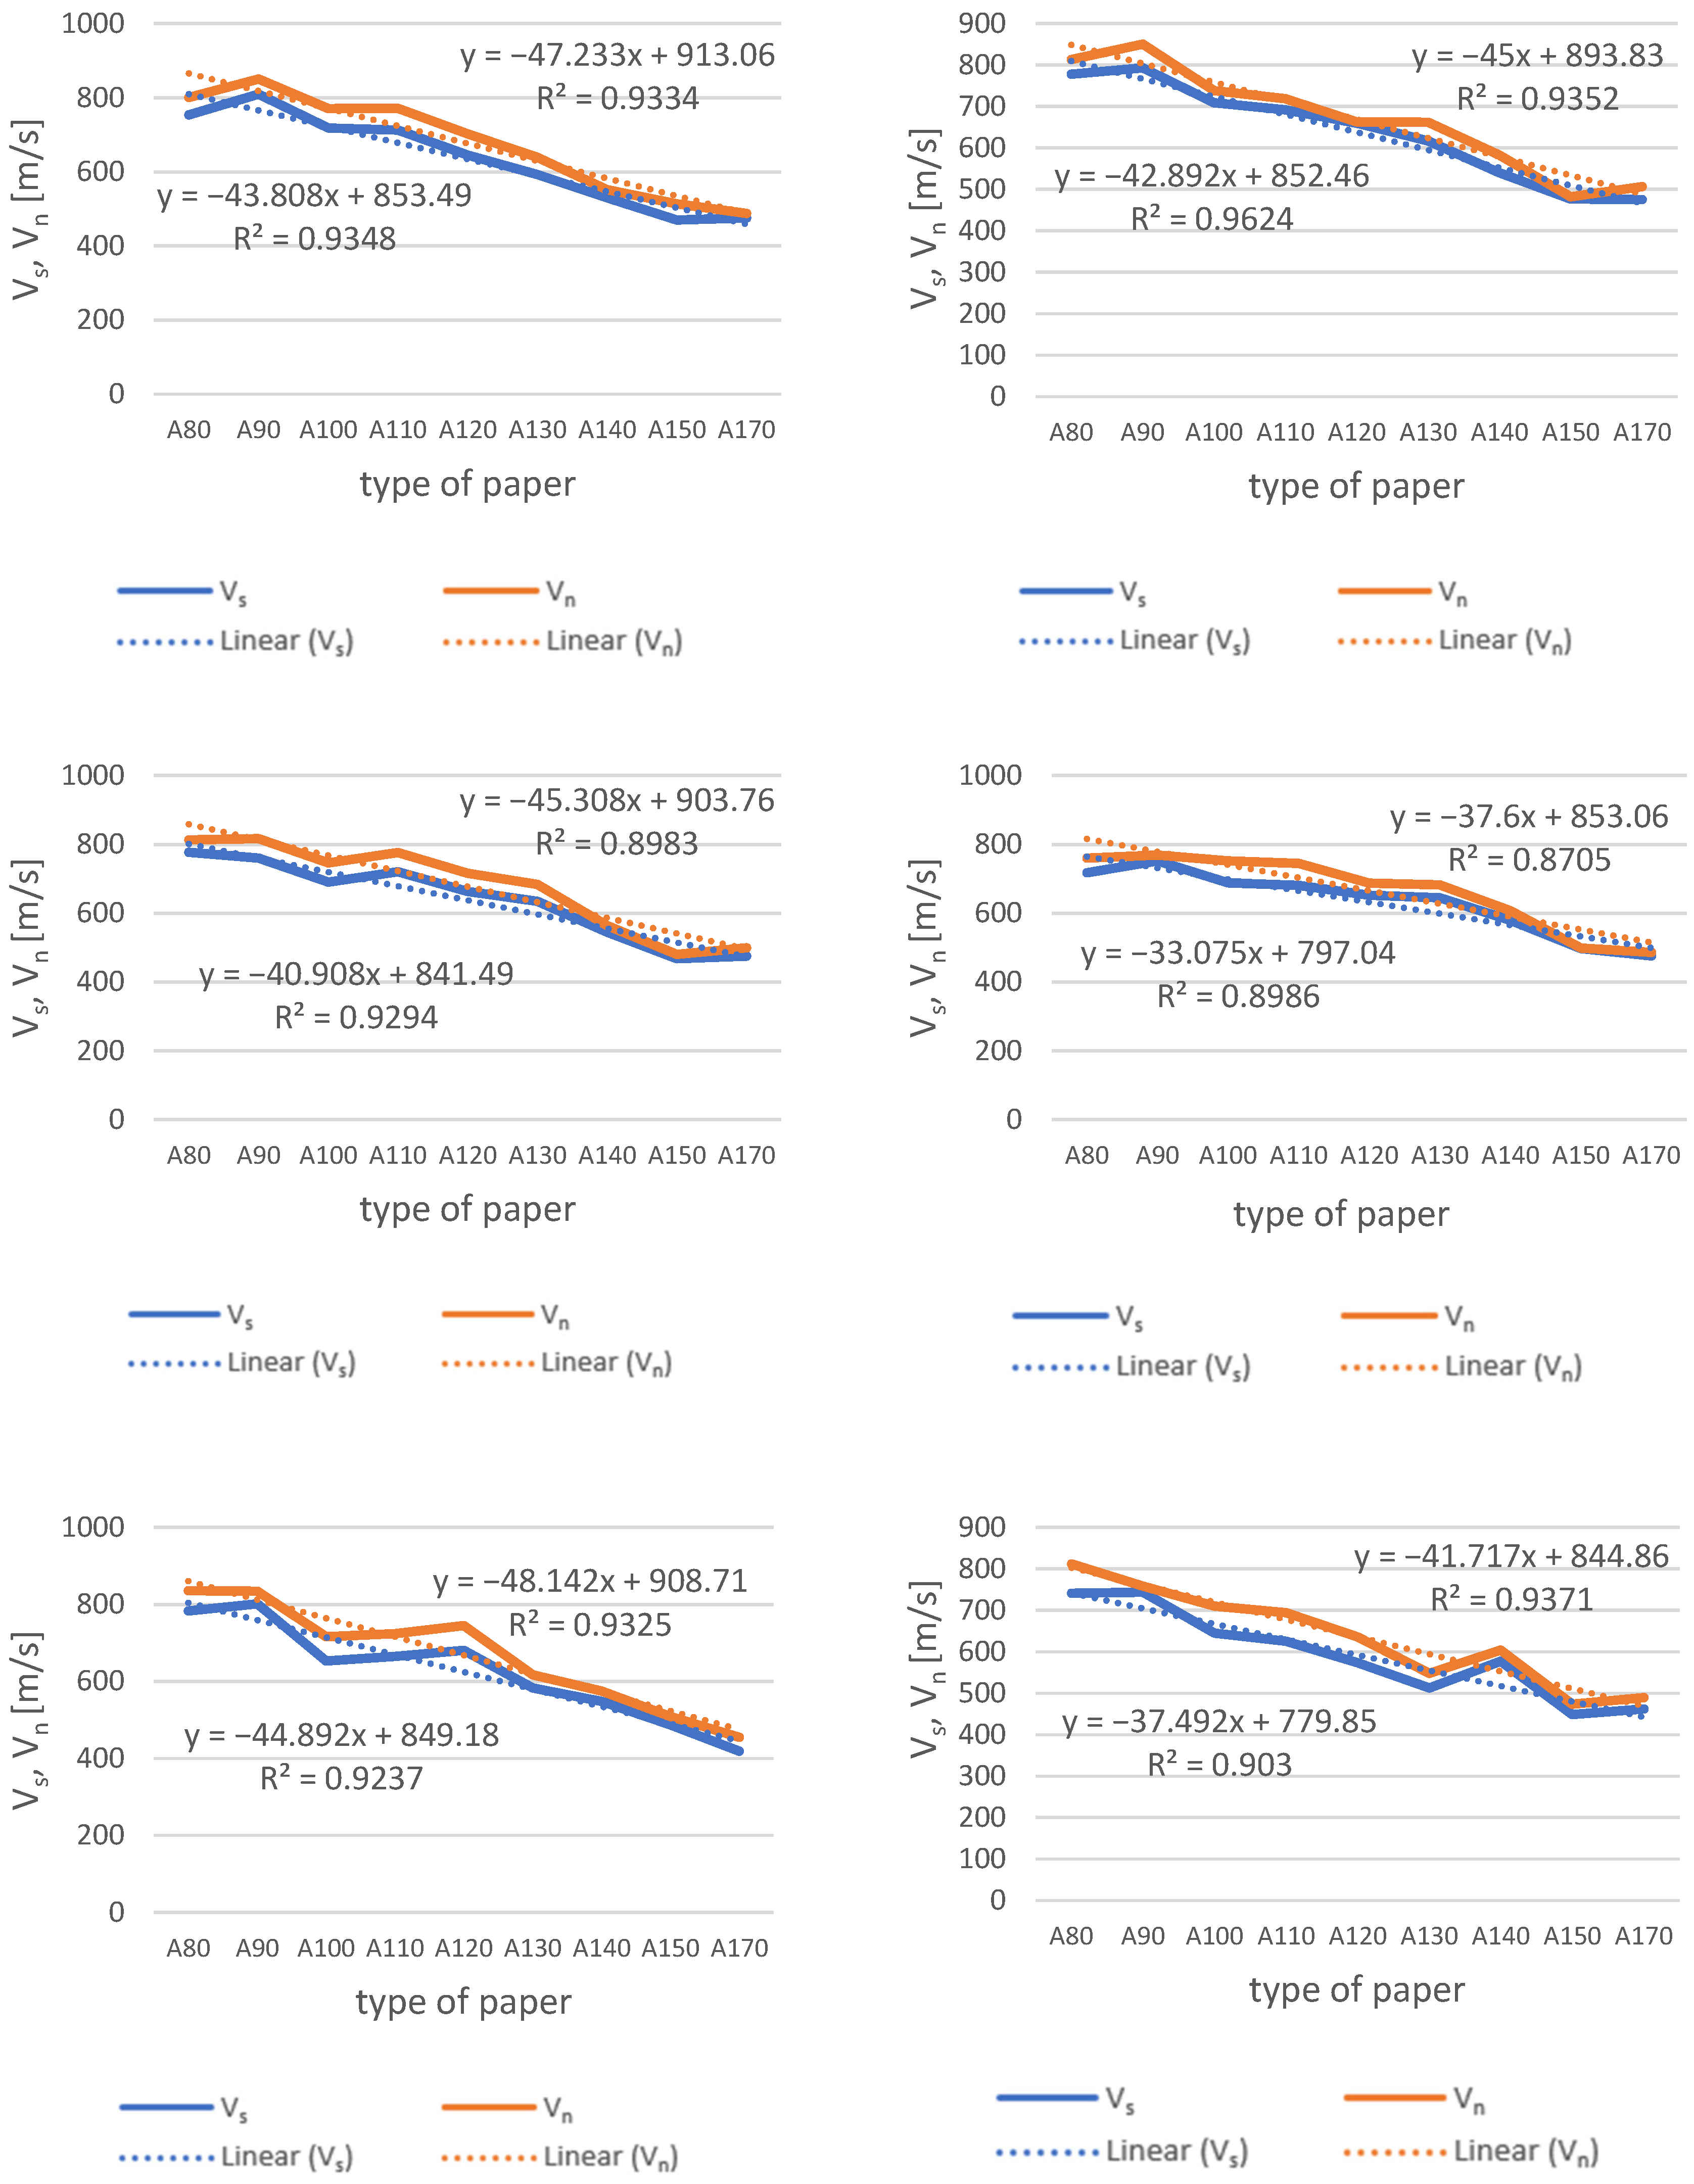
- As the grammage increases (for a given type of paper), the optimal values of the speed ranges of Vs and Vn decrease;
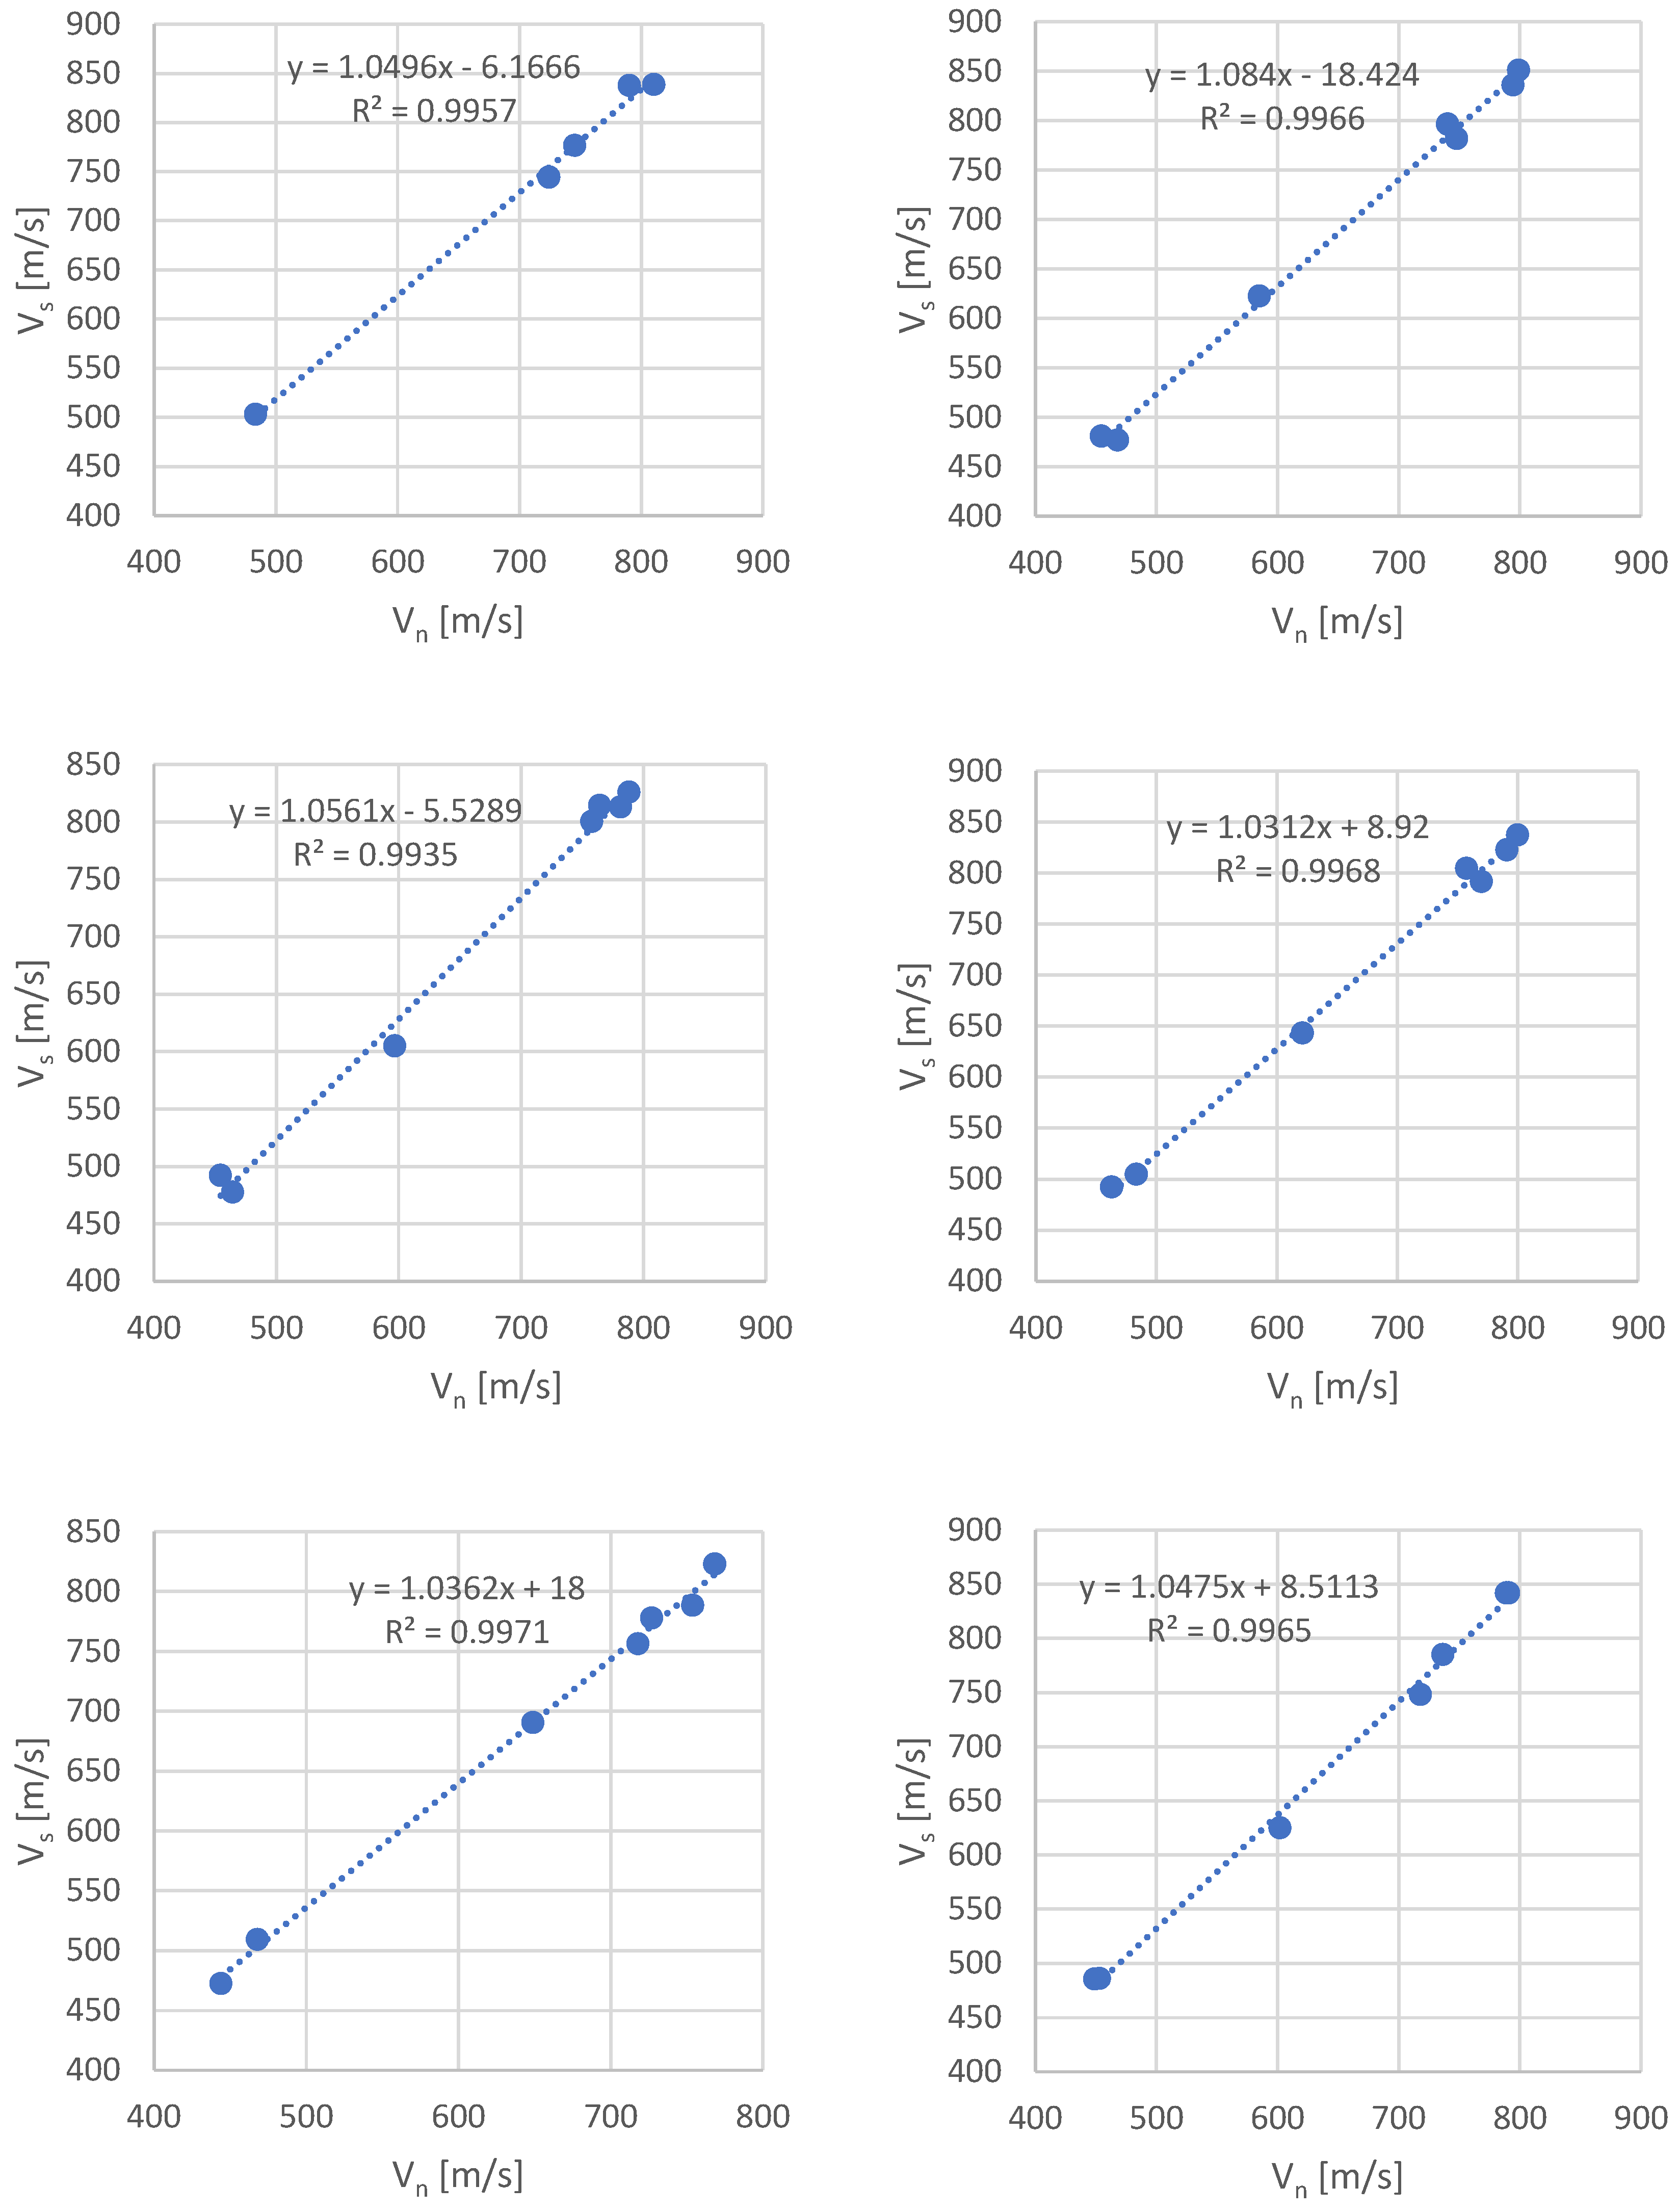
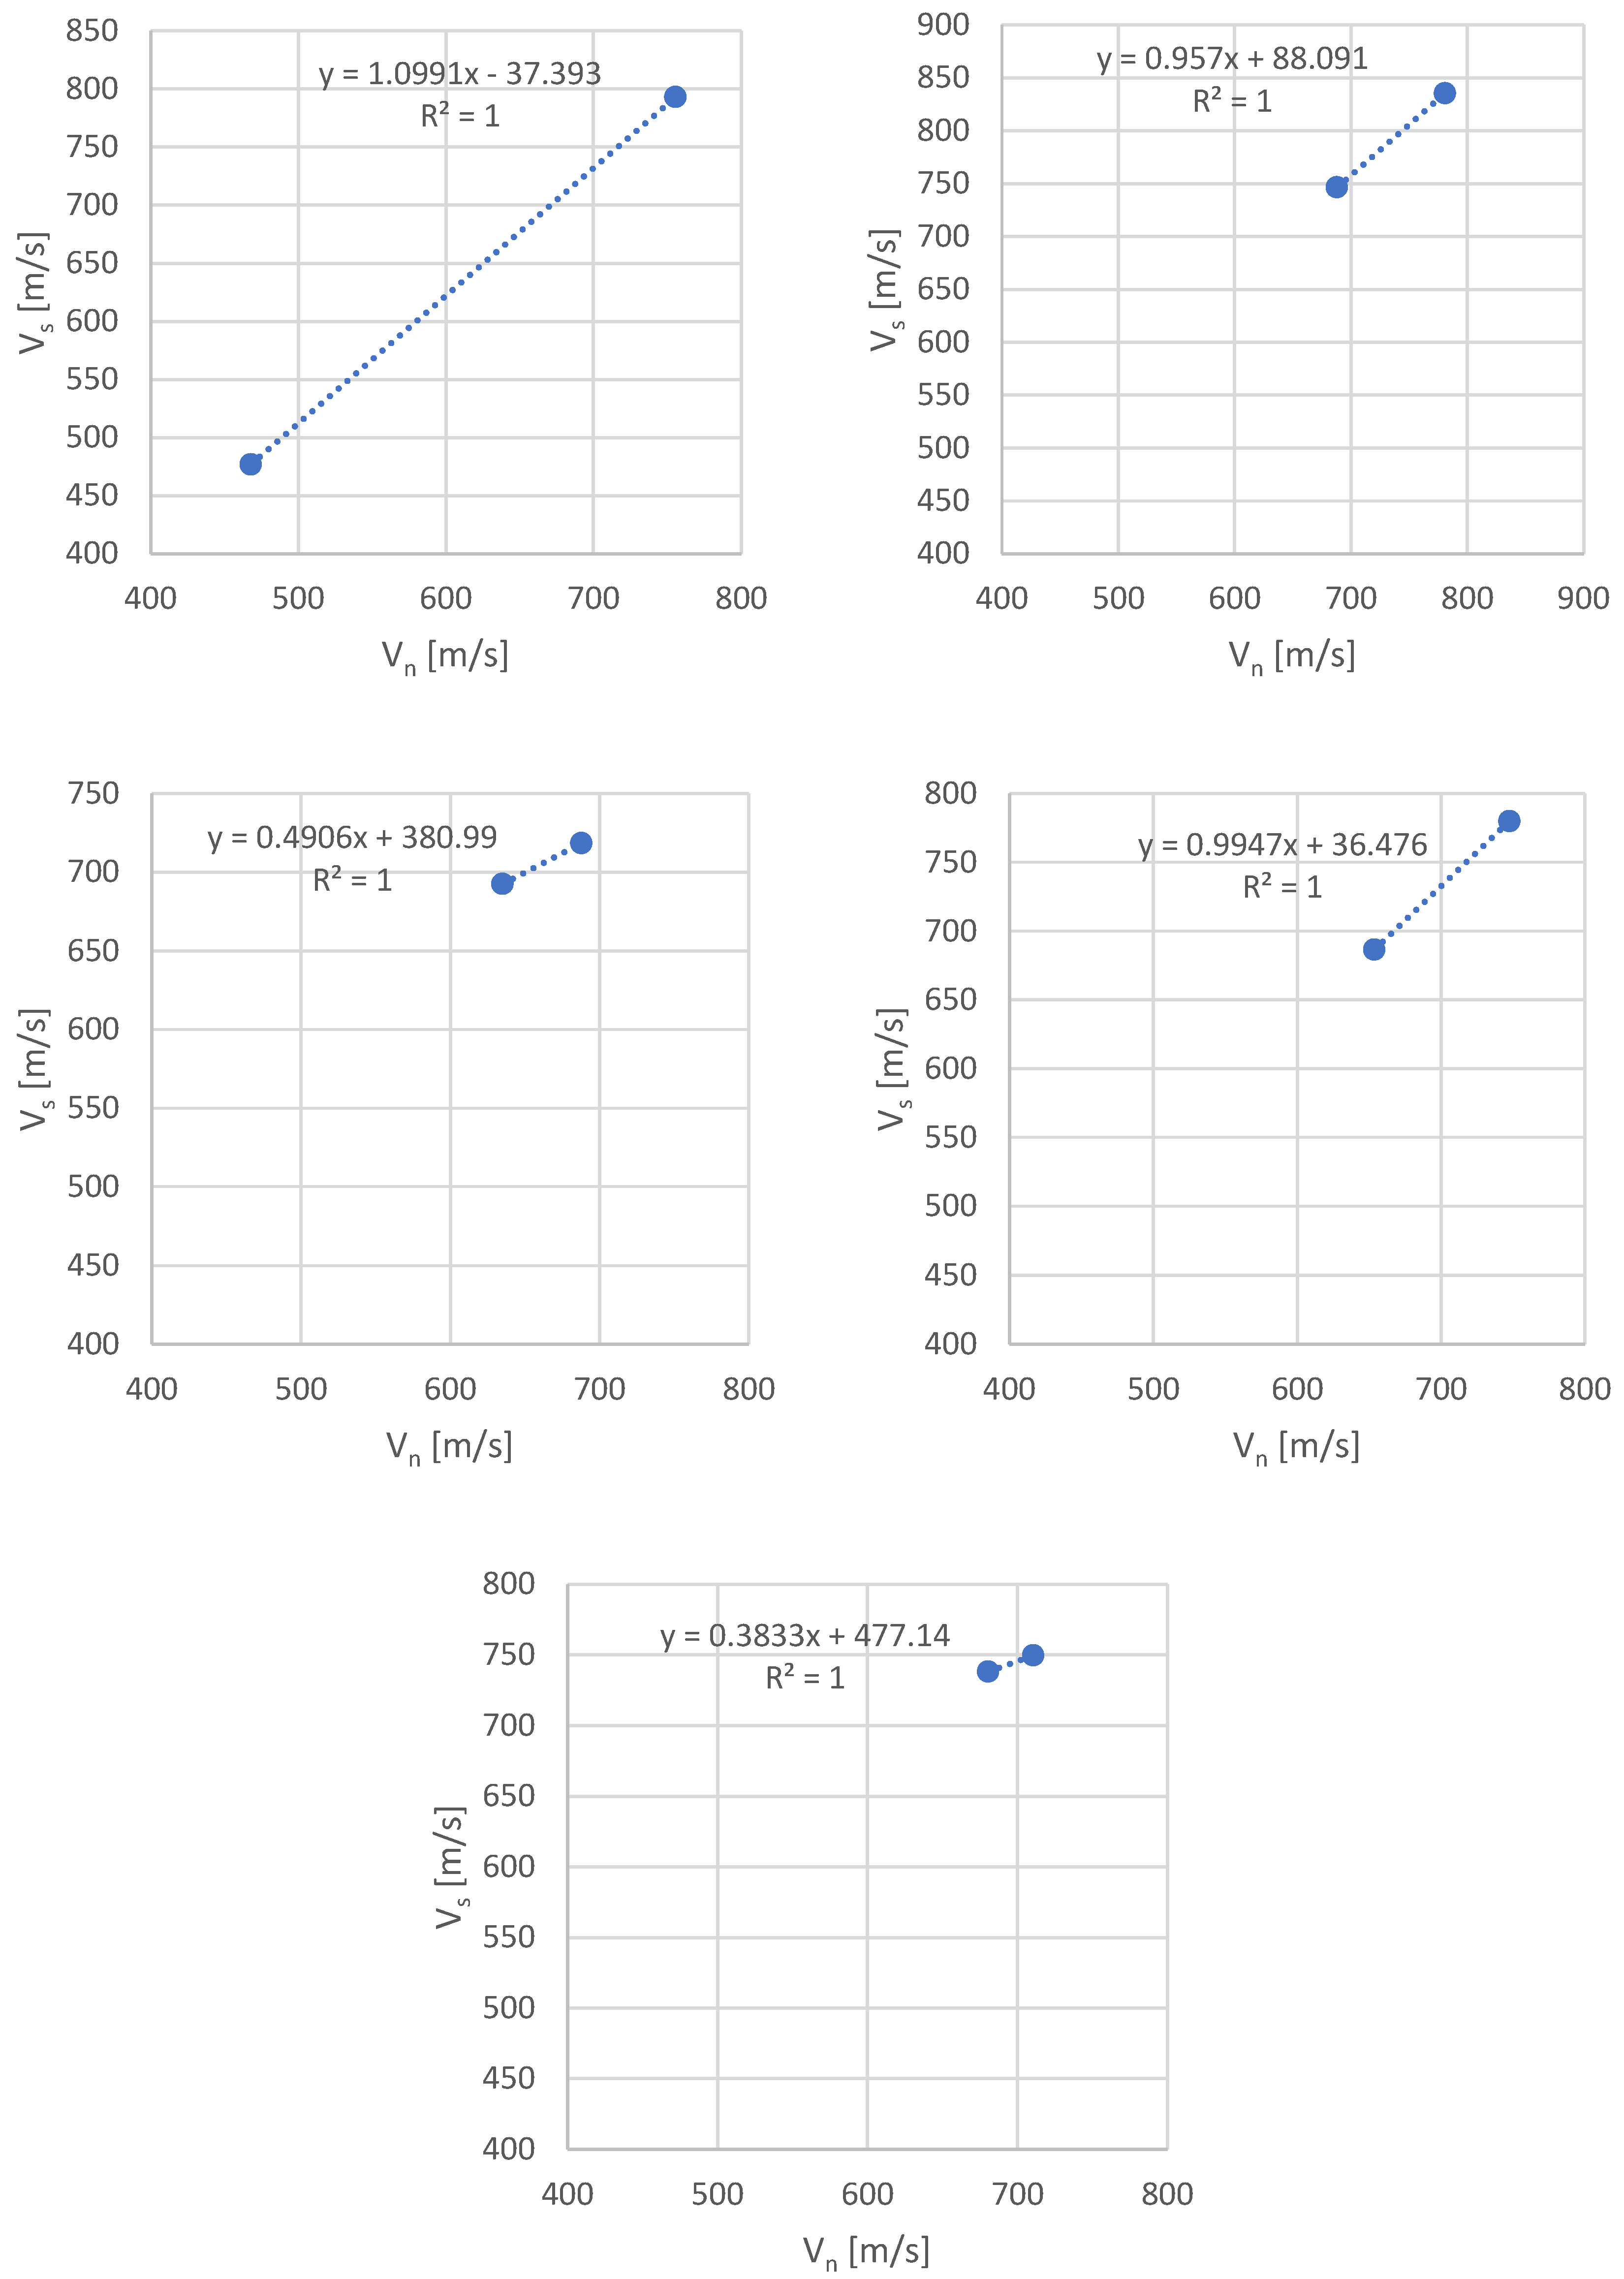
- The optimal velocities Vs and Vn are strongly correlated;
- The established regression equations enable the determination of screen speed based on a known winding speed value, thereby minimizing the risk of undesirable phenomena.
- Minimization of the risk of undesirable phenomena (such as spurts);
- Significant improvements in production quality and continuity;
- The potential for developing a more accurate prediction of the amount of useful heat and electricity generated.
Author Contributions
Funding
Data Availability Statement
Conflicts of Interest
Appendix A
References
- Pociecha, J. Development of Taxonomic Methods and Their Applications in Socio-Economic Research; Central Statistical Office: Warsaw, Poland, 2008. (In Polish) [Google Scholar]
- Polek, D. Optimization of Useful Heat and Electricity Production in the Steam-Gas System of a Commercial CHP Plant with its Potential Sale on the Power Exchange. Ph.D. Thesis, AGH University of Krakow, Krakow, Poland, 2024. (In Polish). [Google Scholar]
- Larski, Z. Taxonomy of vertebrate viruses. Vet. Med. 2008, 64, 851. (In Polish) [Google Scholar]
- Kmieciak, W.; Szewczyk, E. Coagulase-positive species of the genus Staphylococcus—Taxonomy, pathogenicity. Post. Microbiol. 2017, 56, 233–244. (In Polish) [Google Scholar] [CrossRef]
- Schriefer, A.E.; Cliften, P.F.; Hibberd, M.C.; Sawyer, C.; Brown-Kennerly, V.; Burcea, L.; Klotz, E.; Crosby, S.D.; Gordon, J.I.; Head, R.D. A multi-amplicon 16S rRNA sequencing and analysis method for improved taxonomic profiling of bacterial communities. J. Microbiol. Meth. 2020, 154, 6–13. [Google Scholar] [CrossRef] [PubMed]
- Vasquez, Y.M.S.C.; Gomes, M.B.; Sivla, T.R.; Duarte, A.W.F.; Rosa, L.H.; Oliveira, V.M. Cold-adapted chitinases from Antarctic bacteria: Taxonomic assessment and enzyme production optimization. Biocatal. Agric. Biotechnol. 2021, 34, 102029. [Google Scholar]
- Taber, P.; Staes, C.J.; Phengphoo, S.; Rocha, E.; Lam, A.W.; Fiol, G.D.; Maviglia, S.M.; Rocha, R.A. Developing a sampling method and preliminary taxonomy for classifying COVID-19 public health guidance for healthcare organizations and the general public. J. Biomed. Inform. 2021, 120, 103852. [Google Scholar] [CrossRef] [PubMed]
- Zamri, M.N.; Sunar, M.S. Atmospheric cloud modeling methods in computer graphics: A review, trends, taxonomy, and future directions. J. King Saud. Univ. Comput. Inf. Sci. 2020, 34, 3468–3488. [Google Scholar] [CrossRef]
- Grabiński, T. Methods of Taxonometry; Cracow University of Economics: Cracow, Poland, 1992. (In Polish) [Google Scholar]
- Dziekański, P. Taxonomic method in the assessment of the environmental competitiveness of the districts of the Świętokrzyskie Voivodeship. Res. Pap. Univ. Econ. Wrocław 2014, 348, 44–54. (In Polish) [Google Scholar]
- Rovan, J.; Sambt, J. Socio-economic Differences Among Slovenian Municipalities: A Cluster Analysis Approach. In Developments in Applied Statistics; Ferligoj, A., Mrvar, A., Eds.; FDV: Ljubljana, Slovenia, 2003; pp. 265–278. [Google Scholar]
- Soares, J.; Marquez, M.; Monteiro, C. A multivariate methodology to uncover regional disparities: A contribution to improve European Union and governmental decisions. Eur. J. Oper. Res. 2003, 145, 121–135. [Google Scholar] [CrossRef]
- Goletsis, Y.; Chletsos, M. Measurement of development and regional disparities in Greek periphery: A multivariate approach. Socio-Econ. Plan. Sci. 2011, 45, 174–183. [Google Scholar] [CrossRef]
- Vetrakova, J.; Risin, I. Clustering of Socio-Economic Space: Theoretical Approaches and Russian Experience, taxonomy, and future directions. Procedia Econ. Financ. 2015, 27, 538–547. [Google Scholar]
- Balaniuk, I.; Kyrylenko, V.; Chaliuk, Y.; Sheiki, Y.; Begun, S.; Diachenko, L. Cluster analysis of socio-economic development of rural areas and peasant farms in the system of formation of rural territorial communities: A case of study of Volyn Region, Ukraine. Sci. Papers Ser. Manag. Econom. Eng. Agric. Rural Dev. 2021, 21, 177–188. [Google Scholar]
- Podolec, B.; Zając, K. Econometric Methods of Determining Consumption Regions; Polskie Wydawnictwo Ekonomiczne: Warsaw, Poland, 1978. (In Polish) [Google Scholar]
- Wydymus, S. Methods of Multidimensional Analysis of Socio-Economic Development; Special Series: Monographs; Cracow University of Economics: Cracow, Poland, 1984. [Google Scholar]
- Nowińska-Łaźniewska, E.; Górecki, T. Convergence and divergence processes—Presentation of selected models used in regional analyses. Stud. Reg. Lokal. 2005, 2, 89–100. (In Polish) [Google Scholar]
- Fadilah, I.; Witiastuti, R. A clustering method approach for Portfolio Optimization. Manag. Anal. J. 2018, 7, 436–447. [Google Scholar] [CrossRef]
- Garsztka, P.; Rutkowska-Ziarko, A. Diversification of risk of a fundamental portfolio based on semi-variance. Econ. Bus. Rev. 2014, 14, 80–96. (In Polish) [Google Scholar]
- León, D.; Sandoval, J.; Aragón, A.; Hernández, G.; Arévalo, A.; Niño, J. Clustering Algorithms for Risk-Adjusted Portfolio Construction. Procedia Comput. Sci. 2017, 108, 1334–1343. [Google Scholar] [CrossRef]
- Marvin, K. Creating Diversified Portfolios Using Cluster Analysis, Independent Work Report Fall. 2015. Available online: https://www.cs.princeton.edu/sites/default/files/uploads/karina_marvin.pdf?fbclid=IwAR3QKvNdbmVMNLARTixVx0XtusCgxT_XCAcqd5qLHIZBjj4Vkx7B_t94OLs (accessed on 20 April 2024).
- Gubu, L.; Abdurakhman, A.; Rosadi, D. A New Approach for Robust Mean-Variance Portfolio Selection Using Trimmed k-Means Clustering. Ind. Eng. Manag. Syst. 2021, 20, 782–794. [Google Scholar] [CrossRef]
- Borys, T. Methods of normalizing traits in comparative statistical studies. Prz. Stat. 1978, 2, 363–372. (In Polish) [Google Scholar]
- Pięta, P.; Niedoba, T.; Surowiak, A. 2018. The Use of Taxonomy Methods to Assess the Enrichment of Individual Lithological Types of Polish Copper Ores. In Science, Research and Scientific Reports: Technical and Exact Sciences; Wysoczański, T., Ed.; Idea Knowledge Future: Świebodzice, Poland, 2018; pp. 229–237. (In Polish) [Google Scholar]
- Niedoba, T.; Pięta, P.; Surowiak, A.; Şahbaz, O. Multidimensional Optimization of the Copper Flotation in a Jameson Cell by Means of Taxonomic Methods. Minerals 2021, 11, 385. [Google Scholar] [CrossRef]
- Alkhayat, G.; Mehmood, R. A review and taxonomy of wind and solar energy forecasting methods based on deep learning. Energy AI 2021, 4, 100060. [Google Scholar] [CrossRef]
- Pach-Gargul, A. Single Electricity Market in the European Union in the Context of Polish’s Energy Security. Ph.D. Thesis, Cracow University of Economics, Kraków, Poland, 2012. (In Polish). [Google Scholar]
- Ivy, A.; Manowska, A. The Use of Hierarchical Agglomeration Methods in Assessing the Polish Energy Market. Energies 2021, 14, 3958. [Google Scholar] [CrossRef]
- Ficoń, K.; Krasnodębski, G. Study of multi-feature objects using numerical taxonomy using a reference object. Mil. Logist. Syst. 2016, 45, 91–107. [Google Scholar]
- Gawlik, L.; Mokrzycki, E. Effective Production and Use of Energy; IGSMiE PAN Publishing House: Krakow, Poland, 2021. (In Polish) [Google Scholar]
- Hellwig, Z. Applications of the taxonomic method to the typological division of countries according to the level of development. Prz. Stat. 1968, 25, 307–327. (In Polish) [Google Scholar]
- Borg, I.; Groenen, P.J.F. Modern Multidimensional Scaling, Theory and Application, 2nd ed.; Springer Science Business Media: New York, NY, USA, 2005. [Google Scholar]
- Walesiak, M. Visualization of Linear Ordering Results for Metric Data with the Application of Multidimensional Data Scaling. Econometrics 2016, 2, 9–21. (In Polish) [Google Scholar]
- Churski, P.; Herodowicz, T.; Konecka-Szydłowska, B.; Perdał, R. Spatial Differentiation of the Socio-Economic Development of Poland–“Invisible” Historical Heritage. Land 2021, 10, 1247. (In Polish) [Google Scholar] [CrossRef]
- Falniowski, A. Numerical Methods in Taxonomy; Jagiellonian University Press: Krakow, Poland, 2003. (In Polish) [Google Scholar]
- Pluta, W. Multidimensional Comparative Analysis in Economic Research; Polskie Wydawnictwo Ekonomiczne: Warsaw, Poland, 1977. (In Polish) [Google Scholar]
- Nowak, E. Taxonomic Methods in the Classification of Socio-Economic Objects; PWE: Warsaw, Poland, 1990. (In Polish) [Google Scholar]
- Dykas, P. Taksonomiczne wskaźniki przestrzennego zróżnicowania rozwoju powiatów województwa podkarpackiego. Stud. Praw.-Ekon. 2009, 80, 201–214. (In Polish) [Google Scholar]


| A-80, Year 2020 | ||||||
|---|---|---|---|---|---|---|
| Vs [m/s] Vn [m/s] | I [835–854] | II [855–874] | III [875–893] | IV [894–912] | V [913–931] | VI [932–950] |
| 880–898 (1) | P1 = 0.9324 | |||||
| P2 = 0.0389 | ||||||
| P3 = 0.0056 | ||||||
| P4 = 0.0231 | ||||||
| 899–917 (2) | P1 = 0.8404 | |||||
| P2 = 0.0998 | ||||||
| P3 = 0.0064 | ||||||
| P4 = 0.0534 | ||||||
| 918–936 (3) | P1 = 0.0882 | P1 = 0.5795 | ||||
| P2 = 0.9108 | P2 = 0.3948 | |||||
| P3 = 0.001 | P3 = 0.0046 | |||||
| P4 = 0 | P4 = 0.0211 | |||||
| 937–955 (4) | P1 = 0.7465 | |||||
| P2 = 0.2224 | ||||||
| P3 = 0.0035 | ||||||
| P4 = 0.0276 | ||||||
| 956–974 (5) | P1 = 0.8689 | P1 = 0.8891 | ||||
| P2 = 0.0863 | P2 = 0.0697 | |||||
| P3 = 0.0074 | P3 = 0.0033 | |||||
| P4 = 0.0374 | P4 = 0.0379 | |||||
| 975–992 (6) | P1 = 0.8667 | P1 = 0.8978 | ||||
| P2 = 0.0913 | P2 = 0.0836 | |||||
| P3 = 0.0036 | P3 = 0.0087 | |||||
| P4 = 0.0384 | P4 = 0.0099 | |||||
| A-80 2020 | ||||||||
|---|---|---|---|---|---|---|---|---|
| Object | Class Vs | Class Vn | P1 | P2 | P3 | P4 | D | |
| O1 | And | (1) | 0.932 | 1.073 | 0.039 | 0.006 | 0.023 | 1.478205 |
| O2 | II | (2) | 0.84 | 1.19 | 0.1 | 0.006 | 0.053 | 1.289908 |
| O3 | II | (3) | 0.088 | 11.34 | 0.911 | 0.001 | 0 | 1.335413 |
| O4 | III | (3) | 0.58 | 1.726 | 0.395 | 0.005 | 0.021 | 1.275807 |
| O5 | IV | (4) | 0.747 | 1.34 | 0.222 | 0.004 | 0.028 | 1.392694 |
| O6 | IV | (5) | 0.869 | 1.151 | 0.086 | 0.007 | 0.037 | 1.318661 |
| O7 | V | (5) | 0.889 | 1.125 | 0.07 | 0.003 | 0.038 | 1.460736 |
| O8 | V | (6) | 0.867 | 1.154 | 0.091 | 0.004 | 0.038 | 1.427912 |
| O9 | VI | (6) | 0.898 | 1.114 | 0.084 | 0.009 | 0.01 | 1.517104 |
| Class | Mid-Class | ||
|---|---|---|---|
| Vs [m/s] | Vn [m/s] | Vs [m/s]avg | Vn [m/s]avg |
| 932–950 | 975–992 | 941 | 983.5 |
| 835–854 | 880–898 | 844.5 | 889 |
| 913–931 | 956–974 | 922 | 965 |
| 913–931 | 975–992 | 922 | 983.5 |
| 894–912 | 937–955 | 903 | 946 |
| 855–874 | 918–936 | 864.5 | 927 |
| 894–912 | 956–974 | 903 | 965 |
| 855–874 | 899–917 | 864.5 | 908 |
| 875–893 | 918–936 | 884 | 927 |
| 2015 | 2016 | 2017 | 2018 | 2019 | 2020 | Average | ||||||||
|---|---|---|---|---|---|---|---|---|---|---|---|---|---|---|
| Vs | Vn | Vs | Vn | Vs | Vn | Vs | Vn | Vs | Vn | Vs | Vn | Vs | Vn | |
| A-60 | 778.5 | 838 | 755.5 | 810.5 | 781 | 824 | 766 | 827 | 889 | 934.5 | 860.5 | 929 | 805.1 | 860.5 |
| A-70 | 815 | 869 | 819 | 869 | 789.5 | 860.5 | 755 | 801 | 831.5 | 856.5 | 931.5 | 981 | 823.6 | 872.8 |
| A-80 | 793 | 841.5 | 805.5 | 875 | 756 | 819 | 767.5 | 828 | 819.5 | 886.5 | 941 | 983.5 | 813.8 | 872.3 |
| A-90 | 745.5 | 797 | 740.5 | 802 | 756 | 781.5 | 772.5 | 820 | 952.5 | 992.5 | 793.4 | 838.6 | ||
| A-100 | 705 | 746.5 | 688 | 728 | 891 | 922 | 761.3 | 798.8 | ||||||
| B-70 | 789 | 835 | 799.5 | 854.5 | 782 | 832 | 890.5 | 915 | 883 | 924.5 | 828.8 | 872.2 | ||
| B-75 | 803 | 846 | 787.5 | 842.5 | 788 | 846.5 | 810.5 | 872.5 | 899 | 946 | 817.6 | 870.7 | ||
| B-80 | 764.5 | 821.5 | 800 | 844.5 | 870.5 | 917.5 | 899.5 | 934 | 833.6 | 879.4 | ||||
| C-70 | 764 | 816 | 825.5 | 870 | 779 | 828 | 808 | 858 | 839 | 878 | 803.1 | 850.0 | ||
| C-80 | 783 | 811.5 | 780.5 | 823 | 763.5 | 813.5 | 759 | 810 | 871.5 | 910.5 | 888 | 953 | 807.6 | 853.6 |
| C-90 | 766.5 | 814.5 | 786.5 | 807 | 711 | 747 | 765.5 | 816 | 841 | 881.5 | 861.5 | 903 | 788.7 | 828.2 |
| 2015 | 2016 | 2017 | 2018 | 2019 | 2020 | Average | ||||||||
|---|---|---|---|---|---|---|---|---|---|---|---|---|---|---|
| Vs | Vn | Vs | Vn | Vs | Vn | Vs | Vn | Vs | Vn | Vs | Vn | Vs | Vn | |
| A-80 | 754 | 801.5 | 778 | 813.5 | 776.5 | 813 | 717.5 | 759.5 | 783.5 | 836 | 741.5 | 812 | 758.5 | 805.9 |
| A-90 | 810 | 851 | 793.5 | 851 | 759.5 | 816.5 | 751.5 | 768.5 | 801.5 | 834.5 | 744 | 758.5 | 776.7 | 813.3 |
| A-100 | 718.5 | 771 | 709 | 738.5 | 690 | 745.5 | 688 | 752 | 653.5 | 716 | 645 | 710.5 | 684.0 | 738.9 |
| A-110 | 713 | 771.5 | 692.5 | 719 | 720.5 | 776.5 | 680 | 744.5 | 665.5 | 724 | 625.5 | 694.5 | 682.8 | 738.3 |
| A-120 | 645.5 | 703 | 659.5 | 663 | 663 | 716 | 652 | 687 | 681 | 745 | 574 | 635.5 | 645.8 | 691.6 |
| A-130 | 592.5 | 639.5 | 617 | 662.5 | 634.5 | 684 | 644 | 682.5 | 583 | 617 | 513 | 548 | 597.3 | 638.9 |
| A-140 | 530.5 | 552.5 | 540.5 | 582.5 | 545 | 563.5 | 579.5 | 607 | 548 | 575.5 | 577 | 604 | 553.4 | 580.8 |
| A-150 | 470 | 514 | 476.5 | 482.5 | 468 | 480.5 | 497 | 498.5 | 487.5 | 509 | 449 | 474 | 474.7 | 493.1 |
| A-170 | 476 | 488 | 475.5 | 507 | 475.5 | 499.5 | 475.5 | 486 | 419 | 455 | 462.5 | 489.5 | 464.0 | 487.5 |
| B-70 | 790.5 | 837.5 | 794.5 | 836 | 788.5 | 826 | 800 | 837 | 768.5 | 823 | 791 | 842 | 788.8 | 833.6 |
| B-75 | 810.5 | 838.5 | 799 | 851 | 781.5 | 813 | 791 | 822.5 | 754 | 788.5 | 789 | 842 | 787.5 | 825.9 |
| B- 90 | 745.5 | 776.5 | 740.5 | 796.5 | 764.5 | 814.5 | 757.5 | 804.5 | 727 | 778 | 736.5 | 785 | 745.3 | 792.5 |
| B-100 | 724.5 | 744.5 | 748 | 782 | 758 | 800.5 | 770 | 791.5 | 718 | 756.5 | 718 | 748 | 739.4 | 770.5 |
| B-120 | 585 | 622.5 | 597 | 605 | 621.5 | 643 | 649 | 690.5 | 602 | 625 | 610.9 | 637.2 | ||
| B-150 | 454.5 | 481 | 454.5 | 492 | 463 | 492 | 444 | 472.5 | 453 | 486 | 453.8 | 484.7 | ||
| B-160 | 483.5 | 503 | 468 | 477 | 464.5 | 477.5 | 483.5 | 504.5 | 468 | 509.5 | 449 | 485.5 | 469.4 | 492.8 |
| D-80 | 755.5 | 793 | 781 | 835.5 | 688 | 718.5 | 747.5 | 780 | 680.5 | 738 | 730.5 | 773.0 | ||
| D-90 | 738 | 777.5 | 688 | 746.5 | 635 | 692.5 | 653.5 | 686.5 | 710.5 | 749.5 | 685.0 | 730.5 | ||
| E-80 | 784 | 833.5 | 717.5 | 752.5 | 719.5 | 754.5 | 744 | 800 | 700.5 | 737.5 | 733.1 | 775.6 | ||
| E-90 | 670 | 701 | 616 | 645 | 679.5 | 717.5 | 655.2 | 687.8 | ||||||
Disclaimer/Publisher’s Note: The statements, opinions and data contained in all publications are solely those of the individual author(s) and contributor(s) and not of MDPI and/or the editor(s). MDPI and/or the editor(s) disclaim responsibility for any injury to people or property resulting from any ideas, methods, instructions or products referred to in the content. |
© 2024 by the authors. Licensee MDPI, Basel, Switzerland. This article is an open access article distributed under the terms and conditions of the Creative Commons Attribution (CC BY) license (https://creativecommons.org/licenses/by/4.0/).
Share and Cite
Polek, D.; Niedoba, T.; Jamróz, D. Multi-Criteria Optimization of the Paper Production Process Using Numerical Taxonomy Methods: A Necessary Condition for Predicting Heat and Electricity Output in a Combined Heat and Power (CHP) System. Energies 2024, 17, 5548. https://doi.org/10.3390/en17225548
Polek D, Niedoba T, Jamróz D. Multi-Criteria Optimization of the Paper Production Process Using Numerical Taxonomy Methods: A Necessary Condition for Predicting Heat and Electricity Output in a Combined Heat and Power (CHP) System. Energies. 2024; 17(22):5548. https://doi.org/10.3390/en17225548
Chicago/Turabian StylePolek, Daria, Tomasz Niedoba, and Dariusz Jamróz. 2024. "Multi-Criteria Optimization of the Paper Production Process Using Numerical Taxonomy Methods: A Necessary Condition for Predicting Heat and Electricity Output in a Combined Heat and Power (CHP) System" Energies 17, no. 22: 5548. https://doi.org/10.3390/en17225548
APA StylePolek, D., Niedoba, T., & Jamróz, D. (2024). Multi-Criteria Optimization of the Paper Production Process Using Numerical Taxonomy Methods: A Necessary Condition for Predicting Heat and Electricity Output in a Combined Heat and Power (CHP) System. Energies, 17(22), 5548. https://doi.org/10.3390/en17225548