1. Introduction
The increasing trend in world energy consumption determines a wider employment of fossil and renewable sources to meet the total demand. Recent estimates indicate that the global primary energy requirement in 2050 will be 80% higher than the 2000 level [
1]. In the European Community, the primary energy consumption in the period 1990–2020 almost doubled in all the member countries, especially in the eastern nations, whereas a slight decrease was registered from 2015 to 2020 in western countries [
1]. Specifically, for Italy, the absorbed primary energy was 333 925 TJ in 1990, which grew to 569 779 TJ (+70%) in 2015, and reduced to 529 162 TJ (−7%) in 2021 owing to the pandemic period [
1]. Regarding the society sectors, the building stock shows the greatest consumption share, representing 47% of the global primary energy demand worldwide [
2]. Therefore, it is significant to find solutions to promote consumption reductions through the development of novel systems stimulating the efficient use of renewable sources by preserving environmental sustainability [
3]. Currently, this aspect is widely regulated for new constructions, but the improvement attainable in terms of energy demand limitation is quite limited, considering that these edifices represent a low percentage of the current building stock [
4]. A larger potential, instead, is offered by existing edifices, the majority of which were built before the promulgation of specific rules to limit energy consumption. This is particularly true for historical buildings, which are aged, widespread, and uniformly distributed in a given territory. Anyway, for such a building typology, it is very difficult to plan renovation interventions, both for the envelope and the HVAC [
5], because aesthetic features must be preserved [
6], and the implementation of a passive solution (i.e., attached sunspaces) as well as the integration of a renewable system [
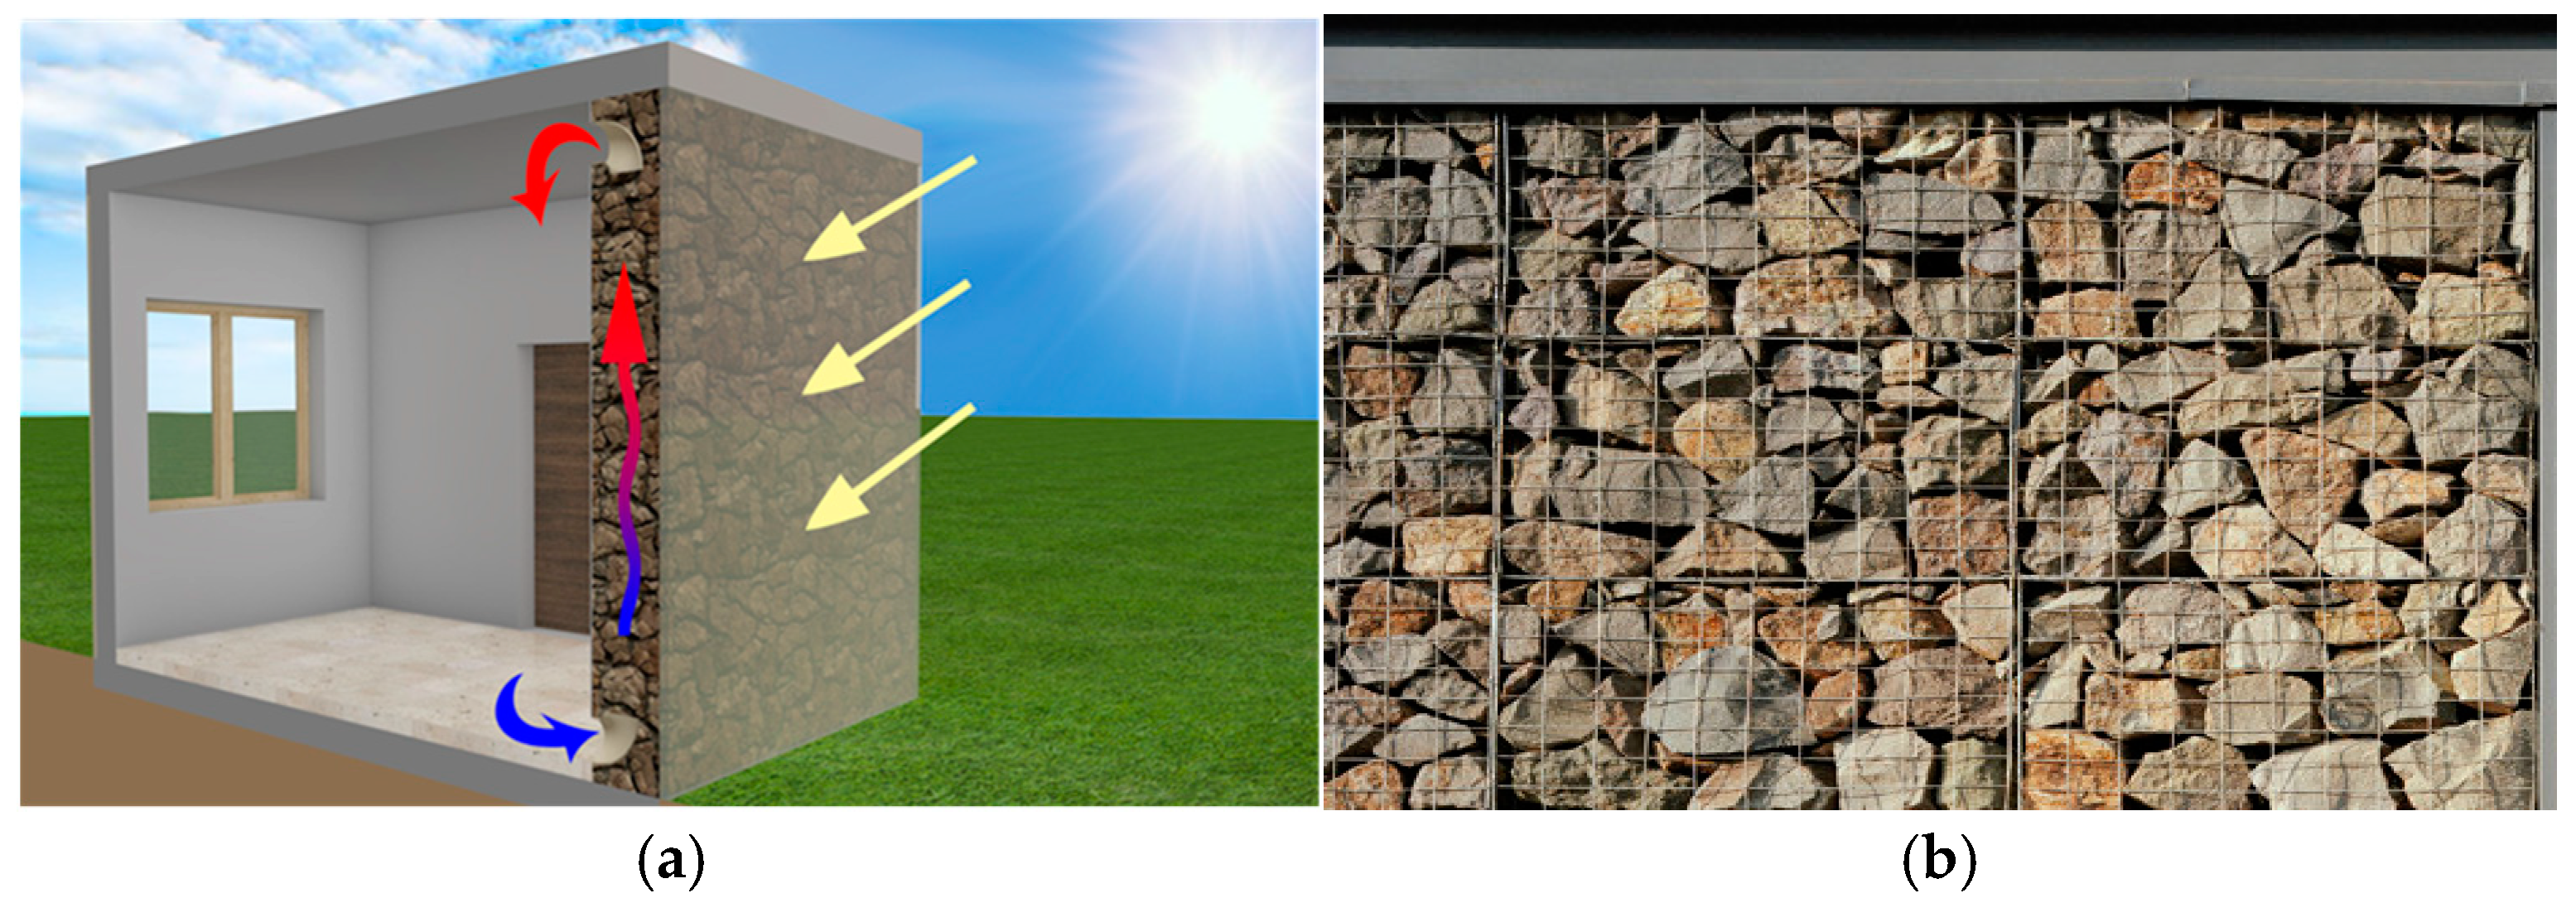
7], such as solar panels installed on the roof or on the façades, is often not permitted. Consequently, the identification of novel solutions respecting these constraints represents a challenge. In light of this, a novel passive system following the Trombe Wall (TW) operation, specifically conceived for historical buildings, is proposed and analysed. The system is depicted in
Figure 1a, consisting of a wall in which the massive structure (for thermal accumulation purposes) is made of dry-assembled caged stones (
Figure 1b) opportunely arranged to preserve aesthetic features, maintaining the rock exposure style of the façades. This solution, also known as the
gabion wall, is largely employed in the construction sector due to its several strengths, in particular flexibility, resilience, and cost-effectiveness. Since the wire cages provide the tensile capacity to hold the stones, the whole system behaves as a unique structural block that confers wall stability. Moreover, suitable threaded rods inserted into the gabions allow for an easy connection with structures, increasing the friction capacity of the block, enhancing the tensile uplift capacity, and improving the ductility level of the structural system, minimizing the design’s seismic loads [
8]. These features make the rock wall feasible in terms of envelope integration and structural stability. Finally, metal cages of variable sizes and suitable thicknesses also ensure structural flexibility, allowing for installation in modular units. From
Figure 1a, it can be appreciated that the rock wall is equipped with a glazed surface attached to the stones on the external side (without forming the so-called
solar space) mainly to limit radiative thermal losses. Plaster is applied on the inner surface so that two openings on the bottom and the top allow air circulation between the rock wall and the room, by exploiting the interstitial spaces among the stones. It is a hybrid system, considering that the air flow rate, extracted from the adjacent room, is forced to flow inside the stones from the bottom to the top. Such a solution allows for the storage of transmitted solar radiation inside the rocks, exploiting their large thermal capacity [
9] and heating the air circulating in the interstitial spaces in the presence of scarce solar irradiance or at night. Moreover, the rock wall’s inner surface delivers further heat flux by longwave radiation and convection to the room [
9].
The choice to consider a novel system operating as a TW is justified by the fact that this solution can be integrated into the building envelope to limit energy demands by rationalizing the use of solar radiation [
10], especially in the winter, because it has been developed mainly to limit heating demands [
11]. Anyway, TWs are still largely investigated in the scientific community considering some challenges related to aesthetic appearance and possible overheating issues that could appear when solar gains are not controlled adequately [
12]. To overcome these drawbacks, many authors have proposed innovative TW configurations obtained by varying shapes and involved materials. A detailed overview summarizing different solutions obtained by considering structural improvements and technological innovations can be found in Ref. [
13]. More specifically, in Ref. [
14], the “zigzag” TW was investigated through a reduced-scale experimental set-up on a typical Chinese winter day. A novel TW made of two concentric quarter spheres was investigated in Ref. [
15] through a numerical model to determine the thermal performances when the latitudes ranged from 28.56° N to 53.31° N. The TWs’ thermal performances can be enhanced by using appropriate components, as studied in Ref. [
16] by analyzing different forms of glazing surfaces. In severe winter climates, TWs equipped with adequate insulation layers (missing in the conventional configuration to exploit the thermal mass) offer improved thermal performances, as indicated in Ref. [
17]. Despite these studies investigating different TW configurations, numerical simulation techniques are employed in all the documents to assess the attainable thermal performances. For instance, in Ref. [
18], a room equipped with a traditional TW was simulated numerically in an in-house Fortran code using the finite volume method approach considering fluid flow and heat transfer governing equations. In the study described in Ref. [
19], a simplified quasi-state analytical CFD model was developed to operate in the DesignBuilder environment, evaluating the winter thermal performance in the Egyptian climate. Numerical simulations have also been conducted to determine the efficacy of shading devices in contrasting overheating issues [
20]. Other investigations, instead, were focused mainly on accurately considering the triggered natural convection inside the solar space via CFD tools [
21,
22,
23,
24]. This demonstrates that numerical investigations represent a reliable method to analyse novel configurations of TWs and to model different aspects affecting their operation [
25]. The literature does not report investigations focusing on the proposed TW configurations in which thermal mass is made of a heterogeneous material such as air alternating stones. Consequently, specific modelling components are missing. The main difficulty in implementing such a model concerns the necessity to consider the interaction between the code simulating the rock wall with the existing building models, required to achieve reliable results in terms of energy performance. So, an FDM (Finite Difference Method) code modelling the rock wall implemented in the MATLAB environment [
26] was interfaced with the TRNSYS building model (Type 56) by exploiting the utility “
calling external Matlab program” available in the software library [
27]. In light of this, the main contributions of this study concern the following [
28]:
A modelling approach combining numerical analysis and simulation tools to consider the real interaction between building components required for precise energy evaluations;
A TW configuration in which the thermal mass is formed by heterogeneous rock bed storage, considering that other studies assume TWs made of homogeneous materials;
The proposal of a sustainable solution that reduces water usage, materials, and energy in the building construction phase.
Indeed, the proposed TW configuration not only overcomes the architectural constraints in historical buildings, but the thermal mass made of a natural material, often largely available in the proximity of the building site, combined with the dry-assembled technique and the easy recovery of stones at the building end of life, enhance the environmental footprint [
29]. Anyway, it remains to demonstrate the energy savings attainable during the operative phase connected with the limitation of the heating requirements. For this purpose, the implemented FDM code determines the internal temperature field, the air temperature crossing the rock wall and the inner surface temperature. Successively, these FDM results were provided as input data to the model of a reference building developed in the TRNSYS environment in order to quantify, by using real climatic data, the savings achievable in terms of heating requirements.
2. Materials and Methods
A bidimensional FDM code was implemented by considering the proposed rock wall constituted by three different components: two solids, represented by the stones (assuming uniform size through an equivalent diameter) and the glass pane, and one fluid, represented by the air circulating between the stones (modelled as interstitial nodes). The volume fraction occupied by interstitial spaces was considered through a void factor ε, provided as input data. The transient FDM code considers energy balance equations for a fixed control volume, for both solid and fluid nodes. To simplify the model, it was assumed that the air flow rate is provided as an input (e.g., activated by a fan) to avoid supplementary computational tools and effort. Other simplifications suppose the following:
- -
The highest and lowest sections are considered adiabatic (e.g., the thermal exchange toward the soil is neglected);
- -
The thermophysical properties are invariant with the temperatures;
- -
The thermal effects of the metal cages are negligible;
- -
The employment of combined and constant heat transfer coefficients with the indoor and outdoor environments;
- -
The employment of constant optical properties for the glass;
- -
The neglection of the pressure drops of the air crossing the rocks.
These assumptions can be considered reliable for real applications considering the prevalent mono-dimensional thermal flux through the wall thickness, the limited temperature variation field, the negligible metal cage mass, the thermal bridge effects hindered by the glass pane, the constant heat transfer coefficients approach employed in other dynamic models (EN ISO 52016 [
29]), and the difficulties to generalize optical properties varying with the directional aspects of the solar irradiance. The FDM code does not consider pressure drops because it was focused exclusively on the rock wall thermal aspects, although some evaluations of the friction effects have been carried out for the energy evaluations. The boundary conditions suppose a constant internal air temperature of 20 °C, whereas outdoor air temperature and solar irradiance on the external pane can be set variable by an input file. The computational domain has meshed into several control volumes, for each of which thermal exchange equations between solid and fluid, solid to solid and fluid to fluid were written.
The PDE (Partial Differential Equation) balance equations system was discretized using the implicit finite difference scheme. A system of coupled algebraic equations was obtained, one for each discrete volume. Since it was assumed that the thermophysical properties are constant with the temperature, the system is linear and is solved by inverting the conductance matrix. The unknown vector represents the temperature field at time step n + 1, while the temperature vector at time step n is represented by the solution obtained from the previous iteration.
At the initial
timestep (
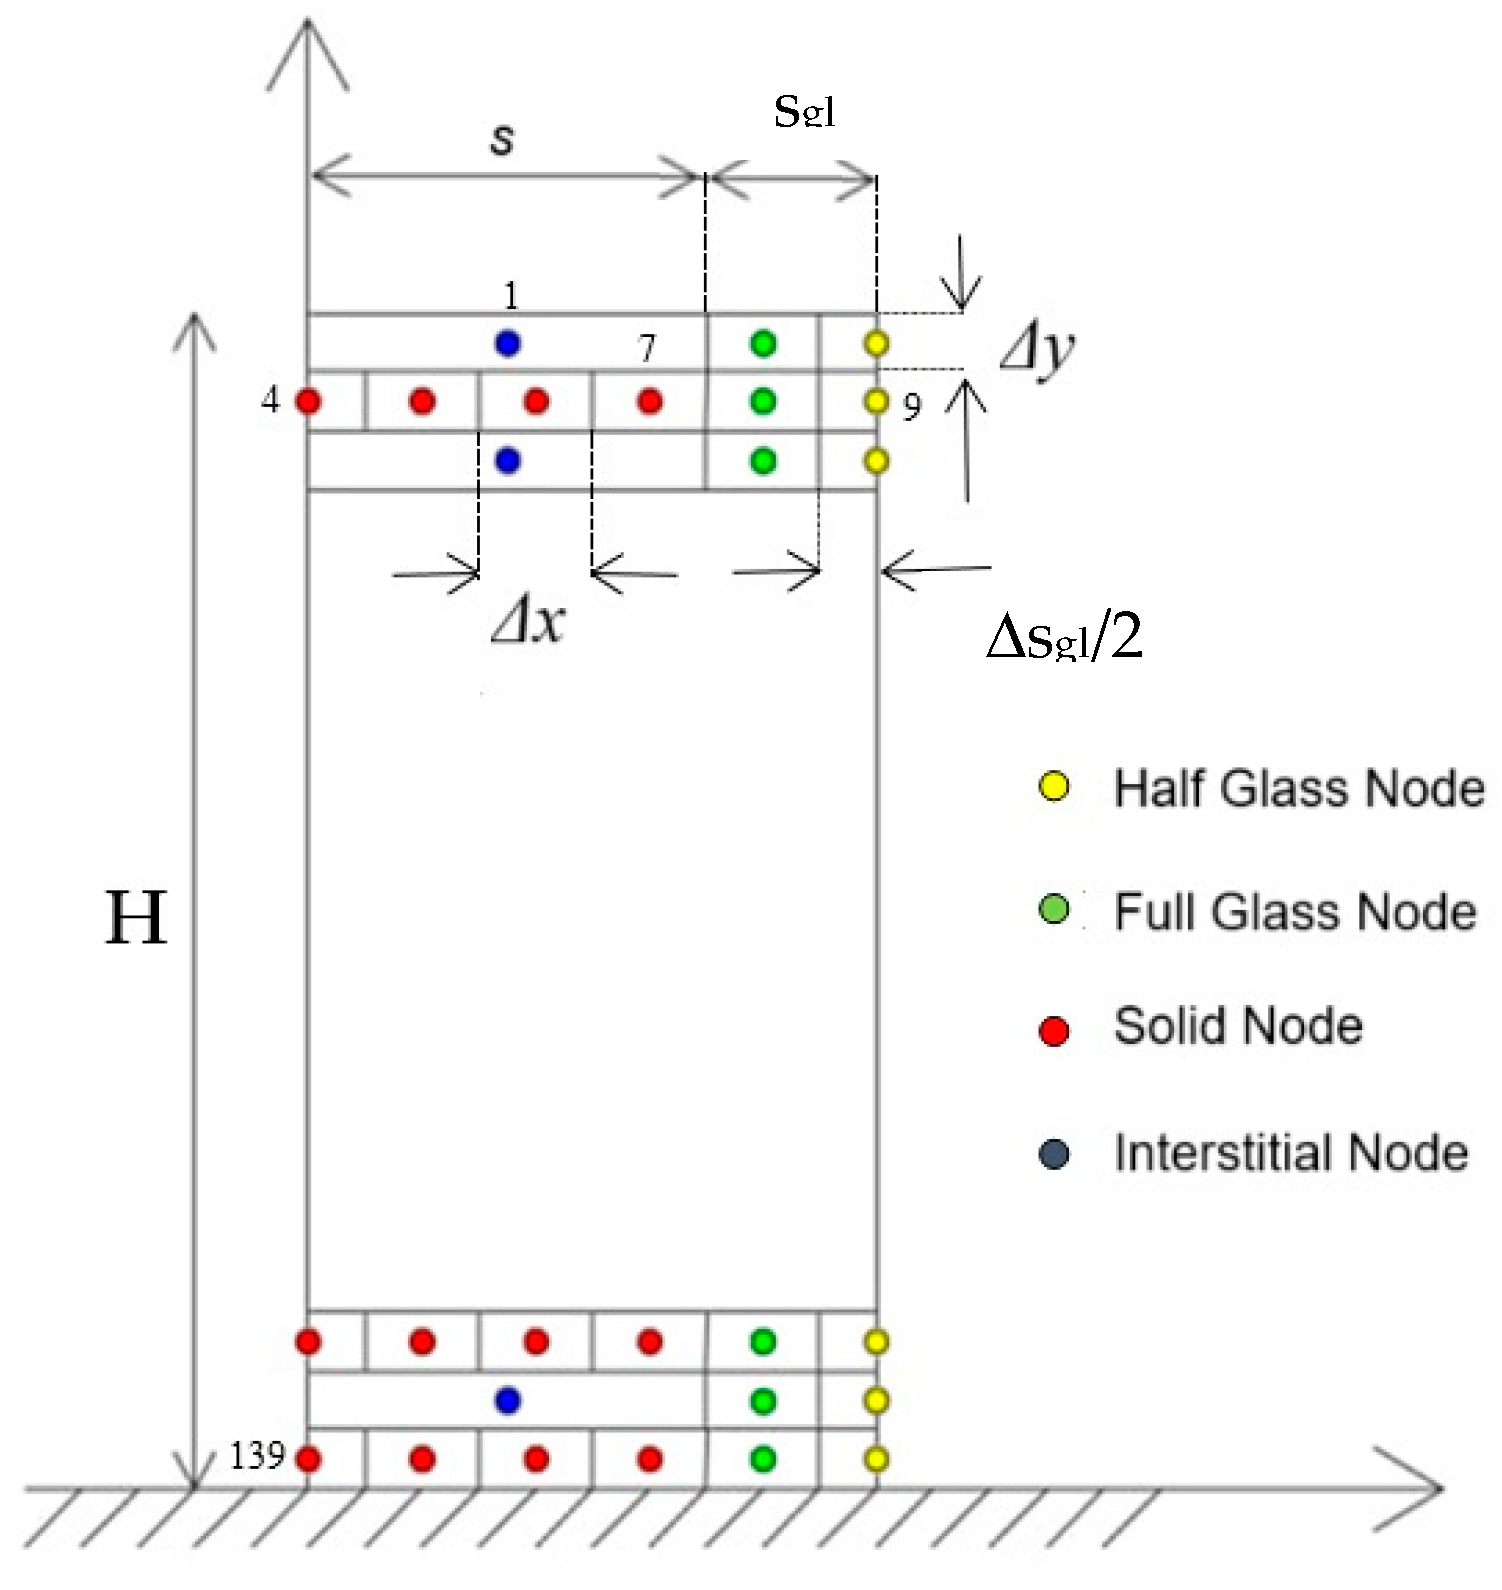
n = 0), the temperatures of solid and fluid nodes must be set as an initial equilibrium condition. The calculation domain was discretized, as depicted in
Figure 2, considering, as reference configuration, the following rock wall sizes:
- -
H = 3.2 m;
- -
s = 0.4 m;
- -
sgl = 0.006 m.
Figure 2.
Discretization of the computational domain.
Figure 2.
Discretization of the computational domain.
The non-aligned distribution between solid and interstitial nodes inside the rock wall was chosen to further simplify the model, as indicated and adopted in the relevant literature [
30]. The reference configuration of the rock wall was discretised with 144 bidimensional nodes, and since the glazed surface has a thickness smaller than that of the rock bed, the spatial discretization steps for these two components are different, Δs
gl and Δx, respectively. In particular, the values of the spatial discretization steps are Δs
gl = 0.004 m, Δx = 0.114 m and Δy = 0.10 m.
The optical properties of the glazing system were left constant with transmission (τgl) and absorption (αgl) coefficients, respectively, of 0.9 and 0.1.
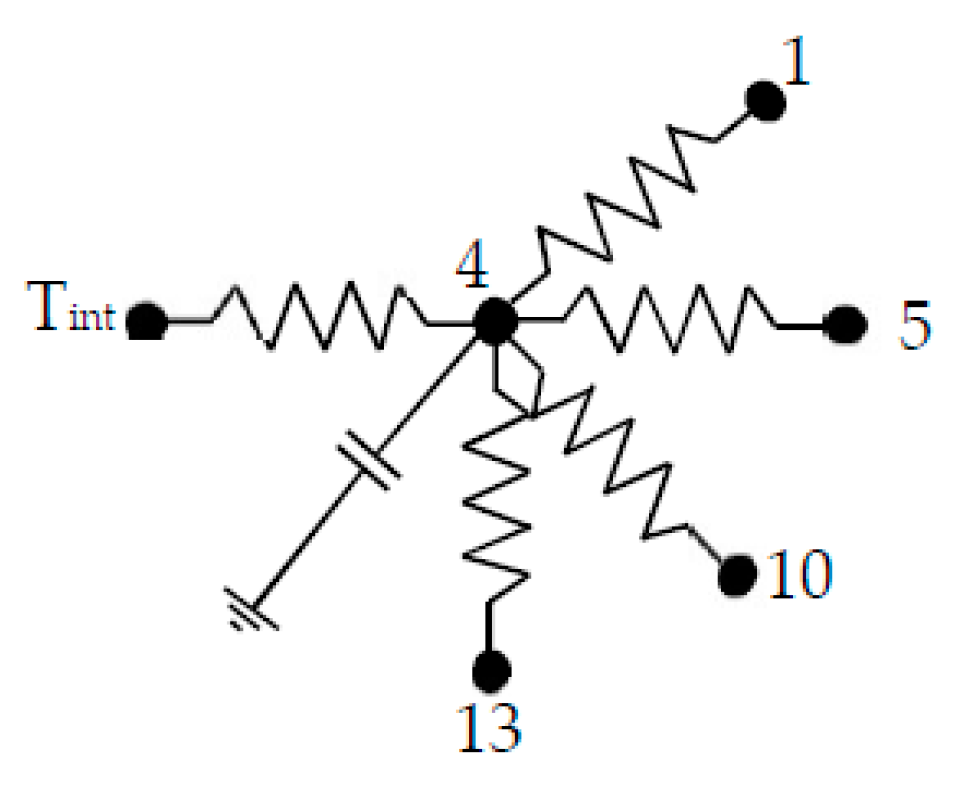
The equivalent electric circuit and the thermal balance equation of the first highest solid half node, indicated progressively as number 4, and surrounded by nodes 1 (interstitial node), 5 (solid), 10 (interstitial), 13 (solid) and by the internal air node, is shown in
Figure 3, with thermal balance equation indicated in Equation (1) and internodal resistances in Equation (2).
with:
setting
hcomb,int = 7.7 W/m
2K [
31] and indicating
h*sp as the convective heat transfer coefficient. Similarly, for the second half glass node starting from the top and indicated as number 9, receiving the solar irradiance G, the equivalent electric circuit and the correspondent thermal balance equation are depicted in
Figure 4 and Equation (3), with internodal resistances indicated in Equation (4).
with:
by setting
hcomb,ext = 25 W/m
2K [
31].
The thermal balance equation of the interstitial nodes considers the variation in the air temperature across the rock wall, which is described by Equation (5), with the equivalent electric circuit indicated in
Figure 5.
with:
Reynolds, Prandtl and Nusselt numbers are determined for the calculation of the convective heat transfer coefficient using the correlation [
30]:
with air velocity determined from the air flow rate crossing the real section area:
The convective heat transfer coefficients for air–glass
hsp and air–stones
h*sp were calculated as follows [
32]:
Similarly, the other thermal balance equations were written for every node considering eventual external forcings. For instance, for the full glass node number 8, located at the interface with the rock wall, the term (G·Δy·τgl·αgl) must be added, where τgl accounts for the fraction of solar radiation G transmitted from the outside into the glass, and subsequently absorbed.
The calculation of the internodal thermal resistances requires the thermophysical features of the solid elements and of the fluid, which are listed in
Table 1, considering rocks with a prevalent granite composition and air values referring to a temperature of 15 °C.
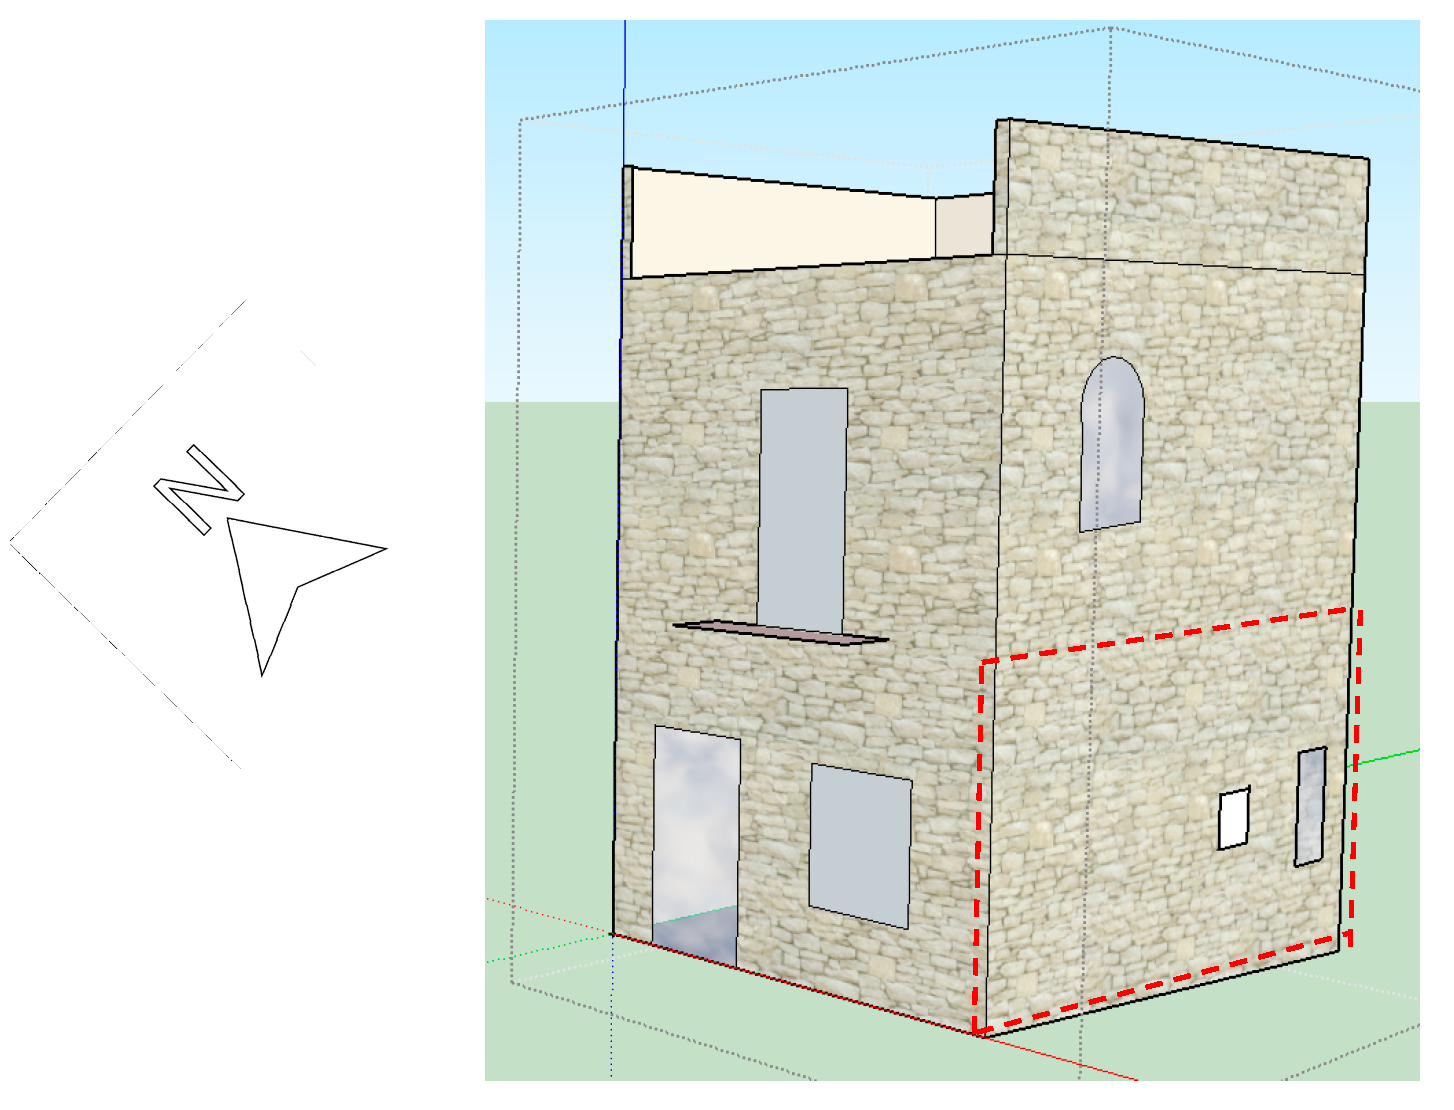
Regarding the evaluation of the heating savings, TRNSYS simulations were carried out on the reference building shown in
Figure 6, with a gross volume of 272 m
3, plant surface of 20 m
2 per floor, aspect ratio over 1.2 m
−1 and interfloor height of 3.2 m, subjected to climatic data of Cosenza (Lat. 39.3° N, Long. 16.1° E). Despite the location belonging to the Mediterranean area classified as a
Csa zone following the
Koppen map [
31], the local climate produces quite severe heating seasons with outdoor air temperatures that often approach 0 °C at night.
Vertical walls are made of stones with properties listed in
Table 1 and a thickness of 0.80 m, for which national regulations suggest a steady-state thermal transmittance of 1.805 W/m
2K, whereas the surface thermal capacity is 72.3 kJ/m
2K (wall code P02 in the Ref. [
34]). The ground deck (code SOL14) is 40 cm thick and it provides thermal transmittance of 1.61 W/m
2K. SOL13 is the code of the simulated and non-dispersing inter-floor deck, whereas the U-value of the roof (code CIN5) is 2.56 W/m
2K.
The ground deck was simulated as a boundary wall imposing a constant temperature of 15 °C on the external side. Windowed surfaces are assumed to have a wooden frame and a clear double-pane glazing system, providing a U-value of 2.8 W/m
2K and a normal solar factor of 0.75. No screens and no external obstructions shading the building were taken into account. Natural ventilation of 1 ach per hour (considering the high building air permeability) and convective internal heat gain of 5 W/m
2 were set to carry out the building energy balance according to national standards [
35]. Every building floor was simulated as a thermal zone with a single internal air node.
The same building was simulated with the proposed rock wall installed on the south façade of the first floor considering a gross surface of 16 m
2 (3.2 × 5 m) and corresponding to the dashed red line depicted in
Figure 6. In the first phase, the weather data were employed in the FDM code to evaluate the rock wall inner surface temperature and the air temperature at the top vent for the room ventilation; successively, these data were transferred to TRNSYS. In particular, the imposed air flow rate and the dynamic intake temperature calculated by the FDM code were used in a fictitious mechanical ventilation system to consider the effects on the thermal balance of the ground floor [
36], assuming an analogous value of air flow rate at 20 °C extracted by the rock wall bottom vent. Successively, to consider the contribution given by the convection and the longwave radiation from the inner surface, the rock wall was set in TRNSYS as a “boundary wall”, for which the internal temperature calculated by the FDM code was set as input data [
36]. It is worth noting that a suitable model (called
type in the TRNSYS slang) to simulate TWs is available in the software library; anyway, this component was not considered because it assumes that the thermal mass is constituted by homogeneous materials, therefore differing from the FDM code features.
3. Results
3.1. FDM Code Results
Preliminarily, the FDM code was run on a typical winter day by setting an outdoor air temperature constant to the location design value of −3 °C [
37], a heated adjacent room, and using the solar irradiance values (at an average hour level) listed in
Table 2 that activate an air flow rate of 360 kg/h. The initial temperature of 15 °C was set in every node (at n = 00:00). The simulation timestep was 1 s, but temperatures were printed at hourly intervals.
The main parameters that affect the system’s performance were quickly identified by leveraging analogies with rock bed storage systems, which are extensively studied in the literature [
38].
These parameters include the equivalent rock diameter, fluid mass flow rate, and wall thickness. Consequently, a parametric study was conducted on these specific factors impacting the geometry and the operation of the rock wall to assess their role in achieving optimal thermal performance. Additionally, all of these parameters are readily measurable from an experimental standpoint [
32].
A first parametric study was conducted considering the rock equivalent diameters with the corresponding void grade (ε) and fill factor (Ψ) values listed in
Table 3. The larger the stone size, the larger the occupied space from the air among the rocks, producing a lower fill factor.
The temperature trends of five representative nodes, namely N° 1 (upper vent), 4, 7, 9 and 139 for the three considered cases, are shown in
Figure 7 in the interval 8:30–23:30.
As observed, in the presence of solar radiation, across all three configurations, node 9 exhibits the lowest temperature profile because it is a glass node, which transmits 90% of the incident solar radiation, part of which is transferred inward by conduction. Furthermore, it is exposed directly to the external environment, promoting heat exchange through hcomb. Solid node 7, located adjacent to the glass, shows the highest temperature absorbing solar radiation (αstone = 0.7).
Moreover, from
Figure 7, it can be appreciated that Case A, describing the more homogeneous configuration, produces a higher thermal level for the inlet air, which reaches the maximum value of 37.5 °C around 14:30, one hour and a half after the solar irradiance peak, benefitting from the thermal capacity of the surrounding stones. When solar irradiance is available, the air temperature rises quickly, reaching values over 20 °C already after 9:30. At this time, the air temperature is positively affected by the temperature of the surrounding stones that, thanks to the appreciable thermal capacity, in the first hours of the day, benefit from a warmer thermal level (see the temperature profile of node 4 and 139). Intake air temperature tends to stabilize after 12:30, by approaching the thermal equilibrium with the hottest external rock nodes, warmer due to the incident solar irradiance. It is worth noting that a slight increase in the air temperature is also detectable when solar irradiance reduces after 13:00, meaning that the system can still transfer thermal power from the rock storage. At sunset (after 16:00), the air temperature reduces; initially, the trend shows an abrupt decrement driven by the thermal losses toward the external environment, but, successively, the air temperature reduction is less pronounced because it tends to stabilize around the storage residual thermal level. Regarding node 7, it can be noticed that, initially, it is colder than the internal stone nodes (4 and 139) because it is majorly affected by thermal losses. When solar irradiance acts on the rock wall, node 7, as previously mentioned, shows the hottest temperatures, whereas, at sunset, these reduce quickly, assuming values lower than the interstitial node 1 at night, which still benefits from the thermal exchange with the internal rock nodes. It is interesting to observe the slight temperature difference between node 4 and node 139, with a maximum deviance of 0.5 °C at 10:30, meaning that the inner side of the rock wall can be managed as a sort of isothermal surface. Anyway, in the vertical direction, the temperatures in node 4 are always higher than in node 139 throughout the day. Moreover, peak temperatures of 32 °C appear and this could compromise punctual thermal comfort conditions.
Passing to Case B and Case C considering greater equivalent diameters and lower fill factors, at a parity of set air flow rate, it can be noticed that:
- -
The air temperature in the intake vent decreases with the increase in stone equivalent diameter: this is due to the worsening of the heat transfer coefficient between air and stones and the limitation of the air velocity crossing the rock wall, which also determines a Nusselt number limitation;
- -
The stone nodes are warmer due to the lower thermal exchange;
- -
Pane temperature remains almost constant to those depicted for Case A because it is majorly affected by external boundary conditions.
Moreover, it can be noticed that the air temperature profile in node 1 is more fragmented, indicating a more difficult achievement of the convergence criteria within the timestep. At 14:30, Case B provided a maximum air temperature in the upper vent of 36.1 °C, further limited to 33.7 °C in Case C. The maximum temperature of node 7 increased from 38.2 °C to 39.5 °C passing from Case A to Case B, reaching the maximum of 40.4 °C with Case C. The different role of the rock wall thermal capacity is noteworthy; with the increase in the equivalent diameter, the profiles of the rock nodes’ temperature become tighter, meaning a worse use of the storage properties. This is due to the minor quantity of “solid” material in the rock wall in which thermal energy can be stored. Summarizing, the increase in the rock equivalent diameter produces a general worsening of the rock wall performance; anyway, this configuration could be preferred because it produces lower pressure drops for the air crossing the structure. Moreover, if the heat gain provided by the air flow stream must be privileged, small stones are recommended; conversely, a slight improvement can be achieved for the inner surface temperature, whose maximum value passes from 32 °C in Case A to 33.1 °C in Case C.
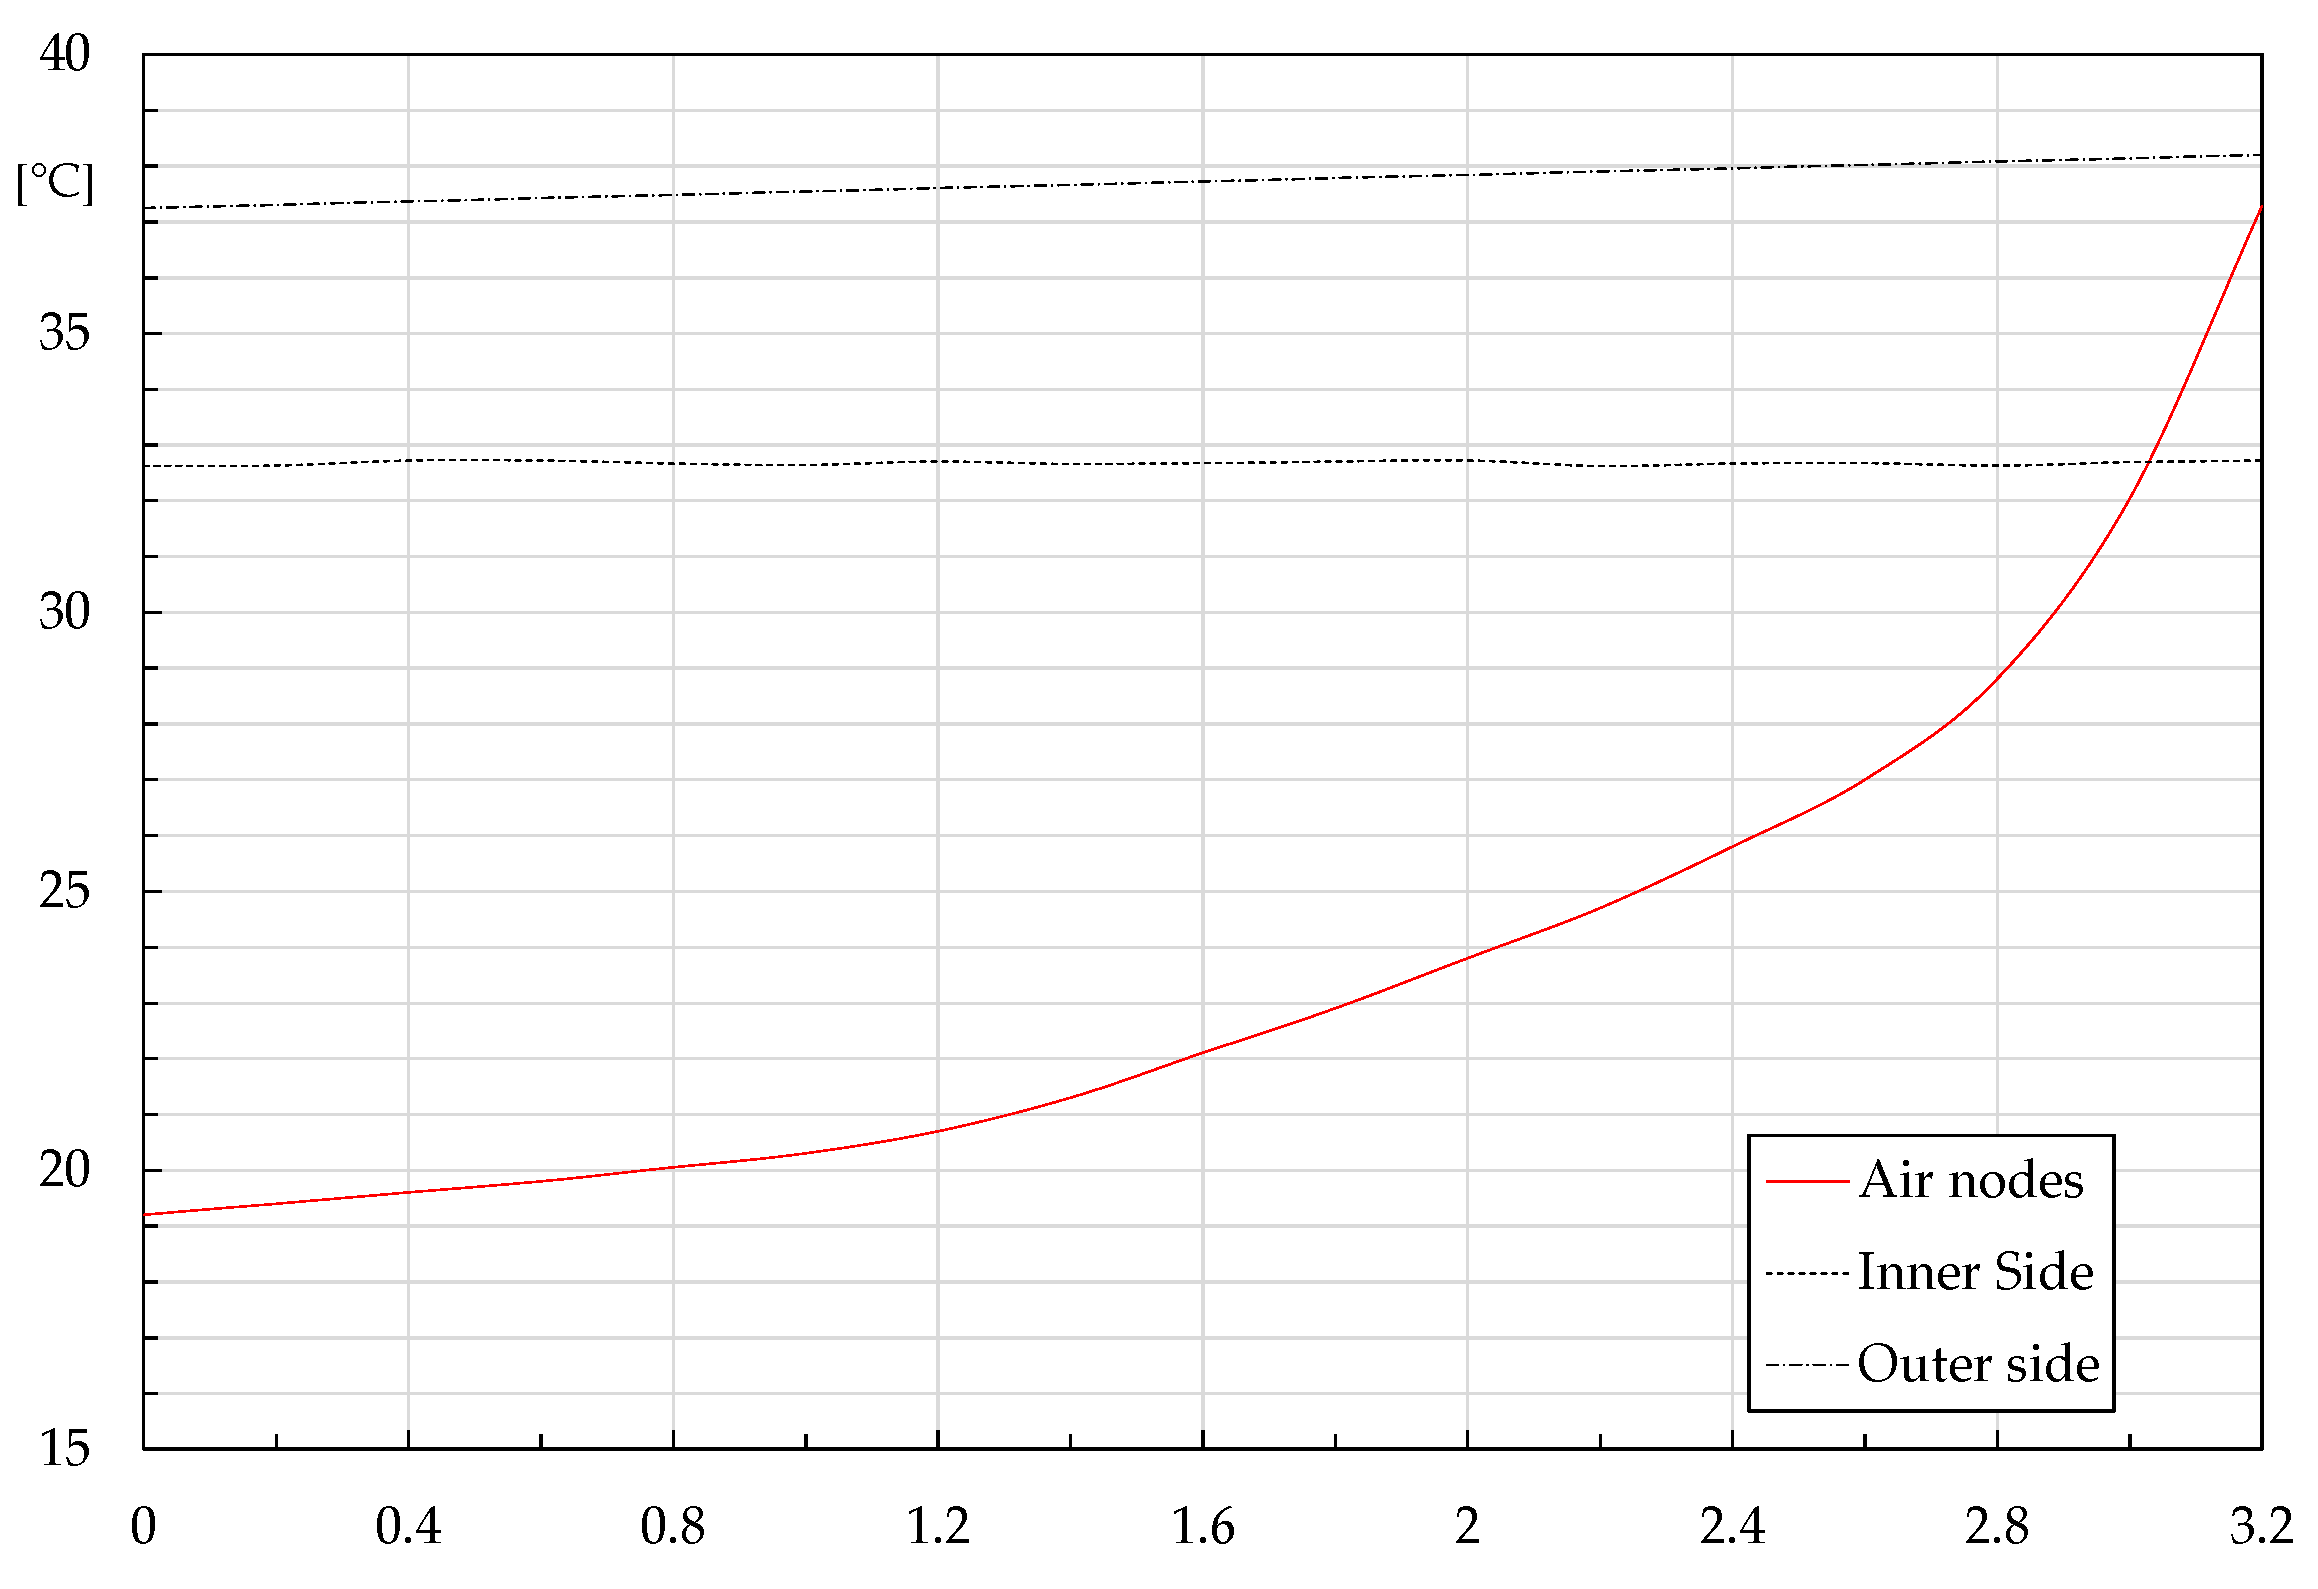
Figure 8, referring to Case A, shows the profile of air and inner and outer surface temperatures at 14:00 along the rock wall height. The air temperature, which starts from a value around 20 °C in the lower vent, rises quickly after 1.5 m, with an abrupt increase in the top due to the exchange surface growth and the adiabatic hypothesis in the upper section.
The inner surface temperature shows a quasi-constant trend because these nodes benefit from the constant indoor air temperature of 20 °C. The outer side highlights a slight increment along the wall height and, after 3 m, it seems to be the main force that promotes the air heating.
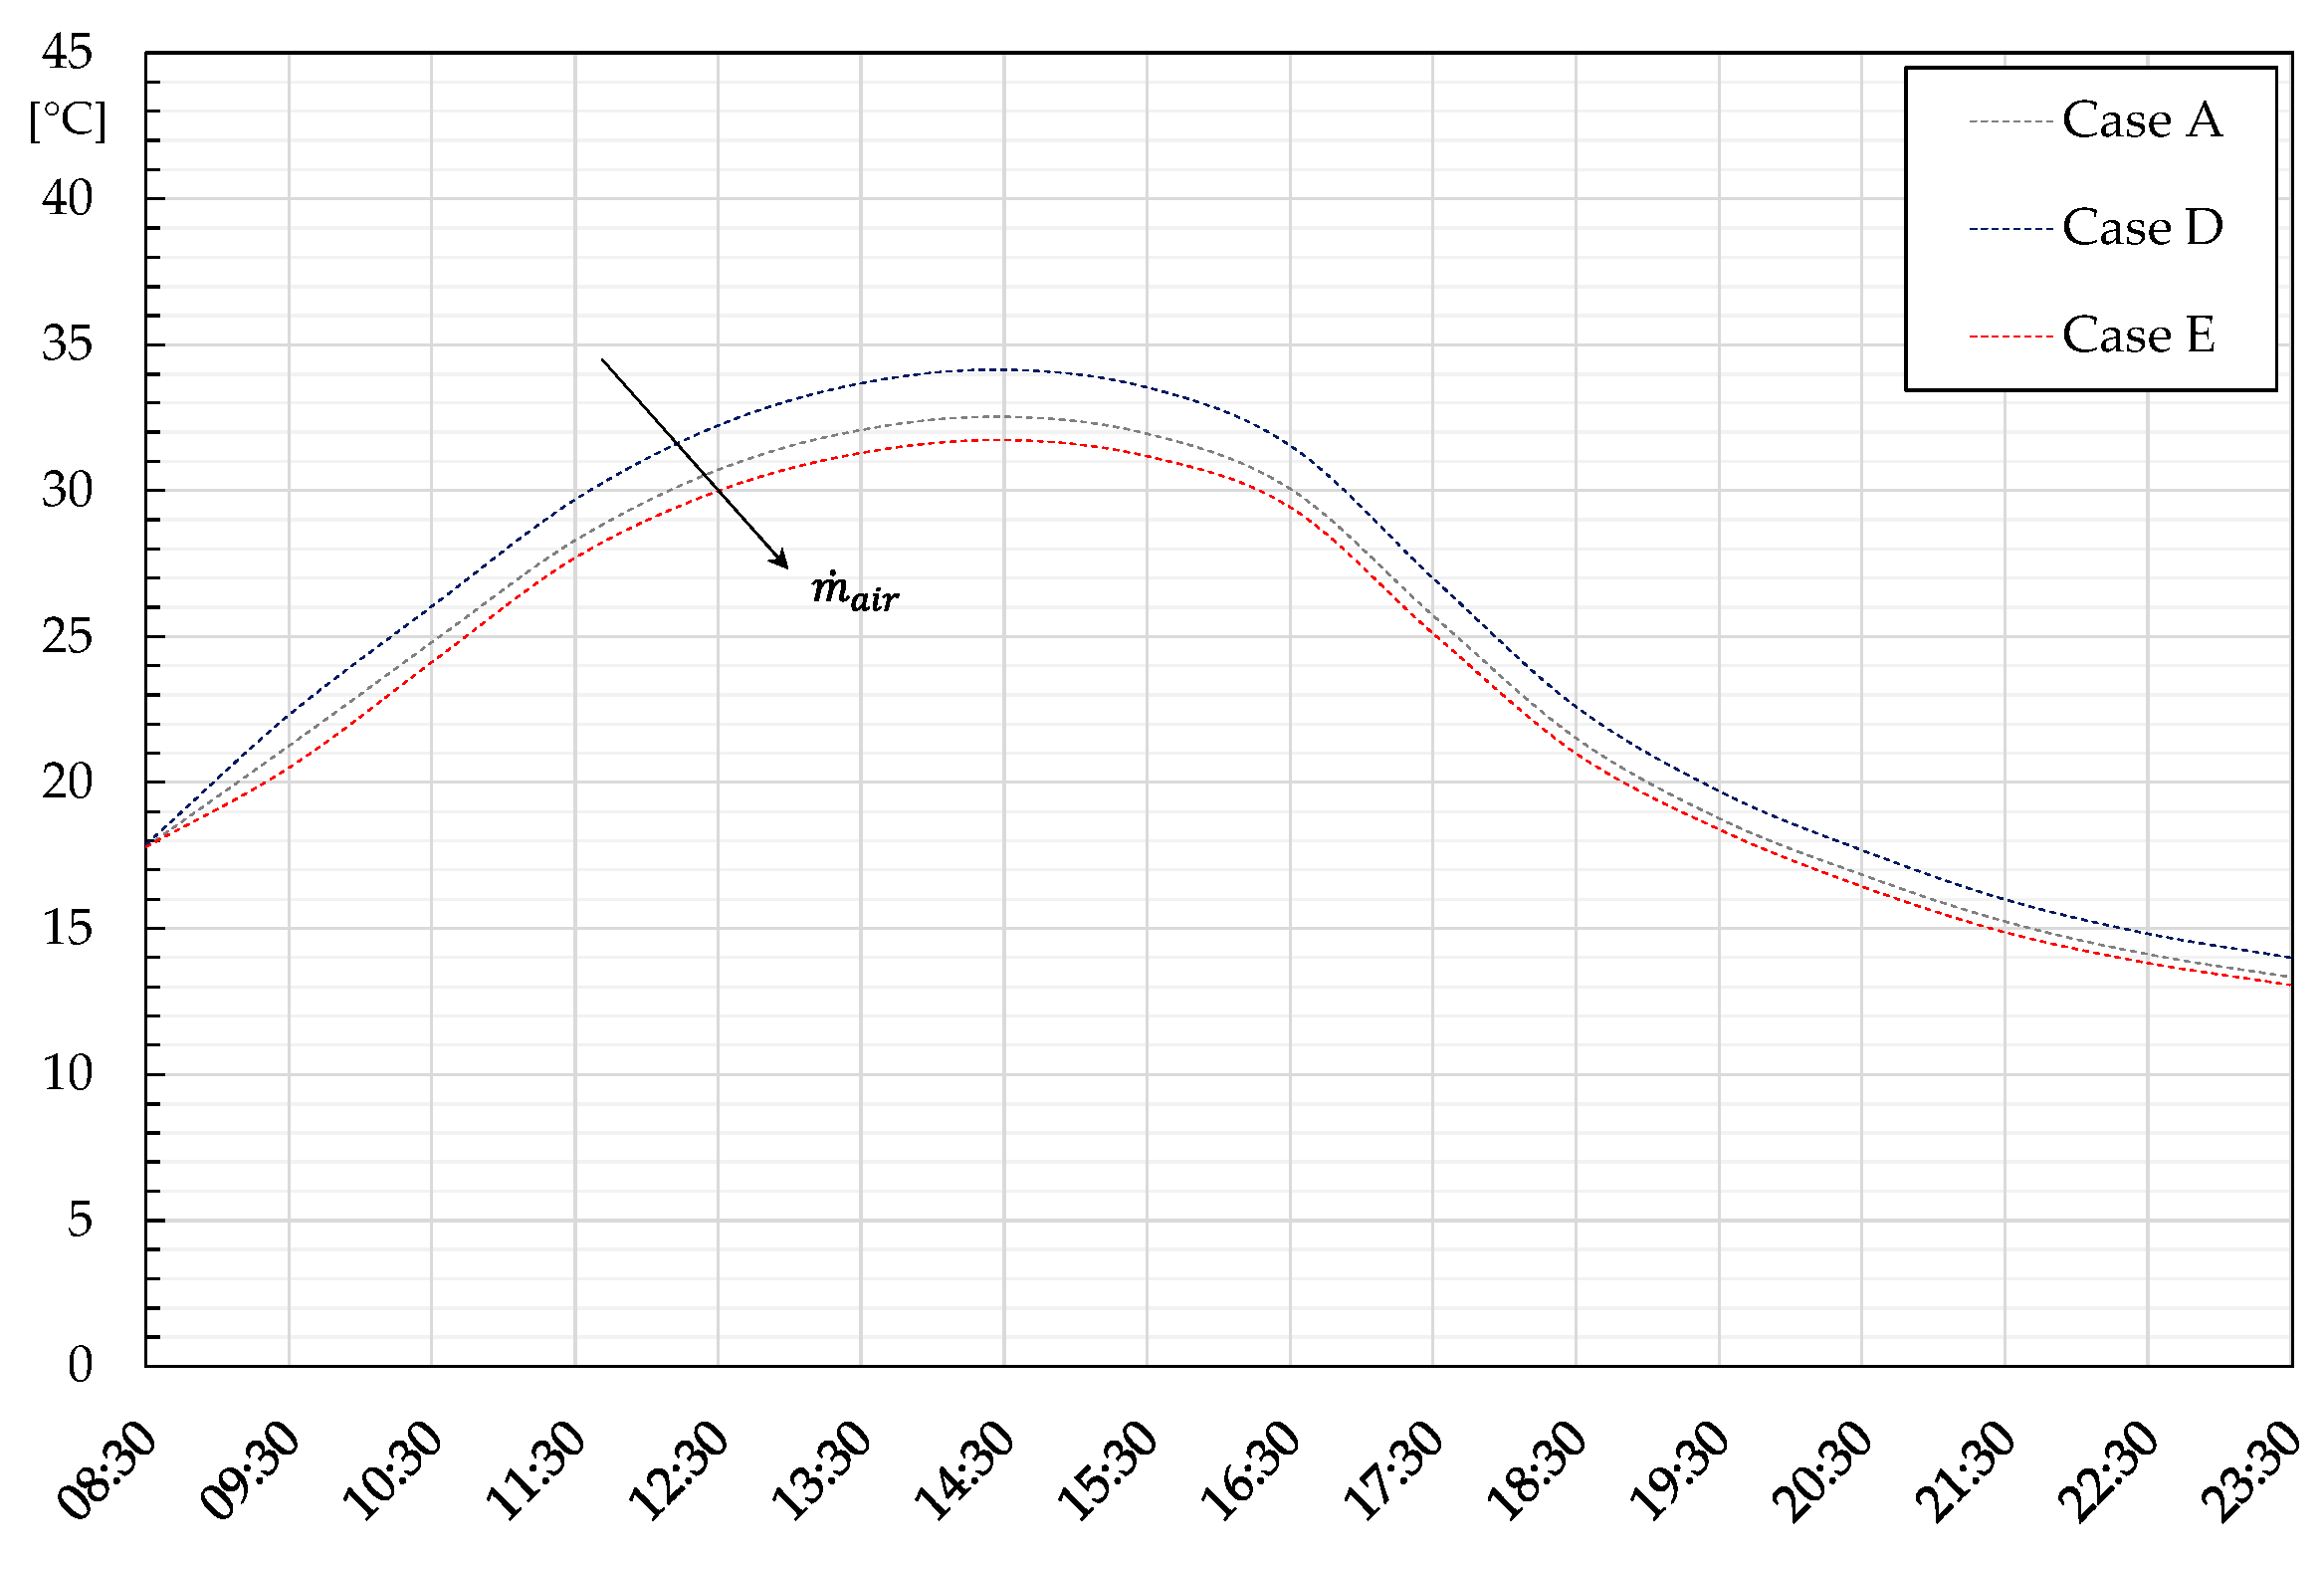
By setting the parameters describing Case A, other investigations were carried out to determine the role of the air flow rate in the achievable thermal performances. In particular, values of 180 kg/h (Case D) and 900 kg/h (Case E) were set to change the air velocity, which varies between 0.05 m/s and 0.65 m/s, and to evaluate the effects on the temperature field inside the rock wall, focusing on node 1 and node 4. From
Figure 9, it can be appreciated that, at parity of rock wall thermal mass, the air flow rate growth produces an increase in the air temperature and a decrement in the inner surface temperature due to the enhancement of the thermal exchange. Anyway, the halved flow rate of Case D produces a marked result variation when compared with Case E (tripled air flow rate) due to the different temperature fields achieved inside the rock wall. In particular, an air temperature reduction of almost 5 °C was detected at 15:30, whereas Case E, at the same hour, produces a slight increase of 1.9 °C. Noteworthy is the quicker time to heat the air in the upper vent with the air flow rate growth: 20 °C is detected at about 09:30 in Case D against 08:40 in Case E. Similarly, the latter case highlights a slower trend in temperature reduction, meaning a more efficient extraction of thermal energy from the rock storage.
Regarding the inner surface temperature (
Figure 10), the air flow rate reduction allows for transferring more thermal energy via convection and longwave radiation, in light of a maximum temperature value of 34.1 °C registered with Case D rather than 31.7 °C of Case E. Assuming, for the indoor environment, a mean radiant temperature of 20 °C, this led to an increase in the longwave radiative thermal flux of about 22%. It remains to be verified, to limit the building heating needs, if the ventilation heat gain growth obtained by increasing the air flow rate prevails on the increase in the convective and radiative heat flux detected with a reduced air flow rate, or vice versa. For this purpose, TRNSYS simulations were conducted, with the results introduced in the next section.
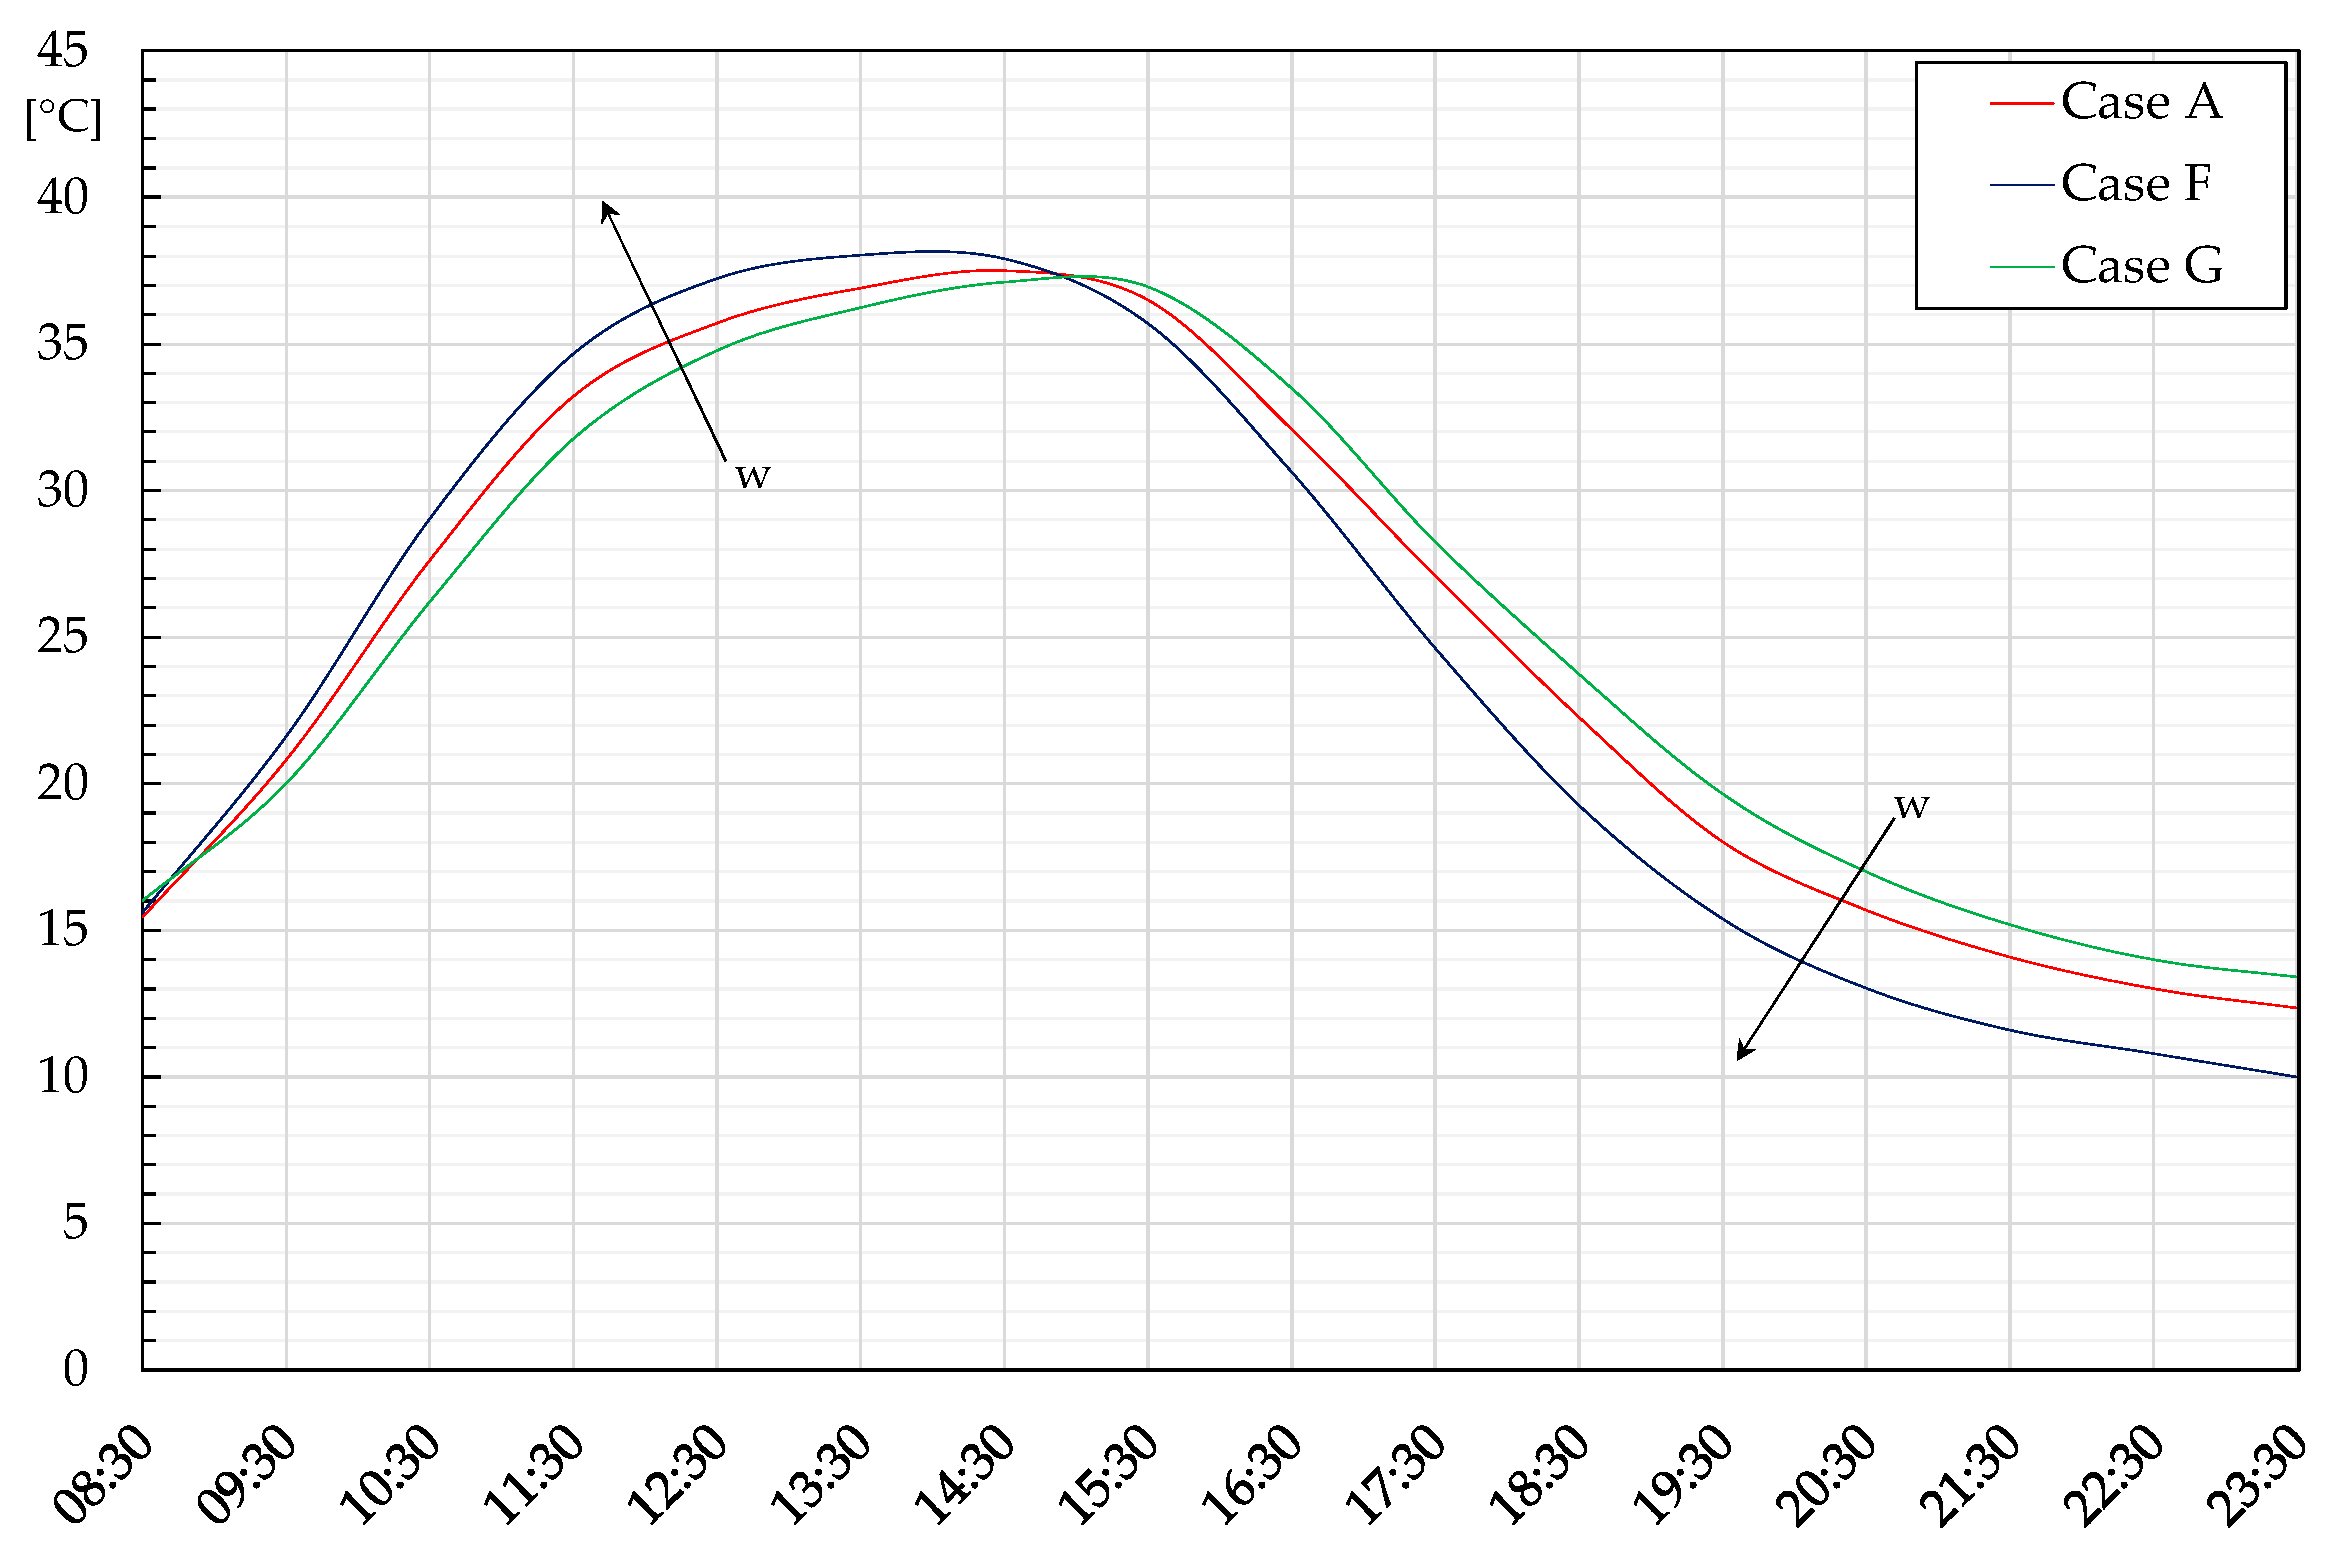
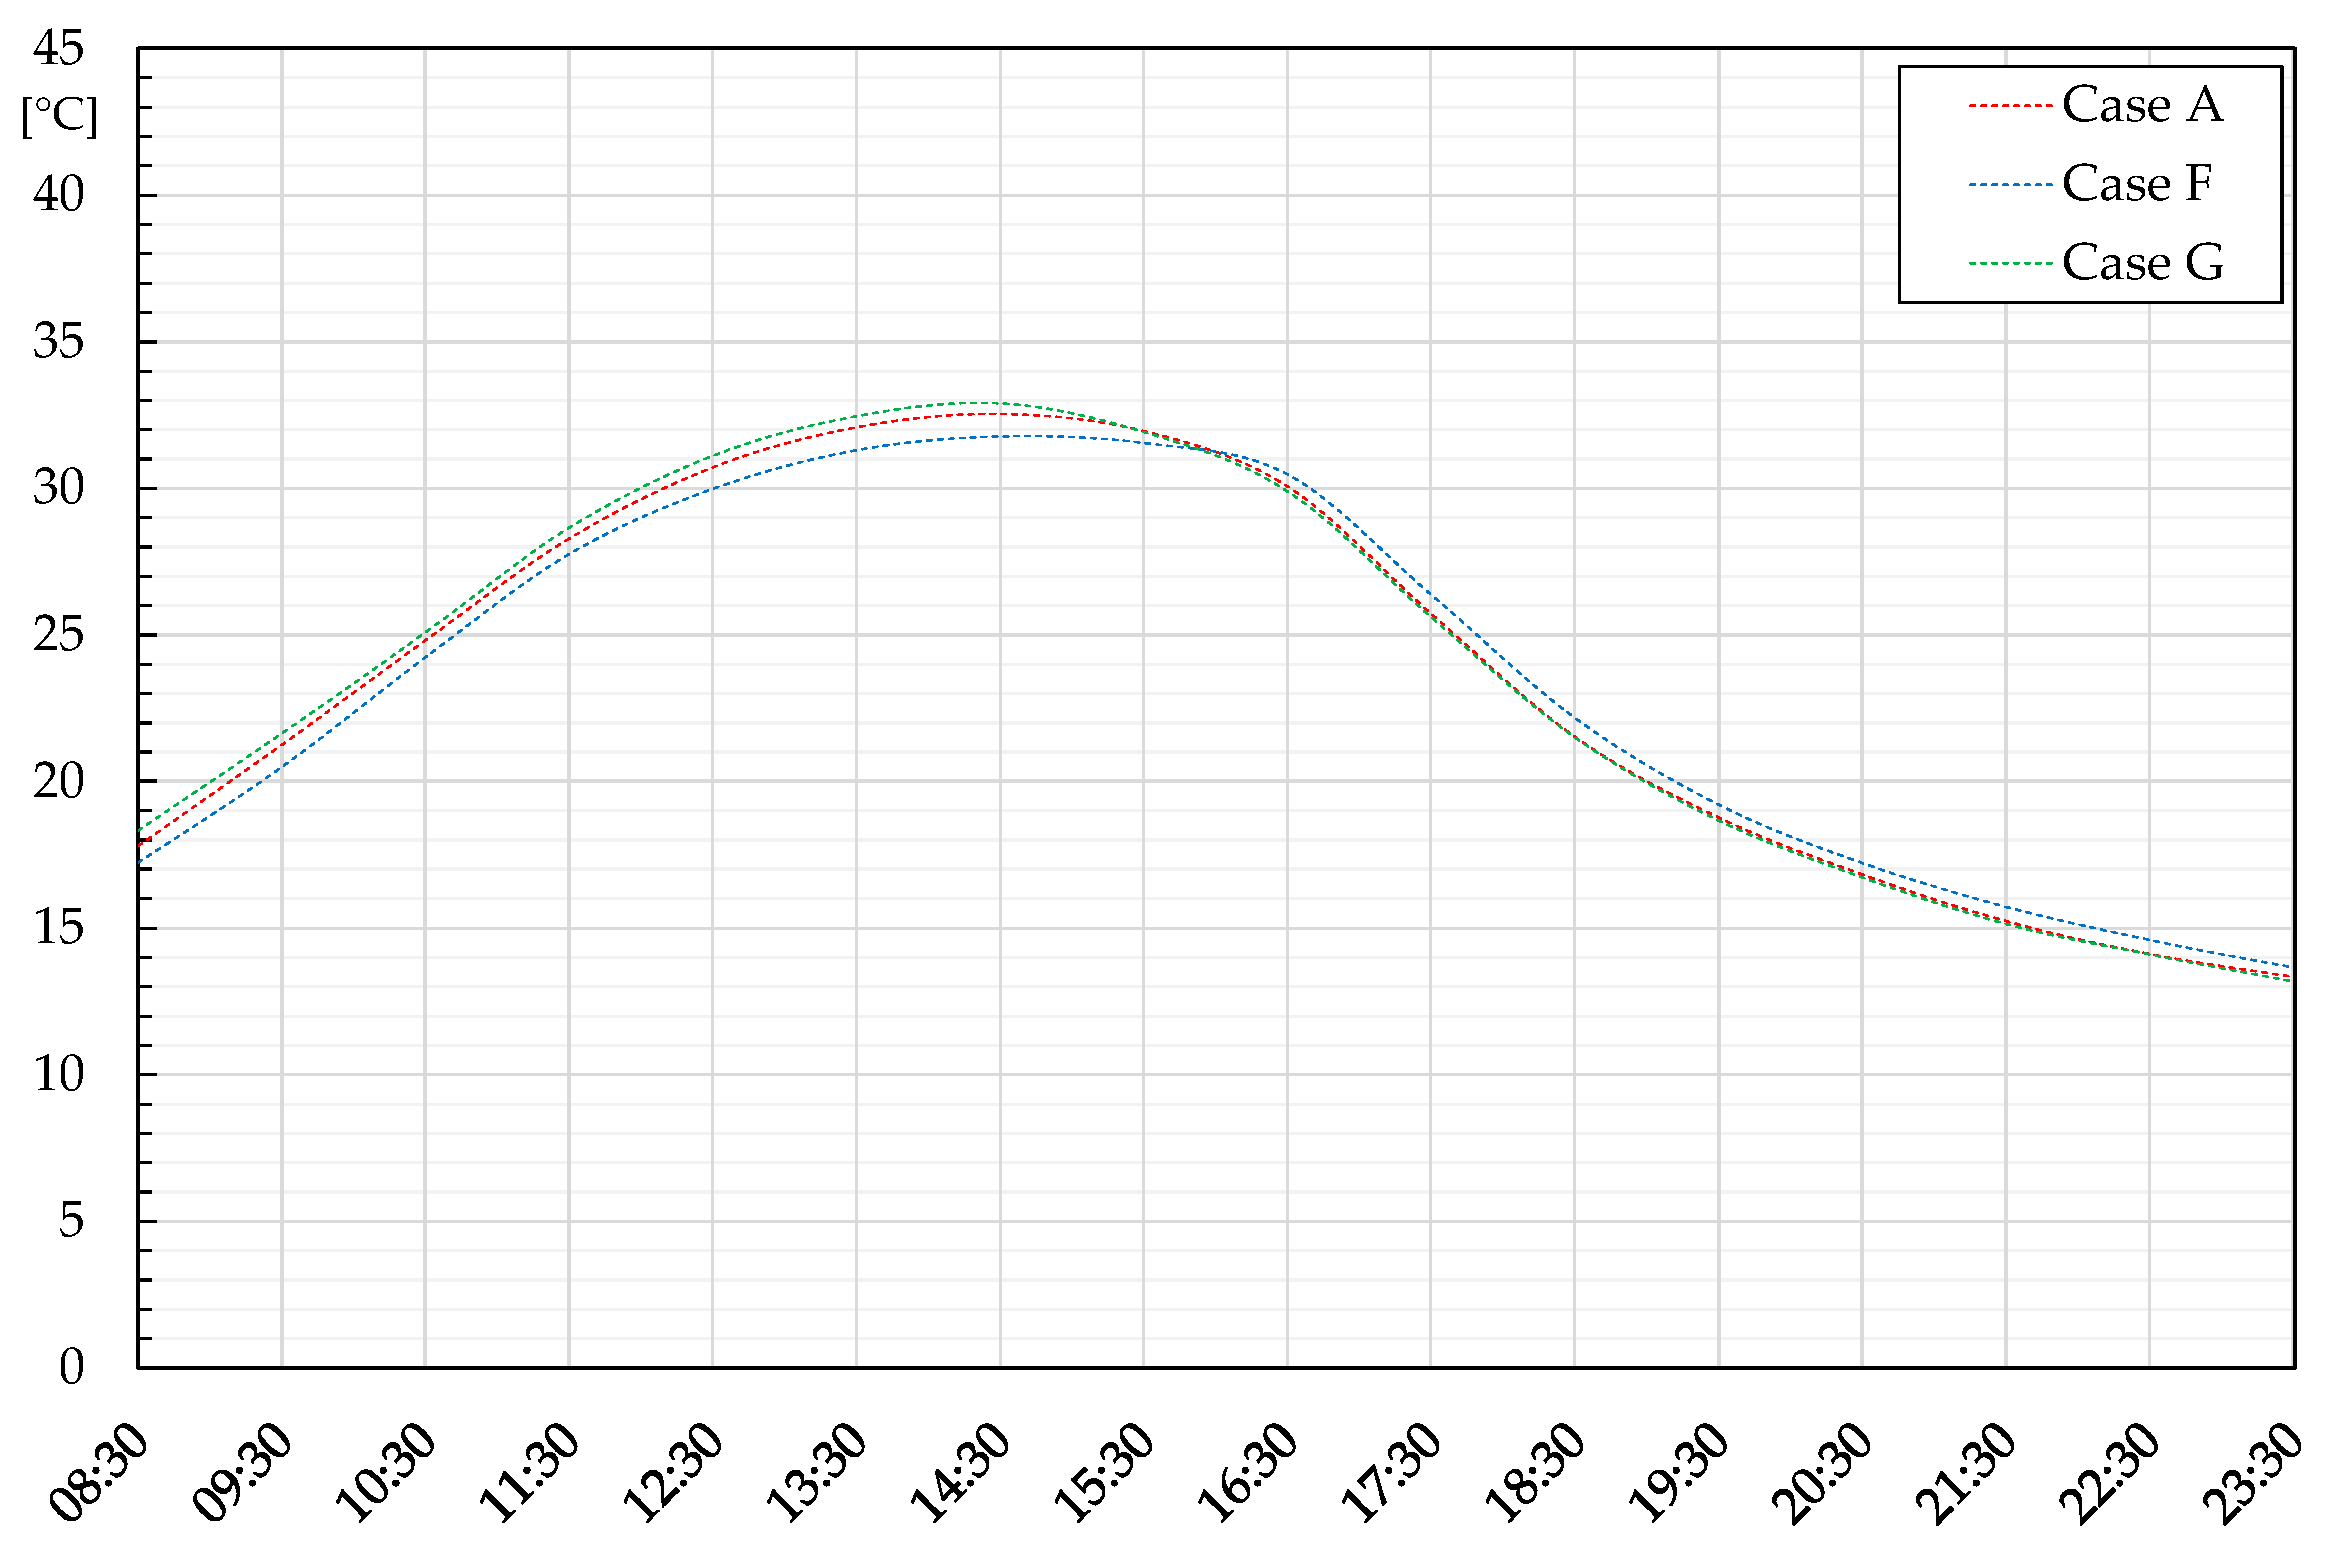
The last investigation involved the rock wall thickness (w), by running the FDM code with the same mesh, using a flow rate of 360 kg/h and a stone diameter of 0.01 m. The temperature trends of node 1 and node 4 detected with values of w = 0.3 m (case F) and w = 0.5 m (case G) were compared with the reference configuration with w = 0.4 m (Case A), with the results shown in
Figure 11 and
Figure 12. The significant role of solar irradiance can be noticed, denoting different trends between the morning and the afternoon. In particular, regarding the upper vent, the lowest thickness produces an air temperature rise in the morning, whereas it drops in the afternoon. This is due to the increase in the air velocity following Equation (8), which enhances the heat exchange with the stones, allowing for the achievement of warmer air streams. Anyway, this positive effect is connected to the presence of solar irradiance; indeed, in the afternoon and at night, temperatures are reduced because of the lower wall thermal capacity, penalizing the transfer of thermal power from the storage to the air stream. Conversely, the highest thickness w = 0.50 m shows the opposite trend, penalized by the air velocity lowering in the morning but benefitting from the higher thermal storage volume in successive hours. To summarize, Case F seems to be more penalized than Case G; therefore, it can be concluded that the role of the system’s thermal inertia growth is more significant than the improvement in the convective heat exchange between air and stones. Similar trends were obtained for node 4; anyway, the deviances are less marked, meaning that the inner surface again benefits from the favourable boundary condition.
3.2. TRNSYS Results
Simulations were carried out using the same weather file in the MATLAB code and in TRNSYS, involving a controller with a dead band of 2 °C that deactivates the fan when the indoor air temperature exceeds 21 °C (to avoid indoor overheating) or when the inlet temperature at the upper vent is lower than the indoor air temperature.
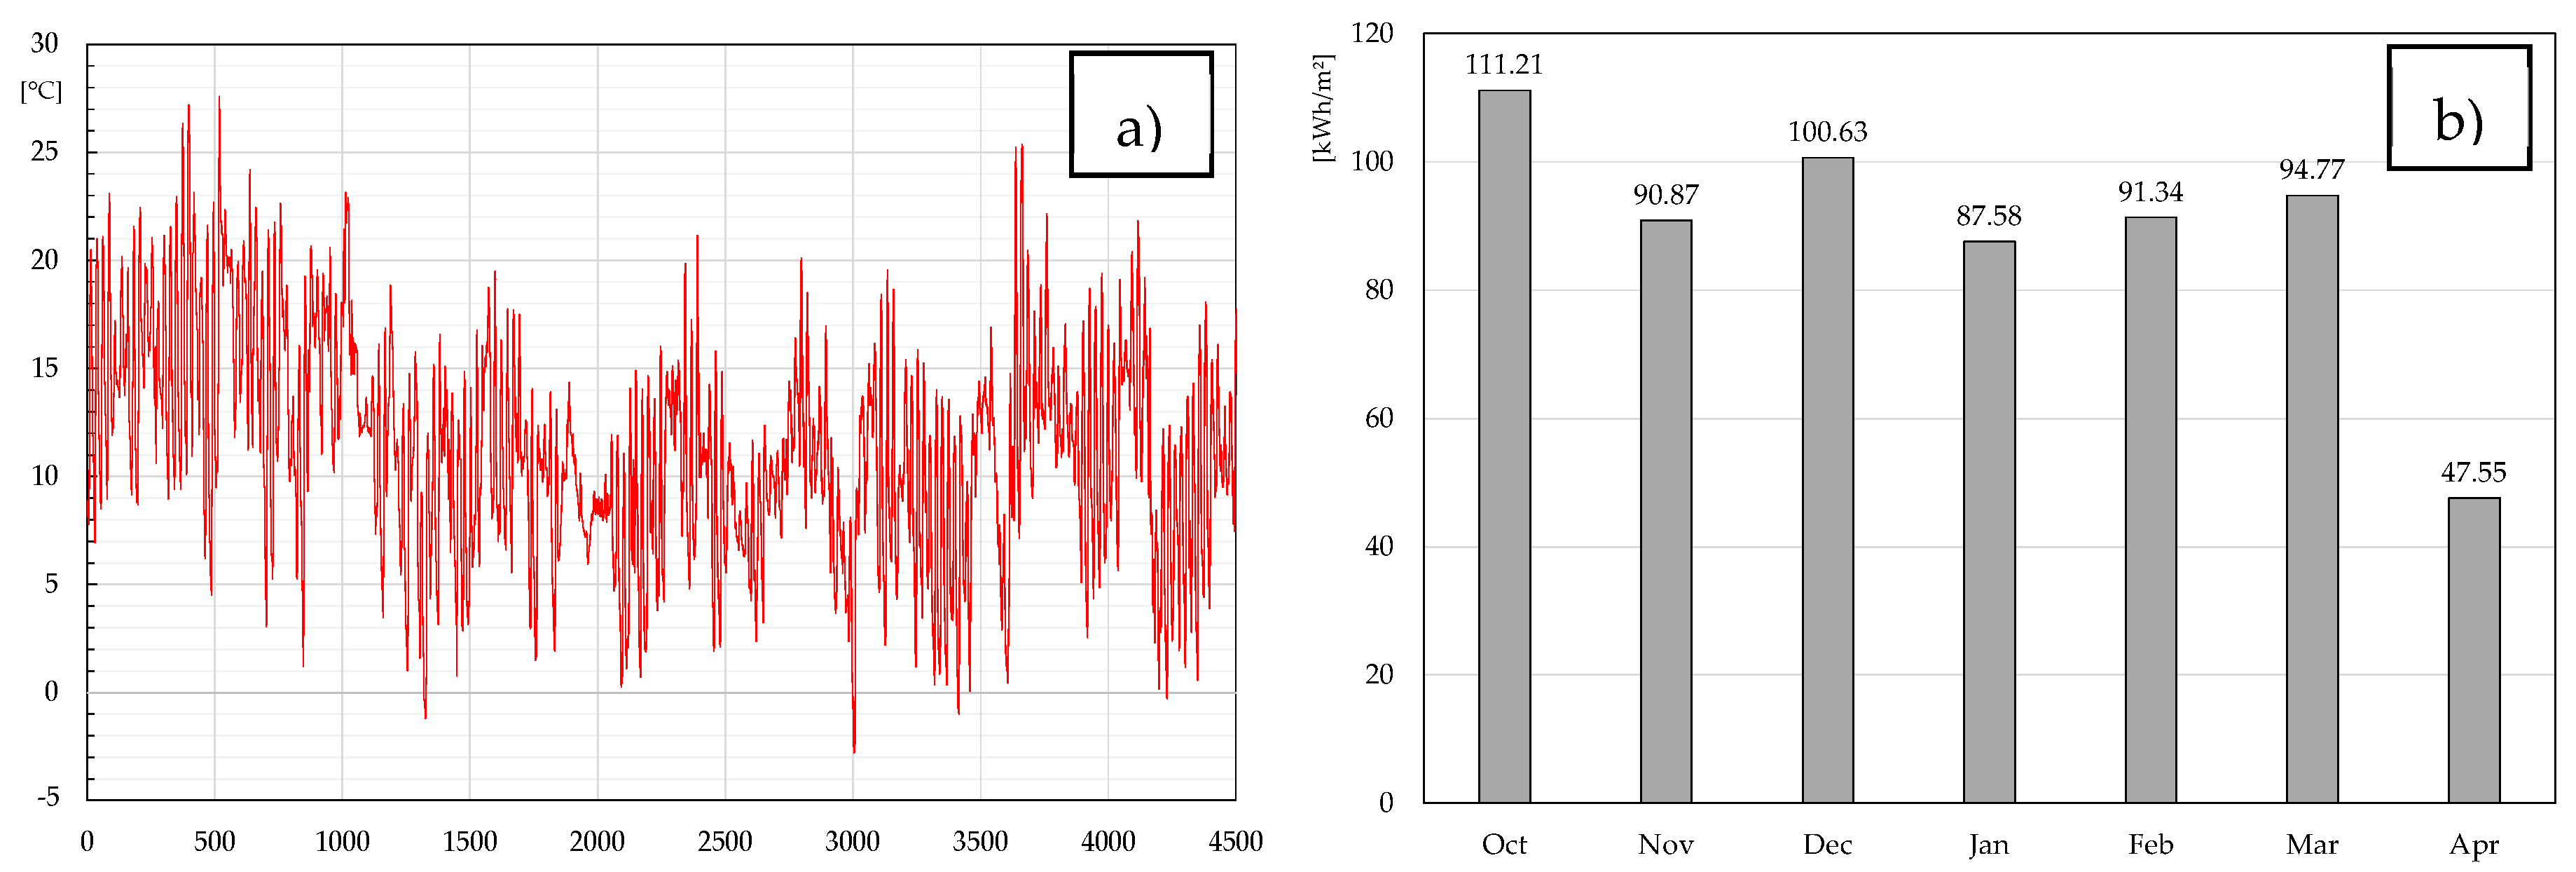
The simulation was run from 1 October to 15 April, with external weather data depicted in
Figure 13a (outdoor air temperature) and
Figure 13b (monthly solar radiation for surfaces exposed toward the south and tilted 90°). The initial temperatures of air and surfaces in the reference building were set to 15 °C.
The comparison was carried out by setting, for the renovated building configuration, the rock wall with an equivalent stone diameter of 0.01 m (fill factor of 0.75), a thickness of 40 cm, and a crossing air flow rate of 360 kg/h (case A).
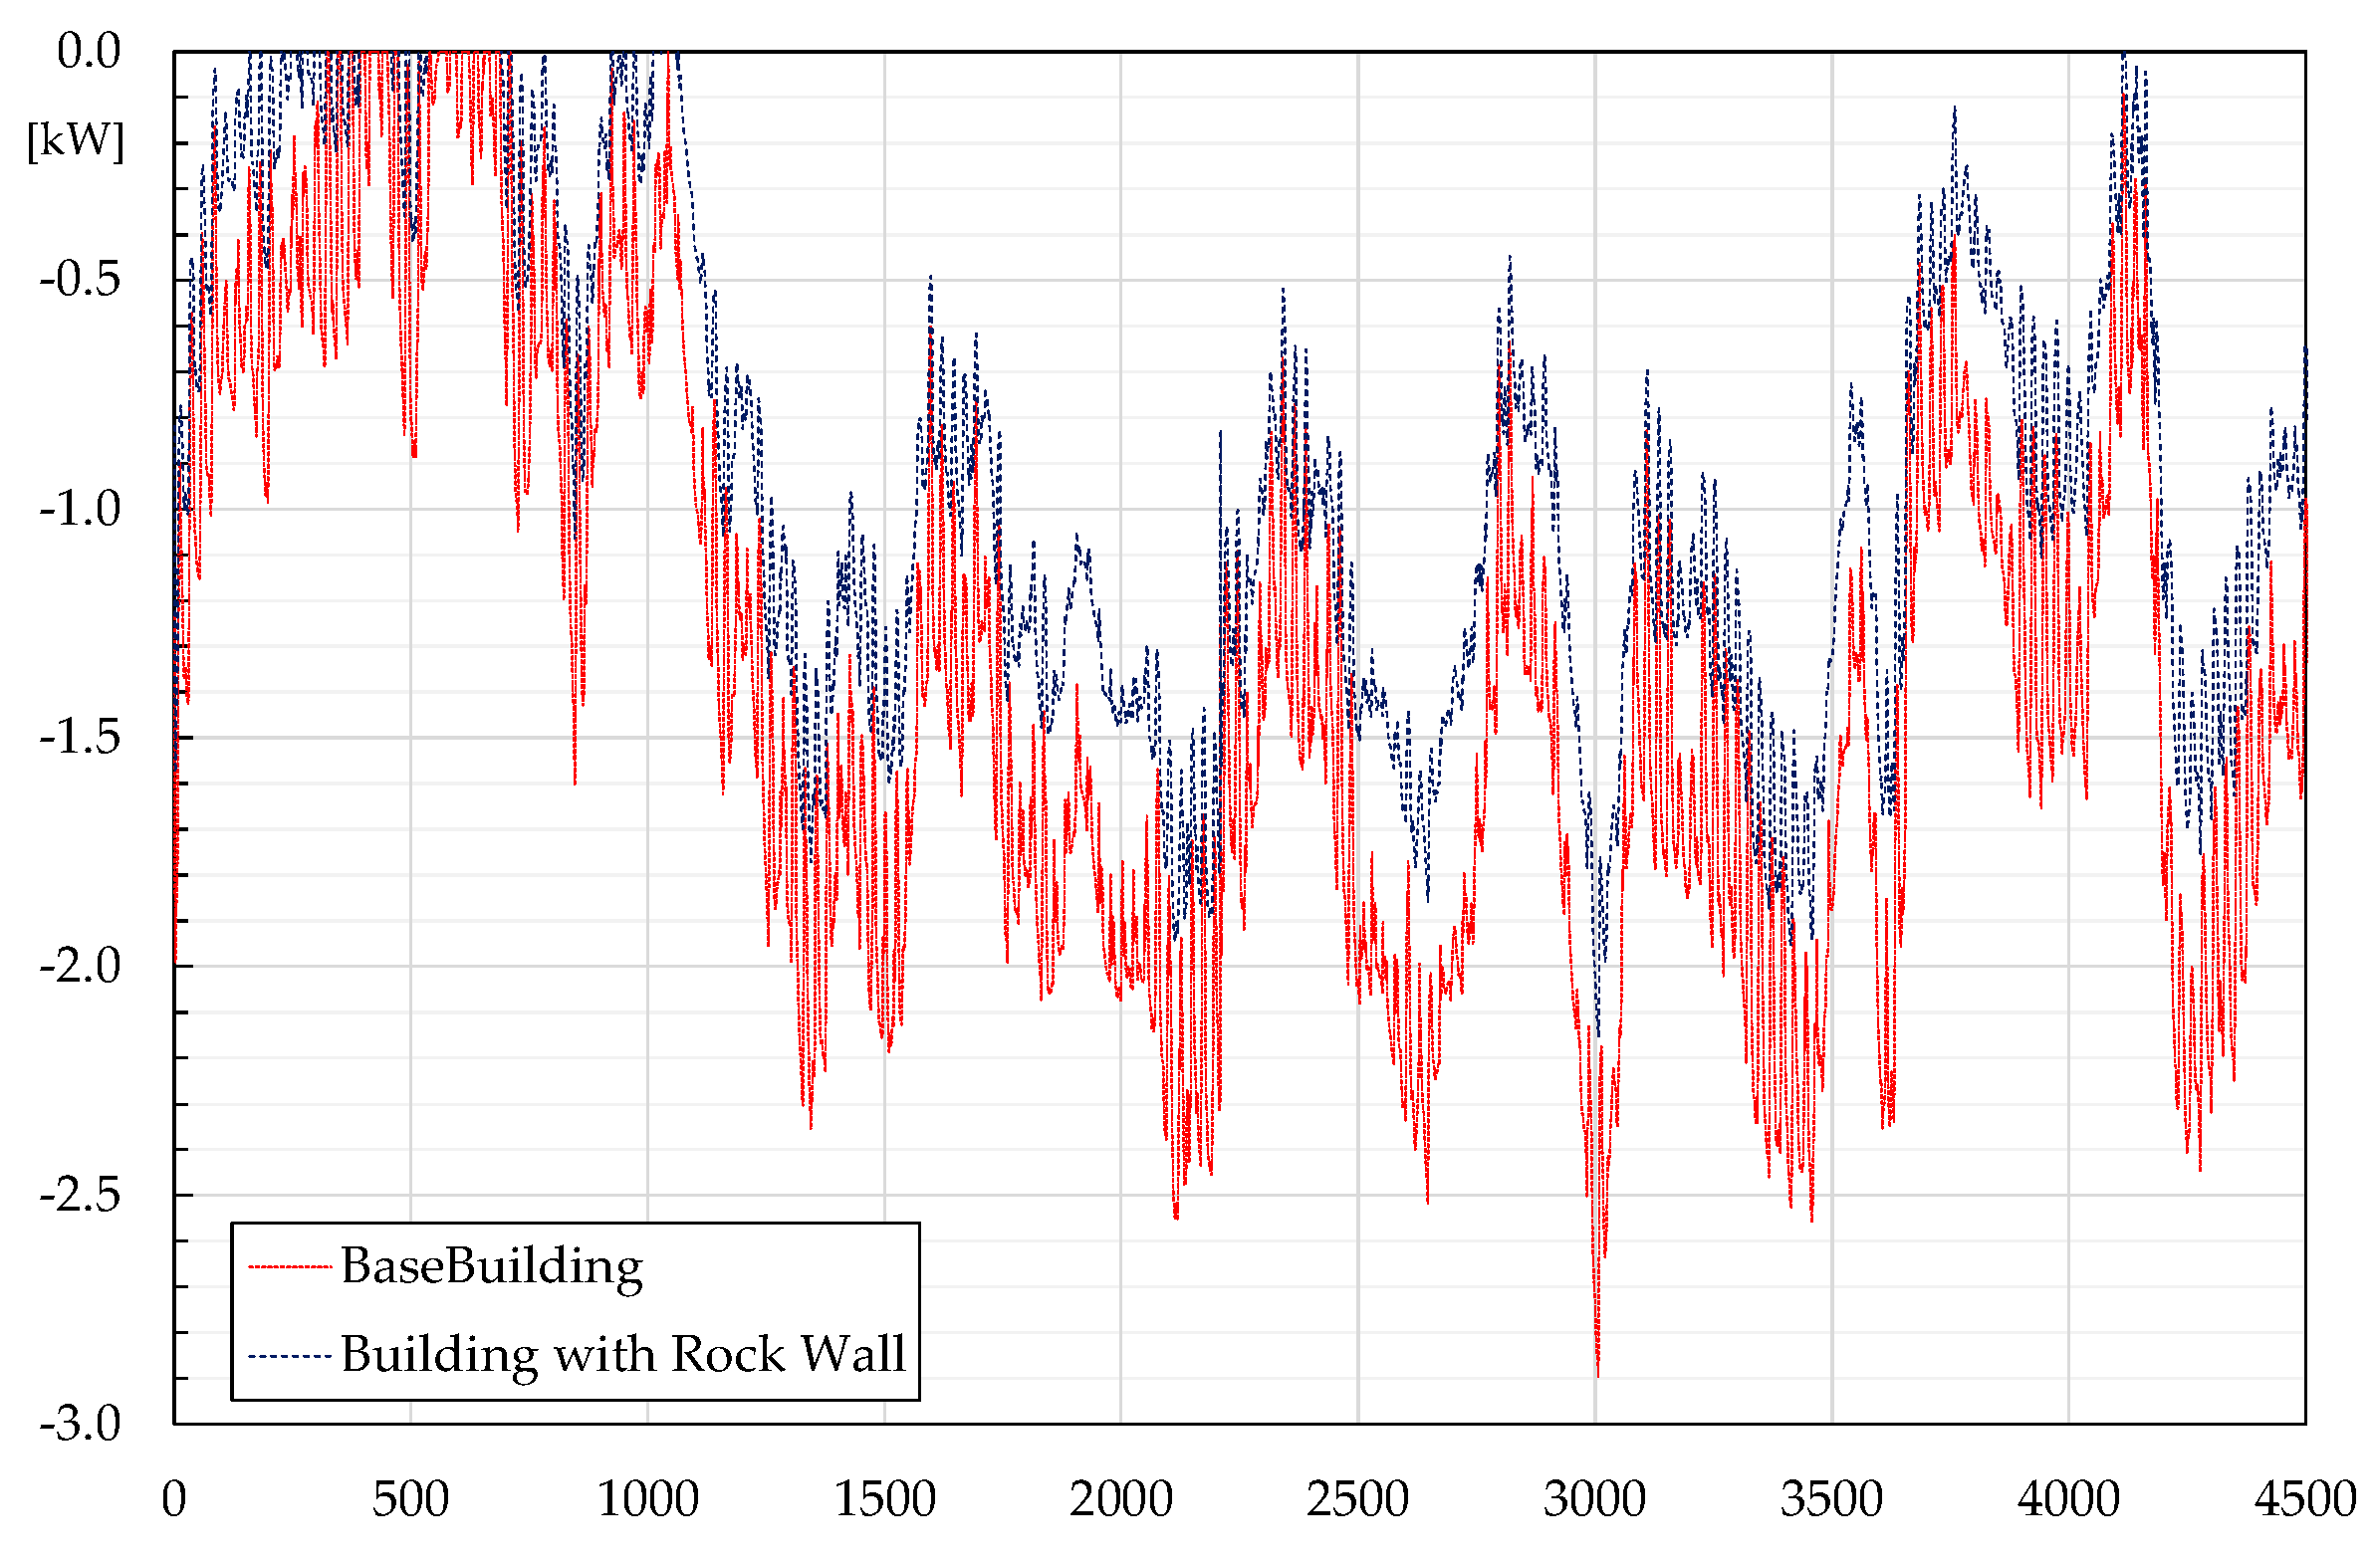
Figure 14 highlights the deviances obtained in terms of heating loads for the whole building by setting a set-point temperature of 20 °C for the indoor air. It can be appreciated that the improvement is detectable, especially in the coldest periods, with heating loads that reduce significantly. In particular, the maximum heating load of 2.90 kW required for the reference configuration on 3 February (red line) was reduced to 2.15 kW (−25%) by integrating the rock wall (blue dashed line) in the building envelope.
Noteworthily, at the start of the heating period, the plant intervenes less frequently. At an average level, the reference building needs a heating power of 1.32 kW throughout the simulated period, whereas the proposed intervention reduces the average value to 0.87 kW.
Figure 15 depicts the temperature values obtained for the rock wall inner surface: an average rise of 2 °C it can be noticed in the entire season, with maximum deviances detectable in conditions of scarce solar irradiance when the thermal energy stored in the rock bed can be exploited adequately. When solar gain is largely available, the gap tends to reduce because the reference wall reaches itself appreciable inner surface temperature; conversely, it tends to cool quickly at night. A successive parametric study highlighted that by increasing the air flow rate crossing the rock wall, heating loads are subjected to negligible variations. In light of this, TRNSYS demonstrates that air velocity is less significant in enhancing the rock wall thermal performances; therefore, low values are preferred to limit the pressure drops and fan energy consumption. To confirm this, it can be noticed that pressure drops decrease from 950 Pa required with 900 kg/h to 260 Pa calculated with 360 kg/h, determined by the Tallmadge correlation and assuming no spherical stones [
39]:
with:
Globally, comparing Case A and Case E, the air flow rate limitation reduces the ventilation heat gain by 2.57-times, but pressure drops increase by 2.65-times. Moreover, the limitation of the ventilation heat gain is largely counterbalanced by the increase in the heat delivered per convection and longwave radiation from the rock wall’s inner surface, as confirmed by the slight variation in the TRNSYS heating loads.
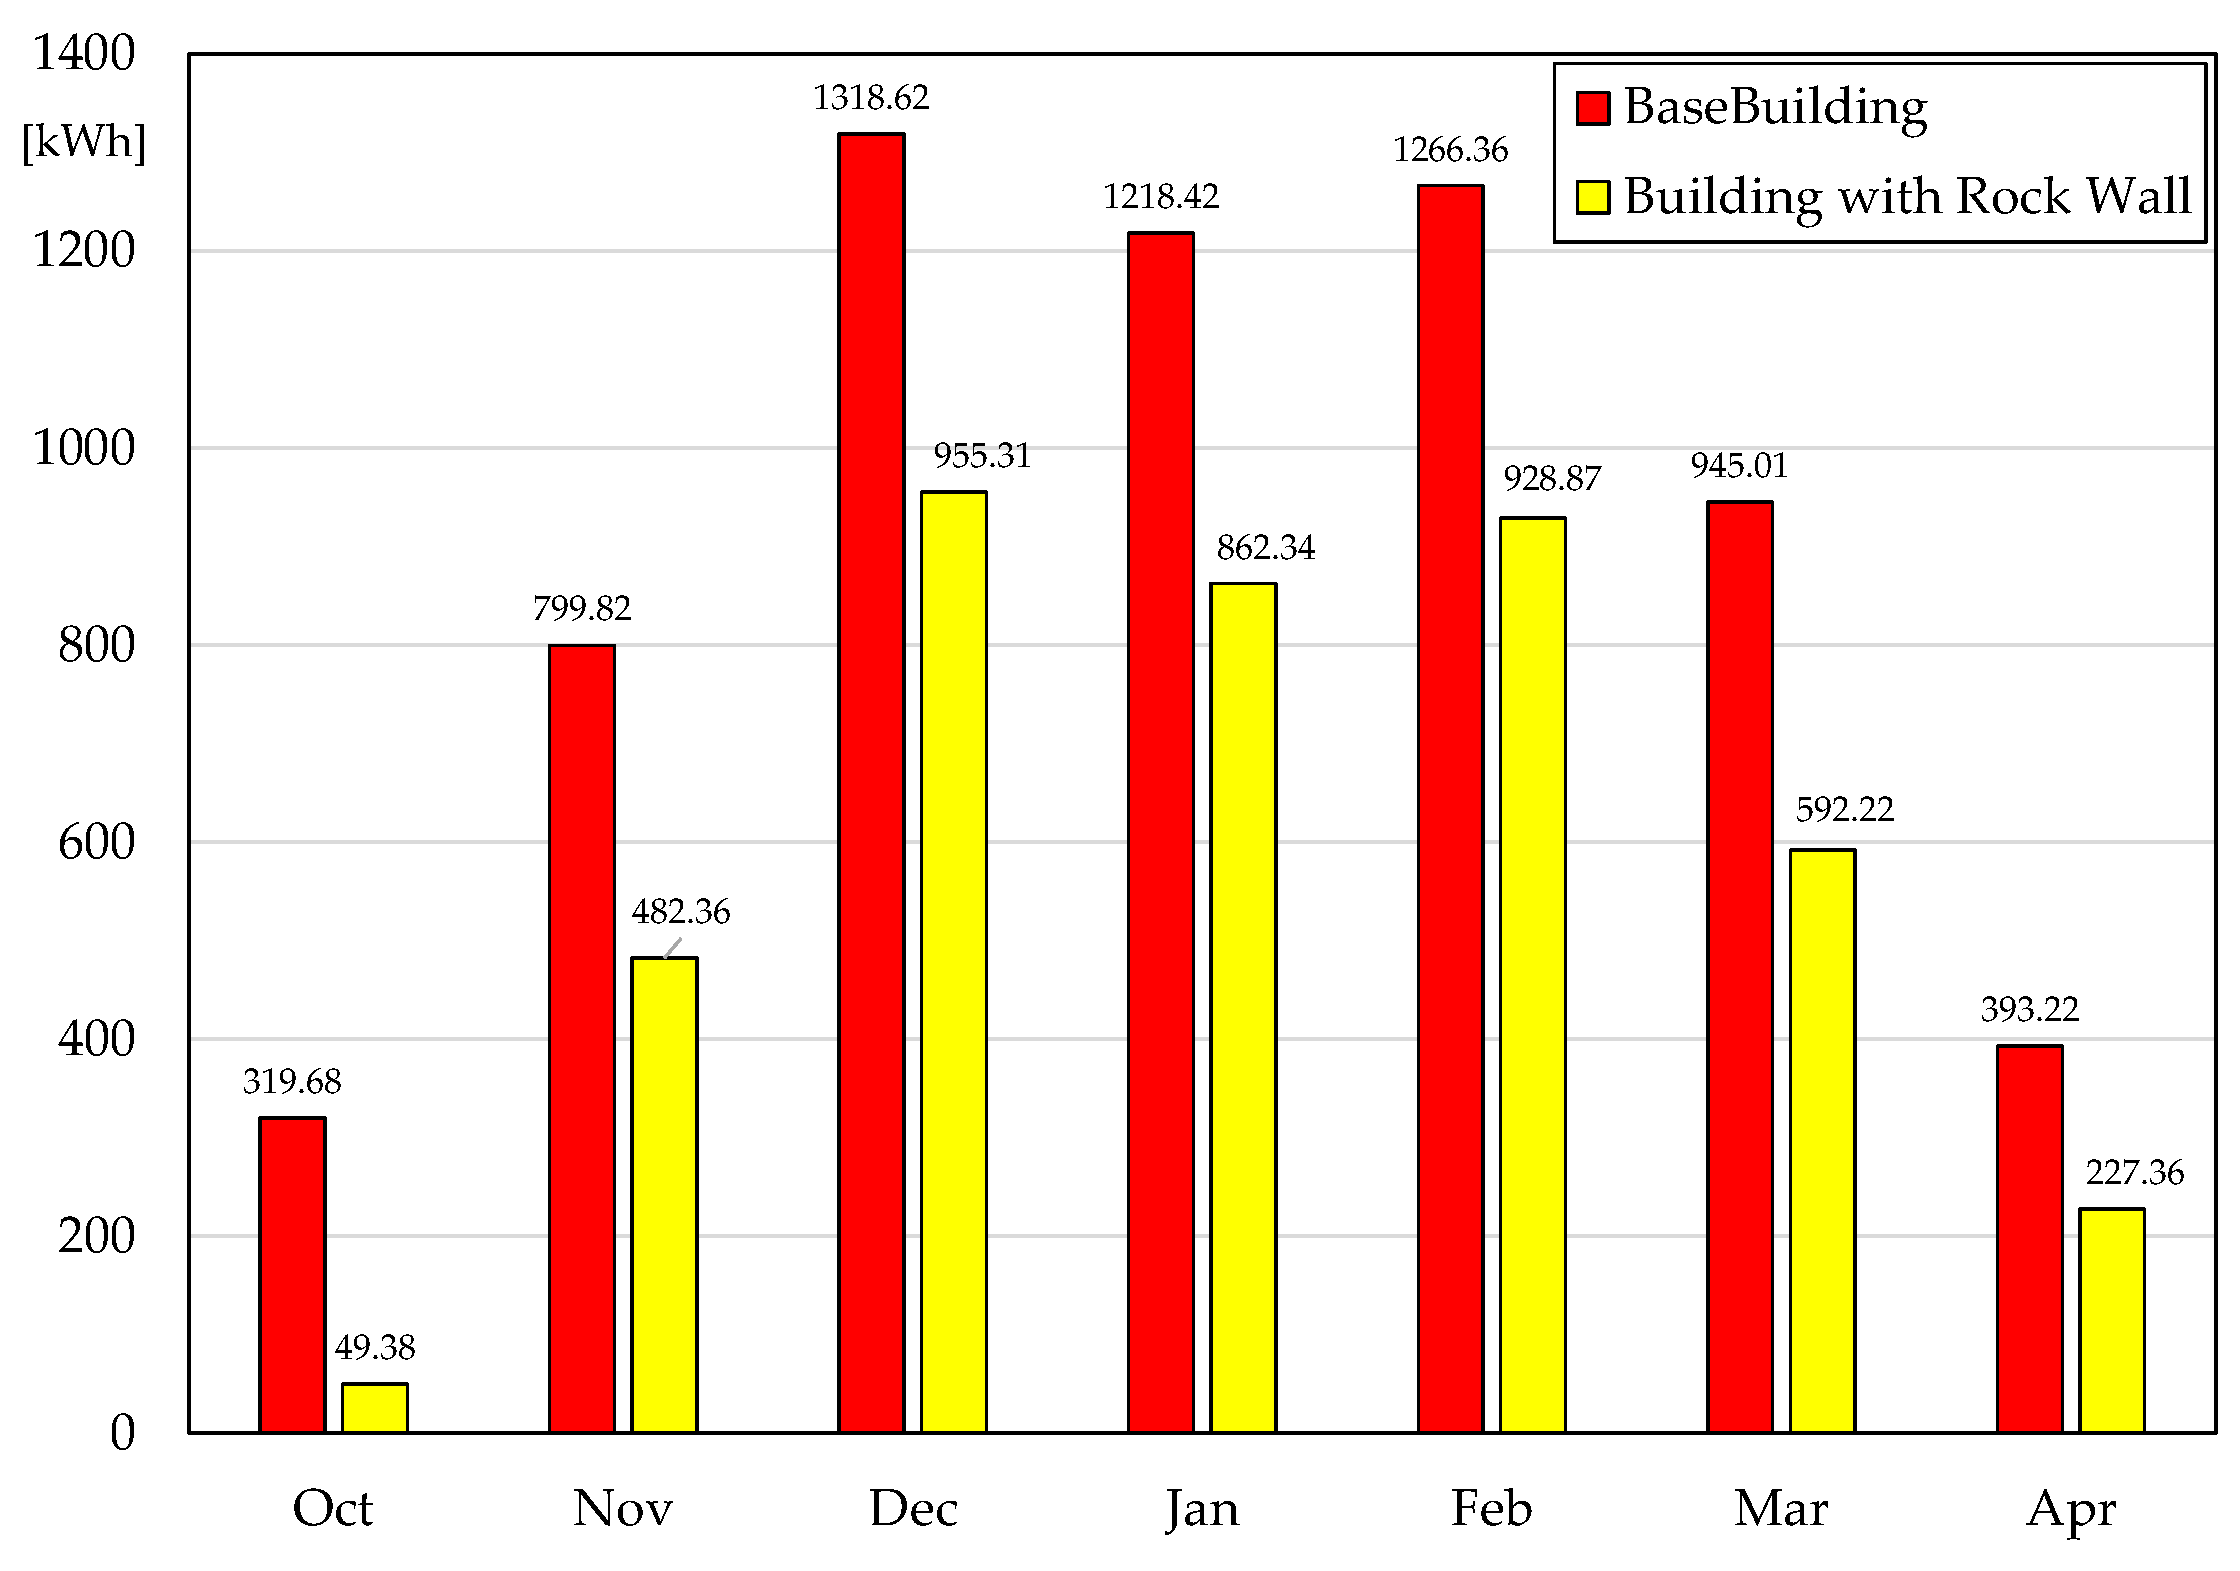
Finally,
Figure 16 shows the achieved benefits in terms of monthly heating demand savings, whereas
Table 4 lists the correspondent percentage reductions; appreciable results were obtained every month, with the maximum values registered during the coldest periods. It is worth noting that the energy performance index for heating, calculated as a function of the thermal energy requirement and, therefore, depending exclusively on the building fabric features, reduces from 156.5 kWh/m
2 per year to 102.5 kWh/m
2 per year. Considering that it is difficult to employ heat pumps in historical buildings due to issues related to the installation of the external units, if a gas boiler with an average seasonal efficiency of 90% supplies the heating plant, a primary energy saving of about 60 kWh/m
2 per year can be achieved. Anyway, to state the real energy sustainability attained with the proposed renovation intervention, it is necessary to also determine the primary energy related to the fan operation. In the worst condition of a fan operating continuously with an air flow rate of 360 kg/h and efficiency of 90%, by associating the pressure drops calculated by Equation (10), an electric consumption of 10.2 kWh/m
2 per year is determined. Therefore, by setting a grid efficiency value of 54% [
39], the renovation intervention assures a primary energy saving of over 41 kWh/m
2 per year, highlighting the rock wall as an efficient and feasible solution for the refurbishment of historical buildings.
4. Conclusions
This study focused on a particular typology of dry-assembled rock walls made of caged stones conceived for the refurbishment of historical buildings. The wall was preliminarily analyzed by an FDM code to investigate the temperature field inside the structure. The results highlighted the necessity to use a more homogeneous configuration with a high fill factor to enhance the thermal performance. Furthermore, it emerged that a greater thickness of the rock wall (i.e., greater thermal inertia) is more significant than the improvement in convective heat exchange between the air and stones. High air flow rates improve the thermal exchange between air and rocks, and thermal energy extraction from the accumulator is enhanced in the presence of scarce solar irradiance; nevertheless, greater fan pumping powers are required. Furthermore, large air flow rates reduce the temperature of the inner surface by limiting the thermal exchange by convection and longwave radiation to the indoor environment. In a second phase, the temperatures provided by the FDM code were employed in the TRNSYS software to evaluate the energy performance for a reference historic building subjected to weather conditions typical of a Csa zone following the Koppen classification. It was observed that it is preferable to use a reduced air flow rate because the main contribution to the limitation of the heating loads is given by the rock wall’s inner surface temperature growth. Indeed, the growth in the convective and longwave radiation fluxes largely counterbalances the limitation of the ventilation gains, in front of a conspicuous augment of the pressure drops and, consequently, of the pumping powers. In such a condition, heating loads reduced significantly with a peak value that passed from 2.9 kW to 2.15 kW; simultaneously, a significant increase in the inner surface temperature was observed, with an augment, on average, of 2 °C. Regarding the whole period, the achievable monthly heating savings vary between 26% and 85%, with an energy performance index determined starting from the thermal energy requirements reduced by 54.1 kWh/m2 per year. If thermal energy demand and fan electric consumption are converted into primary energy, savings of 41.1 kWh/m2 per year were also achieved in the worst condition of a non-stop operating fan, assuring the energy sustainability of the proposed renovation intervention. These results confirm the goodness of the proposed solution, although other investigations are required. Since an experimental set-up is planned to be installed in the Laboratory of Building Physics of the University of Calabria, in the next step, the validation of the FDM code can be carried out. Moreover, achievable thermal comfort conditions and system optimization must be explored by looking at the summer performances, considering that in the involved location, cooling demands often overcome the heating ones.


