Abstract
The prevalence of micropores and nanopores in low-permeability reservoirs is a cause for concern, as it results in a sizeable quantity of oil reserves being trapped within them. The water-gas dispersion system has the capacity to expand the reservoirs’ wave volume and enhance oil recovery. While the microscopic oil repulsion mechanism has been the center of attention, the oil repulsion effect of three distinct types of gases (N2, CH4, and CO2) is of particular importance in understanding the displacement mechanism of N2/CH4/CO2 on heptane at the blind end of the nanometer. A molecular dynamics simulation using the LAMMPS software was employed to construct a model of a blind end of heptane on a SiO2 wall and an interface model with different types of gas molecules. This was done to investigate the microscopic mechanism of heptane replacement by gas molecules. The temperature (50 °C) and pressure (30 MPa) of the reservoir in the Changqing oil field are selected as the parameters for analysis. The findings indicate that all three types of gas molecules can enter the blind end and displace heptane. However, supercritical CO2 forms a mixed phase with heptane, which is more prone to extruding oil molecules situated near the inner wall surface of the blind end and desorbing the oil film. The results demonstrate that, in the context of the blind end, gaseous CO2 exhibits a lower solvation ability but superior extrusion diffusion ability for heptane compared to N2 and CH4. Furthermore, the interaction energy indicates that the interactions between two states of CO2 and heptane, as well as the thickness of the interface, increase with increasing pressure and temperature. The findings of this study elucidate the microscopic mechanism underlying the replacement of oil droplets or oil films at the blind end by different gases under reservoir conditions at the molecular level and offer further guidance for the selection of the gas phase and the replacement state in the water-gas dispersive drive system.
1. Introduction
Oil and natural gas are the world’s most important strategic energy sources, and China’s low-permeability reservoirs account for more than two-thirds of its total oil and gas reserves [1]. The recovery rate of low-permeability oil and gas reservoirs is typically low, ranging from 10% to 25% [2]. Consequently, there is a significant interest in enhancing the oil production and recovery rate of these reservoirs. The commonly used processes consist of physical, chemical recovery, and biological methods [3]. Physical methods are one of the methods used in the early stage. At present, the common thermal recovery methods mainly include steam flooding, heated water flooding, and in situ combustion [4]. The traditional in-situ combustion technique injects oxygen-containing gas into the oil reservoir. This gas reacts with crude oil to form a high-temperature combustion zone, which generates steam and creates a propagating heating front [5]. Although this method has a relatively higher thermal efficiency compared to direct steam injection and can efficiently increase the oil recovery rate with the generated steam and a small amount of CO2, it may cause severe corrosion, generate toxic gases and result in gravity override [6]. Moreover, the process of “hydrothermal” is a significant alternative. It utilizes specific temperature and pressure conditions to break the bonds in heavy oil and raise the concentration of saturated hydrocarbons and lighter aromatics. In this process, an appropriate catalyst must be introduced to effectively reduce viscosity [7]. Richard et al. employed homogeneous supercritical water in combination with catalysts to improve oil recovery technology. The presence of supercritical water results in an increase in the yield of upgraded oil from 34.68 wt.% to 58.83 wt.%, while concurrently reducing the amount of coke from 51.02 wt.% to 33.64 wt.%, thereby enhancing oil recovery [8]. Although this technology boasts numerous advantages, the design of appropriate catalysts and the selection of operating parameters are still required. Additionally, the stability of hot water also demands attention.
In the chemical flooding process, chemicals like surfactants, polymers, or alkaline solutions are added to the displacing water. As a result, the physicochemical properties of water and the oil in contact are changed, which improves the displacement of residual oil [9]. Chemical methods can improve oil recovery and can be used in combination with other methods. However, there are still issues such as high costs and the risk of damaging formations [10]. Microbial enhanced oil recovery utilizes microorganisms to mobilize the remaining oil in reservoirs and thereby increase oil recovery [11]. Nevertheless, due to its intricate mechanism and uncontrollable reservoir environment, it has not been widely applied in the petroleum industry [12].
In addition, gas infusion is one of the most time-honored enhanced oil recovery methods. Currently, gas injection to enhance recovery is widely used in low-permeability reservoirs by utilizing the low resistance to seepage of gases into small pores. In the subterranean environment, the injection of CO2 has the potential to dissolve in the crude oil, thereby reducing the viscosity of the crude oil and increasing its volume. Moreover, at a particular temperature and pressure, carbon dioxide can become miscible with specific components of the crude oil [13,14,15]; In contrast to CO2 which displays poor compatibility with crude oil, CH4 exhibits enhanced compatibility, although its solubility is relatively low; N2 is insoluble in both water and oil and can be employed to supplement formation pressure [16,17,18]. Furthermore, water-gas alternate injection is more efficient than other oil recovery techniques. This is because it raises the average oil recovery rate by 10% compared with other methods [19]. The mixed injection of gas and water has been proven to be more capable of improving oil displacement efficiency and injectivity than continuous gas injection [20,21]. Yu et al. proposed the water-gas dispersion system flooding, which is a further improvement on the water-gas alternate system flooding for oil displacement. By adding gas in the form of microbubbles to water, it plays an extremely crucial role, especially in the oil displacement process in reservoirs with micron-sized pores and throats [22].
These include the use of water as the continuous phase and gas as the dispersed phase (in the form of microbubbles), as well as the formation of a mixed system. This has the potential to expand the degree of residual oil mobilization of the water and gas dispersal system for marginal areas and improve the recovery rate [23]. As an effective new type of oil drive, the water-gas dispersion system, applied to reservoirs after the water drive, can improve recovery by 8–20 percentage points through the fluctuation effect of microbubbles collaborating to carry residual oil, adsorption of the oil film effect, and the differential utilization of energy [24]. Similar to gas drive, the recovery of oil driven by a water-gas dispersion system also changes depending on the type of injected gas. In the dispersion system, the gas phase has a small size and has a complex interaction with the oil phase. It has a high oil displacement efficiency. However, there is seldom a clear explanation on the micron scale.
In recent years, molecular dynamics simulation has emerged as a valuable technique for investigating the behavior of molecules within microscopic pores. This approach is primarily employed to examine the flow dynamics of molecules within pores and to elucidate the miscibility and interfacial characteristics of distinct molecular species, with a focus on enhancing oil recovery [25,26,27]. By employing a molecular dynamics (MD) approach to investigate the adsorption behavior of a mixture of CO2, CH4, and C4H10 within a slit, Santos et al. discovered that CO2 adsorption was more pronounced at the nanopore wall. This finding suggests that CO2 re-injection may prove an effective means of enhancing oil and gas recovery [28]. Meanwhile, Fang et al. investigated the behavior of CO2/C10 miscibility and displacement in quartz slits using the same methodology. The findings indicated that during the CO2 flooding process, the gas effectively separated the oil from the solid surface at a notable rate. The oil phase mostly moves in a central slit, and no sliding behaviors were observed on the slit surface. Additionally, the oil demonstrated a high degree of propulsive efficiency [29]. In their investigation of the flow behavior of supercritical CO2 in silica pores (scCO2), Liu et al. discovered that the density of the gas at varying pressure gradients or nanochannel sizes resulted in the formation of four distinct structural adsorption layers. They observed that the adsorption layer situated at the center of the channel exhibited significantly higher diffusivity than the adsorption layer proximate to the silica surface [30]. Li et al. investigated the separation of organic molecules from aqueous film-covered calcite surfaces by scCO2 and found that water molecules could dissociate in the phase while being adsorbed onto the calcite surface and that the number of adsorbed molecules increased with the thickness of the aqueous film, pressure, and temperature, which facilitated the separation of organic matter [31]. Luan et al. found that scCO2 can break the hydrogen bond between water molecules and cross the water membrane into the blind end. It was also shown that CO2 binds to silica more readily than C8H18 from an energetic point of view [32]. Wang et al. found that the density of CO2 in the nanoslit is higher than that of CH4 and C8H18 due to the different relative interaction potentials between different types of fluids and carbon atoms, so the organic surfaces are more attractive to CO2, and it can be seen from the density ratio of the adsorbed layer to the native fluid that the density ratio of CO2 is much larger than that of CH4 and C8H18 [33].
The above literature proves that CO2 has a higher adsorption on the wall than CH4 and others, which can affect the interface and separate oil molecules. In addition, compared with supercritical CO2, gaseous CO2 has lower solubility in water and higher interfacial tension with alkanes. They do not cause oil expansion and have a worse oil displacement effect than in the supercritical state. Molecular dynamics simulations have not only been used to study the role of carbon dioxide with alkanes and wall surfaces in the drive oil process, but the use of other types of gases has also received a lot of attention. Fang et al. used MD simulation to study the gas oil flooding mechanism at the molecular and atomic levels and found that there is a CO2 dissolution effect and N2 propulsion effect in the repulsion process. Therefore, the weak propulsion of CO2 and the interaction between N2 and crude oil due to the two effects lead to a short residence time of the gas in the nanoslit [34]. Sun et al. simulated the diffusion of CH4 and CO2 in quartz pores and found that the diffusion ability of gas molecules in the non-supercritical state is much greater than that of gas molecules in the supercritical state. In addition, it was found that in nanopores, CH4 exists in the form of a tight adsorption layer, while CO2 molecules are often absorbed in the pores as a whole. In the binary mixing system, CO2 is preferentially adsorbed on the surface of nanopores [35]. Jin et al. found that CO2 adsorption is stronger than CH4, and additionally the presence of water covers the clay surface, forming a water adsorption layer that greatly reduces the adsorption of both gases in the clay nanopores [36]. Xiong et al. investigated the behavior of CH4 in SiO2 nanopores and found that the ability of CH4 to accumulate on the wall is greater at pore diameters less than 6 nm and increases with increasing pore size in the range of 6 nm. When H2O is added to the model, there are van der Waals interactions, Coulomb force interactions, and hydrogen bonding interactions between H2O and SiO2 molecules, which results in water molecules occupying the pore walls, occupying the adsorption space for methane molecules, and decreasing methane adsorption on the walls [37]. Water wets the pore surface, and methane is usually present in the nanopore as an intercalated structure of H2O-CH4-H2O or a methane bubble structure wrapped in water [38]. Water appears as a film on the surface of the inorganic material, thus preventing the adsorption of gas and oil molecules in the pores of the inorganic material [39]. Long et al. investigated the modeling of coal micropores (0.5 nm) and found that the magnitude of gas-carrying capacity and adsorption in the pores is: CO2 > CH4 > N2. In addition, CO2 molecules have larger diameters, which make them more adsorbent, and have the smallest self-diffusion coefficients in the pores [40]. Wang et al. studied the preferential adsorption of gases on the calcite surface in the order of H2O > CO2 > CH4 > N2. In addition, H2O molecules can form two dense adsorption layers on the surface, and CO2 molecules can form an adsorption layer on the surface as well, while there are no obvious features that indicate that CH4 and N2 molecules are apparently adsorbed on the upper surface of calcite [41]. Li et al. investigated the interfacial interactions between Bakken crude oil and injected CO2, CH4, and C2H6 by MD simulation, and the simulation results showed that the injected gas dissolves when the gas meets the crude oil, causing the oil to swell. The gas solubility, the expansion factor, and the width of the interface between the two phases of gas and oil all increase with increasing pressure [42]. Li et al. investigated the miscibility of different hydrocarbon gases with crude oil in nanoslits under reservoir conditions by MD simulation, and they found that the miscibility of hydrocarbon gases and crude oil decreased due to the increase of polarity of crude oil because the larger polarity would increase the interaction of crude oil with the rock surface, which would correspondingly decrease the solubility of crude oil in hydrocarbon gases [43]. Wang et al. explored the miscible behavior of different gases (CO2, N2, CH4, C3H8) and crude oil in nanoslits under high temperature and pressure. The results showed that the solubility of heptane molecules in different injected gases followed the order of C3H8 > CO2 > CH4 > N2 [44]. The above literature shows that the type of oil molecules and injected gas also affects the interface and miscibility process, while CO2 has a stronger adsorption capacity compared to CH4 and N2, and the magnitude of diffusion capacity is in the opposite order of adsorption capacity. In addition, water forms a water film on the wall surface and reduces the adsorption of gas molecules on the wall surface. Yan et al. proposed that the oil-gas miscibility process mainly originates from the driving force of oil-gas interactions, which induces interdiffusion between oil and gas, while the conjugation of oil components generates repulsive forces that inhibit oil dissolution. In addition, CO2 was found to have better miscibility than CH4, and the miscibility increased with increasing pressure [45]. These studies have shown that gas plays a critical role in the swelling and displacement behavior of crude oil, but few MD simulation studies have focused on gas-hydrocarbon interactions in aqueous environments in slits. The composition of real crude oil is quite complex. Crude oil can be divided into saturated oil, aromatics, resins, and asphaltenes [46]. Some simulation works construct oil mixtures by mixing four representative molecular models in specific proportions [47]. In this study, the oil mixture model is simplified. Heptane is selected to represent the oil mixture and to represent the main (saturated and aromatic) components in crude oil.
In this research work, firstly, the blind end of a SiO2 slit was modeled by MD to investigate the miscibility process and adsorption characteristics of N2/CH4/CO2 gas with heptane in an aqueous environment. Secondly, the miscibility effects of CO2 and heptane in the blind end were compared between the supercritical state and the gas state. Finally, the degree of miscibility and the interfacial thickness of CO2 and heptane at different temperatures and pressures were investigated. This study investigates the miscibility process of a water-gas-dispersed system with oil phase in the formation, provides a molecular-level theoretical basis for the selection of gas phase and exchange state in a water-gas-dispersed propulsion system, and is conducive to providing a theoretical basis and technical guidance for the development of water-gas-dispersed system technology.
2. Models and Methods
2.1. Molecular Models
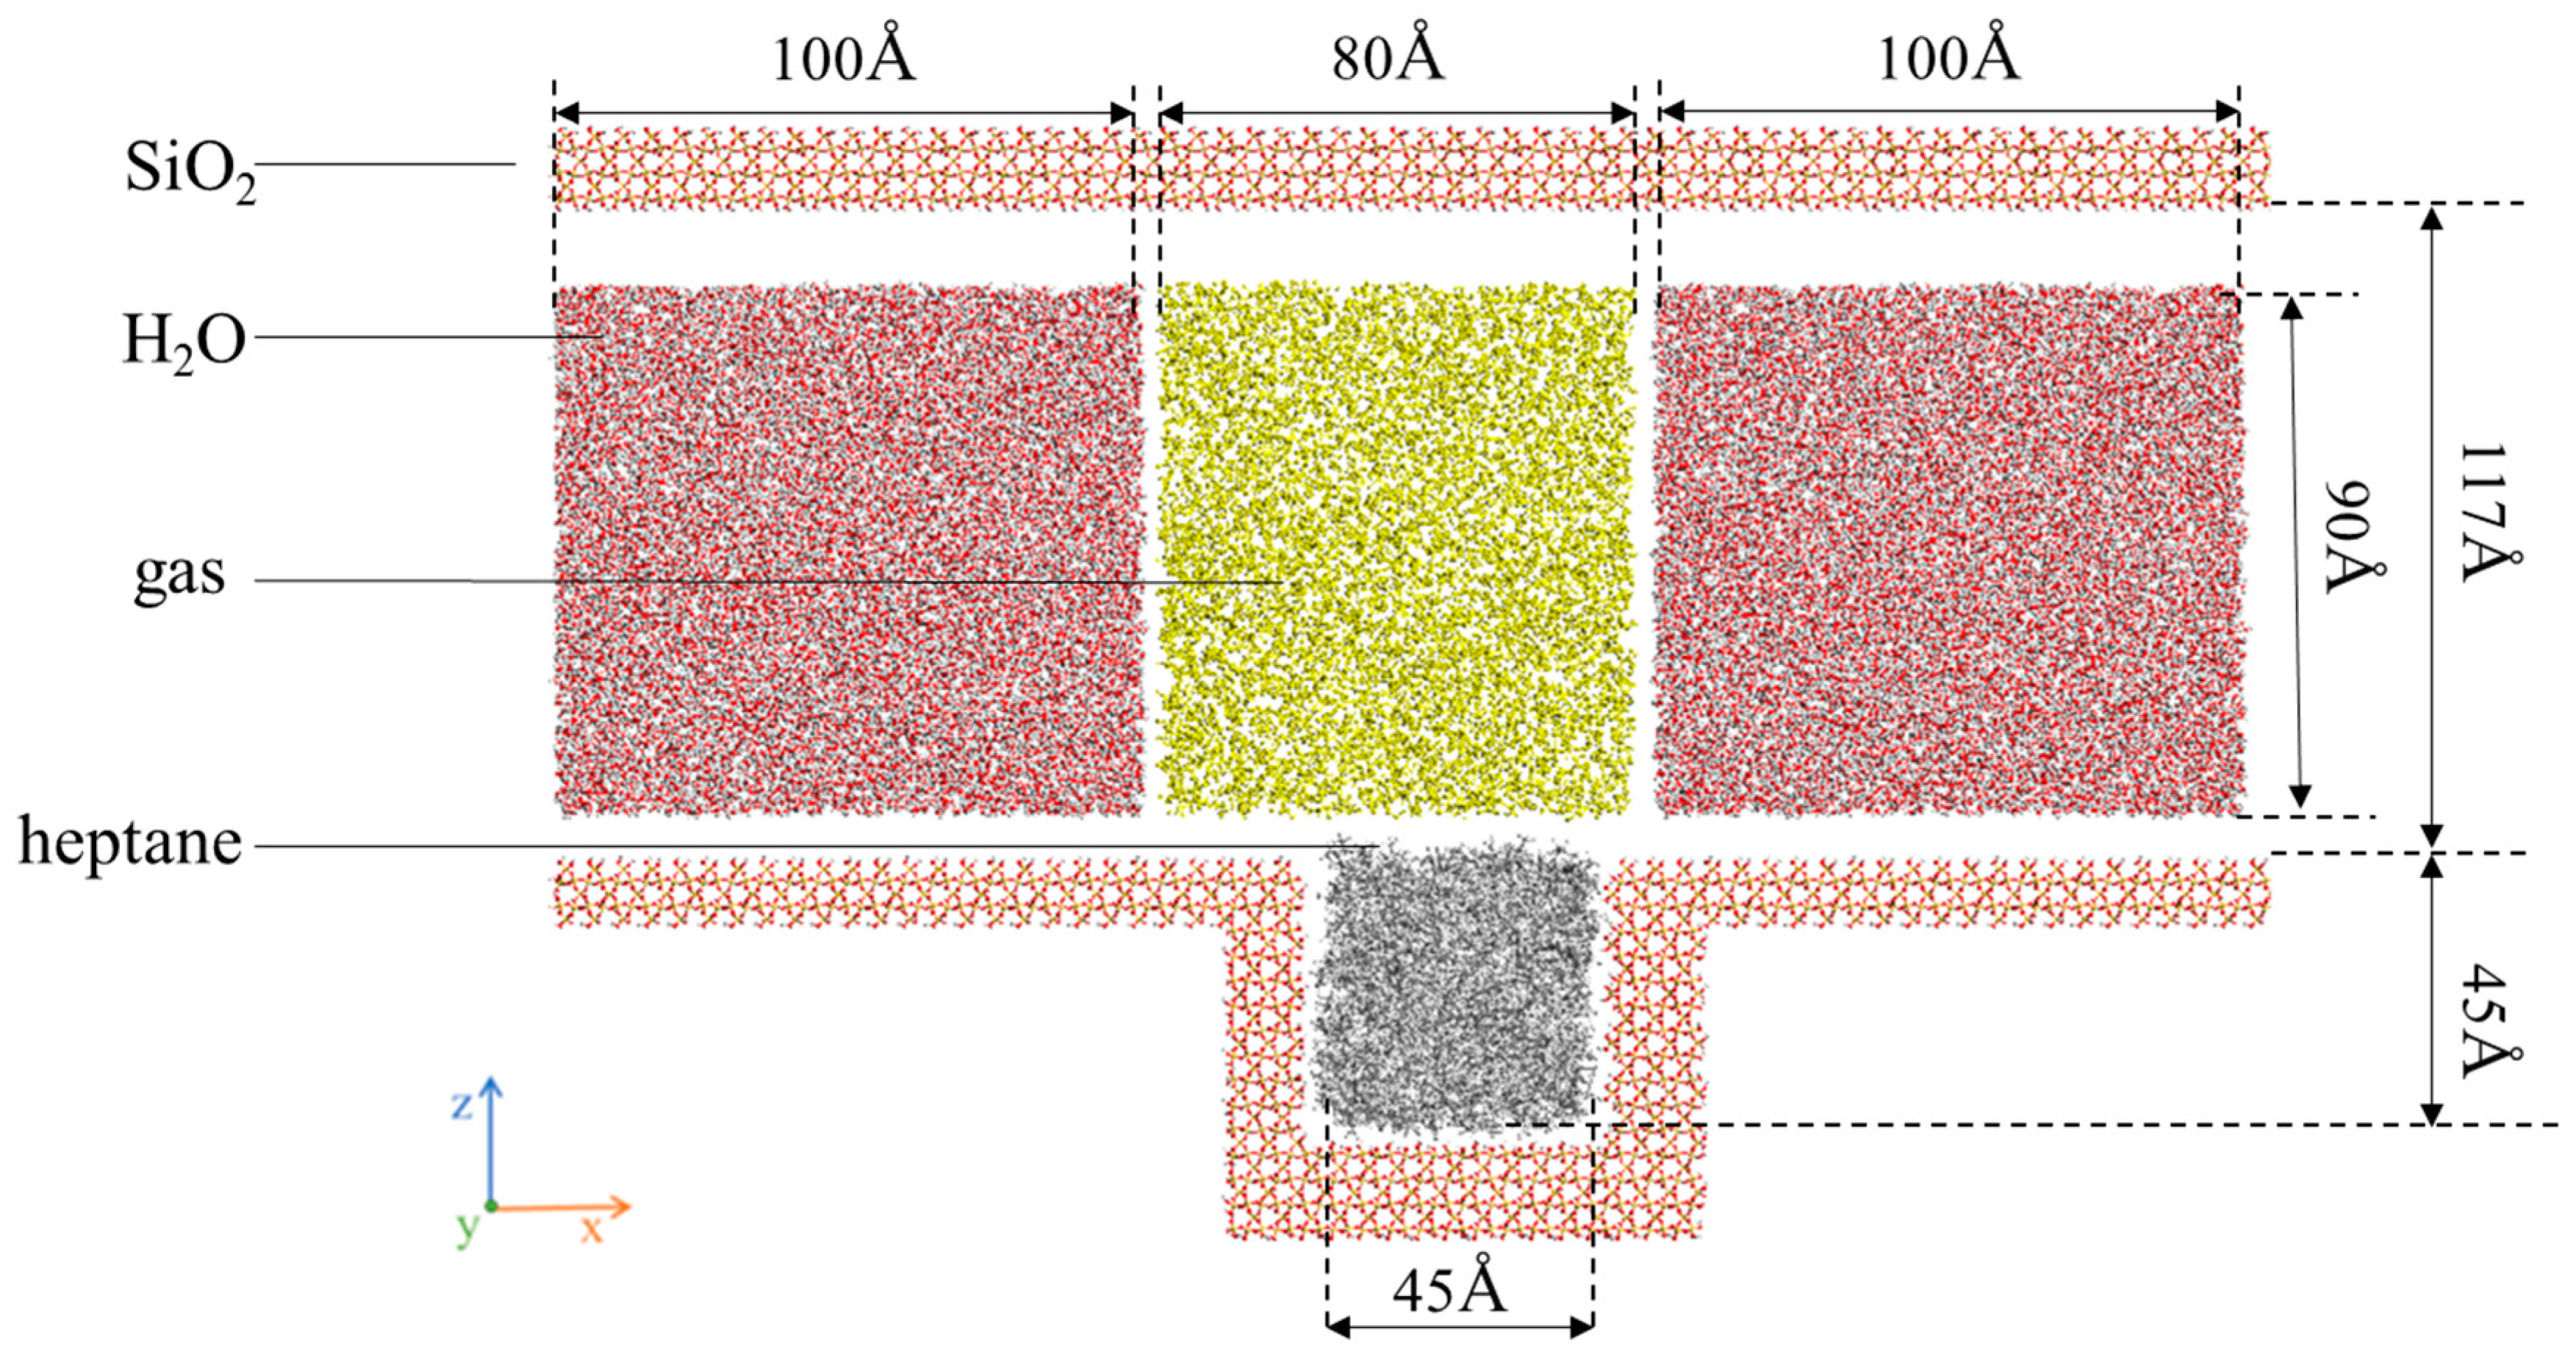
The simulation is divided into two parts. First, model I consists of three parts, i.e., nanochannels composed of SiO2, heptane molecular clusters, and gas molecules distributed inside the channels, as shown. Figure 1 shows (a) gas and water: N2, CH4, CO2, and H2O; (b) heptane: C7H16; and (c) rock surface: SiO2. Meanwhile, Figure 2 shows the complete model after assembly. The channel wall consists of SiO2 crystal cells cut along the (1 0 0) orientation, hydroxylated to hydrogen atoms added to the oxygen atoms exposed on the silica surface [48].
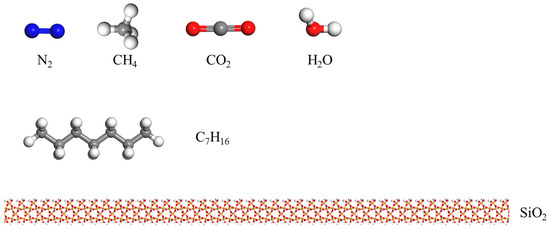
Figure 1.
Multiple molecular structures.
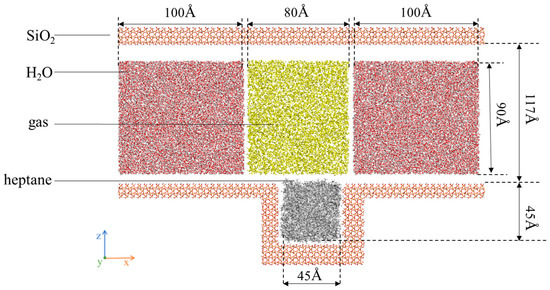
Figure 2.
SiO2 channel liquid atom model.
The z-direction is constructed as the upper and lower wall surfaces, which are considered to be fixed rigid bodies. The region of water and gas in the wall with a thickness of approximately 5 nm along the y-direction is defined as a dynamic group. During the flow simulation, periodic boundary conditions are applied along the x- and y-directions to achieve greater homogeneity and repeatability of the macroscopic fluid, while non-periodic boundary conditions are set up along the z-direction. The overall model has a volume of 29.4 × 5.4 × 19.2 nm3. Subsequently, the constructed system was simulated under reservoir conditions (P = 30 MPa, T = 50 °C) using the LAMMPS software (LAMMPS 64-bit, 8 February 2023). In the model designated as A-D in Table 1, the dimensions of the simulation frame and SiO2 channel walls, the number of oil molecules (326), the number of water molecules (26,902), and the volume of gas were held constant, and the corresponding quantitative data are provided in Table 1.

Table 1.
Definitional details of all systems and particles.
Model II is a simulation of the interface between carbon dioxide and heptane. The two parts are optimized and superimposed, with an overall size of 3.5 × 3.5 × 45.2 nm3 and an interstitial gap of 0.5 nm (see Figure 3). In the simulation process, three-dimensional periodic boundary conditions are employed to eliminate the influence of boundary effects, thereby obtaining a more realistic simulation environment [34].
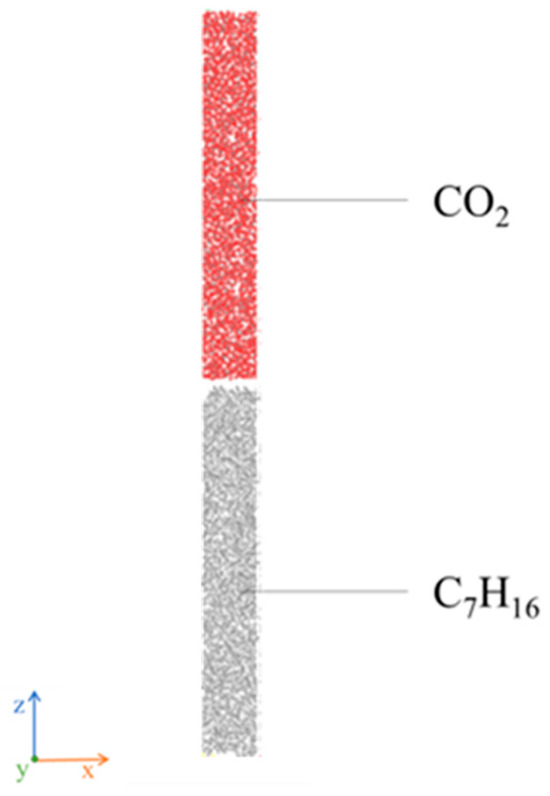
Figure 3.
A Molecular Model of Gas and Heptane II.
The effects of different types of gases on the oil phase in the blind end are distinct, and this study considers a total of three distinct types of gases. To facilitate a more comprehensive analysis, each type of gas is represented in a distinct system.
2.2. Force Field Types and Simulation Details
The Consistent Valence Force Field (CVFF), the original force field provided with the Discover program, is a generalized valence bonding force field. The CVFF is employed for silica and heptane due to its dependable parameters, efficacious portrayal of interactions, computational efficacy, and compatibility. The Optimized Potentials for Liquid Simulations (OPLS) force field is employed for the simulation of liquid systems and is also utilized for the simulation of gas molecules and water due to its enhanced accuracy in describing the interactions of water molecules and non-bonding interactions of gases [48]. Given that the visualization software OVITO has minimal memory requirements, can import large systems with ease, and can be scripted in Python to facilitate specific analytical functions, we elected to utilize this software for visualization purposes [49,50]. The Particle-Particle-Particle-Mesh (PPPM) method is an accurate and efficient method for calculating interactions in molecular simulations. The system has many particles, and to reduce the computational effort, the simulations were performed using the PPPM method for calculating the long-range electrostatic interactions. The modeling is performed by controlling the molecular density in order to achieve a system pressure of 30 MPa. Silicon dioxide (SiO2) is immobilized during the simulation, and the system A-D is run for 3 ns in an NVT set at a temperature of 50 °C.
The E-F model was simulated with an NPT system, and the temperature and pressure were maintained at 25 °C and 30 MPa, respectively. Transient configurations of the heptane-CO2 interfaces at varying temperatures and pressures were obtained through 3–6 ns simulations conducted with the NPT system. The resulting transient relative concentration distribution curves were subsequently analyzed. In accordance with the “10~90” principle, the distance between the heptane interface position corresponding to 10% of the total CO2 concentration and the CO2 interface position corresponding to 10% of the total heptane concentration in the z-axis direction represents the interface width [51,52,53,54].
3. Results and Discussions
3.1. Characterization of the Diffusion Process of H2O and N2 Mixtures in the Channel
In accordance with Model I, the gas in question is N2. The present study investigates the diffusion characteristics of N2 in interaction with heptane under conditions of 50 °C and 30 MPa. The role of water is twofold. Firstly, it simulates the state of existence of the water-gas dispersion system, whereby the gas is dispersed in water. Secondly, in the process of diffusion of N2 molecules with heptane, the water molecules act as a boundary, demonstrating the relationship and degree of interaction between the three phases of gas/water/oil.
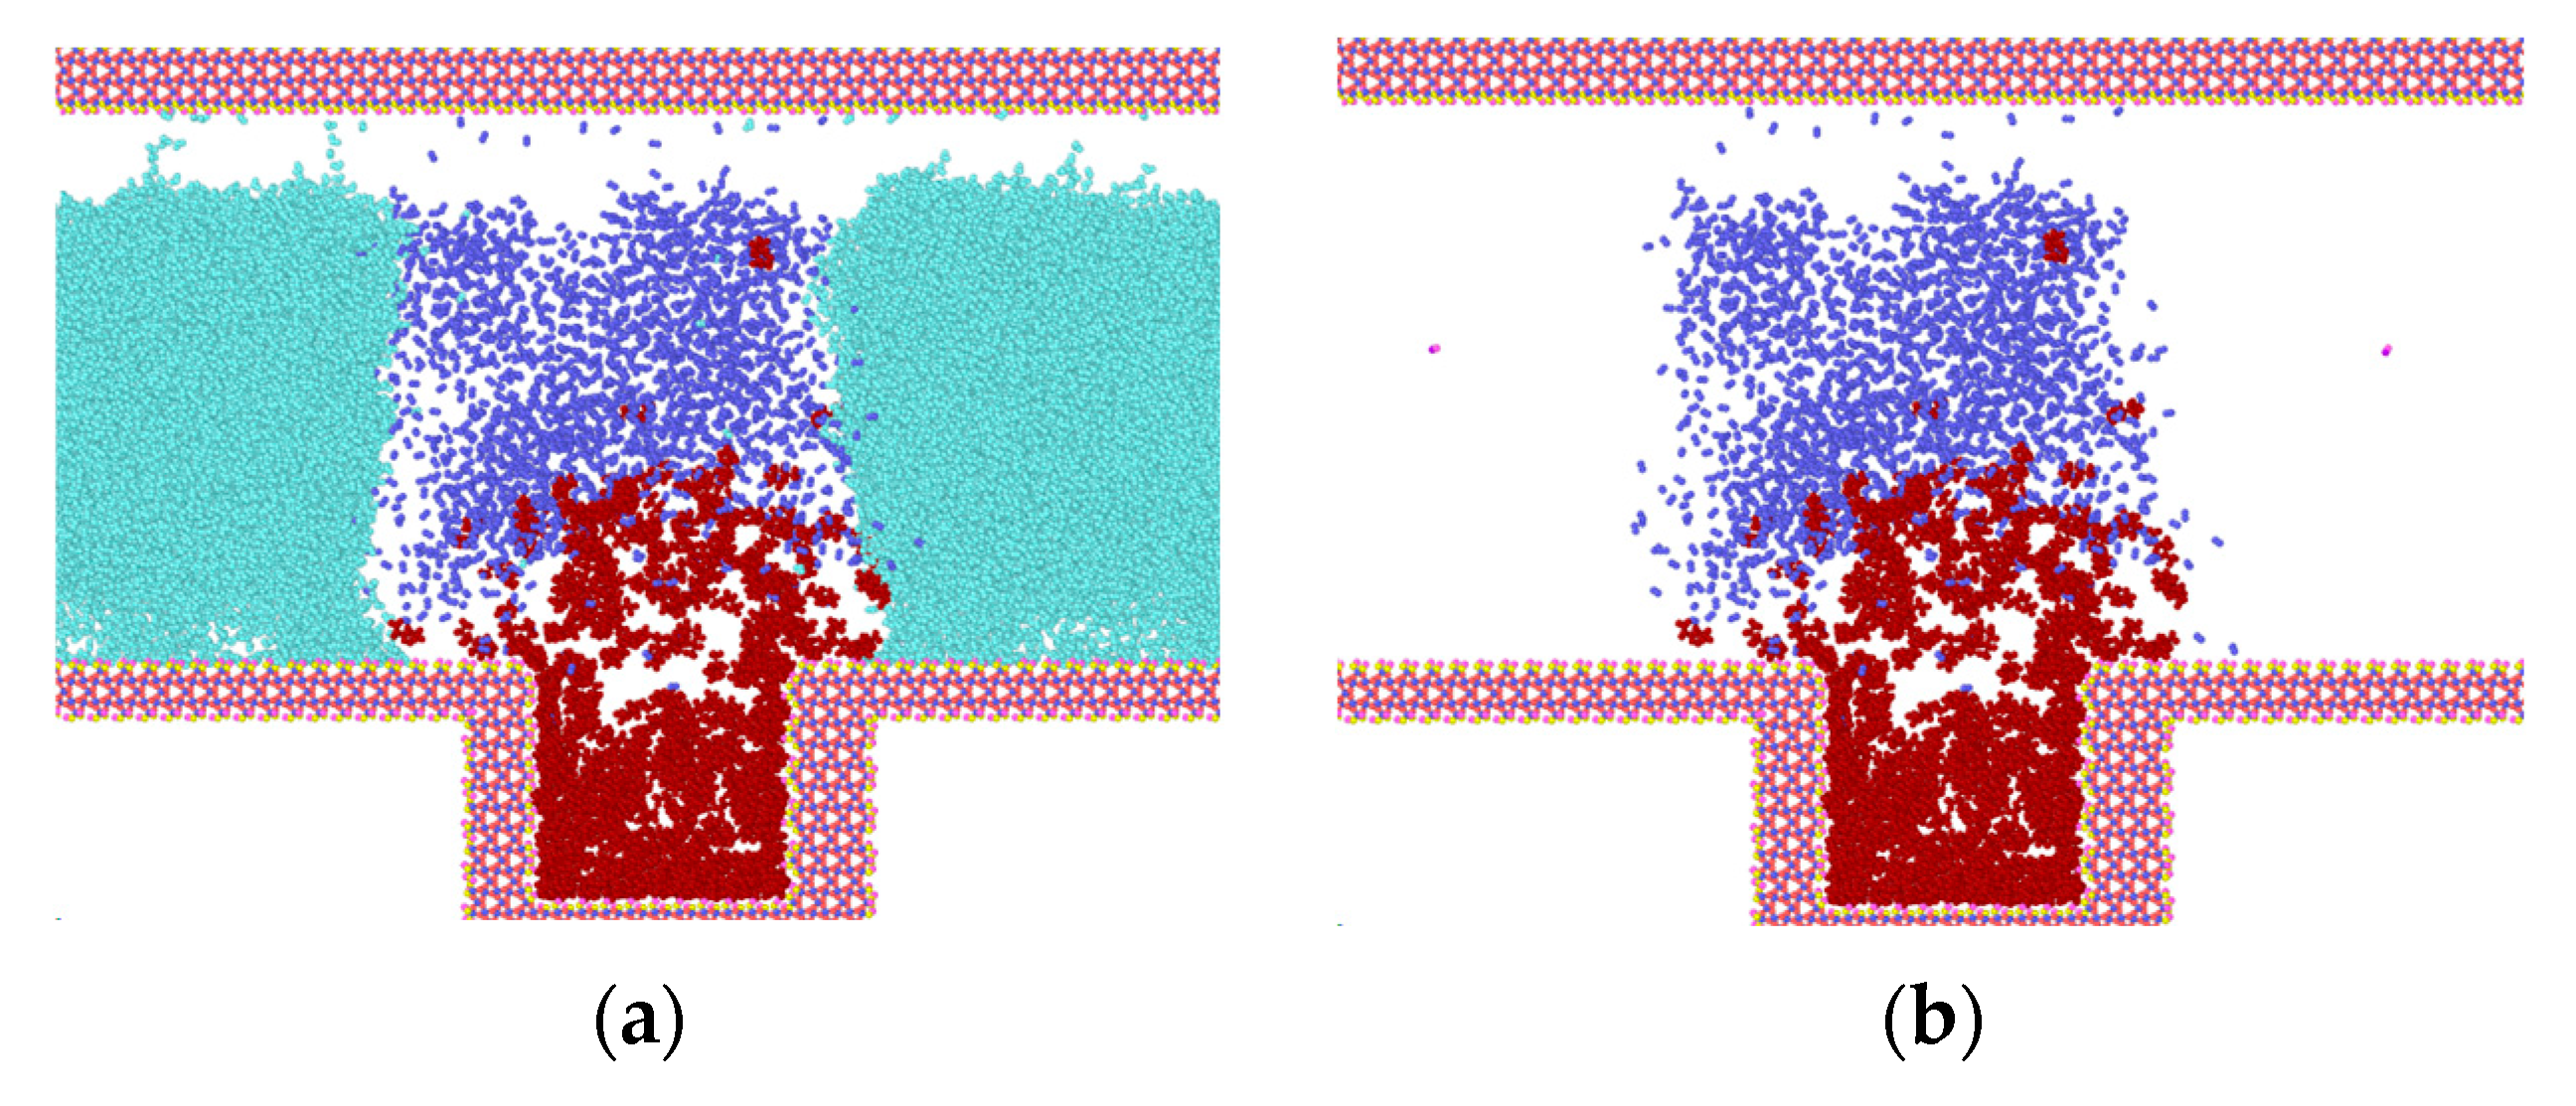
Figure 4 illustrates the intrusion process of N2 and the separation process of heptane at 50 °C and 30 MPa. In order to facilitate the analysis, the water molecules within the model are concealed during the examination of the diffusion process of N2 molecules and heptane.
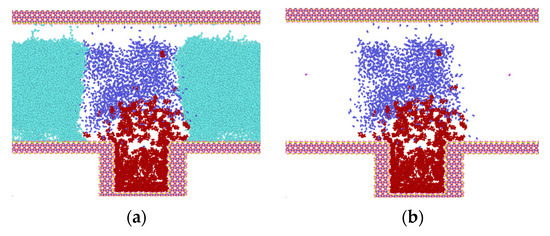
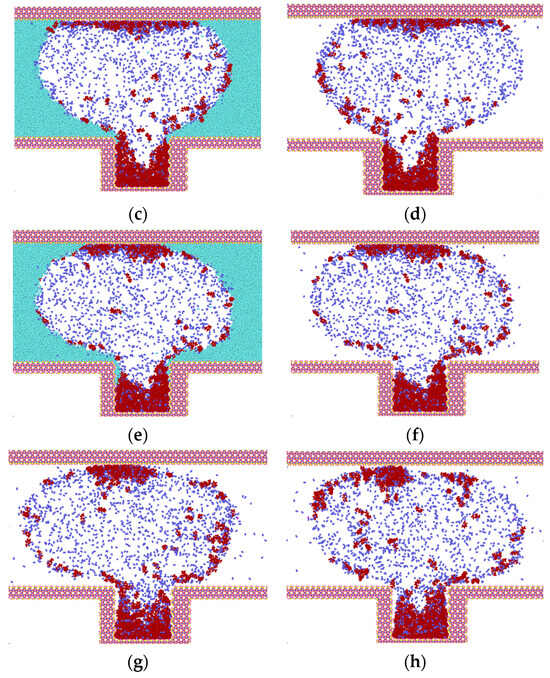
Figure 4.
Invasion of N2 molecules into water and heptane (light green for water, blue-purple for nitrogen, dark red for heptane). (a) Model at t = 0.03 ns; (b) Model with hidden water molecules at t = 0.03 ns; (c) Model at t = 0.035 ns; (d) Model with hidden water molecules at t = 0.035 ns; (e) Model at t = 1.0 ns; (f) Model with hidden water molecules at t = 1.0 ns; (g) Model with hidden water molecules at t = 2.0 ns; (h) Model with hidden water molecules at t = 3.0 ns.
As illustrated in Figure 4, the initial configuration of the model is depicted in Figure 1. The heptane molecule is situated within the blind end, the N2 molecule is located at the top, and the water molecules are positioned on either side of the N2 molecule. Once the simulation has commenced, the diffusion of both the N2 and heptane molecules from their initial positions is observed, as illustrated in Figure 4a–h.
Prior to 0.03 ns, the system undergoes initial structure optimization, during which the heptane clusters begin to expand. This expansion allows for the entry of some molecules into N2, as well as a small amount of N2 into the water on both sides within the blind ends. Following the completion of the initial structure optimization, the rate of molecular diffusion is accelerated, and the N2 molecules, which have been carrying part of the heptane, begin to diffuse in the z-direction until they are attached to the top wall of SiO2 (as illustrated in Figure 4c). At this juncture, the process of diffusion also has an effect. Additionally, the remaining N2 molecules within the blind end exhibit movement in the z-direction. Following a period of 0.35 ns, a considerable number of N2 molecules diffuse into the blind end, prompting the expansion of the heptane clusters and their subsequent diffusion around the channel. This process effectively displaces the water molecules to the two sides of the channel. Concurrently, because of the interaction between water molecules and the upper wall, the initial adsorption of heptane on the wall surface is detached and gradually collected, while its contact area with the wall surface diminishes. At time t = 1.0 ns, the model has reached a state of initial stabilization, as illustrated in Figure 4e. Most heptane molecules are situated at the blind end, with a smaller number gathered in clusters on the upper wall surface. A limited number of free states are distributed across the gas-water interface, where the gas exists in the form of bubbles. The N2 molecules exhibit a high concentration at the gas-water interface, with a small number of N2 molecules adsorbing free-state heptane molecules inside to engage in molecular thermal motion. Most water molecules are situated outside the gas bubbles, and the thickness of the interaction with N2 molecules at the gas-water interface is minimal, estimated to be 2.8 nm based on the principle of relative concentration (10~90). As the duration of the simulation increases, the number of N2 molecules entering the gas-water junction outside the blind end at the point in time designated as t = 2.0 ns rises in conjunction with the production of heptane molecules at this junction. At 3.0 ns, the heptane clusters that had been adsorbed on the upper wall surface were detached from the wall surface and distributed at the junction, as illustrated in Figure 4g,h.
At the outset of the simulation, the heptane molecules are predominantly situated in the lower portion of the z-axis coordinate, specifically in the blind end. Following the stabilization of diffusion, most of the molecules are observed to be distributed between the blind end and the top wall. The z-axis coordinates of the blind ends in the system range from 3.8 nm to 8.3 nm. At time zero, the heptane molecules are predominantly situated within the surface of the blind ends, with a minor concentration observed at the center of the slit. Subsequently, because of adsorption on the lower wall surface, the number of molecules within the blind end increased over time, while some of the molecules diffused above the slit. The number of heptane molecules in the vicinity of the upper and lower wall surfaces reached a maximum value at 1 ns. Subsequently, because of the collision of heptane with the gas diffusion, a minor proportion of heptane diffuses from the blind end into the channel, specifically the gas-water junction. As illustrated in Figure 4h, the heptane molecules that have adsorbed on the upper wall surface are gradually detached due to the competition between water and CO2 molecules. This process is complete by 3 ns.
3.2. Effect of Different Gases on the Heptane Molecule in the Blind End
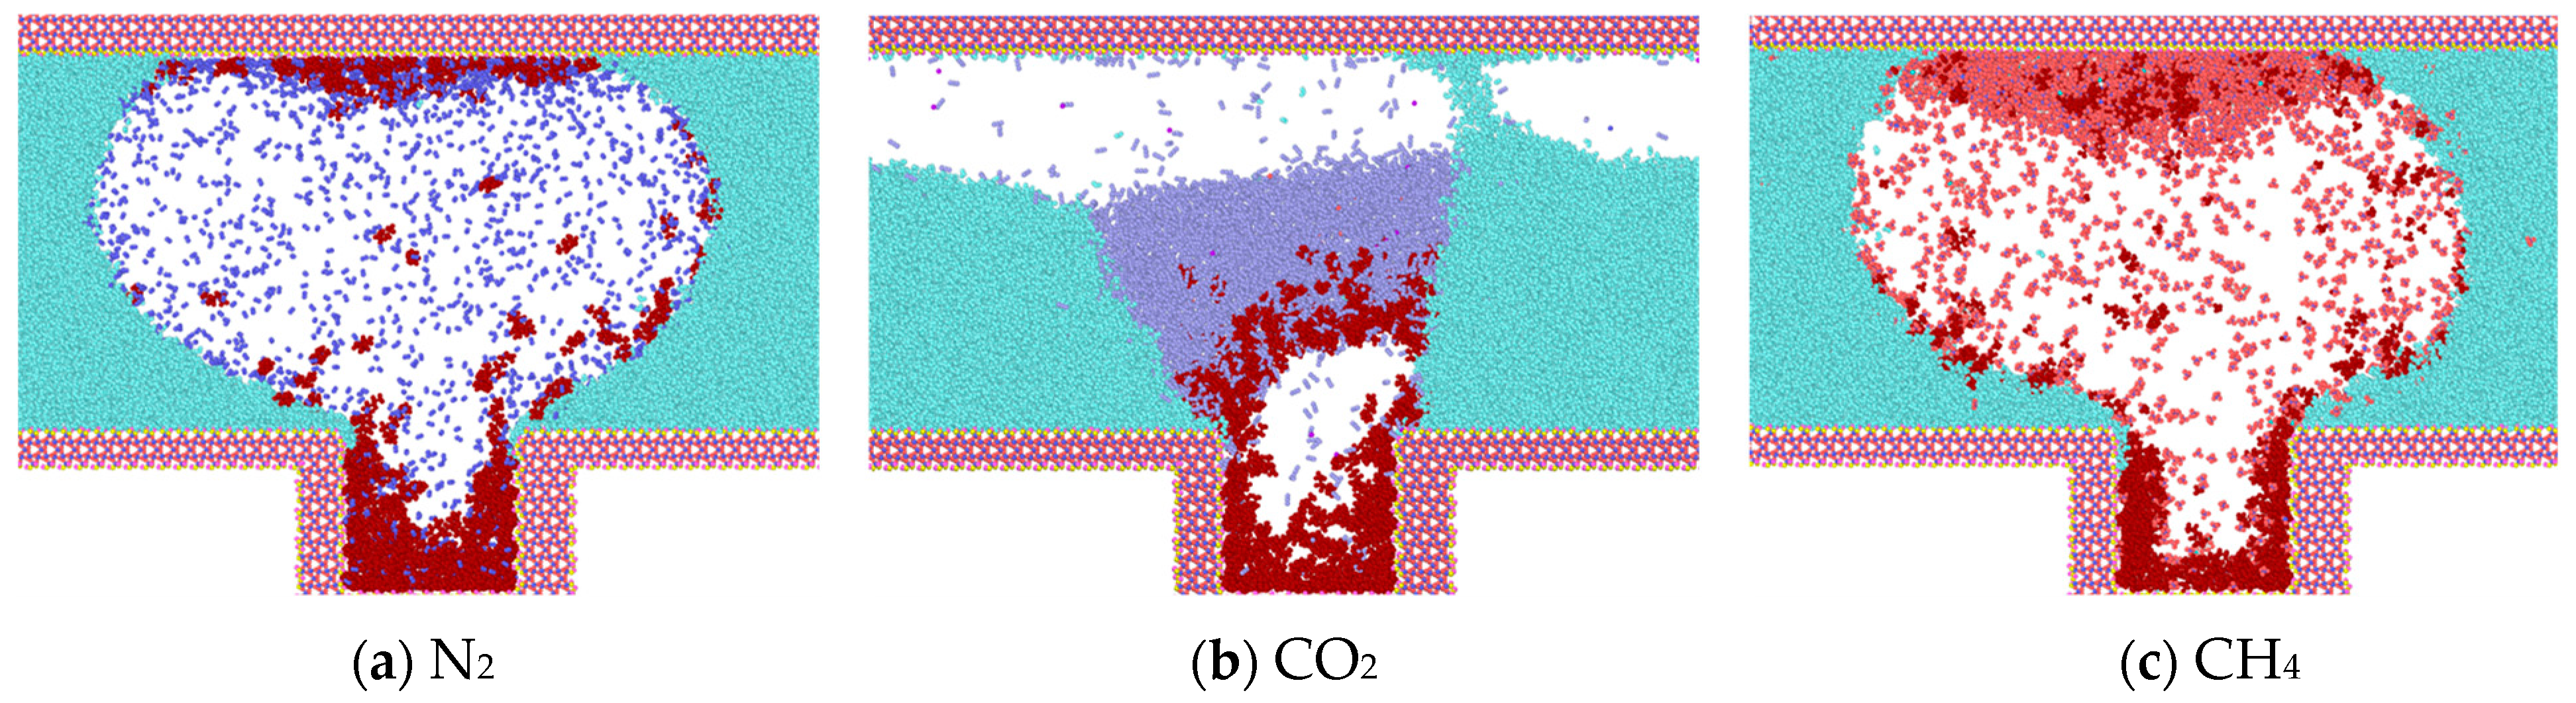
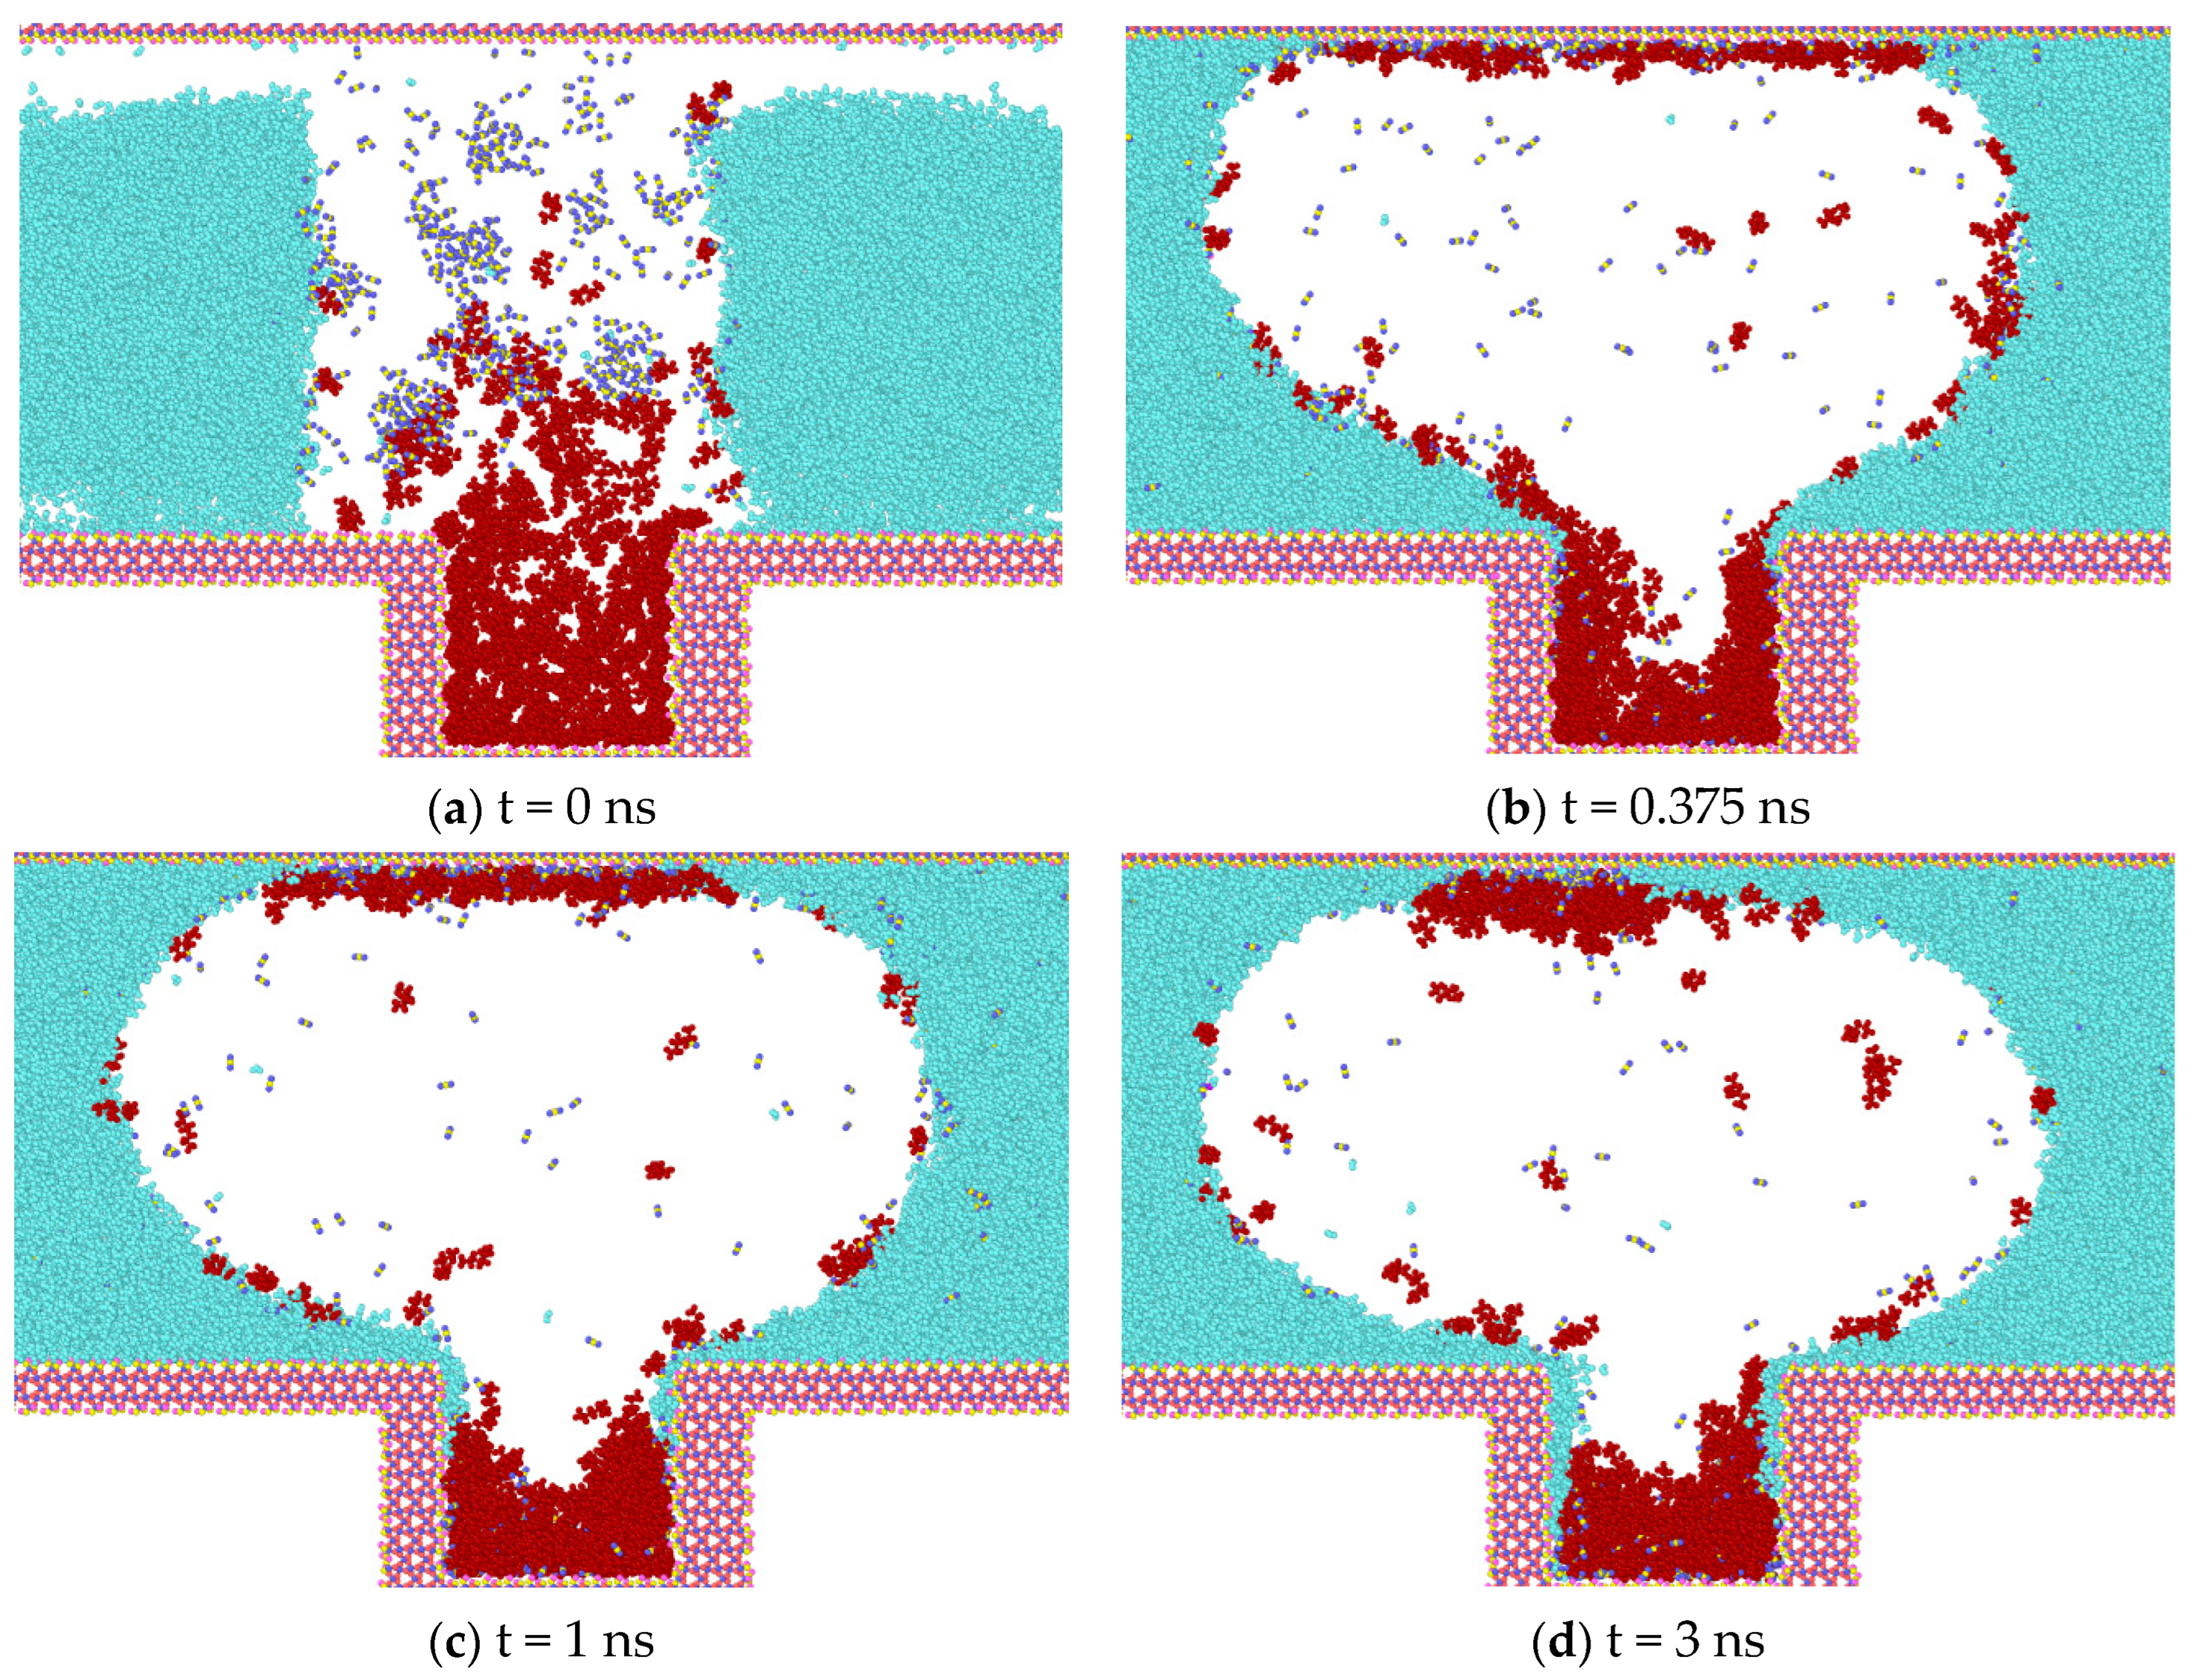
The results of the simulation of different gases on the molecules of heptane inside the blind end are presented and analyzed in Figure 5. It can be observed that with the onset of diffusion, gas molecules diffuse into the oil phase. CO2 exhibits a greater capacity to mix with the oil phase than N2 and CH4, which can be attributed to the fact that CO2 is in a supercritical state and has a higher density. However, the interaction between CO2 and heptane reduces the effect of heptane diffusion outward from the blind end.
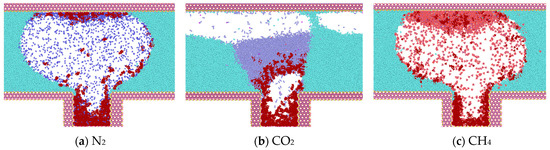
Figure 5.
Diffusion of gases at t = 0.375 ns (water in light blue, heptane in purple, N2 in dark blue, CO2 in purple, CH4 in red).
Following a 0.375 ns simulation, the heptane molecules are observed to diffuse from the blind end into the water-gas mixture. Concurrently, the oil phase undergoes a gradual decomposition, and the two gases N2 and CH4 carry some heptane molecules that are adsorbed in the upper wall surface. Initially, bubbles are formed between the two walls, indicating that a greater number of gas molecules are located in the center of the two walls. This phenomenon can be explained by the overlapping of the potential fields of the two opposing wall surfaces in the vicinity of the adsorbed molecules. The two opposing wall surfaces generate a spatially superimposed potential field that acts on the adsorbed molecules. This results in a significant adsorption potential energy for the gas molecules near the wall surfaces. As illustrated in Figure 5, the density distribution of CO2 is influenced by the phase transition, and concurrently, the interaction with heptane molecules is enhanced. The molecules are clustered and predominantly distributed in the center of the blind end. The magnitude of the diffusion coefficients of the gases in the initial 0.5 ns is calculated based on the mean-square displacements of the three gases. The diffusion coefficients of the gases are as follows: N2 (1.4 × 10⁻⁵) > CH4 (1.1 × 10⁻⁵) > CO2 (0.35 × 10⁻⁵).
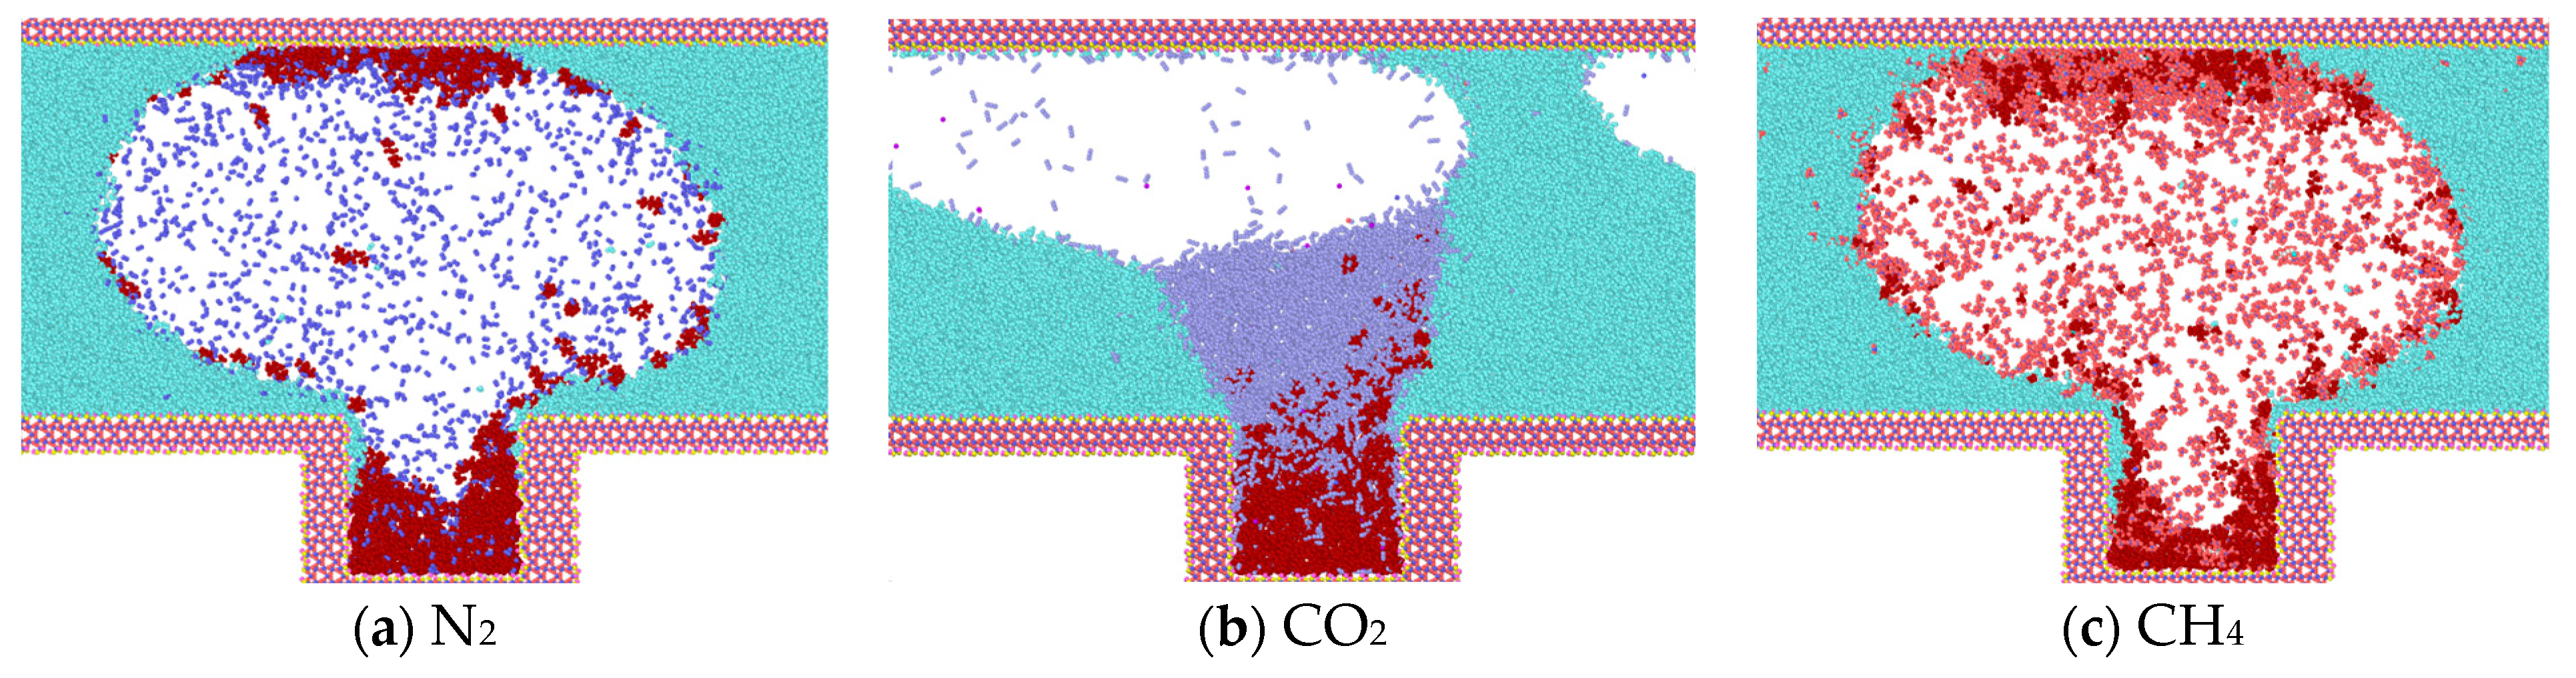
Upon reaching 1 ns (Figure 6), the simulation reveals that water molecules have begun to partially enter the blind end. Concurrently, a notable increase in heptane molecules diffusing out of the blind end is observed in models containing N2 and CH4, while a comparatively lesser influx of heptane molecules is evident in the CO2 model. In comparison to the data obtained at 0.375 ns, the number of gas molecules present at the blind end is as follows: The order of the gases in terms of their abundance is CO2 > CH4 > N2; the number of heptane molecules present at the blind end is as follows: The results show that the number of CO2 molecules entering the blind end is higher than that of N2 and CH4, and that the high degree of mixing of CO2 with heptane is favorable for the next step of expelling heptane from the pore. These findings align with the results of macroscopic fine tube experiments, which were conducted to determine the mixed phase of carbon dioxide and heptane under these conditions. Therefore, the application of supercritical carbon dioxide is conducive to the removal of residual oil in the blind end.
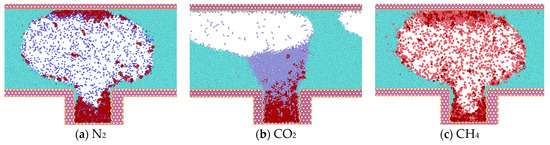
Figure 6.
Diffusion state of gas at t = 1 ns.
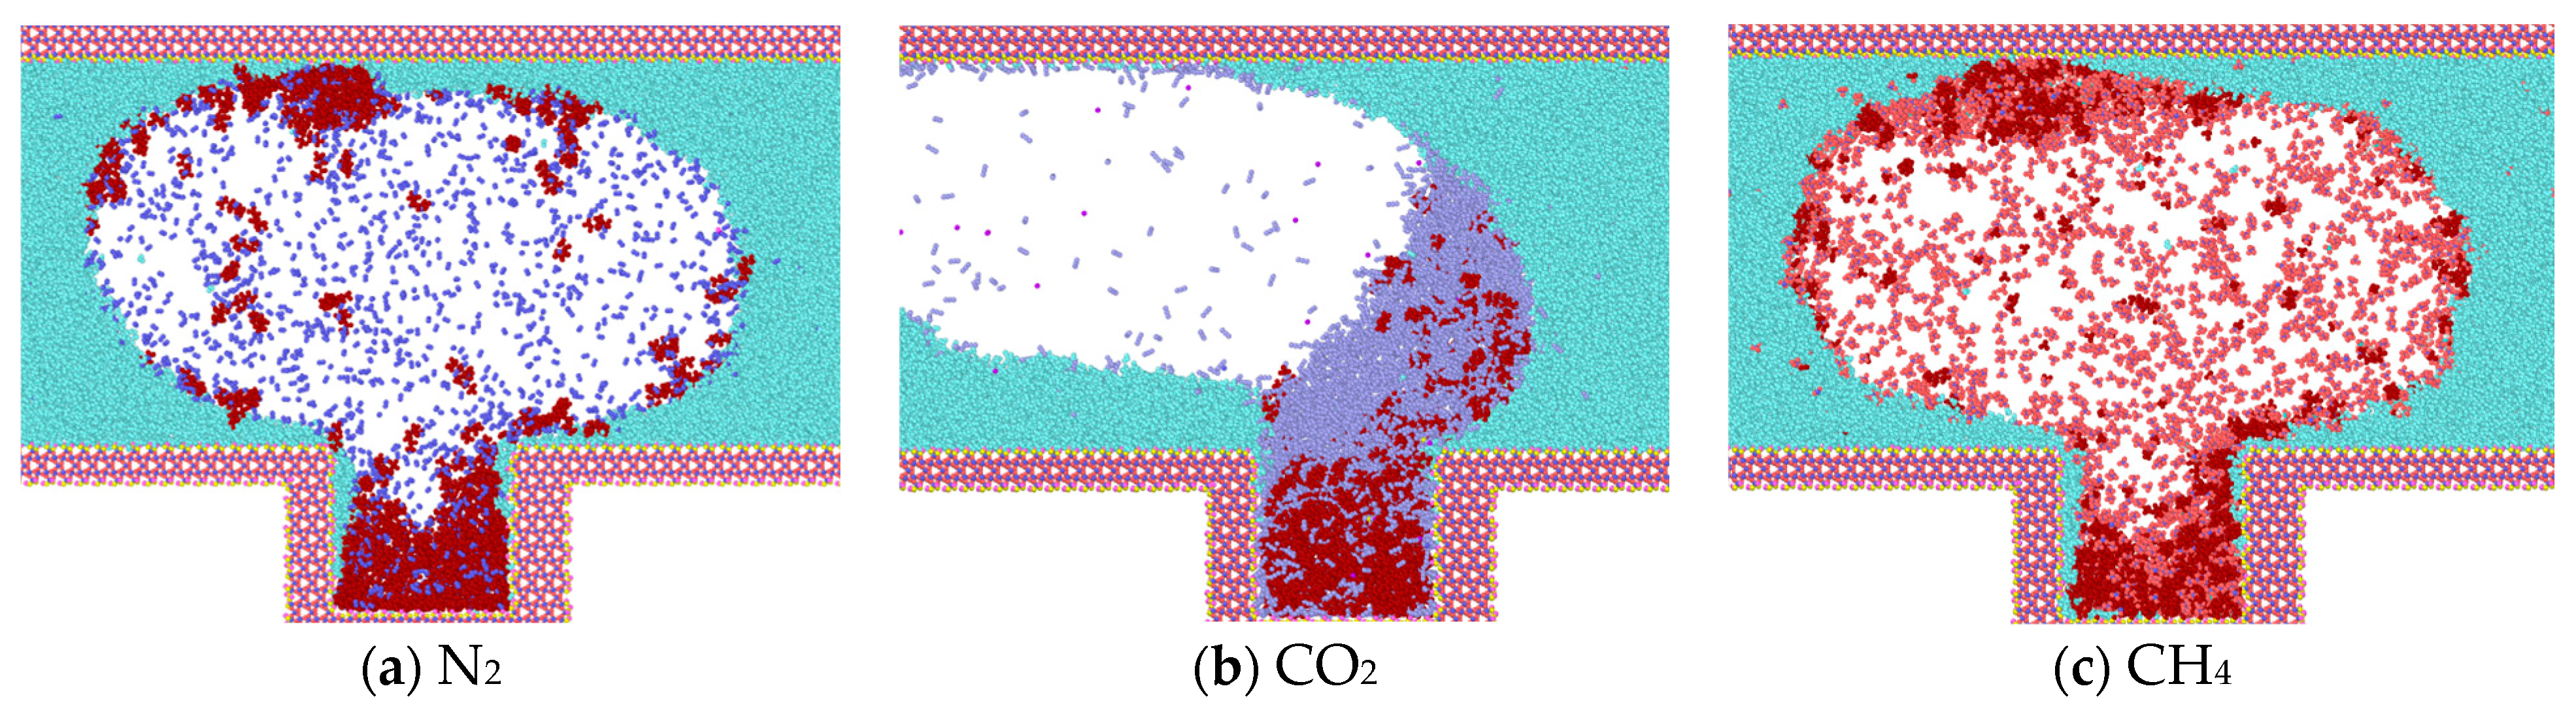
At the conclusion of the simulation (3 ns), CO2 molecules diffuse into the blind end and gradually intermingle with the heptane molecules, ultimately replacing them from the rock wall. This results in the formation of a mixed-phase state with the heptane molecules, accompanied by a reduction in the average spacing between the two types of molecules. This, in turn, leads to the division of the heptane into discontinuous phases, which causes its volume to expand, its density to decrease, and its viscosity to decline significantly (Figure 7b). In the model where CH4 and N2 gases are located, heptane is less dissolved, and the two gases in the blind end do not displace the heptane molecules on the wall, thereby preventing the formation of a mixed-phase state. In both systems, the displaced heptane is primarily located in the middle and upper regions of the blind end. It is more dispersed by the gas and distributed at the gas-liquid interface, which is related to the diffusion coefficient of the gas. Additionally, the heptane in the blind end is aggregated and adsorbed on the wall, resulting in a higher density on the wall. This makes it challenging for the gas to displace the heptane.
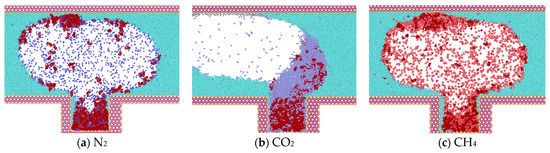
Figure 7.
Diffusion state of gas at t = 3 ns.
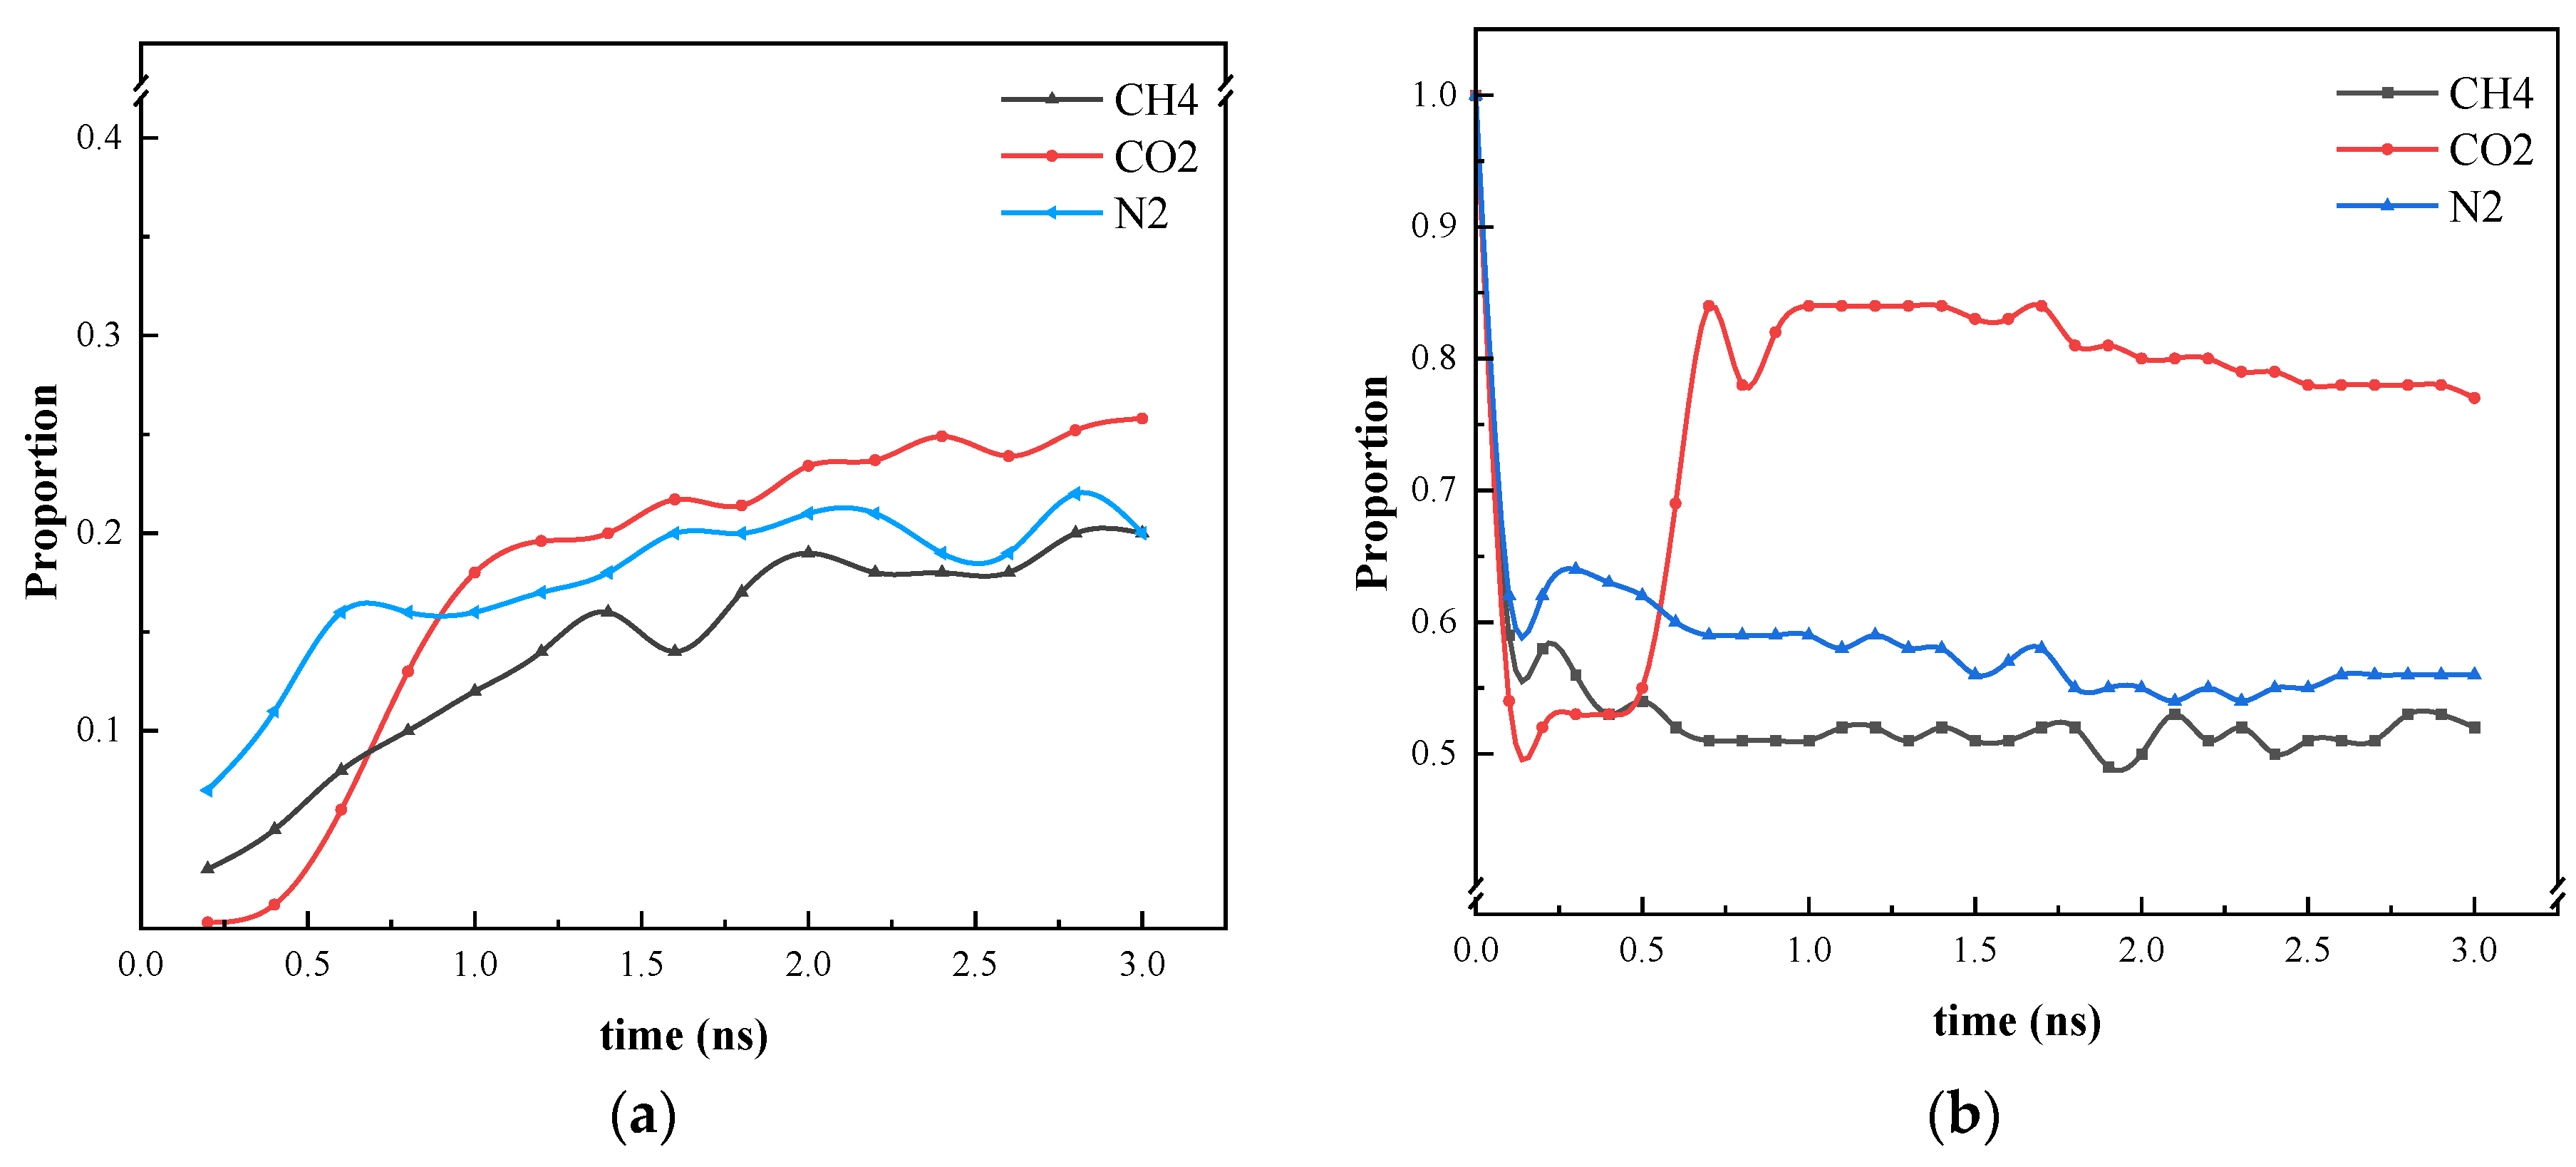
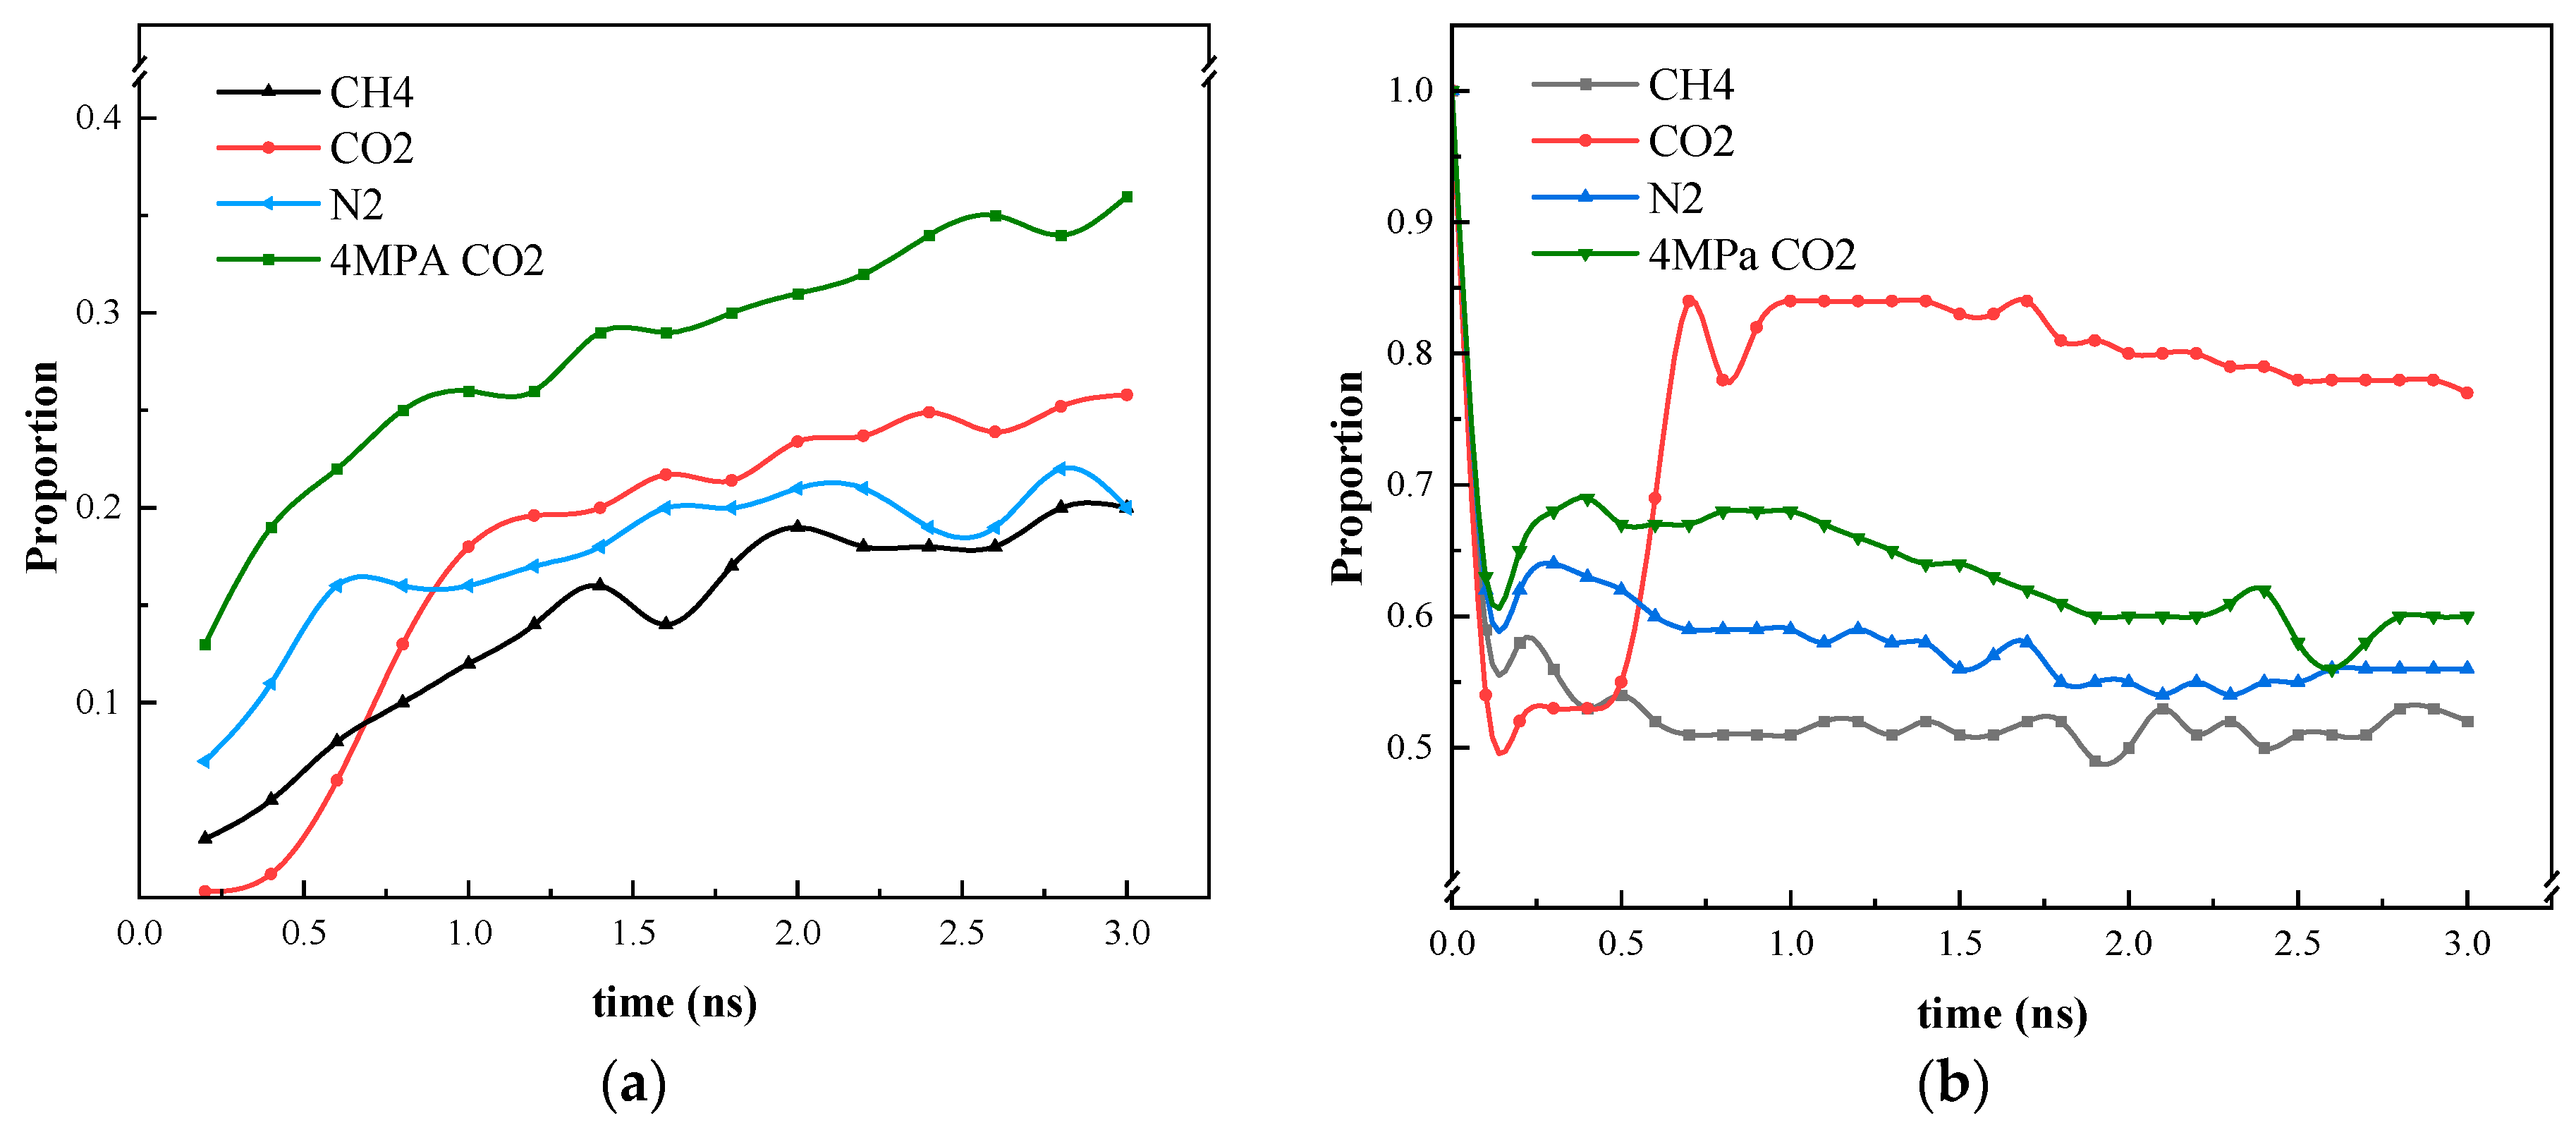
As illustrated in Figure 8, the ratio of CO2 gas molecules entering the blind end and the molecular weight of heptane in the blind end are markedly lower than those of the other two molecular simulation systems within 0.5 ns of the simulation. This is attributed to the stacking phenomenon of CO2 and heptane. After 0.5 ns, the stacked CO2 and heptane undergo a process of mixing and distribution in the blind end. Furthermore, the ratio of methane to nitrogen entering the blind end remains approximately constant at 2 ns. Nevertheless, the quantity of CO2 present in the blind end attains equilibrium at 3 ns, indicating that CO2 enters the blind end at a slower rate. As illustrated in Figure 8a, the proportion of molecules entering the blind end is markedly higher for CO2 than for the other two gases. Figure 8b illustrates that within the initial 0.2 ns of the reaction, the number of heptanes within the CO2 system’s blind end exhibits a more pronounced decline compared to CH4 and N2. At 0.25 ns, a density peak of heptane is observed in the blind end, accompanied by an increase in the number of heptane molecules. The formation of a stable “blocking layer” of gas molecules at the blind end, which has the effect of preventing heptane from entering, is not achieved. Instead, a small number of heptane molecules return to the blind end. At 0.5 ns, the CH4 and N2 system is initially stabilized. However, the CO2 molecules, when mixed with heptane, carry heptane into the blind end due to their interaction with the wall. As a result, the proportion of heptane in the blind end increases once more. Although the proportion of heptane in the blind end of the CO2 system is the largest at the conclusion of the diffusion simulation, Figure 7b illustrates that the CO2 molecules are mixed more uniformly with heptane. This is since the viscosity of heptane is lower, and the CO2 molecules replace almost all the heptane at the blind end of the wall, which is favorable for carrying it out in the oil displacement process. Consequently, this does not contradict the high efficiency of CO2 gas in oil displacement, as observed in the oil displacement experiments.
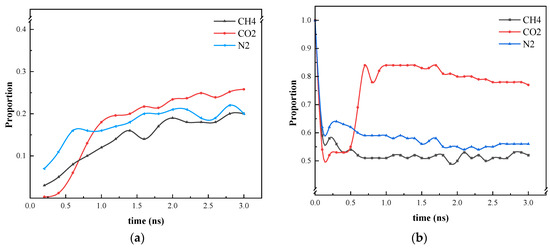
Figure 8.
Statistics on the position of three gas molecules and heptane molecules during the simulation process. (a) Proportion of gases entering the blind end; (b) Heptane in the blind end under gas diffusion conditions.
3.3. Effect of Different States of CO2 on Heptane Molecules Within the Blind Ends
In the above simulation, carbon dioxide is in the supercritical state. N2 and CH4 are in the gaseous state, thus at the same temperature and pressure; the supercritical CO2 impedes the diffusion of heptane molecules. However, it can be mixed with heptane more effectively and replace heptane from the blind end of the pore wall. The simulation conditions were modified to 4 MPa and 50 °C to observe the impact on heptane diffusion at this point. The same volume of CO2 as in the supercritical CO2 system was maintained in this model, and all other variables were held constant.
Figure 9 shows the four states of CO2 diffusion at 4 MPA. The gaseous state has less mixing ability with heptane, less contact with the oil phase, and more diffusion ability compared to CO2 in the supercritical state. This is because the distance between the molecules is greater in the gas state; the intermolecular forces are weaker and interact less with the heptane molecules, resulting in a reduced ability to dissolve heptane. CO2 in the gaseous state is less viscous than in the liquid state and the molecules can move and diffuse more freely, allowing for faster diffusion through the medium. In addition, wall adsorption occurs at low-pressure intensities. Compared to N2 and CH4, CO2 molecules have a certain polarity and are more likely to interact with the wall surface, resulting in more molecules adsorbed on the wall surface.
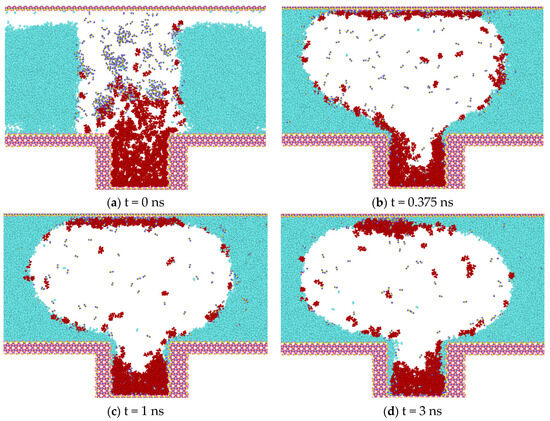
Figure 9.
Diffusion process of CO2 at 4 MPA.
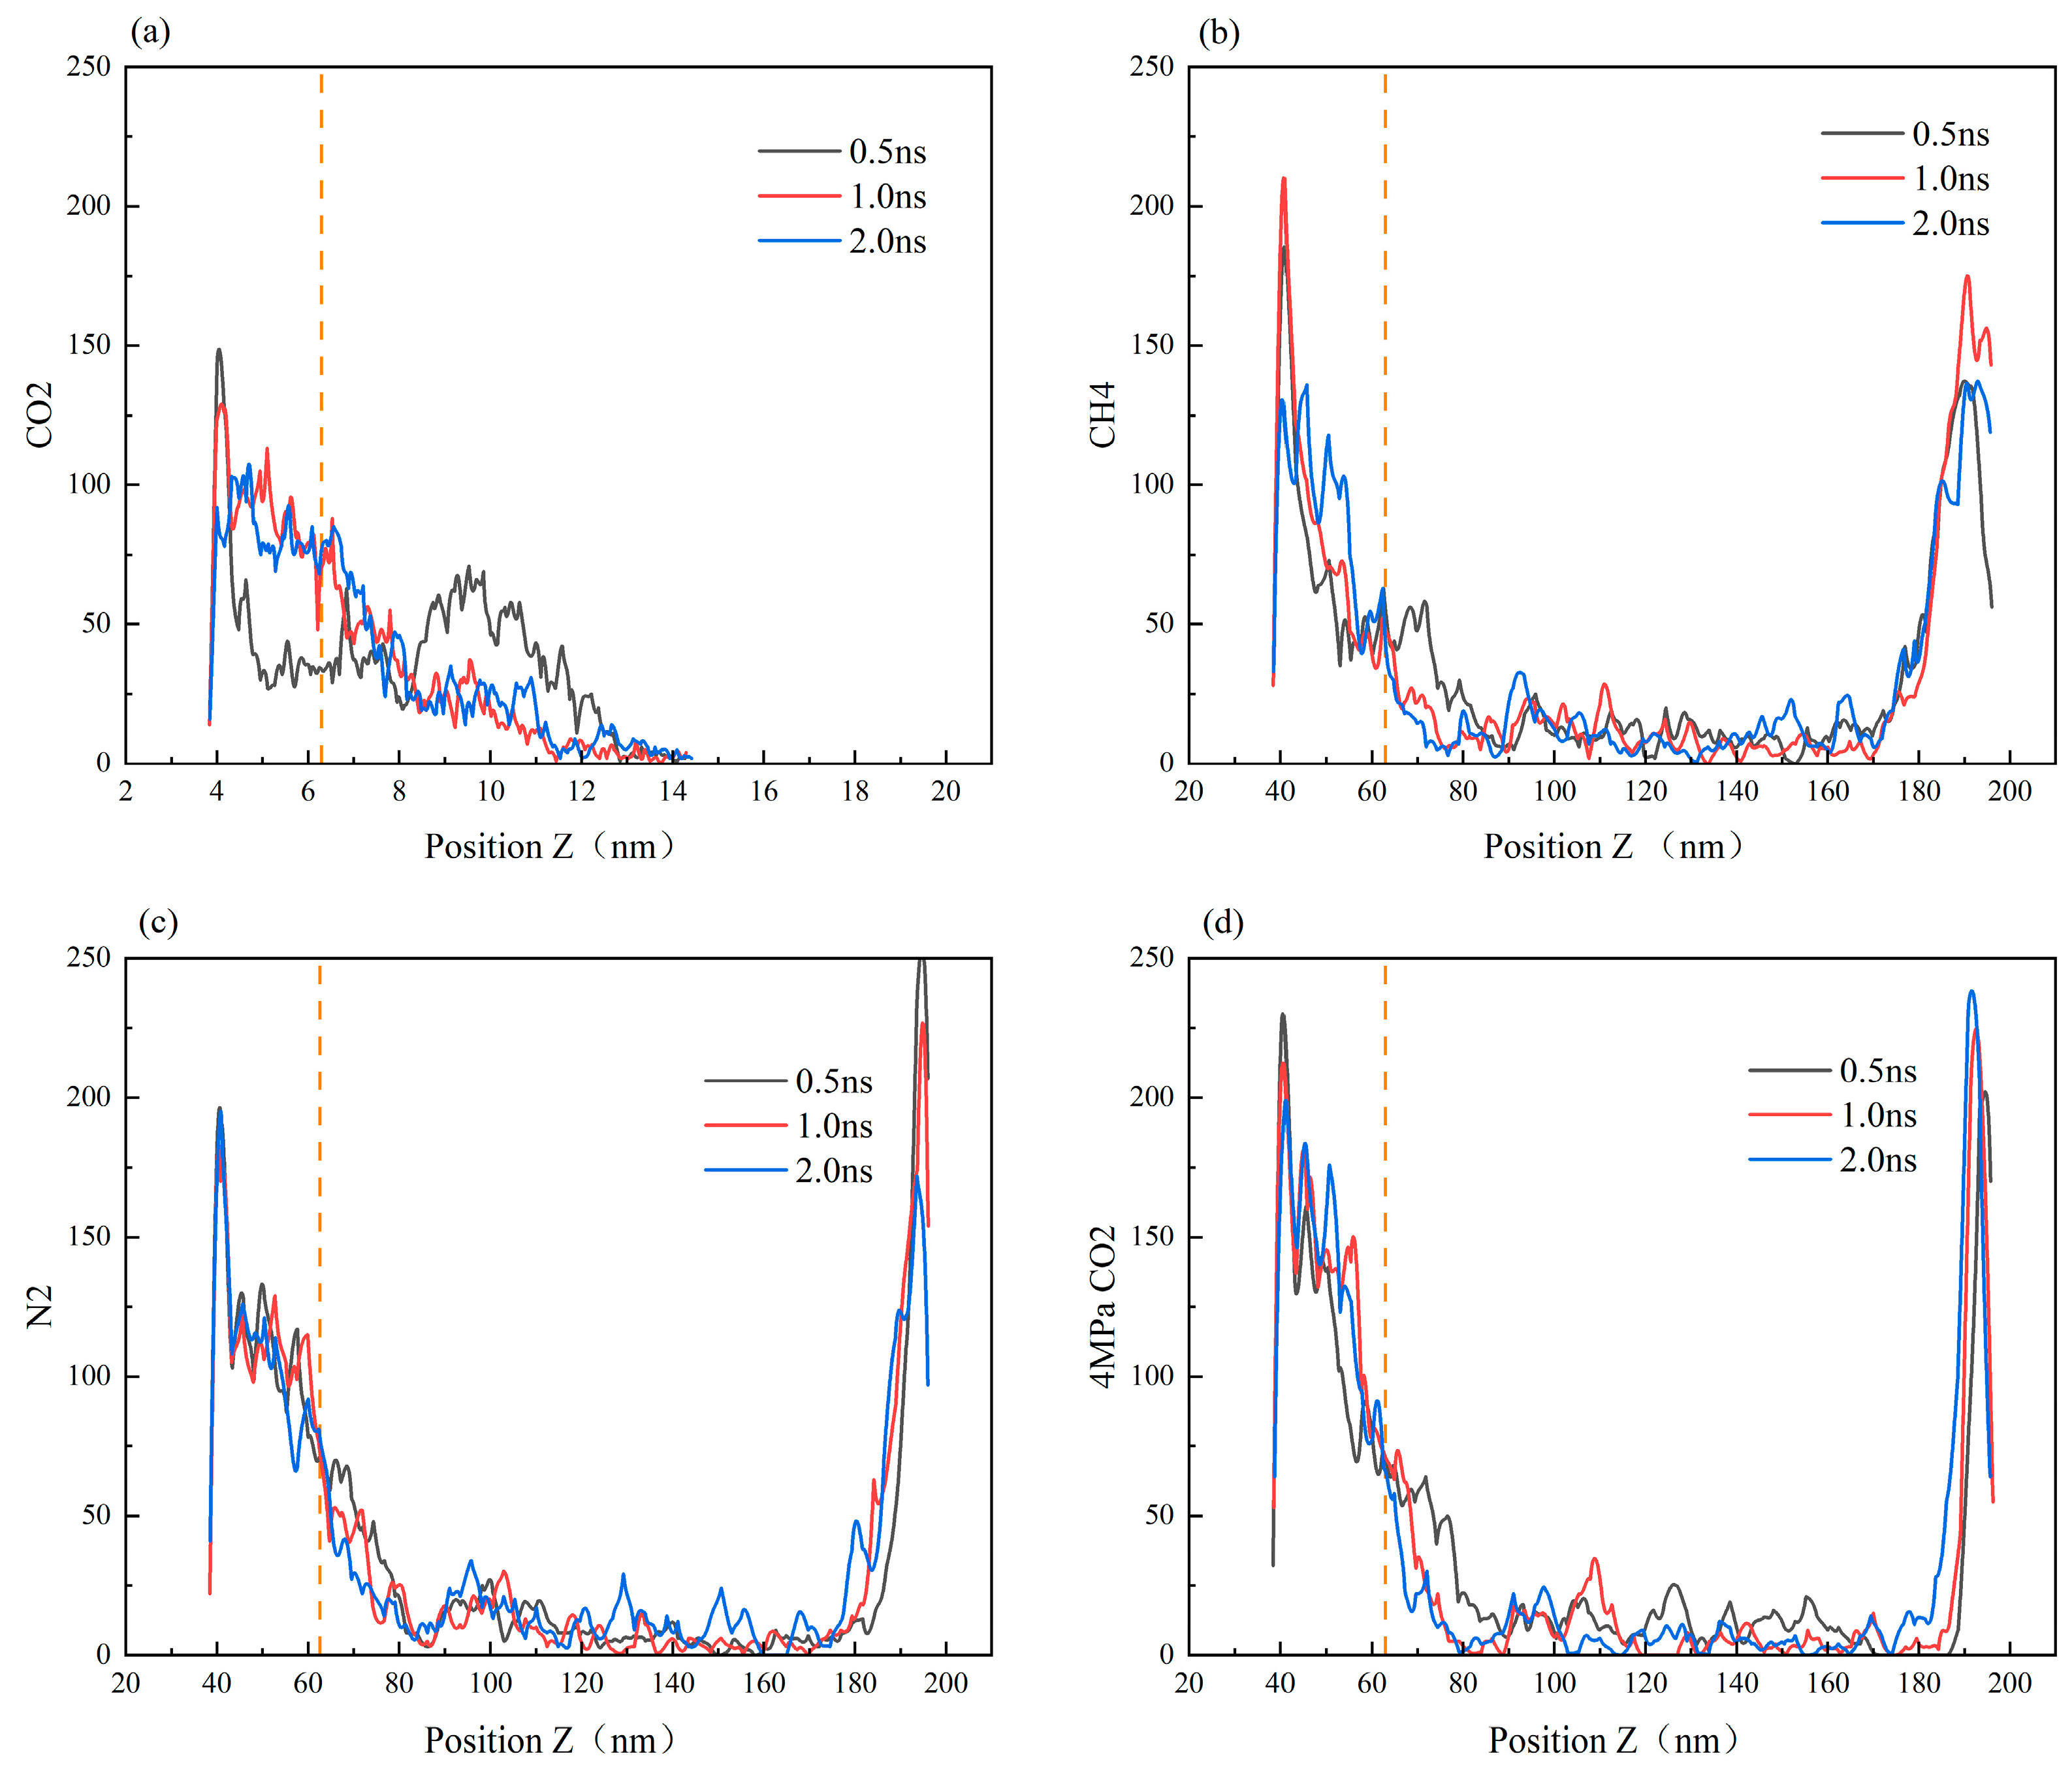
Figure 10 illustrates the distribution of heptane molecules on the SiO2 surface. In the scCO2 gas model, the number of heptane atoms at the bottom wall, i.e., at the smaller position of the Z-coordinate, decreases from 0.5 ns to 2.0 ns, with the number of atoms decreasing by approximately 80. This represents the largest decrease among the four simulation models, indicating that scCO2 has the strongest ability to displace heptane molecules from the wall surface. The CH4 and CO2 gas models at low pressure are the next most effective models, while the distribution of atoms at the lower wall remains largely unaltered in the N2 gas model. At this juncture, it becomes evident that the magnitude of the displacement capacity is as follows: scCO2 (30 MPa, 50 °C) > CH4 (30 MPa, 50 °C) > N2 (30 MPa, 50 °C) > CO2 (4 MPa, 50 °C).
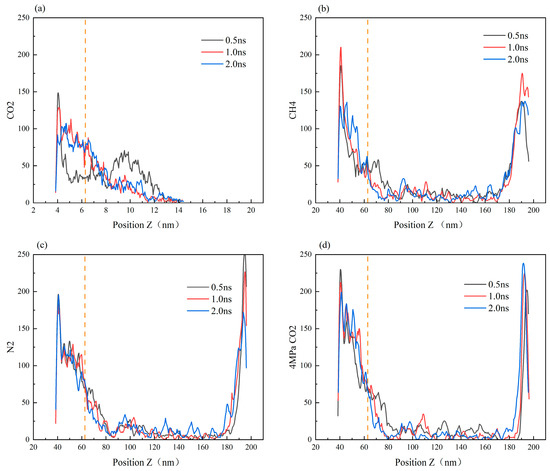
Figure 10.
Density distribution curve of the oil phase on the surface of SiO2 with time (the orange vertical line in the figure represents the height of the blind end).The diffusion of CO2 gas, CH4, N2, and 4 MPa CO2 in the SiO2 channel liquid atom model was studied, corresponding to (a–d) respectively.
At this juncture, the capacity of the four models to exert an influence on heptane was evaluated, as illustrated in Figure 11. In comparison to the other two gases, CO2 displays a greater capacity to enter the blind end, particularly in its gaseous form. However, CO2 exhibits a slower rate of entry than the other two gases. Furthermore, the capacity of CO2 to expel heptane molecules from the blind end is superior to that of N2 vs. CH4 due to the detachment of heptane molecules from the inner wall of the blind end because of CO2 entry and the high diffusivity of heptane. Although CO2 has a greater effect on the diffusion of heptane at low-pressure intensity, it is comparable to the diffusion of N2 and CH4 molecules, which remain in the gaseous state at this temperature and pressure. As illustrated in Figure 7 and Figure 9, the molecules are unable to dissolve heptane to form a mixed phase in a manner like CO2 in the supercritical state.
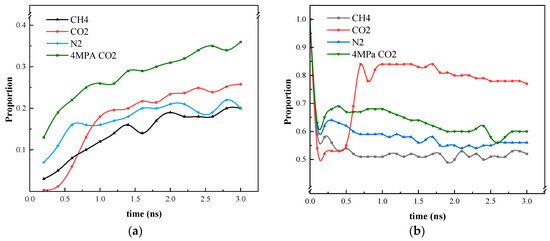
Figure 11.
Statistics on the position of gas molecules and heptane molecules during the simulation process. (a) Proportion of gases entering the blind end; (b) Heptane in the blind end under gas diffusion conditions.
3.4. Miscible Interface Between CO2 and Oil Phase
The interaction and diffusion phenomena between CO2 and heptane molecules in two states have been investigated above. The properties of the miscible interface are likely to be the key factor in these differences. By studying the miscible interface, we can gain a deeper understanding of the mechanisms underlying the ability of CO2 in the supercritical state to mix with heptane, as well as the contrasting behavior of CO2 in the gaseous state, which exhibits reduced solubility but enhanced diffusion ability. An in-depth examination of the miscible interface can facilitate the elucidation of the microscopic processes that govern these phenomena.
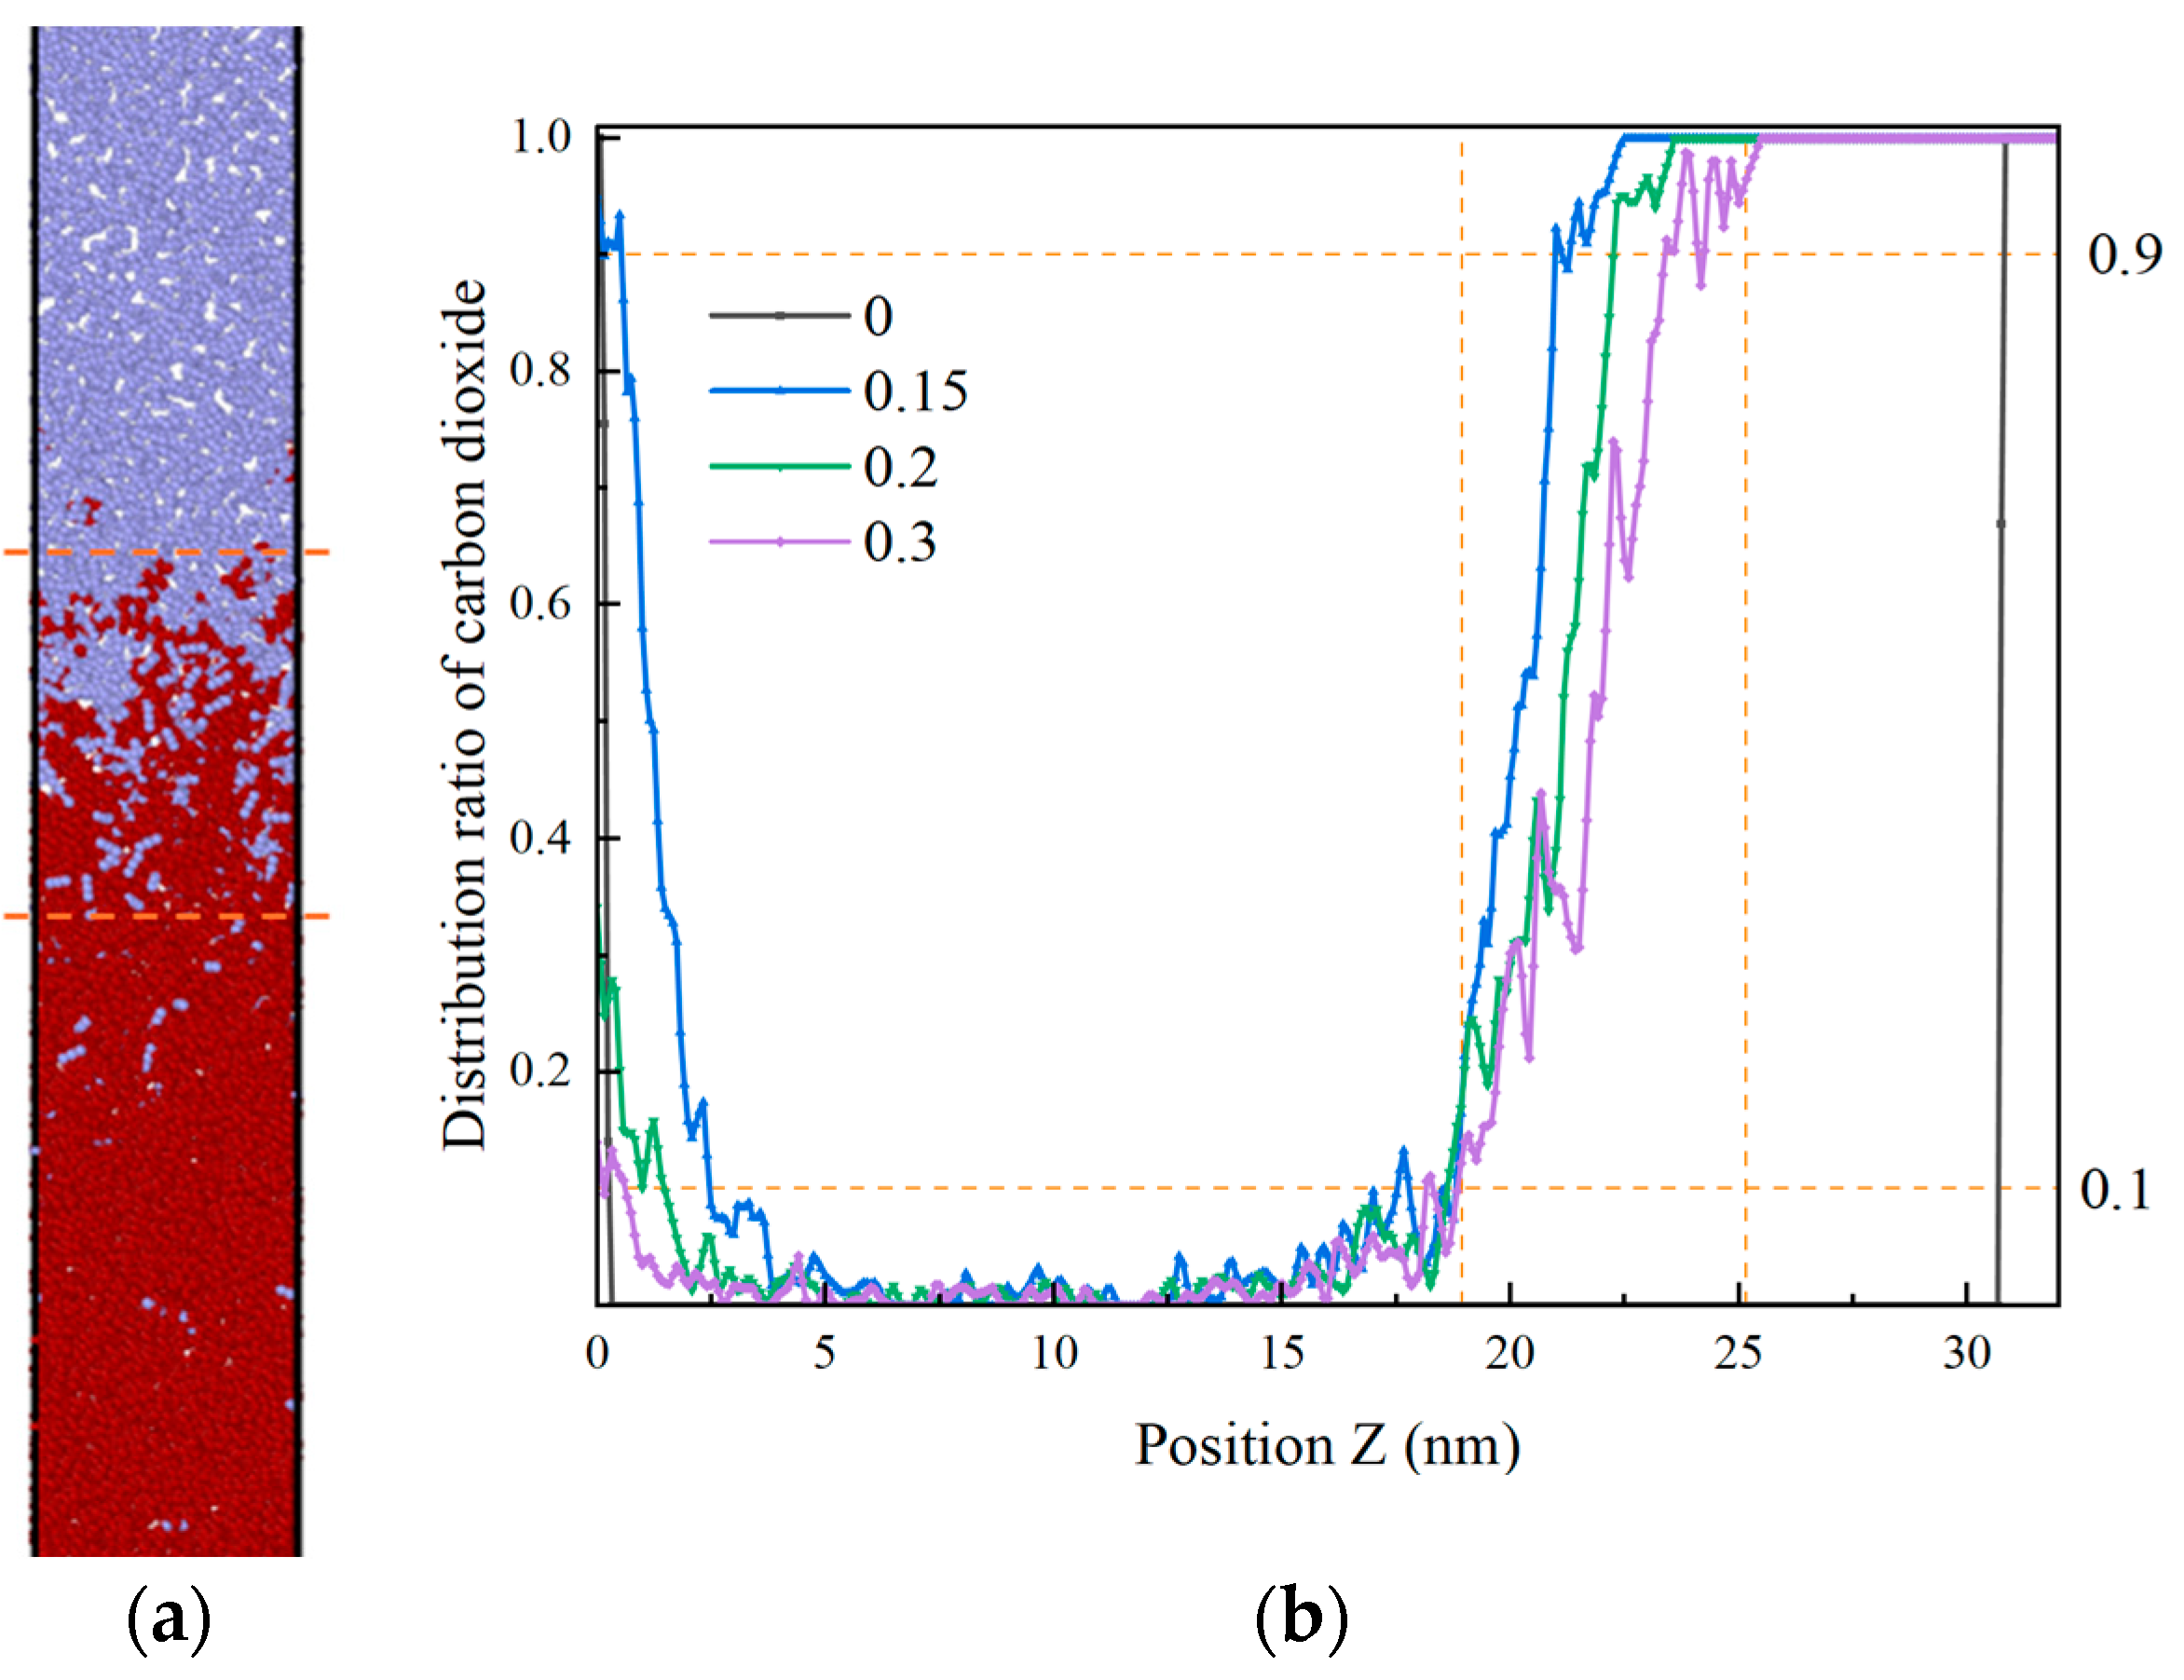
This section presents a comprehensive investigation into the diffusive behavior of carbon dioxide and heptane under conditions of 30 MPa and 25 °C. To provide a more detailed description and facilitate a deeper understanding of the displacement and miscibility processes, the proportion of the distribution of carbon dioxide along the Z-direction of the atoms to the total atoms in the simulation chamber was calculated at different times. The diffusion process was found to be divided into three stages. The initial 0–0.3 ns period is characterized by rapid miscibility, followed by a slower miscibility phase between 0.3 and 1.0 ns, and finally a stabilization stage between 1.0 and 3.0 ns. The interface in proximity to the carbon dioxide undergoes changes within the 0.3–1.0 ns interval, as illustrated in Figure 12. The interface undergoes slight alterations between 0.0 and 1.0 ns, after which it reaches a stable state between carbon dioxide and heptane within 3 ns. This state is maintained without external interference between 3 ns and 6 ns.
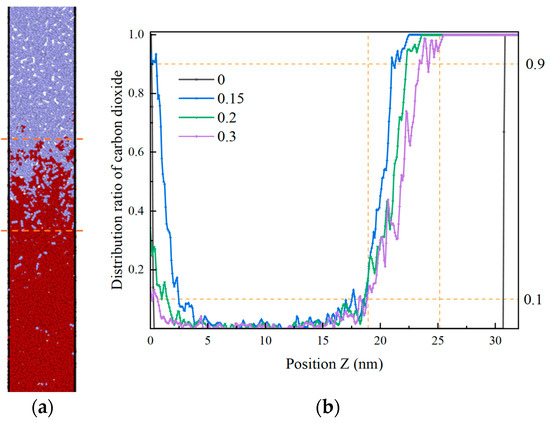
Figure 12.
Proportion of CO2 atoms distributed along the Z-direction in 0.3 ns (miscible interface between the orange dashed lines in the left panel, and CO2 proportions from 0.9 to 0.1 in the right panel, the range of miscible interfaces). (a) t = 0.3 ns; (b) Proportion of CO2 distribution along the Z-direction in 0.3 ns.
In the interval of 0–0.15 nanoseconds, CO2 exerts a downward force on heptane, causing it to expand and attain an initial equilibrium state at 0.15 nanoseconds. Subsequently, within the interval of 0.15 to 0.3 nanoseconds, the CO2 molecules commence their movement from the interface to the interior of the oil phase. At the boundary, the amount of CO2 undergoes a pronounced decrease. At this juncture, the proportion of CO2 at the same position exhibits a decline on average every 1 ns in the mixing zone, as evidenced by the following values: 2.4 (0.15–0.2), 1.1 (0.2–0.3). At 0.3 ns, the interface exhibits a thickness of 4.6 nm.
Within 0.3–1.0 ns, the proportion of CO2 fluctuates and decreases, as illustrated in Figure 13. The clustered heptane molecules are gradually dispersed, the volume of heptane expands, and CO2 mixes with heptane within a certain distance. At this time, the proportion of CO2 in the same position decreases in the mixing zone by an average of 0.073 per 1 ns, and the thickness of the interface is 6.4 nm at 0.9 ns. In the time frame of 1 to 3 nanoseconds, the movement of CO2 in the same position undergoes a gradual and consistent change, resulting in a reduction in the proportion present in the mixing zone by an average of …: This equates to 0.0139 per 1 ns. Within the 3–6 ns interval, the proportion of CO2 distribution in the Z direction undergoes a gradual alteration, with the interface thickness reaching 6.5 ± 3 nm at 3 ns. Upon elevating the ambient temperature of the model beyond 6 ns, it was observed that the velocity of CO2 molecule motion accelerated, facilitating their mixing with heptane molecules and consequently leading to an expansion of the interface thickness. This phenomenon, therefore, exhibited an enhancement following the intensification of the perturbation.
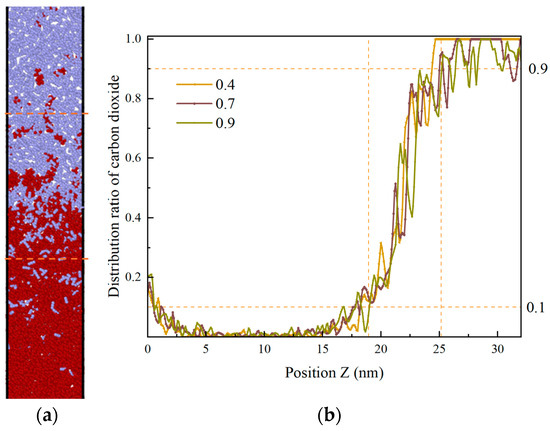
Figure 13.
Proportion of CO2 atoms distributed along the Z-direction in 1.0 ns. The range of 0.1–0.9 for the proportion of distributed CO2 atoms is approximately the miscible region, delimited by the orange dashed lines. (a) t = 0.9 ns; (b) Proportion of CO2 distribution along the Z-direction in 1.0 ns.
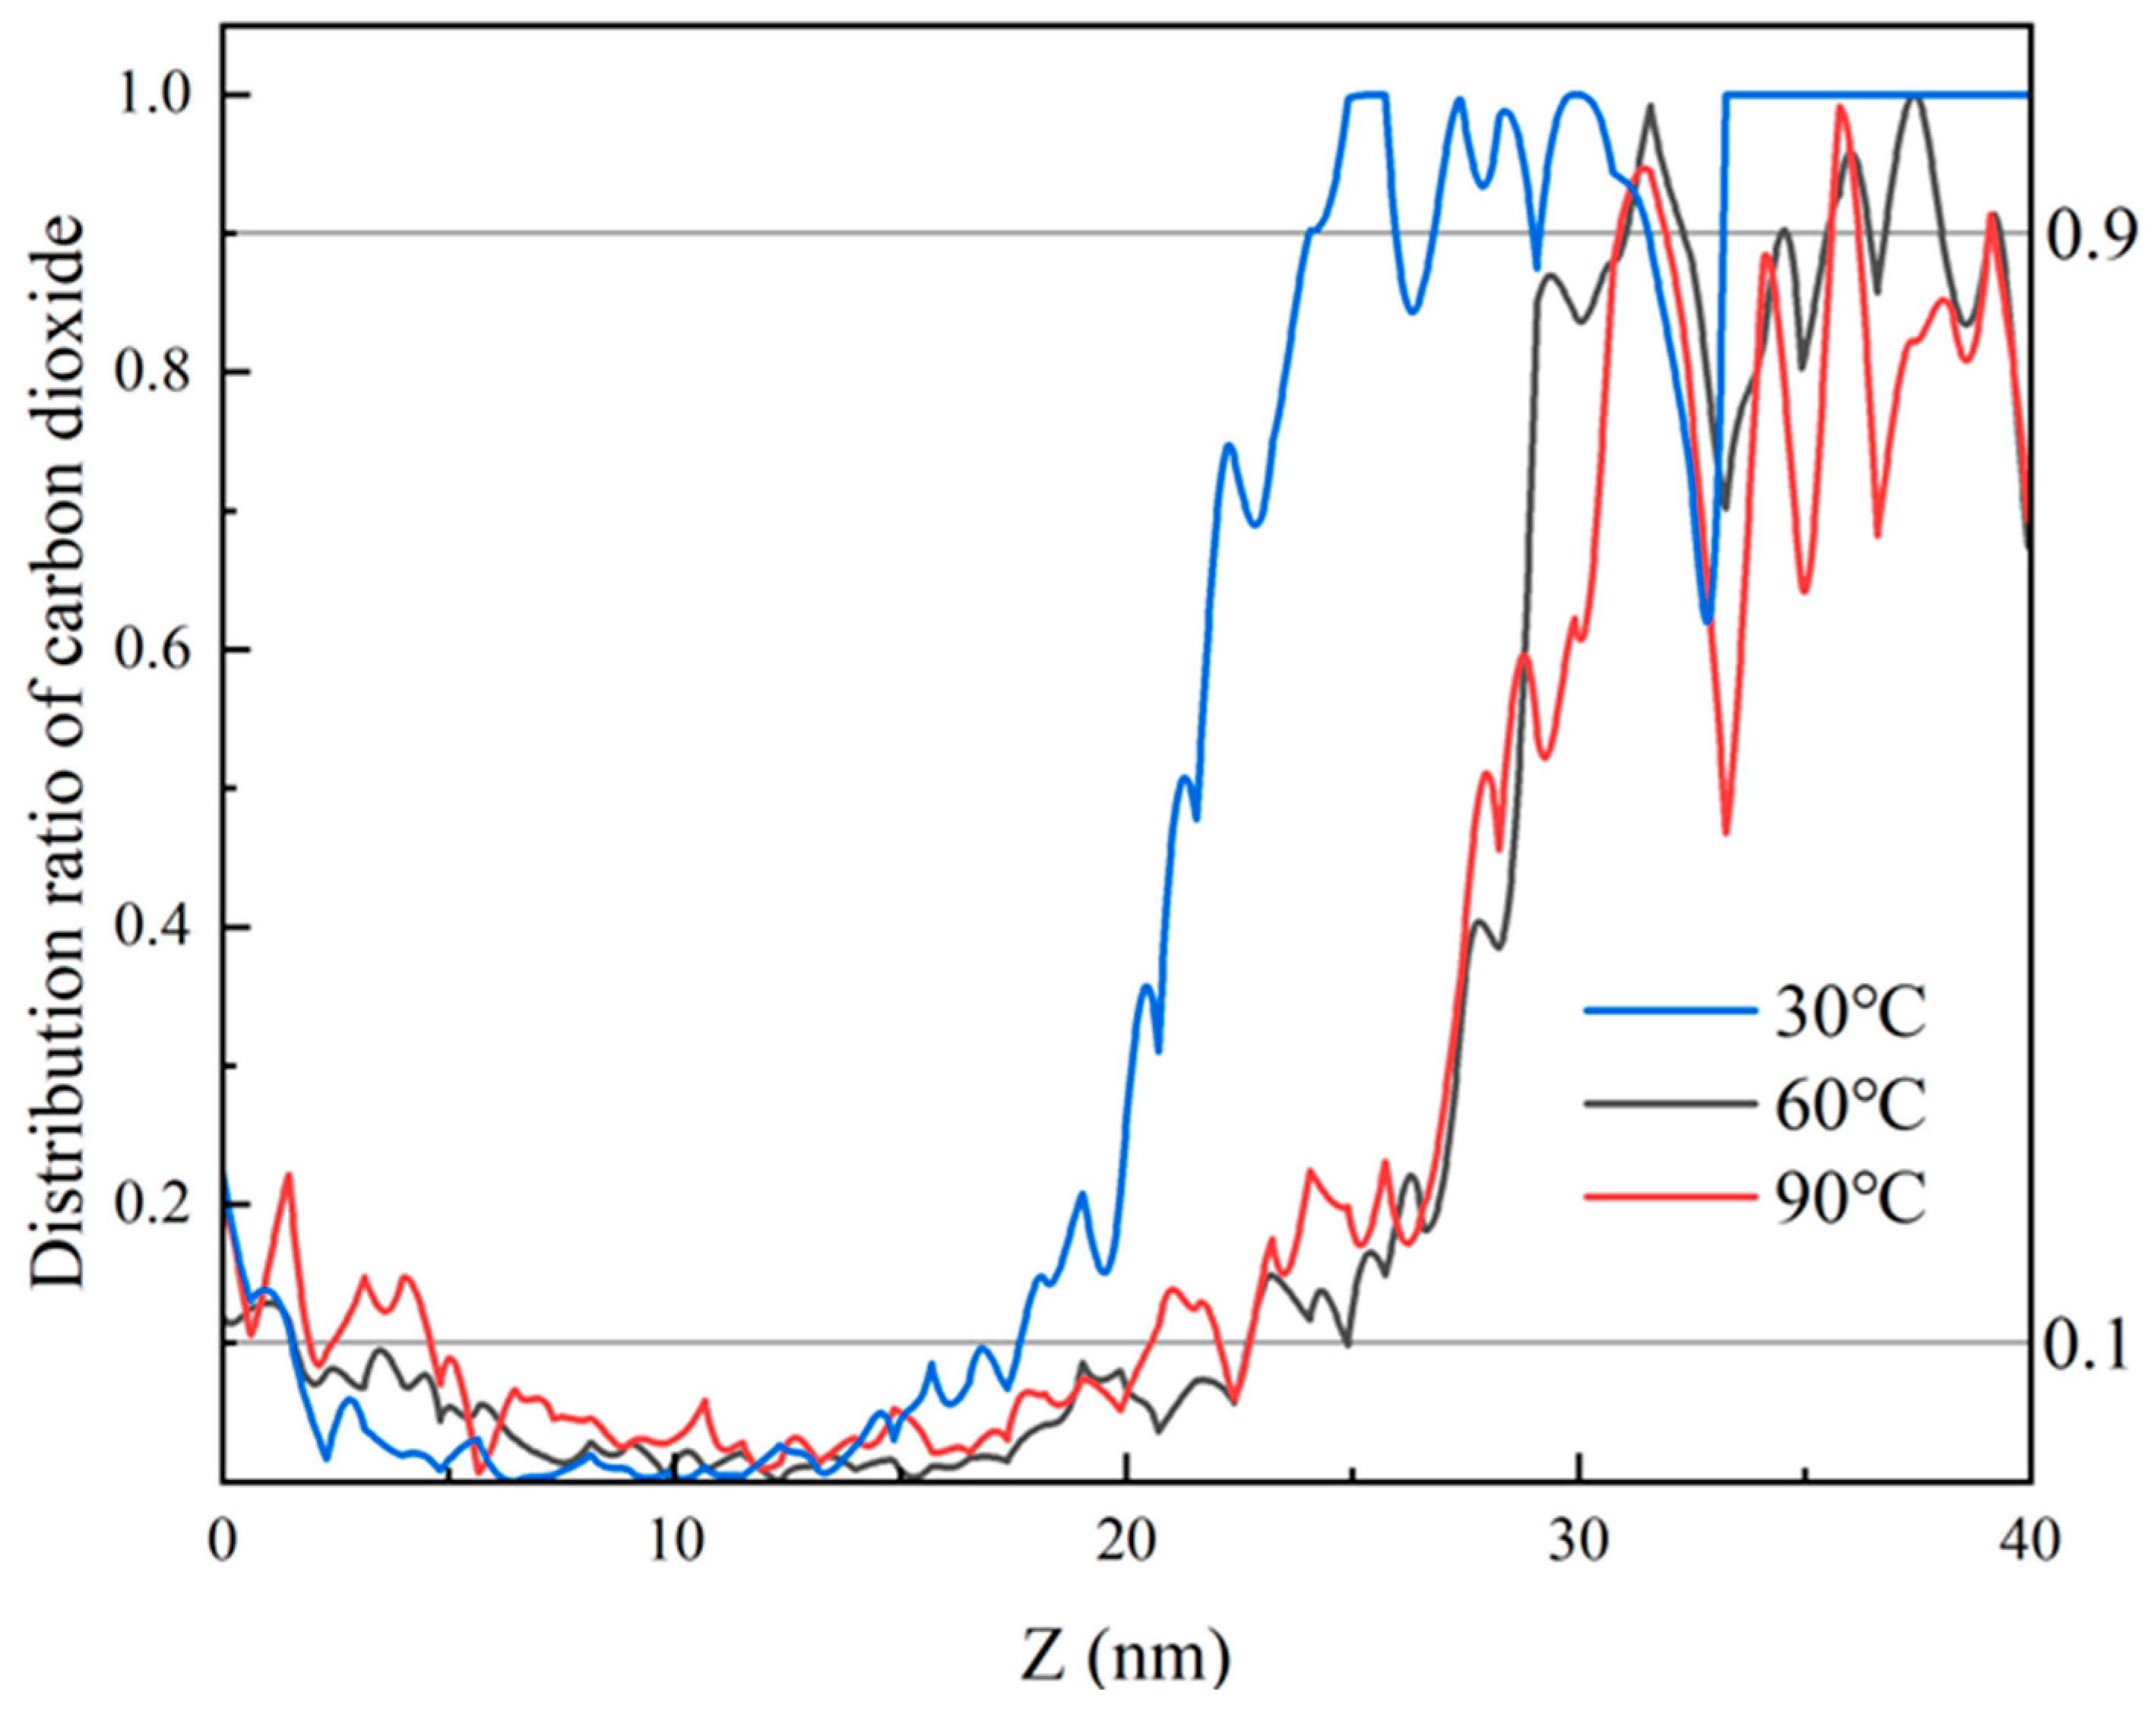
The temperature and pressure of systems F and G are defined as supercritical at 60 °C and 15 MPa, and 90 °C and 35 MPa, respectively. The same volume is modeled with a gap of 5 A remaining in the central void. For system F, the model contains 2432 carbon dioxide molecules, with an interface thickness of 6 nm after 3 ns; for system G, there are 2869 carbon dioxide molecules, with an interface thickness of 19 nm after 3 ns, as shown in Figure 14.

Figure 14.
Proportion of CO2 atom distribution along the Z-direction for different states at 3 ns.
By employing the following equation to calculate the energy of each component at 3 ns, the magnitude of the interaction energy for different systems can be obtained. The results indicate that Model E (−2255.9) has the highest energy, followed by Model F (−2652.5) and Model G (−3175.0).
Eint = EA-B − (EA + EB )
In the above equation EA-B: the total energy of A-B assemblage; EA: energy of individual A in the assemblage; EB: the energy of individual B in the assemblage; Eint: the energy of interaction between A and B.
It can be observed that as the density of the carbon dioxide phase increases, its interaction with heptane also increases in the same volume model. In other words, the density increases, the interaction energy increases, and the thickness of the interface between the two phases increases. Consequently, as previously stated, the density of CO2 is larger in the supercritical state, and its interaction with the oil phase is significant. Furthermore, due to the fact that the blind end occupies only 45 A in the z-axis direction, it reaches a miscible state with heptane in the blind end.
4. Conclusions
This paper presents the findings of a molecular dynamics simulation investigation into the diffusion phenomena of N2/CH4/CO2 in heptane-containing SiO2 blind ends. The impact of CO2 on heptane at varying pressures and temperatures was examined, and the miscibility of CO2 with heptane in distinct states was evaluated. The following conclusions were drawn:
(1) Diffusion at 50 °C and 30 MPa can achieve initial stabilization within one nanosecond, and the interface remains unaltered for a period of three nanoseconds. During the process of diffusion, the formation of bubbles was observed. The inner surface of the bubble contains a minor quantity of free heptane, with some heptane present at the junction between the bubble and the water. The majority of the water molecules are situated outside the bubble, removing the heptane clusters that have been adsorbed on the upper wall, and a small number of water molecules enter the blind end along the wall. Upon completion of the diffusion process, residual heptane remains present at the blind end.
(2) The diffusion phenomena of the CO2 system and the N2/CH4 system at 50 °C and 30 MPa exhibit distinct characteristics. In the N2/CH4 system, the gas forms symmetric bubbles within the pore, whereas in the CO2 system, supercritical CO2 accumulates in the center of the pore. The degree of heptane diffusion in the blind end is consistent with the size of the gas diffusion coefficient. The order of the gases in terms of their diffusion coefficients is N2 > CH4 > CO2; after the end of diffusion, the majority of the heptane in the N2/CH4 system remains adsorbed at the blind end. In contrast, CO2 can displace the heptane adsorbed on the wall surface in the CO2 system, and the two gases can become miscible, which significantly reduces the viscosity of the heptane and facilitates the subsequent increase in its exclusion degree. Furthermore, the diffusion effect of CO2 in the gaseous state is greater than that of the N2/CH4/CO2 system. CO2 in the gaseous state can replace part of the heptane at the blind end wall, and its replacement capacity is less than that of CO2 in the miscible state and greater than that of the other two gases. This demonstrates that CO2 has a greater capacity for displacement than other gases.
(3) The simulation results demonstrate that, under the three specified conditions, the denser CO2 interacts more with heptane, facilitating its displacement from the wall in the blind end. This indicates that the mixing effect with heptane is enhanced.
The aforementioned understanding offers a theoretical foundation at the molecular level for the selection of the gas phase and the replacement state in the water-gas dispersion system, oil repulsion, and the comprehension of the oil repulsion process in the blind end.
Author Contributions
Conceptualization, Y.W. and X.C.; Methodology, X.C.; Software, Y.W.; Validation, Y.W., X.C. and N.L.; Formal analysis, Y.W.; Investigation, Y.W.; Resources, Y.W.; Data curation, Y.W.; Writing—original draft preparation, Y.W. and H.Q.; Writing—review and editing, N.L.; Visualization, Y.W.; Supervision, X.C.; Project administration, X.C.; Funding acquisition, X.C. All authors have read and agreed to the published version of the manuscript.
Funding
This research was funded by the China National Petroleum Corporation, grant number 2023ZZ0410. The APC was funded by the same corporation (China National Petroleum Corporation).
Data Availability Statement
The original contributions presented in this study are included in the article. Further inquiries can be directed to the corresponding author.
Acknowledgments
This work is partially supported by the China National Petroleum Corporation Major Special Project “Research on Multi Element Gas Drive to Improve Oil Recovery” (2023ZZ0410).
Conflicts of Interest
The authors declare that they have no known competing financial interests or personal relationships that could have appeared to influence the work reported in this paper.
References
- You, Q.; Wang, H.; Zhang, Y.; Liu, Y.; Fang, J.; Dai, C. Experimental study on spontaneous imbibition of recycled fracturing flow-back fluid to enhance oil recovery in low permeability sandstone reservoirs. J. Pet. Sci. Eng. 2018, 166, 375–380. [Google Scholar] [CrossRef]
- Wei, J.; Zhou, X.; Zhou, J.; Li, J.; Wang, A. Experimental and simulation investigations of carbon storage associated with CO2 EOR in low-permeability reservoir. Int. J. Greenh. Gas Control 2021, 104, 103203. [Google Scholar] [CrossRef]
- Terry, R.E. Enhanced oil recovery. In Encyclopedia of Physical Science and Technology; Elsevier: Amsterdam, The Netherlands, 2000. [Google Scholar]
- Hashemi-Kiasari, H.; Hemmati-Sarapardeh, A.; Mighani, S.; Mohammadi, A.H.; Sedaee-Sola, B. Effect of operational parameters on SAGD performance in a dip heterogeneous fractured reservoir. Fuel 2014, 122, 82–93. [Google Scholar] [CrossRef]
- Antolinez, J.D.; Miri, R.; Nouri, A. In situ combustion: A comprehensive review of the current state of knowledge. Energies 2023, 16, 6306. [Google Scholar] [CrossRef]
- Mahinpey, N.; Ambalae, A.; Asghari, K. In situ combustion in enhanced oil recovery (EOR): A review. Chem. Eng. Commun. 2007, 194, 995–1021. [Google Scholar] [CrossRef]
- Muraza, O.; Galadima, A. Aquathermolysis of heavy oil: A review and perspective on catalyst development. Fuel 2015, 157, 219–231. [Google Scholar] [CrossRef]
- Djimasbe, R.; Ilyasov, I.R.; Kwofie, M.; Khelkhal, M.A.; Emelianov, D.A.; Al-Muntaser, A.A.; Suwaid, M.A.; Varfolomeev, M.A. Direct hydrogen production from extra-heavy crude oil under supercritical water conditions using a catalytic (Ni-Co/Al2O3) upgrading process. Catalysts 2022, 12, 1183. [Google Scholar] [CrossRef]
- Lourdes, R.S.; Cheng, S.Y.; Chew, K.W.; Ma, Z.; Show, P.L. Prospects of microbial enhanced oil recovery: Mechanisms and environmental sustainability. Sustain. Energy Technol. Assess. 2022, 53, 102527. [Google Scholar] [CrossRef]
- Tavakkoli, O.; Kamyab, H.; Shariati, M.; Mohamed, A.M.; Junin, R. Effect of nanoparticles on the performance of polymer/surfactant flooding for enhanced oil recovery: A review. Fuel 2022, 312, 122867. [Google Scholar] [CrossRef]
- Niu, J.; Liu, Q.; Lv, J.; Peng, B. Review on microbial enhanced oil recovery: Mechanisms, modeling and field trials. J. Pet. Sci. Eng. 2020, 192, 107350. [Google Scholar] [CrossRef]
- Romero-Zerón, L. (Ed.) Introduction to Enhanced Oil Recovery (EOR) Processes and Bioremediation of Oil-Contaminated Sites; BoD—Books on Demand: Norderstedt, Germany, 2012. [Google Scholar]
- Patel, J.; Borgohain, S.; Kumar, M.; Rangarajan, V.; Somasundaran, P.; Sen, R. Recent developments in microbial enhanced oil recovery. Renew. Sustain. Energy Rev. 2015, 52, 1539–1558. [Google Scholar] [CrossRef]
- Crawford, P.B.; Reynolds, B.; Rushing, M.D.; Thomassom, B. Nitrogen may be used for Miscible Displacement in Oil Reservoirs. J. Pet. Technol. 1978, 30, 1715–1716. [Google Scholar] [CrossRef]
- Guo, H.; Dong, J.; Wang, Z.; Liu, H.; Ma, R.; Kong, D.; Wang, F.; Xin, X.; Li, Y.; She, H. EOR Survey in China-Part 1. In Proceedings of the SPE Improved Oil Recovery Conference, Tulsa, OK, USA, 14–18 April 2018; Volume 10. [Google Scholar]
- Al-Riyami, H.F.; Kamali, F.; Hussain, F. Effect of gravity on near-miscible CO2 flooding. In Proceedings of the SPE Kingdom of Saudi Arabia Annual Technical Symposium and Exhibition, Dammam, Saudi Arabia, 24–27 April 2017. [Google Scholar]
- Hudgins, D.A.; Llave, F.M.; Chung, F.T. Nitrogen Miscible Displacement off Light Crude Oil: A Laboratory Study. SPE Reserv. Eng. 1990, 5, 100–106. [Google Scholar] [CrossRef]
- Duiveman, M.W.; Herwin, H.; Grivot, P. Integrated management of water, lean gas, and air injection: The successful ingredients to EOR projects on the mature Handil Field. In Proceedings of the SPE Asia Pacific Oil and Gas Conference and Exhibition, Jakarta, Indonesia, 5–7 April 2005; p. SPE-93858. [Google Scholar]
- Janssen, M.T.; Azimi, F.; Zitha, P.L. Immiscible nitrogen flooding in bentheimer sandstones: Comparing gas injection schemes for enhanced oil recovery. In Proceedings of the SPE Improved Oil Recovery Conference, Tulsa, OK, USA, 14–18 April 2018; p. D041S021R002. [Google Scholar]
- Skauge, A.; Stensen, J.Å. Review of WAG field experience. In Proceedings of the Oil Recovery—2003, 1st International Conference and Exhibition, Modern Challenges in Oil Recovery, Moscow, Russia, 19–23 May 2003; Gubkin University: Moscow, Russia, 2003; pp. 19–23. [Google Scholar]
- Yang, T.Y.; Zhang, Y.; Yang, Z.; Ting, C. Mechanism of enhanced oil recovery by CO2 flooding in tight sandstone reservoirs. Sci. Technol. Eng. 2019, 19, 113–118. [Google Scholar]
- Liu, N.; Chen, X.; Ju, B.; He, Y.; Yang, Y.; Brantson, E.T.; Tian, Y. Microbubbles generation by an orifice spraying method in a water-gas dispersion flooding system for enhanced oil recovery. J. Pet. Sci. Eng. 2021, 198, 108196. [Google Scholar] [CrossRef]
- Zhang, J.; Zhang, Y.; Yuan, L.; Chen, M.; Song, Y. Dynamic adsorption of CO2 in different sized shale organic pores using molecular dynamic simulations under various pressures. Energy Fuels 2021, 35, 15950–15961. [Google Scholar] [CrossRef]
- Li, X.; Wang, P.; Yan, Z.; Yu, S.; Wei, K.; Zhu, X.; Sun, Y.; Xue, Q. The miscible behaviors of C3H8/C8H18 (C7H17N) system in nanoslits: Effects of pore size and rock surface wettability. Chem. Eng. J. 2022, 431, 133988. [Google Scholar] [CrossRef]
- Wang, R.; Peng, F.; Song, K.; Feng, G.; Guo, Z. Molecular dynamics study of interfacial properties in CO2 enhanced oil recovery. Fluid Phase Equilibria 2018, 467, 25–32. [Google Scholar] [CrossRef]
- Santos, M.S.; Franco, L.F.; Castier, M.; Economou, I.G. Molecular dynamics simulation of n-alkanes and CO2 confined by calcite nanopores. Energy Fuels 2018, 32, 1934–1941. [Google Scholar] [CrossRef]
- Fang, T.; Zhang, Y.; Ding, B.; Yan, Y.; Zhang, J. Static and dynamic behavior of CO2 enhanced oil recovery in nanoslits: Effects of mineral type and oil components. Int. J. Heat Mass Transf. 2020, 153, 119583. [Google Scholar] [CrossRef]
- Liu, B.; Li, X.; Qi, C.; Mai, T.; Zhan, K.; Zhao, L.; Shen, Y. Pressure-driven supercritical CO2 transport through a silica nanochannel. RSC Adv. 2018, 8, 1461–1468. [Google Scholar] [CrossRef] [PubMed]
- Li, S.; Pan, Y.; Yang, S.; Li, Z. A molecular insight into the mechanism of organic molecule detachment by supercritical CO2 from a water invasion calcite surface: Effect of water film and molecular absorbability. Geoenergy Sci. Eng. 2023, 231, 212290. [Google Scholar] [CrossRef]
- Bhadran, V.; Goharzadeh, A.; Fatt, Y.Y. Experimental study of oil recovery by water alternating gas (WAG) process in microporous media. J. Phys. Conf. Ser. 2019, 1276, 012023. [Google Scholar] [CrossRef]
- Belazreg, L.; Mahmood, S.M. Water alternating gas incremental recovery factor prediction and WAG pilot lessons learned. J. Pet. Explor. Prod. Technol. 2020, 10, 249–269. [Google Scholar] [CrossRef]
- Yu, H.; Ma, D.; Li, S.; Ji, Z.; Chen, X.; Zhang, K. Experimental study of enhance oil recovery by water-gas dispersion flooding system. Sci. Technol. Eng. 2013, 13, 9946–9949. [Google Scholar]
- Luan, Y.; Liu, B.; Hao, P.; Zhan, K.; Liu, J. Oil displacement by supercritical CO2 in a water cut dead-end pore: Molecular dynamics simulation. J. Pet. Sci. Eng. 2020, 188, 106899. [Google Scholar] [CrossRef]
- Wang, S.; Javadpour, F.; Feng, Q. Molecular dynamics simulations of oil transport through inorganic nanopores in shale. Fuel 2016, 171, 74–86. [Google Scholar] [CrossRef]
- Fang, T.; Wang, M.; Gao, Y.; Zhang, Y.; Yan, Y.; Zhang, J. Enhanced oil recovery with CO2/N2 slug in low permeability reservoir: Molecular dynamics simulation. Chem. Eng. Sci. 2019, 197, 204–211. [Google Scholar] [CrossRef]
- Sun, H.; Sun, W.; Zhao, H.; Sun, Y.; Zhang, D.; Qi, X.; Li, Y. Adsorption properties of CH4 and CO2 in quartz nanopores studied by molecular simulation. RSC Adv. 2016, 6, 32770–32778. [Google Scholar] [CrossRef]
- Jin, Z.; Firoozabadi, A. Effect of water on methane and carbon dioxide sorption in clay minerals by Monte Carlo simulations. Fluid Phase Equilibria 2014, 382, 10–20. [Google Scholar] [CrossRef]
- Xiong, J.; Liu, K.; Liu, X.; Liang, L.; Zeng, Q. Molecular simulation of methane adsorption in slit-like quartz pores. RSC Adv. 2016, 6, 110808–110819. [Google Scholar] [CrossRef]
- Liu, B.; Qi, C.; Zhao, X.; Teng, G.; Zhao, L.; Zheng, H.; Zhan, K.; Shi, J. Nanoscale two-phase flow of methane and water in shale inorganic matrix. J. Phys. Chem. C 2018, 122, 26671–26679. [Google Scholar] [CrossRef]
- Zhang, W.; Feng, Q.; Wang, S.; Xing, X. Oil diffusion in shale nanopores: Insight of molecular dynamics simulation. J. Mol. Liq. 2019, 290, 111183. [Google Scholar] [CrossRef]
- Long, H.; Lin, H.F.; Yan, M.; Bai, Y.; Tong, X.; Kong, X.G.; Li, S.G. Adsorption and diffusion characteristics of CH4, CO2, and N2 in micropores and mesopores of bituminous coal: Molecular dynamics. Fuel 2021, 292, 120268. [Google Scholar] [CrossRef]
- Wang, S.; Zhou, G.; Ma, Y.; Gao, L.; Song, R.; Jiang, G.; Lu, G. Molecular dynamics investigation on the adsorption behaviors of H2O, CO2, CH4 and N2 gases on calcite (1 1 0) surface. Appl. Surf. Sci. 2016, 385, 616–621. [Google Scholar] [CrossRef]
- Li, C.; Pu, H.; Zhong, X.; Li, Y.; Zhao, J.X. Interfacial interactions between Bakken crude oil and injected gases at reservoir temperature: A molecular dynamics simulation study. Fuel 2020, 276, 118058. [Google Scholar] [CrossRef]
- Li, X.; Wang, P.; Wang, S.; Feng, Q.; Xue, Q. Dynamics and miscible behaviors of hydrocarbon gas and crude oil in nanoslits: Effects of light gas type and crude oil components. Chem. Eng. J. 2021, 405, 127012. [Google Scholar] [CrossRef]
- Wang, P.; Li, X.; Tao, Z.; Wang, S.; Fan, J.; Feng, Q.; Xue, Q. The miscible behaviors and mechanism of CO2/CH4/C3H8/N2 and crude oil in nanoslits: A molecular dynamics simulation study. Fuel 2021, 304, 121461. [Google Scholar] [CrossRef]
- Yan, Y.; Jia, Z.; Geng, X.; Liang, D.; Hao, X.; Yang, Z.; Ding, B. Insight into miscibility mechanism of multiple components crude oil in CO2/CH4 by molecular dynamic simulation. J. Mol. Liq. 2024, 398, 124283. [Google Scholar] [CrossRef]
- Hong, X.; Yu, H.; Xu, H.; Wang, X.; Jin, X.; Wu, H.; Wang, F. Competitive adsorption of asphaltene and n-heptane on quartz surfaces and its effect on crude oil transport through nanopores. J. Mol. Liq. 2022, 359, 119312. [Google Scholar] [CrossRef]
- Wu, G.; He, L.; Chen, D. Sorption and distribution of asphaltene, resin, aromatic and saturate fractions of heavy crude oil on quartz surface: Molecular dynamic simulation. Chemosphere 2013, 92, 1465–1471. [Google Scholar] [CrossRef] [PubMed]
- Jorgensen, W.L.; Maxwell, D.S.; Tirado-Rives, J. Development and testing of the OPLS all-atom force field on conformational energetics and properties of organic liquids. J. Am. Chem. Soc. 1996, 118, 11225–11236. [Google Scholar] [CrossRef]
- Zhong, J.; Wang, P.; Zhang, Y.; Yan, Y.; Hu, S.; Zhang, J. Adsorption mechanism of oil components on water-wet mineral surface: A molecular dynamics simulation study. Energy 2013, 59, 295–300. [Google Scholar] [CrossRef]
- Stukowski, A. Visualization and analysis of atomistic simulation data with OVITO–the Open Visualization Tool. Model. Simul. Mater. Sci. Eng. 2009, 18, 015012. [Google Scholar] [CrossRef]
- Vilcáez, J.; Watanabe, M.; Watanabe, N.; Kishita, A.; Adschiri, T. Hydrothermal extractive upgrading of bitumen without coke formation. Fuel 2012, 102, 379–385. [Google Scholar] [CrossRef]
- Yuet, P.K.; Blankschtein, D. Molecular dynamics simulation study of water surfaces: Comparison of flexible water models. J. Phys. Chem. B 2010, 114, 13786–13795. [Google Scholar] [CrossRef]
- Zhao, L.; Lin, S.; Mendenhall, J.D.; Yuet, P.K.; Blankschtein, D. Molecular dynamics investigation of the various atomic force contributions to the interfacial tension at the supercritical CO2–water interface. J. Phys. Chem. B 2011, 115, 6076–6087. [Google Scholar] [CrossRef]


Disclaimer/Publisher’s Note: The statements, opinions and data contained in all publications are solely those of the individual author(s) and contributor(s) and not of MDPI and/or the editor(s). MDPI and/or the editor(s) disclaim responsibility for any injury to people or property resulting from any ideas, methods, instructions or products referred to in the content. |
© 2024 by the authors. Licensee MDPI, Basel, Switzerland. This article is an open access article distributed under the terms and conditions of the Creative Commons Attribution (CC BY) license (https://creativecommons.org/licenses/by/4.0/).