Abstract
Background: The implementation of the EU climate and energy policy, along with changes in the legal environment, has led to a significant increase in energy prices in Poland. Consequently, energy expenditures are now a larger part of household budgets. These rising energy costs and the evolving legal landscape are compelling households to invest in energy-saving solutions and modify their energy consumption habits. This article aims to identify the activities of households in Poland regarding the rationalization of energy expenditures. It formulates the following research hypothesis: households invest in energy-saving appliances to rationalize energy expenditures and/or change their behaviors to reduce energy consumption. Methods: The paper is based on primary research conducted using an online questionnaire survey on a sample of 331 respondents in Poland in March and April 2023. Results: A classification tree algorithm was used to identify the level of investment activities and behavioral changes made by households to reduce energy expenditures. The authors found that low-income households and people who fear further energy price increases are the first of all to change their behaviors for more energy-efficient ones. Medium- and high-income households take investment measures. They replace household appliances with more energy-efficient ones and install heat pumps and photovoltaic panels. These investments are motivated by responsible consumption, environmental protection, cleanliness, and the ease of use of the appliances.
1. Introduction
In 2014, the European Commission’s Communication to the European Parliament, the Council, the European Economic and Social Committee, and the Committee of the Regions outlined the fundamental framework for the future energy policy. According to its content, the EU member states committed to reducing greenhouse gas emissions in the EU by 40% by 2030 compared to the 1990 levels, increasing the share of renewable energy to at least 27% at the EU level, and reforming the existing emissions trading system through a new market stability reserve [1]. The Paris Agreement on climate change, adopted in December 2015 [2], reflected the EU’s more radical approach to climate issues and energy transition, which was subsequently confirmed during the European Council summit in December 2019. It was then that the assumption was made that by 2050, the EU should achieve a net-zero balance of greenhouse gas emissions, also known as climate neutrality. Climate neutrality means a situation where the amount of greenhouse gases emitted into the atmosphere is equivalent to the amount that can be absorbed naturally by the environment: forests, water bodies, and soil. Additionally, it aims to decouple economic growth from resource consumption. The planned transformation should be cost-efficient and, from a social perspective, sustainable and fair. In July 2021, the new climate strategy was finally adopted and confirmed through the European Climate Law [3], which came into force in July 2021.
The efforts undertaken at the EU legislative level to promote the cost-effective and economically efficient reduction of greenhouse gas emissions reflected the long-standing belief in the need to improve energy efficiency and transition to sustainable and competitive forms of energy. At the same time, the initiatives aimed at promoting the cost-effective and economically efficient reduction of greenhouse gas emissions resulted in specific consequences. One of these was the increase in energy prices in EU countries, including Poland. The rise in prices in Poland was further exacerbated by the lack of energy transition, heavy dependence on coal, insufficient levels of low-emission investments amid significantly increased energy demand, rising costs of purchasing energy resources and CO2 emission allowances, growing producer margins, and inadequate infrastructure for storing energy from renewable sources, which is supplied irregularly to the distribution grid [4,5,6]. The deepening energy crisis caused by the war in Ukraine, which led to the disruption of raw material supplies from Russia and the destabilization of European energy markets, also had a significant impact on the increase in energy prices [7].
However, not only in Poland but also in other EU countries, the increase in prices has been driven by a combination of factors such as rising raw material costs, the geopolitical situation, the EU climate policy, and challenges related to energy transition and infrastructure investments. Meanwhile, energy expenditures represent one of the largest expense categories in the budgets of Polish households. In 2018, the average share of energy expenditures in Polish households was 8.0%. Among the European countries, only Slovakia recorded a higher percentage of energy expenditures at 8.4%, with the average for the EU estimated at 3.9% [8]. It is worth noting that Poland belongs to the group of countries with the highest share of energy costs in total household expenditures among the EU countries [9].
The problems related to the calculation of energy expenditures pose a threat to the global energy system. Short-term periods of high energy and fuel prices create investment uncertainty in this area, while the long-term impacts affect industries and the purchasing power of households. The increase in energy expenses places many households at risk of energy poverty. Energy poverty occurs when energy costs represent too large a share of a household’s overall expenses [10], making the access to energy a luxury for many [11]. Energy poverty thus means the inability to meet energy needs at home at a reasonable cost, with these needs being understood as maintaining a certain standard of heating and supplying other types of energy essential for the biological and social functioning of the household members [12]. According to cautious estimates, over 50 million households in the European Union alone experience energy poverty. Energy poverty, varying over time and space, is a multidimensional phenomenon (political, economic, health-related, infrastructural, and social) and is linked to two types of factors: technical, related to the technical conditions of the building, heating system, location of the building, and dwelling; and socioeconomic, related to the household’s source of income, household structure, and age [13].
In this situation, households face the urgent need to reassess their previous decisions and take action to optimize their energy expenditures to maximize the utility of the consumed energy [14]. The issue of the rationalization of household energy behaviors has been extensively discussed in the literature. The research in this area comprises selected countries [15,16,17] or views the problem first of all from a supply-side perspective [18,19]. Many studies focus only on chosen aspects. For example, the impact of the COVID-19 pandemic on energy demands and consumption was addressed in [20], where the authors presented possible directions for further energy development, such as a new lifestyle with lower energy consumption, opportunities for the use of renewable energy sources, and energy storage by households. Meanwhile, the impact of COVID-19-related restrictions on the electricity consumption in Europe was discussed in a comparative article [21]. The rationalization of household energy expenditures in the new geopolitical situation, especially due to the war in Ukraine, has been the subject of numerous analyses [22,23,24,25]. Additionally, the issue of household energy demands in terms of minimizing environmental harm was discussed in [26], where an ensemble learning (EL) model for classifying total household energy expenditures was applied.
However, there is a lack of broader analyses concerning the determinants of the behaviors of Polish households. Rationalization, in this context, should be understood as more economical, conscious, and effective action aimed at achieving the highest possible utility while continuously considering the minimal expenditure of financial resources. The rationalization of expenditures can be pursued in various ways, utilizing legal regulations and efficiency measurement methods and introducing new, innovative, and increasingly efficient and cost-effective methods of energy acquisition.
There is a difference between objective and subjective rationalization of energy expenditures, which can be understood through an analysis of how people make decisions regarding energy consumption and how they justify those decisions. In the context of energy consumption and spending, subjective rationalization may involve the different behaviors and attitudes of households. For example, they may justify the use of energy-intensive devices or practices by claiming they are necessary for their comfort, even though more energy-efficient alternatives exist. Another example might be downplaying the impact of personal consumption habits on electricity bills, disregarding energy savings, or avoiding investments in more efficient technologies.
Addressing the issue of rationalizing household energy expenditures requires analysis and research, and it can constitute a further effective financial control system for consumers to prevent inefficiencies in household budgeting.
In light of the above, the aim of this article is to identify the actions taken by households in Poland regarding the rationalization of energy expenditures and the motives of their behavior. The analysis of Polish household energy behaviors from the demand side fills the gap in the literature on the subject.
In order to analyze household energy consumption, different variables are used in the literature. Some studies focus on the influence of income, household size, length of residency, education level, type of occupancy, age [27,28,29,30,31], or building characteristics [32] on gas and electricity consumption. Other papers include occupants’ energy-related behaviors within their houses, such as heating, room usage, cooking, household appliance usage, and time spent at home [33,34,35,36]. In this paper, financial and non-financial measures are used. Moreover, several motives for energy efficiency measures are considered.
The authors formulated the following research questions: to what extent were households open to new opportunities in the form of energy-saving innovations, and to what extent were they willing to change their lifestyle? What were the main determinants for undertaking investment actions versus lifestyle changes? This article proposes the following research hypothesis: in order to rationalize energy expenditures, households invest in energy-efficient devices and/or change their behaviors to reduce energy consumption.
This paper is based on primary research conducted on a sample of 331 respondents in March and April 2023 in Poland using an online questionnaire survey. An algorithm of classification trees was applied to identify the effects of the levels of investment actions and changes in household behaviors on the reduction of energy expenditures.
2. Materials and Methods
This paper presents the insightful results of a pilot questionnaire survey conducted in Poland in March–April 2023 on a sample of 331 households. Purposive sampling was used to select the participants of the survey. The online survey was sent to persons managing household budgets via email with a link that automatically opened the survey on their device, which lasted 10–12 min. The data were collected subject to Wroclaw University of Economics and Business ethics (application no. 43/2023). Participation in the survey was voluntary. The data were kept strictly confidential and only accessible to the members of the research project team.
The subject scope of the questionnaire survey included, among others, the following crucial issues:
- The types of fuels and energy carriers used in the household;
- A self-assessment of the energy management status of the household, particularly the changes in the monthly energy costs and consumption compared to one year ago;
- The measures taken to rationalize energy expenditures;
- The main motives for taking action to rationalize energy spending;
- The unnecessary energy expenditures incurred due to wasted energy or the failure to use alternative energy-saving options.
The survey was meticulously designed, using both closed and semi-open, single- and multiple-choice questions. Guided by the subject scope of the empirical study, it was assumed that the explanatory (dependent) variables were the selected forms of energy expenditure rationalization measures taken about the individual household investment measures (financial measures) and lifestyle changes (non-financial measures).
The variables YI(i); i = 1,..., 7 (with the following scale of values: 1—yes, 0—no) were selected to represent the investment measures undertaken in the households to rationalize energy expenditures: replacing old household appliances with more energy-efficient ones (YI(1)); replacing old-type light bulbs with new-generation LED lighting (YI(2)); installing thermostatic valves and heads (YI(3)); saving hot water by installing an aerator in the tap (YI(4)); taking care of the proper insulation of the house (sealing the windows and doors) (YI(5)); changing the energy acquisition system in favor of renewable energy sources (e.g., the installation of heat pumps, photovoltaic panels) (YI(6)); and others, e.g., recuperation and the use of automatic balancing of the central heating system (YI(7)). The coefficient value α-Cronbach = 0.529 (for the binary variables calculated identically to the so-called Kuder–Richardson KR-20 formula for scale reliability) (The Kuder–Richardson Coefficient (KR-20) is a method used to assess the internal consistency of a measure, particularly with dichotomous data. It is based on the variance of the item scores and is the dichotomous equivalent to the coefficient alpha [37].)—Table 1. In addition, the following forms of lifestyle changes were included in the questionnaire (variables YS(i); i =1,..., 9 with the following value scale: 1—definitely no; 2—rather not; 3—hard to say; 4—rather yes; 5—definitely yes): turning off the TV if it is not being watched (YS(1)); washing only with a full load in the washing machine (YS(2)); lowering the temperature in an unused part of the dwelling and when ventilating (YS(3)); unplugging chargers from the socket if they are not being used for charging a device, e.g., a phone (YS(4)); reducing the temperature in the dwelling to 19–20 degrees Celsius during the day and 17–18 degrees at night (YS(5)); reducing the time spent in the shower or bathing (YS(6)); reducing the use of the oven, e.g., for baking cakes (YS(7)); reorganizing work to work as much as possible during the day using the daylight (YS(8)); and going to bed earlier (YS(9)). The α-Cronbach’s coefficient value was 0.856, indicating high measurement reliability and consistency (Table 1).

Table 1.
Item analysis; Cronbach’s alpha coefficient.
To avoid excessive detail, when analyzing the seven types of investment activities included in the empirical study (YI(i); i = 1,..., 7) and the nine forms of lifestyle changes (YS(i); i = 1,..., 9), synthetic variables were constructed for each respondent:
The variables constructed in this way, indicating the scale of the action taken in terms of investment activities and in the scope of the lifestyle changes , take values in the range [0, 1].
The group of independent variables describing and relating to the state of the energy economy and the financial conditions of the respondents were selected from the questionnaire survey:
- The change in the household energy use costs compared to the previous year (variable XS(1) with the following scale of values: 1—costs decreased by more than 50%; 2—decrease between 25% and 50%; 3—decreased by 25% at most; 4—average remained the same; 5—increased by 25% at most; 6—increase between 25% and 49%; 7—increase between 50% and 74%; 8—increase between 75% and 99%; and 9—increased by 100% or more);
- The change in the average monthly level of energy consumption in the household compared to the previous year (XS(2) with the following scale of values: 1—definitely no increase in energy consumption; 2—rather not; 3—hard to say; 4—energy consumption has rather increased; and 5—definitely yes);
- The recognition of the issue of unnecessary energy expenditures incurred as a result of wasted energy or the lack of use of alternative energy-saving options (XS(3) with the following scale of values: 1—definitely not; 2—rather not; 3—hard to say; 4—rather yes; 5—definitely yes);
- XS(4): the average monthly electricity/other heat charges;
- XS(5): the average monthly net income per person in the household;
- XS(6): the primary sources of energy used in the household (grid electricity, district heating, solid fuels, fossil fuels, natural gas, liquefied petroleum gas, fuel oil, and energy from renewable sources).
The main motives for the energy efficiency measures included in the questionnaire survey (the independent variables) were the following XM(i) (i = 1,...6 with values of 1—yes and 0—no) variables: the willingness to save (variable XM(1)); conscious, responsible consumption, including being guided by the principles of sustainability (XM(2)); limited household budget and the fear of rising energy costs (XM(3)); cleanliness and automation in operation (XM(4)); information about the positive experiences of family, neighbors, or friends in using innovative energy-saving solutions (XM(5)); and the existing legal regulations (XM(6)).
The additional control variables characterizing the households were as follows: XH(1)—the number of persons in the household; XH(2)—the dwelling metric; XH(3)—the place of residence (cities with more than 150,000 inhabitants, towns with up to 150,000 inhabitants and more than 50,000 inhabitants, cities with up to 50,000 inhabitants, and rural areas). To construct two models of the relationship between the dependent variables, describing the propensity to undertake investment activities (quantitative variable ) and the propensity to change lifestyle (quantitative variable ), and the independent variables, relating to the state of the respondents’ energy economy and the main motives for energy efficiency measures, as well as the control variables characterizing the household, the regression tree method was proposed. Its use in discriminant and regression analysis was presented by Breiman et al. [38]. This method (belonging to the group of non-parametric methods for building discriminant and regression models) is used to predict the value of the explanatory variable measured on a quotient or interval scale.
It consists of a recursive division of the population into disjointed subsets (segments, classes) that are as homogeneous as possible in terms of the explanatory (dependent) variables, analyzing the relationship of each explanatory (independent) variable to the explanatory variables. The forecast error in such a procedure is most often calculated from the sum of the squares of the deviations from the mean at the terminal nodes, most often the RMSE (Root Mean Square Error), R2 [39]. Nowadays, the method of regression trees (as well as the method of classification trees) is increasingly used in many different research fields, not only within statistics or econometrics but also in microeconomics, e.g., in the segmentation strategies of individuals and companies, to analyze financial health, to assess credit risk, and to achieve success [40,41], or about households, to identify which household characteristics play an important role in income polarization [42], to investigate the additional expenditures caused by the COVID-19 pandemic [43], and to analyze the levels of energy consumption [44] or financial exclusion [45].
Unlike many other statistical methods, regression trees are less sensitive to distributional assumptions than parametric methods like linear regression, and variables measured on weak measurement scales (ordinal or qualitative, including binary) and variables with missing data can also be included in the model. In the case of generating accurate decision trees with manageable complexity and error rates, selecting an appropriate sample size is essential [46].
In this analysis, the regression tree method allowed the determination (and presentation, using the appropriate diagrams) of the affiliation of the object-respondents to the classes of the variable measure of the willingness to invest or the measure of the desire to change lifestyle to rationalize energy spending, i.e., the dependent variables (continuous) based on the above-mentioned independent, explanatory (mainly qualitative) variables and the prediction of the value of the explained variable—the aggregated measure of the willingness to invest or the measure of the desire to change lifestyle.
The final division of the surveyed community is illustrated by the final node leaves, which contain the forecast value of the two analyzed dependent variables (arithmetic mean) and information about the number of respondents assigned to each class. To obtain a relatively simple tree indicating the main significant independent variables, it was necessary to stop the procedure of the recursive division of the community before obtaining complete homogeneity of the segments and classes (at the expense of the quality and reduction of R2) by performing the so-called pruning of the tree. For this purpose, the direct stopping rule FACT (Fast Algorithm for Classification Trees) was used for a given fraction of objects—5% of the tested community. The calculations were conducted using Statistica software (version 13.3) purchased by the universities under the Site License academic license. The C&RT (Classification & Regression Trees) module was used for the classification tree, a complete implementation of the CART method introduced by Breiman and his colleagues from Berkeley [38].
3. Results
The pilot survey covered 331 households in Poland, with over 82% of the respondents being owner-occupiers. Among the respondents, single-person households accounted for 14% and two-person households 37%, and the remaining 49% were households with three or more persons. Approximately 60% of the dwellings were over 60 m2, and one-third were over 100 m2. The respondents lived mainly in cities (75%), with half in cities with more than 150,000 inhabitants. Over half of the respondents had an average monthly net income per person in the household of less than PLN 3500 (EUR 756).
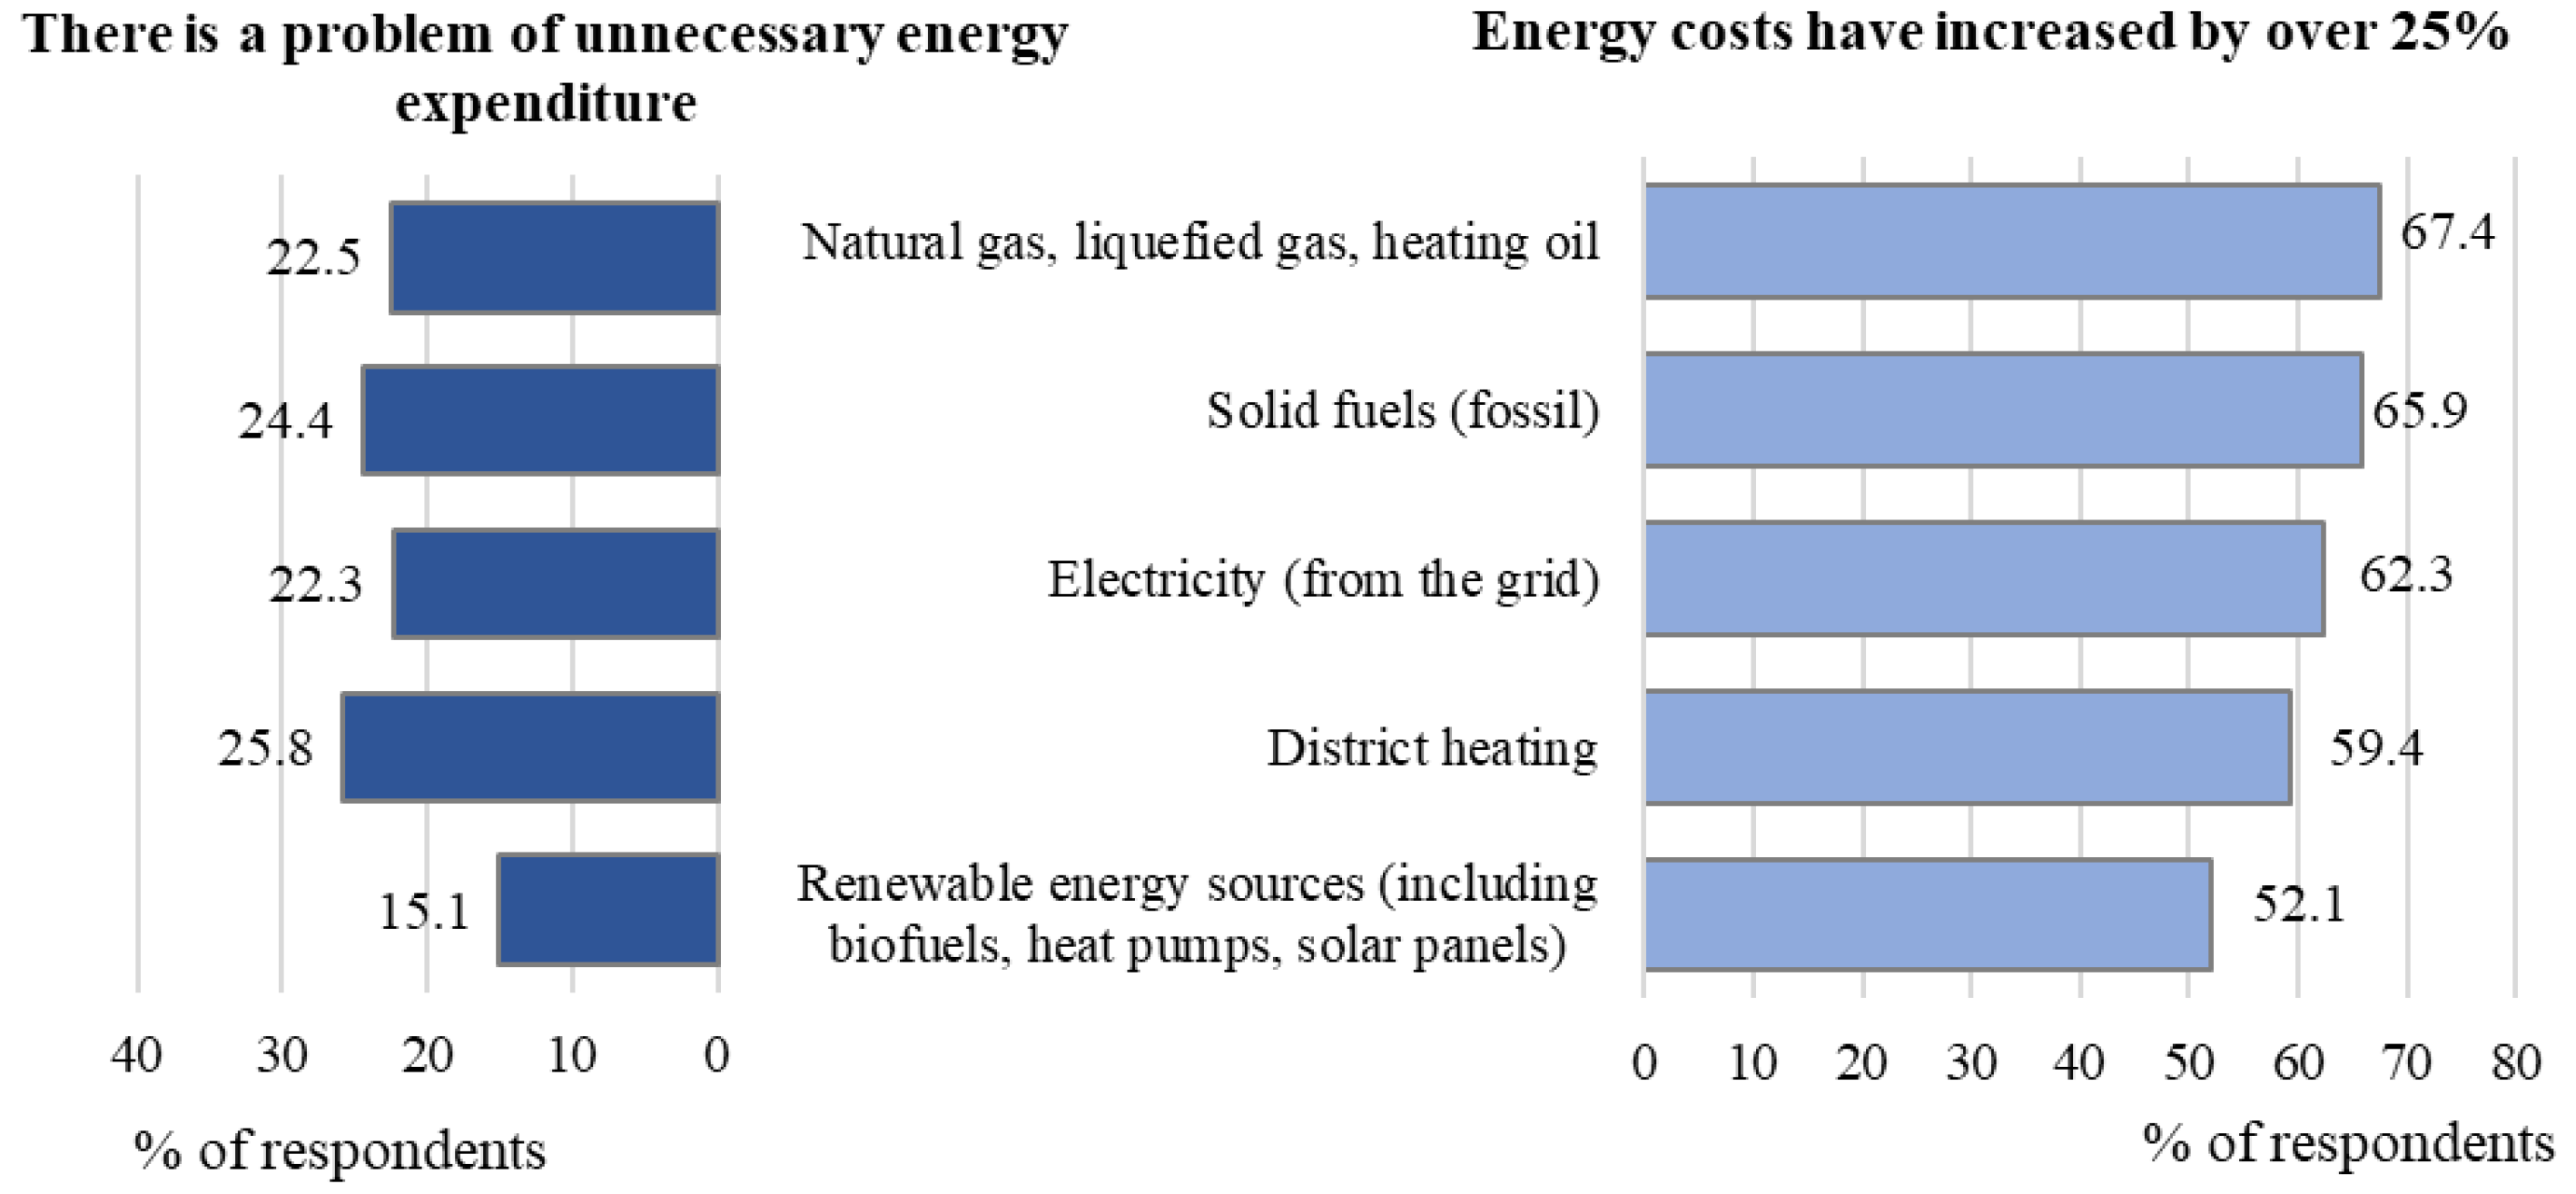
On the other hand, the respondents’ average monthly charges for electricity or other heat ranged from 50 PLN to 800 PLN (EUR 11-173), with an average of 507 PLN (EUR 109). Half the respondents were charged, at most, 300 PLN (65 EUR) monthly. Compared to 2022, in the subset of households where the energy use did not increase (or remained the same), the monthly energy expenditures increased for 82% of the respondents. In contrast, for 63% of the households, the monthly energy use and home heating costs increased by 25% or more. The percentage of households declaring an increase in energy use and space heating costs varied according to the primary source and energy carrier. Among the households that used natural gas, liquefied petroleum gas, fuel oil, or fossil fuels, the highest percentage declared an increase in the monthly costs associated with energy use (66% declared an increase in costs by more than one-fourth). Notably, 52% of the households using renewable energy sources also declared increased costs.
The households with renewable energy sources were distinguished by the lowest percentage of respondents who perceived a problem of unnecessary energy expenses incurred from wasting energy or not using alternative energy-saving options (5% of the respondents in the case of electricity charges). The perception of such a problem was much more common among the households using district heating or fossil fuels (26% and 24% of the respondents, respectively—Figure 1).
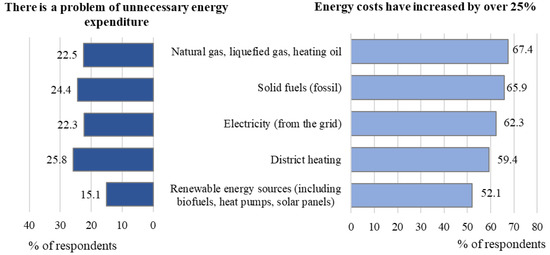
Figure 1.
The percentage of households in which the monthly costs related to energy use increased by more than 25% and those in which there was a problem of unnecessary energy expenditure, in groups according to the main energy sources in the households. Source: own elaboration.
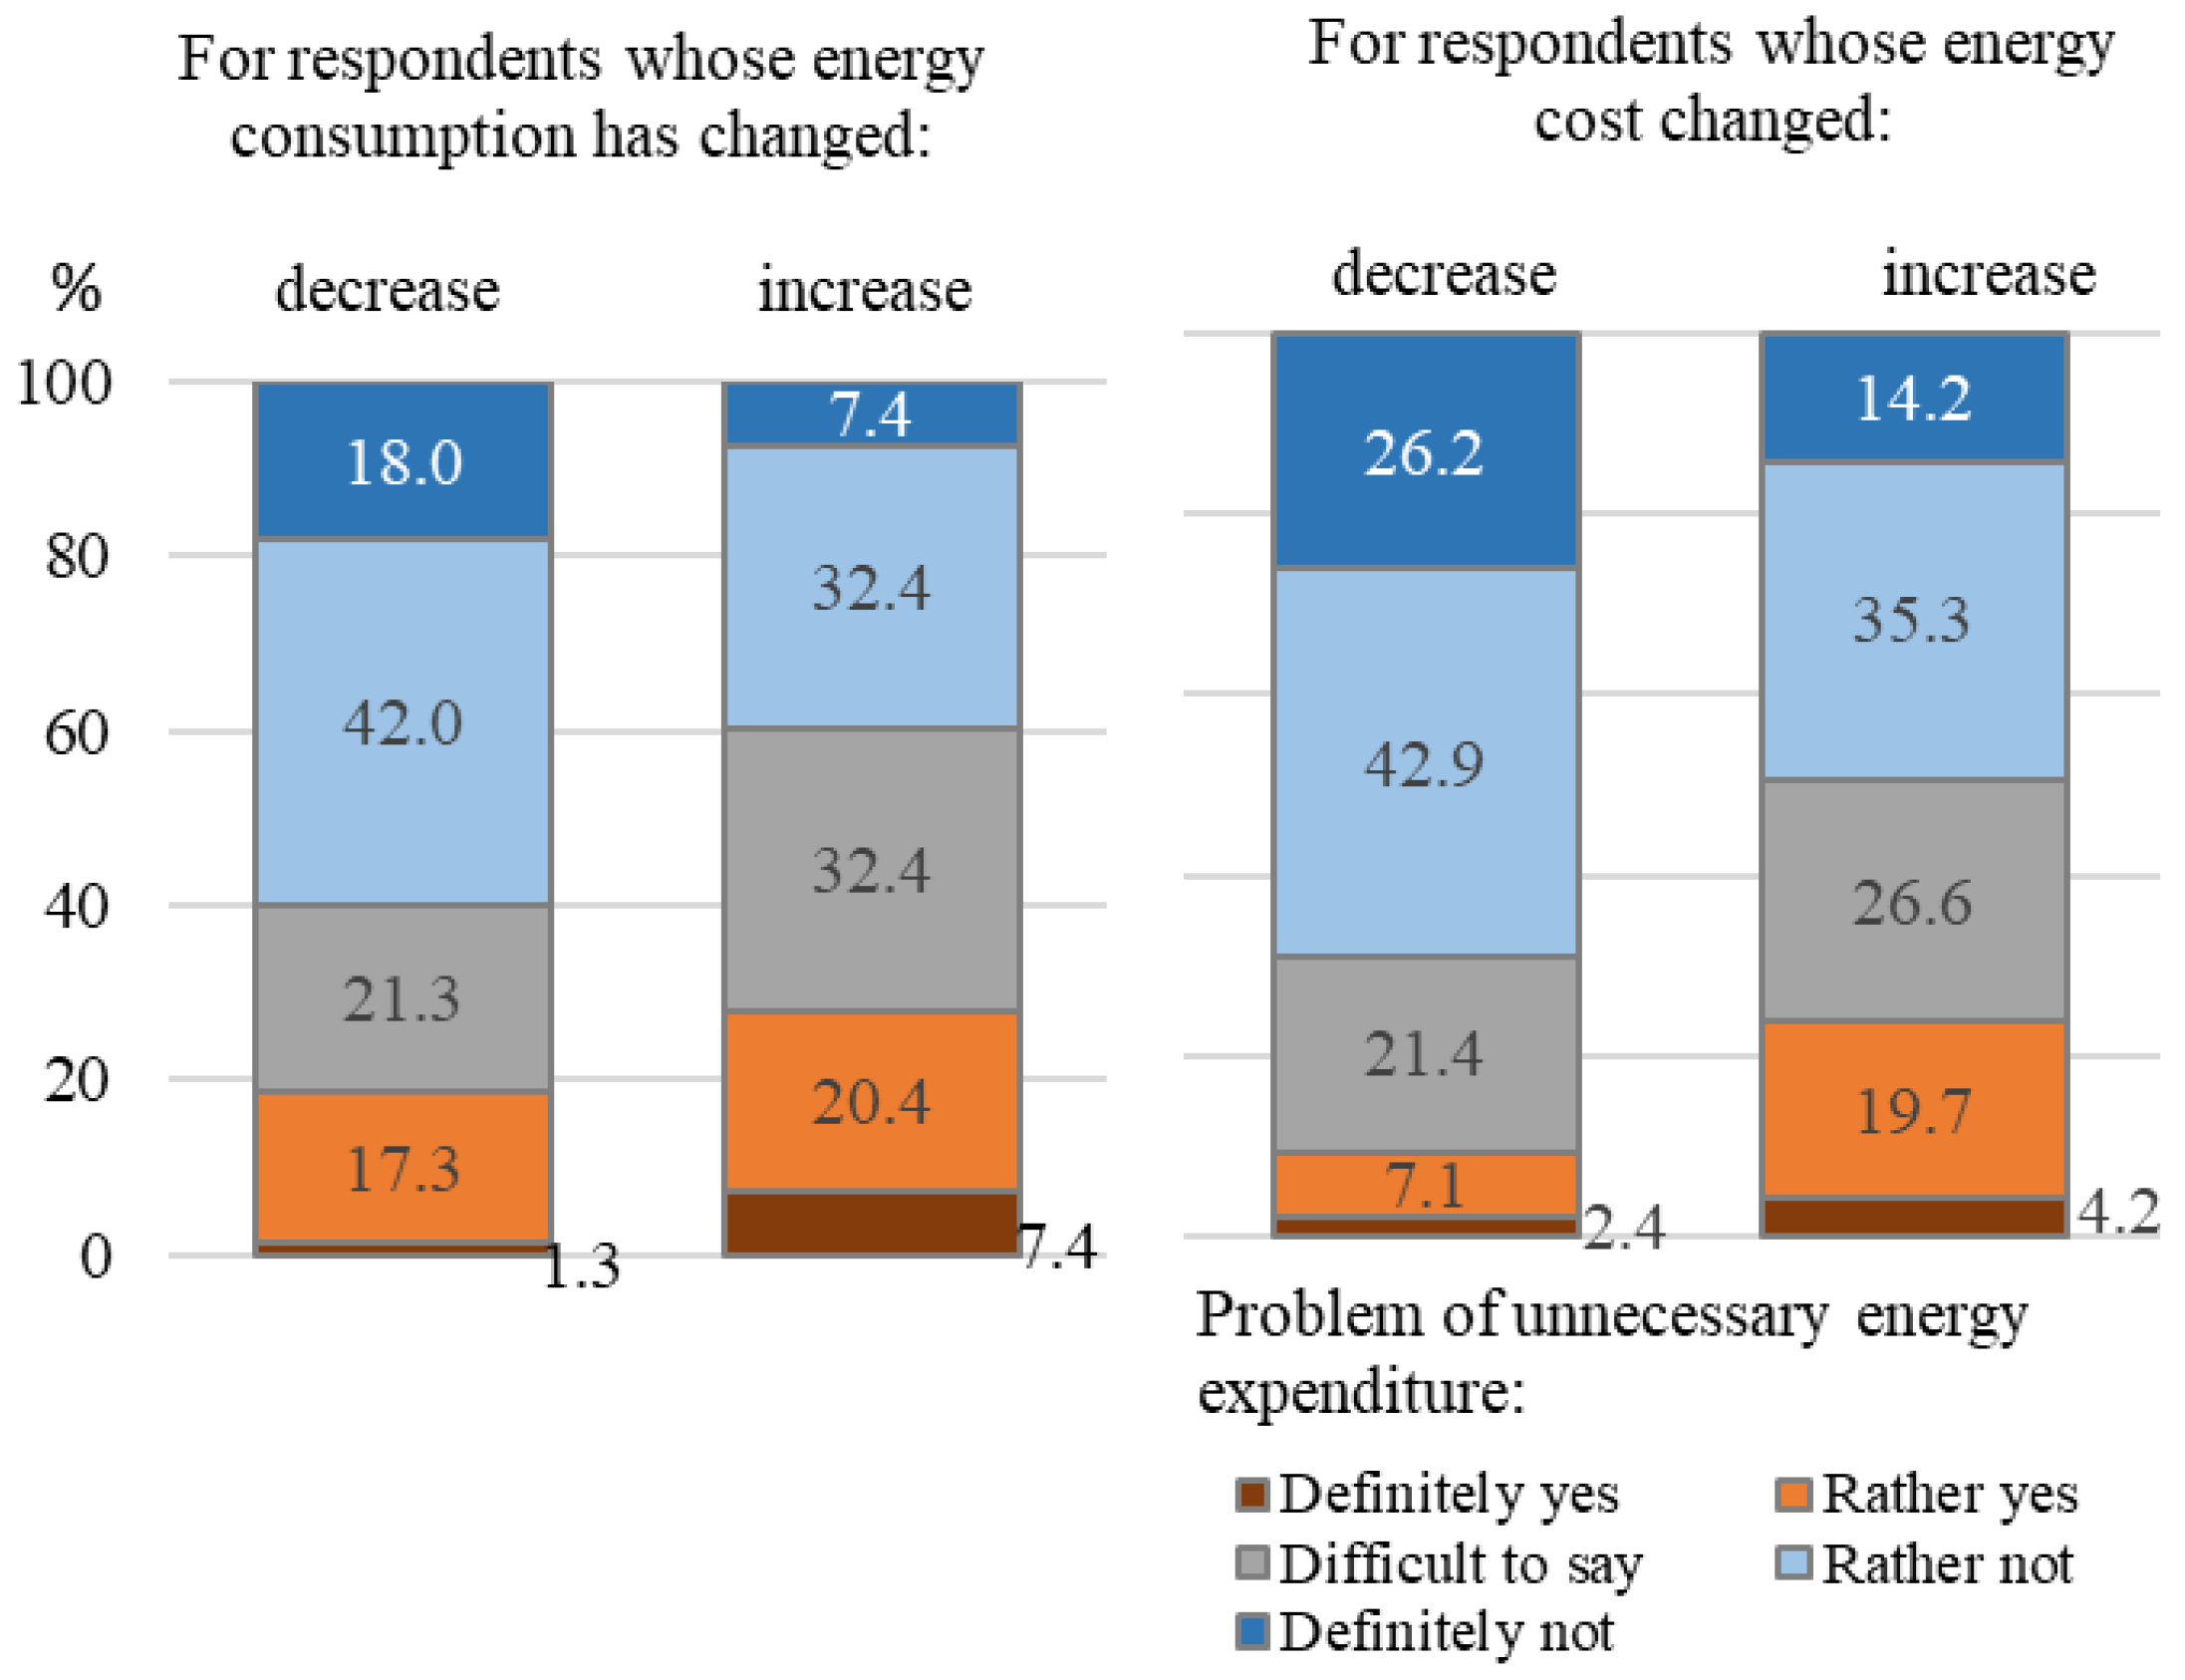
Overall, the problem of unnecessary energy expenditures was perceived by 22% of the respondents (answers “yes” or “rather yes”). More than twice as many respondents did not perceive such a problem, with 52% (answers “no” or “rather not”)—Figure 2. The perception of the problem of unnecessary expenditures increased in the situation of an observable increase in energy consumption (28% of the respondents in this group, against about 19% among the households in which the energy consumption decreased) (The test statistic χ2 = 15.968 and the p-value = 0.003. It means that the chance of rejecting a correct H0 (hypothesis about the independence of the perception of the problem of lost expenses and the increase in the costs related to energy use) was 0.3%. A significant association was found between both variables (p-value < α = 0.05)), and to a lesser extent in the situation of an increase in the costs associated with energy use (24% of the respondents in this group, against 9.5% among the households in which the energy expenditures decreased) (The test statistic χ2 = 7.820 and the p-value = 0.098. It means that the chance of rejecting a correct H0 (hypothesis about the independence of the perception of the problem of lost expenses and the increase in the costs related to energy use) was 9.8%).

Figure 2.
The households with the problem of unnecessary energy expenditure. Source: own elaboration.
According to 46% of the respondents, with more rational energy management, there was a chance to reduce energy charges by more than 5%. For 16% of the respondents, on the other hand, energy expenses could be reduced by more than 10% in this way. The opportunity to reduce the energy expenditures was noted primarily by those who perceived energy wastage in their households or realized that more energy-efficient solutions could be used. In such a subset, 63% of the respondents still had an opportunity to save more than 5% of the current energy charges (compared to 40% of the respondents who did not perceive a wastage problem) (The test statistic χ2 = 20.984 and the p-value = 0.0003. It means that the chance of rejecting a correct H0 (hypothesis about the independence of perceiving the problem of lost expenses and the possibility of saving on energy costs) was 0.03%. A significant association was found between both variables (p-value < α = 0.05)).
The most remarkable propensity to reduce wasteful energy consumption was declared by those whose average monthly household income per person was less than PLN 3500.
In 2023, Polish households’ most used energy source (primary or supplementary) was electricity (from the grid), particularly for cooking meals. The growing popularity of induction hobs, microwave ovens, and electric ovens may have influenced the importance of the electricity used for cooking meals in Polish households. Natural gas was the households’ second most crucial energy source, followed by district heating (the thermal energy supplied by heating companies for space heating and water heating purposes). For the renewable energy households, the energy obtained from photovoltaic installations and the energy from biofuels were most important. Energy obtained from ambient heat was of minor importance. Hard coal was the most important and commonly used solid fuel by households in Poland (Table 2).
Table 2.
Fuels and energy carriers in surveyed households.
In order to rationalize their energy expenditures, Polish households undertook various investment measures. The percentage of such respondents ranged from 10.9% in the category “other” (e.g., recuperation, the use of automatic hydraulic balancing of the central heating system) (YI(7)) to about 55% in the case of replacing old-type light bulbs with new-generation LED lighting (YI(2)). Switching to renewable energy sources, e.g., the installation of heat pumps and photovoltaic panels (YI(6)), was declared by 35% of the respondents (Table 3). A test χ2 was conducted for each pair of variables; the financial measures for energy efficiency (YI(i); i = 1,..., 7) and annual changes in energy-related costs, XS(1), showed no significant relationship at a = 0.05 level.
Table 3.
Investment measures taken by Polish households to rationalize their energy expenditures.
Among the different forms of lifestyle changes included in the questionnaire survey that could have had an impact on the energy management of the household, the following were mentioned most frequently by the respondents: switching off the TV if it is not being watched (YS(1)); washing only with a full load in the washing machine (YS(2)); and lowering the temperature in the unused part of the dwelling and when ventilating (YS(3)) (Table 4). The willingness to undertake such household activities depended significantly on the increase in the monthly costs associated with energy use (this conjecture is confirmed by, among others, the chi-square test) (for the pair of variables YS(1) and XS(1), the test χ2 = 59.1 and the p-value = 0.002; for the pair of variables YS(2) and XS(1), the test χ2 = 46.6 and the p-value = 0.044; and for the pair of variables YS(3) and XS(1), the test χ2 = 48.6 and the p-value = 0.030. A significant association was found between both variables (p-value < α = 0.05).
Table 4.
Lifestyle change affecting household energy economy in Poland by selected forms.
The primary statistical parameters of the two aggregate measures testifying to the scale of the energy efficiency measures, with the first synthesizing the information on the investment measures included in the empirical study and the second synthesizing the individual forms of the lifestyle changes, are presented in Table 5. According to the adopted design, both synthetic measures take values in the interval [0, 1], with the synthetic measure of the lifestyle changes equal to 1 if “definitely yes” responses were received for all component forms of lifestyle changes (maximum values). At the same time, it is equal to 0 if “definitely no” responses were received for all component forms of lifestyle changes (minimum values). Based on the empirical survey data, the calculated synthetic measures indicate that, in the context of energy expenditure rationalization, the propensity to change lifestyles was more significant than the propensity to take investment more significant than the arithmetic mean of the variable and greater than the mean of the synthetic variable .
Table 5.
Basic statistical parameters of synthetic measure of investment activities for energy efficiency and synthetic measure of lifestyle changes.
The primary motivation for energy efficiency measures most often indicated by the respondents was the desire to save (XM(1)), followed by conscious, responsible consumption (XM(2)) and limited finances and fears of rising energy costs (XM(3)) (Table 6). Those who indicated these motivations were the most likely to make lifestyle changes (the highest values of ). In contrast, the propensity to undertake investment measures to rationalize energy expenditures was highest among those for whom cleanliness and automation in operation (XM(4)) and information about the positive experiences of family, neighbors, and friends in the use of innovative energy-saving solutions (XM(5)), as well as conscious, responsible consumption (XM(2)), were critical motivational criteria.
Table 6.
The main motives for the decision to rationalize energy expenditures in the surveyed households.
Two regression tree models were constructed to show the impact of the variables included in the questionnaire survey on the levels of investment activities for energy efficiency and lifestyle changes. Only those variables with the highest classification power and those significantly influencing the value of the dependent variables (the measures of investment activities or lifestyle changes) were included. The population size was 305 respondents (the respondents who did not answer the question on average monthly electricity/other heat payments were omitted). A recursive procedure to divide the analyzed set of households by the value of the synthetic measure of investment activities (using appropriate measures of the quality of the division, including the reduction of dispersion around the dependent variable, as well as the tree pruning rule) (RMSE = 0.194; R2 = 0.305 after so-called tree pruning) identified ten classes of households (Figure 3).
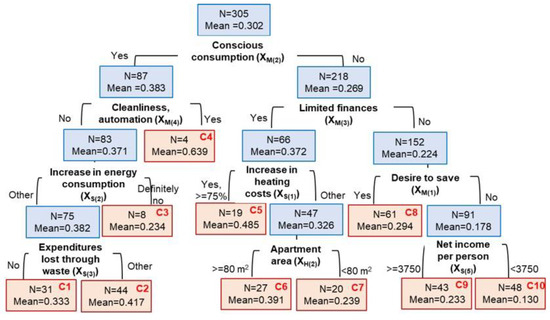
Figure 3.
Regression tree for synthetic measure of investment activities to rationalize energy expenditures. Source: own elaboration.
The following variables had the highest discriminatory power in the model for the measure of changes in investment activities: conscious, responsible consumption, including the importance of sustainability (XM(2)), and cleanliness and automation in service (XM(4)). The following variables, determining the value of the dependent variable and serving to subdivide the household collective further, were limited finances (XM(3)); a change in the cost of household energy use compared to the previous year (XS(1)); an increase in the average monthly level of household energy consumption compared to the previous year (XS(2)); willingness to save (XM(1)); perception of the unnecessary energy expenditures incurred as a result of wasted energy or the lack of use of alternative energy-saving options (XS(3)); the average monthly net income per person in the household (XS(5)); the square meters of the dwelling (XH(2)); and information about the positive experiences of family, neighbors, and acquaintances with the use of innovative energy-saving solutions (XM(5)).
The value of the average synthetic measure of investment activities for energy expenditure rationalization ranged from 0.13 (C10) to 0.64 (C4) in separate classes. In class C4 (with the highest value of the mean synthetic measure of investment activities, more than twice as high as the average in the whole set of surveyed households), the households that were classified included conscious, responsible consumption and cleanliness and automation in service among the main reasons for the decision to rationalize energy expenditures. The lowest value of the average synthetic measure of investment activities for rationalizing energy expenditures occurred in class C10, covering the households with an average monthly net income per person below 3750 PLN. In addition, these households did not use conscious and responsible consumption.
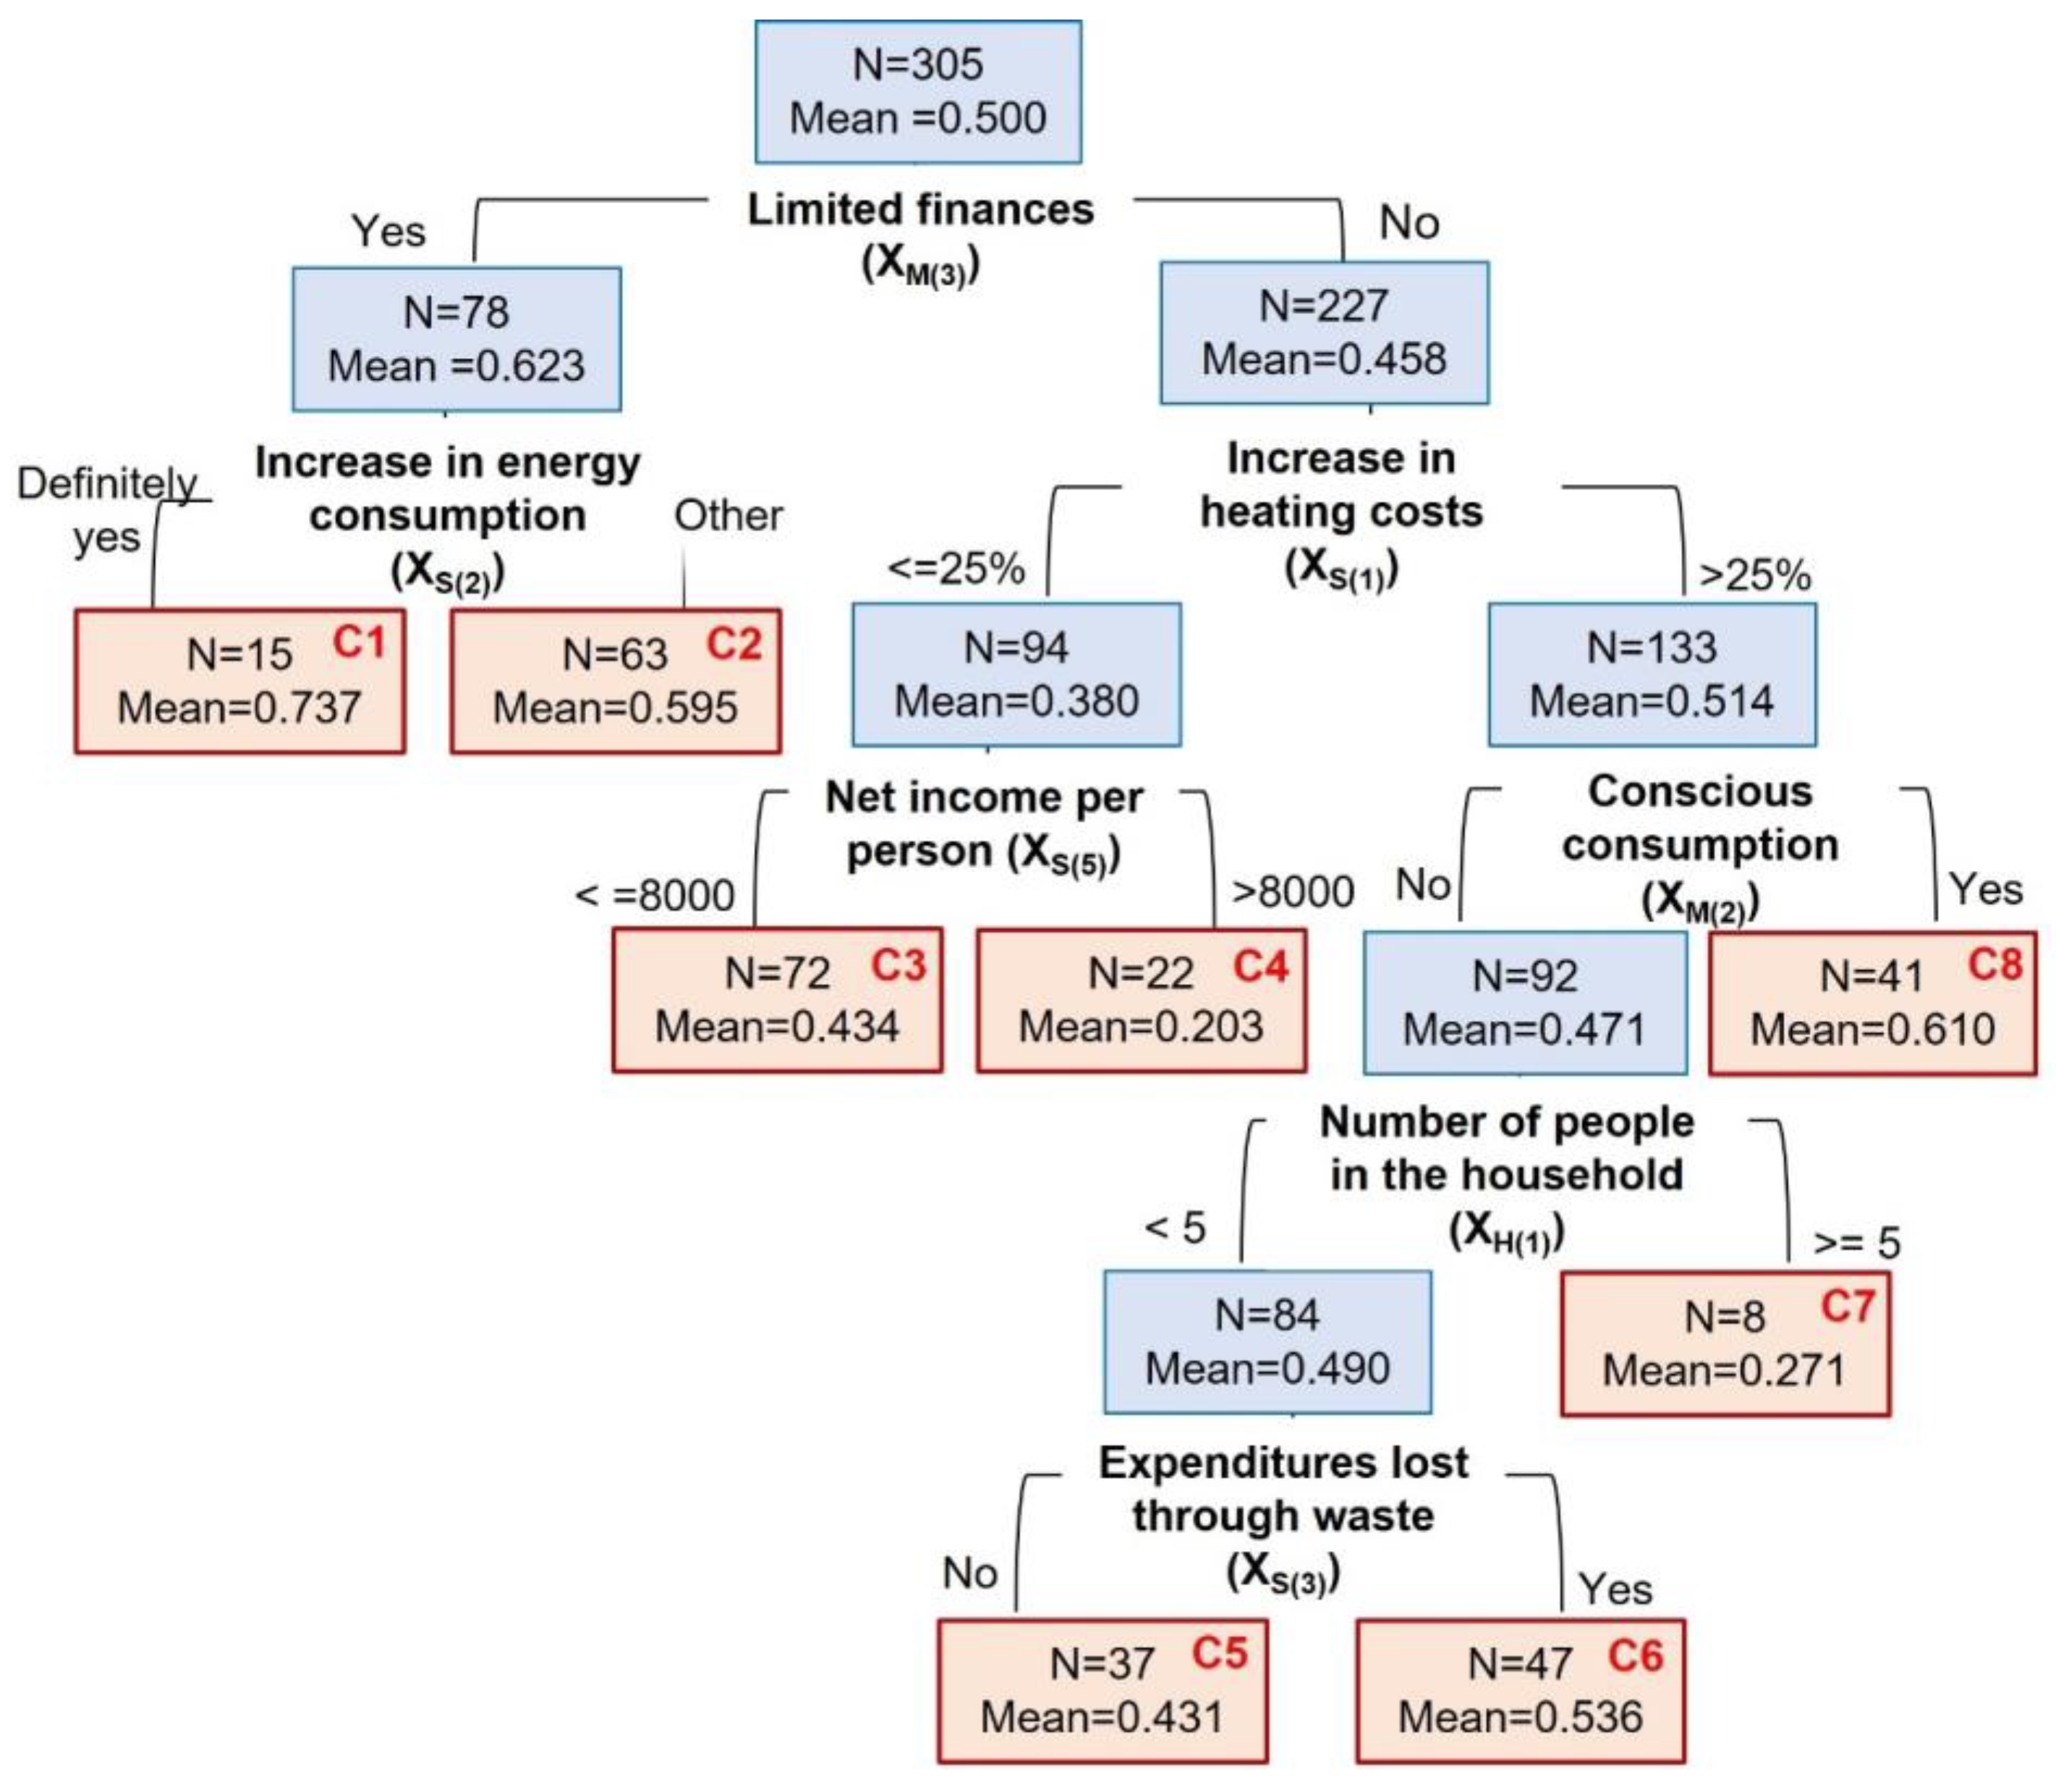
As a result of the procedure of recursive partitioning of the analyzed set of households concerning the value of the measure of lifestyle changes (using the appropriate measures of the quality of the partitioning, including the reduction of dispersion around the dependent variable, as well as the use of the tree pruning rule), eight classes of households were identified (Figure 4) (RMSE = 0.164; R2 = 0.358 after so-called tree pruning). The value of the synthetic lifestyle measure was most strongly determined by the variable of restricted finances, XM(3). The following variables provided significant classificatory power for further subdivisions of the community: the change in the cost of energy use in the household compared to the previous year (XS(1)); the increase in the average monthly level of energy consumption in the household compared to the previous year (XS(2)); the average monthly net income per person in the household (XS(5)); conscious, responsible consumption, including the importance of sustainability (XM(2)); the recognition of the problem of unnecessary energy expenditures incurred as a result of energy waste or the lack of use of alternative energy-saving options (XS(3)); and the number of persons per household (XH(1)).

Figure 4.
Regression tree for synthetic measure of lifestyle changes to rationalize energy expenditures. Source: own elaboration.
The highest (predicted) value of the mean synthetic measure of lifestyle changes was recorded in the class described by node C1 (equal to 0.74), comprising the households that made decisions to rationalize energy expenditures due to limited finances and noticed an increase in the average monthly level of energy consumption compared to the previous year.
The second highest value for the average lifestyle change measure occurred in class C8 (0.61), comprising the households that followed the principles of conscious and responsible consumption and noted that their average monthly energy use costs had increased by more than 25% compared to the previous year.
The class of respondents described by node C4 (0.20) had the lowest mean (predicted) value of the average measure of synthetic lifestyle changes, i.e., the most miniature scale of the energy expenditure rationalization measures in the form of lifestyle changes. It comprised 7.2% of the respondents with an average monthly net income per person in their household greater than 8000 PLN and declaring that their monthly costs related to energy use decreased, remained unchanged, or increased by 25% at most.
4. Discussion
Restricted finances forced the respondents who were sensitive to electricity price increases to make some changes in their lifestyles and daily household energy-saving behaviors. In order to decrease their average monthly levels of energy consumption, they lowered the temperature in an unused part of the dwelling and when ventilating, and lowered the temperature in the flat to 19–20 degrees Celsius during the day and 17–18 degrees at night. Such behavior is in accordance with the results of some previous studies [35,47].
Turning off the air conditioner when the room is empty and setting the air conditioner at the right temperature, not the lowest or highest, was also observed among urban residents in China who tried to lower electricity consumption [34,36]. Turning off the TV if it was not being watched and pulling the plugs in time are also popular household electricity-saving behaviors in the world [36,48]. Respondents in Poland trying to reduce energy use mainly washed only with a full load in the washing machine, while households in other countries first turned off the light in time and/or in an empty room [34,36,48,49].
If the electricity expenditure is a small proportion of the household consumption expenditures, then respondents are not willing to change their living habits to save electricity. However, they invest in energy-efficient devices. Their electricity-saving consumption is caused by the belief that it contributes to the improvement of the environment. The result is consistent with studies which show that personal moral norms and environmentally friendly habits have a significant effect on people’s intentions to reduce electricity consumption [34,36,50]. Respondents in Poland first indicated making investments that required low funding (new-generation lighting, replacing household appliances with more energy-efficient ones, or installing a faucet aerator). Purchasing high-efficiency appliances and equipment as a result of changes in energy prices was shown in many studies [51,52,53,54]. One-third of respondents changed their energy generation system (installing heat pumps or photovoltaic panels) and/or improved their home insulation. A recent increase of the share of renewable sources in energy production in Poland was also confirmed by other papers [55,56].
The presented research results have some limitations, since they refer predominantly to a small sample of Polish households. The sample size and measurement scales used limited the possibility of using other multidimensional, parametric statistical models allowing for testing the relationships between variables.
The conducted questionnaire study was exploratory. This pilot study also allowed for testing the possibility of applying the proposed analytical method (regression trees), which could be used in the actual study, with a much larger size.
In the paper, socio-demographic factors were not included in the analysis because the respondents provided answers about their households regardless of the division of the decision-making power in the area of rationalizing energy expenditures. Therefore, in subsequent studies, it is recommended to conduct in-depth research on an extended sample and to modify the survey questionnaire to include the socio-demographic factors of the surveyed households to obtain more reliable measures of internal coherence. We also recommend extending the territorial scope to the international dimension. Moreover, taking into account the importance of the problem under consideration, it is justified to monitor consumers’ attitudes towards the rationalization of energy expenditures (in the face of increasing energy prices and institutional requirements) and towards energy innovations.
5. Conclusions
Due to the implementation of the EU’s climate and energy policy and ongoing geopolitical changes, a significant increase in energy prices has been observed in Poland. In 2023, the increase in energy expenditures was the highest in households that relied on natural gas or fossil energy sources.
The rising energy costs, along with the changes in legal regulations, have led households to alter their energy management behaviors. To rationalize their energy expenditures, they invested in energy-efficient devices and/or changed their habits to reduce energy consumption.
Pilot studies show that households with low incomes or concerns about further energy price increases were the most inclined to adopt lifestyle changes aimed at reducing energy consumption. The respondents most frequently reported turning off the television when not in use, doing laundry only with a full load, or lowering the temperature in the unused areas of their homes.
New-generation lighting, replacing household appliances with more energy-efficient ones, installing heat pumps or photovoltaic panels, saving hot water by installing a faucet aerator, and improving home insulation were the most commonly cited investment actions by respondents aimed at rationalizing their energy expenditures. Households that undertook more significant investments with higher financial costs were primarily motivated by responsible consumption, environmental protection, and the cleanliness and ease of use of the devices. The positive experiences shared by family, neighbors, or friends regarding the use of innovative energy-saving solutions also had a strong influence on their decisions.
Over 40% of respondents noted that their energy expenditures could be lower if they reduced energy wastage or adopted alternative energy-saving options.
Author Contributions
Conceptualization, E.S., K.S., M.N.-P., W.N., P.S., K.W. and J.Z.-S.; methodology, E.S.; validation, E.S., K.S., M.N.-P., W.N., P.S., K.W. and J.Z.-S.; formal analysis, E.S. and W.N.; investigation, E.S., K.S., M.N.-P., W.N., P.S., K.W. and J.Z.-S.; resources, E.S., K.S., M.N.-P., W.N., P.S., K.W. and J.Z.-S.; data curation, E.S., K.S., M.N.-P., P.S., K.W. and J.Z.-S.; writing—original draft preparation, E.S., K.S., M.N.-P., W.N., P.S., K.W. and J.Z.-S.; writing—review and editing, E.S., K.S., M.N.-P., W.N., P.S., K.W. and J.Z.-S.; visualization, E.S. and J.Z.-S.; supervision, E.S., K.S., M.N.-P., W.N., P.S., K.W. and J.Z.-S.; project administration, E.S. and J.Z.-S.; funding acquisition, K.S. and P.S. All authors have read and agreed to the published version of the manuscript.
Funding
This publication was financed by a subsidy granted to the University of Wroclaw and the Wroclaw University of Economics.
Data Availability Statement
The original contributions presented in the study are included in the article, further inquiries can be directed to the corresponding author.
Conflicts of Interest
The authors declare no conflicts of interest.
References
- Communication from the Commission to the European Parliament, the Council, the European Economic and Social Committee and the Committee of the Regions: A Policy Framework for Climate and Energy in the Period from 2020 to 2030; Document 52014DC0015; European Union: Maastricht, The Netherlands, 2014.
- Paris Agreement; Document 22016A1019(01), OJ L 282; European Union: Maastricht, The Netherlands, 2016.
- Regulation (EU) 2021/1119 of the European Parliament and of the Council of 30 June 2021 Establishing the Framework for Achieving Climate Neutrality and Amending Regulations (EC) No 401/2009 and (EU) 2018/1999 (‘European Climate Law’); Document 32021R1119, OJ L 243; European Union: Maastricht, The Netherlands, 2021.
- Stala-Szlugaj, K.; Grudziński, Z. (Eds.) Zagadnienia surowców energetycznych i energii w gospodarce krajowej. Bezpieczeństwo energetyczne Polski i UE w świetle obecnej sytuacji gospodarczej. In Zeszyty Naukowe Instytutu Gospodarki Surowcami Mineralnymi i Energią PAN; Instytut Gospodarki Surowcami Mineralnymi i Energią Polskiej Akademii Nauk: Krakow, Poland, 2024; Volume 1, Available online: https://min-pan.krakow.pl/wydawnictwo/wp-content/uploads/sites/4/2024/03/ZN-2024-nr-112-1.pdf (accessed on 19 October 2024).
- Brodny, J.; Tutak, M.; Grebski, W. Empirical Assesment of Efficiency of Poland’s Energy Transition Process in the Context of Implementing the European Union’s Energy Policy. Energies 2024, 17, 2686. [Google Scholar] [CrossRef]
- Bijańska, J.; Wodarski, K. Hard coal production in Poland in the aspect of climate change and energy policy of the European Union and the war in Ukraine. Investment case study. Resour. Policy 2024, 88, 104390. [Google Scholar] [CrossRef]
- Gradzewicz, M.; Jabłonowski, J.; Sasiela, M.; Żółkiewski, Z. The impact of energy prices increases on the Polish economy. Energy Econ. 2024, 140, 107944. [Google Scholar] [CrossRef]
- Piekut, M. Patterns of Energy Consumption in Polish One-Person Households. Energies 2020, 13, 5699. [Google Scholar] [CrossRef]
- Barwińska Małajowicz, A.; Knapková, M.; Szczotka, K.; Martinkovičová, M.; Pyrek, R. Energy Efficiency Policies in Poland and Slovakia in the Context of Individual Well-Being. Energies 2023, 16, 116. [Google Scholar] [CrossRef]
- Bouzarovski, S. Understanding Energy Poverty, Vulnerability and Justice. In Energy Poverty; Palgrave Macmillan: Cham, Switzerland, 2018; pp. 9–39. [Google Scholar] [CrossRef]
- Conradie, P.; Van Hove, S.; Pelka, S.; Karaliopoulos, M.; Anagnostopoulos, F.; Brugger, H.; Ponnet, K. Why do people turn down the heat? Applying behavioural theories to assess reductions in space heating and energy consumption in Europe. Energy Res. Soc. Sci. 2023, 100, 103059. [Google Scholar] [CrossRef]
- Borowska, A.; Mikuła, A.; Raczkowska, M.; Utzig, M. Konsumpcja Dóbr i Usług w Gospodarstwach Domowych w Polsce; Wydawnictwo SGGW: Warszawa, Poland, 2020. [Google Scholar]
- Szczygieł, O.; Kalinowski, S.; Łuczak, A. When Energy Becomes a Luxury. Challenges in the Fight Against Energy Poverty. Conclusion from the Research on the Causes of Poverty in the Mazovian Voivodship. Polityka Społeczna 2024, 599, 21–29. [Google Scholar] [CrossRef]
- Piao, X.; Managi, S. Household energy-saving behavior, its consumption, and life satisfaction in 37 countries. Sci. Rep. 2023, 13, 1382. [Google Scholar] [CrossRef]
- Shittu, I.; Latiff, A.R.A.; Baharudin, S.A. Assessing the compensation and reinvestment plans for fuel subsidy rationalization in Nigeria: A dynamic computable general equilibrium approach. Energy 2024, 293, 130671. [Google Scholar] [CrossRef]
- Amores, A.F.; Maier, S.; Ricci, M. Taxing household energy consumption in the EU: The tax burden and its redistributive effect. Energy Policy 2023, 182, 113721. [Google Scholar] [CrossRef]
- Bhattarai, U.; Maraseni, T.; Devkota, L.P.; Apan, A. Facilitating sustainable energy transition of Nepal: A best-fit model to prioritize influential socio-economic and climate perception factors on household energy behaviour. Energy Sustain. Dev. 2024, 81, 101505. [Google Scholar] [CrossRef]
- Blonz, J.A. The costs of misaligned incentives: Energy inefficiency and the principal-agent problem. Am. Econ. J. Econ. Policy 2023, 15, 286–321. [Google Scholar] [CrossRef]
- Jonassen, R.; Andersen, M.S.; Cottrell, J.; Bhattacharya, S. Carbon Pricing and Fossil Fuel Subsidy Rationalization Tool Kit; Asian Development Bank: Mandaluyong, Philippines, 2023. [Google Scholar] [CrossRef]
- Jiang, P.; Van Fan, Y.; Klemeš, J.J. Impacts of COVID-19 on energy demand and consumption: Challenges, lessons and emerging opportunities. Appl. Energy 2022, 285, 116441. [Google Scholar] [CrossRef] [PubMed]
- Bahmanyar, A.; Estebsari, A.; Ernst, D. The impact of different COVID-19 containment measures on electricity consumption in Europe. Energy Res. Soc. Sci. 2020, 68, 101683. [Google Scholar] [CrossRef]
- Strojny, J.A.; Chwastek, M.S.; Badach, E.; Lisek, S.J.; Kacorzyk, P. Impacts of COVID-19 on Energy Expenditures of Local Self-Government Units in Poland. Energies 2022, 15, 1583. [Google Scholar] [CrossRef]
- Ślusarczyk, B.; Chłąd, M.; Michałek, J.; Dacko-Pikiewicz, Z.; Androniceanu, A. Strategies for supplying enterprises with energy in the context of changing coal prices on the Polish market—The effect of the war in Ukraine. Resour. Policy 2023, 85, 104028. [Google Scholar] [CrossRef]
- Liobikienè, G.; Matiiuk, Y.; Krikštolaitis, R. The concern about main crises such as the Covid-19 pandemic, the war in Ukraine, and climate change’s impact on energy-saving behavior. Energy Policy 2023, 180, 113678. [Google Scholar] [CrossRef]
- Colgan, J.D.; Gard-Murray, A.S.; Hinthorn, M. Quantifying the value of energy security: How Russia’s invasion of Ukraine exploded Europe’s fossil fuel costs. Energy Res. Soc. Sci. 2023, 103, 103201. [Google Scholar] [CrossRef]
- Kesriklioğlu, E.; Oktay, E.; Karaaslan, A. Predicting total household energy expenditures using ensemble learning methods. Energy 2023, 276, 127581. [Google Scholar] [CrossRef]
- Xu, X.; Xiao, B.; Li, C.Z. Critical factors on electricity consumption in residential buildings: An analysis from the point of occupant characteristics view. J. Clean. Prod. 2020, 256, 120423. [Google Scholar] [CrossRef]
- Chen, C.; Xu, X.; Adua, L.; Briggs, M.; Nelson, H. Exploring the factors that influence energy use intensity across low-, middle-, and high-income households in the United States. Energy Policy 2022, 168, 113071. [Google Scholar] [CrossRef]
- Zhang, W.; Calauit, J. Occupancy behaviour and patterns: Impact on energy consumption of high-rise households in southeast China. Smart Energy 2022, 6, 100072. [Google Scholar] [CrossRef]
- Hu, S.; He, J.; Yang, C. Evaluating the impacts of the increasing block tariffs on residential electricity consumption in China. Sustain. Prod. Consum. 2022, 29, 180–187. [Google Scholar] [CrossRef]
- Chen, X.; Gou, Z. Bridging the knowledge gap between energy-saving intentions and behaviours of young people in residential buildings. J. Build. Eng. 2022, 57, 104932. [Google Scholar] [CrossRef]
- Swell, G.; Gauthier, S.; James, P.; Stein, S. Predicting UK Domestic Electricity and Gas Consumption between Differing Demographic Household Compositions. Energies 2024, 17, 4753. [Google Scholar] [CrossRef]
- Ben, H.; Steemers, K. Household archetypes and behavioural patterns in UK domestic energy use. Energy Effic. 2018, 11, 761–771. [Google Scholar] [CrossRef]
- Wang, B.; Wang, X.; Guo, D.; Zhang, B.; Wang, Z. Analysis of factors influencing residents’ habitual energy-saving behaviour based on NAM and TPB models: Egoism or altruism? Energy Policy 2018, 116, 68–77. [Google Scholar] [CrossRef]
- Belaïd, F.; Joumni, H. Behavioral attitudes towards energy saving: Empirical evidence from France. Energy Policy 2020, 140, 111406. [Google Scholar] [CrossRef]
- Fu, W.; Zhou, Y.; Li, L.; Yang, R. Understanding household electricity-saving behavior: Exploring the effect of perception and cognition factors. Sustain. Prod. Consum. 2021, 28, 116–128. [Google Scholar] [CrossRef]
- Anselmi, P.; Colledani, D.; Robusto, E. A Comparison of Classical and Modern Measures of Internal Consistency. Front Psychol. 2019, 10, 2714. [Google Scholar] [CrossRef]
- Breiman, L.; Friedman, J.H.; Olshen, R.A.; Stone, C.J. Classification and Regression Trees; Chapman and Hall/CRC: New York, NY, USA, 1984. [Google Scholar]
- Mitra, A.; Jain, A.; Kishore, A.; Kumar, P. A Comparative Study of Demand Forecasting Models for a Multi-Channel Retail Company: A Novel Hybrid Machine Learning Approach. Oper. Res. Forum 2022, 3, 58. [Google Scholar] [CrossRef]
- Valaskova, K.; Kliestik, T.; Svabova, L.; Adamko, P. Financial Risk Measurement and Prediction Modelling for Sustainable Development of Business Entities Using Regression Analysis. Sustainability 2018, 10, 2144. [Google Scholar] [CrossRef]
- Dudek, A.; Stańczyk, E. Zastosowanie drzew regresyjnych w analizie determinant sukcesu małych i średnich przedsiębiorstw. In Determinanty Sukcesu Małych i Średnich Przedsiębiorstw; Woźniak, H., Ed.; Główny Urząd Statystyczny, Urząd Statystyczny we Wrocławiu: Warszawa, Poland, 2022. Available online: https://stat.gov.pl/statystyki-eksperymentalne/badania-i-rozwoj-innowacyjnosc-spoleczenstwo-informacyjne/determinanty-sukcesu-malych-i-srednich-przedsiebiorstw,14,1.html (accessed on 25 February 2024).
- Mussini, M. On measuring income polarization: An approach based regression trees. Stat. Transit. New Ser. 2016, 17, 221–236. [Google Scholar] [CrossRef]
- Lotfy, N. Regression tree modelling to predict total average extra costs in household spending during COVID-19 pandemic. Bull. Natl. Res. Cent. 2021, 45, 127. [Google Scholar] [CrossRef]
- Nie, P.; Roccotelli, M.; Fanti, M.P.; Ming, Z.; Li, Z. Prediction of home energy consumption based on gradient boosting regression tree. Energy Rep. 2021, 7, 1246–1255. [Google Scholar] [CrossRef]
- Strzelecka, A.; Zawadzka, D. Application of classification and regression tree (CRT) analysis to identify the agricultural households at risk of financial exclusion. Procedia Comput. Sci. 2021, 192, 4532–4541. [Google Scholar] [CrossRef]
- Genç, S.; Mendeş, M. Evaluating performance and determining optimum sample size for regression tree and automatic linear modeling. Arq. Bras. Med. Vet. Zootec. 2021, 73, 1391–1402. [Google Scholar] [CrossRef]
- Kola-Bezka, M.; Leki, K. Household energy behaviour in the times of crisis: Lessons for policy initiatives from peripheral, fossil-dependent regions of the European Union. Energy Policy 2024, 188, 114113. [Google Scholar] [CrossRef]
- Wang, S.; Lin, S.; Li, J. Exploring the effects of non-cognitive and emotional factors on household electricity saving behavior. Energy Policy 2018, 115, 171–180. [Google Scholar] [CrossRef]
- Krupnova, T.G.; Rakova, O.V.; Shefer, E.A.; Semenenko, D.P.; Saifullin, A.F. Domestic energy-saving behavior index as sustainability indicator: Are Russians ready for sacrifices to protect environment? Environ. Sustain. Indic. 2022, 16, 100209. [Google Scholar] [CrossRef]
- Motz, A. Consumer acceptance of energy transition in Switzerland: The role of attitudes explained through a hybrid discrete choice model. Energy Policy 2021, 151, 112152. [Google Scholar] [CrossRef]
- Jacobsen, G.D. Do energy prices influence investment in energy efficiency? Evidence from energy star appliances. J. Environ. Econ. Manag. 2015, 74, 94–106. [Google Scholar] [CrossRef]
- Alberini, A.; Ščasný, M.; Czajkowski, M.; Bigano, A. Volatile energy markets, consumers and energy price expectations. Energy Econ. 2023, 126, 107039. [Google Scholar] [CrossRef]
- Park, J.; Woo, J. Analyzing consumer’s willingness to purchase energy-efficient appliances in response to energy price changes: Case study of South Korea. Energy Econ. 2023, 127, 107088. [Google Scholar] [CrossRef]
- Mataloto, B.; Ferreira, J.C.; Pontes Resende, R. Long Term Energy Saving Through User Behavior Modeling in Smart Homes. IEEE Access 2023, 11, 44544–44558. [Google Scholar] [CrossRef]
- Rusin, A.; Wojaczek, A. Trends of changes in the power generation system structure and their impact on the system reliability. Energy 2015, 92, 128–134. [Google Scholar] [CrossRef]
- Rusin, A.; Wojaczek, A. Changes in the structure of the Polish energy mix in the transition period to ensure the safety and reliability of energy supplies. Energy 2023, 282, 128831. [Google Scholar] [CrossRef]

Disclaimer/Publisher’s Note: The statements, opinions and data contained in all publications are solely those of the individual author(s) and contributor(s) and not of MDPI and/or the editor(s). MDPI and/or the editor(s) disclaim responsibility for any injury to people or property resulting from any ideas, methods, instructions or products referred to in the content. |
© 2024 by the authors. Licensee MDPI, Basel, Switzerland. This article is an open access article distributed under the terms and conditions of the Creative Commons Attribution (CC BY) license (https://creativecommons.org/licenses/by/4.0/).