Abstract
Gas evolution and flow patterns inside an alkaline electrolyzer cell strongly affect efficiency, although such effects have not been explored in detail to date. The present study aims to critically analyze the dependence of cell performance on the multiphase flow phenomena, defining some key metrics for its assessment using CFD. Six performance indicators, involving gas accumulation, bubble coverage, and flow uniformity, are applied to a 3D CFD model of an alkaline cathodic cell, and possible optimizations of the cell geometry are evaluated. The results demonstrate the complexity of defining the optimal indicator, which strictly depends on the case study and on the analysis at hand. For the cell analyzed herein, the parameters linked to the electrode volume fraction were indicated as the most influential on the cell efficiency, allowing us to define the best geometry case during the optimization. Furthermore, a sensitivity analysis was conducted, which showed that higher mass flow rates are generally preferable as they are linked to higher bubble removal. Higher current densities, allowing enhanced gas production, are instead associated with slightly lower efficiencies and stronger nonuniformity of the electrolyte flow inside the cell.
1. Introduction
For long-term storage of renewable energy sources, hydrogen has been identified as one of the best engineering alternatives since it can be efficiently produced from water electrolysis in case of renewable energy surplus. Compared with other technologies, alkaline water electrolyzers (AWEs) show key advantages such as durability, maturity, and low specific costs, with all characteristics well-proven industrially. Nowadays, AWEs are commercially available in the MW range and able to cover high hydrogen demands. According to Rodríguez and Amores [1], the cost of alkaline electrolysis systems of this size is around 600 to 1000 USD/kW and, recently, was evaluated to be even lower, up to 500 USD/kW, by Wang et al. [2]. The challenges in expanding the use of water electrolysis include reducing energy consumption, costs, and maintenance requirements while also improving the efficiency, durability, and safety of electrolyzers.
Electrolyzer efficiency is linked to both static and dynamic factors. As discussed by Bazarah et al. [3], static factors, such as temperature, pressure affect cell operation. Among the dynamic factors are the water flow rate and the influence of gas evolution. Going into deeper detail, as thoroughly described by Zarghami et al. [4], the performance of alkaline electrolysis cells is closely linked to the fluid dynamics characteristics of the two-phase flow from many points of view. Bubbles are known to cause local turbulence near the electrode, increasing the transport of active species. While in a zero-gap electrolysis cell, the bubbles attached to the electrode reduce the effective electrode surface area [5]; whereas, in non-zero-gap configurations, the rising bubbles act as moving electrical insulators, thus affecting the current density distribution and increasing the ohmic overpotential across the cell [6]. At higher current densities (>1000 A/m2), an appreciable reduction in conductivity due to the bubble layer was detected in [7]. Angulo et al. provided a deep discussion of the topic, with a background on the physics of bubble evolution and outlining how bubbles affect energy efficiency with their impact on overpotentials [8]. It is worth recalling that the cell efficiency can be calculated as the ratio between the ideal potential, without losses, and the actual potential that is increased by activation, ohmic, and concentration overpotentials. Thus, cell optimization mainly deals with lowering the cell potential. To achieve that, the role of the surface bubble layer as well as of the bulk bubbles must be considered in cell design, in order to reduce as much as possible the bubble coverage of the electrode.
In addition, when studying PEM electrolysis, Norazahar et al. explain how hot spots, leading to mechanical and chemical degradation, are linked to the quality and quantity of water at the anode [9]. A too-high gas volume fraction, causing local drying of the membrane, may be detrimental to the life of the cell. Unfortunately, there is still a general lack of studies on AWE membrane degradation.
Strictly linked to the gas volume fraction, the flow inside the cell can be optimized to avoid stagnation of fluid at the electrode. With this in mind, to model the gas behavior, Rajora and Haverkort provided analytical relations for velocity and gas volume fraction profiles near the electrode [10], while Aldas et al. linked the electrolyte inlet mass flow to the gas volume fraction, showing a direct dependence of the mass flow rate on the volume of gas inside the cell [11]. According to Mat et al., the gas release rate increases with the electrolyte flow velocity due to the consequent decrease in the bubble residence time on the electrode [12]. Some authors show how the achievement of uniform electrolyte flow can be critical in mitigating AWE energy consumption [13,14]. In their study, Gao et al., using a 3D numerical model of an electrolyzer cell, corroborated the thesis that low velocities correspond to stagnation of bubbles and higher local volume fractions that contribute to reducing local current densities by increasing ohmic overpotentials [15].
It is evident from the literature review that research is still at a phase of fluid dynamics model calibration. The absence of a real-scale cell experimental validation of the fluid dynamics models does not help determine the sound parameters for a CFD model. For example, of particular interest would be the determination of the diameter distribution of the gas bubbles in a pressurized cell. Furthermore, 3D CFD models of full-geometry alkaline electrolyzer cells are rare [13,14,16].
In this context, few of the mentioned studies focus on defining which variables are pivotal to assessing the cell quality from a fluid dynamics point of view: Xue et al. introduced a parameter Γ to evaluate the flow uniformity and analyze the volume fraction at the electrode to assess the cell performance for different geometries [13]. Still, to the best of the authors’ knowledge, a comparison of the parameters that can be employed for the fluid dynamics evaluation of the cell is absent in the literature. The present paper tries to bridge this gap, providing an overview of the possible variables for such analysis, defining some key metrics, regarding bubble coverage, gas accumulation, and flow uniformity, and applying them to a 3D CFD model of a real electrolyzer cell. In particular, building upon experience collected in the joint numerical and experimental development of AWEs with an industrial partner, the indicators selected for the study are as follows: gas volume inside the cell, average and maximum gas volume fraction at the cathode, the ratio between gas volume fraction at the electrode and at the outlet, average liquid velocity in the form of a flow uniformity parameter, and recirculation liquid velocity.
To achieve cell optimization, various geometries of the cathodic cell are taken into account, evaluating the output of key variables and performance parameters. Furthermore, a sensitivity analysis is conducted to assess the impact of varying mass flow rates and current density on the chosen indicators.
The paper is divided into six sections, including this one. Section 2 presents the case study electrolyzer on which the CFD model was built. Section 3 details the methodology and the numerical model setup, covering aspects such as geometry, mesh construction, and the specific models and forces employed in the Fluent 2023 R1 software. Performance indicators are also introduced and defined in this section. Section 4 and Section 5 present and discuss the results of the optimization and sensitivity analyses. Finally, Section 6 provides some conclusions of the study and lists the main takeaways.
2. Case Study Electrolyzer
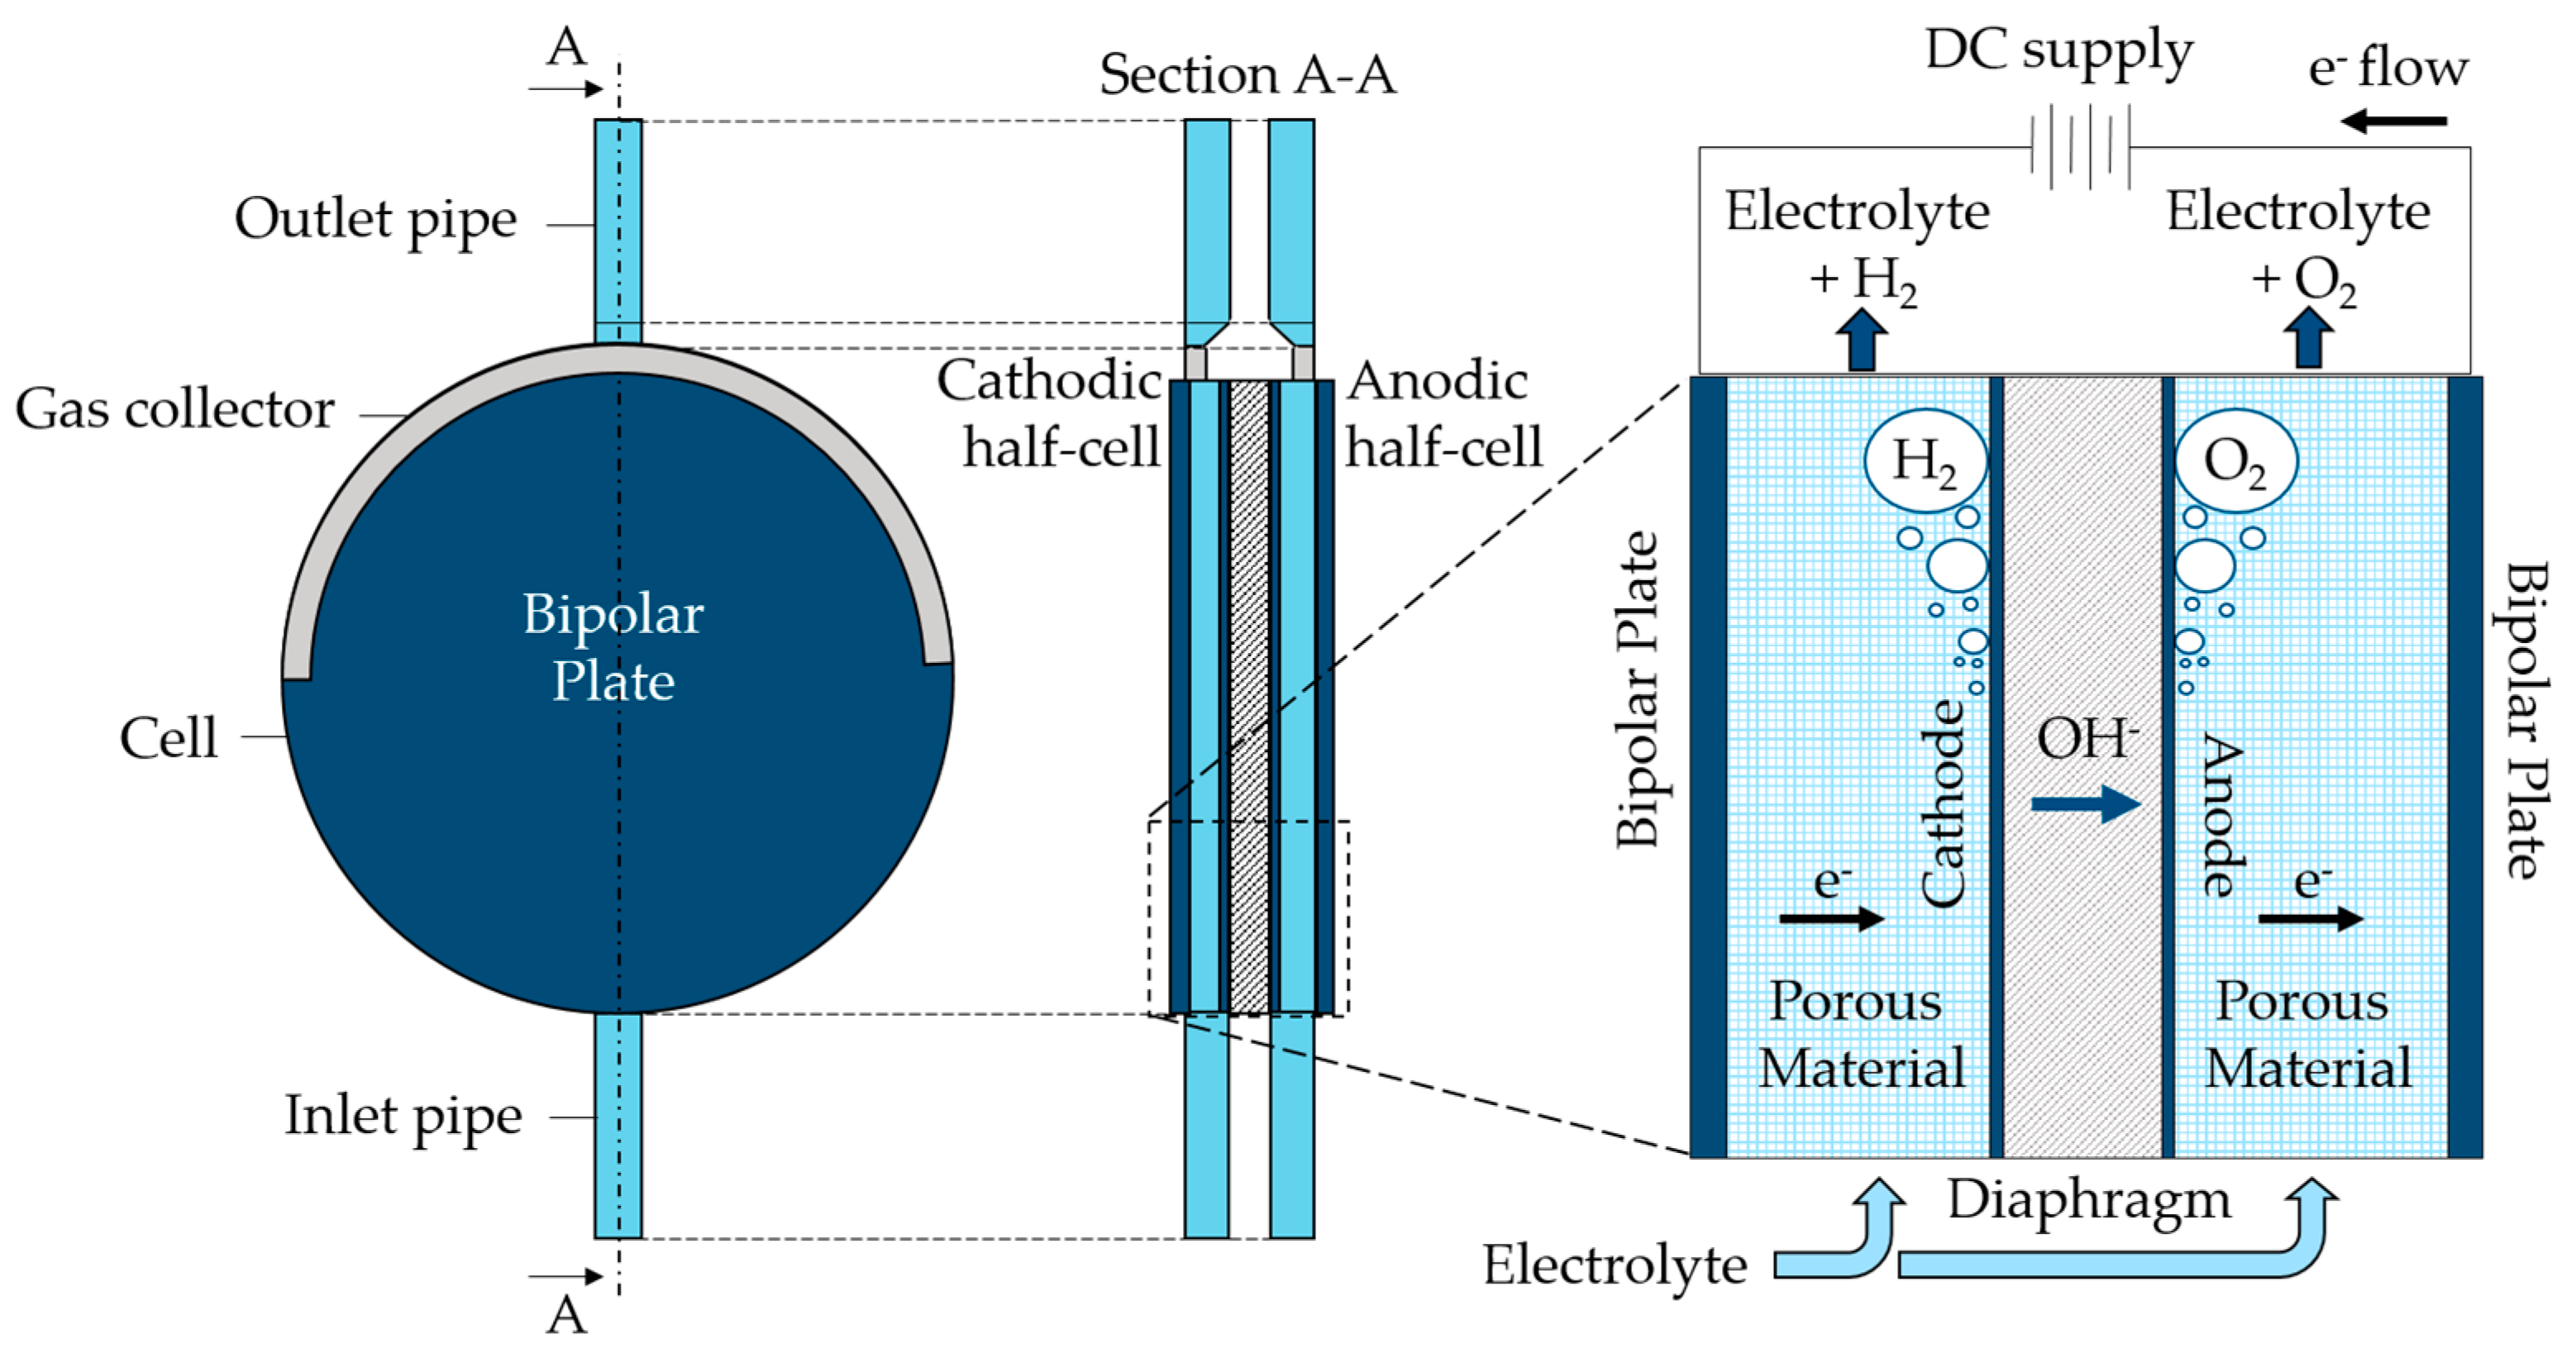
An alkaline water electrolyzer, characterized by a nominal hydrogen production of 200 Nm3/h and a pressure of 30 bar gauge, was chosen for the analysis. The cells are of the zero-gap type, having the anode and cathode placed directly on the diaphragm used for hydroxide ions transport, and two bipolar plates at the cell sides to which the current is applied. Thanks to porous conductive material, the electrons reach the internal cathode where hydrogen and hydroxide ions are generated, as expressed by the hydrogen evolution reaction in Equation (1). The diaphragm, made of polyphenylene sulfide (PPS), is only permeable to liquids and allows ions to flow toward the anode, moved by the potential field. At the anode, an oxygen evolution reaction takes place, as displayed in Equation (2), oxygen is generated, and the electrons close the circuit reaching the anodic bipolar plate.
The cell is disk-shaped and the electrolyte, a KOH 28 wt% aqueous solution, enters the cell from a bottom pipe and flows inside it upward. The gas produced by the half-cells is collected in the upper part of the cell by a gas collector, and both the electrolyte and the gas leave the cell from a pipe at the top of it. A functional scheme, including the indication of main components, is displayed in Figure 1. This cell was chosen for the analysis due to its working conditions, with high current density associated with elevated average electrode volume fraction. Such characteristics make it an interesting case study for the purpose of the paper. The exact value of the applied current cannot be disclosed for industrial privacy reasons. The working temperatures have values between 60 °C and 80 °C.
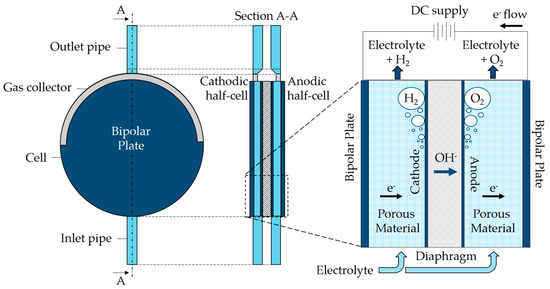
Figure 1.
Scheme of the case study alkaline electrolyzer cell.
3. Methodology
For the necessary multiphysics analysis of the cell, we chose a RANS CFD modeling, with a particular focus on fluid dynamics aspects. Steady calculations are sufficient for the case study, operating the cell in steady conditions.
More specifically, the study was conducted in the ANSYS 2023 R1 environment, which is particularly effective for geometry optimization. The fluid dynamics simulations were performed in Fluent, which allowed us to integrate the electrochemical model into the general fluid dynamics setup. As further explained in Section 3.3, an Euler–Euler model was chosen for the two-phase simulations.
3.1. Geometry
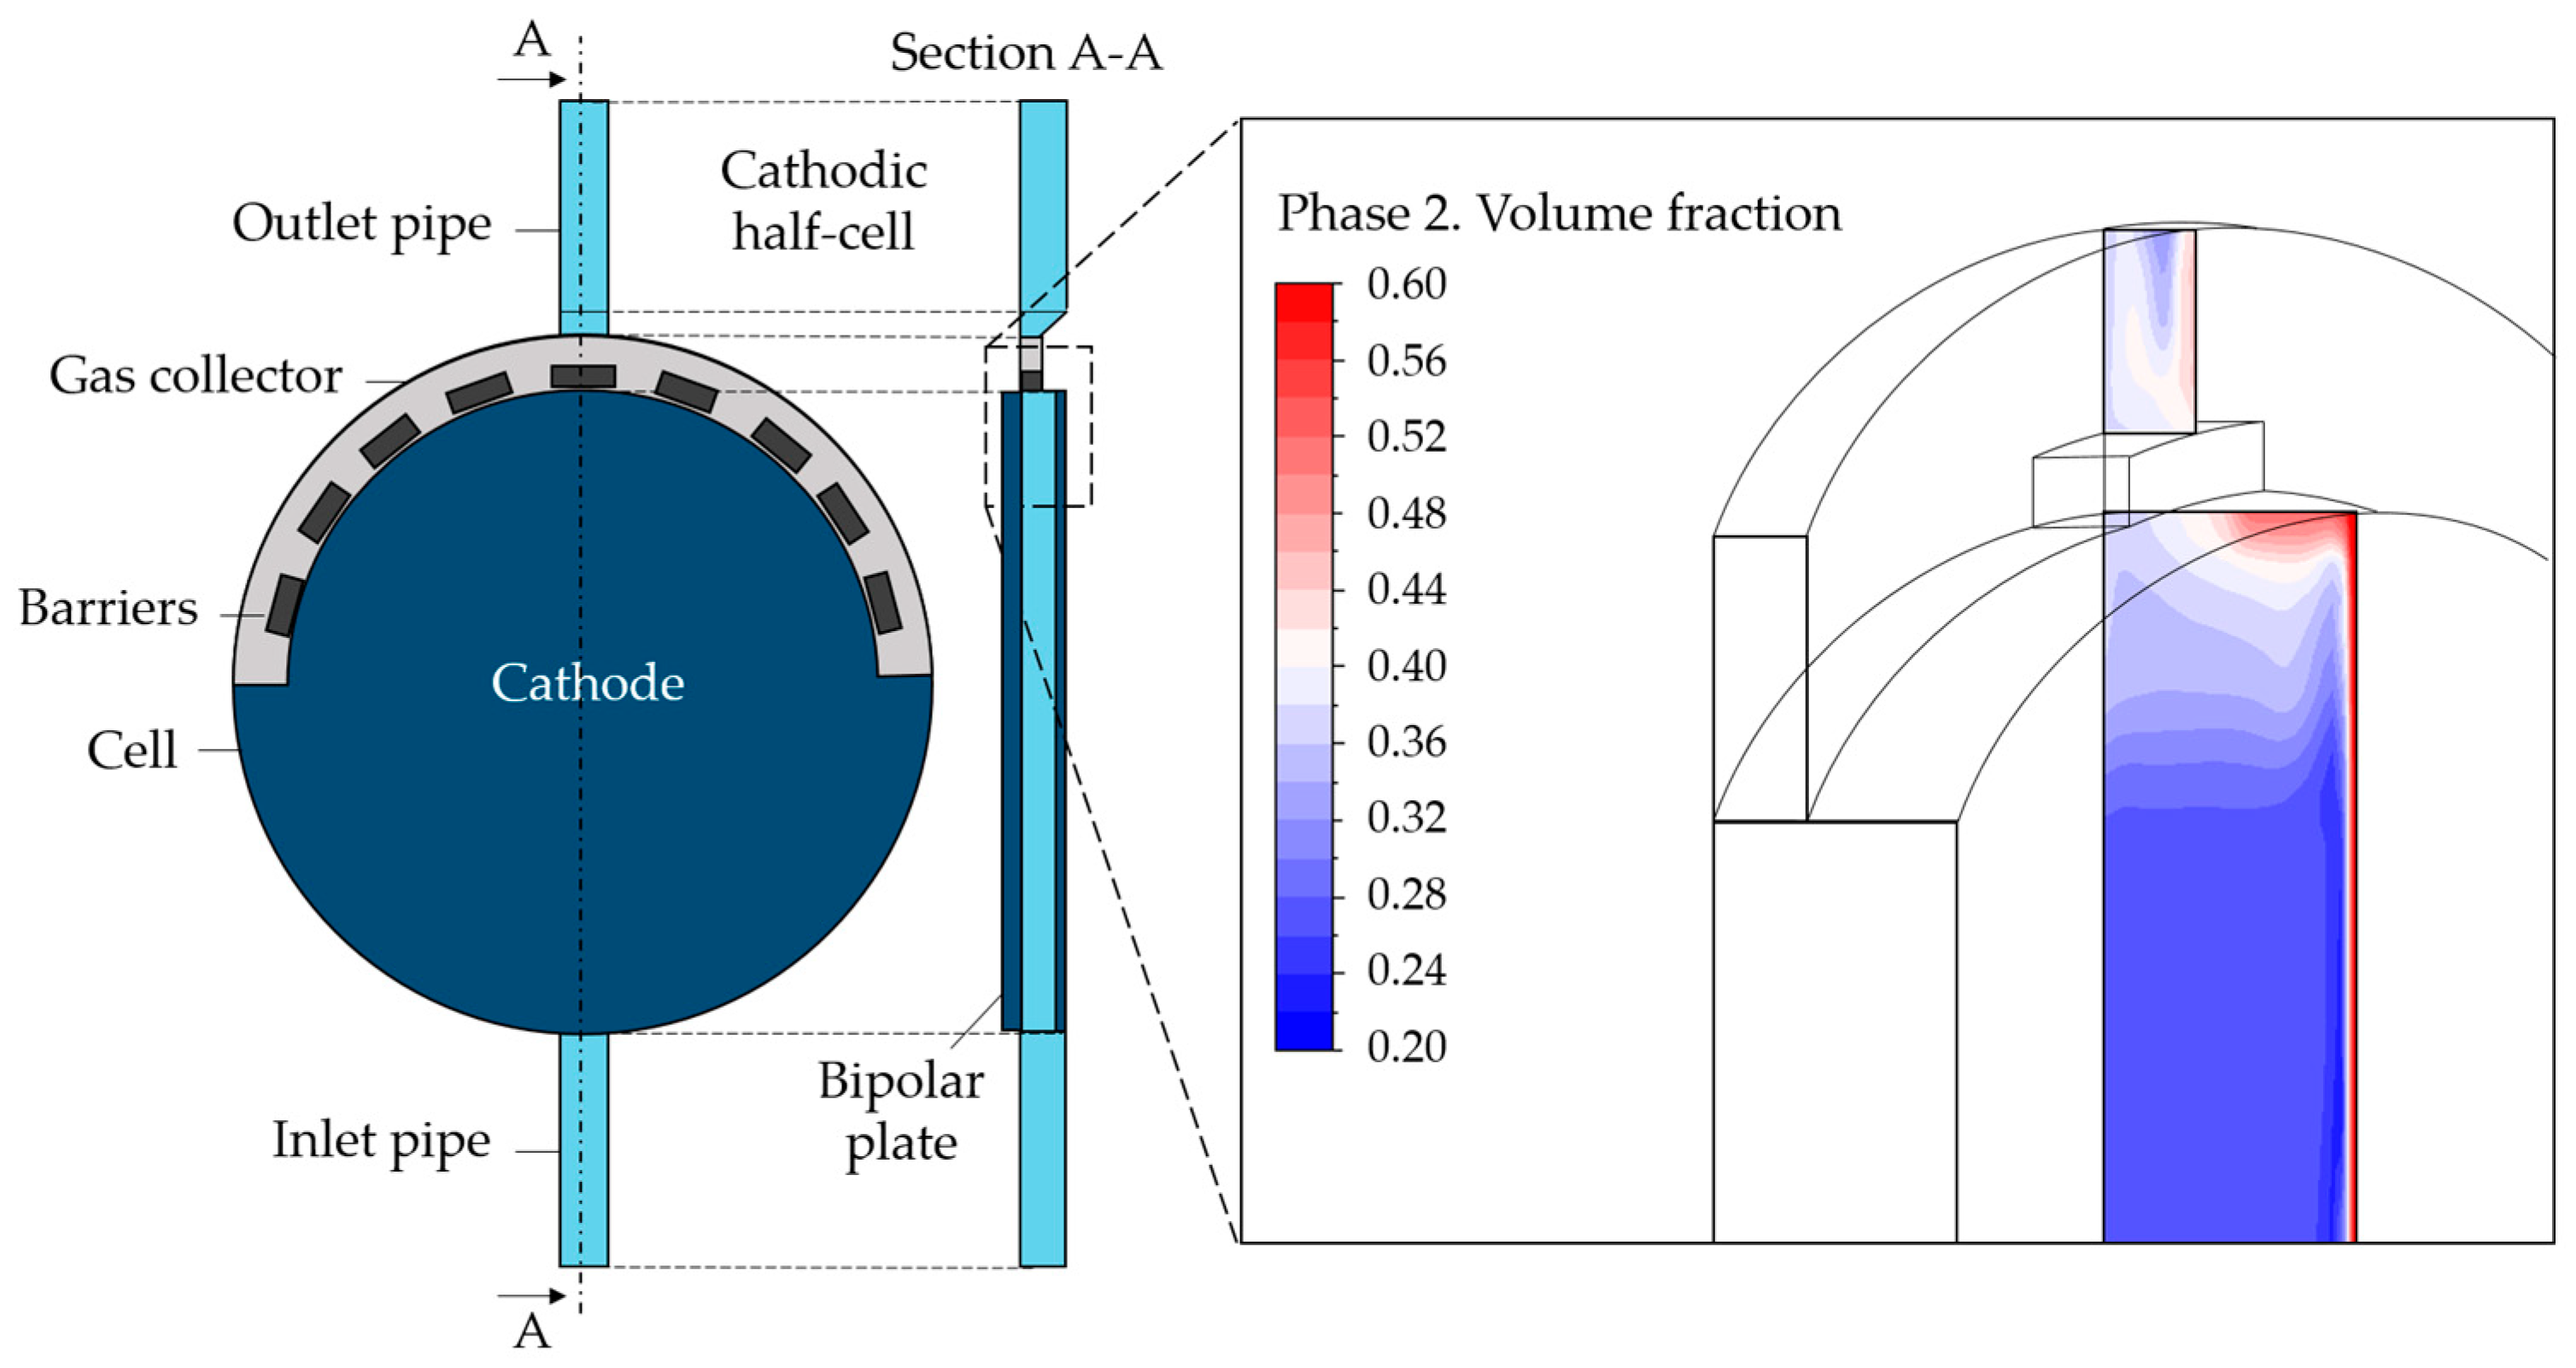
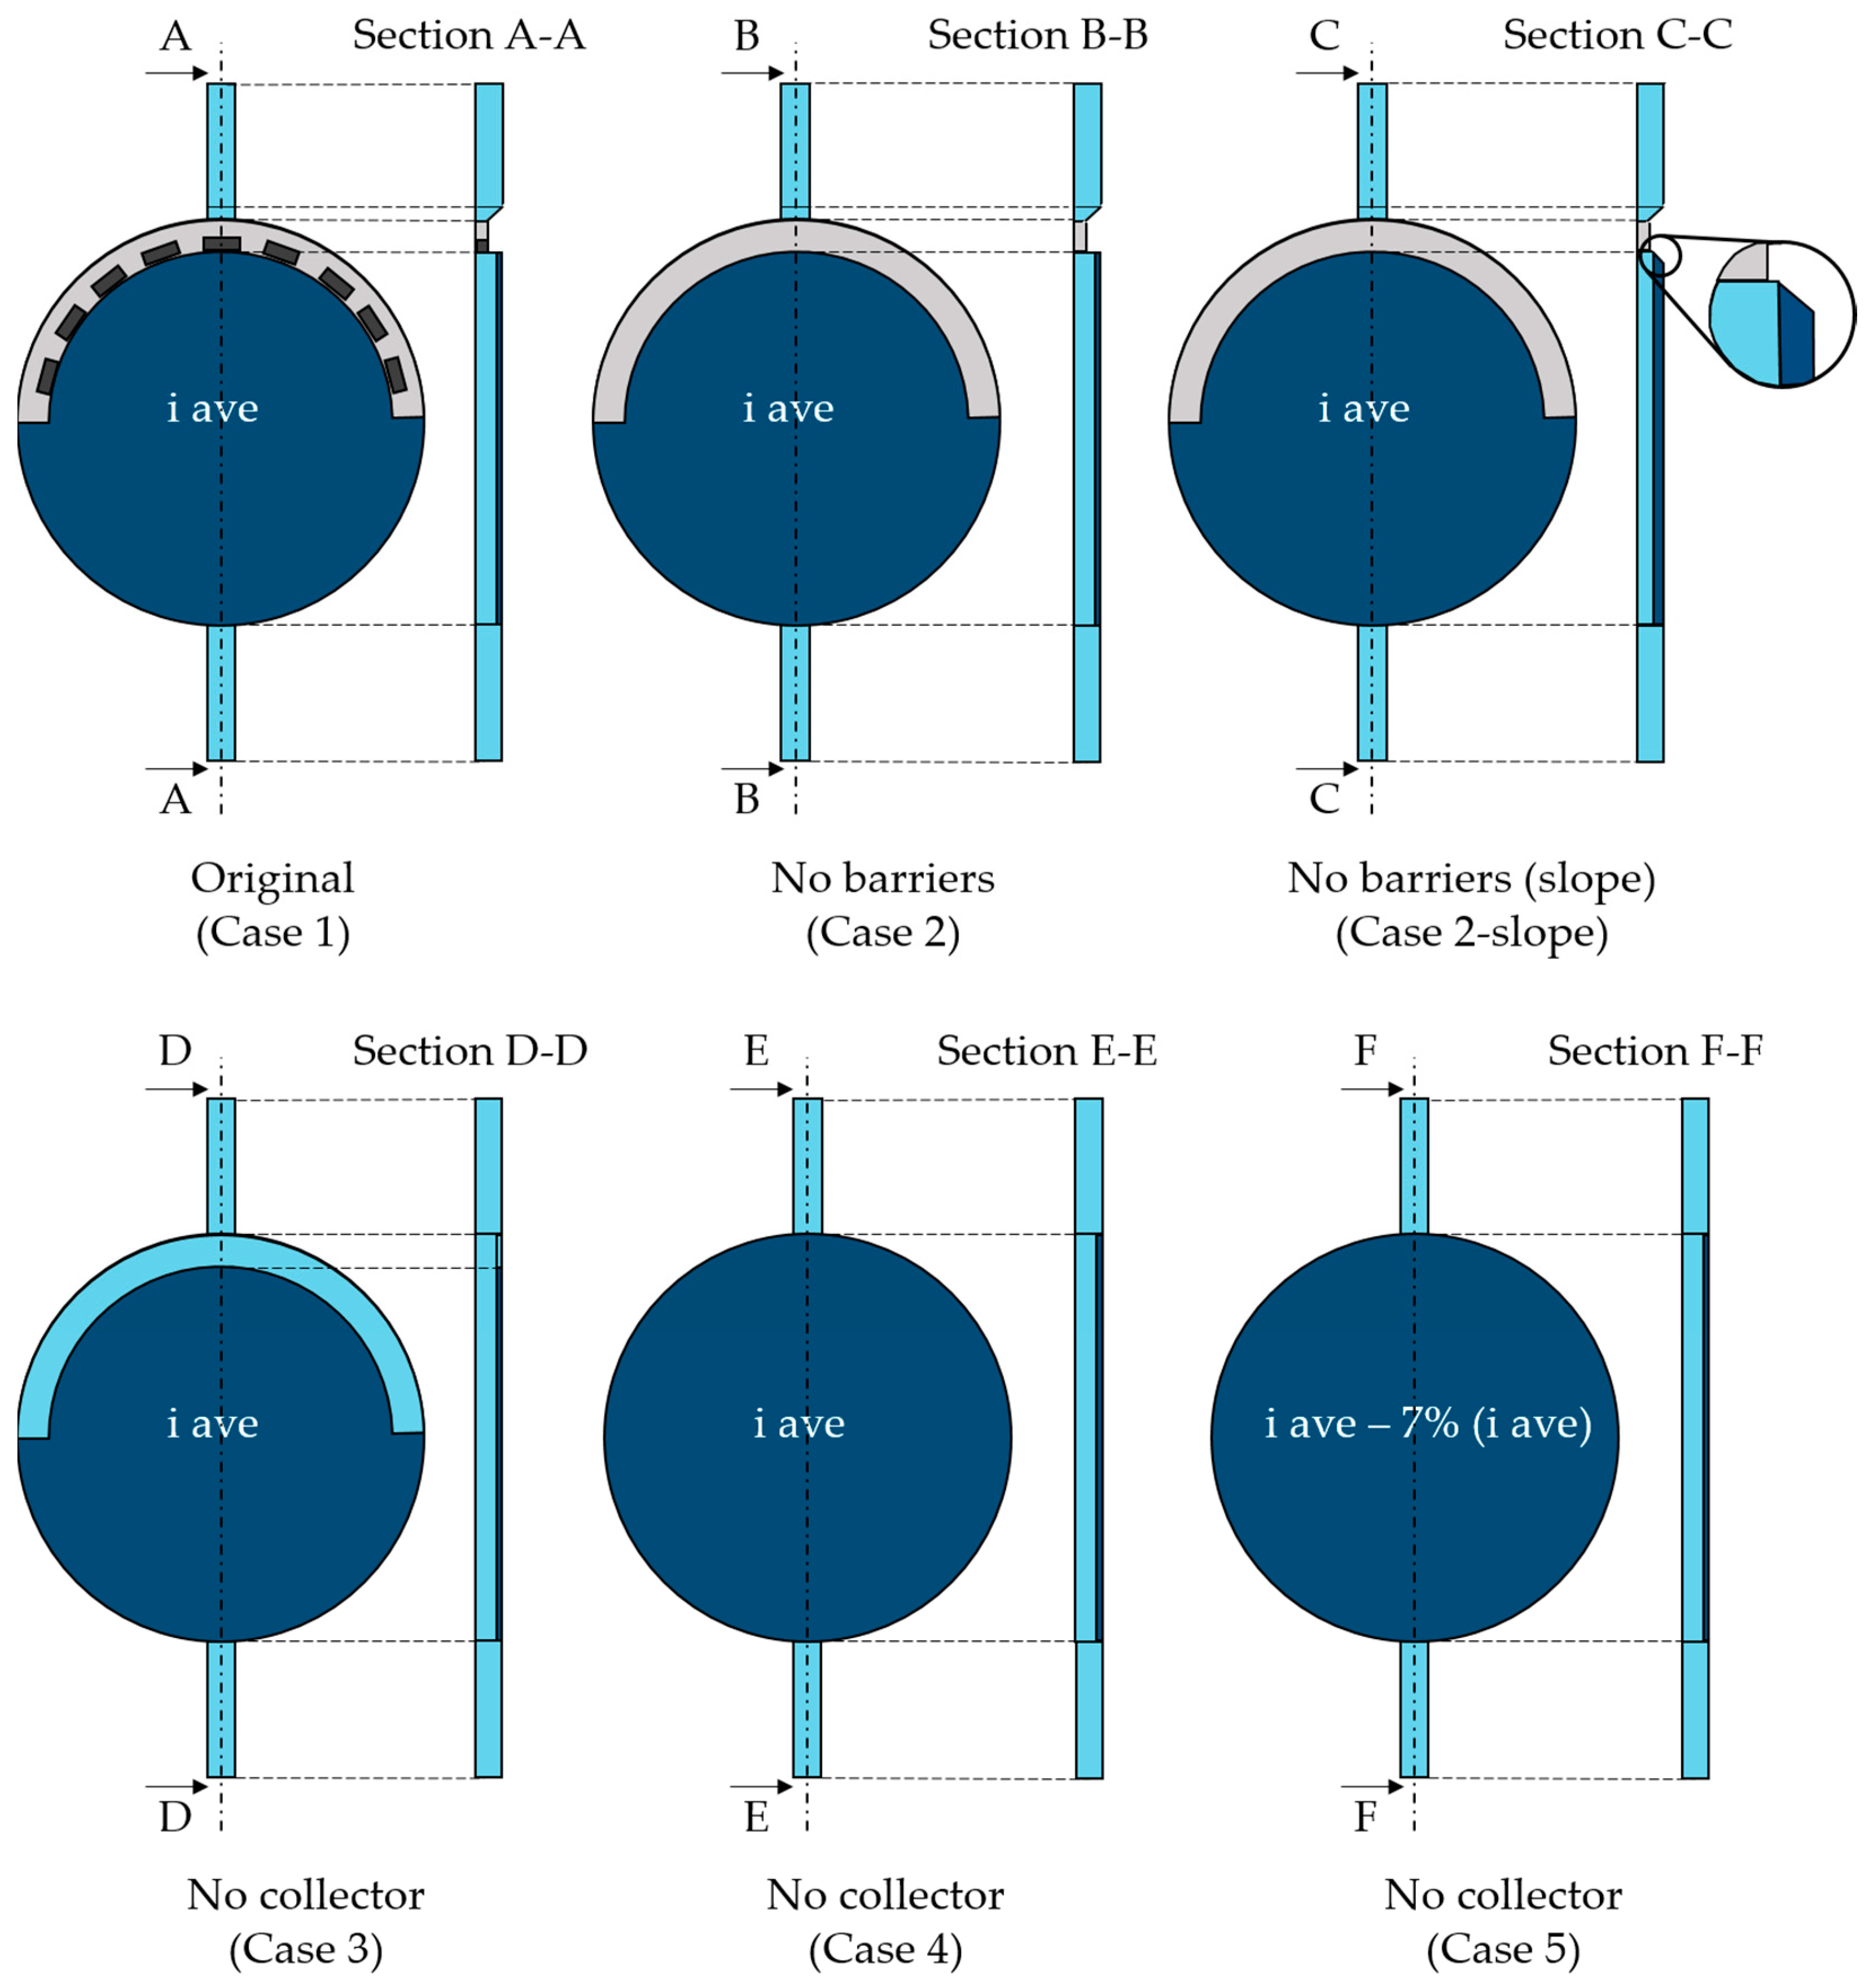
The geometry was created using Design Modeler. Specifically, the cathodic cell was built for the scope of the present paper—i.e., the portion of the alkaline cell included between the cathode and the bipolar plate in Figure 1. Beginning with the original geometry referred to as “Case 1”, alternative configurations were explored. More specifically, the component at the top of the cell, i.e., the gas collector, was the primary focus of the analysis. The standard design is characterized by some orifices that accelerate the flow toward the exit. Based on the hypothesis that the solid elements between the orifices could constitute a barrier to the gas flow, the first modification concerned the removal of these parts, leading to “Case 2”. Second, to facilitate the mass flow, a slope on the gas collector was created (“Case 2-slope”). Last, the same gas collector removal was considered. This possibility was addressed since during CFD simulations, it was observed that the gas collector could hinder the gas upward movement toward the outlet pipe due to the location of the electrode inside the cell. The gas behavior at the collector can be observed in Figure 2 where the gas volume fraction contour is reported on a vertical section. The electrode is on the right where the gas volume fraction is visibly higher. As can be seen, the reduction in the section in the upper part, with the entrance to the gas collector, represents an impediment to the gas rise, causing undesired gas accumulation.
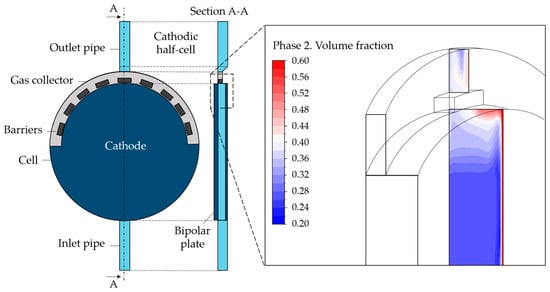
Figure 2.
Cathodic half-cell geometry and gas volume fraction contour in the upper part of the cell.
The gas collector removal generated three different case studies: “Case 3” with the same electrode area as the original and “Case 4” and “Case 5” with an increased electrode surface, including the previous gas collector area. In particular, “Case 4” was built considering the same current density, thus increasing hydrogen production at the output, while a reduced current density was applied in “Case 5” to have the same hydrogen production as in the case of the original geometry.
Specific cell details cannot be disclosed since they are proprietary information of the company; however, a general idea of the original and modified geometries is given in Figure 3. The grey area represents the gas collector, whereas the dark blue one refers to the electrode. Except for “Case 5”, the electrode is supplied with the same average current density whose design value cannot be disclosed. The value of “Case 5” current density is subtracted by 7%. Such a percentage, in fact, represents how large the collector area is compared with the electrode surface. This way, the last case has the same total current as the original one. Table 1 summarizes the main operating parameters, with “Design” indicating the nominal one.
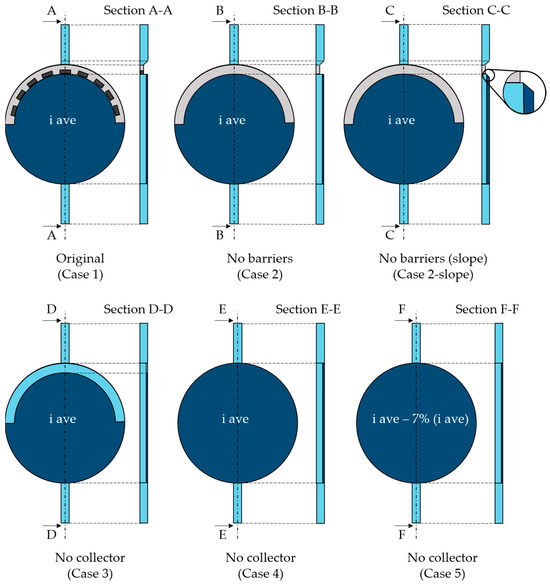
Figure 3.
Original (Case 1) and modified geometries (Case 2–Case 5), with respective sections.

Table 1.
Operating parameters for the six cases.
3.2. Mesh
A hexahedral mesh was built in the Ansys meshing environment and a grid independence test was conducted to obtain precise modeling. As already mentioned in [17] by the authors, when dealing with two-phase flows, a trade-off between the gas bubble size and the gas production layer must be carried on to find the minimum grid thickness Lmin at the electrode for stable and physically meaningful simulations, as displayed in Equation (3):
where d is the bubble diameter (m), Vg is the volume of the gas generated in the first layer of cells at the electrode (m3), and A is the electrode surface (m2).
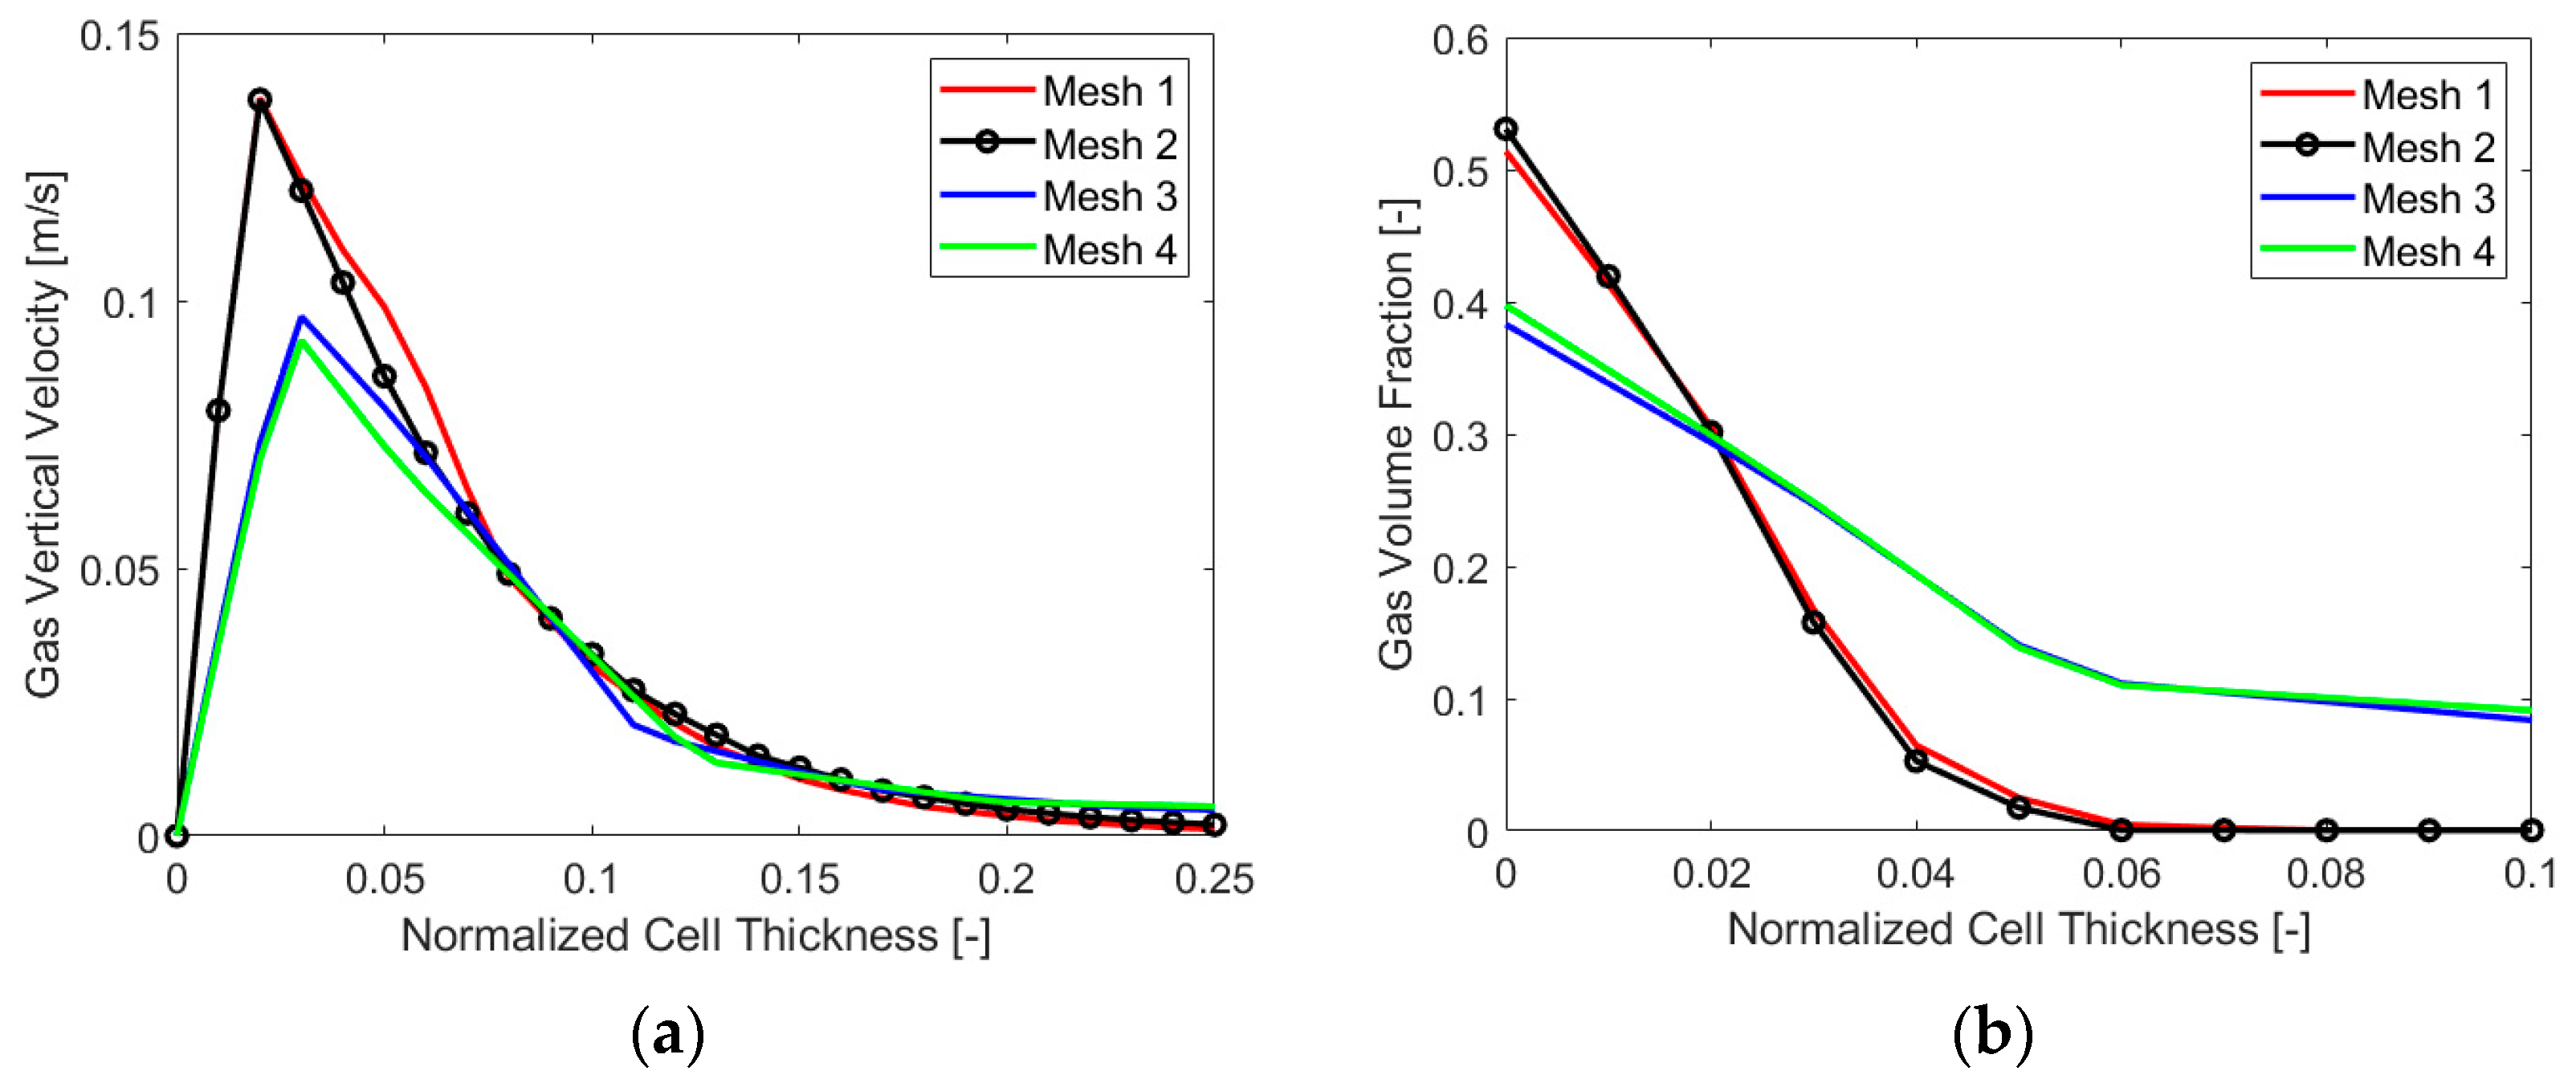
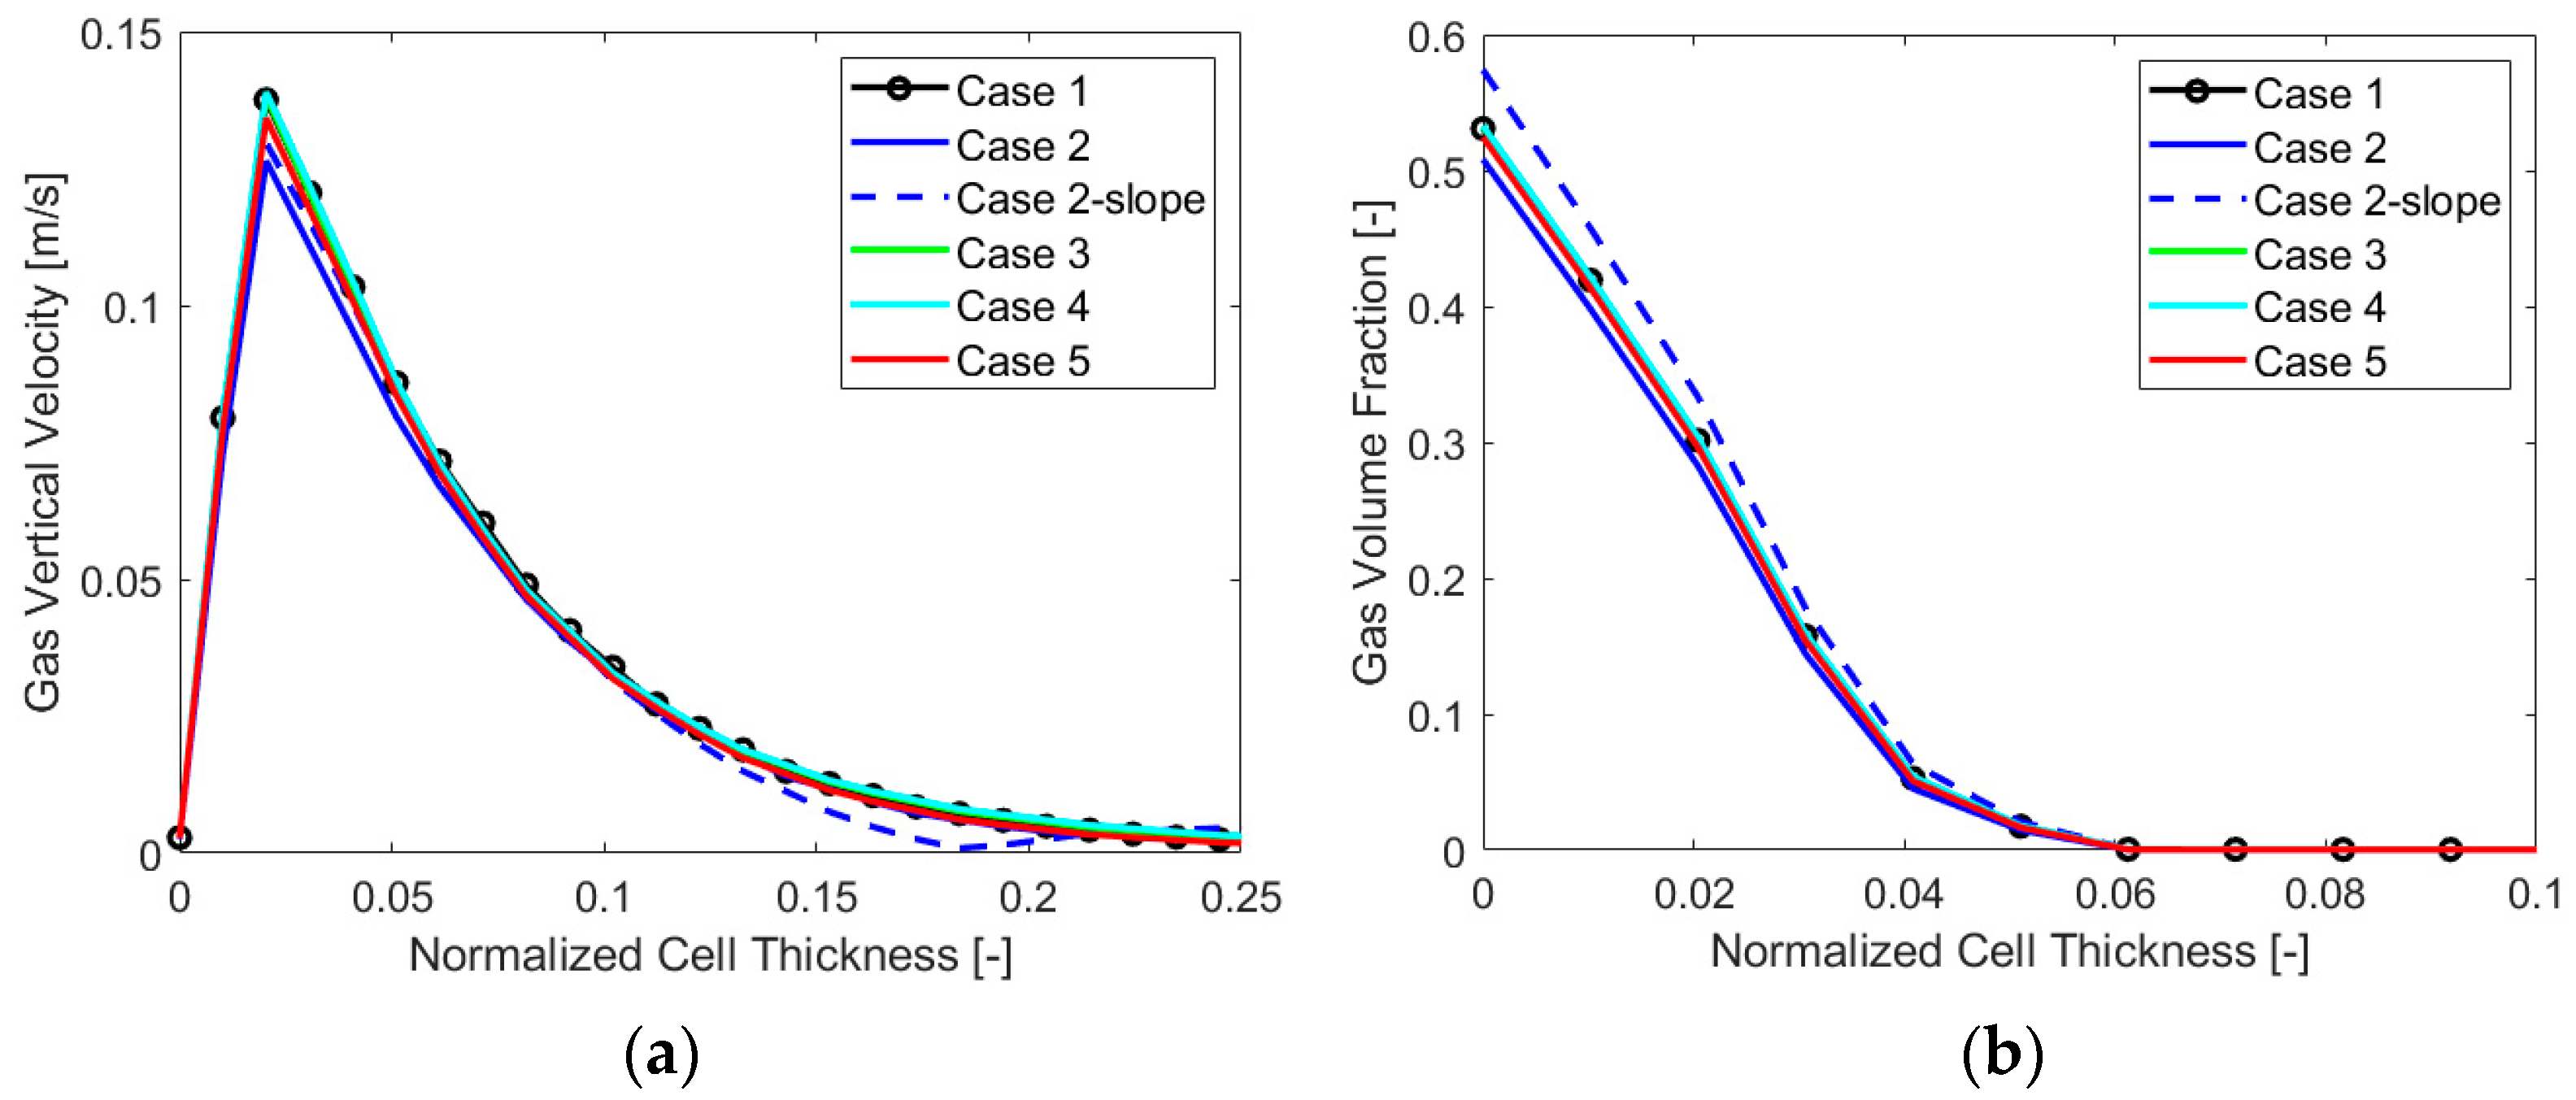
In this case, a calculation of the minimum necessary layer size at the electrode gave a value of 110 µm, the chosen bubble diameter being 10 µm, as clarified in Section 3.3.2. In fact, for such Eulerian simulations, having a cell size that is lower than the diameter can make no sense physically. At the same time, it is crucial not to have a volume of the cell at the electrode lower than the local amount of gas produced for a stable numerical simulation. Therefore, a chosen minimum cell size of 150 µm was employed, and starting from this value, four different mesh sizes were evaluated, two having a minimum cell thickness at the electrode of 150 µm and the others having a minimum size of 225 µm. As the main variable gradient perpendicular to the electrode, the cell size in this direction constituted the main distinction among the four meshes. A variation between the two finest and coarsest cases was obtained by changing the element size on the electrode, which resulted in a number of elements of around 8 million (“Mesh 1”) and 4 million (“Mesh 2”) for the first two and 2 million (“Mesh 3”) and 1 million (“Mesh 4”) for the last two. Figure 4 reports the results in terms of a gas volume fraction (VF) and vertical velocity for the four cases analyzed. It is possible to see that “Mesh 1”, the finest, is not very different from “Mesh 2”, as expected. The same can be said for “Mesh 3” and “Mesh 4”. A significant difference was instead evident between the first two and the second two, and the final choice for the mesh size was “Mesh 2”, which was precise enough but not as computationally heavy as “Mesh 1”.
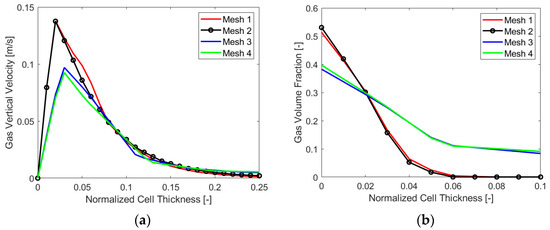
Figure 4.
Mesh sensitivity analysis: (a) gas vertical velocity and (b) VF along the cell thickness.
3.3. Fluid Dynamics Modeling
The flow characterizing electrolyzer cells is a two-phase flow with a liquid electrolyte and gas bubbles being generated at the electrodes. For CFD analyses, two main approaches are used to simulate such flows: Euler–Lagrange, which considers the electrolyte as a continuous phase and the gas bubbles as a discrete phase, and Euler–Euler, for which the different phases are mathematically treated as interpenetrating continua.
In Ansys Fluent, three different Euler–Euler multiphase models are available: the volume of fluid (VOF), the mixture, and the Eulerian model, which, differently from the previous ones, solves a set of continuity equations for each phase. Coupling is achieved through pressure and interphase coefficients. Due to the dispersed state of bubbles, the two-phase Eulerian model was chosen. A brief description of the mathematical setup is reported in the following section, relevant for the interpretation of the results.
3.3.1. Eulerian Model Equations
The mass continuity equations for the two-phase Eulerian model can be written for each phase as displayed in Equations (4) and (5), with subscript “l” referring to the liquid phase and subscript “g” to the gas phase:
where are, respectively, the volume fraction, the density, the velocity, and the mass source term of phase “k”, while and indicate the mass transfer from the liquid phase to the gas phase and vice versa.
Equations (6) and (7) represent the momentum continuity equations for each phase:
where is the pressure shared between the two phases, and are external body forces, is the drag force and is the interphase velocity, and are the lift forces, and are the wall lubrication forces, and are the virtual mass forces, and and are the turbulent dispersion forces. Finally, and are the stress tensors. The forces considered for the present model are described in Section 3.3.3.
3.3.2. Main Modeling Hypotheses
The following hypotheses were adopted for the fluid dynamics modeling:
- Inlet temperature and operating pressure were chosen equal to 60 °C and 30 bar, consistently with the real application.
- Primary phase is a 28 wt% solution of KOH in water, whereas the secondary phase is hydrogen.
- The flow regime was set as turbulent, employing a k-ω SST model with low Reynolds correction. As pre-model prescriptions, y+ values were kept below 1 within the boundary layer.
- The bubble diameter for hydrogen gas was chosen to be constant and equal to 10 µm. This reference value was based on the recent investigation presented in [18] where the mean bubble diameter is characterized as a function of working pressures from 1 to 200 bar, by means of the empiric Equation (8):where db is the mean bubble diameter in µm and pbar is the pressure in bar. This value is also in line with the experience of the industrial partner.
- Bubble coalescence and breakage were neglected due to the high current densities.
- The cell is porous with viscous and inertial resistances obtained using the Davies equation [19].
Regarding the boundary conditions, a proper pressure gauge value was employed at the outlet and a mass flow rate at the inlet. No-slip conditions were applied at cathode and bipolar plate walls, for both liquid and gas phase.
3.3.3. Forces
The force that most significantly influences the movement of bubbles inside the cell is the buoyancy force due to a significant difference in density between the electrolyte and gaseous hydrogen. Among interface forces exchanged between the gas and liquid phases, the main ones generally employed to implement the Eulerian model are drag, lift, wall lubrication, and virtual mass forces. For the present study, assuming that bubbles are spherical, of small size, and non-deformable, the lift force was neglected as also indicated by the solver’s guidelines [20]. The drag force (Equation (9)) represents the liquid resistance of gas bubbles to the movement, acting in the opposite direction of the bubble–liquid slip velocity, and expressed as follows:
where Cd is the drag coefficient, which was implemented using Ishii–Zuber modeling in non-deformable conditions and chosen because it was more suitable for the bubbly flow and more stable from a numerical point of view, following the indications in [21]. The coefficient is expressed in Equation (10):
where Re is the Reynolds number, calculated in Equation (11):
where µl is the liquid dynamic viscosity. A wall lubrication force (Equation (12)) was also activated inside the model. It is calculated by the software as:
where Cwl is the wall lubrication coefficient, which was considered using the Antal et al. [22] model, the relative velocity component tangential to the wall surface, and the unit vector perpendicular to the wall. Finally, a virtual mass force (Equation (13)) was included among the forces between phases:
where Cvm the virtual mass coefficient, chosen equal to 0.5, due to the spherical shape hypothesis for the bubbles.
3.3.4. Electrochemical Modeling
The hydrogen gas was introduced into the model activating the available electrochemical module and imposing the hydrogen evolution reaction at the cathode wall, as in Equation (1). A function for the current density was applied at the electrode as already performed by the authors in [17]. As shown in Equation (14), the electrical quantity is directly dependent on the local gas volume fraction:
where ivar is the variable local current density, defined cell by cell; iave is the average electrode current density; VF is the local volume fraction for the gas phase; and VFave is the average electrode gas volume fraction, calculated for each iteration. A reduced local current density is expected where more gas is present; hence, ivar decreases with the height of the cell while having a constant average current density, dependent on the current applied. The software calculates the amount of gas produced by solving Faraday’s law (Equation (15)):
where MH2 represents the molar flow of hydrogen, i is the current density, A is the active area of the cathode, F = 96,487 As/mol is the Faraday constant, and z is the number of electrons involved in the electrochemical reactions. In this case z = 2, as can be derived from Equation (1).
3.4. Performance Indicators
The key performance indicators employed by the authors to assess the quality of the cell from a fluid dynamics point of view are listed below:
- Gas volume inside the cell (Vgas): This value represents the volume of gas that can be found in the portion of cell in front of the electrode. As already mentioned in the Introduction, a lower amount of gas in the cell is to be looked for since a dispersed gas contributes to increasing the electrolyte resistivity and, thus, the overall potential. The value was normalized for “Case 4” and “Case 5” for a better comparison with the others since the portion of active cells is larger for these cases. To achieve that, their values were multiplied by the ratio between the original and the extended volumes in front of the electrode.
- Average gas volume fraction at the electrode (VFave): According to the definition of bubble coverage, this indicator may be considered as the most important analytical parameter, for the direct effect it has on the electrode functioning.
- Maximum gas volume fraction value at the electrode (VFmax): This parameter can be crucial to detecting hot spots, leading to possible material degradation. In fact, due to the different specific heats of gas and liquid, the high local presence of gas on the electrode can affect the temperature distribution. This is especially true for the anode since oxygen specific heat is generally lower than the electrolyte heat at the operating pressures and temperatures employed.
- Ratio between gas VF at the electrode and gas VF at the outlet (VFratio): This indicator increases if the gas accumulating at the electrode is higher than the gas leaving the cell. It is of interest because, being a ratio, it can be used to compare different current density cases of the same geometry.
- Velocity uniformity (Γ), defined in Equation (16) [13]:calculated by considering an arbitrary number of n points in a chosen section for the analysis. is the average velocity of the fluid for the locations considered, and ui is the specific velocity at the point. Thus, it gives an idea of the flow velocity uniformity with respect to the average values that can be found in a chosen section. Γ can vary between 0 and 1 and a value of Γ = 1 corresponds to a uniform velocity throughout the section. In our case, this possibility is not to be expected due to the higher velocities at the cathode.
- Liquid recirculation (rec): This indicator represents the ratio between the maximum downward and upward velocities of the liquid at the mid-section of the cell. Downward velocities are caused by recirculation, whereas upward velocities are due to the electrolyte flow and gas buoyancy. Higher efficiency is expected when flow recirculation is the minimum, but on the other hand, no specific studies on the topic could be found in the literature. A certain local turbulence could also be beneficial for gas removal, as Zarghami et al. [4] pointed out.
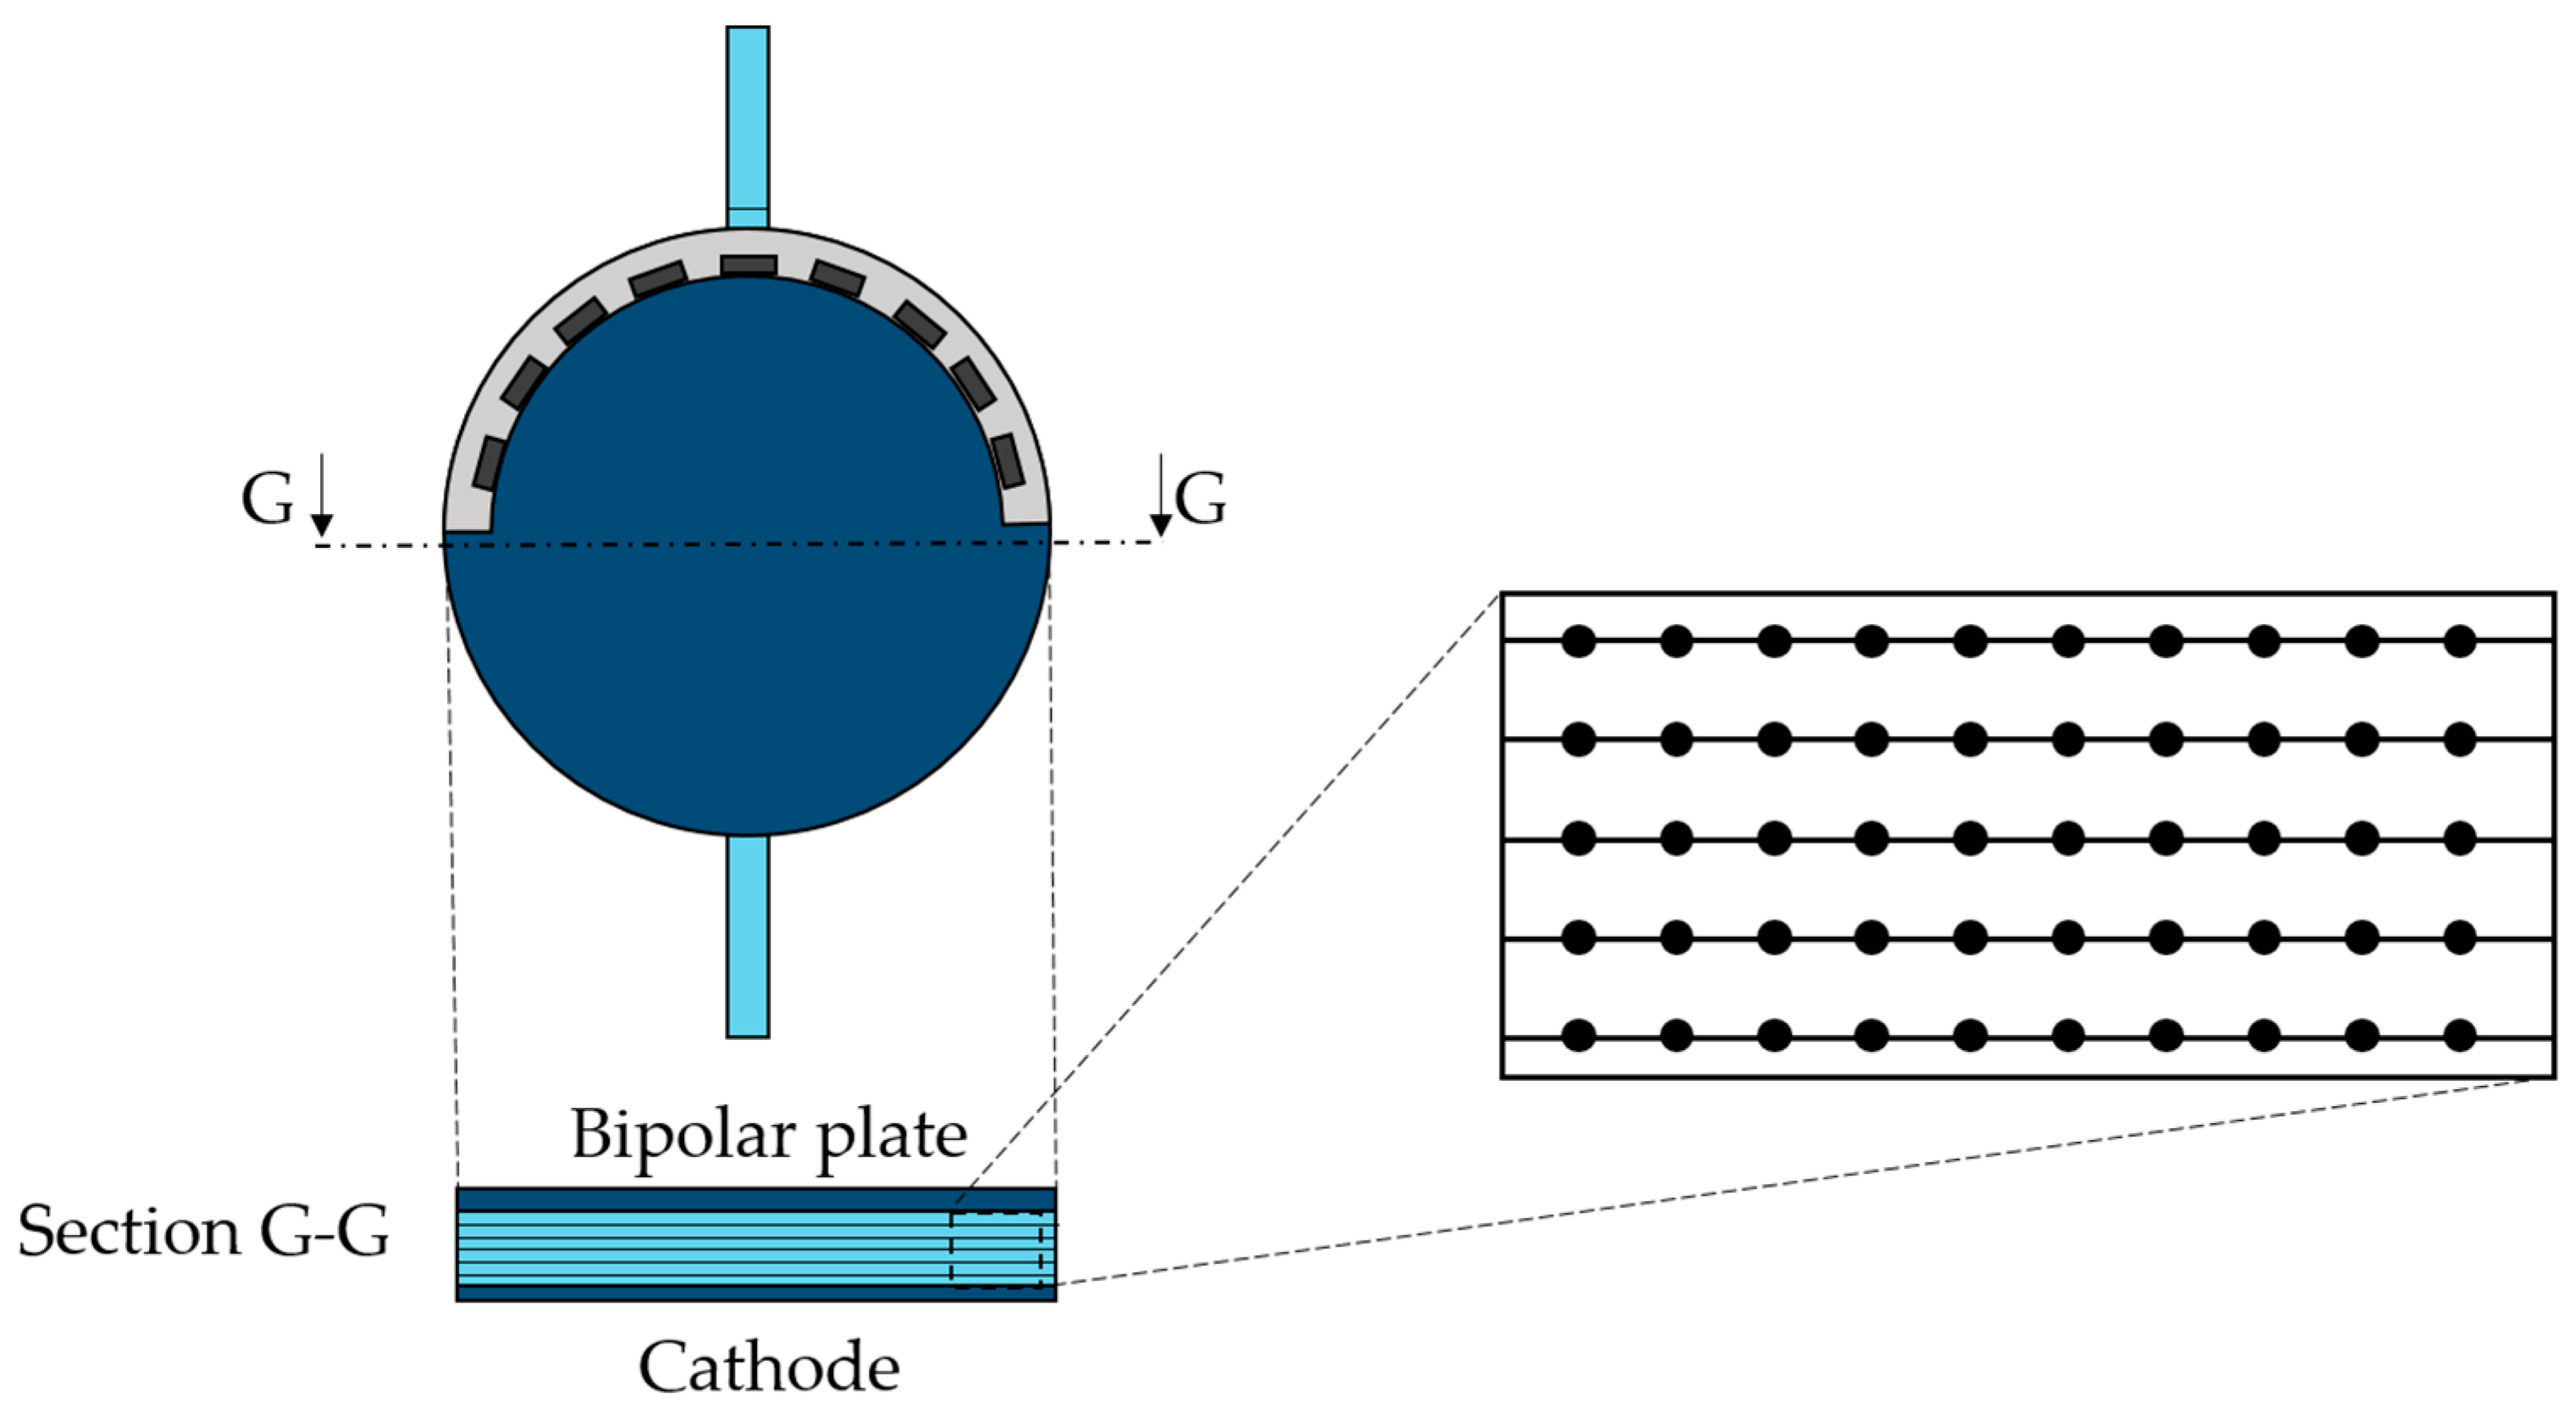
For this specific study, the horizontal section at the half of the cell, perpendicular to the flow streamlines, was considered the most suitable for Γ and rec calculations. In particular, 500 points were chosen, located on five lines of the section, as displayed in Figure 5.
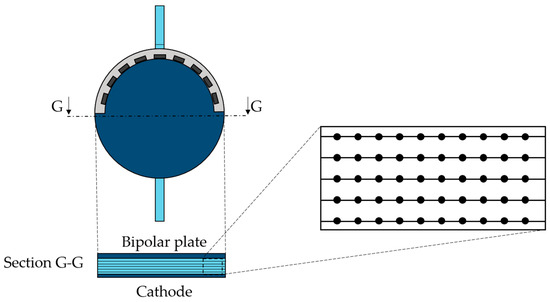
Figure 5.
Mid-section detail with the point distribution for Γ calculation.
4. Results
4.1. Performance Parameters Analysis
The six parameters discussed in the previous paragraph were applied to the converged CFD simulations of the alkaline cathodic cell. Table 2 provides an overview of the simulation results for each case, with performance graded from the worst to the best. The color scale shifts from red (the worst performance) to green (the best performance), based on the selected parameters.

Table 2.
Performance parameters for the six cases.
Concerning the amount of gas volume inside the cell, removing the gas obstacles, as in “Case 2”, or even having a slope on the gas collector, is beneficial; in fact, “Case 2-slope” shows the minimum value. A lower gas accumulation inside the cell for “Case 5”, with respect to “Case 4”, can be related to having a hydrogen production that is spread on a broader surface, with lower current density. “Case 3” volume of gas is instead lower than in the other cases without a collector since the gas mainly accumulates at the top where the electrode is absent for this geometry.
Coming to VFave, the different geometries perform similarly except for “Case 2”, which seems to produce a lower output. A higher value for “Case 2-slope” is, instead, in contrast to the results for the previous parameter, showing that the two values are not related. It appears from the simulation that an undesired gas accumulation occurs right under the slope, giving the higher value reported at the electrode. For the same reason, the highest maximum value of gas VF can be found at the electrode for “Case 2-slope”, whereas the others are almost comparable.
“Case 1” and “Case 2” have the lowest values of the ratio between gas VF at the electrode and gas VF at the outlet. When analyzing the reason for this more in-depth, it could be found that the gas collector contributed to increasing the flow velocity in the upper part of the cell, thus locally decreasing the gas VF. The outlet gas volume fraction is, instead, almost the same for the different geometries. The cases without a collector have a worse performance from this point of view, with lower values when a higher current density is considered (“Case 4”). This may be related again to the higher velocities linked to the specific increased hydrogen production. “Case 2-slope”, on the other hand, undergoes the effects of having a higher average gas VF at the electrode, as already discussed.
Γ does not experience dramatic changes from geometry to geometry. However, “Case 5” shows lower flow uniformity due to the decreased gas buoyancy related to the lower current density. The overall lower vertical velocity is the cause of local vortices, affecting the parameter. On the other hand, “Case 4”, characterized by a higher hydrogen production and vertical velocities, is the one with the highest velocity uniformity. Γ is obviously sensitive to the location choice of the points where the velocity is calculated.
The last parameter considered, liquid recirculation rec, gives lower values when the collector is present but the obstacles absent, possibly due to the higher velocities in the upper part of the cell for these cases, which cause less recirculation. On the other hand, “Case 4” shows an increased recirculation. The reason is to be found again in the higher cell velocities for this geometry. A comparison with Γ shows that these last indicators are not strictly linked to one another.
4.2. Additional Analyses
4.2.1. Volume Fraction Contours
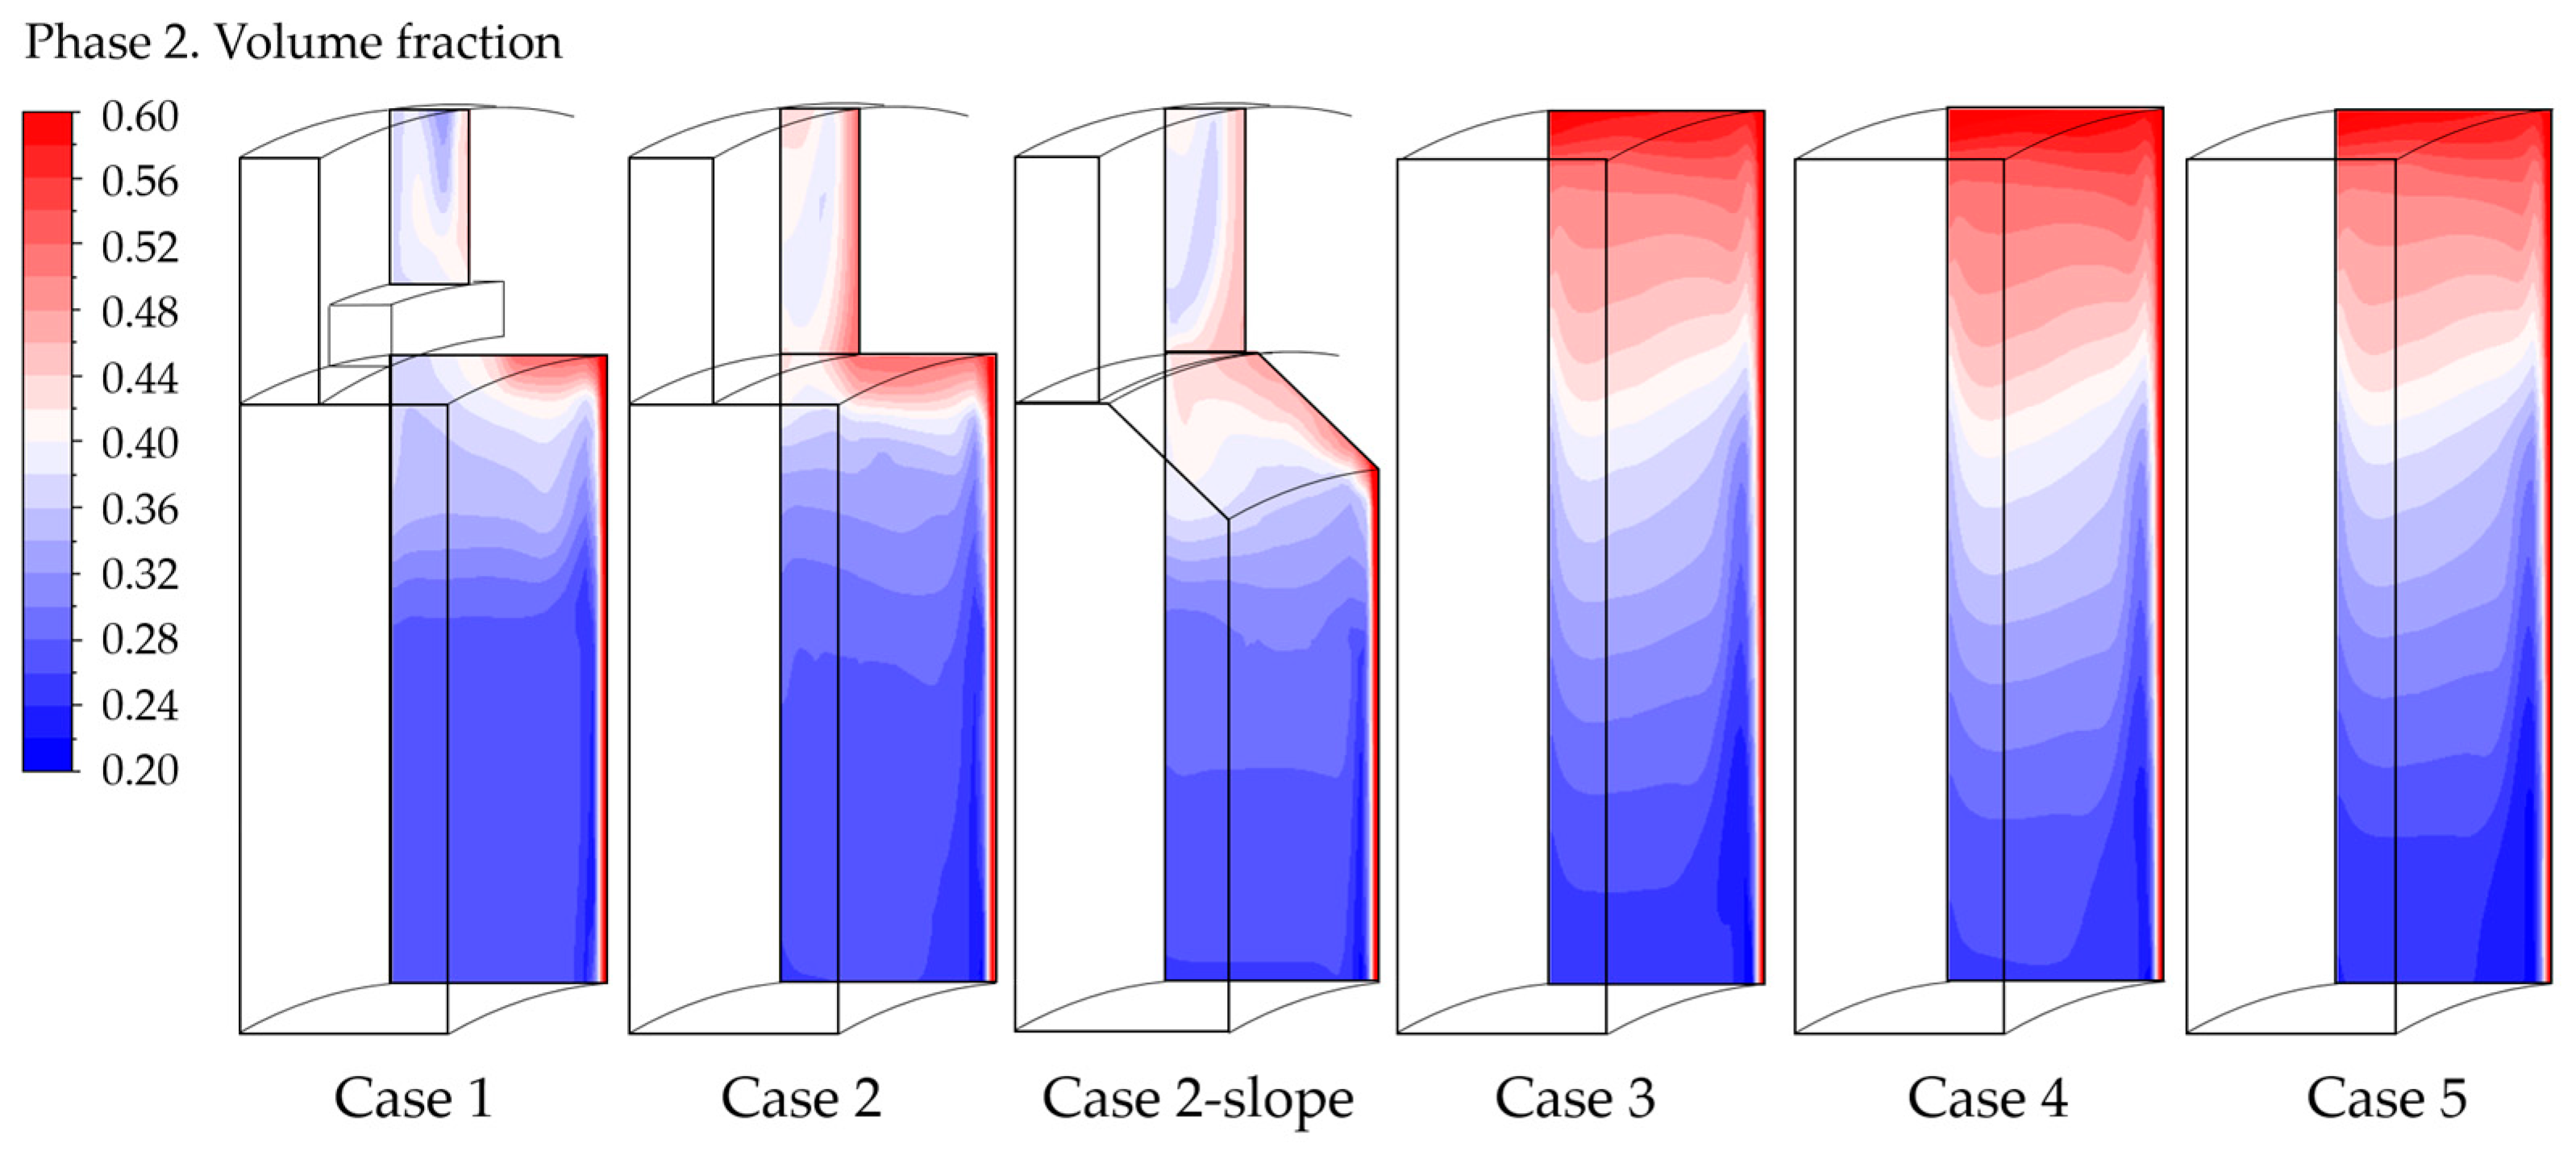
The parameters associated with gas accumulation can also be analyzed by examining the gas volume fraction contours in a vertical section in the upper part of the cell, as illustrated in Figure 6.
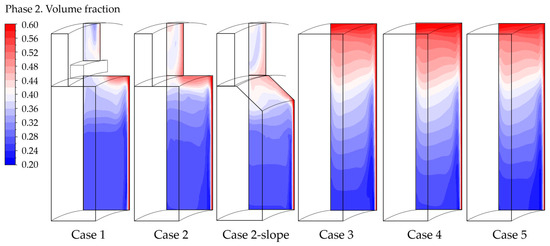
Figure 6.
Gas volume fraction contour in a vertical section in the upper part of the cell, case by case.
It is evident that the gas encounters greater difficulty leaving the cell in cases without the collector. This negatively impacts the indicator regarding the gas accumulation, particularly for “Case 4” and “Case 5” where the electrode is extended until the top of the cell, as previously discussed. Having dispersed gas results in higher ohmic resistance.
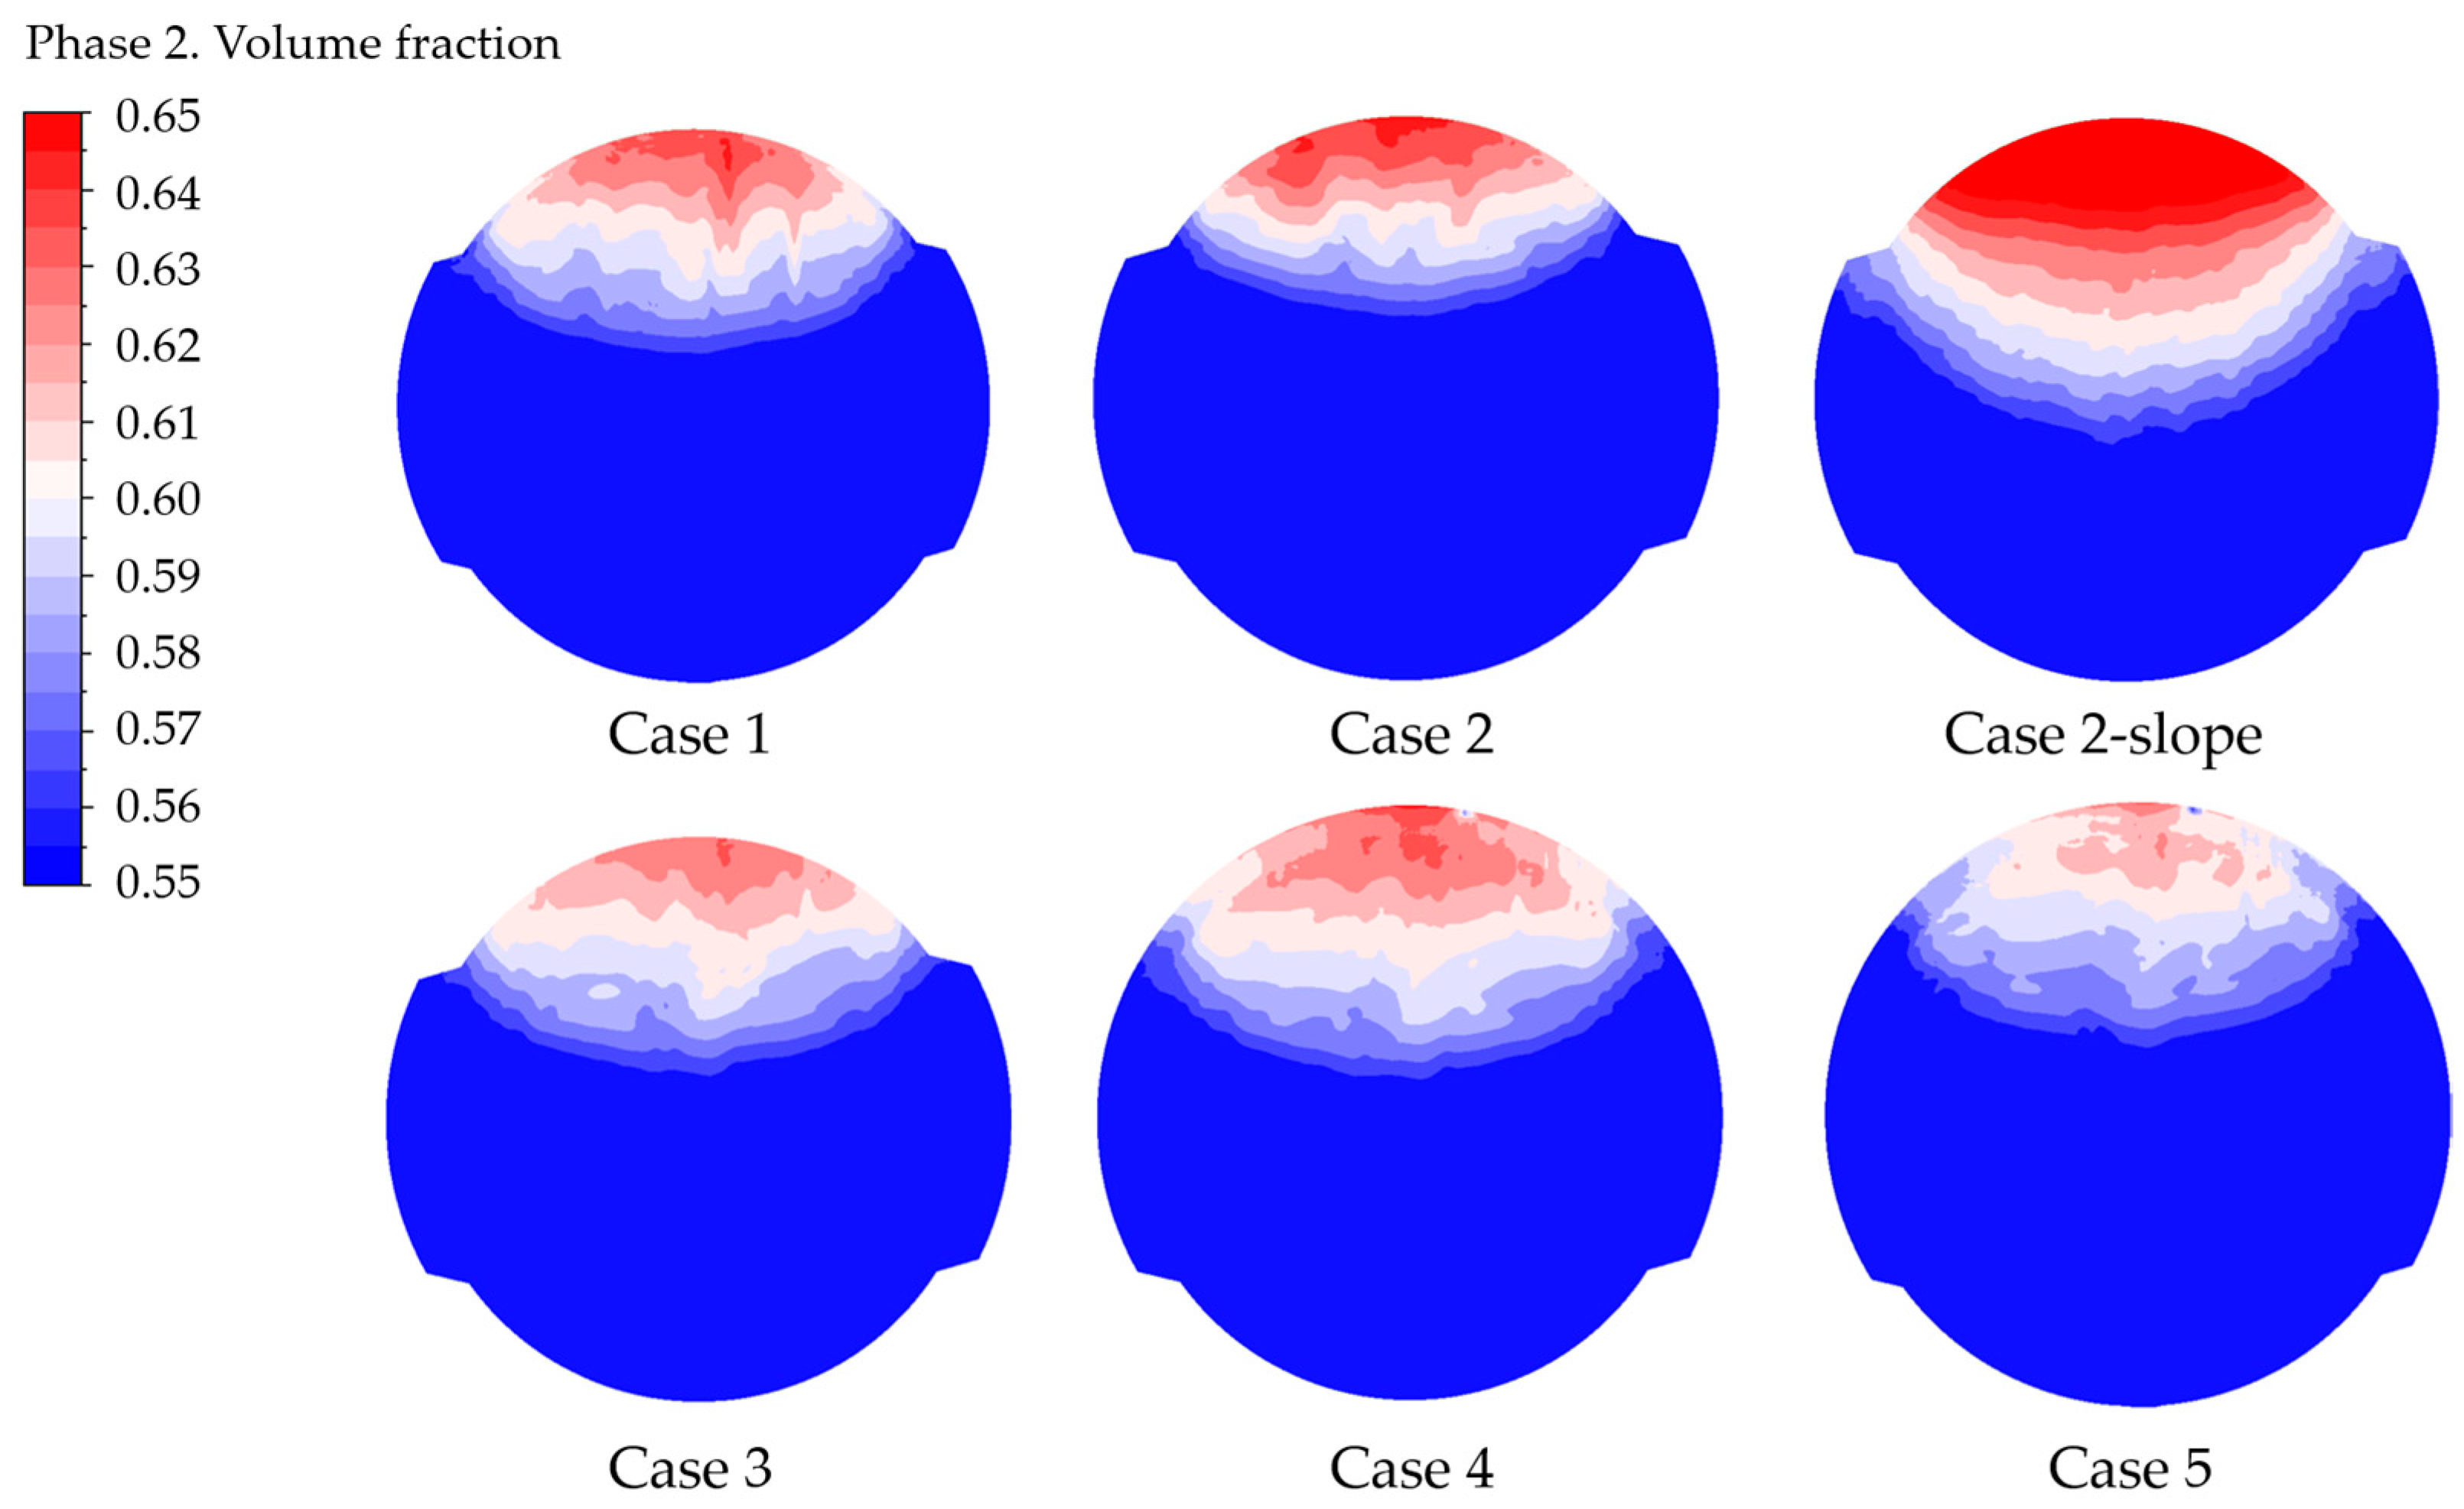
Additionally, a detailed examination of the volume fraction contours on the electrode provides insights into the parameters regarding the bubble coverage, as illustrated in Figure 7.
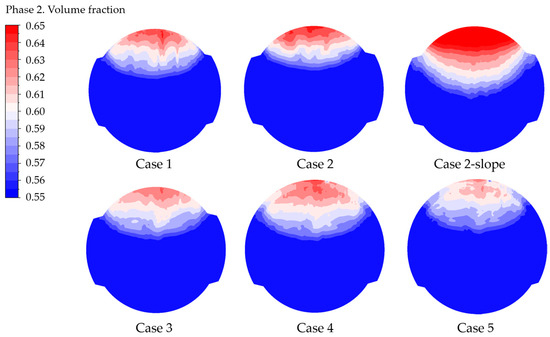
Figure 7.
Gas volume fraction contour at the electrode, case by case.
The average and maximum gas VF values for “Case 2-slope” can be directly inferred from the contours, confirming that such geometry does not remove gas efficiently. On the contrary, the lower values of the maximum gas volume fraction are visible for cases from 3 to 5, especially for the last one, which is related to the lower current density.
4.2.2. Flow Uniformity in Different Sections
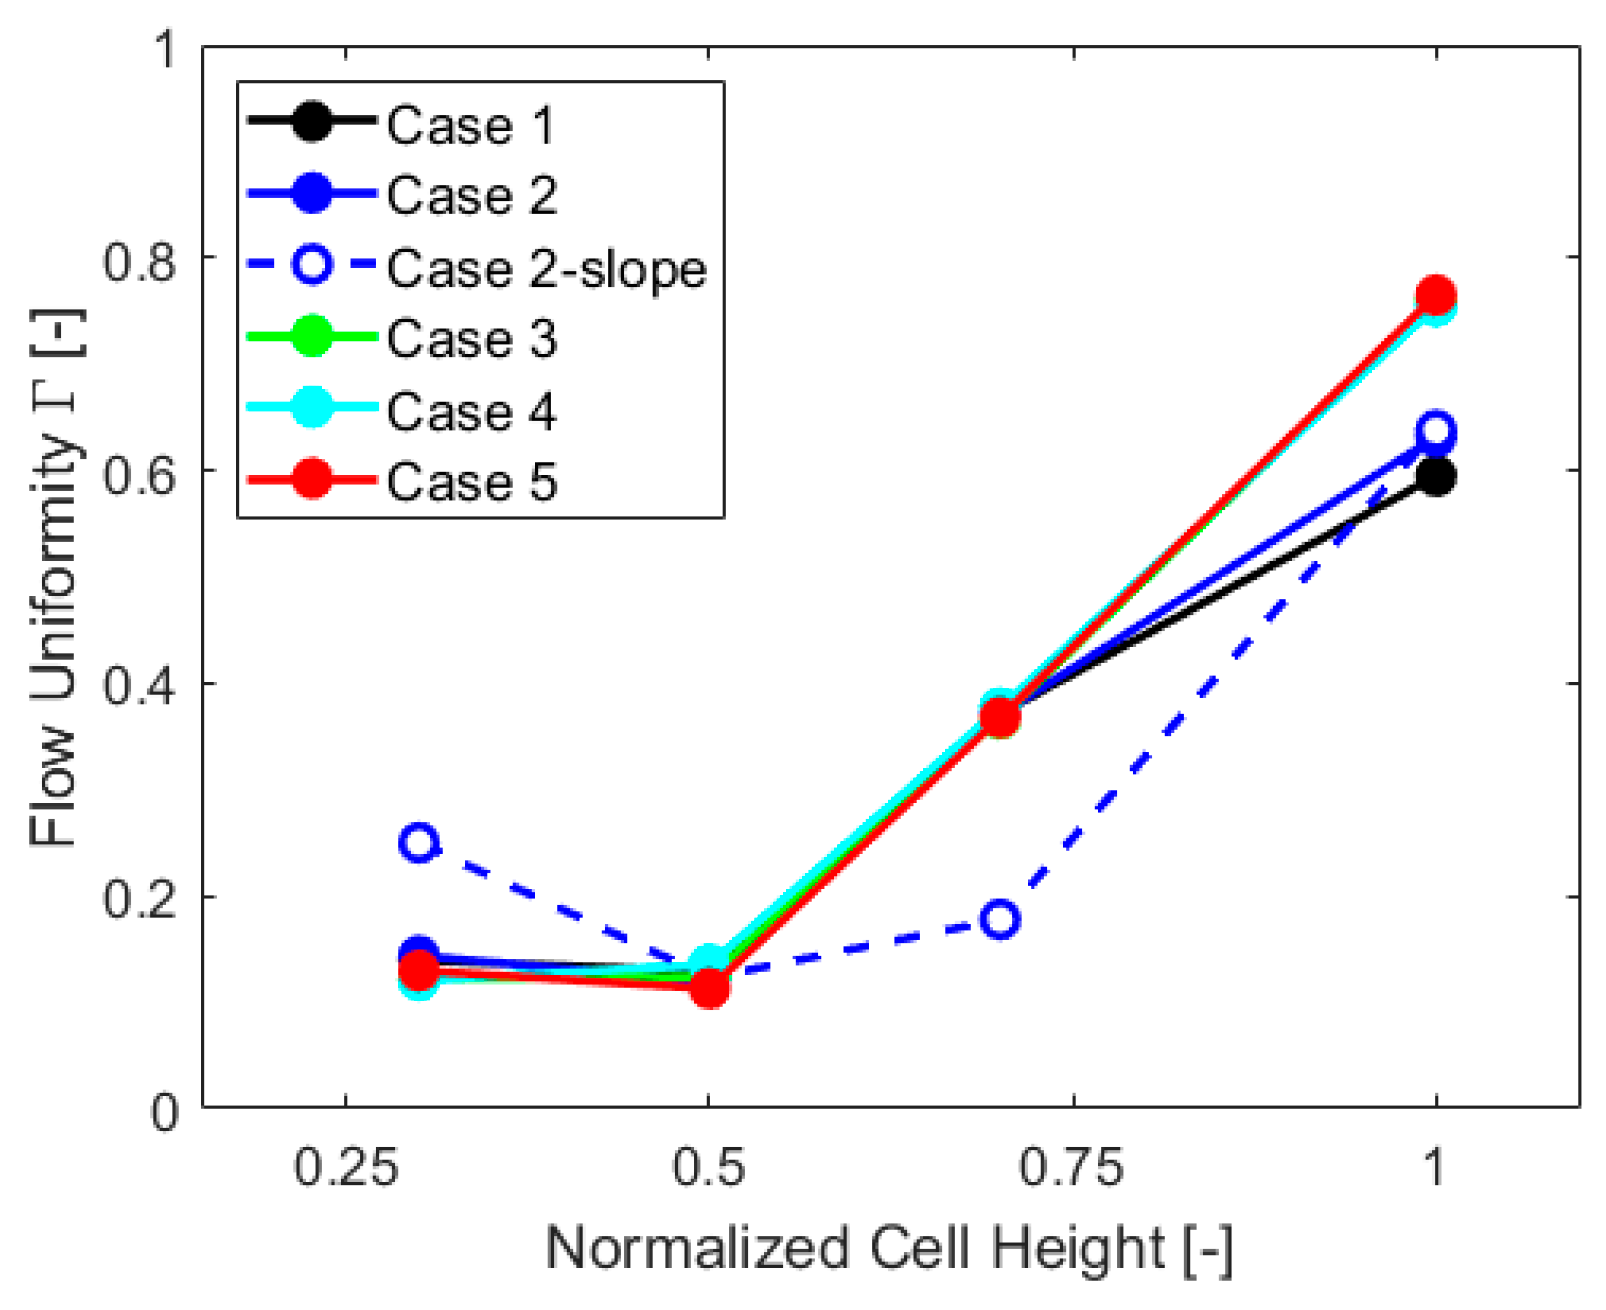
Flow uniformity parameter Γ was also obtained for other sections of the cell at a quarter of the height, at three-quarters, and at an outlet pipe section, to further extend the analysis. The results, case by case, are reported in the chart of Figure 8.
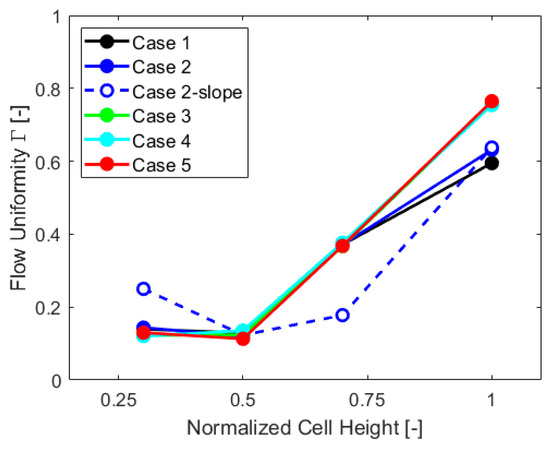
Figure 8.
Flow uniformity in different sections of the cell, case by case.
Flow uniformity analysis shows that “Case 2-slope” differs from other cases, with much more non-uniformity in the upper part of the cell and increased uniformity in the lower part. This is mostly caused by the gas VF distribution, with higher values at the top of the cell, as visible in Figure 7, which impacts the velocity field. The values of Γ in the lower part of the cell are influenced by the inlet components, which are the same for all the geometries and exhibit similar behavior up to three-quarters of the cell height. The outlet Γ values are, instead, impacted by the gas collector presence, with higher flow uniformity for cases without this component.
4.2.3. Velocity and Gas Volume Fraction Trends
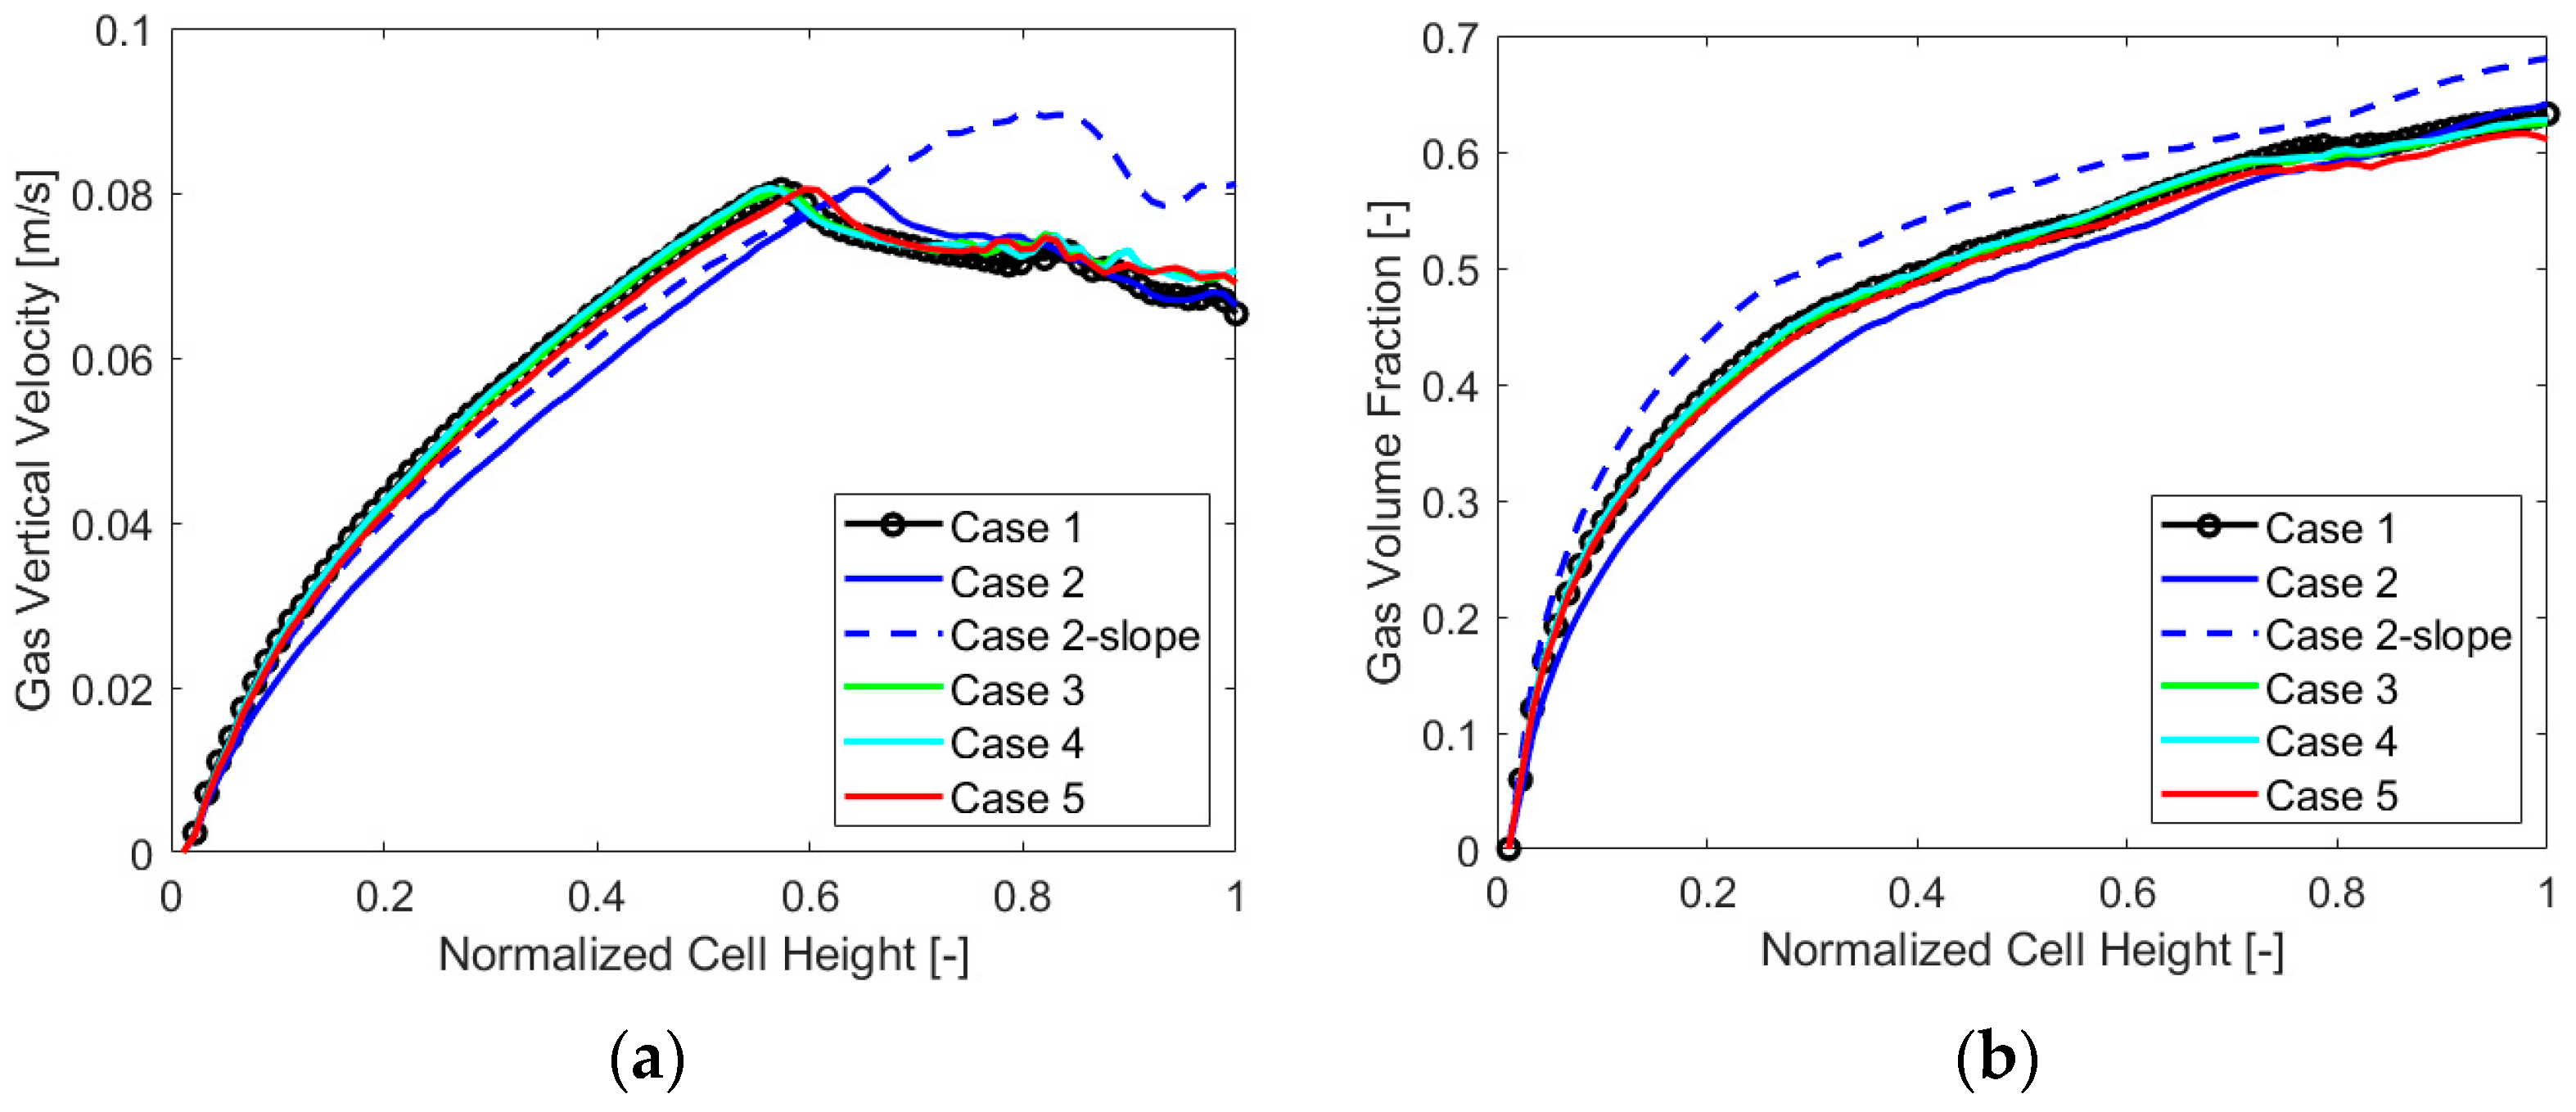
To extend the analysis even more, below are the charts with the gas VF and velocity trends along the cell thickness at a mid-section in Figure 9, and along the electrode, in Figure 10, for each case analyzed.
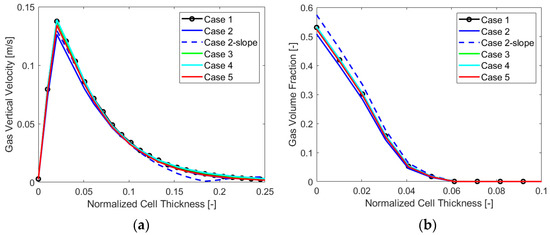
Figure 9.
(a) Gas vertical velocity and (b) volume fraction along the cell thickness, case by case.
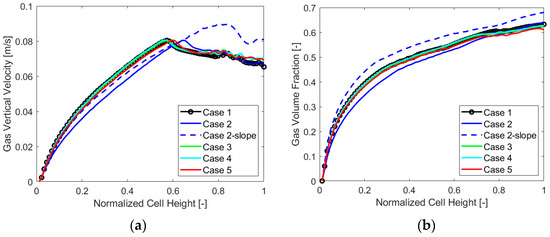
Figure 10.
(a) Gas vertical velocity and (b) volume fraction along the electrode, case by case.
The main output that can be detected from the charts is the overall lower value of the gas vertical velocity and volume fraction for “Case 2”, which appears to perform generally better when evaluating the chosen parameters. Also, a higher gas volume fraction along the thickness and the electrode for “Case 2-slope” is visible, resulting in a different velocity behavior along the electrode as was also evident from Γ parameter analysis. The other cases displayed similar gas VF and velocity trends.
4.3. Sensitivity Analysis of the Original Geometry
After having evaluated performance indicators for various possible optimized geometries under design conditions, modifications of electrolyte mass flow rate and current density for the same geometry were assessed to analyze their impact on the parameters. The original geometry, “Case 1”, was employed and three values of electrolyte mass flow rate were considered at the inlet, i.e., the design value and the cases obtained by halving and doubling it. Furthermore, five average current densities of 1000, 2500, 5000, 7500, and 10,000 A/m2 were taken into account for the analysis. This range of currents covers the typical working range (including part-load conditions) of commercial units that was defined by conducting an analysis of the electrolyzers available on the market.
Results of the Sensitivity Analysis
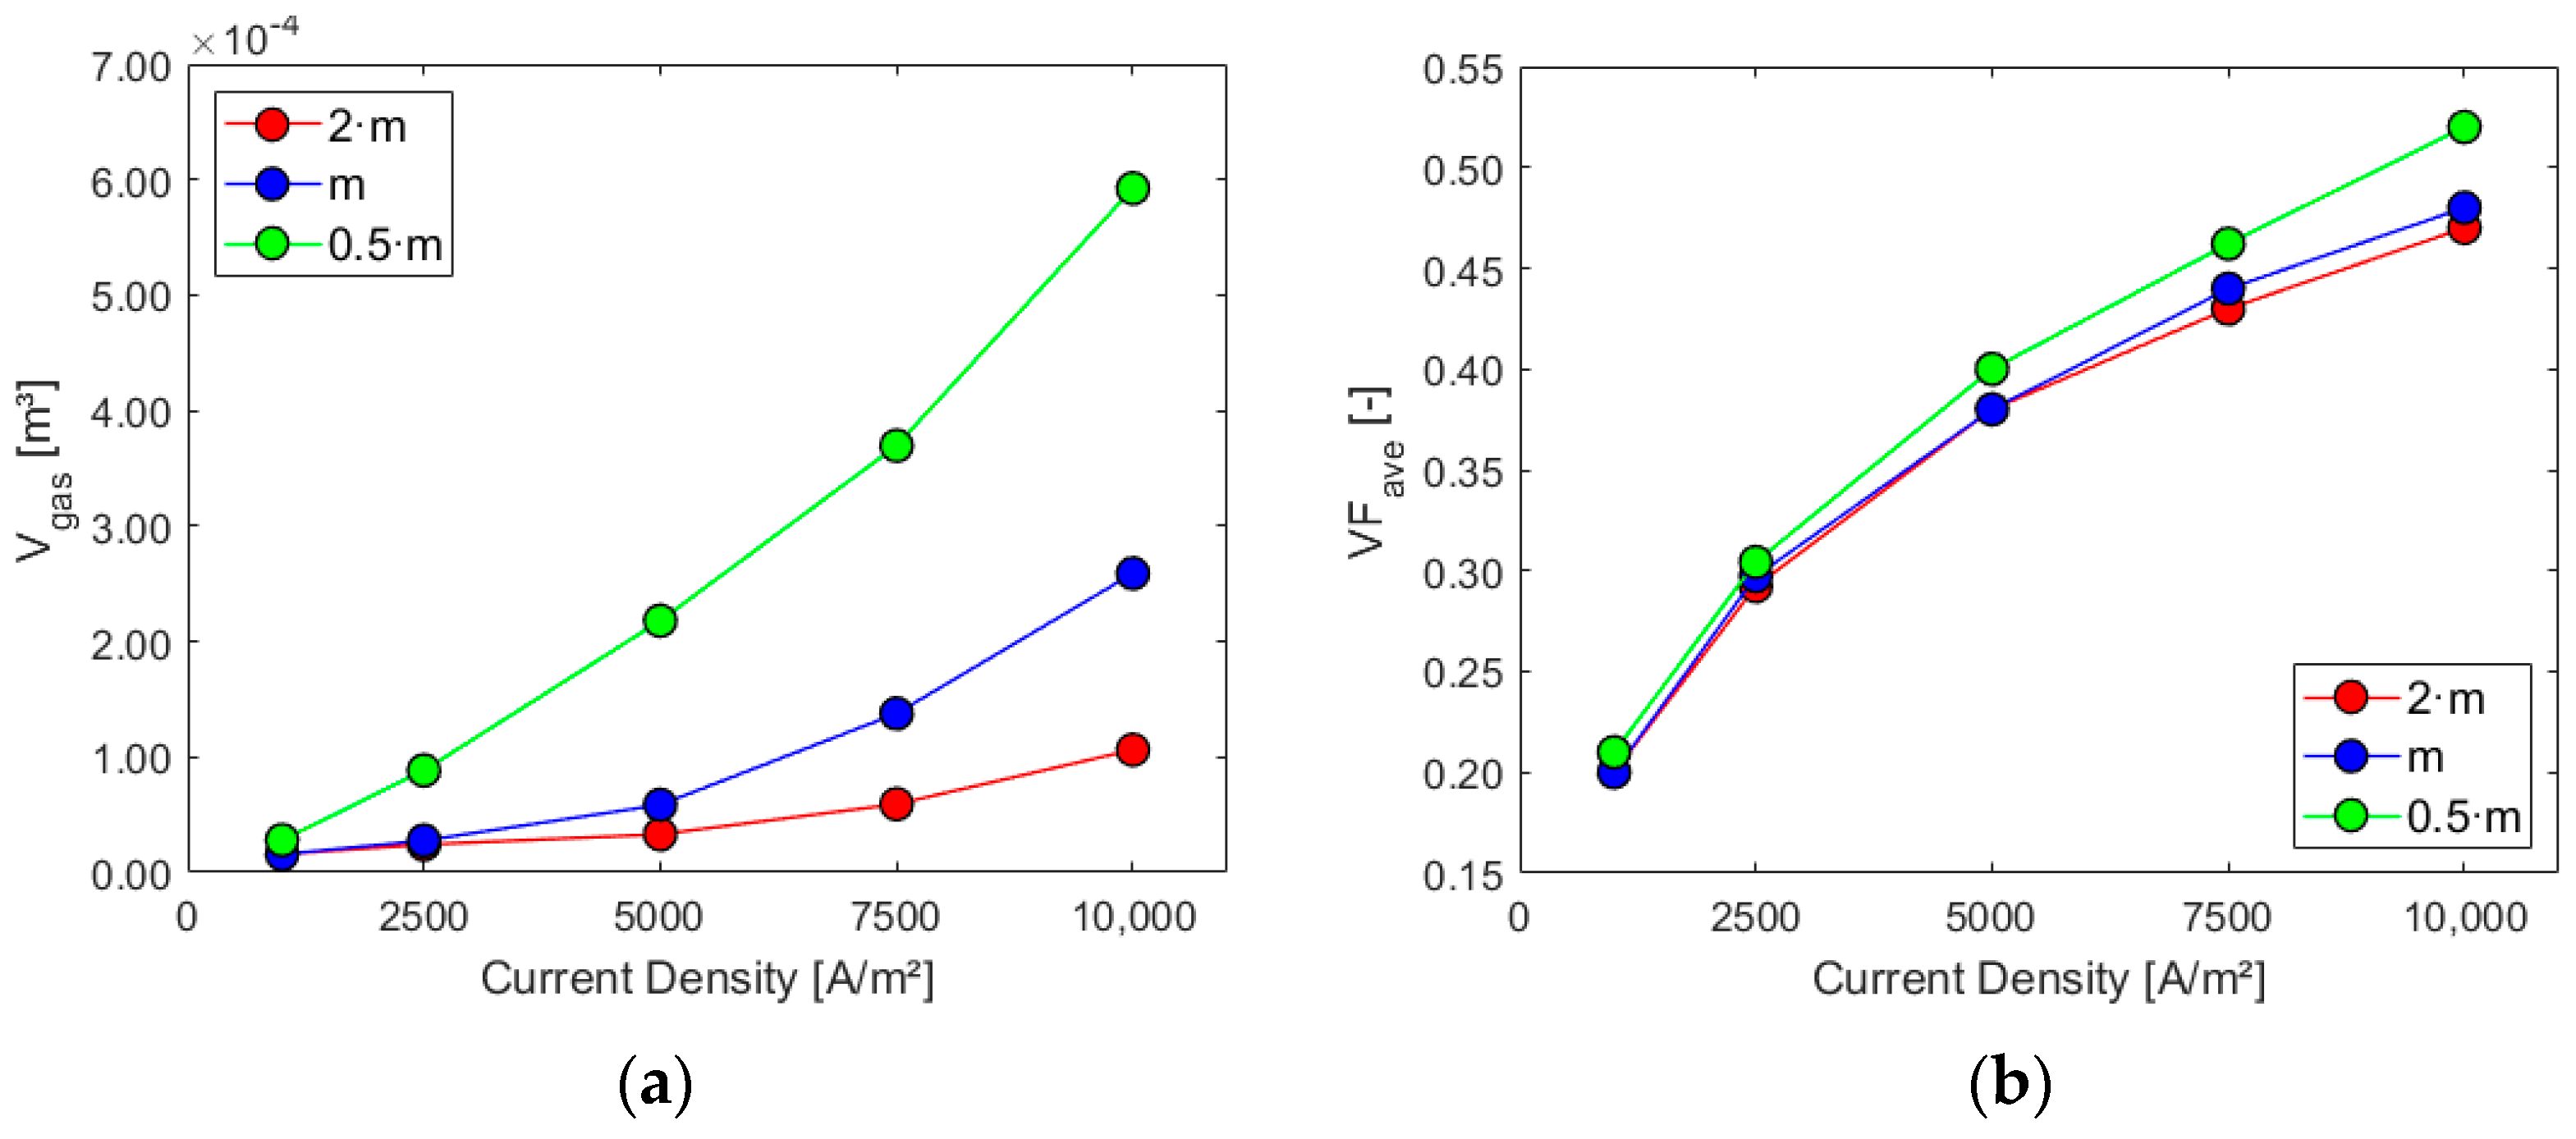
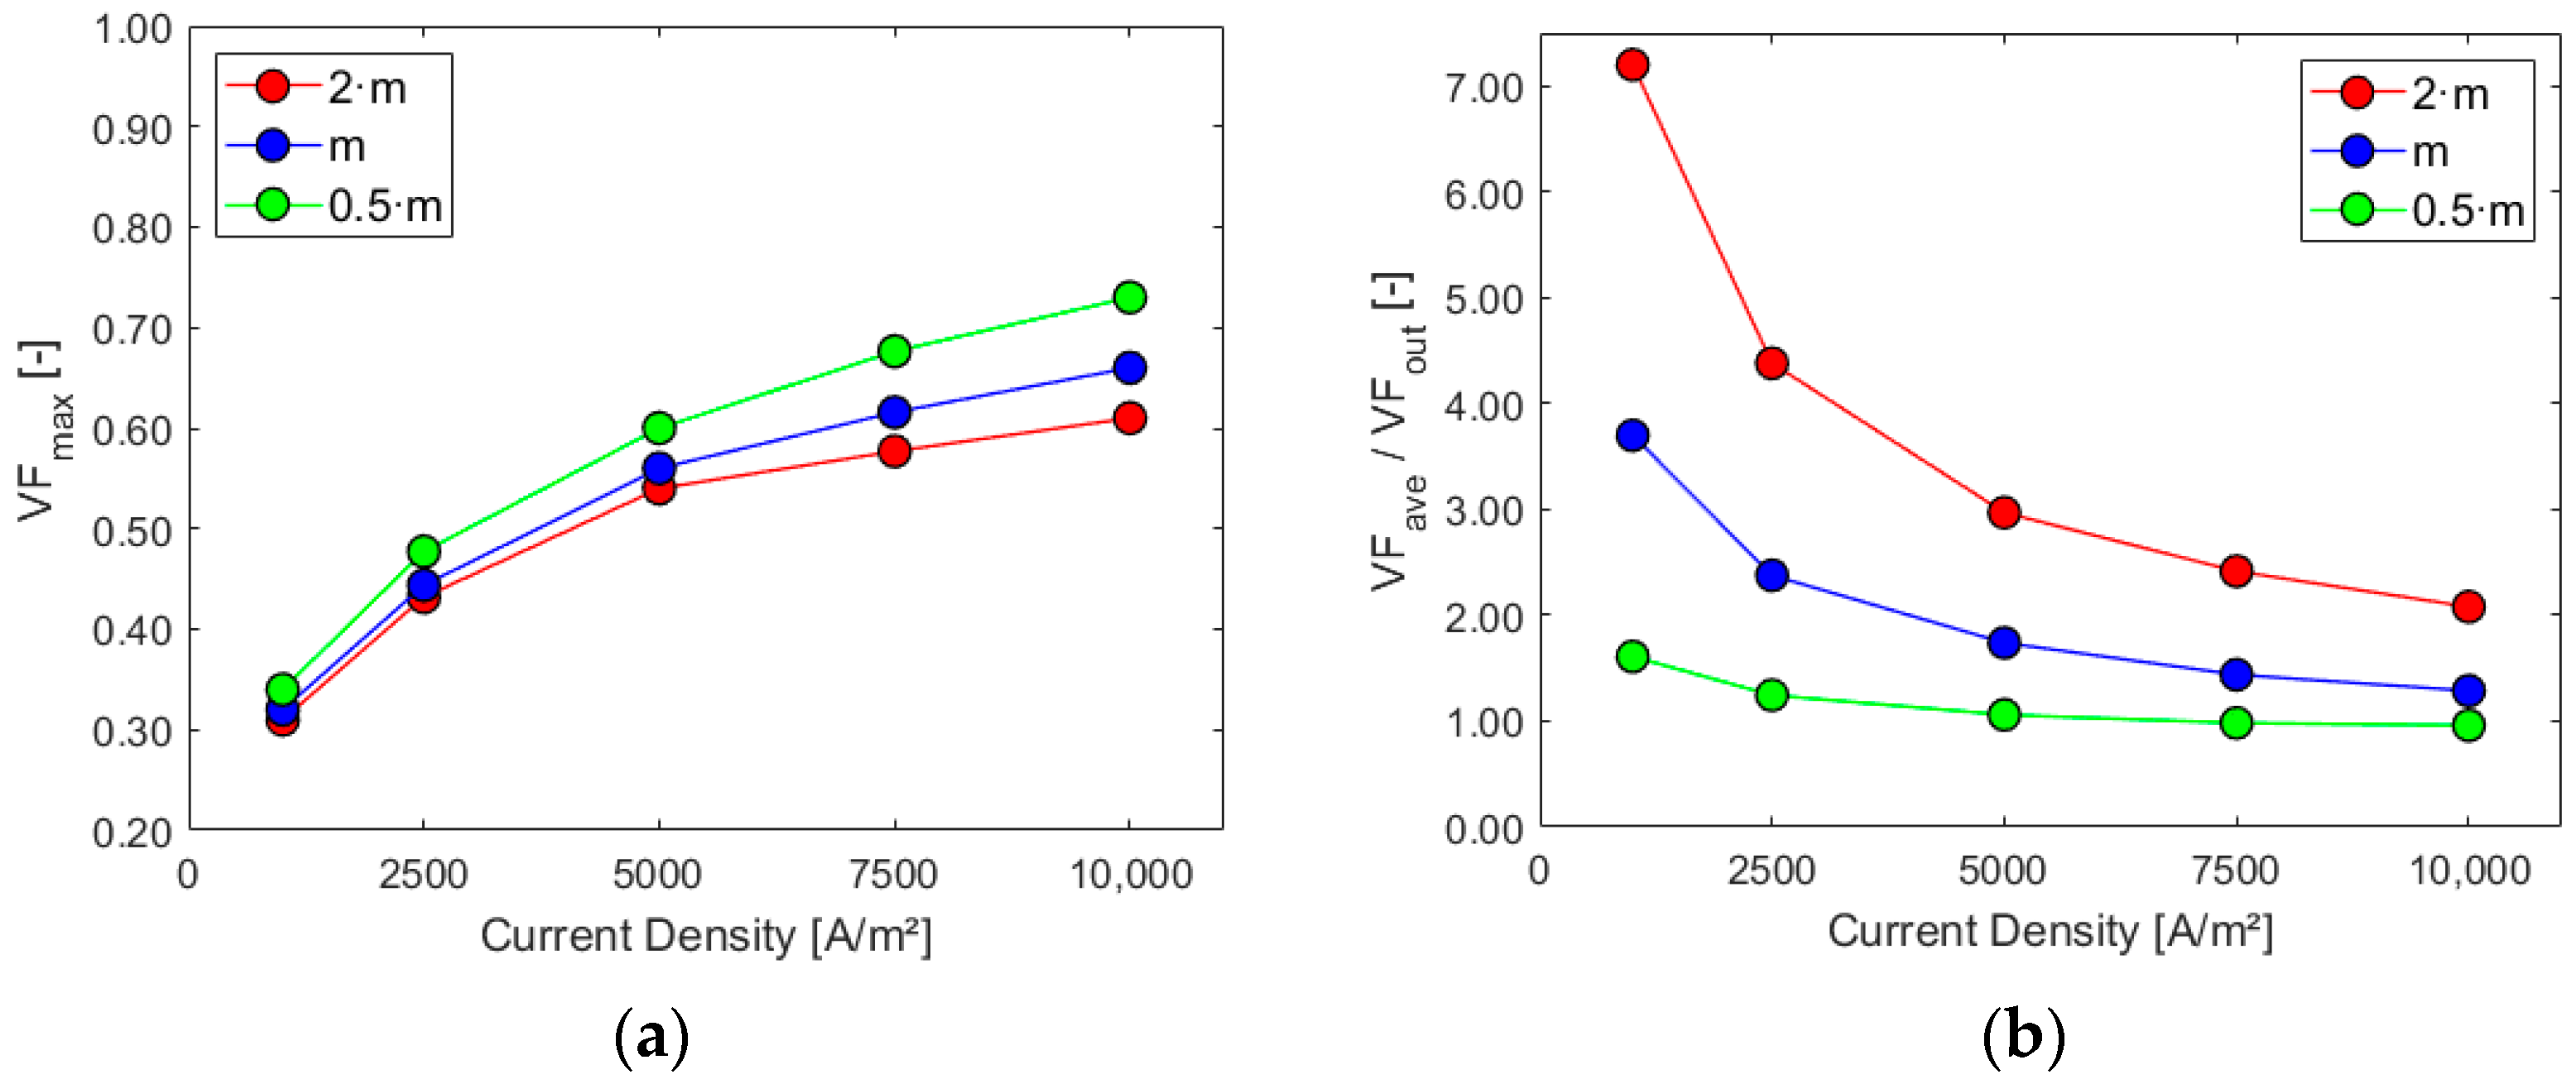
Figure 11, Figure 12 and Figure 13 show the charts for the six performance indicators and their variations with respect to current density and inlet mass flow rate.
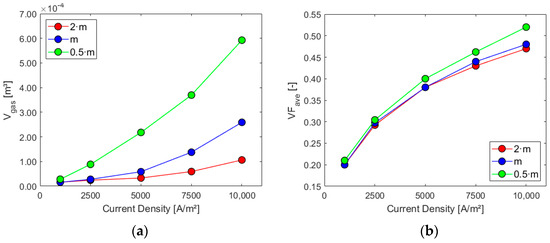
Figure 11.
Sensitivity analysis: (a) gas volume inside the cell and (b) electrode average gas VF.
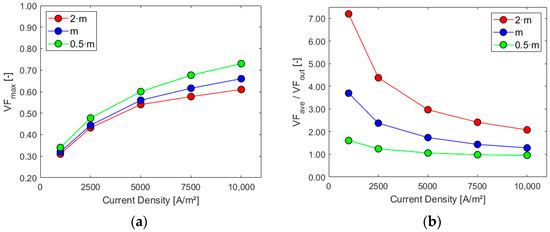
Figure 12.
Sensitivity analysis: (a) maximum electrode gas VF and (b) ratio VFave/VFout.
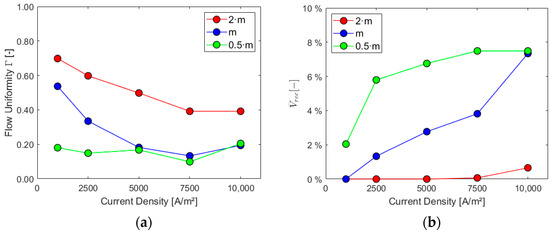
Figure 13.
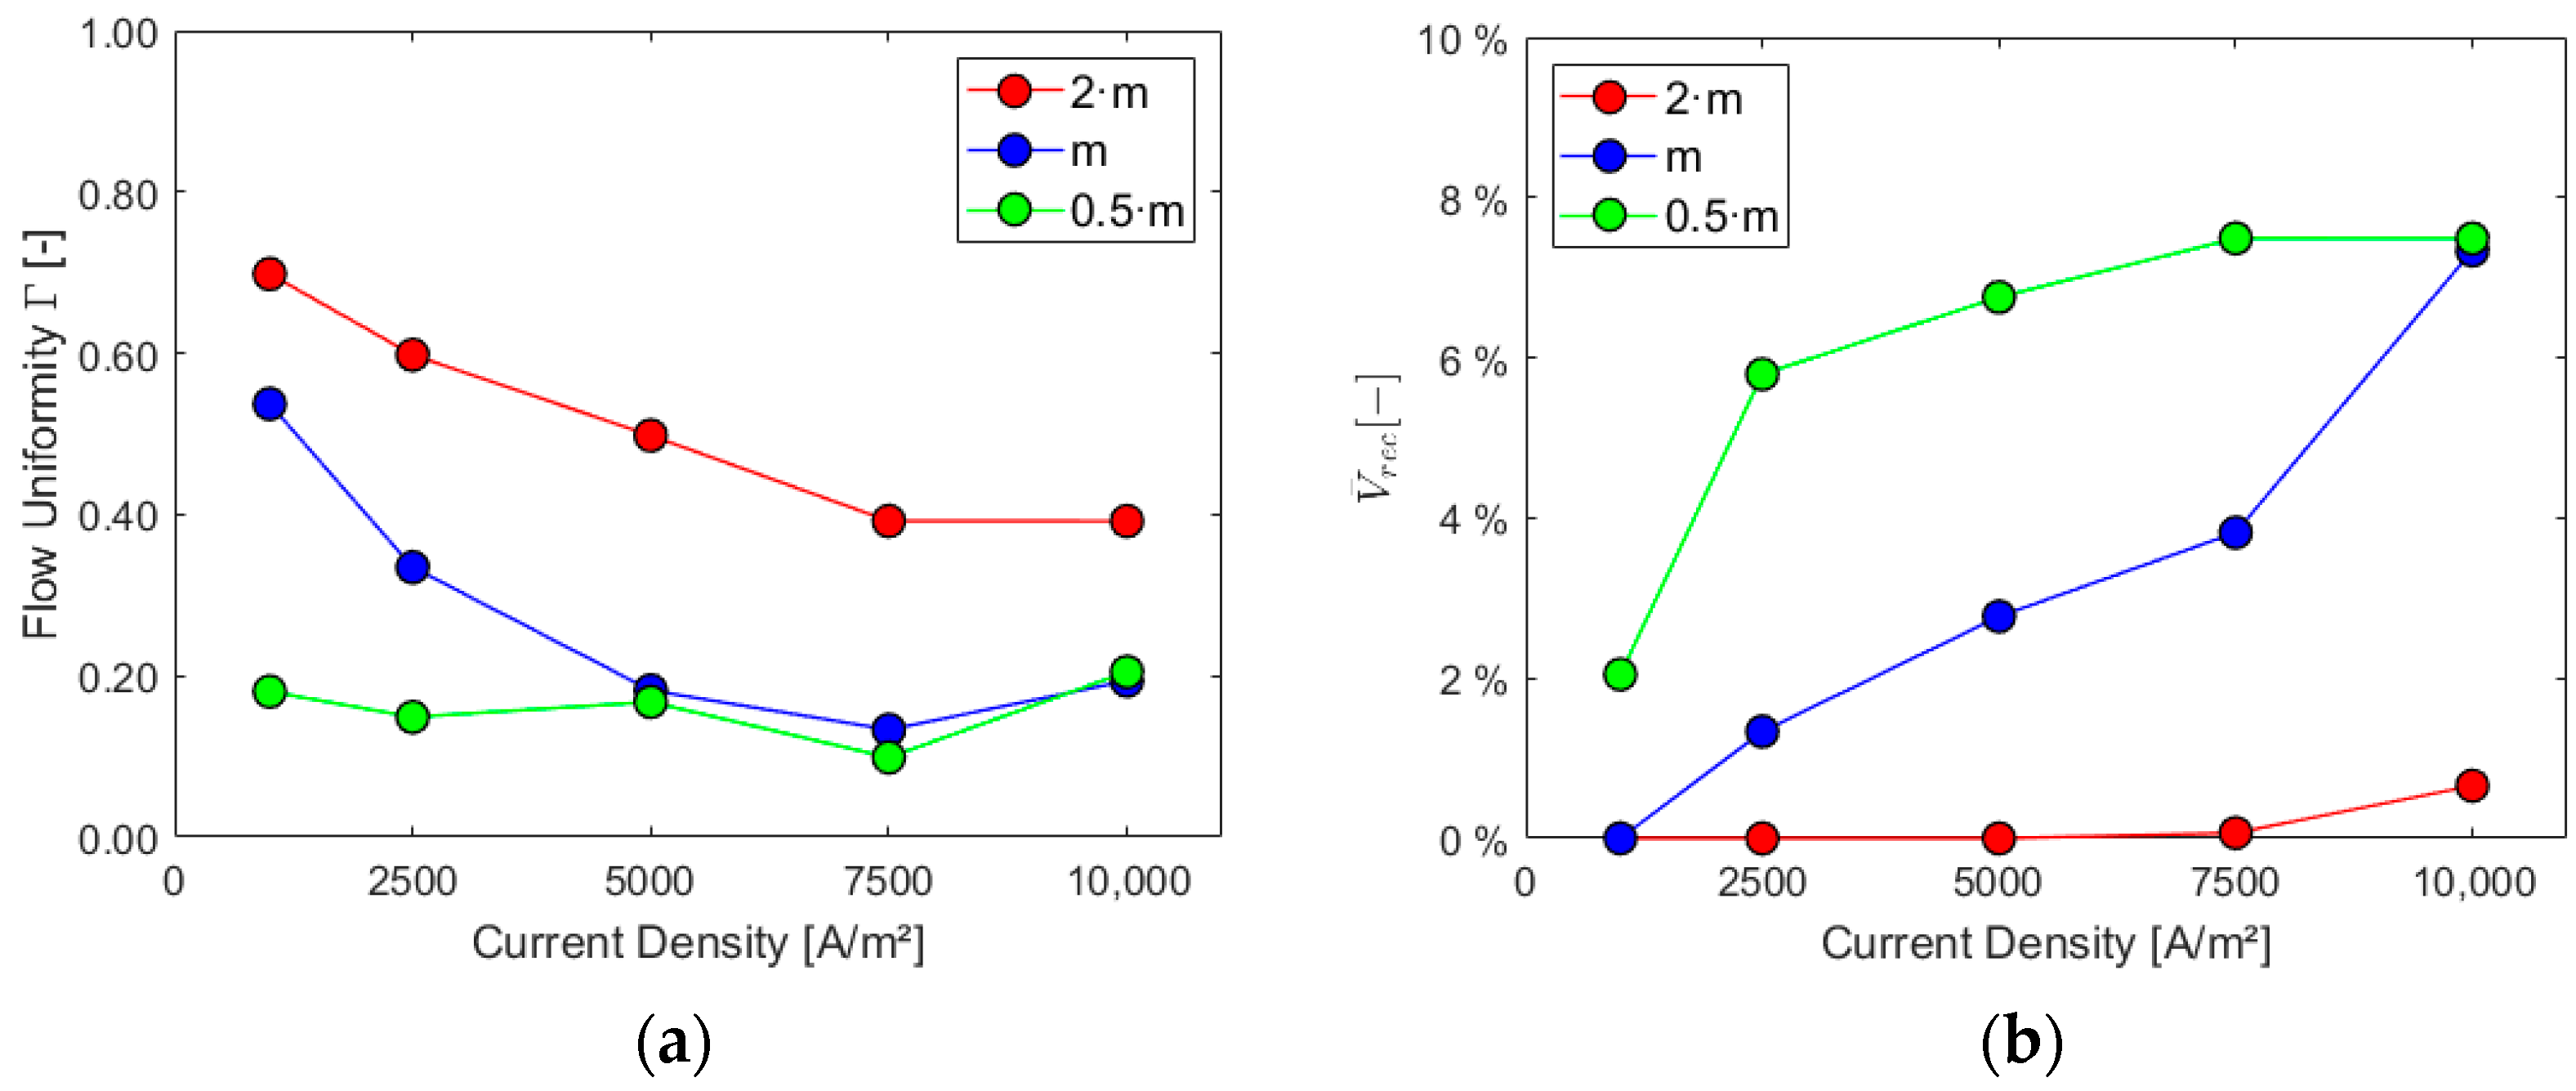
Sensitivity analysis: (a) flow uniformity Γ and (b) liquid recirculation rec.
Higher mass flow rates at the inlet positively impact the cell performance when considering the first three parameters, especially for higher current densities. As expected, the volume of gas and its presence on the electrode increase with the current density since the last one is proportional to hydrogen generation. The ratio between the average gas volume fraction at the electrode and at the outlet is, instead, decreased by lower mass flows and increased by higher current densities due to their effect on the outlet gas VF. Flow uniformity Γ at the mid-section increases with higher mass flow rates at the inlet and experiences a slight decrease as current density rises. Finally, higher mass flow rates hinder the electrolyte recirculation inside the cell, as evident from the chart in Figure 13b. Higher current densities are responsible for increased turbulence inside the cell, with more possibility of vortices and flow recirculation.
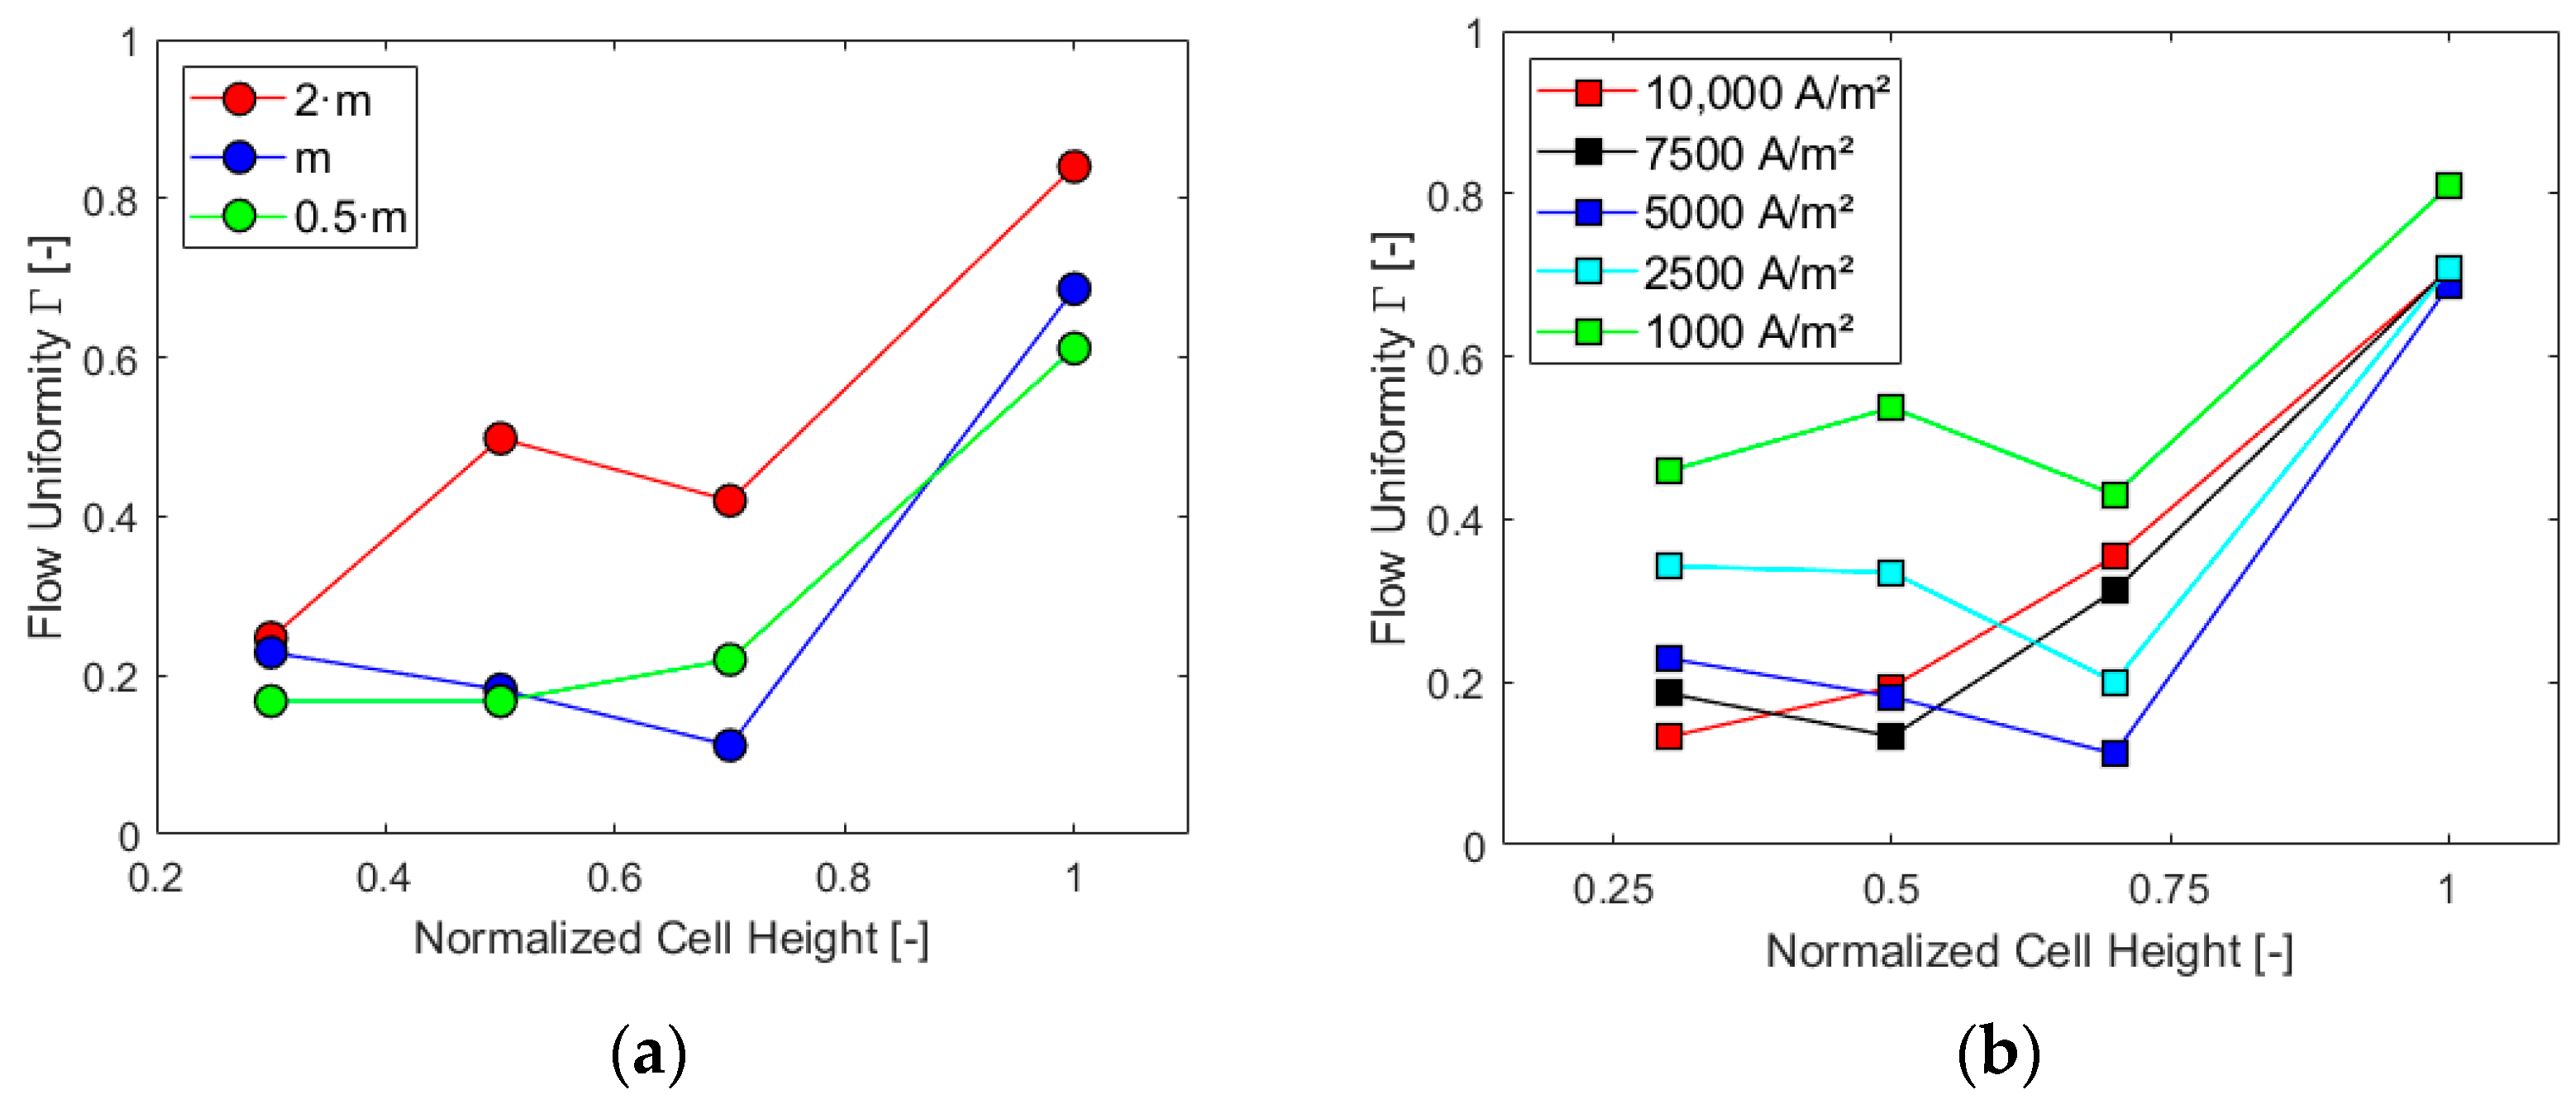
Γ parameter was finally obtained for different sections of the cell, as was already accomplished in Section 4.2.2: first, maintaining constant the current density at a value of 5000 A/m2 and, second, the inlet mass flow at the design value. The results are reported in the charts in Figure 14.
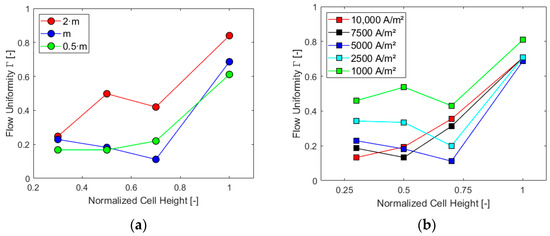
Figure 14.
Γ in different sections for (a) i = 5000 A/m2 and (b) at the design inlet mass flow rate.
As already expected from the previous results, the highest mass flow rate and lowest current density generate higher flow uniformity in each section of the cell. The downward trend between half and three-quarters of the cell for higher mass flow rates, Figure 14a, is justified by the vortices induced by the section reduction at the top, with the presence of the gas collector, which impacts the flow more significantly for these cases. Furthermore, such trend is more evident for lower values of current densities, Figure 14b. Under these conditions, in fact, a more uniform flow occurs in the bottom part of the cell due to reduced gas production and consequent lower velocities at the electrode. Finally, for all the studied cases, the trend of Γ shows an increase between three-quarters of the cell height and the top of the cell where the flow, accelerated and directed toward the outlet pipe, becomes more uniform.
5. Discussion
The results of the 3D CFD model developed for the cathodic cell provided valuable insights into the fluid dynamics behavior of the cell itself, especially in relation to gas accumulation and the overall cell efficiency. Six key performance indicators were analyzed, with a particular focus on parameters directly influencing overpotentials, such as the gas volume fraction and flow characteristics.
Based on the literature study conducted, in terms of direct gas influence on the ohmic resistance for zero-gap cells, the most critical factors for efficiency are considered to be the average gas volume fraction at the electrode (VFave) and VFratio parameters, i.e., the ratio between average gas volume fraction at the electrode and at the outlet. In contrast, the gas volume inside the cell (Vgas) is expected to have a greater impact on traditional cells due to their increased distance between electrodes. Although less significant for overall efficiency, VFmax is crucial for identifying hot spots, making it secondary but still essential for understanding cell behavior.
A different approach is required for evaluating flow uniformity (Γ) and recirculation. While these factors are indeed linked to cell efficiency—since stagnation and uneven distribution of reactants leads to reduced reaction rates and increased overpotential, as Xue et al. pointed out [13]—our case study cell presents a regular geometry, unlike the irregular shapes studied in [13]. In the mid-section of the case study, the most important velocity gradient occurs along the cell thickness, with higher velocities at the electrode and negligible lateral gradients. As a result, flow uniformity is less relevant in characterizing the efficiency of this specific cell geometry.
Regarding velocity recirculation, despite not being considered positively in the present study, it might prove beneficial by promoting turbulence, which could enhance chemical reaction rates and improve bubble removal. Therefore, a more detailed future investigation into this phenomenon is necessary.
The modification of the cell geometry, for optimization, allowed us to link the cell characteristics with the performance parameters presented: the gas collector component apparently does not negatively influence the gas accumulation inside the cell and the bubble coverage on the electrode due to the higher velocities involved in the cell section reduction, and “Case 2”, without flow obstacles, performs better than the others while also prioritizing the indicators as discussed above. Both the contours and the trends of gas volume fractions and velocities confirm that “Case 2-slope” underperforms, as highlighted by the parameters, due to greater gas accumulation under the gas collector.
Moving on to the sensitivity analysis, the following conclusions were drawn. Higher VFave values are clearly associated with higher current densities according to Faraday’s law, but they are less influenced by the electrolyte mass flow rate at the inlet. VFratio is a more suitable indicator when working with lower current densities, and in these cases, lower mass flow rates are preferable. Regarding gas volume inside the cell, higher mass flow rates at higher current densities are beneficial as gas accumulation increases with current density. To prevent hot spots, related to VFmax, it is advisable to have higher mass flow rates. As to the flow uniformity, our analysis indicates that higher Γ values occur for higher mass flow rates and lower current densities. Finally, flow recirculation appears to be significantly affected by lower mass flow rates and higher current densities. In general, our findings align with Mat et al. [12], who observed that the gas release rate increases with electrolyte flow velocity as the bubble residence time decreases.
6. Conclusions
A 3D CFD model of a cathodic cell was developed in the Ansys Fluent (2023 R1) environment. Six key performance indicators were presented, accounting for various fluid dynamics behaviors of the cell and, thus, related to the cell efficiency. The impact of the parameters was evaluated using two distinct approaches, namely, the optimization of the cell geometry under design conditions and a sensitivity analysis of the original geometry with variations in current density and electrolyte mass flow at the inlet.
The results demonstrate the complexity of defining a single parameter to evaluate the cell’s performance from a fluid dynamics perspective. The choice of the optimal indicator depends on the specific characteristics of the cell and the analysis being conducted.
For the specific case study at hand, the parameters VFave and VFratio were indicated as the most influential on the cell efficiency, allowing us to define “Case 2” as the best geometry during the optimization, i.e., a cell geometry maintaining the gas collector component, without the solid elements that were evaluated as barriers to the gas flow. Furthermore, the sensitivity analysis showed that working with higher mass flow rates is generally preferable as they are linked to higher bubble removal. On the other hand, higher current densities, related to increased gas production, are associated with an overall worse performance and stronger non-uniformity of the electrolyte flow inside the cell.
For future developments of the analysis, a deeper characterization of the mutual influence on the fluid dynamics and potential field is needed to improve the multiphysics approach with the description of more interrelated phenomena.
Author Contributions
Conceptualization, M.D., S.S.H., F.B., M.N., and A.B.; methodology, M.D., F.B., and A.B.; software M.D. and F.B.; formal analysis, M.D.; investigation, M.D. and S.S.H.; resources, M.N., S.S.H., and F.M.F.; data curation, M.D.; writing—original draft preparation, M.D.; writing—review and editing, M.D., F.B., S.S.H., F.M.F., M.N., and A.B.; visualization, M.D., F.B., and A.B.; supervision, F.B., A.B., S.S.H., F.M.F., M.N., and G.F.; project administration, G.F.; funding acquisition, G.F. All authors have read and agreed to the published version of the manuscript.
Funding
The research presented is part of the PhD project of Marco Dreoni, funded by the 2014–2020 PON Research and Innovation (D. 1061/2021), Resources FSE REACT-EU, Action IV.4, Italian Ministry of University and Research (MUR), CUP B11B21004930007.
Data Availability Statement
The original contributions presented in the study are included in the article, further inquiries can be directed to the corresponding author.
Conflicts of Interest
Authors Syed Sahil Hossain and Matthias Neben were employed by McPhy Energy Deutschland GmbH. Author Francesco Maria Ferro was employed by McPhy Energy Italia Srl. The remaining authors declare that the research was conducted in the absence of any commercial or financial relationships that could be construed as a potential conflict of interest. The funders had no role in the design of the study; in the collection, analyses, or interpretation of data; in the writing of the manuscript; or in the decision to publish the results.
References
- Rodríguez, J.; Amores, E. CFD modeling and experimental validation of an alkaline water electrolysis cell for hydrogen production. Processes 2020, 8, 1634. [Google Scholar] [CrossRef]
- Wang, T.; Wang, J.; Wang, P.; Wang, F.; Liu, L.; Guo, H. Non-uniform liquid flow distribution in an alkaline water electrolyzer with concave-convex bipolar plate (CCBP): A numerical study. Int. J. Hydrogen Energy 2023, 48, 12200–12214. [Google Scholar] [CrossRef]
- Bazarah, A.; Majlan, E.H.; Husaini, T.; Zainoodin, A.M.; Alshami, I.; Goh, J.; Masdar, M.S. Factors influencing the performance and durability of polymer electrolyte membrane water electrolyzer: A review. Int. J. Hydrogen Energy 2022, 47, 35976–35989. [Google Scholar] [CrossRef]
- Zarghami, A.; Deen, N.G.; Vreman, A.W. CFD modeling of multiphase flow in an alkaline water electrolyzer. Chem. Eng. Sci. 2020, 227, 115926. [Google Scholar] [CrossRef]
- Vogt, H. The actual current density of gas-evolving electrodes—Notes on the bubble coverage. Electrochim. Acta 2012, 78, 183–187. [Google Scholar] [CrossRef]
- Hreiz, R.; Abdelouahed, L.; Fuenfschilling, D.; Lapicque, F. Electrogenerated bubbles induced convection in narrow vertical cells: PIV measurements and Euler–Lagrange CFD simulation. Chem. Eng. Sci. 2015, 134, 138–152. [Google Scholar] [CrossRef]
- Lumanauw, D. Hydrogen bubble characterization in alkaline water electrolysis. Master’s Thesis, University of Toronto, Toronto, ON, Canada, 2000. [Google Scholar]
- Angulo, A.; van der Linde, P.; Gardeniers, H.; Modestino, M.; Rivas, D.F. Influence of bubbles on the energy conversion efficiency of electrochemical reactors. Joule 2020, 4, 555–579. [Google Scholar] [CrossRef]
- Norazahar, N.; Khan, F.; Rahmani, N.; Ahmad, A. Degradation modelling and reliability analysis of PEM electrolyzer. Int. J. Hydrogen Energy 2024, 50, 842–856. [Google Scholar] [CrossRef]
- Rajora, A.; Haverkort, J.W. An analytical model for the velocity and gas fraction profiles near gas-evolving electrodes. Int. J. Hydrogen Energy 2023, 48, 27450–27463. [Google Scholar] [CrossRef]
- Aldas, K.; Pehlivanoglu, N.; Mat, M.D. Numerical and experimental investigation of two-phase flow in an electrochemical cell. Int. J. Hydrogen Energy 2008, 33, 3668–3675. [Google Scholar] [CrossRef]
- Mat, M.D.; Aldas, K.; Ilegbusi, O.J. A two-phase flow model for hydrogen evolution in an electrochemical cell. Int. J. Hydrogen Energy 2004, 29, 1015–1023. [Google Scholar] [CrossRef]
- Xue, L.; Song, S.; Chen, W.; Liu, B.; Wang, X. Enhancing Efficiency in Alkaline Electrolysis Cells: Optimizing Flow Channels through Multiphase Computational Fluid Dynamics Modeling. Energies 2024, 17, 448. [Google Scholar] [CrossRef]
- Lee, J.; Alam, A.; Ju, H. Multidimensional and transient modeling of an alkaline water electrolysis cell. Int. J. Hydrogen Energy 2021, 46, 13678–13690. [Google Scholar] [CrossRef]
- Gao, L.Y.; Yang, L.; Wang, C.H.; Shan, G.X.; Huo, X.Y.; Zhang, M.F.; Li, W.; Zhang, J.L. Three-dimensional two-phase CFD simulation of alkaline electrolyzers. J. Electrochem. 2023, 29, 3. [Google Scholar] [CrossRef]
- Alam, A.; Park, C.; Lee, J.; Ju, H. Comparative analysis of performance of alkaline water electrolyzer by using porous separator and ion-solvating polybenzimidazole membrane. Renew. Energy 2020, 166, 222–233. [Google Scholar] [CrossRef]
- Dreoni, M.; Balduzzi, F.; Ferro, F.M.; Neben, M.; Hossain, S.S.; Ferrara, G.; Bianchini, A. Alkaline electrolysis CFD modeling and application: A novel expression for a volume fraction-dependent current density. In Proceedings of the 37th International Conference on Efficiency, Cost, Optimization, Simulation and Environmental Impact of Energy Systems (ECOS), Rhodes, Greece, 30 June–4 July 2024. [Google Scholar]
- Frey, F. Experimental Set-Up for Bubble Behaviour in a High Pressure Alkaline Electrolyte. Master’s Thesis, Karlsruhe Institute of Technology, Karlsruhe, Germany, 2016. [Google Scholar]
- Grahn, A.; Krepper, E.; Alt, S.; Kästner, W. Implementation of a strainer model for calculating the pressure drop across beds of compressible, fibrous materials. Nucl. Eng. Des. 2008, 238, 2546–2553. [Google Scholar] [CrossRef]
- ANSYS Fluent Theory Guide. 2021. Available online: https://dl.cfdexperts.net/cfd_resources/Ansys_Documentation/Fluent/Ansys_Fluent_Theory_Guide.pdf (accessed on 18 October 2024).
- Khan, I.; Wang, M.; Zhang, Y.; Tian, W.; Su, G.; Qiu, S. Two-phase bubbly flow simulation using CFD method: A review of models for interfacial forces. Prog. Nucl. Energy 2020, 125, 103360. [Google Scholar] [CrossRef]
- Antal, S.P.; Lahey, R.T.; Flaherty, J.E. Analysis of phase distribution in fully developed laminar bubbly two-phase flow. Int. J. Multiph. Flow 1991, 17, 635–652. [Google Scholar] [CrossRef]
Disclaimer/Publisher’s Note: The statements, opinions and data contained in all publications are solely those of the individual author(s) and contributor(s) and not of MDPI and/or the editor(s). MDPI and/or the editor(s) disclaim responsibility for any injury to people or property resulting from any ideas, methods, instructions or products referred to in the content. |
© 2024 by the authors. Licensee MDPI, Basel, Switzerland. This article is an open access article distributed under the terms and conditions of the Creative Commons Attribution (CC BY) license (https://creativecommons.org/licenses/by/4.0/).

