
Investigation of a Gas-Pump-Driven Loop Heat Pipe


Abstract
1. Introduction
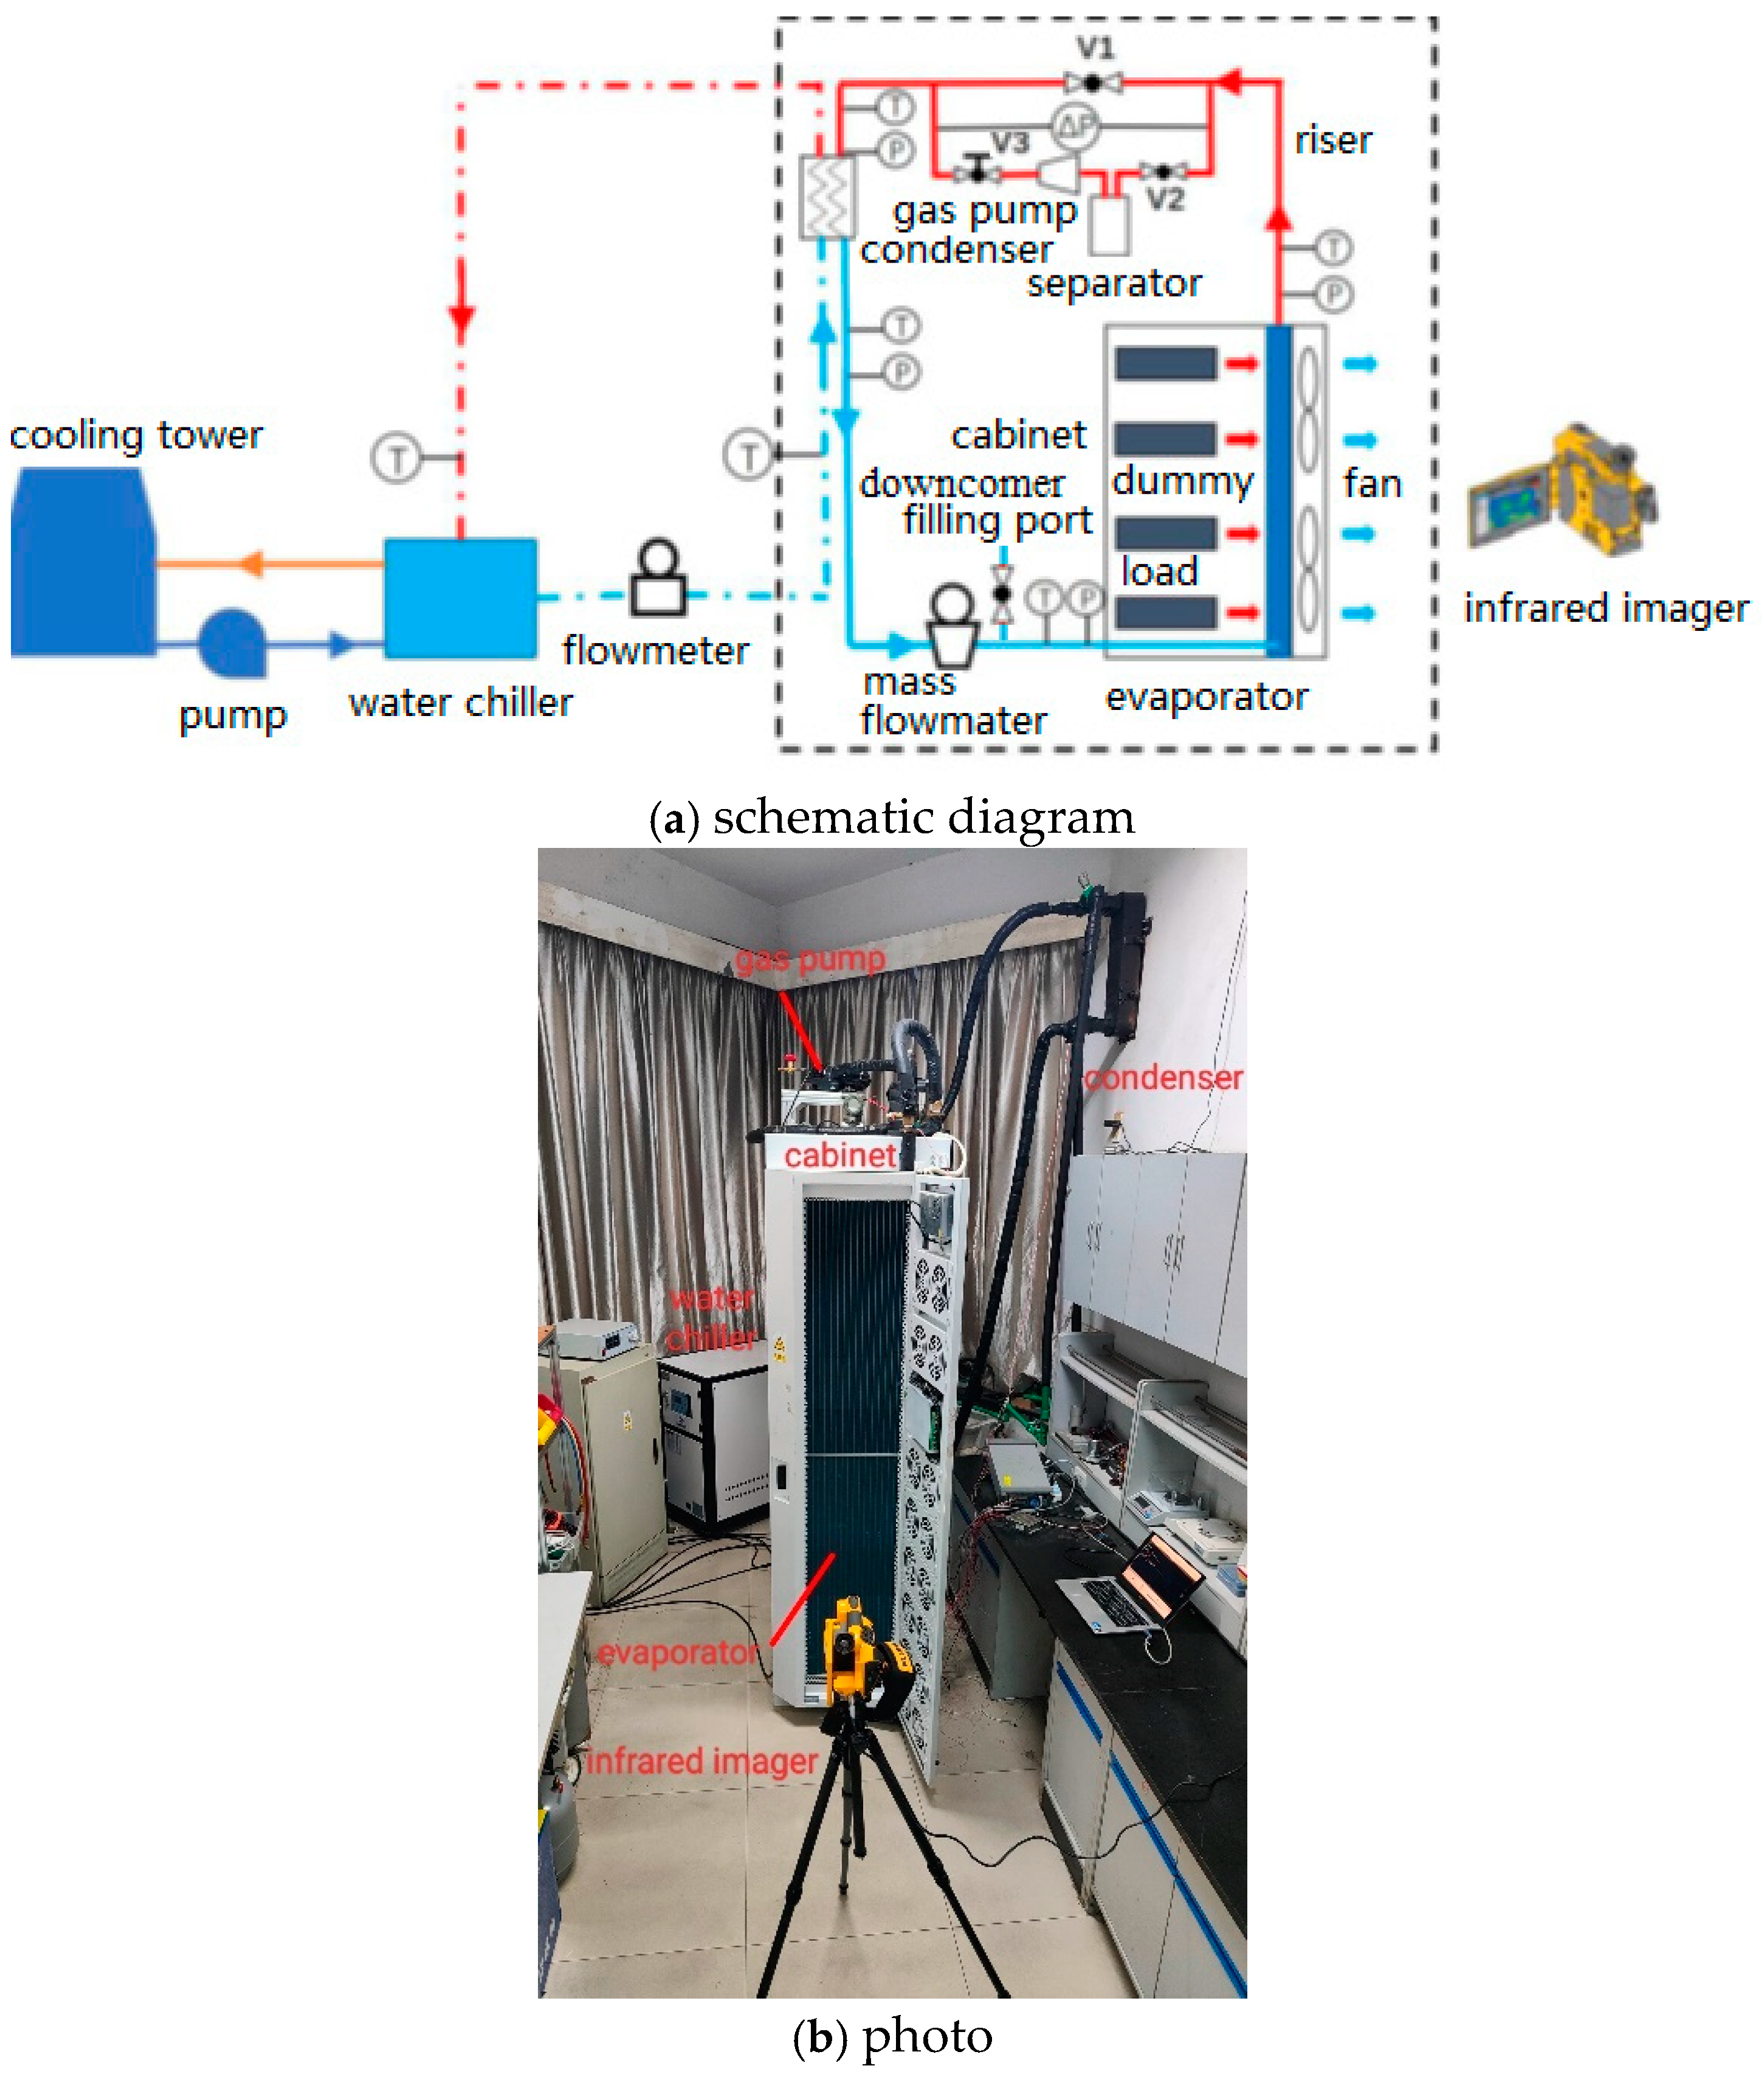
2. Experiment
3. Modelling and Solving
3.1. Model Assumption
3.2. Model
3.2.1. Single-Phase Heat Transfer
3.2.2. Two-Phase Heat Transfer
3.2.3. Single Phase Pressure Drop
3.2.4. Two-Phase Pressure Drop
3.2.5. Fan and Gas Pump
3.2.6. Mass Balance
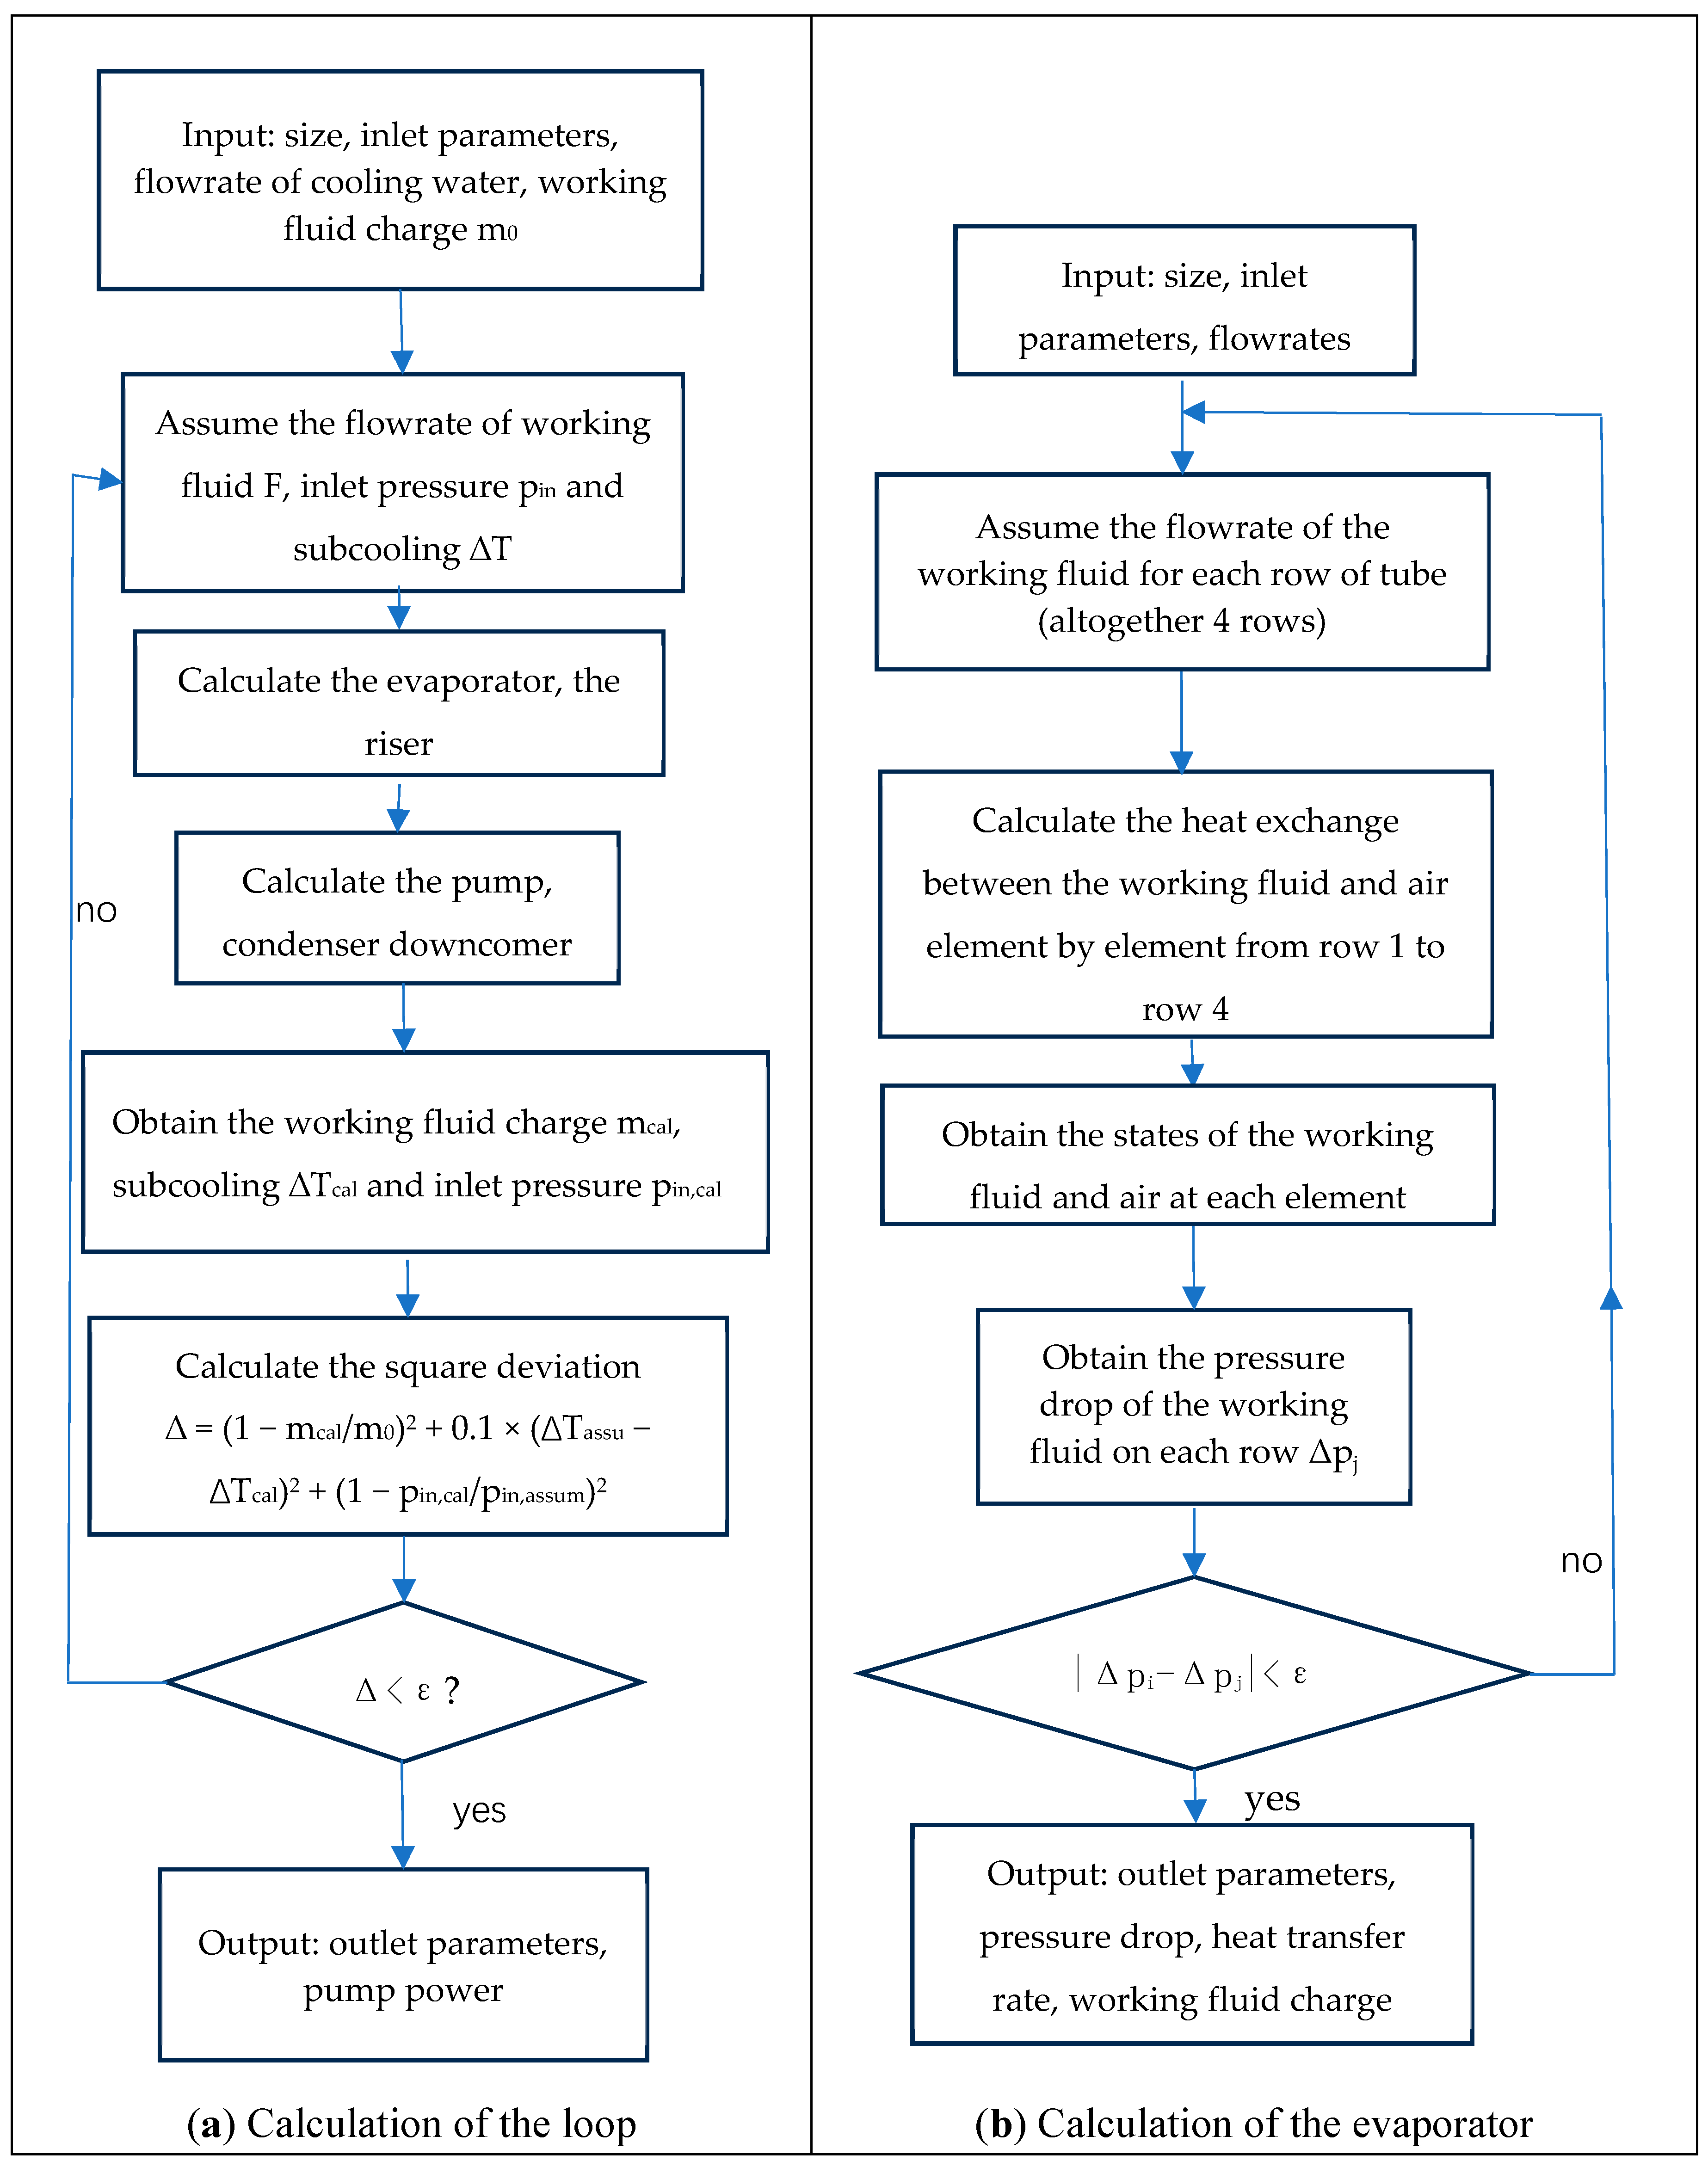
3.3. Model Solving
4. Results and Discussions
4.1. Experimental Results
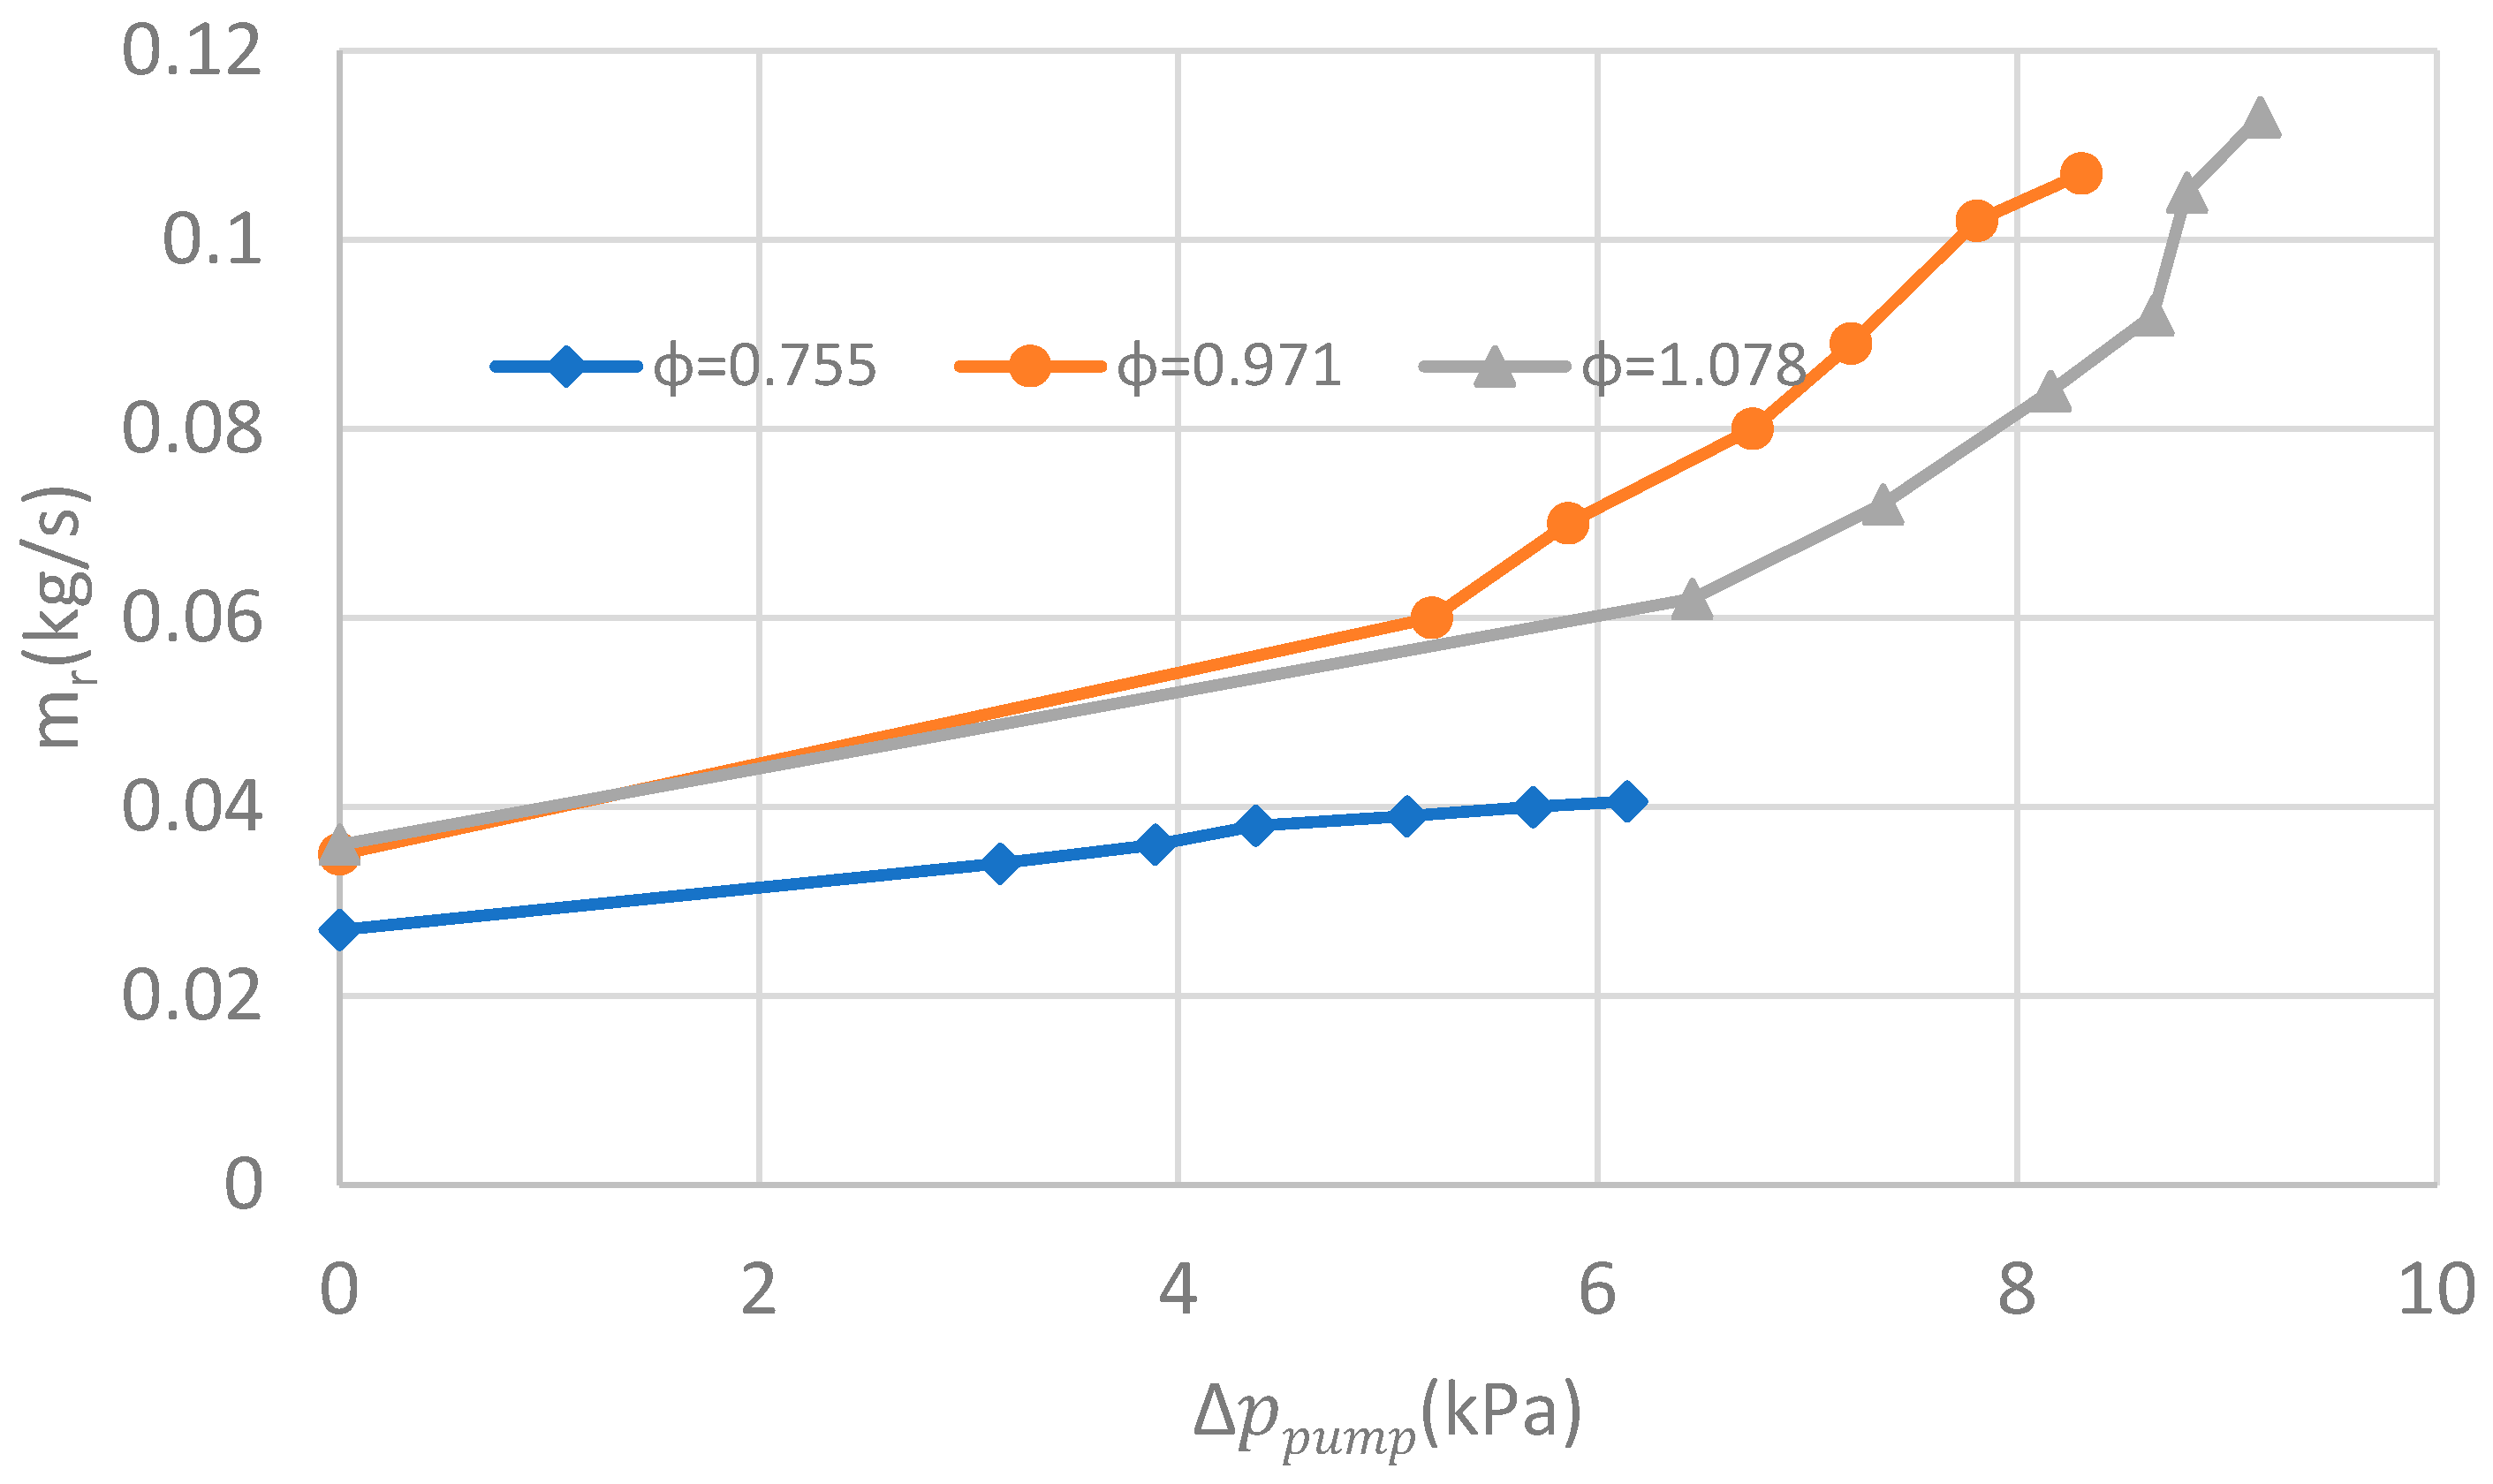
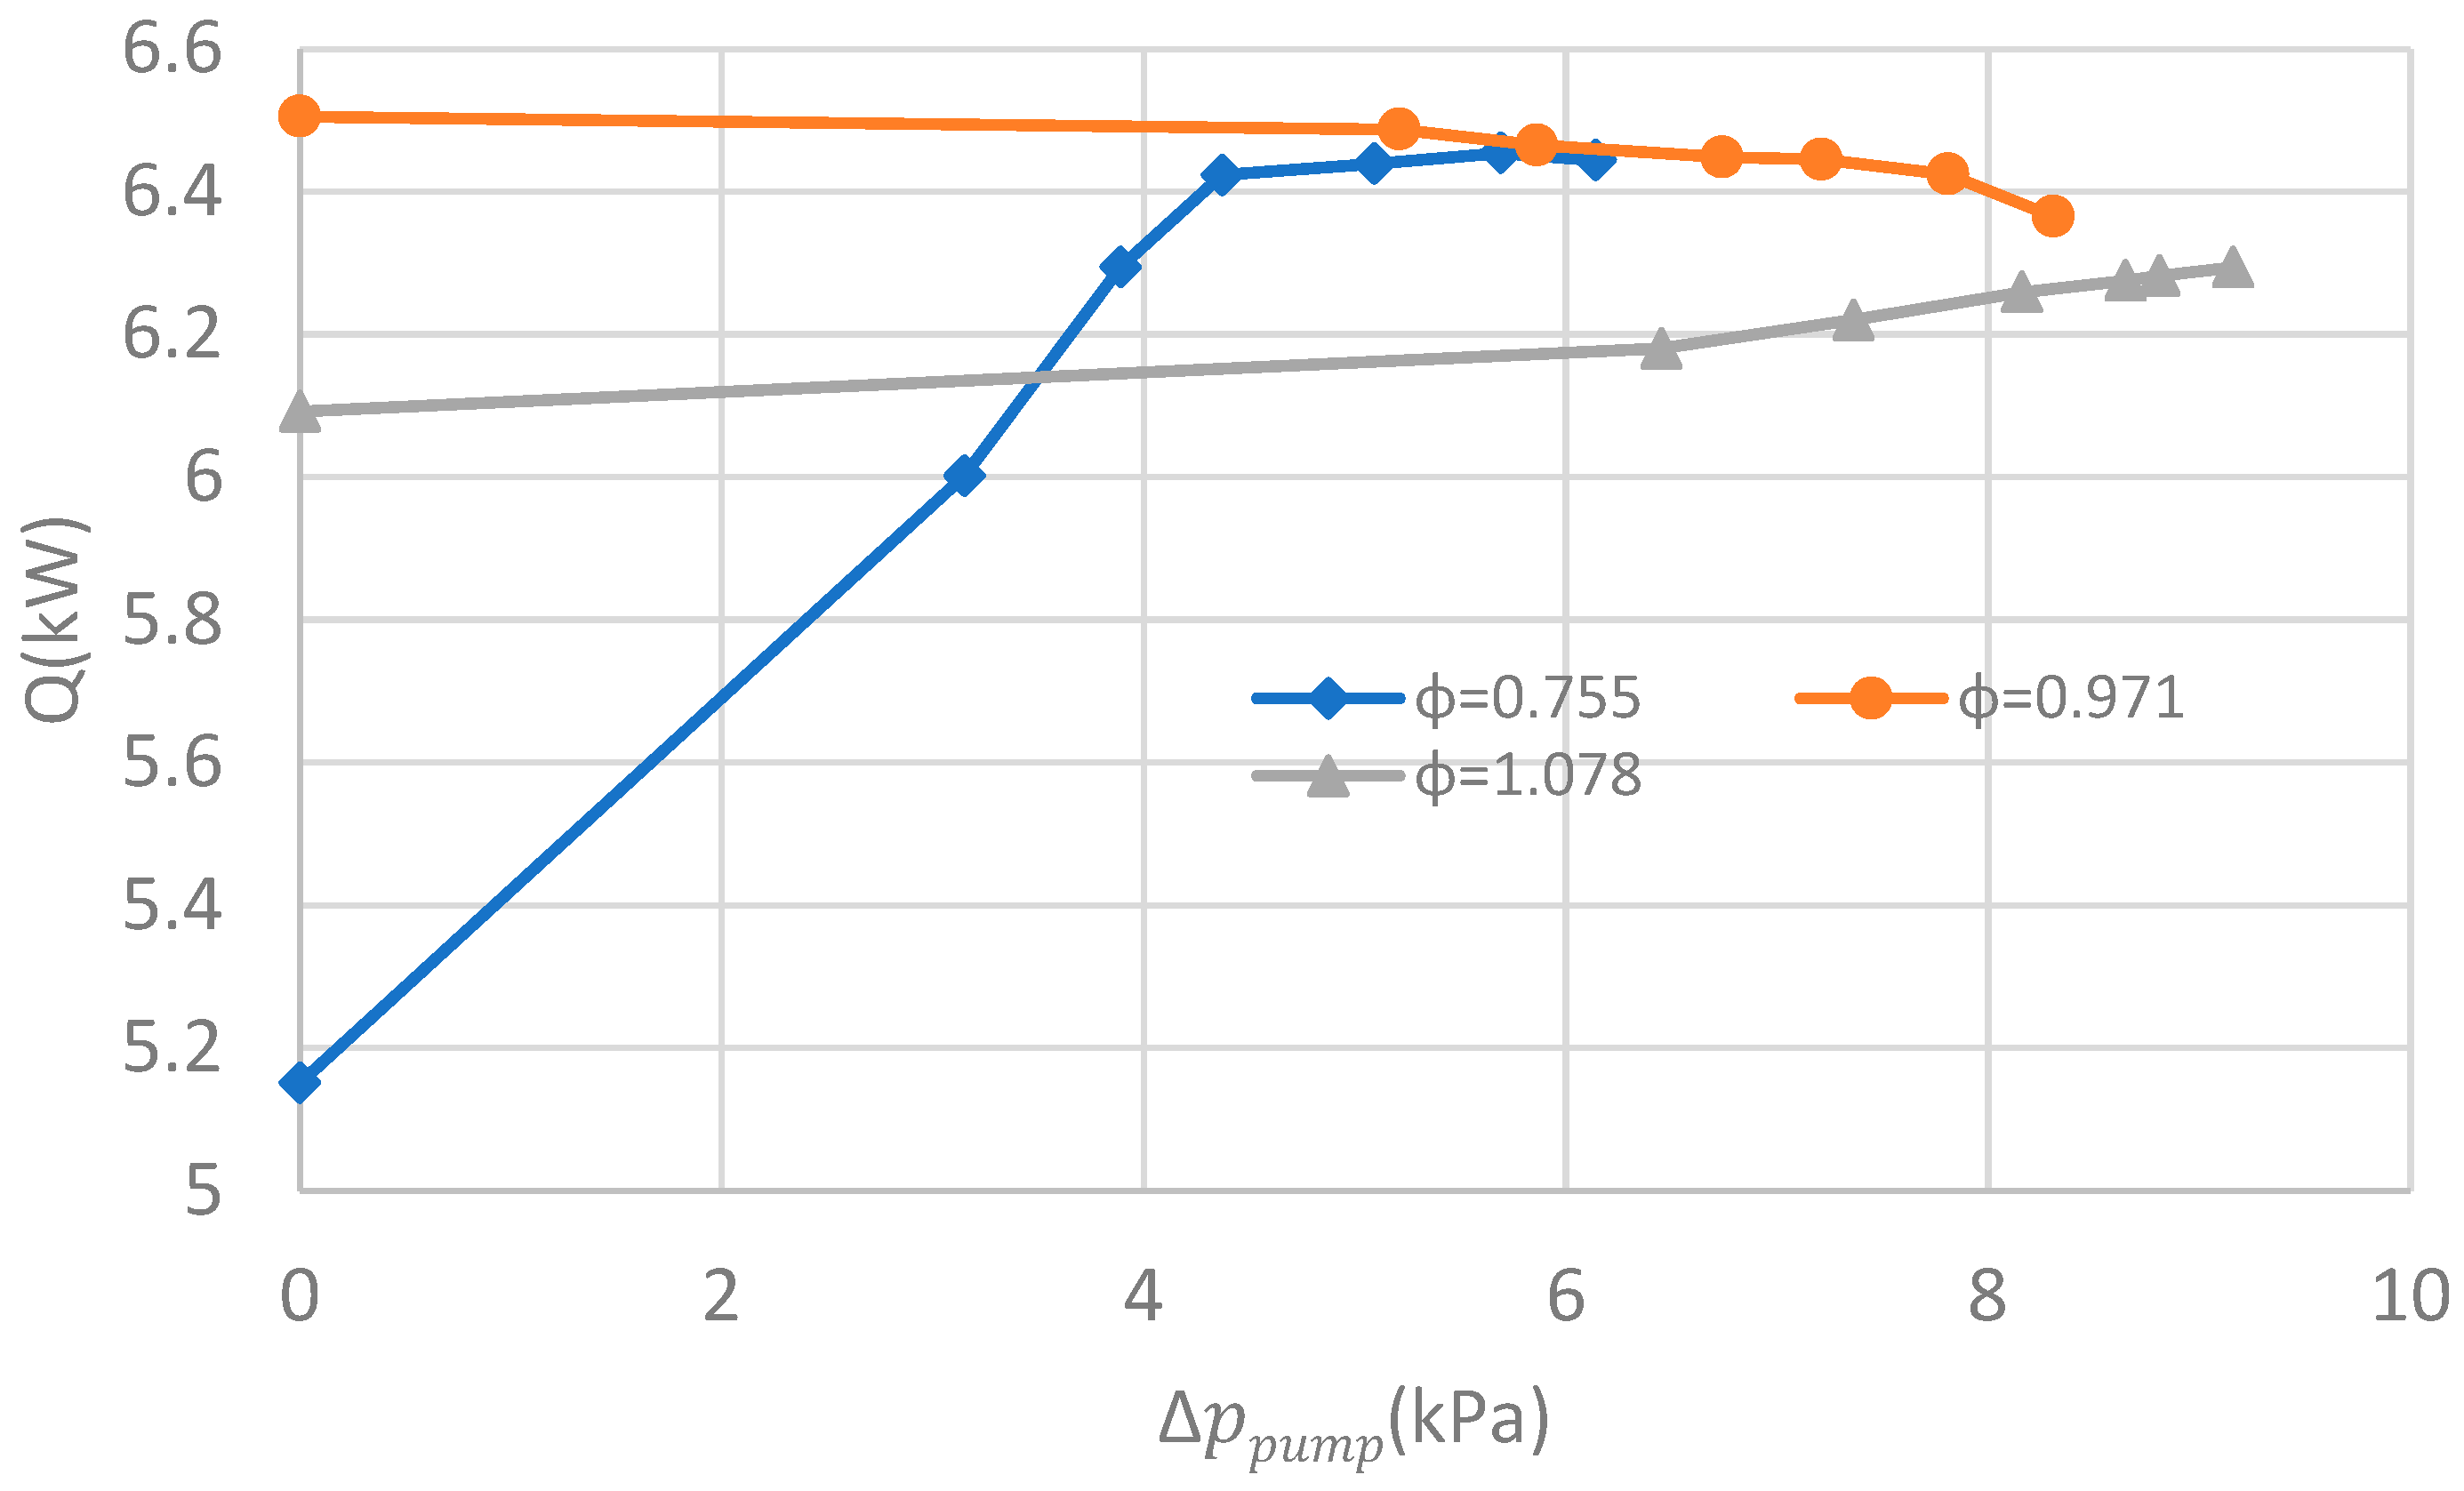
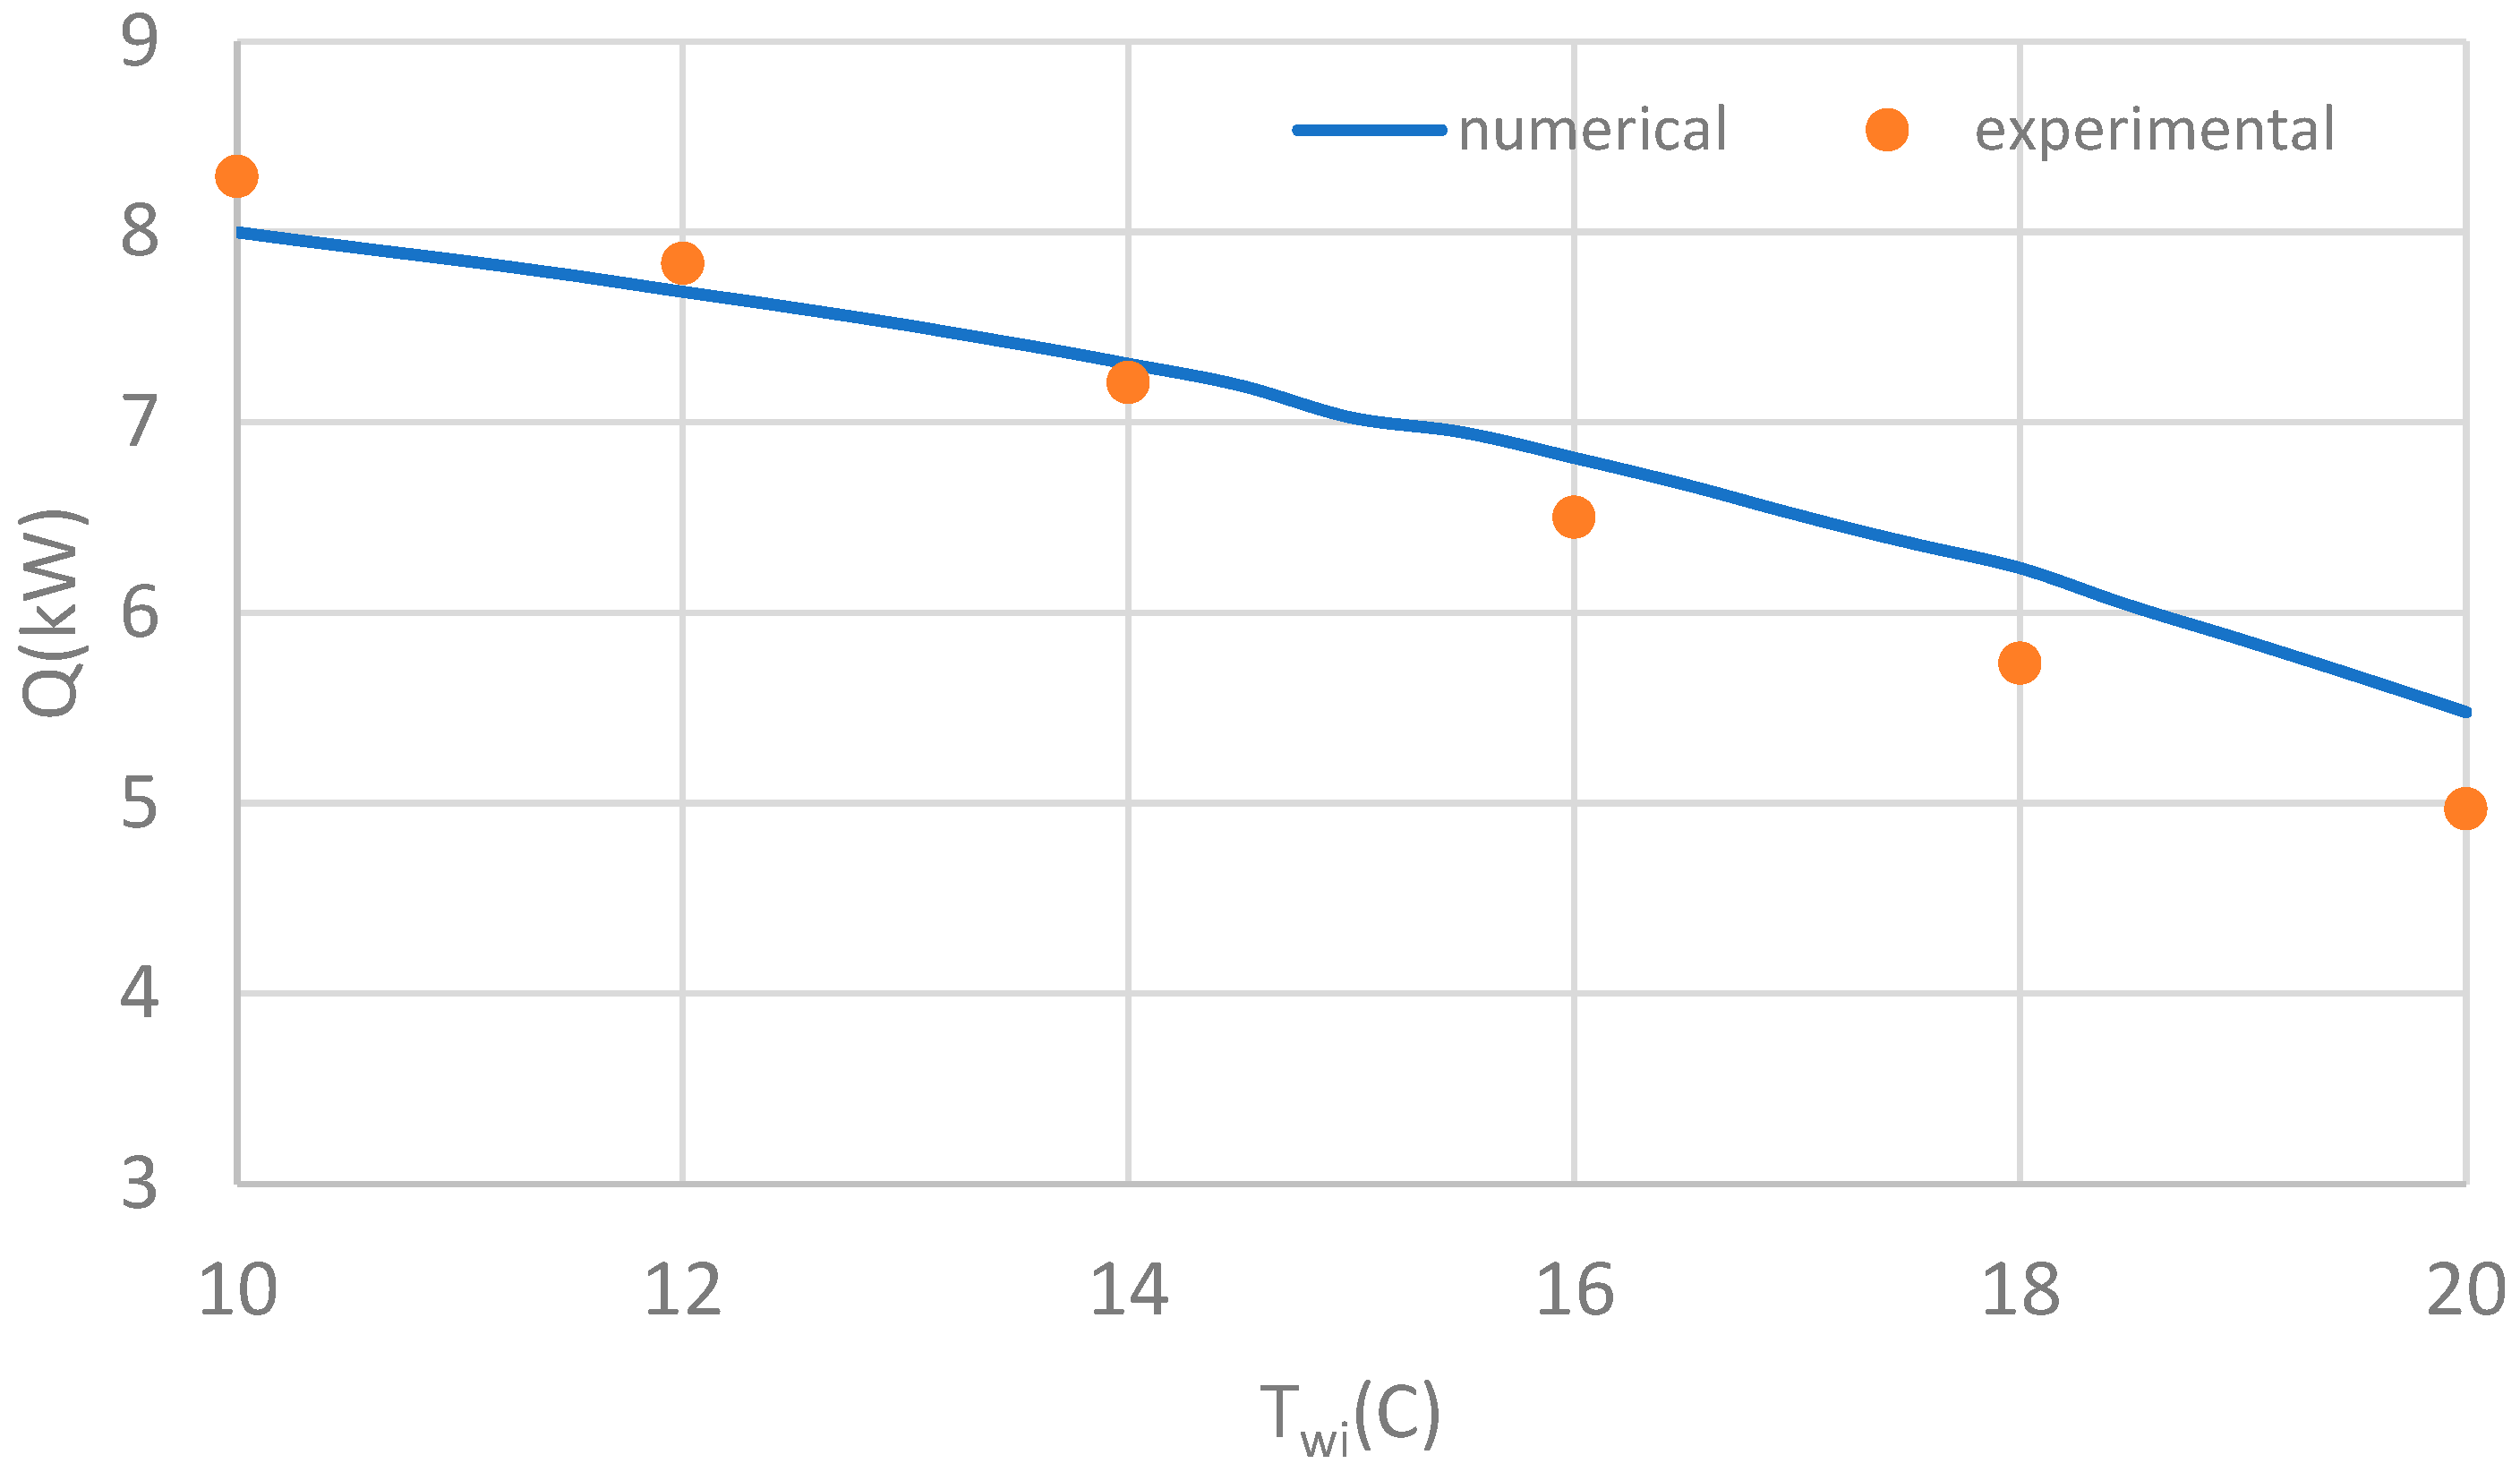
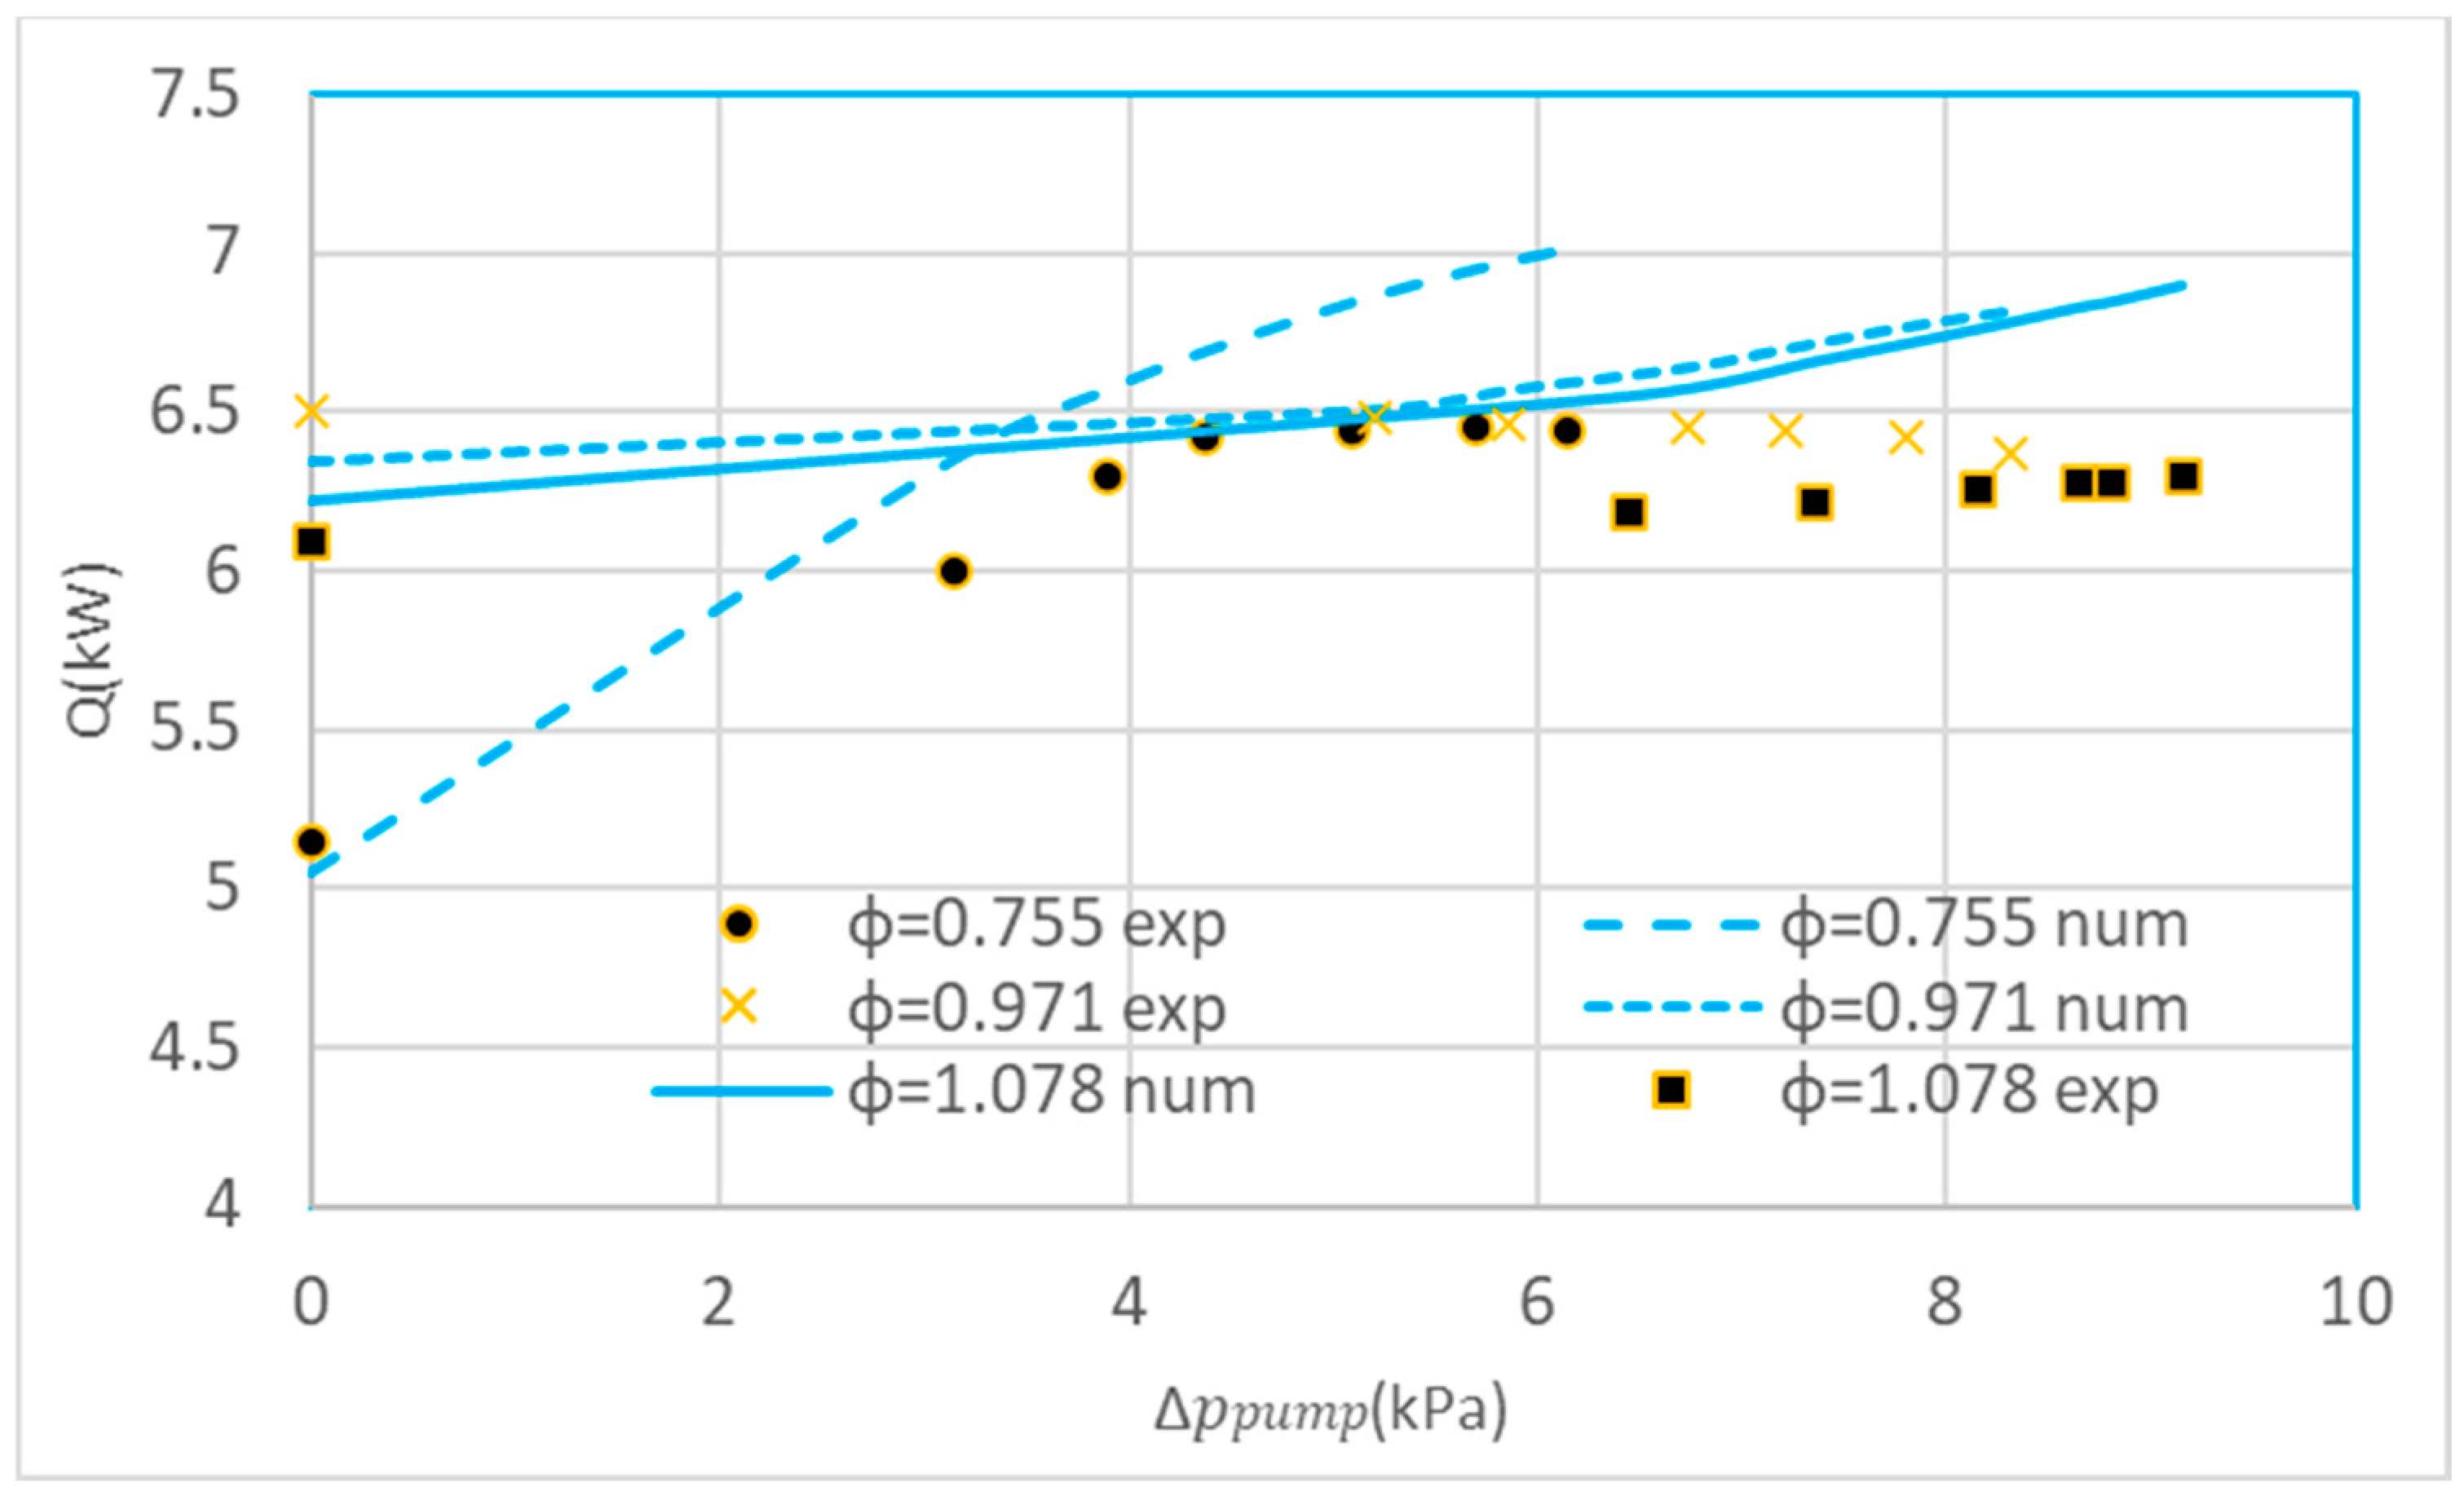
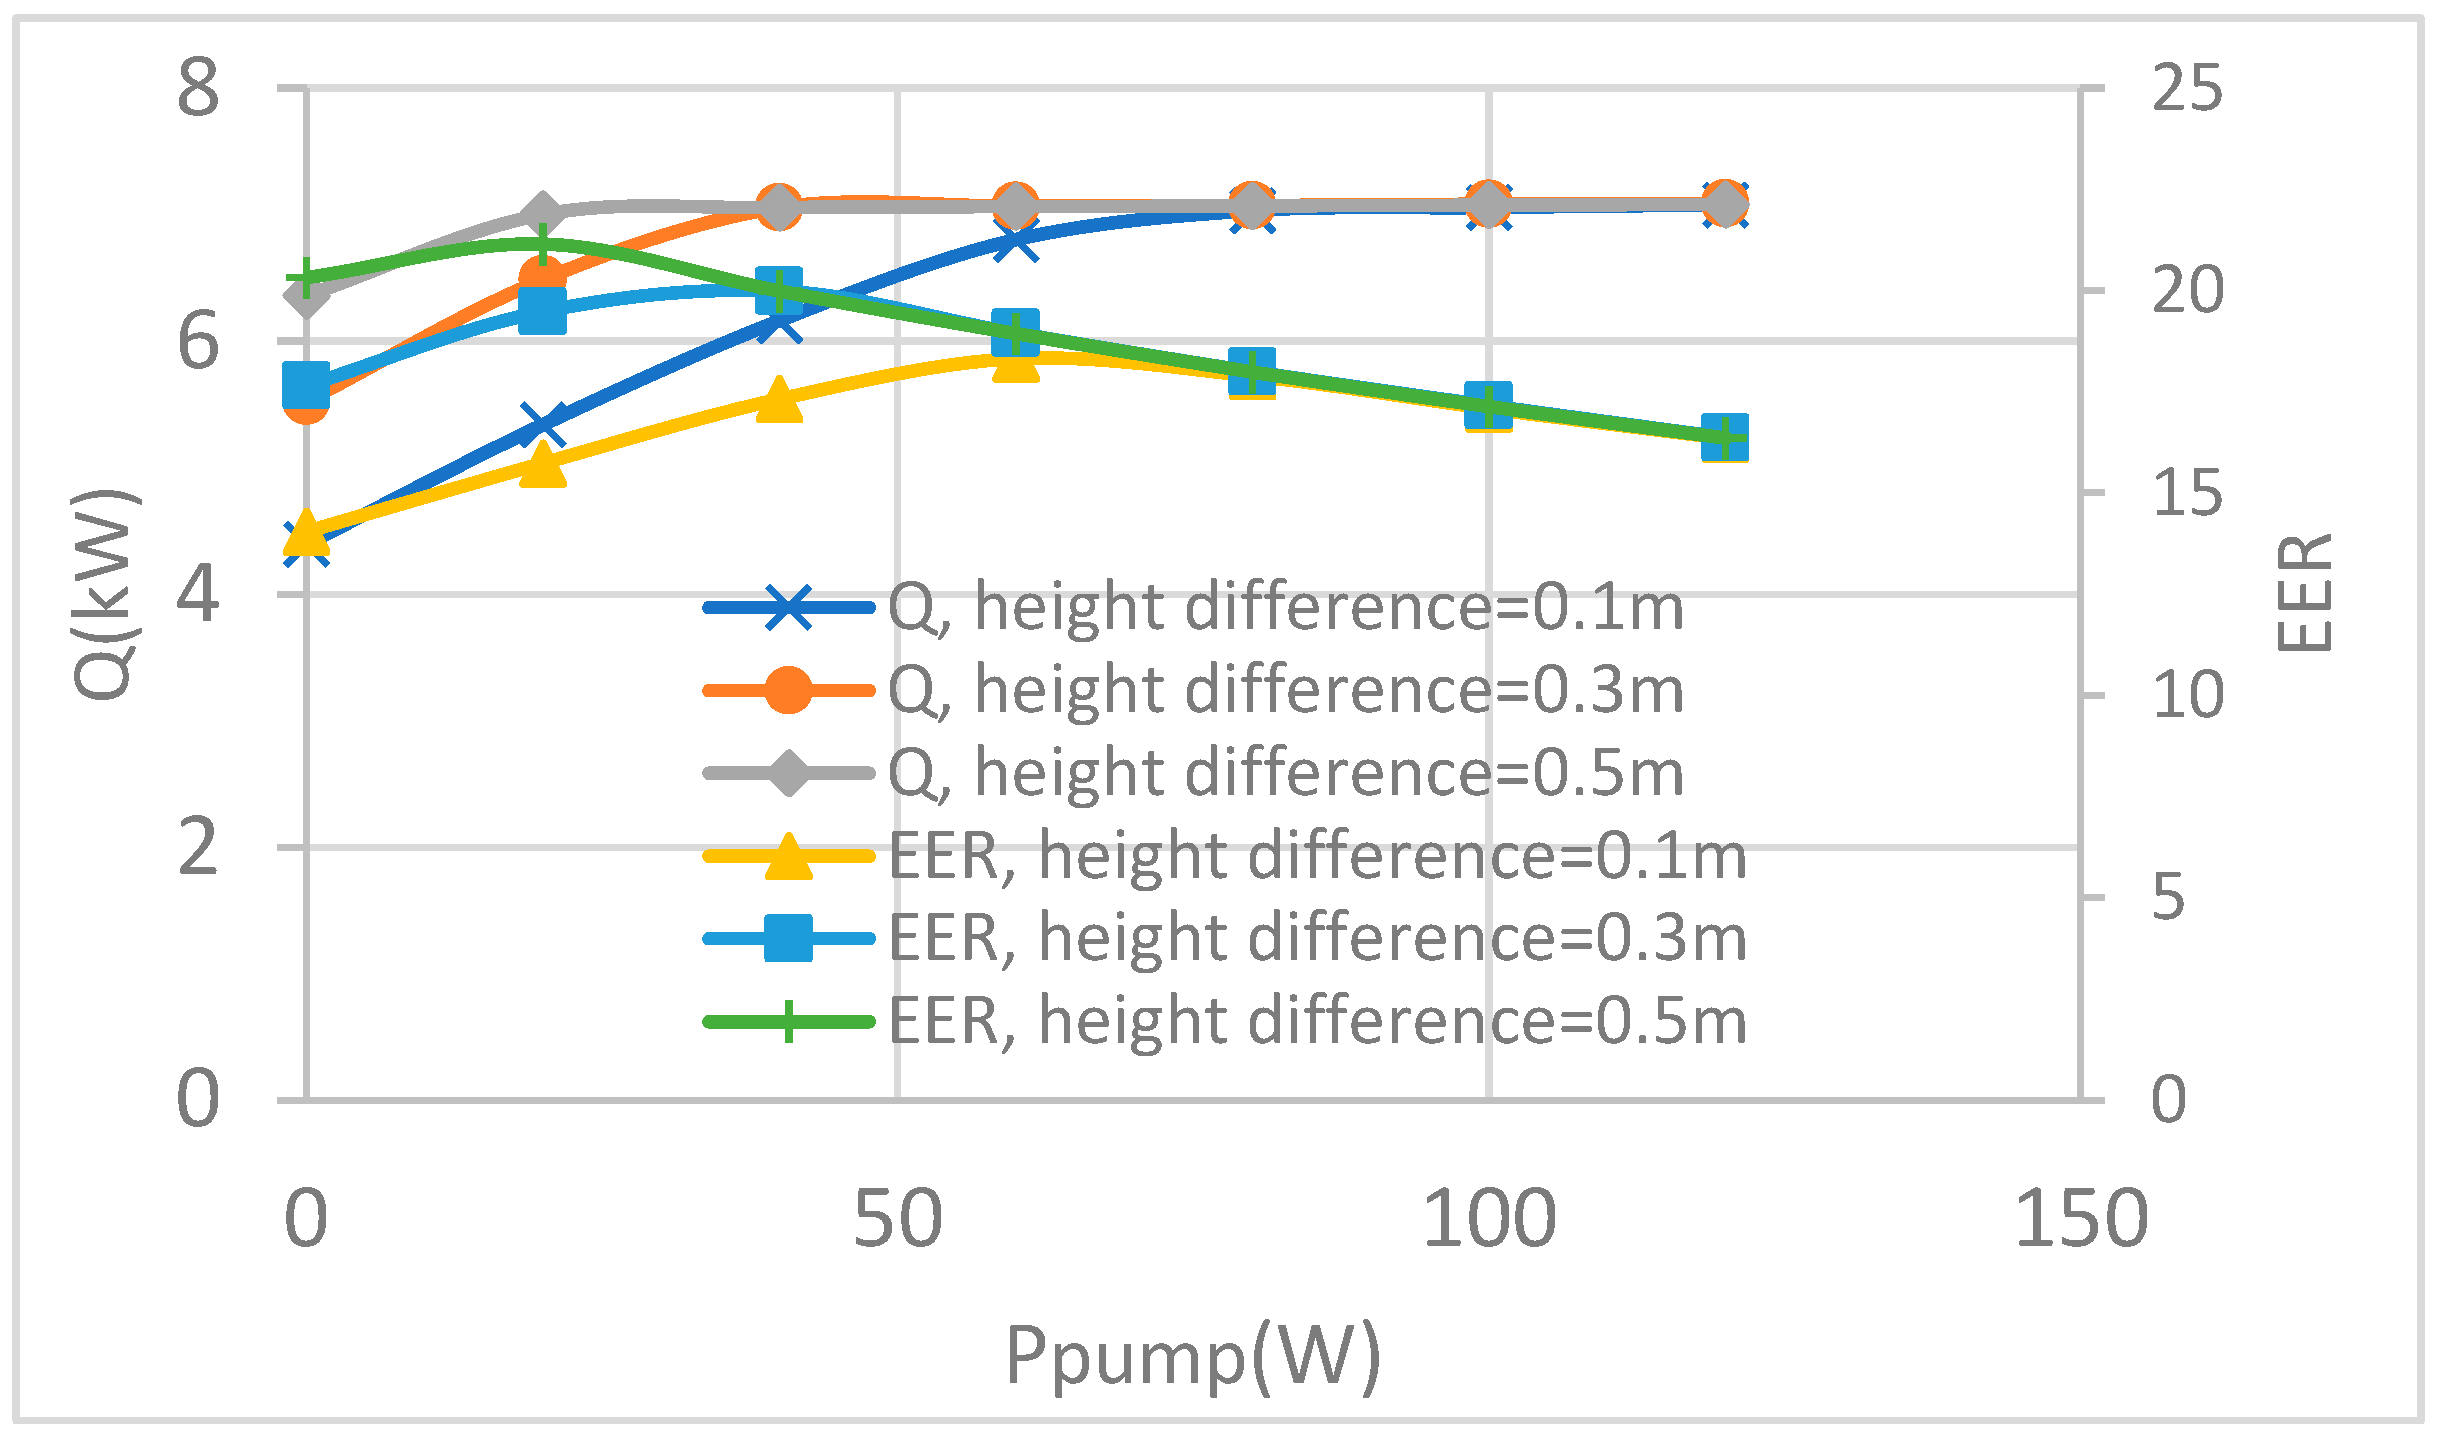
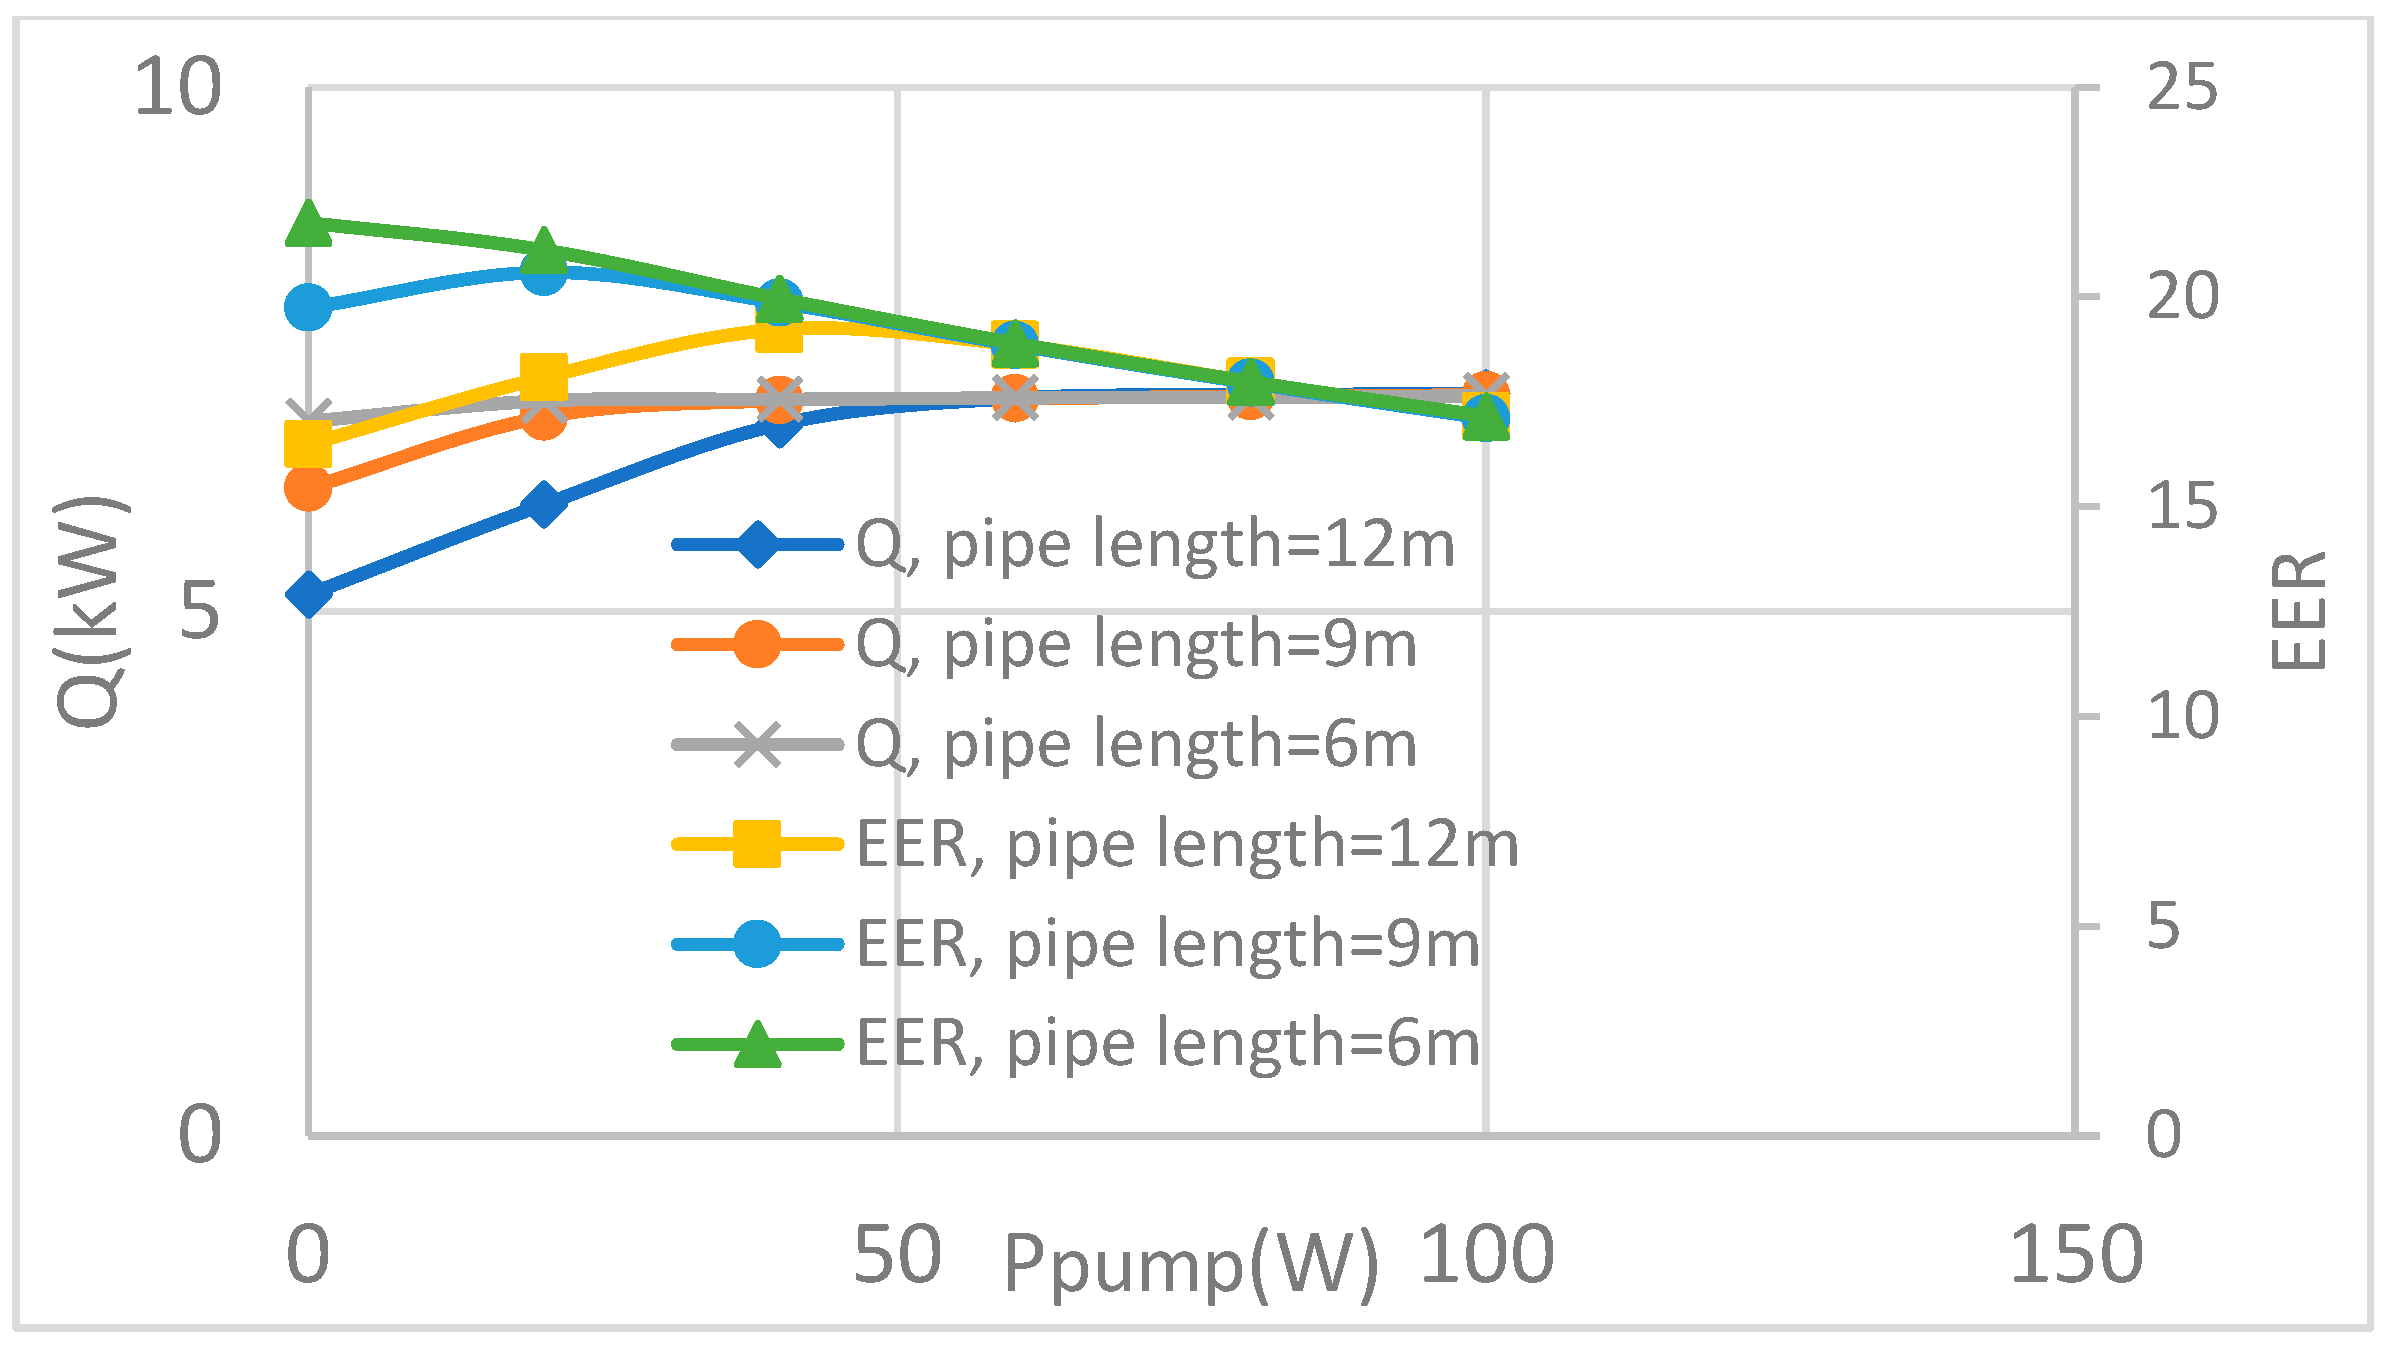
4.2. Numerical Results
4.3. Discussions
5. Conclusions
- (1)
- The gas pump can enhance the heat transfer of the LHP depending on the installation condition (height difference and distance between the evaporator and the condenser) and the filling ratio of the working fluid.
- (2)
- A positive effect can be achieved under the following situations: an insufficient change in the working fluid, an insufficient height difference between the evaporator and the condenser, an overly long distance between the evaporator and the condenser.
- (3)
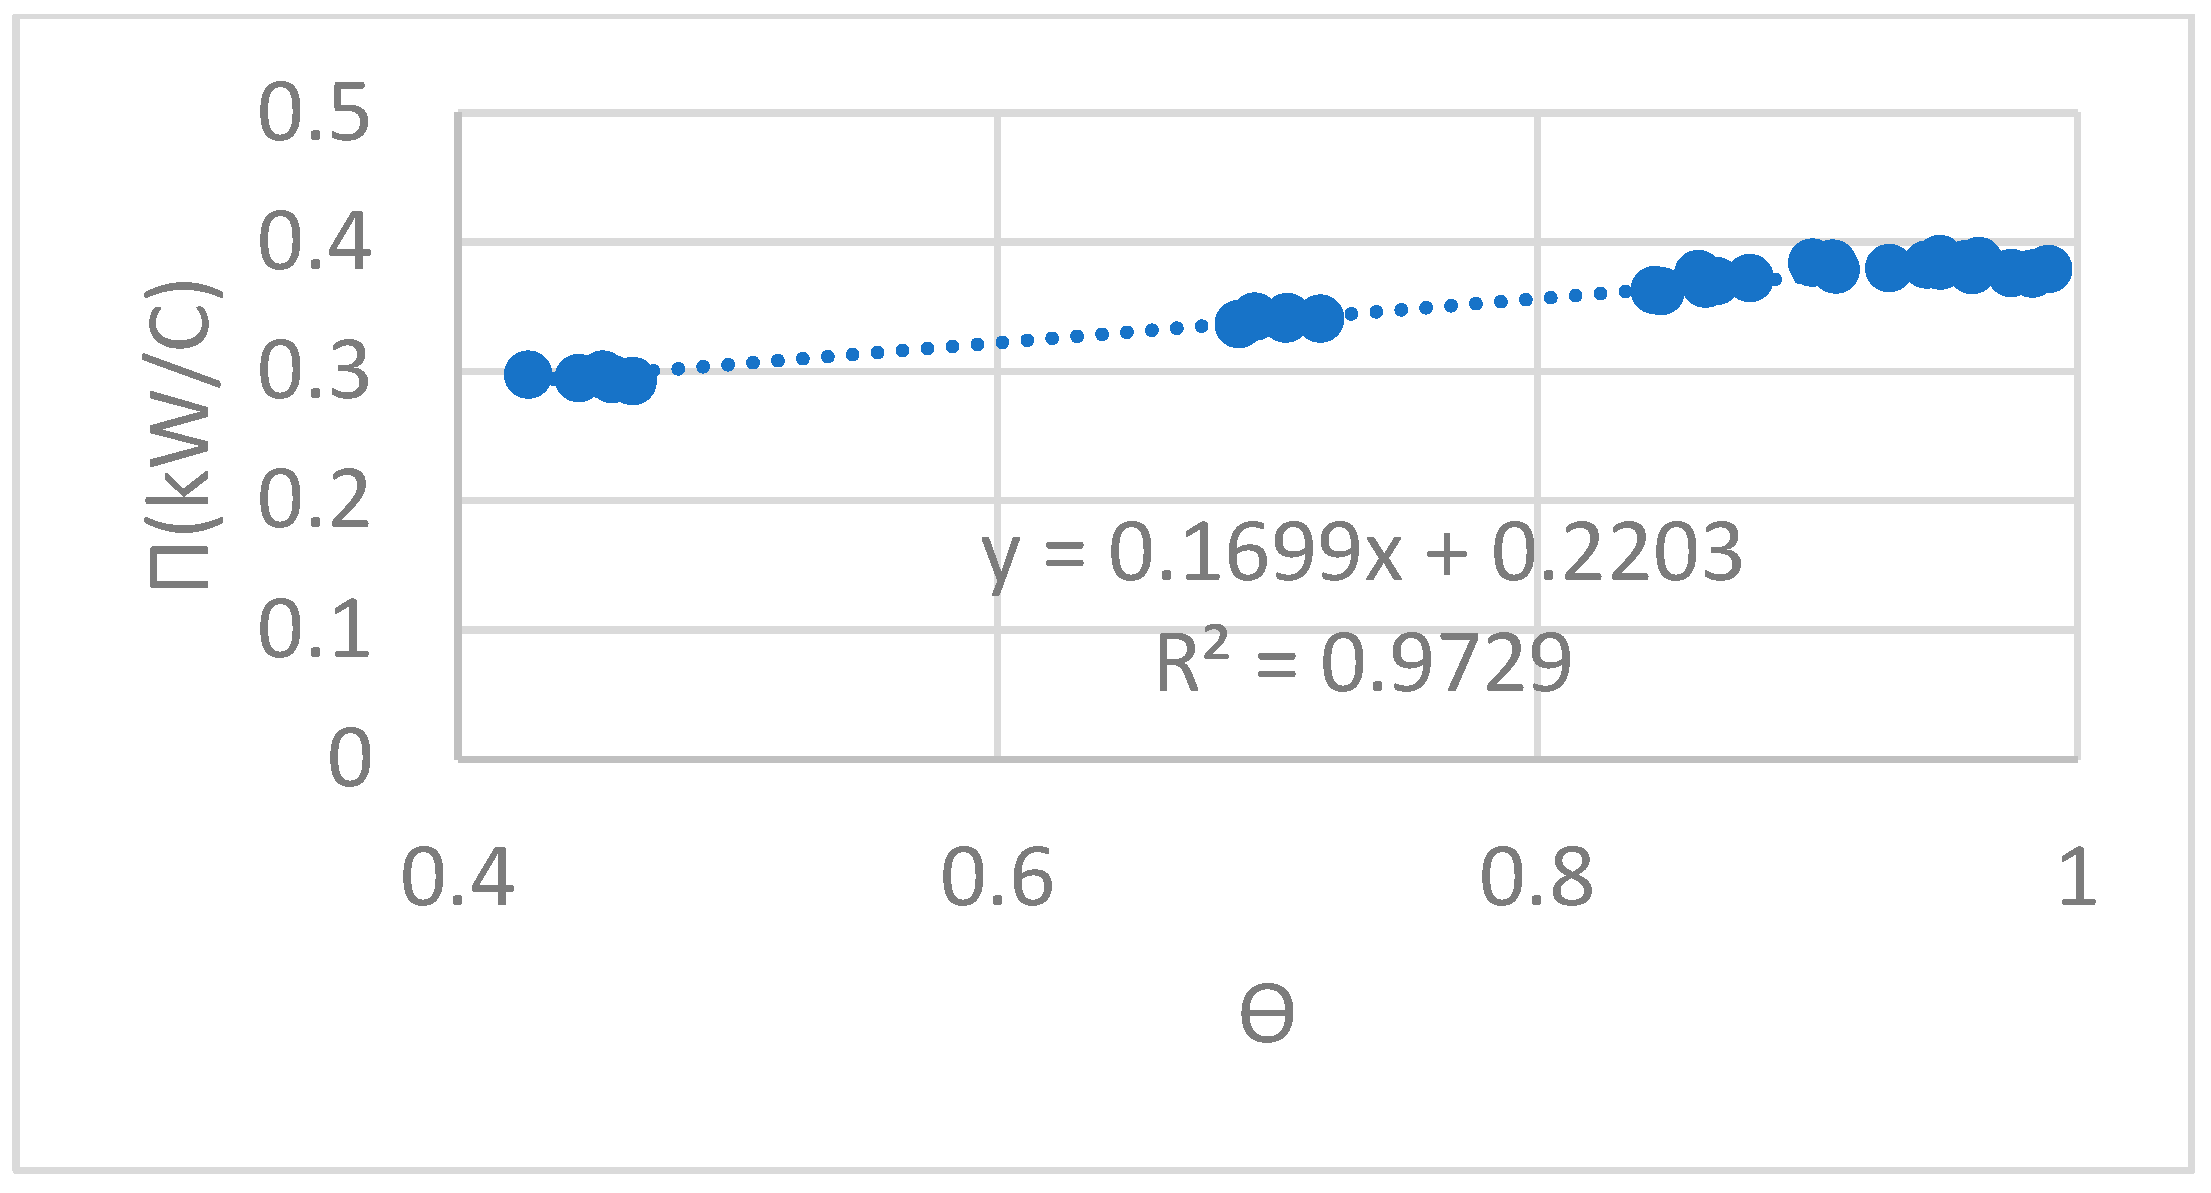
- There exists an approximately linear relationship between the heat conductance of the LHP and area ratio of two-phase zone of the evaporator when the cooling conditions on the condenser side are fixed. Maximum heat conductance may be derived from a few measurements.
Author Contributions
Funding
Data Availability Statement
Conflicts of Interest
Nomenclature
| A | constant in Equation (15) | Twi | temperature of inlet water |
| boiling number | average air temperature at the evaporator inlet | ||
| C | parameter in Equation (9) | air velocity at the narrowest section | |
| Cw | specific heat capacity of water | velocity of the working fluid | |
| equivalent diameter | water flow rate | ||
| D | inner diameter of the tube | internal volume of the evaporator | |
| f | friction coefficient | pump power | |
| volume flow rate of air | fan power | ||
| the maximum volume flow rate | x | quality of the working fluid | |
| g | gravity acceleration | void fraction | |
| mass flux | condensation heat transfer coefficient | ||
| enthalpy of working fluid at the inlet of gas pump | filling ratio | ||
| enthalpy of working fluid at the outlet of gas pump | fan efficiency | ||
| heat transfer coefficient of single-phase vapor | motor efficiency of the gas pump | ||
| heat transfer coefficient at quality x | thermodynamic efficiency of the gas pump | ||
| heat transfer coefficient at the quality x=90% | volumetric efficiency of the gas pump | ||
| L | Length of the tube | total efficiency of the gas pump | |
| fin length along the air flow direction | ρw | water density | |
| the mass of the working fluid in the evaporator | density of the liquid working fluid | ||
| the mass of the working fluid in the condenser | density of the vapor working fluid | ||
| the mass of the working fluid in the riser | density of the working fluid | ||
| the mass of the working fluid in the downcomer | density of the saturated working fluid gas | ||
| the mass flowrate of the working fluid in the LHP | acceleration pressure drop | ||
| the charge of the working fluid in the LHP | pressure drop of the air | ||
| n | parameter in Equation (9) | friction pressure drop | |
| Nu | Nusselt number | gravity pressure drop | |
| Pr | Prandtl number | maximum operating pressure lift | |
| inlet pressure of gas pump | pressure lift of the fan | ||
| outlet pressure of gas pump | pressure lift of the gas pump | ||
| Q | heat transfer rate | pressure drop of two-phase flow | |
| Re | Reynolds number | temperature difference between cold and hot sources | |
| Reynolds number of liquid phase | dynamic viscosity of saturated liquid | ||
| Reynolds number of two-phase | heat conductivity of the liquid working fluid | ||
| entropy of the working fluid at the inlet of the gas pump | thermal resistance of the LHP | ||
| entropy of the working fluid at the outlet of the gas pump | thermal conductance of the LHP | ||
| Two | temperature of the return water | ϴ | area ratio of the two-phase zone |
References
- Gong, Y.; Zhou, F.; Ma, G.; Liu, S. Advancements on mechanically driven two-phase cooling loop systems for data center free cooling. Int. J. Refrig. 2022, 138, 84–96. [Google Scholar] [CrossRef]
- Alkrush, A.A.; Salem, M.S.; Abdelrehim, O.; Hegazi, A.A. Data centers cooling: A critical review of techniques, challenges, and energy saving solutions. Int. J. Refrig. 2024, 160, 246–262. [Google Scholar] [CrossRef]
- Wang, X.; Wen, Q.; Yang, J.; Xiang, J.; Wang, Z.; Weng, C.; Chen, F.; Zheng, S. A review on data centre cooling system using heat pipe technology. Sustain. Comput. Inform. Syst. 2022, 35, 100774. [Google Scholar] [CrossRef]
- Zhang, S.; Ma, G.; Zhou, F. Experimental analysis on function of free cooling unit with a pump-driven loop heat pipe for internet data center. J. Civ. Archit. Environ. Eng. 2013, 35, 145–150. (In Chinese) [Google Scholar]
- Wang, X.; Ma, G.; Zhou, F. Performance optimization and characteristics of different refrigerants for pump-driven two-phase cooling system. J. Refrig. 2018, 39, 89–98. (In Chinese) [Google Scholar]
- Ma, G.; Wei, C.C.; Zhang, S.; Zhou, F. Application of a pumped loop heat pipe heat exchanger unit for a small data center. J. Beijing Univ. Technol. 2015, 41, 439–445. (In Chinese) [Google Scholar]
- Zhou, F.; Wei, C.; Ma, G. Development and analysis of a pump-driven loop heat pipe unit for cooling a small data center. Appl. Therm. Eng. 2017, 124, 1169–1175. [Google Scholar] [CrossRef]
- Ma, Y.; Ma, G.; Zhang, S.; Zhou, F. Cooling performance of a pump-driven two-phase cooling system for free cooling in data centers. Appl. Therm. Eng. 2016, 95, 143–149. [Google Scholar] [CrossRef]
- Zhou, F.; Li, C.; Zhu, W.; Zhou, J.; Ma, G.; Liu, Z. Energy-saving analysis of a case data center with a pump-driven loop heat pipe system in different climate regions in China. Energy Build. 2018, 169, 295–304. [Google Scholar] [CrossRef]
- Xue, L.; Ma, G.; Zhou, F.; Li, F.; Yan, X.; Jiang, M. Performance analysis of gas-pump-driven free-cooling unit in a small data center. J. Refrig. 2019, 40, 1–9. (In Chinese) [Google Scholar]
- Kokate, R.; Park, C. Numerical analysis of pumped two-phase loop: Characterization of steady-state performance. Appl. Therm. Eng. 2023, 229, 120630. [Google Scholar] [CrossRef]
- Middelhuis, M.; Muñoz Rojo, M.; Wits, W.W. Analysis and experimental validation of a pumped two-phase loop for multi-component electronics cooling. Heat Mass Transfer 2024, 60, 305–327. [Google Scholar] [CrossRef]
- Wang, F.; Huang, D.; Shi, Z. Experimental study on two kinds of dynamic separate type heat pipe system. Refrig. Air-Cond. 2017, 17, 53–57. (In Chinese) [Google Scholar]
- Wei, C.; Ma, G.; Xu, S.; Zhang, S.; Zhou, F. Design and experimental study on heat exchanger unit with a gas pump-driven loop heat pipe for communication base stations. In Proceedings of the 12th National Conference on Refrigerator, Air Conditioner and Compressor, Hefei, China, 17 October 2014. (In Chinese). [Google Scholar]
- Shi, W.; Wang, F.; Huang, D.; Shi, Z. Development of gas pressurized composite air-conditioning unit and annual operation energy efficiency analysis. Refrig. Air Cond. 2017, 17, 11–16. (In Chinese) [Google Scholar]
- Zhang, P.; Li, X.; Li, R.; Shi, W.; Wang, B. Comparative study of two-phase natural circulation and gas-side mechanically driven loop used in air-conditioning systems. Appl. Therm. Eng. 2019, 153, 848–860. [Google Scholar] [CrossRef]
- Li, S.; Ma, G.; Xue, L.; Zhou, F. Working characteristics of a rotary booster-driven loop cooling unit. J. Refrig. 2019, 40, 1–7. (In Chinese) [Google Scholar] [CrossRef]
- Wang, F.; Shao, S. Analysis on energy-saving potentiality of gas pump driven heat pipe composite air-conditioning in data center. Refrig. Air-Cond. 2021, 21, 73–77. (In Chinese) [Google Scholar]
- Rong, Y.; Su, W.; Wang, S.; Du, B.; Wei, J.; Zhang, S. Optimization of finned-tube heat exchanger in a gravity-assisted separated heat pipe. Front. Heat Mass Transf. 2024, in press. [Google Scholar] [CrossRef]
- Shah, R.K.; Sekulić, D.P. Fundamentals of Heat Exchanger Design; John Wiley & Sons: Hoboken, NJ, USA, 2003; pp. 482–483. [Google Scholar]
- Roetzel, W.; Das, S.K.; Luo, X. Measurement of the heat transfer coefficient in plate heat exchangers using a temperature oscillation technique. Int. J. Heat Mass Transf. 1994, 37, 325–331. [Google Scholar] [CrossRef]
- Zhang, Z.Y. Refrigeration Principal and Equipment; Mechanical Industry Press: Beijing, China, 1987; pp. 205–206. (In Chinese) [Google Scholar]
- Gungor, K.E.; Winterton, R.H.S. A general correlation for fow boiling in tubes and annuli. Int. J. Heat Mass Transf. 1986, 29, 351–358. [Google Scholar] [CrossRef]
- Bensafi, A.; Borg, S.; Parent, D. CYRANO: A computational model for the detailed design of plate-fin-and-tube heat exchangers using pure and mixed refrigerants. Int. J. Refrig. 1997, 20, 218–228. [Google Scholar] [CrossRef]
- Chen, B.H.; Li, X.R.; Feng, Z.L.; Yao, R.Y. Application Manual of Plate Heat Exchanger and Heat Transfer Device; China Architecture Industry Press: Beijing, China, 2005; pp. 149–150. [Google Scholar]
- Nadjahi, C.; Louahlia-Gualous, H.; Le Masson, S. Experimental study and analytical modeling of thermosyphon loop for cooling data center racks. Heat Mass Transf. 2020, 56, 121–142. [Google Scholar] [CrossRef]
- Muley, A.; Manglik, R.M. Experimental study of turbulent flow heat transfer and pressure drop in a plate heat exchanger with chevron plates. J. Heat Transf. 1999, 121, 110–117. [Google Scholar] [CrossRef]
- Zivi, S.M. Estimation of steady-state steam void-fraction by means of the principle of minimum entropy production. J. Heat Transf. 1964, 86, 247–251. [Google Scholar] [CrossRef]
- Friedel, L. Improved friction pressure drop correlations for horizontal and vertical two phase pipe flow. Rohre-Rohreleitungsbau-Rohreleitungstransport 1979, 18, 485–491. [Google Scholar]
- Han, D.; Lee, K.; Kim, Y. The characteristics of condensation in brazed plate heat exchangers with different chevron angles. J Korean Phys. Soc. 2003, 43, 66–73. [Google Scholar]
- Liang, K.; Stone, R.; Hancock, W.; Dadd, M.; Bailey, P. Comparison between a crank-drive reciprocating compressor and a novel oil-free linear compressor. Energy Econ. 2014, 45, 25–34. [Google Scholar] [CrossRef]
- Lemmon, E.W.; Huber, M.L.; McLinden, M.O. REFPROP, NIST Standard Reference Database 23, Version 9.1. 2017.
- Li, H.; Hrnjak, P. Quantification of liquid refrigerant distribution in parallel flow microchannel heat exchanger using infrared thermography. Appl. Therm. Eng. 2015, 78, 410–418. [Google Scholar] [CrossRef]
- Zhang, P.; Li, X.; Shi, W.; Wang, B.; Rong, X. Experimentally comparative study on two-phase natural and pump-driven loop used in HVAC systems. Appl. Therm. Eng. 2018, 142, 321–333. [Google Scholar] [CrossRef]
- Guo, W.; Li, F.; Zhao, R.; Huang, D.; Zhao, Y. Predicting evaporation heat transfer coefficient distribution in multi-path alternating-laminated-microchannel-tube (ALMT) heat exchanger based on infrared thermography. Appl. Energy 2024, 364, 123161. [Google Scholar] [CrossRef]
- Leblay, P.; Henry, J.-F.; Caron, D.; Leducq, D.; Fournaison, L.; Bontemps, A. Characterisation of the hydraulic maldistribution in a heat exchanger by local measurement of convective heat transfer coefficients using infrared thermography. Energy Econ. 2014, 45, 73–82. [Google Scholar] [CrossRef]
- Sarraf, K.; Launay, S.; El Achkar, G.; Tadrist, L. Local vs global heat transfer and flow analysis of hydrocarbon complete condensation in plate heat exchanger based on infrared thermography. Int. J. Heat Mass Transf. 2015, 90, 878–893. [Google Scholar] [CrossRef]
- Zhang, H.; Shi, Z.; Liu, K.; Shao, S.; Jin, T.; Tian, C. Experimental and numerical investigation on a CO2 loop thermosyphon for free cooling of data centers. Appl. Therm. Eng. 2017, 111, 1083–1090. [Google Scholar] [CrossRef]
- Zhang, S.; Li, Y.; Xu, Y.; Yang, J.; Wang, Q. A new method for estimating the refrigerant distribution in plate evaporator based on infrared thermal imaging. Int. J. Refrig. 2021, 126, 57–65. [Google Scholar] [CrossRef]


| Parameter | Value |
|---|---|
| Evaporator | |
| Inner diameter of liquid inlet line (mm) | 15.88 |
| Inner diameter of gas outlet line (mm) | 19.05 |
| Space between neighbored columns (mm) | 18 |
| Space between neighbored rows (mm) | 18 |
| Thickness of corrugated fin (mm) | 0.11 |
| Space between neighbored fins (mm) | 1.5 |
| Tube size (mm) | ∅7 × 0.24 |
| Tube length (mm) | 1800 |
| Number of tube rows | 4 |
| Column number of tube | 17 |
| Fan number | 14 |
| Condenser | |
| Length of the plate (mm) | 525 |
| Width of the plate (mm) | 107 |
| Thickness of the plate (mm) | 0.4 |
| Chevron angle of the plate (°) | 65 |
| Hydraulic diameter (mm) | 4.2 |
| Flow area of single channel (mm2) | 206 |
| Heat transfer area (m2) | 1.25 |
| Item | Type | Range | Precision |
|---|---|---|---|
| Temperature | PT100 platinum resistor (Xiamen Mingcon Instrument Co., Ltd., Xiamen, China) | −50~500 °C | ±0.1 °C |
| Pressure | Pressure transmitter (Xuan Sheng Instrument Technology Co., Ltd., Suzhou, China) | 0~5 MPa | ±0.2% |
| Pressure difference | EJA110E pressure difference transducer (Yokogawa China Co., Ltd., Shanghai, China) | 0~100 kPa | ±0.075% |
| Air velocity | Hot wire anemometer (Testo SE & Co., KGaA, Shenzhen, China) | 0~30 m/s | ±0.1 m/s |
| Refrigerant mass flow rate | Coriolis mass flowmeter (MicroMotion, Inc., Boulder, CO, USA) | 0~0.378 kg/s | ±0.2% |
| Water flow rate | Electromagnetic flowmeter (Shanghai Micro Condition Measurement and Control Technology Co., Ltd., Shanghai, China) | 0~17.671 m3/h | ±0.2% |
| Electricity power | Power meter (Ningbo Gigh-tech Zone Xincheng Electronics Co., Ltd., Ningbo, China) | 0~2500 W | ±0.1% |
| Parameter | Value |
|---|---|
| Temperature range | −40~+1200 °C |
| Measurement accuracy | ±1.5 °C or ±1.5% |
| Image resolution | 640 × 480 Pixels |
| NETD | 0.03 °C |
| Wavelength range | 7.5~14 μm |
| Installation Condition | Filling Ratio | Effect (Positive/Negative) |
|---|---|---|
| Appropriate height difference and distance | Appropriate | negative |
| Appropriate height difference and distance | insufficient | Positive |
| Appropriate height difference and distance | Too high | Positive |
| Too long distance | Appropriate | Positive |
| Too small height difference | Appropriate | Positive |
Disclaimer/Publisher’s Note: The statements, opinions and data contained in all publications are solely those of the individual author(s) and contributor(s) and not of MDPI and/or the editor(s). MDPI and/or the editor(s) disclaim responsibility for any injury to people or property resulting from any ideas, methods, instructions or products referred to in the content. |
© 2024 by the authors. Licensee MDPI, Basel, Switzerland. This article is an open access article distributed under the terms and conditions of the Creative Commons Attribution (CC BY) license (https://creativecommons.org/licenses/by/4.0/).
Share and Cite
Rong, Y.; Su, W.; Wang, S.; Du, B.; Mao, Z.; Zhang, S. Investigation of a Gas-Pump-Driven Loop Heat Pipe. Energies 2024, 17, 5283. https://doi.org/10.3390/en17215283
Rong Y, Su W, Wang S, Du B, Mao Z, Zhang S. Investigation of a Gas-Pump-Driven Loop Heat Pipe. Energies. 2024; 17(21):5283. https://doi.org/10.3390/en17215283
Chicago/Turabian StyleRong, Yangyiming, Weitao Su, Shuai Wang, Bowen Du, Zujun Mao, and Shaozhi Zhang. 2024. "Investigation of a Gas-Pump-Driven Loop Heat Pipe" Energies 17, no. 21: 5283. https://doi.org/10.3390/en17215283
APA StyleRong, Y., Su, W., Wang, S., Du, B., Mao, Z., & Zhang, S. (2024). Investigation of a Gas-Pump-Driven Loop Heat Pipe. Energies, 17(21), 5283. https://doi.org/10.3390/en17215283