Article

Detection of Impedance Inhomogeneity in Lithium-Ion Battery Packs Based on Local Outlier Factor

1
Hubei Key Laboratory for High-Efficiency Utilization of Solar Energy and Operation Control of Energy Storage Systesm, Hubei University of Technology, Wuhan 430068, China
2
Huizhou Power Supply Bureau of Guangdong Power Grid Co., Ltd., Huizhou 516000, China
*
Author to whom correspondence should be addressed.
Energies 2024, 17(20), 5123; https://doi.org/10.3390/en17205123
Submission received: 26 September 2024 / Revised: 10 October 2024 / Accepted: 14 October 2024 / Published: 15 October 2024
(This article belongs to the Section D2: Electrochem: Batteries, Fuel Cells, Capacitors)

Abstract

:
The inhomogeneity between cells is the main cause of failure and thermal runaway in Lithium-ion battery packs. Electrochemical Impedance Spectroscopy (EIS) is a non-destructive testing technique that can map the complex reaction processes inside the battery. It can detect and characterise battery anomalies and inconsistencies. This study proposes a method for detecting impedance inconsistencies in Lithium-ion batteries. The method involves conducting a battery EIS test and Distribution of Relaxation Times (DRT) analysis to extract characteristic frequency points in the full frequency band. These points are less affected by the State of Charge (SOC) and have a strong correlation with temperature, charge/discharge rate, and cycles. An anomaly detection characteristic impedance frequency of 136.2644 Hz was determined for a cell in a Lithium-ion battery pack. Single-frequency point impedance acquisition solves the problem of lengthy measurements and identification of anomalies throughout the frequency band. The experiment demonstrates a significant reduction in impedance measurement time, from 1.05 h to just 54 s. The LOF was used to identify anomalies in the EIS data at this characteristic frequency. The detection results were consistent with the actual conditions of the battery pack in the laboratory, which verifies the feasibility of this detection method. The LOF algorithm was chosen due to its superior performance in terms of FAR (False Alarm Rate), MAR (Missing Alarm Rate), and its fast anomaly identification time of only 0.1518 ms. The method does not involve complex mathematical models or parameter identification. This helps to achieve efficient anomaly identification and timely warning of single cells in the battery pack.

1. Introduction

Energy storage is a crucial technology and an enabling device for the development of new energy systems. Lithium-ion batteries hold a significant position in the new energy storage technology [1]. Due to safety and manufacturing process considerations, the capacity and energy density of a single Lithium-ion battery is limited. Therefore, various application scenarios typically use a single Lithium-ion battery in different series or parallel relationships to form a battery pack [2]. The inconsistency between a single Lithium-ion battery in a battery pack may be due to differences in battery performance and fabrication parameters [3]. Simultaneously, as Lithium-ion battery application scenarios continue to expand, various complex working conditions can affect the capacity, self-discharge rate, internal resistance, open-circuit voltage, and other internal parameters of a single Lithium-ion battery. This exacerbates the inconsistency of the battery pack, shortening the cycle life of Lithium-ion batteries, accelerating their aging, and in severe cases, leading to thermal runaway [4,5]. Furthermore, during the operation of a Lithium-ion battery pack, there is a phenomenon known as the ‘barrel short board effect’. This means that the maximum capacity of the entire battery pack is determined by the minimum capacity of a single unit in the pack. This can have a negative impact on the efficiency of the other single unit Lithium-ion batteries and even compromise the lifespan of the smallest capacity unit [6]. In extreme cases, it may even pose a safety risk. Based on the above considerations, it is necessary to identify any inconsistencies in Lithium-ion battery packs after they are put into use and provide timely warnings.
The warning methods for battery pack inhomogeneities are typically divided into three categories: model-based, signal processing-based, and machine learning-based. The model-based approach is to build a model of the battery mechanism to describe the dynamic response and use the variation of selected parameters in the model to determine the inconsistency of the battery pack, but the method is susceptible to the interference of noise in the signal and is too reliant on the accuracy of the battery model, which results in the lack of practicality of the method [7,8]. The signal processing-based method analyses the waveform and amplitude of the collected signal, observes and summarises its changes in the Lithium-ion battery work and aging process, showing according to a large number of studies that the parameters of a Lithium-ion battery in the aging process is mainly from the normal distribution to the Weibull distribution, but the method is currently usually applied to the time-domain parameter to determine the inconsistency of the battery [9]. Machine learning-based methods often use neural networks, fuzzy control, and random forests to judge the inconsistency of a battery, but the selection of quantitative characteristics of the training data greatly affects the effectiveness of these methods [10]. Based on the existing results, most of the research has focused on detecting inconsistency faults in battery packs by measuring parameters such as the capacity, open-circuit voltage, and internal resistance of cells. The literature [11] used the voltage isolation point, voltage range, and voltage difference as characteristic variables to identify inconsistencies in battery packs online. The literature [12] proposes a method for detecting changes in the remaining capacity of a cell within a battery pack to provide consistent fault warnings. Meanwhile, other literature [13] suggests a method for inconsistent fault warnings based on the looseness within the battery pack and the change in the internal resistance of a cell. However, detecting and differentiating the battery’s internal changes based on external parameters alone is difficult due to the complex and strongly nonlinear electrochemical system. Therefore, a research technique is needed to achieve rapid detection and evaluation of a single battery [14].
EIS is a classical electrochemical research method that provides more kinetic information and electrode interface structure information than other conventional electrochemical methods. It enables the simultaneous characterisation of different physicochemical processes [15]. The literature [16] proposed using 500 Hz impedance as the eigenvalue to monitor battery monoblock overcharging. Other literature [17] extended this method to detect faults in battery packs using single-point impedance. However, existing studies commonly use the equivalent circuit method to resolve the EIS. This method presents the joint action of the internal and external parameters of the battery in a limited bandwidth, causing characteristic peaks to overlap or characteristic time constants to be indistinguishable [18]. The diagnostic analysis of the EIS can lead to ambiguity and uncertainty in the results. However, the DRT can separate out the time constants corresponding to each electrochemical sub-process, allowing for the analysis of impedance spectra under non-model-assisted power. Furthermore, performing full-band EIS tests is a time-consuming and inefficient method for detecting inhomogeneity in battery packs at an early stage. Therefore, the identification of anomalous monomers in the battery pack has become an urgent problem to be solved. The DRT method can be used to solve the spectrum and extract the characteristic frequency points from the full-band EIS data.
This paper proposes a method for detecting impedance inhomogeneity in Lithium-ion battery packs based on LOF. The proposed method aims to solve the aforementioned problems. Firstly, the same batch of Lithium-ion ternary batteries without capacity, internal resistance, voltage difference, and external damage from the factory were subjected to EIS tests under different SOCs, temperatures, charge/discharge rates, and cycles so as to obtain the impedance dataset of the experimental battery under different application conditions. Secondly, the EIS test data was analysed using DRT analysis to obtain the characteristics of different Lithium-ion reactions inside the battery. The impedance decomposition spectrum of a Lithium-ion battery under different SOCs, temperatures, charge/discharge rates, and cycles can be used to determine the electrochemical impedance eigenfrequency for the entire frequency band. Finally, 19 normal battery and one abnormal battery aged by accelerated cycling at −15 °C were grouped together. They were then subjected to cyclic charge/discharge experiments. The EIS test data of a single battery at this characteristic frequency were analysed using the LOF outlier detection algorithm to detect any abnormal monomers in the battery pack. In addition, this study also compared it with existing commonly used outlier detection algorithms to verify the feasibility and efficiency of the method.

2. Methodology

This research contains three main research parts: EIS test in laboratory, analysis of experimental results and feature frequency selection, and validation analysis of Lithium-ion battery group anomaly detection based on LOF algorithm under feature frequency. The main points of the above research contents and the logical relationship between them are shown in Figure 1 and will be discussed in detail in the following sections.

2.1. Battery Specification and Consistency Check

This experiment uses cylindrical FCB 21700 H 4R2 C2500 Lithium-ion battery (developed by Hesheng Alternative Energy technology Co., Ltd., Ningbo, China) as the experimental object since ternary Lithium-ion batteries have better consistency compared to Lithium-ion iron phosphate battery [19]. The specific parameters are shown in Table 1.
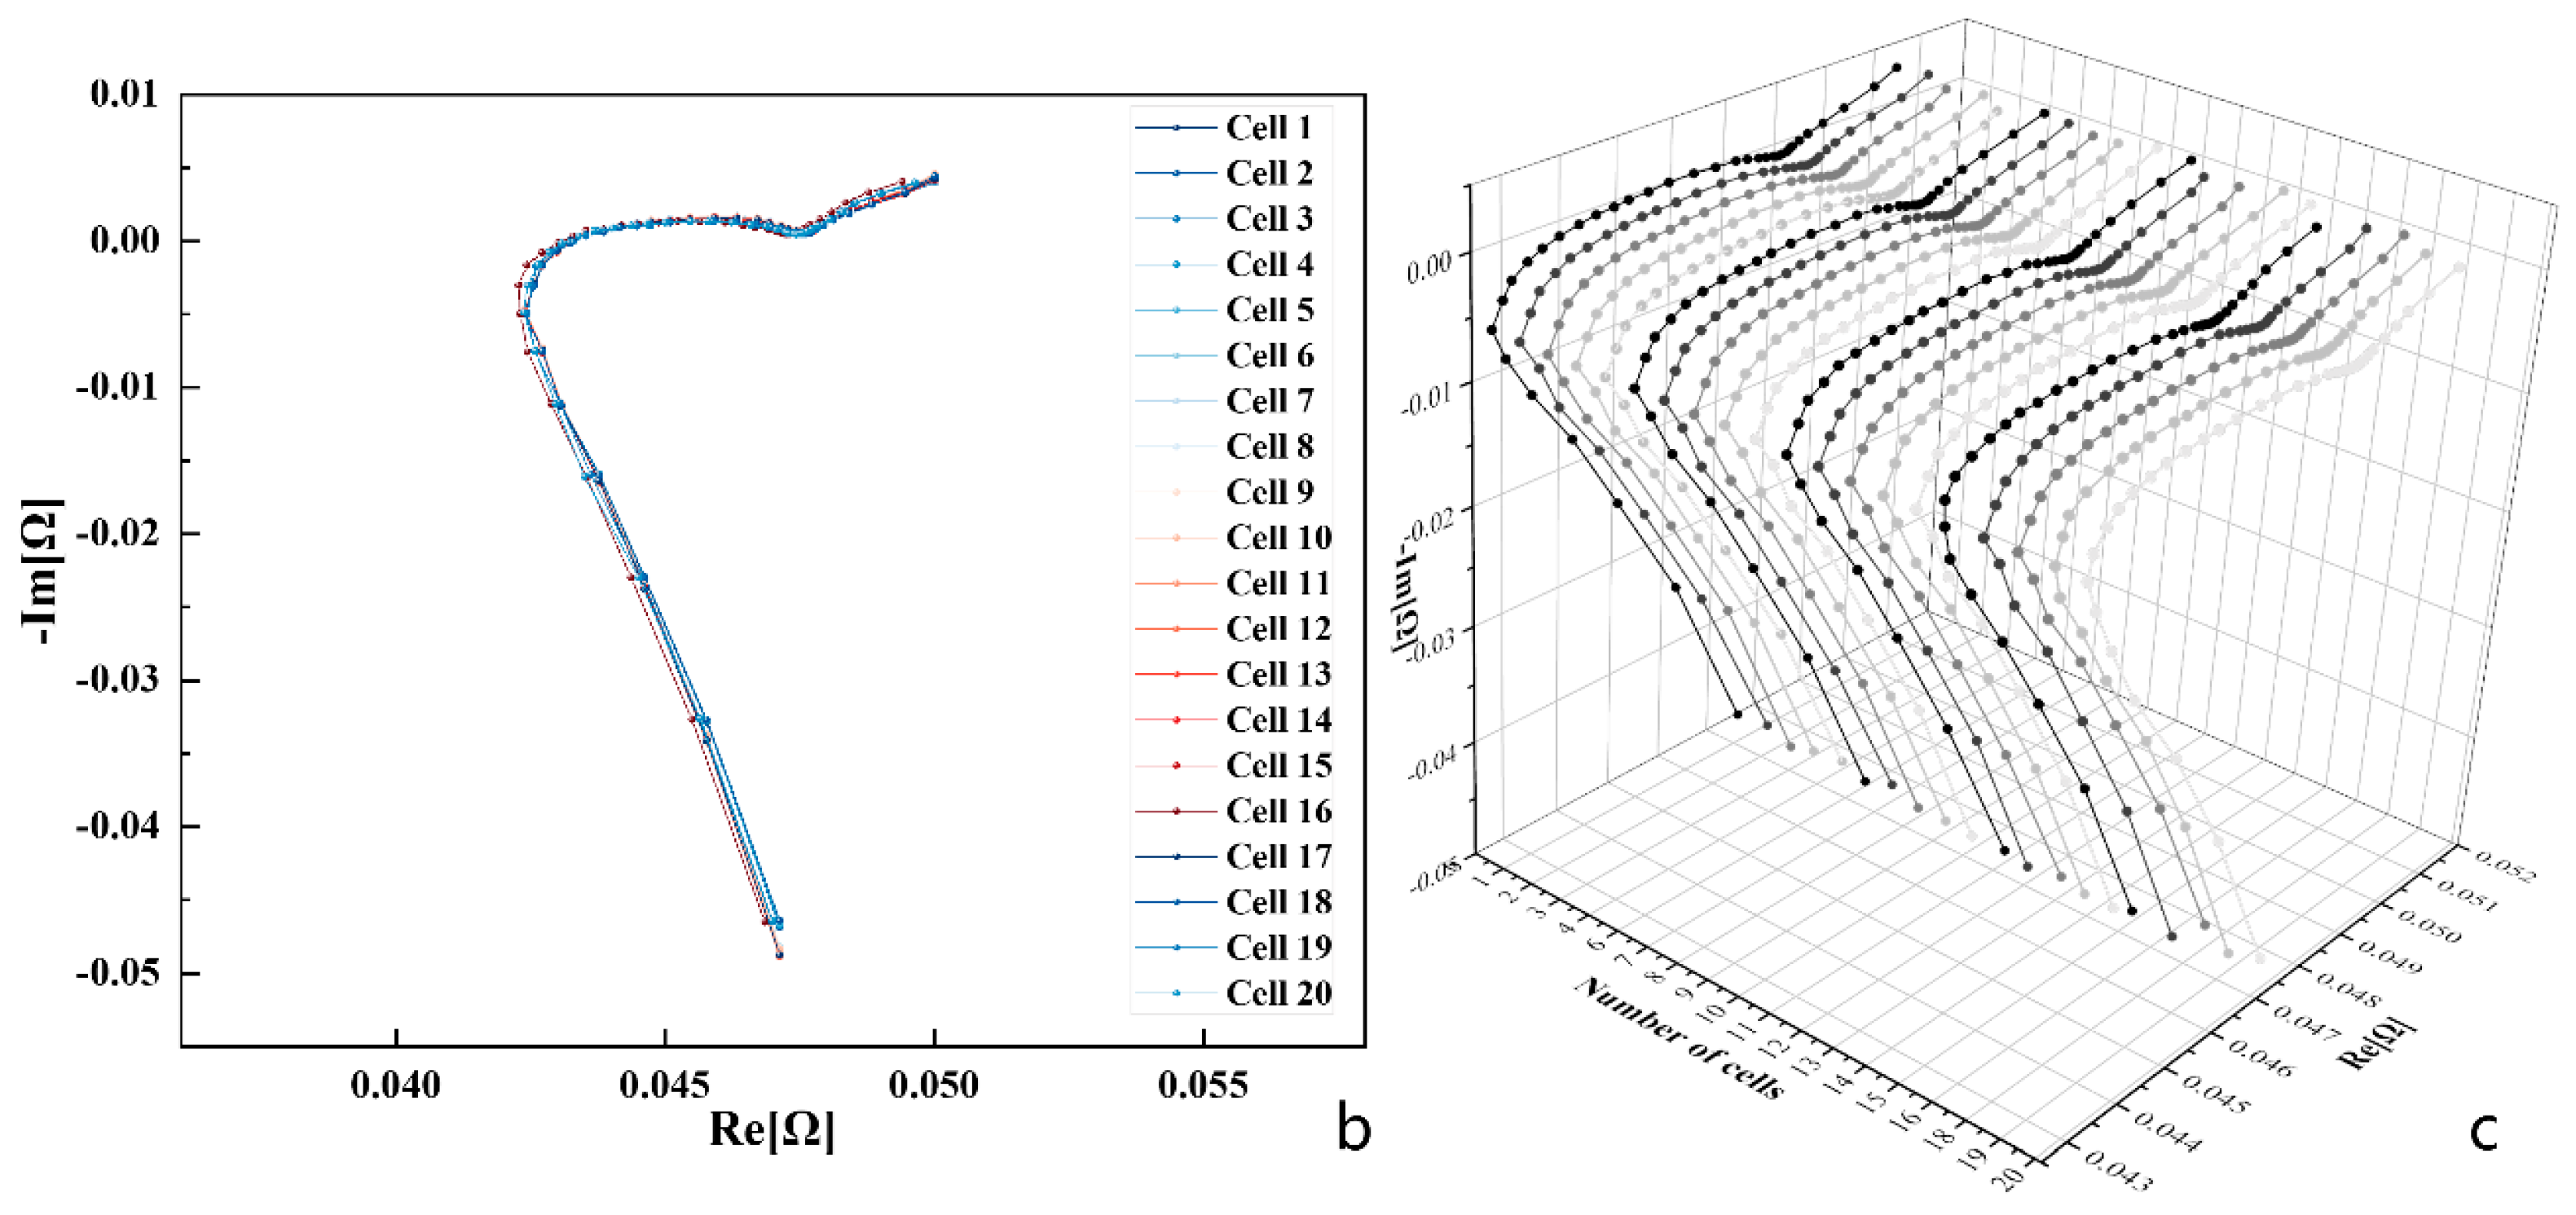
To ensure consistency among test samples and obtain accurate experimental results, it is necessary to conduct pre-processing experiments prior to EIS test. This involves comparing sample battery capacity and open-circuit voltage error. Simultaneously, the pre-treatment experiment also triggers the Lithium-ion battery to completely discharge the electrode’s active material. This chapter describes the standard charge/discharge tests performed on 20 sample cells in a room temperature (25 °C) environment. Firstly, place the battery in a thermostat at 25 °C for three hours to ensure that the temperature inside and outside the battery is equal. The Arbin single battery test system was used to charge the battery at a constant current with a 1 C charge rate until it reached a cut-off voltage of 4.2 V. The system then switched to constant voltage charging until the charging current was less than 1/20 C, indicating that the battery was fully charged. Finally, the battery was discharged to a cut-off voltage of 2.5 V at a discharge rate of 1 C. The discharged charge and open-circuit voltage were then recorded. The process was repeated three times, and the average value of the discharged charge and open-circuit voltage were taken as the actual parameter of the battery. The capacity and open-circuit voltage of 20 cells were measured, as shown in Figure 2a It shows that the capacity error of 20 cells is 1.5%, the open-circuit voltage error is 0.9%, and the Nyquist curves in Figure 2b,c are similar. Therefore, the error caused by cells’ differences can be disregarded.

2.2. EIS Testing under Different Conditions

The use of a sinusoidal signal as an excitation source enables precise AC impedance measurements and facilitates the attainment of a signal-to-noise ratio for a given frequency response. In this study, the EIS test primarily involves applying small-amplitude sinusoidal current (potential) excitation signals of varying frequencies to the Lithium-ion battery. The battery generates sinusoidal voltage response signals of corresponding frequencies, which can be calculated to obtain the impedance spectrum of the electrochemical internal impedance as a function of frequency [20]. The test offers high accuracy, wide bandwidth, and non-destructive detection, making it effective for characterising the physical and chemical reaction processes inside the battery.
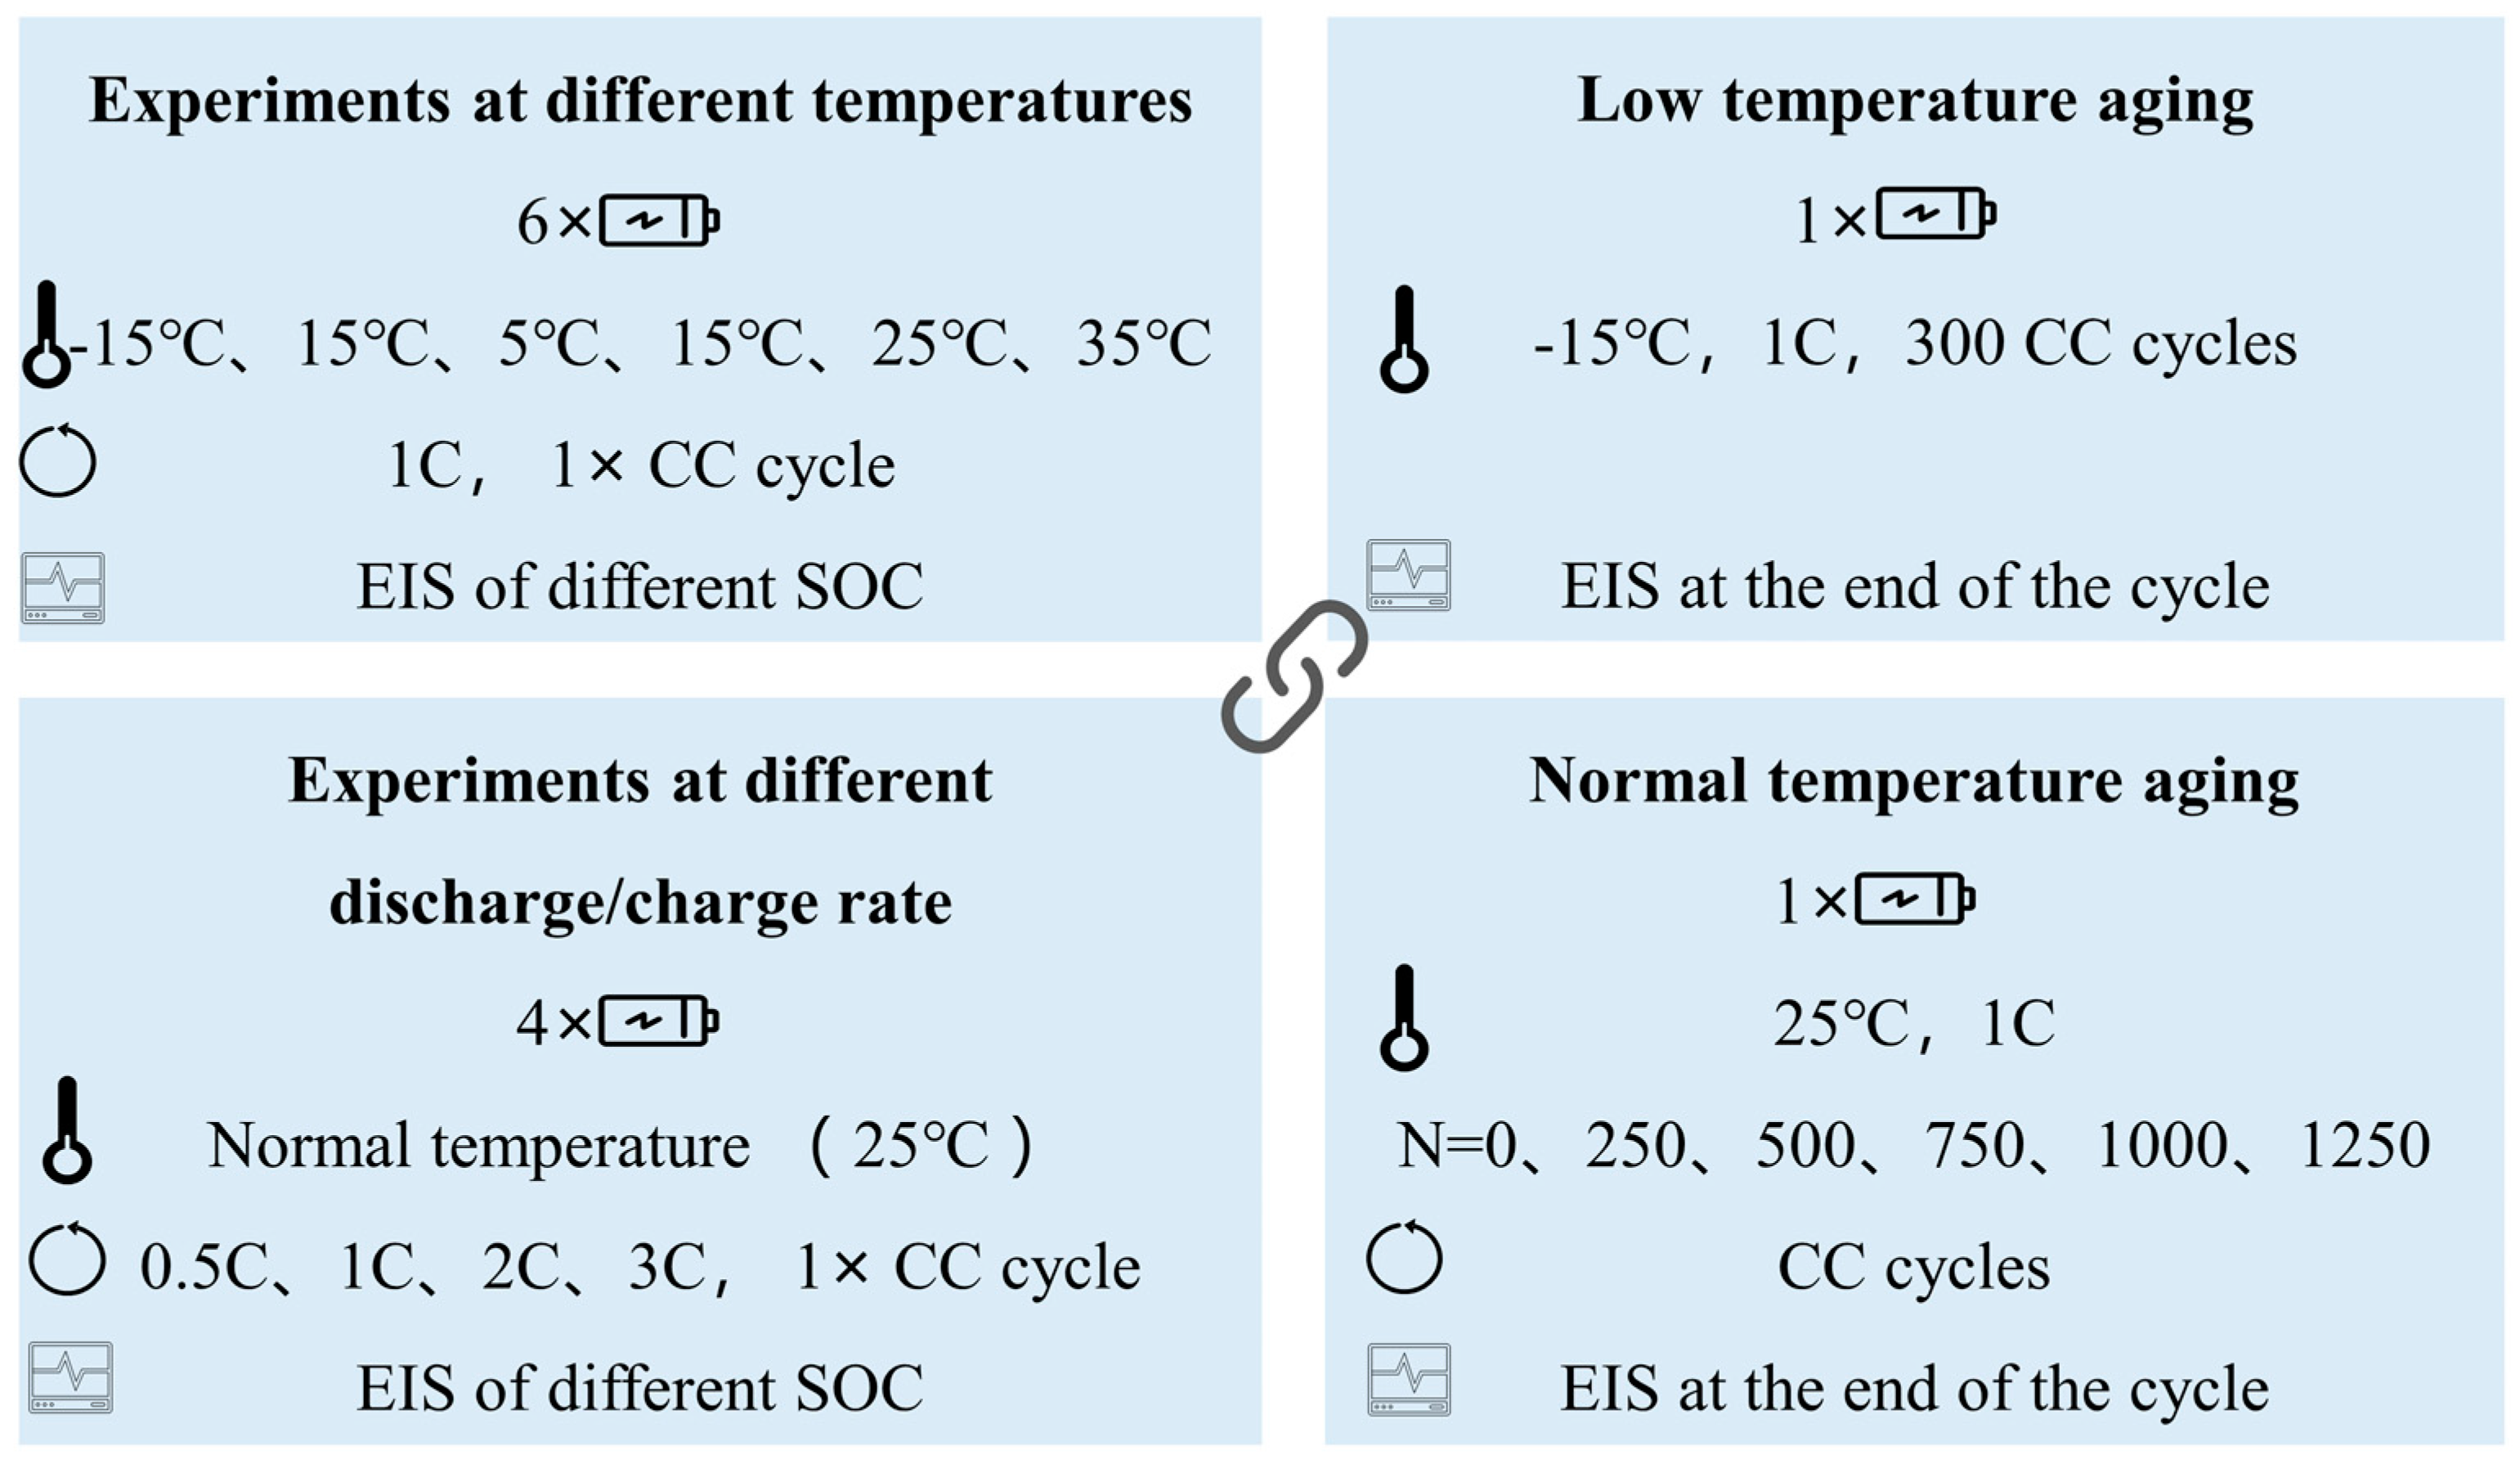
Figure 1 shows the EIS test platform used in this paper, which includes an electrochemical workstation, a Galaxy SDJ405F thermostat, a data logging device, and a Lithium-ion battery as described in Section 2.1. The EIS test instrument selected was the BioLogic electrochemical workstation. The test excitation frequency range was set to 0.02~20 kHz, and the excitation voltage amplitude was 10 M. The battery’ impedance spectra were tested under constant temperature conditions and charge/discharge rate. The battery’ impedance spectra were tested at various states of charge (SOCs) and under different conditions. Figure 3 shows the specific data acquisition scheme for each battery. Take the EIS test under different temperature conditions as an example: a charge and discharge experiment at a 1 C rate was conducted using 6 cells across 6 different temperatures. The electrochemical workstation measured the EIS data of the cells at different SOCs. The method of operation is only illustrated when the temperature is at 25 °C: the battery should be charged to 100% state of charge (with a cut-off voltage of 4.2 V and a cut-off current of 1/20 C) at a constant temperature of 25 °C using a constant current. After charging, allow the battery to stand for at least three hours. Subsequently, the battery’s state of charge (SOC) was adjusted to 90% using a 1 C discharge rate and left to stand for three hours. Impedance measurements were then taken on the battery using the BioLogic electrochemical workstation, following the same method outlined in Section 2.1. By conducting the impedance measurement process at 10% SOC intervals, a total of 10 impedance spectral measurements can be obtained for the battery, ranging from 100% SOC to 10% SOC, at a constant temperature of 25 °C.

2.3. Principles of the Electrochemical Impedance Spectroscopy Relaxation Time Distribution Method

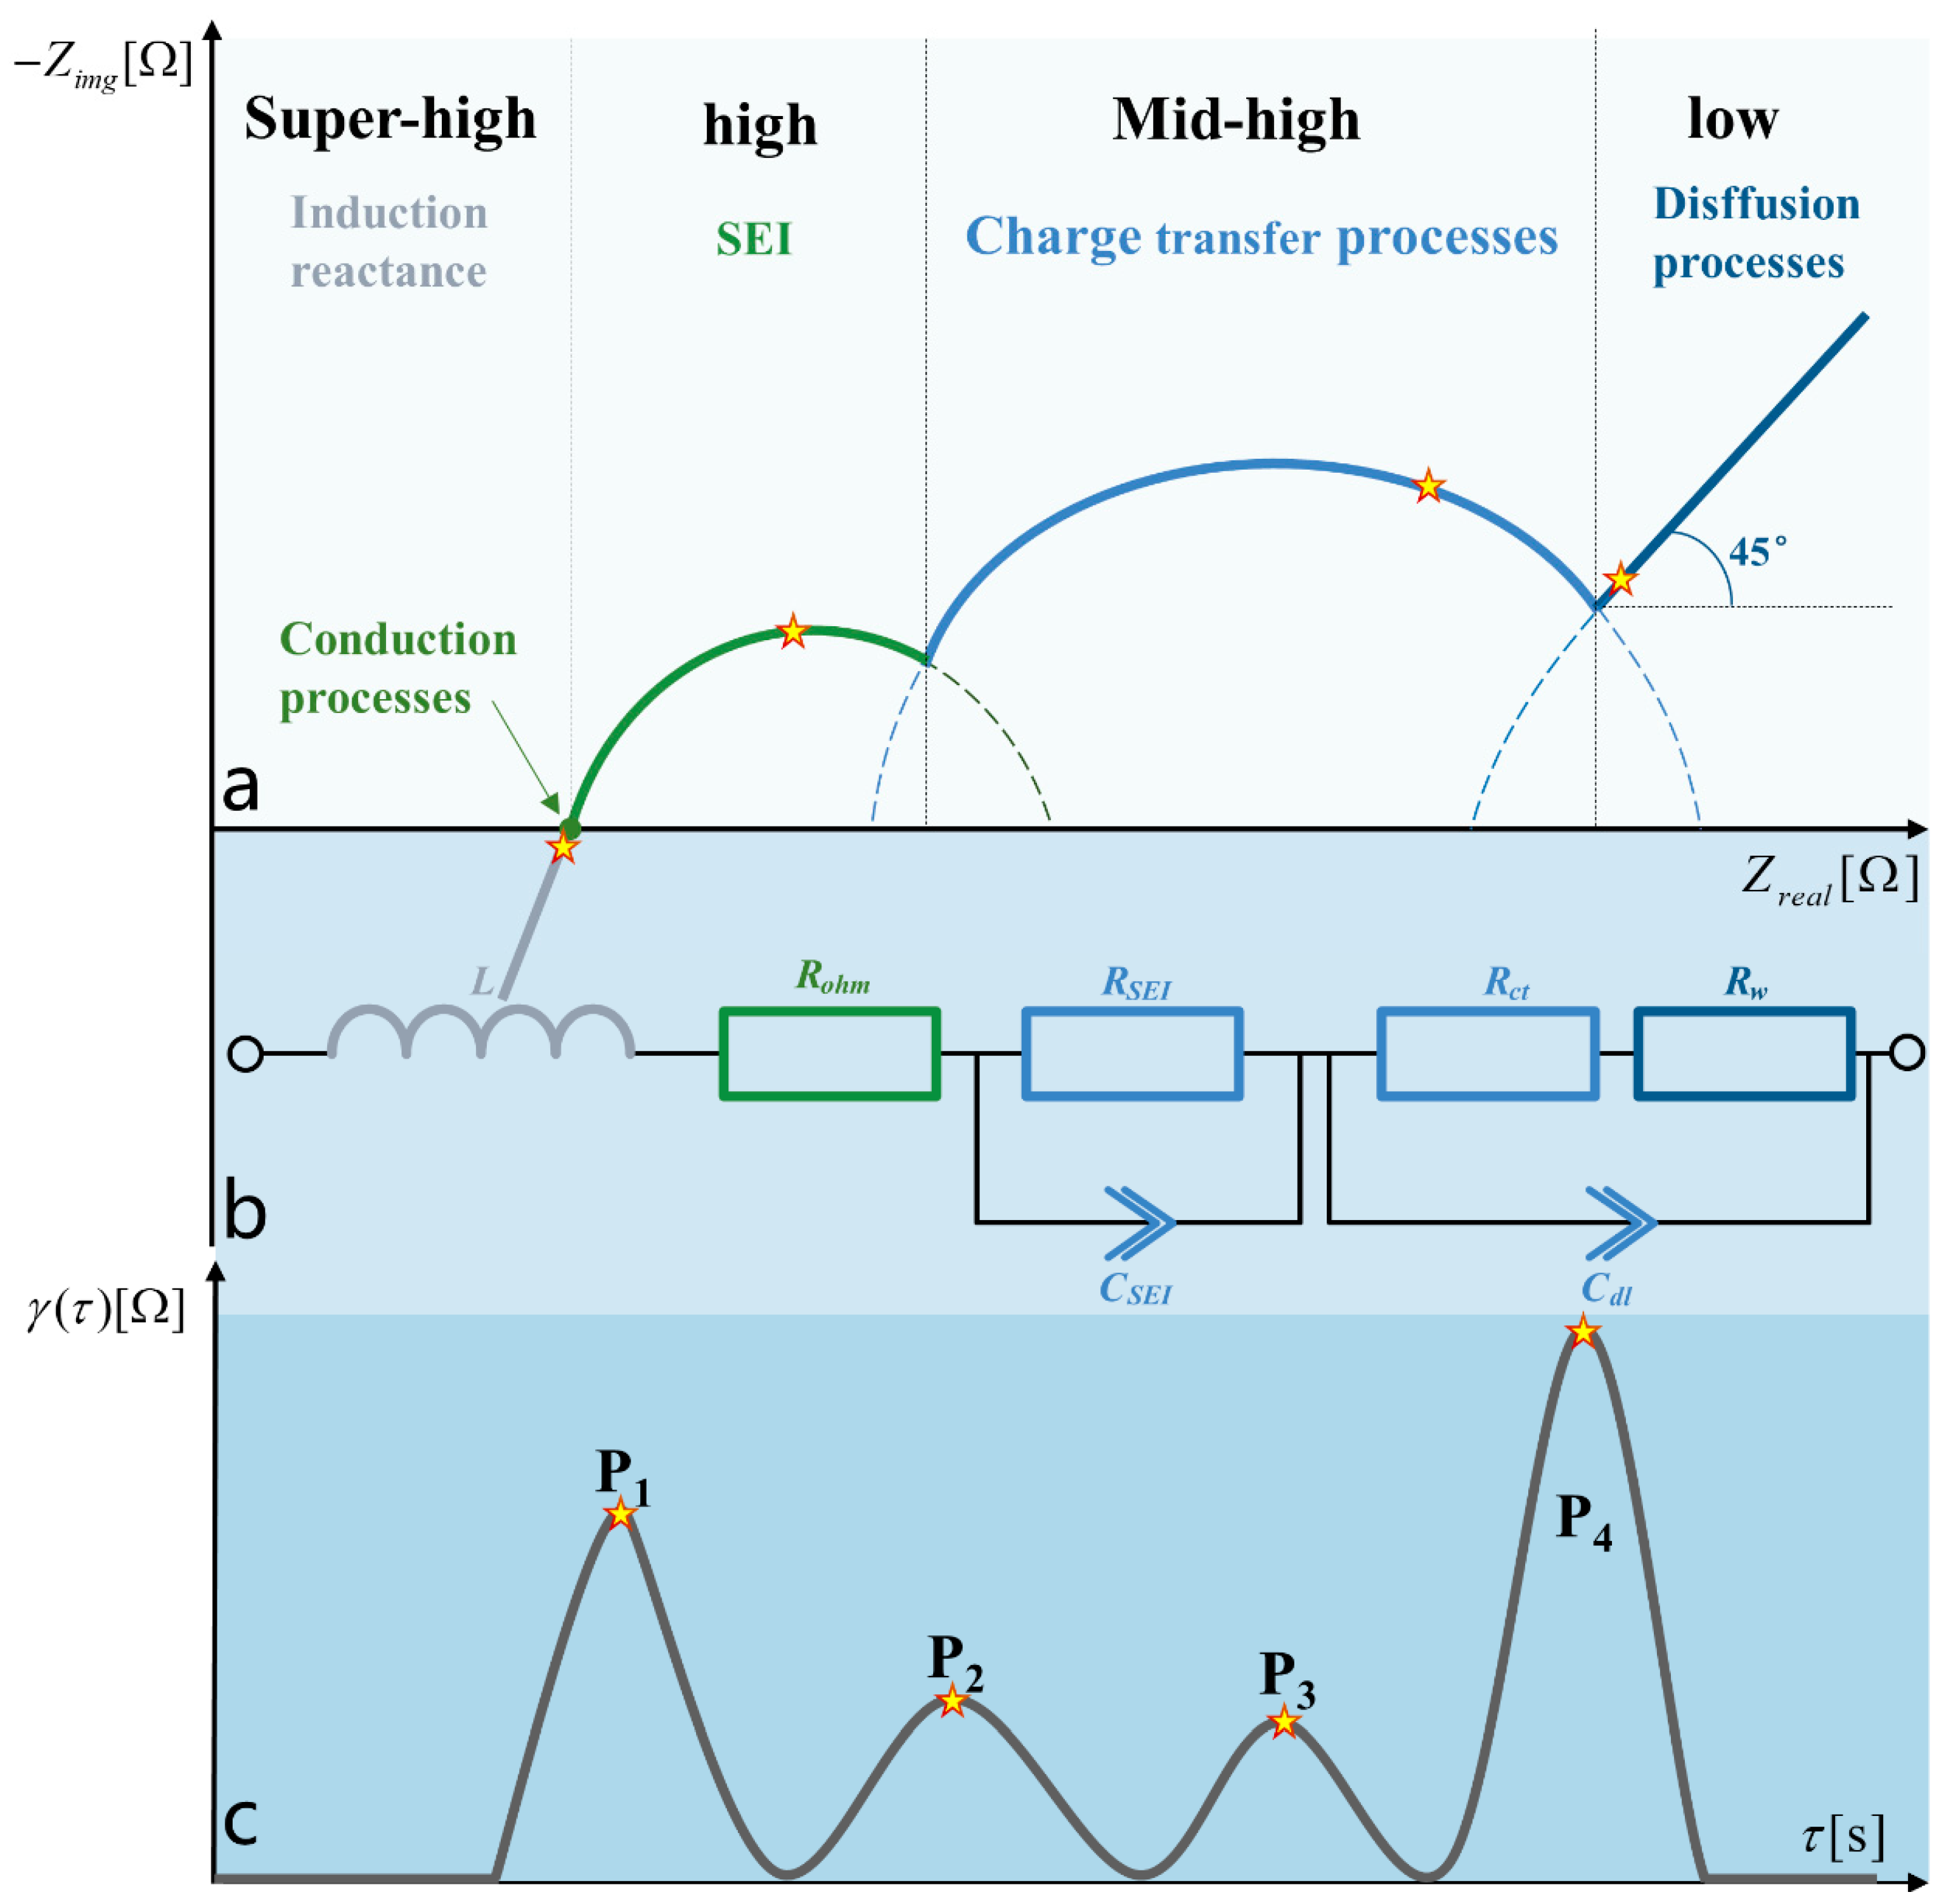
In addition to the benefits outlined in Section 2.2, EIS is sensitive to both internal and external parameters of the battery. These parameters may include temperature, pressure, load, material intrinsic properties, and interfacial characteristics [21]. EIS provides a valuable foundation for the efficient diagnosis of failure warnings in cells within a Lithium-ion battery pack. The commonly used method for EIS resolution is currently the equivalent circuit method. This method decomposes each impedance inside the battery into different RC circuits and obtains the impedance values of the corresponding components in the equivalent circuit after fitting. Figure 4a,b shows the typical Nyquist plots and their equivalent circuit diagrams as obtained from the EIS test results. To accurately study the change in EIS parameters under different conditions, the impedance spectra are usually analysed by dividing them into low-frequency, medium-frequency, and high-frequency ranges. The UHF section of the impedance curve intersects the horizontal axis, representing the ohmic impedance (Rohm) in the equivalent circuit. The first semicircle in the figure represents the high-frequency part, which mainly reflects the impedance RSEI of Lithium-ions passing through the electrolyte. The IF portion is the second semicircle and represents the charge transfer impedance Rct. The low-frequency portion of the graph is represented by a 45° straight line, which indicates the diffusion impedance Rw of the Lithium-ion [22].
Electrochemical processes in a cell have distinct time constants. The combined effect of internal and external parameters of the cell is presented in a finite bandwidth. This is represented as semicircular arcs with varying radii in the Nyquist plot [23]. If the time constants of two semicircular arcs are similar, they will overlap in the Nyquist plot, making them hard to differentiate. Furthermore, the internal structure of the battery undergoes changes with use. The relaxation times corresponding to different electrochemical processes also change, causing severe overlap of multiple semicircular arcs in the Nyquist diagram. This overlap makes it difficult to effectively differentiate between the various electrochemical reaction processes inside the battery, leading to inaccurate analysis results of the EIS test [24]. The method for relaxation time distribution, as shown in Figure 4c, separates the time constants and frequency ranges that correspond to each electrochemical sub-process. This allows for an accurate resolution of the impedance spectra under non-modelled boosting. The relaxation time is the time required for an electrochemical system to transition from a transient state to a steady state. It corresponds to the characteristic time constant of the electrochemical process. The method described in this paper focuses on using the inverse convolution operation of the broadband impedance spectrum to obtain the distribution of characteristic time constants of the electrochemical system [25]. The DRT curve’s number of peaks, corresponding distribution of characteristic time constants, and coverage areas indicate the number of polarisation processes, relaxation time constants, and magnitude of the polarisation resistance within the cell. Next, we will discuss specific mathematical relationships.
According to the DRT analysis method, the battery is seen as a series of ohmic internal resistances and an infinite number of polarisation impedances. The impedance expression can be written as [26]:
Z ω = Ro + Zp ω = Ro + Rp 0 g τ 1 + j ω τ d τ
where Z ( ω ) represents the total impedance of the Lithium-ion battery, Z p ( ω ) represents the total polarisation impedance of the Lithium-ion battery, Ro represents the ohmic internal resistance of the Lithium-ion battery, Rp represents the polarisation resistance of the Lithium-ion battery, g(τ) represents the distribution function of the relaxation time, τ represents the relaxation time, j represents the complex unit, and ω represents the angular frequency.
Eventually, the distribution function g(τ) for the relaxation time satisfies:
0 g τ d τ = 1
Once the time constant τ has been obtained, the corresponding frequency f can be calculated:
f = 1 2 π τ
Current research commonly uses methods such as regularisation, Monte Carlo, and Fourier transform to solve DRT. Among these, the Tikhonov regularisation method is simple and allows for easy parameter adjustment. In this study, we compute the DRT results for EIS by means of Tikhonov regularisation based on continuous function discretisation in the publicly available DRTtools of Ciuccislab. The Lithium-ion battery Nyquist curves, DRT curves, and equivalent circuit correspondences in different frequency ranges are clearly shown in Figure 4. According to the literature [27], the DRT curve can typically be divided into four sections of polarisation peaks, namely P1–P4, as shown in the figure. The number of polarisation peaks varies depending on the type of cells. Figure 4c illustrates the impedance associated with the electrical contact between the active material of the reaction cell and the collector for the P1 peak. The P2 peak responds to the corresponding impedance RSEI as Lithium-ions pass through the SEI membrane. The P3 peak responds to Lithium-ion charge transfer impedance at the electrode/electrolyte interface Rct. The P4 peak responds to Lithium-ion diffusion impedance in active material and electrolyte Rw. The four Lithium-ion peaks correspond to their individual Lithium-ion processes.
This paper describes the frequency range of each band based on the battery characteristics [28] and the EIS test excitation frequency range (0.02–20 kHz): high frequency (2000 Hz–20 kHz), high frequency (200–2000 Hz), medium frequency (20–200 Hz), low-middle frequency (2–20 Hz), low frequency (0.2–2 Hz), and ultra-low frequency (0.02–0.2 Hz). The above information is provided to assist in the upcoming discussion on the characteristics of EIS in various frequency ranges.

3. Analysis of Experimental Results and Extraction of Eigenfrequencies

3.1. Results of EIS Tests

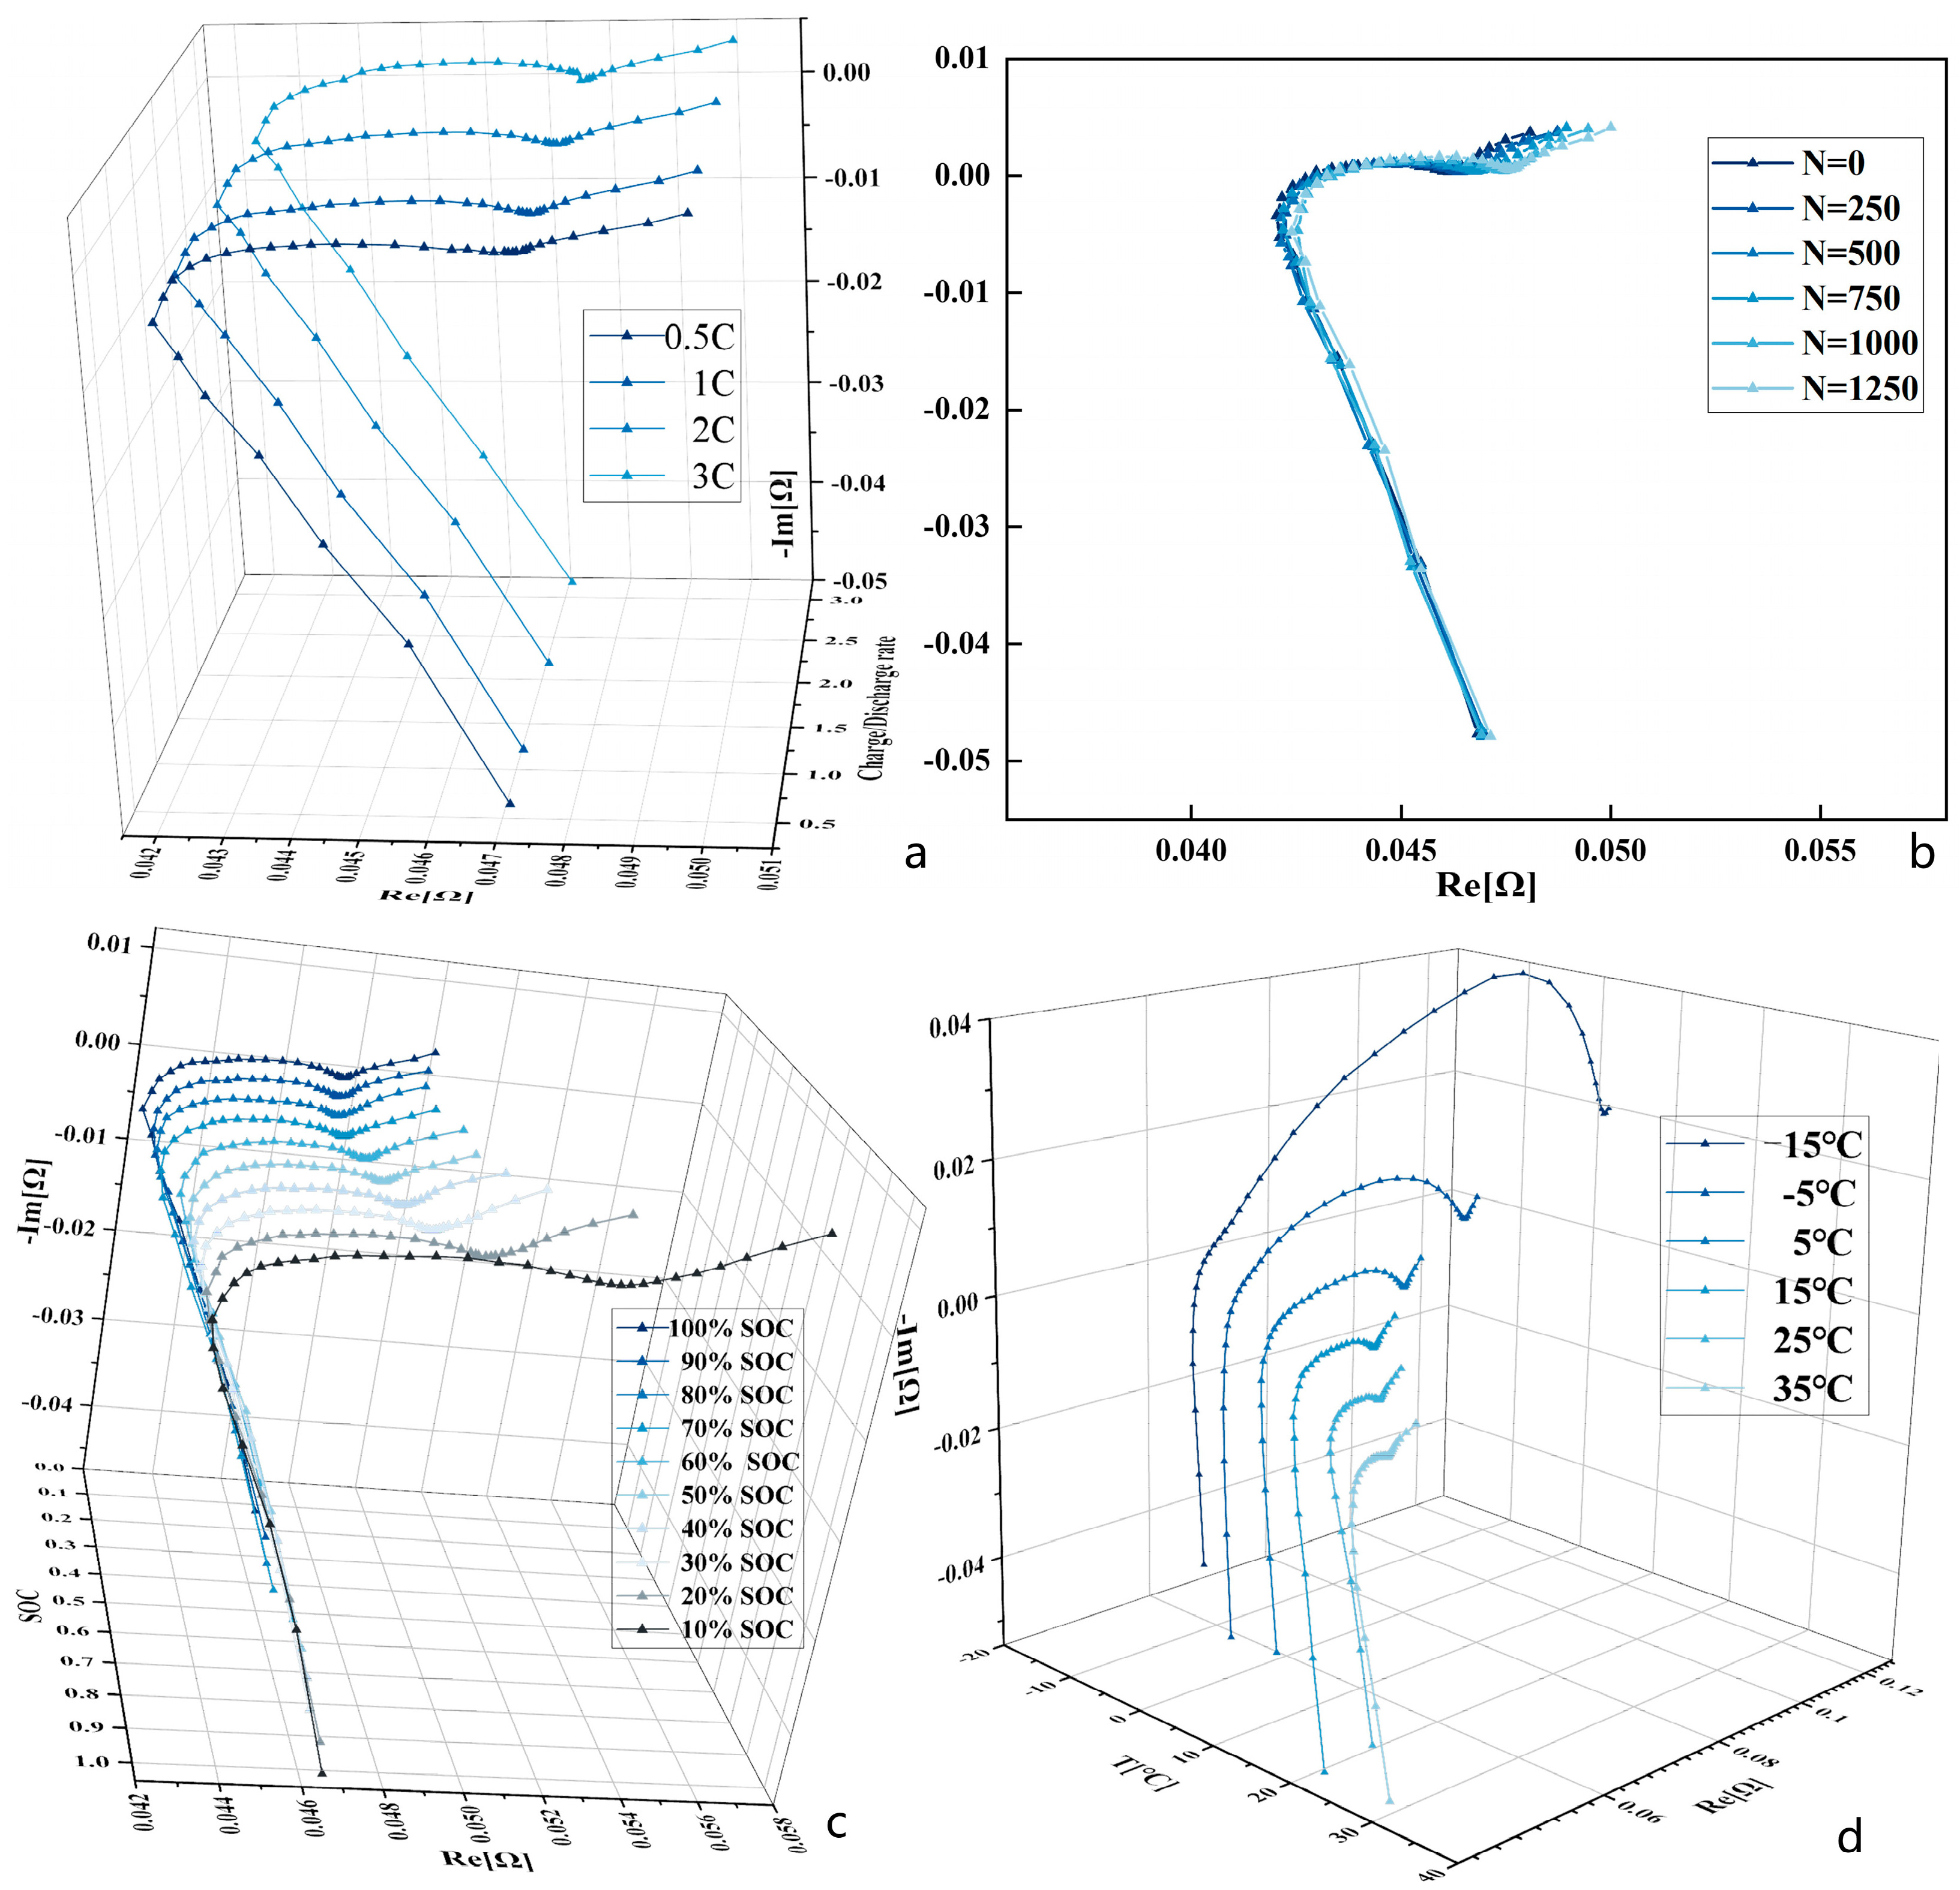
The electrochemical reaction process inside the Lithium-ion battery is significantly affected by different ambient temperatures, SOC charge/discharge rates, and cycles. To demonstrate the influence of different charge/discharge conditions on the impedance response of a Lithium-ion battery, the respective Nyquist curves at a 50% SOC state are compared in Figure 5a,b,d. Additionally, Figure 5c shows the Nyquist curves for different SOC states under room temperature conditions (25 °C).
Figure 5a shows the Nyquist curves of a Lithium-ion battery for four charge/discharge rates (0.5 C, 1 C, 2 C, 3 C). The impedance spectrum shows no significant change in the low and high frequency bands. However, the arcs in the middle and high frequency bands increase significantly with the increase of the charge/discharge rate. The reason for this is that an increase in the charge/discharge rate boosts the parareduction reaction between the electrode particles and electrolyte dissolution [29]. This leads to an increase in cell impedance by promoting SEI film growth.
Figure 5b compares the Nyquist curves for new cells and cells cycled at different cycles (N = 250, 500, 750, 1000, 1250). As the cycle times increase, the curve is slightly shifted to the right along the real axis (Z’-axis), and the vertical line in the high-frequency band constantly increases. This indicates a tendency to increase both the ohmic impedance and the total impedance. Simultaneously, the radii of the two semicircular arcs that represent the impedance of the SEI membrane and the total solid–liquid interface charge transfer in the middle and high frequency bands have increased significantly. The total solid–liquid interface charge transfer impedance has increased the most. This is due to the fact that the thickness of the SEI film becomes larger as the battery ages, thus reducing the diffusion rate of Lithium-ions [30,31].
Figure 5c presents Nyquist curves for various states of charge (SOCs) at ambient conditions (25 °C). The curves of the middle- and high-frequency bands overlap in different SOC states, and the intersection of the curves with the real axis has not significantly shifted. This indicates that the ohmic impedance remains unchanged [32], while the radius of the semicircular arc in the mid-frequency band increases slightly with decreasing SOC, indicating that its charge transfer impedance also increases with decreasing SOC. The hindrance of the charge transfer process in a Lithium-ion battery at low SOC states is the reason for this [33]. The low-frequency straight line slope is significantly influenced by the SOC. As the SOC increases, the length of the straight line decreases and the slope increases, indicating a slowdown.
Figure 5d compares the Nyquist curves for different temperature conditions (T = −15 °C, −5 °C, 5 °C, 15 °C, 25 °C, 35 °C) with the SOC state of 50%. The curve shifts to the left and then to the right as the temperature increases. The ohmic impedance and the diffusion impedance of the cell in the low-frequency band both decrease and then increase. The first semicircular arc’s radius in the middle and high frequency bands decreases as temperature increases. This is because the battery system’s reaction rate accelerates with temperature, and the ions’ activity in its internal reactions continues to increase, resulting in an overall impedance decrease [34]. However, at a certain temperature, a series of side reactions occur within the battery, causing an increase in impedance and irreversible aging.
In conclusion, the Nyquist curves for different SOCs overlap in the mid-frequency band, indicating that the SOC has minimal effect on the cell’s EIS in this range. Additionally, the SOC has a negligible effect on the imaginary part of the impedance in the frequency range of 20–200 Hz. The Nyquist curves exhibit significant changes in the middlefrequency band under different charge/discharge rates. These changes reflect the parareduction reaction between the electrode particles and electrolyte dissolution inside the battery, and effectively map the growth of the SEI film inside each single cell in the Lithium-ion battery pack [35]. The changes are more pronounced within the low and middle frequencies. The Nyquist curves exhibit significant changes in the middle and high frequency bands under different cycle times. This indicates that the attenuation of a Lithium-ion battery can be efficiently characterised in the EIS within this frequency band [36]. Therefore, it provides strong support for the judgement of the occurrence of different attenuation of single cells in Lithium-ion battery packs. The battery’s impedance varies significantly across different temperature ranges. Temperature has a greater impact on the charge transfer impedance in the mid-frequency band and the diffusion impedance in the low-frequency band compared to the high-frequency band. This suggests that the battery’s impedance is more closely linked to its internal temperature in the mid- and low-frequency bands [37]. This information can be used to more accurately reflect temperature changes in the cells of a battery pack. The analysis results indicate that changes in experimental conditions affect the impedance change characteristics in the middle and high frequency bands, as well as the middle and low frequency bands. The Nyquist curves in these frequency bands are mostly semi-circular arcs that overlap, making it difficult to extract characteristic frequency points with certainty. The impedance value at the characteristic frequency, as extracted in this paper, should be fully decoupled from external factors such as temperature, SOC, aging degree, charge/discharge rate, and excitation signal frequency. This is to avoid anomalous misdetection based on the impedance feature under the characteristic frequency caused by any of these factors. Therefore, the following section explores the effect of each factor on the impedance variation in conjunction with the DRT. This is done to eliminate overlap and inaccurate detection of anomalies caused by the close proximity of the corresponding eigentime constants of the lower half arcs in the low-frequency band of the Nyquist plot.

3.2. Eigenfrequency Selection under Multipolarisation Process

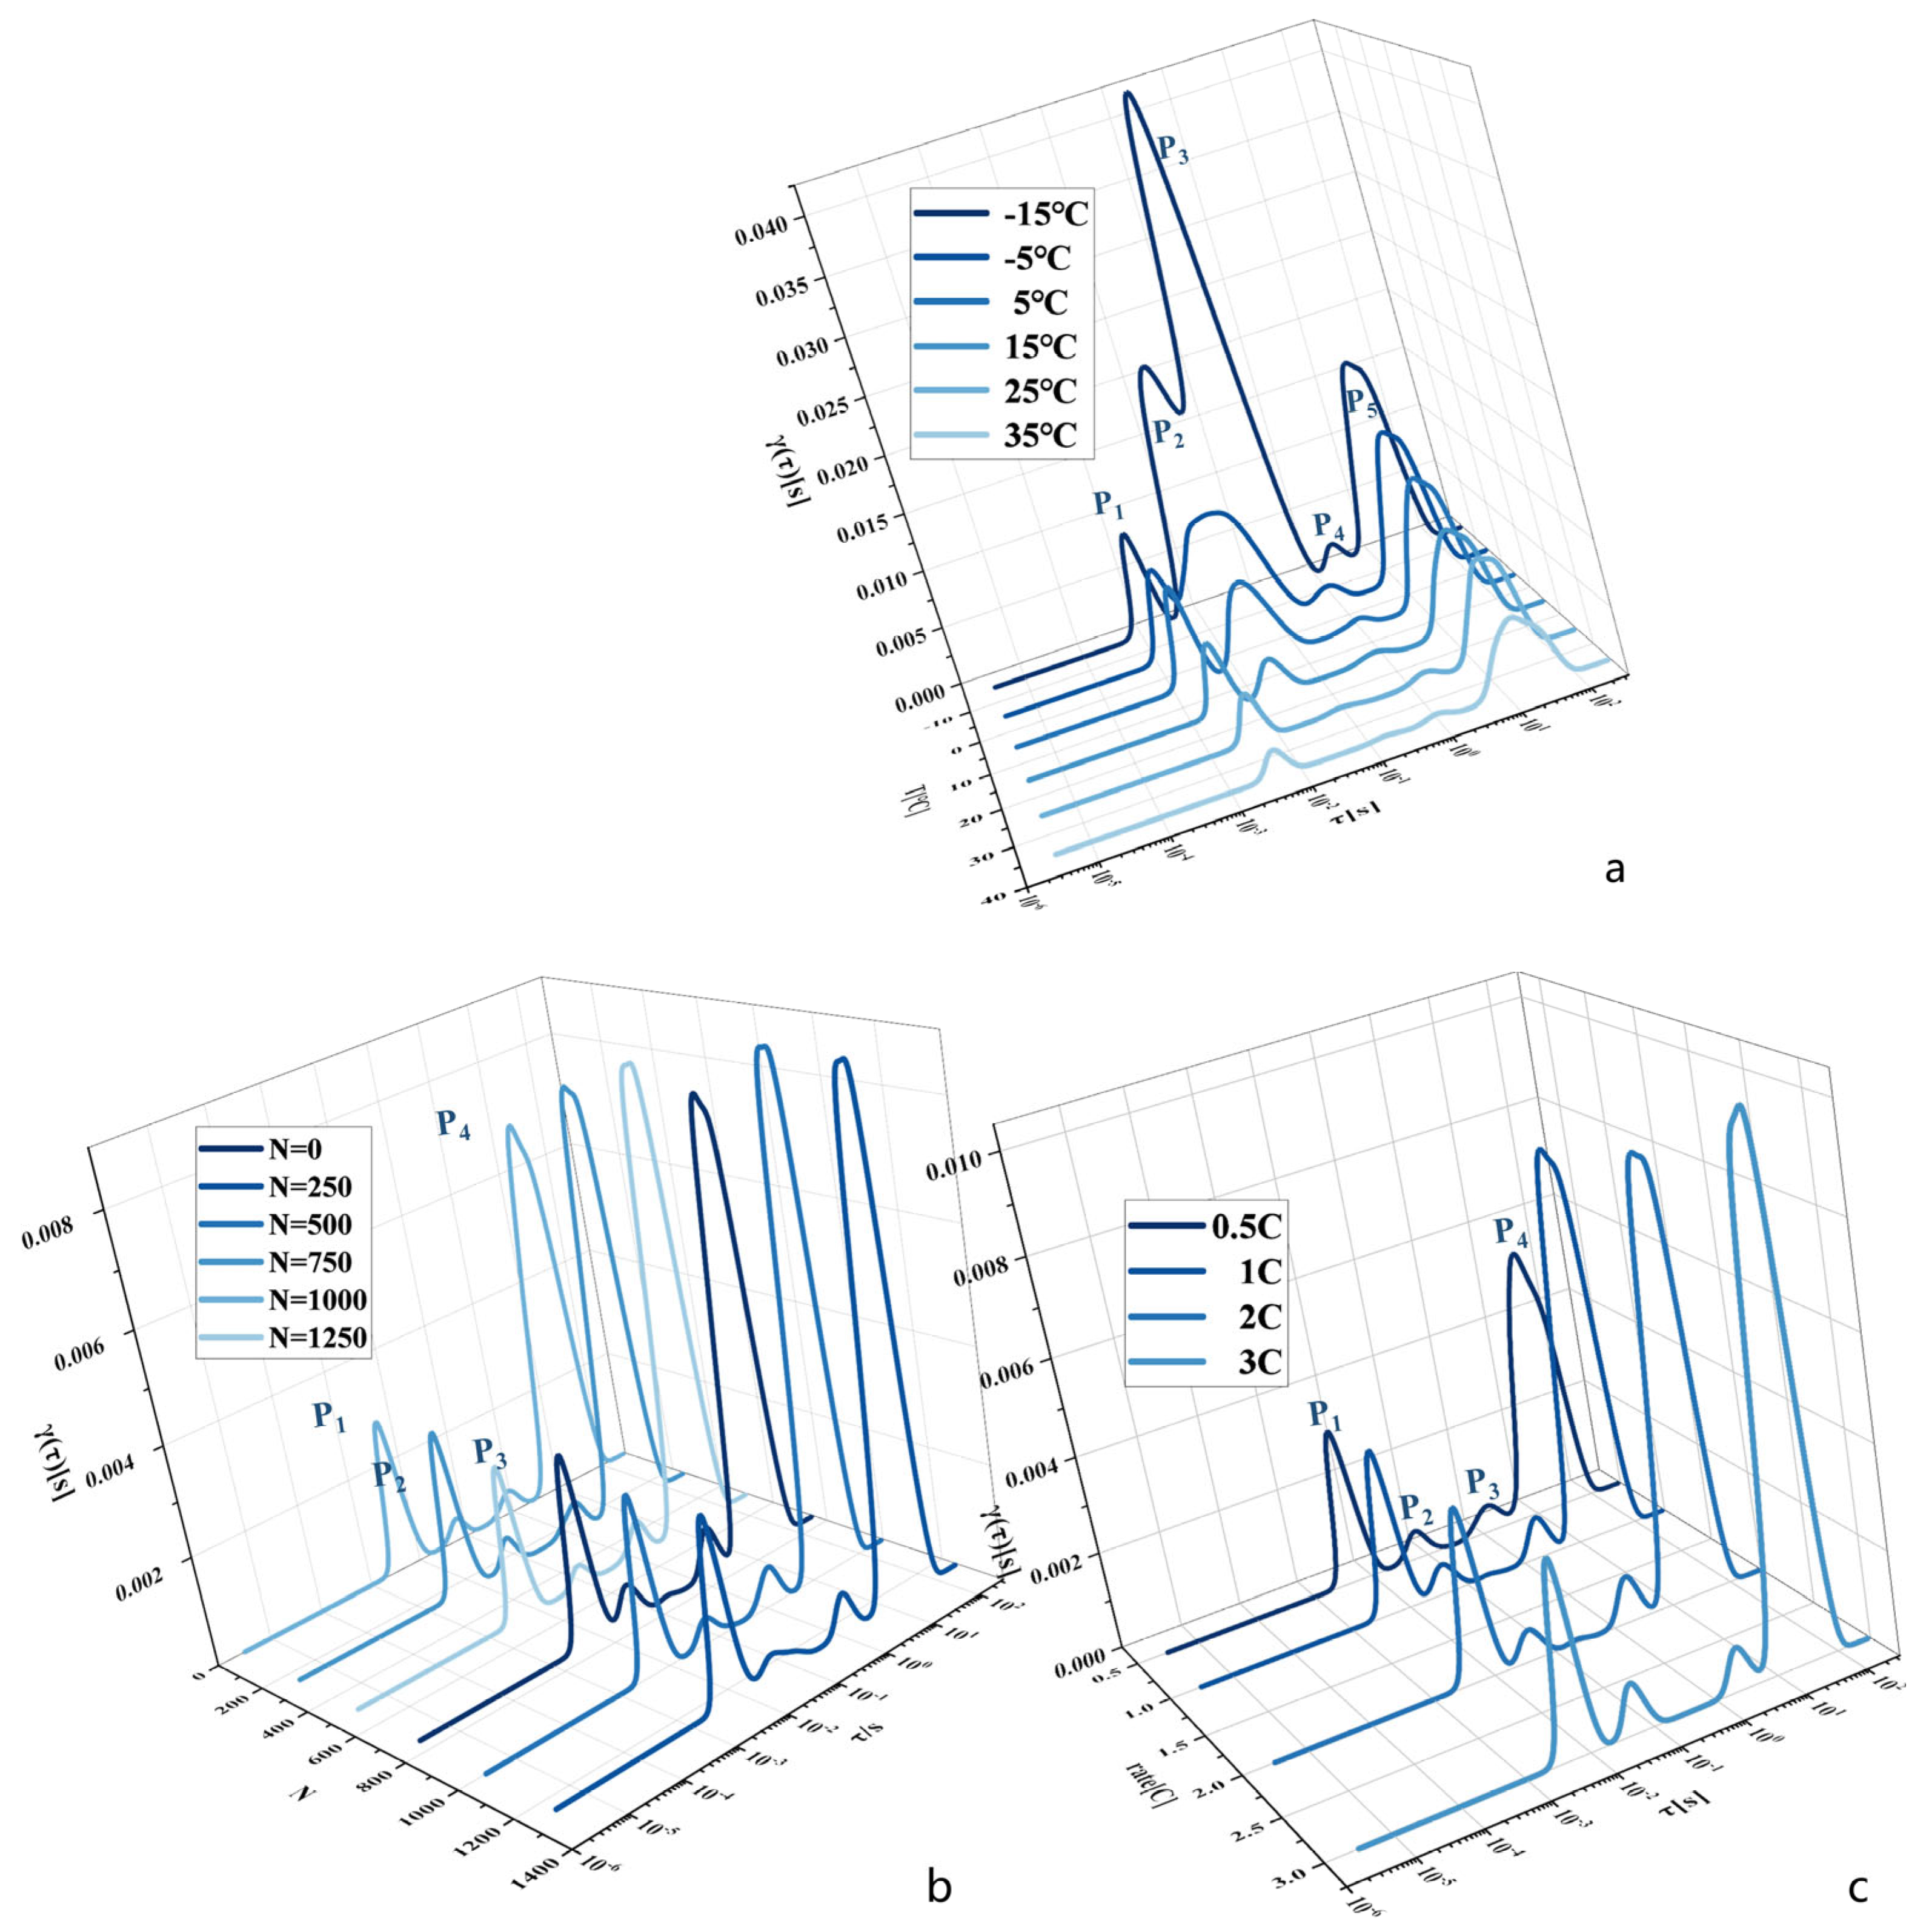
This research analyses the Nyquist curves of a Lithium-ion battery and their characteristics at varying temperatures, SOCs, cycle times, charge/discharge rates, and excitation signal frequencies. Additionally, the study finds a close relationship between the aging decay and electrochemical impedance of the battery. This section analyses the DRT curves of a Lithium-ion battery with different temperatures, SOCs, cycle times, and charge/discharge rates to overcome the difficulty in resolving the Nyquist curve due to the overlapping of the semicircular arcs of the reactive polarisation process in the Nyquist curve. The frequency ranges that are least affected by the SOC state on the EIS and are strongly correlated with the charge/discharge rate, temperature, and cycle times (which simulates the difference in the aging degree of the cells in a battery pack) are identified based on their characteristics. Section 2 describes the correspondence between the frequency response of a Lithium-ion battery and its relaxation time across the full frequency band. In this section, the polarisation peaks are labelled as P1, P2, P3, P4, and P5, according to the experimental battery’s actual relaxation time, from shortest to longest. The number of polarisation peaks corresponds to the number of time constants of the reaction inside the battery, and the strength of the reaction is reflected in the peaks.
Using the Lithium-ion battery in a 50% SOC state as an example, Figure 6 shows the DRT curves of the Lithium-ion battery at varying temperatures, cycle times, and charge/discharge rates. The solid-phase electrolyte film impedance semicircular arcs overlaid in the mid-frequency region can be clearly distinguished from the solid–liquid interface charge-transfer impedance semicircular arcs as seen by cross-referencing the DRT plots with the corresponding Nyquist plots in Section 3.1. According to the Nyquist diagram resolution theory, the second semicircular arc can only be localised to the total electrode–electrolyte interface inside the cell [38]. However, in DRT diagrams, a significant distinction can be made between the negative electrode–electrolyte interface and the positive electrode–electrolyte interface. This section employs the DRT analysis method to solve the spectra, which addresses the issue of overlapping semicircular arcs in the low and middle frequency bands. This method also verifies the accuracy of the results discussed in the previous section regarding Nyquist plots.
Figure 6a shows five Lithium-ion processes in the DRT curve at a temperature of −15 °C. At temperatures of −5 °C, 5 °C, 15 °C, 25 °C, and 35 °C, the Lithium-ion process occurs four times. The peak values of the Lithium-ion peaks in each band decrease significantly as the temperature increases. As illustrated in Figure 6b, the number of Lithium-ion peaks remains constant despite an increase in the cycling period. There are minor fluctuations in the relaxation times associated with the four Lithium-ion peaks, and the peaks of P1 and P2 exhibit an upward trend, indicating a continuous increase in the corresponding Lithium-ion resistances with cell aging [39]. Figure 6c shows four Lithium-ion processes occurring at different charge/discharge rates. The peaks of each Lithium-ion peak increase with the increasing charge/discharge rate. The relaxation times corresponding to P2 and P3 both exhibit hysteresis phenomena, indicating that the parareductive reaction between the electrode particles and the electrolyte solubilisation is strengthened. This promotes the growth of SEI membranes, leading to an increase in the cell’s impedance [40].
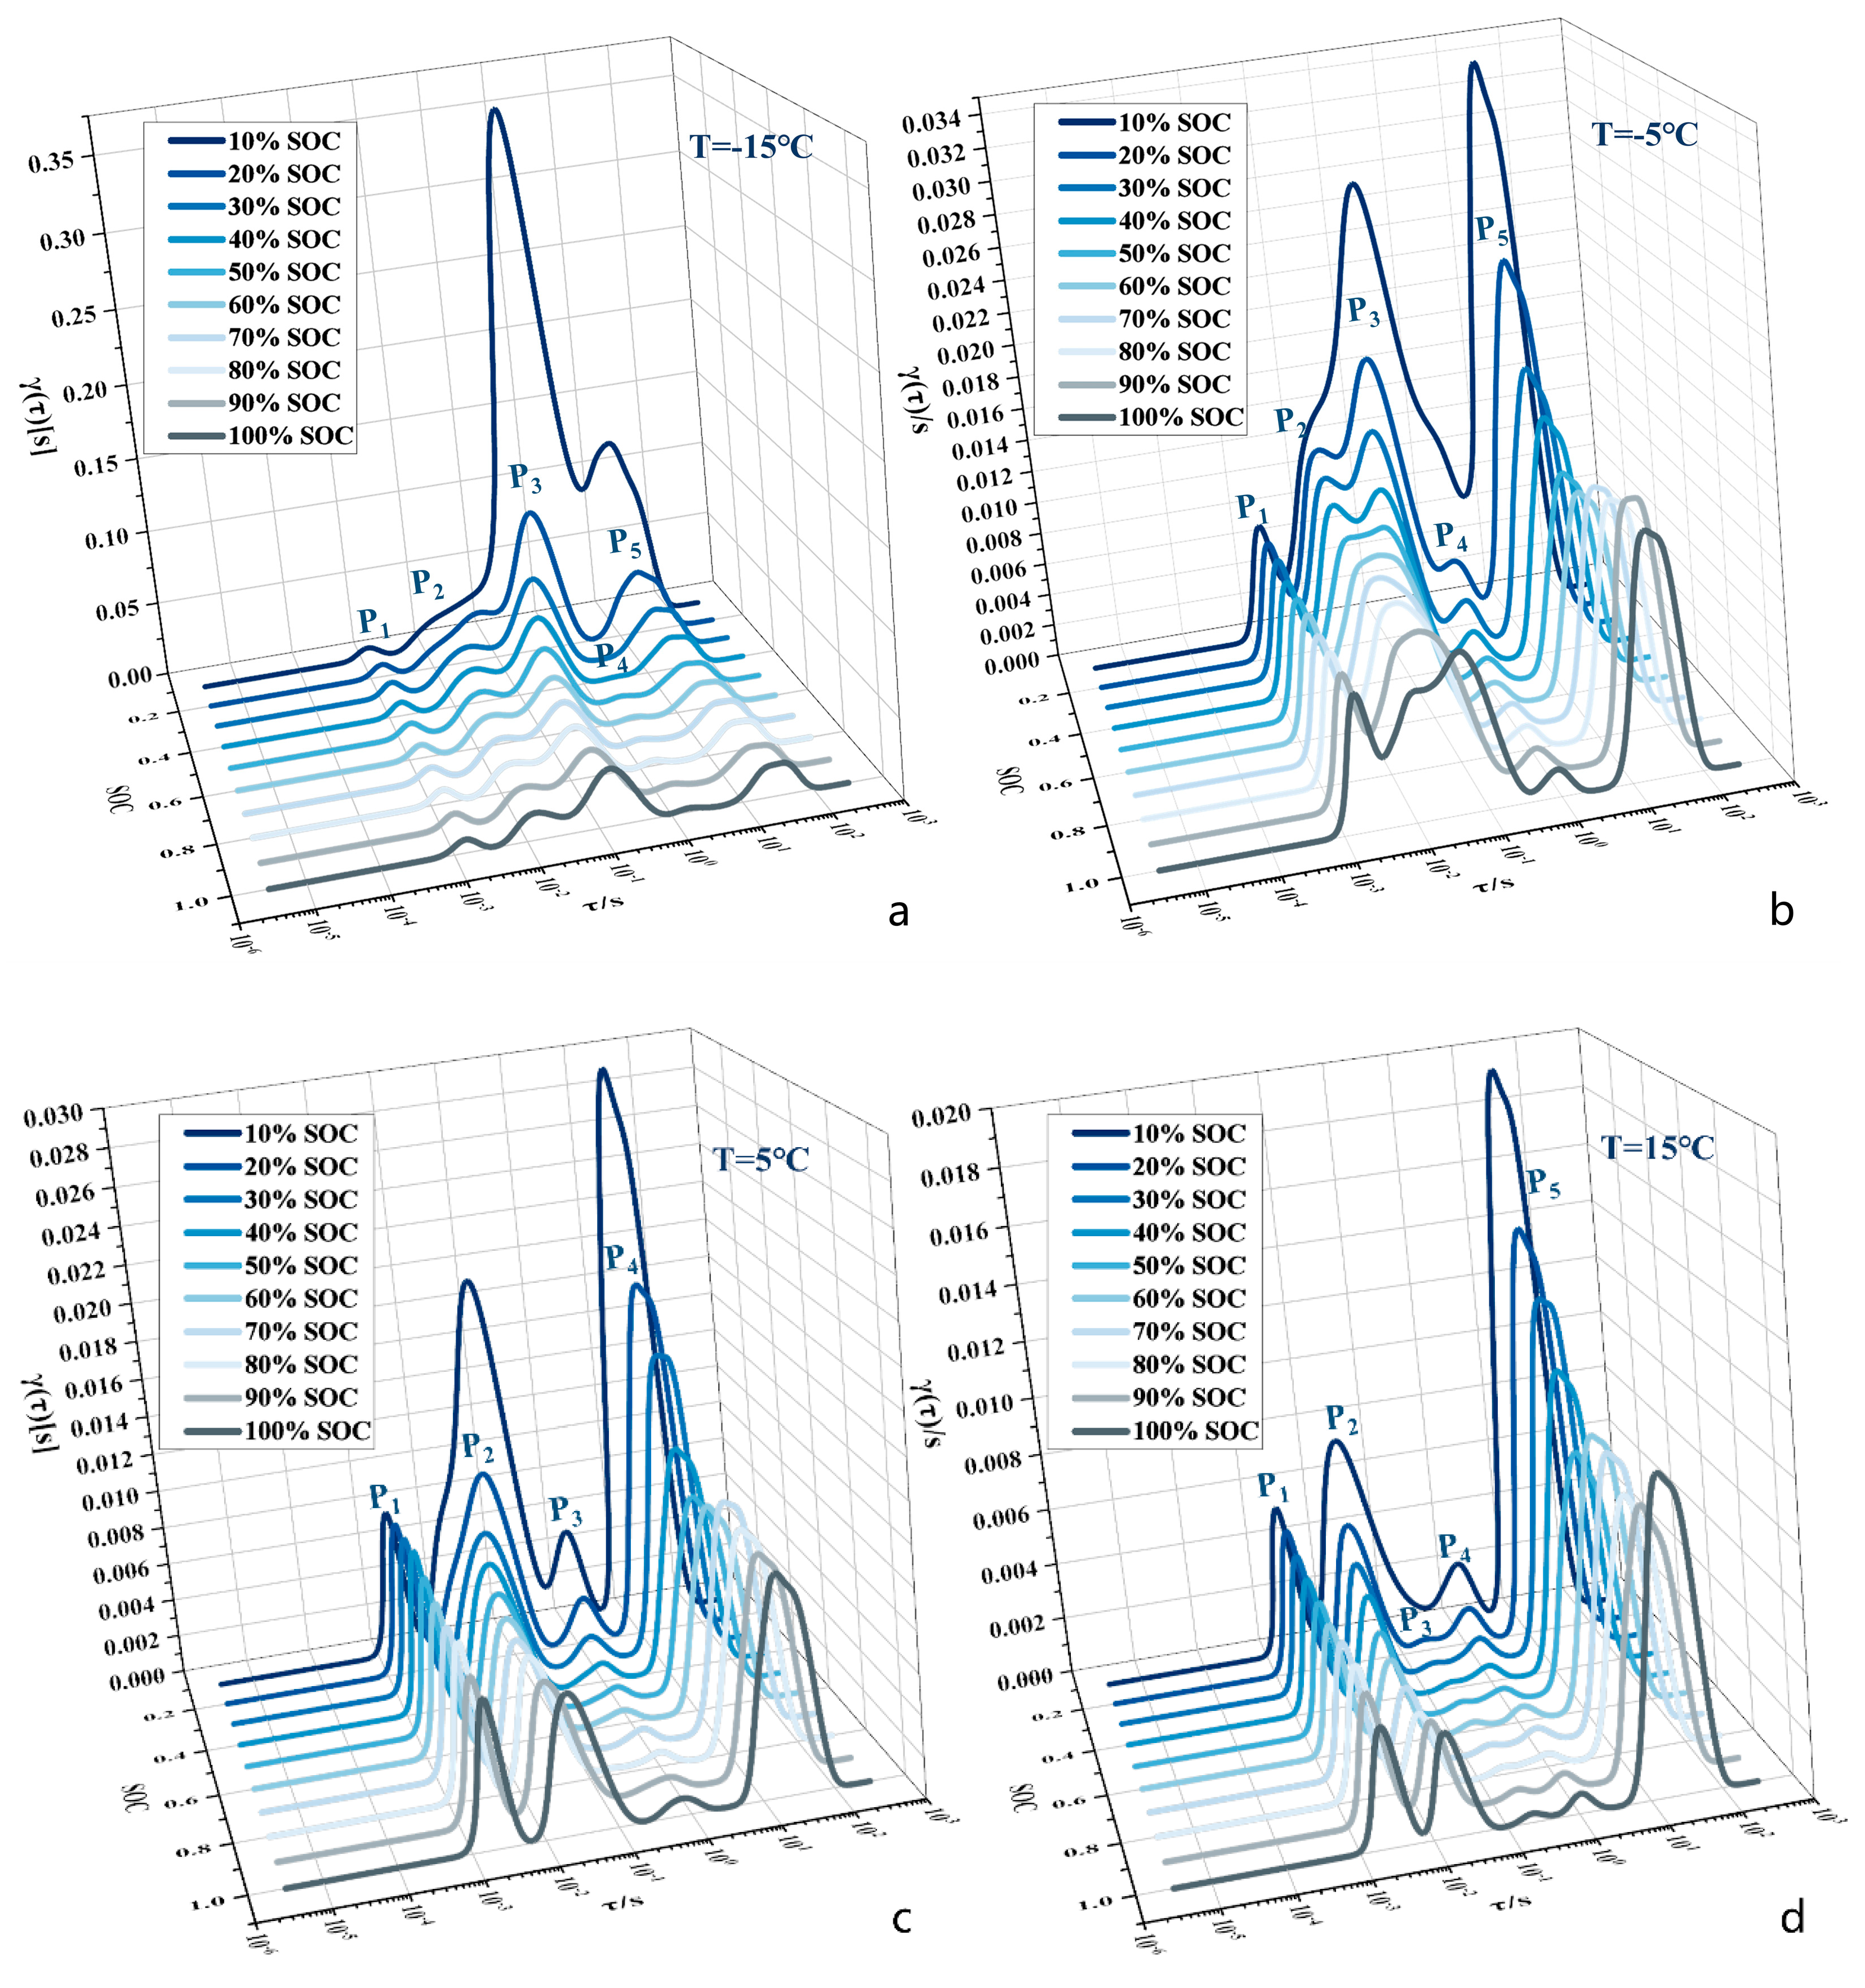
Figure 7 compares the DRT curves from 10 to 100% SOCs at different temperature conditions. When considered alongside Figure 5c, it is evident that the shape of the Nyquist curve is less affected by the cell’s SOC. The polarisation processes mapped by the P1 and P2 polarisation peaks show a weak correlation with the SOC state changes. However, the polarisation peaks P3–P5, which are correlated with the interfacial impedance and diffusion impedance, are significantly affected by the SOC. The trend of each polarisation peak with the SOC in the distribution of the DRT plot is consistent with that of the impedance data in the Nyquist plot. This verifies the feasibility and convenience of using the DRT method to resolve the EIS test data of a Lithium-ion battery.
Furthermore, it is evident from Figure 5d and Figure 6a that temperature has a significant impact on EIS. Therefore, this paper will analyse and discuss the DRT of a Lithium-ion battery across a wide range of temperatures. Figure 7 shows that the polarisation peaks P1–P5 vary significantly with temperature, and the corresponding polarisation resistance decreases as temperature increases. When the SOC is lower than 20%, the polarisation peaks P2–P5 vary significantly with temperature. This is because this part is related to the interfacial impedance and diffusion impedance [41,42]. Furthermore, the sensitivity of P1 to temperature is lower than that of the other polarisation peaks for each temperature condition. Therefore, the characteristics of the polarisation peak P1 can be attributed to the contact resistance [43].
According to Figure 7, the relaxation time and peak value of polarisation peaks P1 and P2 remain constant across a wide temperature range, regardless of the SOC. However, the relaxation time and peak value of polarisation peaks P3, P4, and P5 appear to vary to some extent with changes in the SOC. Polarisation peak P3 exhibits a significant advancement or delay in the hesitation time, and polarisation peaks P4 and P5 typically display large peaks at low charge states (SOC = 10%) or near full charge states (SOC = 90%). According to the characteristics of the DRT curve, impedance characteristics in the frequency bands corresponding to the two polarisation peaks of P1 and P2 can be selected for fault monitoring of a single cell in a battery pack. This reduces the impact on anomaly detection when the SOC state changes under different temperature conditions. Therefore, the EIS data in the frequency band of 2–200 Hz can be used to identify inconsistencies in the cells within a Lithium-ion battery pack.

4. Inhomogeneity Detection Experiment Based on LOF Outlier Algorithm

4.1. Principle of LOF Outlier Algorithm

This section employs the Local Outlier Factor algorithm, a density-based outlier detection method, to identify inconsistent singletons in the EIS data. The algorithm is an unsupervised learning clustering method that does not rely on a priori knowledge of a large number of datasets and does not require the data to satisfy a normal distribution or have labels [44]. The LOF algorithm primarily focuses on the neighbourhood of data points to detect anomalies based on their distribution characteristics. This approach greatly reduces the impact of data density on anomaly detection, making it more applicable to uneven data sets. Furthermore, the LOF algorithm can provide a quantitative measure of the degree of anomaly by assessing the local deviation of the data points from the domain data. Meanwhile, the data measured from Lithium-ion battery packs in real-world scenarios often do not follow a normal distribution. Additionally, the temperature of a single cell can be influenced by its neighbouring cells, which can lead to increased inconsistency among battery packs and the emergence of data clustering phenomena [45]. Therefore, using the LOF algorithm for battery pack fault detection is a better option. The following are the relevant definitions and calculation formulae:
dist di , dj : Euclidean distance from data point di to dj.
k Distance: k _ dist di : The distance from data point di to other data points in the dataset and are sorted from smallest to largest, and the distance from di to the k data point.
k Distance from Neighbourhood: Nk di : The dataset includes data points that are within a certain distance, k _ dist di , from a reference point, di.
Reachable Distance: reach _ distk   dr , di : The maximum distance k between the data point di and the Euclidean distance from di to dr. The equation is expressed as follows:
reach _ distk dr , di = max k _ dist di , dist dr , di
Local Reachability Density: lrdk di : The inverse of the k distance of the data point di from the average reachable distance of all data to di in the neighbourhood. Nk di is calculated. The equation is expressed as follows:
lrdk di = 1 / ds Nk di reach _ distk ds , di / Nk di
Local Outlier Factor: LOFk di : The average ratio of the local attainable densities of all data points in the neighbourhood Nk di to the local attainable density of di at distance k from the data point di should be calculated. The equation is expressed as follows:
LOFk di = ds Nk di lrdk dt lrdk di / Nk di
Using the above method, the LOF value is calculated for each data point in the dataset. The LOF value greater (or less) than one indicates a higher likelihood of being an anomaly.

4.2. Experiment on Battery Packs and Extraction of Eigenfrequencies

This section of the experiment involved connecting 20 cylindrical FCB 21700 H 4R2 C2500 Lithium-ion batteries in series to form a group. The consistency verification process used was the same as in Section 2.1. Nineteen of the batteries (Nos. 1–19) were brand new and close to 100% in the SOH state. One battery (No. 20) was found to be in the Lithium-ion precipitation state after 300 cycles of charge/discharge at −15 °C [46]. The battery packs were charged to 100% SOC at a constant temperature of 25 °C. After a resting period of more than three hours, the SOC of the packs was adjusted to 50% and left to rest for an additional three hours. Impedance measurements were then performed on each individual cell using the same method as described in Section 2.1, employing the BioLogic electrochemical workstation.
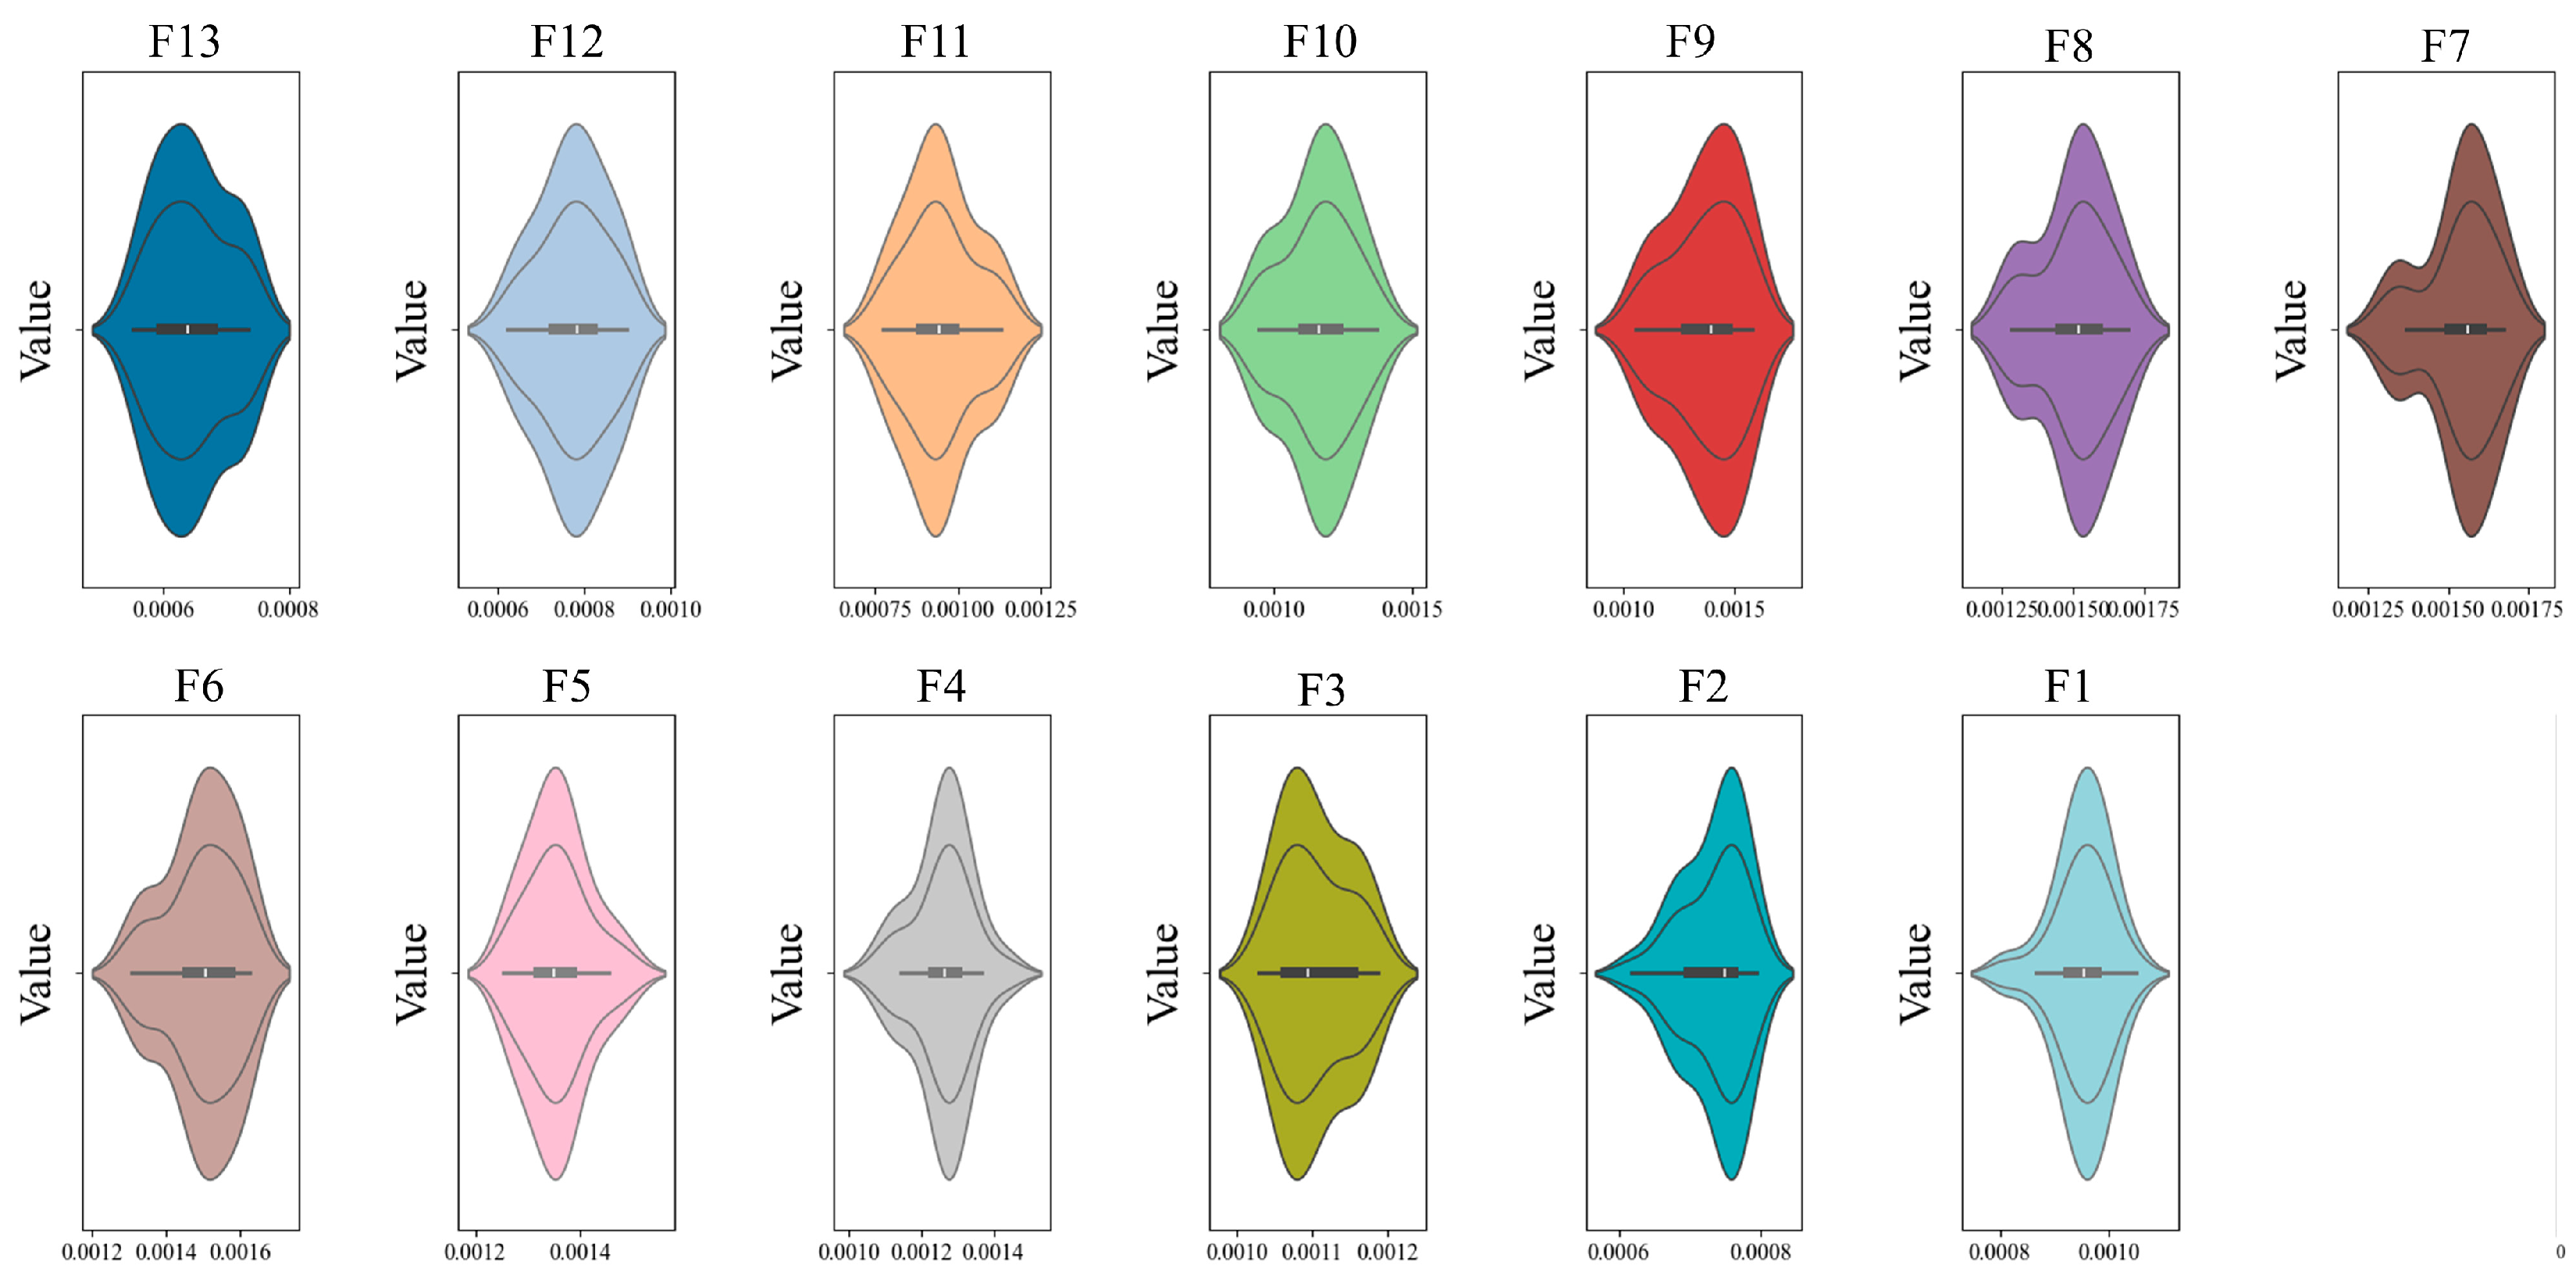
Section 3 discusses the analysis of the results, which indicate that the impedance data of a single cell in the frequency band of 20–200 Hz can be used to characterise its abnormal failure. This section presents the excitation frequencies used in the EIS test, namely 2.000131 Hz, 2.935924 Hz, 4.306778 Hz, 6.3259082 Hz, 9.2840195 Hz, 13.626441 Hz, 19.99363 Hz, 29.351934 Hz, 43.08365 Hz, 63.23941 Hz, 92.83125 Hz, 136.2644 Hz, and 199.9363 Hz, which are referred to as F1–F13. The distribution of the EIS data of the 19 groups of normal single cells at these frequencies is visualised in Figure 8. It shows a violin plot, which combines box-and-line and kernel density plots. The plot shows various percentile points of the data and provides a better representation of the data distribution and probability density. The use of subject-specific vocabulary enhances precision and clarity. The figure includes a box plot and a kernel density plot. The size of each region in the plot corresponds to the probability of the distribution around a specific value. By determining the thickness, median, and peak conditions of the violin, a more concentrated distribution of impedance data at the F12 frequency can be seen in the 13 groups of data shown in Figure 8. The characteristic frequency of 136.2644 Hz is situated within the intermediate frequency region, which is typically associated with the charge transfer processes of lithium ions at the surface of electrode materials. This encompasses both the adsorption and desorption of lithium ions on the electrode surface, as well as their migration across it. These processes are crucial to the performance of lithium-ion batteries, as they directly influence the embedding and deembedding efficiency of lithium ions. Consequently, this affects various battery attributes such as charge and discharge rates, temperature stability, cycle longevity, and other essential properties. At the same time, in conjunction with the previous analysis of the DRT results for the battery under various experimental conditions, it is evident that the impedance data at the F12 frequency also satisfies the following criteria: it is less influenced by the SOC and exhibits a strong correlation with temperature, charge/discharge rate, and cycles. Therefore, 136.2644 Hz is selected as the characteristic frequency for detecting impedance inconsistency in a single cell of the Lithium-ion battery pack.

4.3. Experimental Results and Comparison of Battery Pack Algorithm Effectiveness

The impedance values of the cells in a series battery pack were obtained in a laboratory environment, as shown in Figure 1. The algorithmic models were implemented in Python 3.10.0. Table 2 shows the LOF values of each cell in the battery pack, which were calculated using Equations (4)–(6). Combined with the results of the discussion of the LOF algorithm in Section 4.1, it is evident that the single cell No. 20 has the furthest distance from one compared to the other data, indicating that it is an anomalous single cell in the battery pack. To assess the method’s efficiency, this paper will also employ other commonly used outlier detection algorithms to identify anomalous single cells and visualise the results.
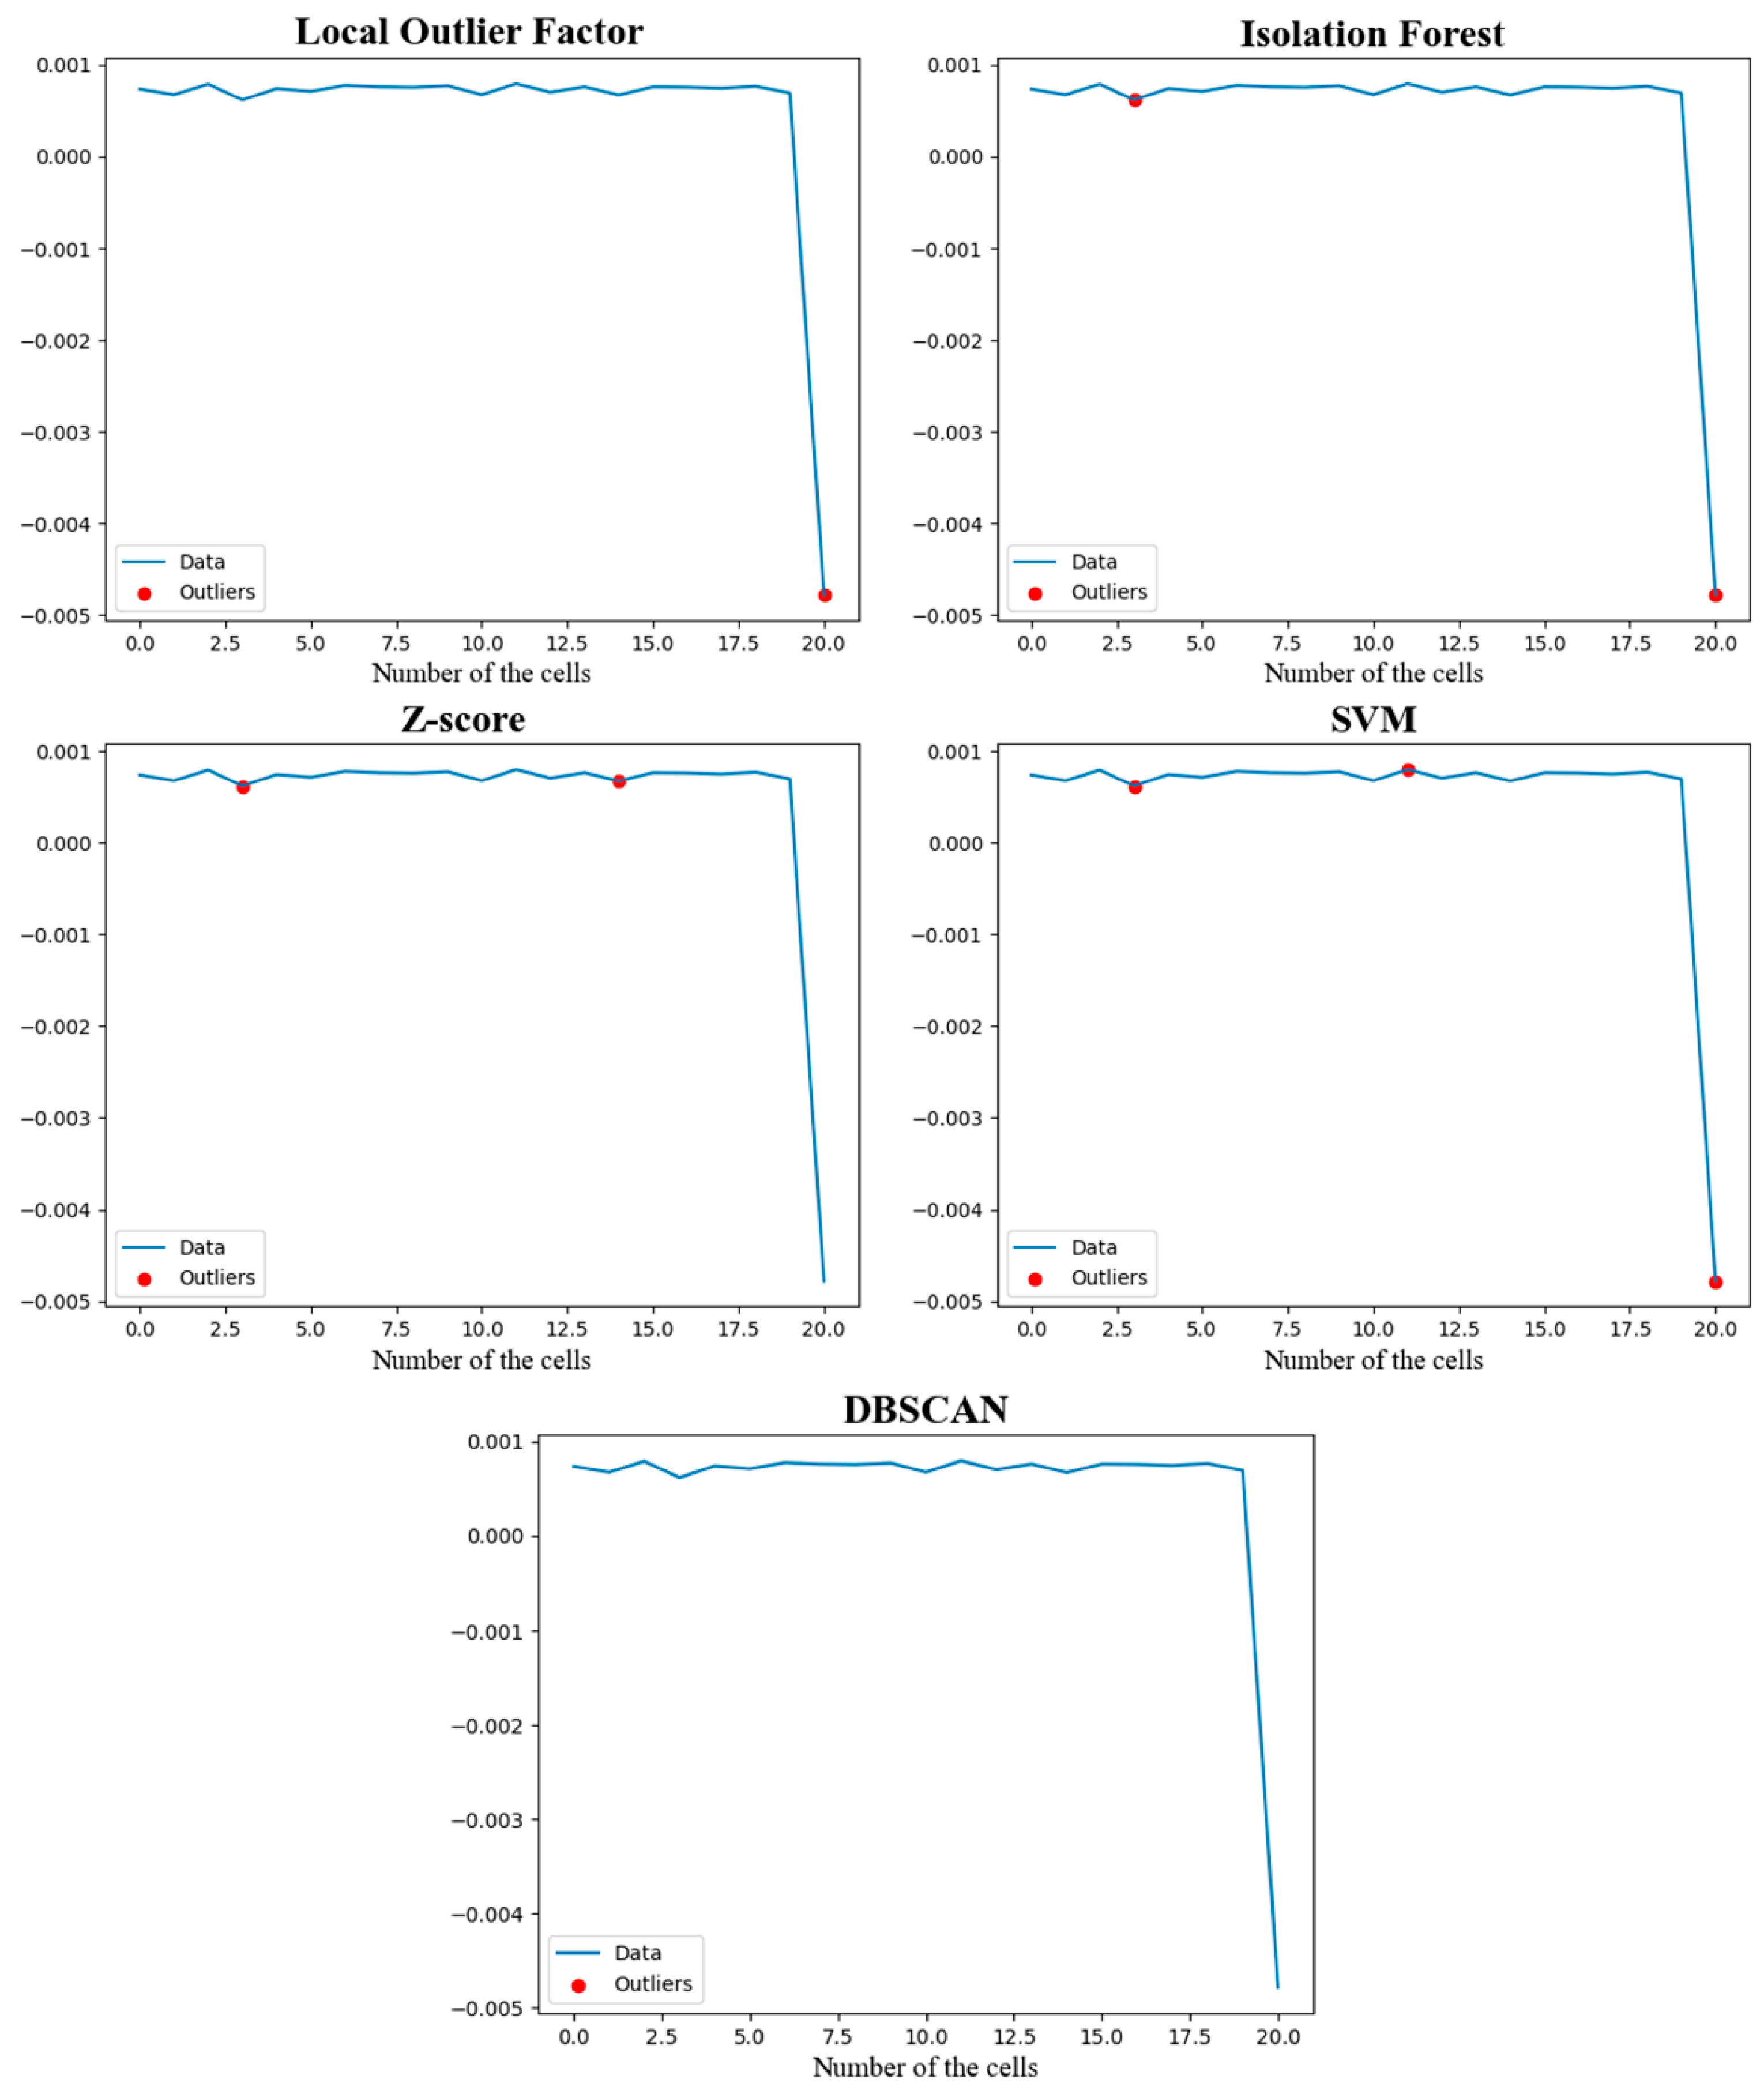
The results of applying unsupervised algorithms, including LOF, iForest, Support Vector Machine(SVM), Z-score, and DBSCAN, to an unlabelled dataset are presented in Figure 9. It shows that the LOF, iForest, and SVM algorithms all detect the twentieth abnormal single cell in the battery pack. However, false alarms occur under the iForest and SVM algorithms. The Z-score algorithm produces a false alarm when no abnormal single cell is detected, and the DBSCAN algorithm fails to identify an abnormal single cell through the impedance data. Different anomaly detection algorithms make varying assumptions and apply different conditions to the distribution of the data and the definition of anomalies, resulting in diverse outcomes [47]. Therefore, choosing the appropriate algorithm requires consideration of various factors, including data characteristics, the anomaly definition, and the strengths and weaknesses of the algorithm.
Table 3 shows the FAR, MAR, and detection time for various algorithm types. Figure 9 and Table 3 show that the Z-score and DBSCAN algorithms missed detections, while the iForest and SVM algorithms also misdetected. The results of the LOF algorithm used in this paper indicate a superior performance compared to other algorithms. The algorithm exhibits high sensitivity in detecting abnormal impedance values of single cells within the battery pack. It is also the fastest in detecting abnormal single cells and can accurately identify abnormal values in the collected data.

5. Conclusions

The inconsistency of a single cell in Lithium-ion battery packs can easily lead to sudden failure of the battery pack and can induce thermal runaway. Due to the difficulty of characterising the complex electrochemical processes inside the battery, the traditional anomaly detection technology is not efficient in identifying anomalies of single cells and providing early warnings. This paper provides a theoretical basis for measuring impedance data and relaxation time analysis of a Lithium-ion battery across the frequency range under different experimental conditions. It also provides a theoretical basis for identifying and providing early warnings for battery pack inconsistencies based on impedance data at characteristic frequency points. This paper presents a theoretical framework for identifying and providing early warning of inhomogeneity in battery packs using impedance data at characteristic frequency points. Using the results of the full frequency band EIS test data under different SOC states, ambient temperatures, charge/discharge rates, and cycles, DRT was employed to analyse the various kinetic processes inside the battery, as indicated by the changes in the five Lithium-ion peaks from P1 to P5. The characteristic frequency of 136.2644 Hz was extracted from the processes of interfacial evolution, SEI film growth, and charge transfer. This frequency was obtained from the interfacial evolution and SEI film growth and charge transfer processes. Finally, the analysis was conducted using five commonly used outlier detection algorithms (LOF, iForest, Z-score, SVM, DBSCAN) on EIS data obtained from cyclic charge/discharge of nineteen brand-new Lithium-ion batteries and one abnormally aged battery, which were used as input values for the algorithm. The experimental results demonstrate that the anomaly identification results of the LOF algorithm, as selected in this paper, are superior to those of other algorithms. Additionally, the proposed method for detecting impedance inconsistency in Lithium-ion battery groups based on the outlier factor of LOF is shown to be reliable. The reliability of this method for detecting impedance inhomogeneity in Lithium-ion battery packs based on LOF outlier factors is confirmed. The method has practical value in identifying inhomogeneity and warning of faults in Lithium-ion battery packs. It is also applicable to extracting impedance features from a battery made of other materials and can be applied to safety warnings. The text presents the main research conclusions as follows:
(1) EIS measurements were used to obtain the characteristics of a Lithium-ion ternary battery under different SOCs, temperatures, charge/discharge rates, and cycles. The experimental results indicate that the EIS is minimally impacted by changes in SOC, and the Nyquist curves maintain a similar shape across different SOCs, except for the low-frequency diffusion region. Meanwhile, the performance of the EIS is significantly impacted by changes in temperature, charge/discharge rate, and cycles. The alterations of Nyquist curves in the mid-frequency range under various charge/discharge frequencies can objectively demonstrate the side-reduction reaction between electrode particles and electrolyte dissolution inside the battery. This can effectively track the growth of SEI film inside each cell in the Lithium-ion battery pack. The Nyquist curves exhibit significant changes in the middle and high frequency bands under different cycle times. This provides strong support for distinguishing between the degradation of single cells in Lithium-ion battery packs. The impact of temperature on the EIS is particularly noteworthy, as evidenced by the Nyquist curve’s overall scaling effect. As temperature increases, the semicircular arc in the curve related to the charge transfer process reduces, indicating a decrease in the charge transfer impedance, Rct. However, the ohmic impedance, Rohm, remains almost unaffected. The battery’s overall impedance decreases significantly as the temperature increases, providing a theoretical basis for EIS studies of a Lithium-ion battery.
(2) The DRT method was utilised to parse EIS data, effectively distinguishing semi-circular arcs that may overlap in high-frequency bands in the Nyquist diagram. This method also provides a basis for selecting the characteristic frequency to identify impedance anomalies in a single cell. The results indicate that the DRT analysis method effectively addresses the deficiencies in the Nyquist diagram by accurately separating the charge transfer process at the electrode–electrolyte interface into two parts: the negative electrode–electrolyte interface and the positive electrode–electrolyte interface. By combining the Nyquist diagram and DRT diagram analysis, a characteristic frequency point of 136.2644Hz was selected for identifying impedance anomalies in a single cell of a Lithium-ion battery. Conducting EIS measurements at a single point frequency significantly reduces the acquisition time of impedance data, enabling accurate anomaly identification and timely warning for a Lithium-ion battery.
(3) The LOF outlier algorithm was used to identify anomalies of monomers in the battery pack, and it was compared with four other commonly used outlier detection algorithms. The validation and comparison results indicate that the LOF algorithm can rapidly and precisely detect abnormal impedance values in single cells. Compared to other algorithms, it has a faster detection speed without compromising measurement accuracy. This method can be applied to detect and provide early warning for anomalies in single-cell Lithium-ion battery packs.

Author Contributions

Conceptualization, L.W. and L.Z.; methodology, L.Z.; software, L.W.; validation, L.W., L.Z. and J.W.; formal analysis, Y.W.; investigation, B.P.; data curation, L.Z.; writing—original draft preparation, L.Z.; writing—review and editing, J.W.; project administration, L.W. All authors have read and agreed to the published version of the manuscript.

Funding

This research was funded by the National Key R&D Program of China, grant number 2023YFB2406004, Hubei Provincial Natural Science Foundation Innovation Group, grant number 2023AFA033 and Hubei Provincial Key R&D Program Project, grant number 2022BAA085.

Data Availability Statement

The original contributions presented in the study are included in the article, further inquiries can be directed to the corresponding author.

Acknowledgments

The author is grateful for the review and guidance of the reviewing experts. At the same time, the author would also like to thank the Hubei Key Laboratory for High-efficiency Utilization of Solar Energy and Operation Control of Energy Storage System for its support.

Conflicts of Interest

Author Bin Pan was employed by the Huizhou Power Supply Bureau of Guangdong Power Grid Co., Ltd. The remaining authors declare that the research was conducted in the absence of any commercial or financial relationships that could be construed as a potential conflict of interest.

References

  1. Hu, X.; Xu, L.; Lin, X.; Pecht, M. Battery lifetime prognostics. Joule 2020, 4, 310–346. [Google Scholar] [CrossRef]
  2. Zhang, C.; Jiang, Y.; Jiang, J.; Cheng, G.; Diao, W.; Zhang, W. Study on battery pack consistency evolutions and equilibrium diagnosis for serial-connected Lithium-ion battery. J. Appl. Energy 2017, 207, 510–519. [Google Scholar] [CrossRef]
  3. Ren, D.; Feng, X.; Liu, L.; Hsu, H.; Lu, L.; Wang, L.; Ouyang, M. Investigating the relationship between internal short circuit and thermal runaway of Lithium-ion battery under thermal abuse condition. Energy Storage Mater. 2021, 34, 563–573. [Google Scholar] [CrossRef]
  4. Jones, P.K.; Stimming, U.; Lee, A.A. Impedance-based forecasting of Lithium-ion battery performance amid uneven usage. Nat. Commun. 2022, 13, 4806. [Google Scholar] [CrossRef] [PubMed]
  5. Lu, Y.; Zhao, C.Z.; Huang, J.Q.; Zhang, Q. The timescale identification decoupling complicated kinetic processes in Lithium-ion battery. Joule 2022, 6, 1172–1198. [Google Scholar] [CrossRef]
  6. Rüther, T.; Plank, C.; Schamel, M.; Danzer, M.A. Detection of inhomogeneities in serially connected Lithium-ion battery. Appl. Energy 2023, 332, 0306–2619. [Google Scholar] [CrossRef]
  7. Tian, J.; Wang, Y.; Liu, C.; Chen, Z. Consistency evaluation and cluster analysis for Lithium-ion battery pack in electric vehicles. Energy 2018, 194, 116944. [Google Scholar] [CrossRef]
  8. Feng, X.; Pan, Y.; He, X.; Wang, L.; Ouyang, M. Detecting the internal short circuit in large-format Lithium-ion battery using model-based fault-diagnosis algorithm. J. Energy Storage 2018, 18, 26–39. [Google Scholar] [CrossRef]
  9. Cong, X.; Zhang, C.; Jiang, J.; Zhang, W.; Jiang, Y.; Zhang, L. A comprehensive signal-based fault diagnosis method for Lithium-ion battery in electric vehicles. Energies 2021, 14, 1221. [Google Scholar] [CrossRef]
  10. Yao, L.; Xiao, Y.; Gong, X.; Hou, J.; Chen, X. A novel intelligent method for fault diagnosis of electric vehicle battery system based on wavelet neural network. J. Power Sources 2020, 453, 227870. [Google Scholar] [CrossRef]
  11. Lin, D.; Li, Z.; Feng, Y.; Wang, X.; Li, S. Research on inconsistency identification of Lithium-ion battery pack based on operational data. In Proceedings of the 2021 4th IEEE International Conference on Industrial Cyber-Physical Systems (ICPS), Victoria, BC, Canada, 10–12 May 2021; pp. 498–502. [Google Scholar]
  12. Kong, X.; Zheng, Y.; Ouyang, M.; Lu, L.; Li, J.; Zhang, Z. Fault diagnosis and quantitative analysis of micro-short circuits for Lithium-ion battery in battery packs. J. Power Sources 2018, 395, 358–368. [Google Scholar] [CrossRef]
  13. Lin, T.; Chen, Z.; Zhou, S. Voltage-correlation based multi-fault diagnosis of Lithium-ion battery packs considering inconsistency. J. Clean. Prod. 2022, 336, 130358. [Google Scholar] [CrossRef]
  14. Hong, J.; Wang, Z.; Chen, W.; Wang, L. Multi-fault synergistic diagnosis of battery systems based on the modified multi-scale entropy. Int. J. Energy Res. 2019, 42, 8350–8369. [Google Scholar] [CrossRef]
  15. Zhang, Y.; Tang, Q.; Zhang, Y.; Wang, J.; Stimming, U.; Lee, A.A. Identifying degradation patterns of Lithium-ion battery from impedance spectroscopy using machine learning. Nat. Commun. 2020, 11, 1706. [Google Scholar] [CrossRef] [PubMed]
  16. Liu, Y.; Xie, J. Failure Study of Commercial LiFePO4 Cells in Overcharge Conditions Using Electrochemical Impedance Spectroscopy. J. Electrochem. Soc. 2015, 162, 10. [Google Scholar] [CrossRef]
  17. Gantenbein, S.; Weiss, M.; Ivers-Tiffée, E. Impedance based time-domain modeling of lithium-ion batteries: Part I. J. Power Sources 2018, 379, 317–327. [Google Scholar] [CrossRef]
  18. Zhu, D.; Ma, T.; Yang, Y. Optimization and application of the distribution of relaxation times based on characteristic frequency resolution and hyperparameters. J. Power Sources 2022, 545, 231955. [Google Scholar] [CrossRef]
  19. Zhang, L. Study on State Estimation of Ternary Lithium-Ion Battery Based on Electrochemical Impedance Spectroscopy. Master’s Thesis, Jilin University, Changchun, China, 2018. [Google Scholar]
  20. Wang, J.; Huang, Q.; Li, W.; Wang, J.; Zhuang, Q.-C.; Zhang, J.-J. Fundamentals of distribution of relaxation times for electrochemical impedance spectroscopy. J. Electrochem. 2020, 26, 607–627. [Google Scholar]
  21. Zhou, X.; Pan, Z.; Han, X.; Lu, L.; Ouyang, M. An easy-to-implement multi-point impedance technique for monitoring aging of Lithium-ion battery. J. Power Sources 2019, 417, 188–192. [Google Scholar] [CrossRef]
  22. Iurilli, P.; Brivio, C.; Wood, V. On the use of electrochemical impedance spectroscopy to characterize and model the aging phenomena of Lithium-ion battery: A critical review. J. Power Sources 2021, 505, 229860. [Google Scholar] [CrossRef]
  23. Li, X.; Ahmadi, M.; Collins, L.; Kalinin, S.V. Deconvolving distribution of relaxation times, resistances and inductance from electrochemical impedance spectroscopy via statistical model selection: Exploiting structural-sparsity regularization and data-driven parameter tuning. Electrochim. Acta 2019, 313, 570–583. [Google Scholar] [CrossRef]
  24. Babaeiyazdi, I.; Rezaei-Zare, A.; Shokrzadeh, S. State of charge prediction of EV Lithium-ion battery using EIS: A machine learning approach. J. Energy 2021, 223, 120116. [Google Scholar] [CrossRef]
  25. Ivers-Tiff’ee, E.; Weber, A. Evaluation of electrochemical impedance spectra by the distribution of relaxation times. J. Ceram. Soc. Jpn. 2017, 125, 193–201. [Google Scholar] [CrossRef]
  26. Wan, T.H.; Saccoccio, M.; Chen, C.; Ciucci, F. Influence of the Discretization Methods on the Distribution of Relaxation Times Deconvolution: Implementing Radial Basis Functions with DRTtools. J. Electrochim. Acta 2015, 184, 483–499. [Google Scholar] [CrossRef]
  27. Gavrilyuk, A.L.; Osinkin, D.A.; Bronin, D.I. On a variation of the Tikhonov regularization method for calculating the distribution function of relaxation times in impedance spectroscopy. J. Electrochim. Acta 2020, 354, 136683. [Google Scholar] [CrossRef]
  28. Tagayi, R.K.; Ezahedi, S.E.; Kim, J.; Kim, J. Employment of relaxation times distribution with improved elastic net regularization for advanced impedance data analysis of a Lithium-ion battery. J. Energy Storage 2023, 70, 107970. [Google Scholar] [CrossRef]
  29. Effat, M.B.; Ciucci, F. Bayesian and hierarchical Bayesian based regularization for deconvolving the distribution of relaxation times from electrochemical impedance spectroscopy data. J. Electrochim. Acta 2017, 247, 1117–1129. [Google Scholar] [CrossRef]
  30. Chen, X.; Li, L.; Liu, M.; Huang, T.; Yu, A. Detection of Lithium-ion plating in Lithium-ion battery by distribution of relaxation times. J. Power Sources 2021, 496, 229867. [Google Scholar] [CrossRef]
  31. Zhou, X.; Huang, J.; Pan, Z.; Ouyang, M. Impedance characterization of Lithium-ion battery aging under high-temperature cycling: Importance of electrolyte-phase diffusion. J. Power Sources 2019, 426, 216–222. [Google Scholar] [CrossRef]
  32. Mertens, A.; Granwehr, J. Two-dimensional impedance data analysis by the distribution of relaxation times. J. Energy Storage 2017, 13, 401–408. [Google Scholar] [CrossRef]
  33. Leng, F.; Wei, Z.; Ming, C.; Yazami, R. Hierarchical degradation processes in Lithium-ion battery during ageing. J. Electrochim. Acta 2017, 256, 52–62. [Google Scholar] [CrossRef]
  34. Ko, C.-J.; Chen, K.-C. Constructing battery impedance spectroscopy using partial current in constant-voltage charging or partial relaxation voltage. Appl. Energy 2024, 356, 122454. [Google Scholar] [CrossRef]
  35. Fan, W.; Xu, G.; Yu, B. On-line estimation method for internal temperature of Lithium-ion battery based on electrochemical impedance spectroscopy. J. Proc. CSEE 2021, 41, 3283–3293. [Google Scholar]
  36. Carthy, K.M.; Gullapalli, H.; Ryan, K.M.; Kennedy, T. Electrochemical impedance correlation analysis for the estimation of Lithium-ion battery state of charge, state of health and internal temperature. J. Energy Storage 2022, 50, 104608. [Google Scholar] [CrossRef]
  37. Risse, S.; Cañas, N.A.; Wagner, N.; Härk, E.; Ballauff, M.; Friedrich, K.A. Correlation of capacity fading processes and electrochemical impedance spectra in Lithium-ion/sulfur cells. J. Power Sources 2016, 323, 107–114. [Google Scholar] [CrossRef]
  38. Beelen, H.P.G.J.; Raijmakers, L.H.J.; Donkers, M.C.F.; Notten, P.H.L.; Bergveld, H.J. A comparison and accuracy analysis of impedance-based temperature estimation methods for Lithium-ion battery. J. Appl. Energy 2016, 175, 128–140. [Google Scholar] [CrossRef]
  39. Li, X.; Xu, J.; Hu, Z. The health parameter estimation method for LiFePO4 battery echelon use. J. Trans. China Electrotech. Soc. 2018, 33, 9–16. [Google Scholar]
  40. Ren, D.; Feng, X.; Lu, L.; He, X.; Ouyang, M. Overcharge behaviors and failure mechanism of Lithium-ion battery under different test conditions. J. Appl. Energy 2019, 250, 323–332. [Google Scholar] [CrossRef]
  41. Galeotti, M.; Cinà, L.; Giammanco, C.; Di Carlo, A.; Santoni, F.; De Angelis, A.; Moschitta, A.; Carbone, P. LiPo battery dataset: Capacity, electrochemical impedance spectra, and fit of equivalent circuit model at various states-of-charge and states-of-health. J. Data Brief 2023, 50, 215–223. [Google Scholar] [CrossRef]
  42. Schmidt, J.P.; Berg, P.; Schönleber, M.; Weber, A.; Ivers-Tiffée, E. The distribution of relaxation times as basis for generalizedtime-domain models for Lithium-ion battery. J. Power Sources 2013, 221, 70–77. [Google Scholar] [CrossRef]
  43. Manikandan, B.; Ramar, V.; Yap, C.; Balaya, P. Investigation of physico-chemical processes in Lithium-ion battery by deconvolution of electrochemical impedance spectra. J. Power Sources 2017, 361, 300–309. [Google Scholar] [CrossRef]
  44. Chen, Z.; Xu, K.; Wei, J.; Dong, G. Voltage fault detection for Lithium-ion battery pack using local outlier factor. J. Meas. 2019, 146, 544–556. [Google Scholar] [CrossRef]
  45. Zhao, S.; Luo, L.; Wang, B. An improved outlier delection algorithm K-LOF based on density. Comput. Perform. Commun. Syst. 2017, 2, 1–7. [Google Scholar]
  46. Hu, G. Research on Lithium-Ion Evolution Characteristics and Safety of Lithium-Ion Battery Based on AC Impedance Characteristics; Hunan University: Changsha, China, 2023. [Google Scholar]
  47. Mei, L.; Zhang, F.; Gao, Q. Overview of outlier detection technology. J. Appl. Res. Comput. 2020, 37, 3521–3527. [Google Scholar]
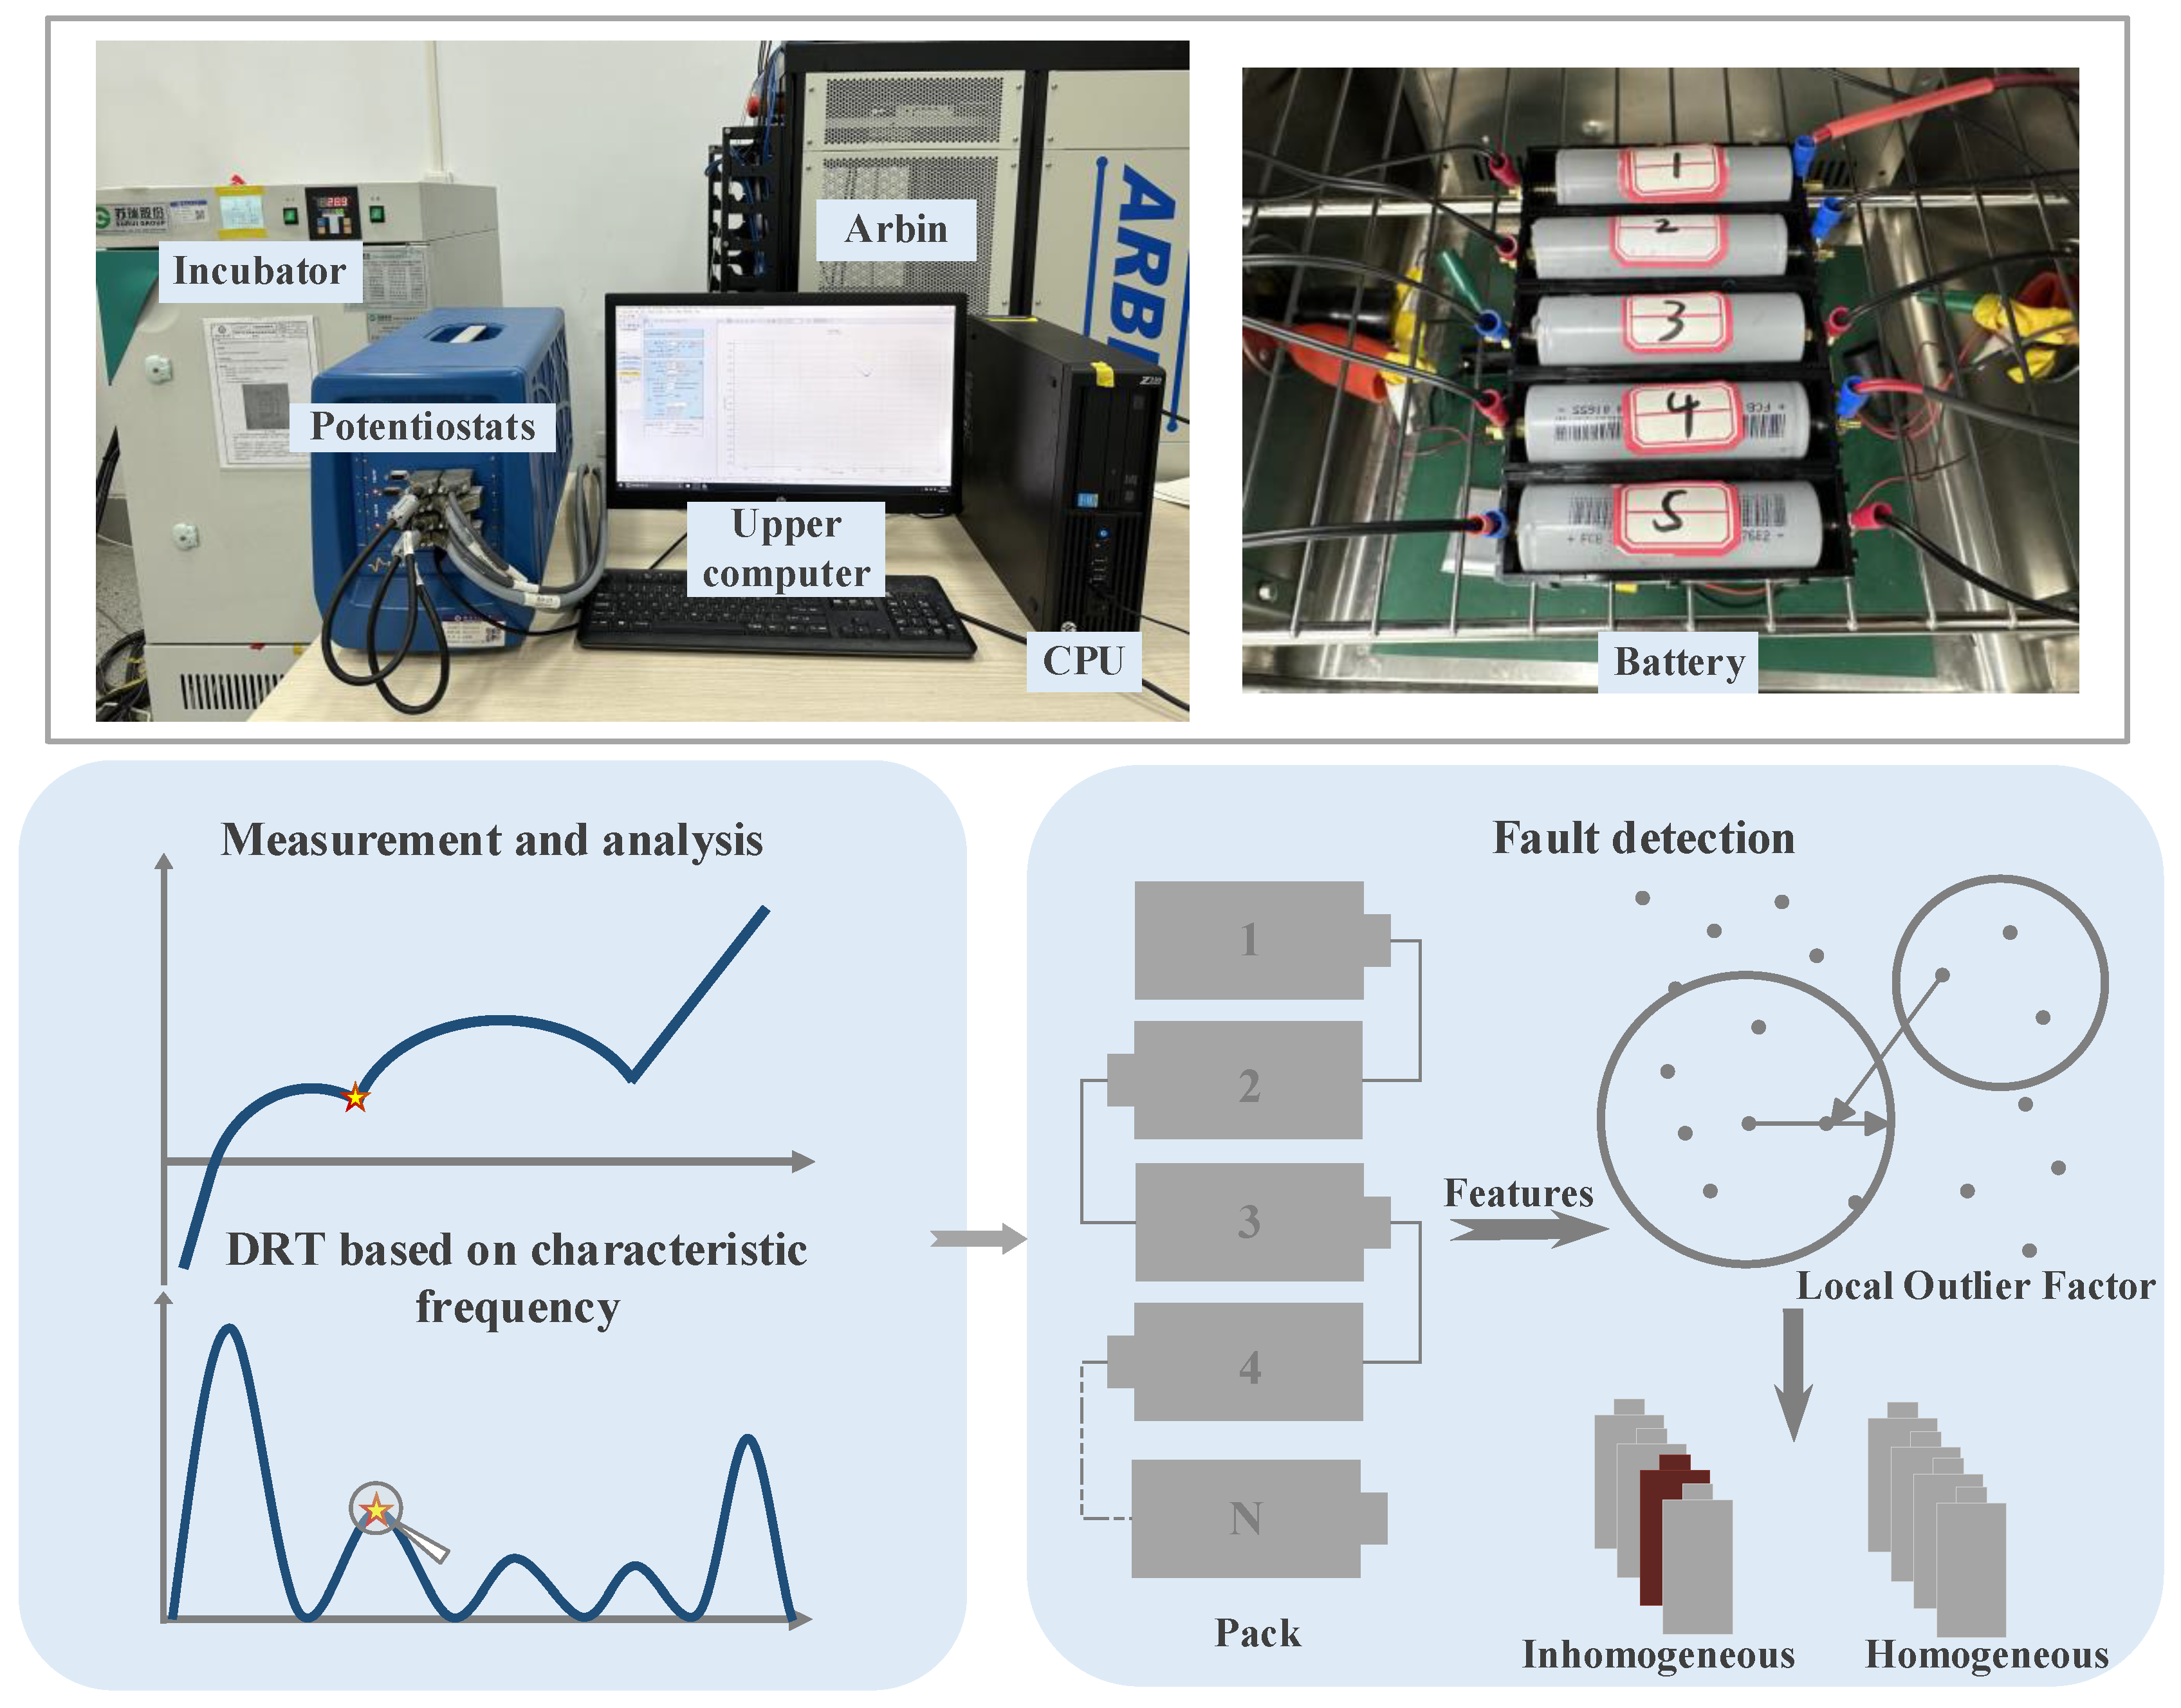
Figure 1. Framework of the methodology employed within this study.
Energies 17 05123 g001
Figure 2. Flow and results plots of the pretreatment experiment. (a) The capacity error of 20 cells. (b) EIS plot of 20 cells in 2D view. (c) EIS plot of 20 cells in 3D view.
Energies 17 05123 g002aEnergies 17 05123 g002b
Figure 3. Schematic representation of the experimental workflow.
Energies 17 05123 g003
Figure 4. Comparison of different parsing methods for EIS test data. (a) Nyquist plot of the impedance spectra. (b) ECM of EIS. (c) The DRT result of EIS. The pentagon represents the identified characteristic frequencies. P1~P4 indicate the contact Lithium-ion, growth of SEI, charge transfer, and diffusion processes, respectively.
Energies 17 05123 g004
Figure 5. Nyquist plots of the cell at different experiment conditions. (a) Different rate. (b) Different cycles. (c) Different SOC states. (d) Different temperatures.
Energies 17 05123 g005
Figure 6. DRT plots of the cell at different experimental conditions. (a) Different temperatures. (b) Different cycles. (c) Different charge/discharge rates.
Energies 17 05123 g006
Figure 7. DRT plots of the cell at different experiment temperatures. (a) −15 °C; (b) −5 °C; (c) 5 °C; (d) 15 °C; (e) 25 °C; (f) 35 °C.
Energies 17 05123 g007aEnergies 17 05123 g007b
Figure 8. Violin plots of impedance date at F13–F1.
Energies 17 05123 g008
Figure 9. Result of outlier value detection by five algorithms.
Energies 17 05123 g009
Table 1. The main parameters of the cells used in this study.
ItemGeneral Parameter
Minimum Capacity2400 mAh
Rated Capacity2500 mAh
Nominal voltage3.6 V
Lower cut-off voltage2.5 V
Upper cut-off voltage4.2 ± 0.03 V
Charging current2.5 A
Table 2. The value of the LOF for the cell.
Number of the CellLOFNumber of the CellLOF
10.9999999603104642111.0005747349187861
21.000577847674403120.9996478433621423
30.9994948657361418131.0003190130016608
41.001113965094464140.9997786215631451
50.9999541066596755151.0006076330331992
61.0002361489721572160.9997693879356649
70.9996234787060005170.9998019338422555
80.9997658478546321180.9999107279827717
90.9998175547351235190.9997069900363661
100.9996647441359714200.9994457946193019
Table 3. Evaluation Index for five algorithms.
Type of AlgorithmFAR/%MAR/%Detection Time/ms
Isolation Forest1/200/159.15600000298582
Z-score2/2010.19610000890679657
SVM2/200/10.5737000028602779
LOF0/200/10.1517999917268753
DBSCAN110.7514000026276335
Disclaimer/Publisher’s Note: The statements, opinions and data contained in all publications are solely those of the individual author(s) and contributor(s) and not of MDPI and/or the editor(s). MDPI and/or the editor(s) disclaim responsibility for any injury to people or property resulting from any ideas, methods, instructions or products referred to in the content.