Article

A Post-Disaster Fault Recovery Model for Distribution Networks Considering Road Damage and Dual Repair Teams

1
School of Electrical Engineering, Southeast University, Nanjing 210096, China
2
Nanjing Power Supply Company, State Jiangsu Electric Power Co., Ltd., Nanjing 210019, China
*
Author to whom correspondence should be addressed.
Energies 2024, 17(20), 5020; https://doi.org/10.3390/en17205020
Submission received: 18 August 2024 / Revised: 30 September 2024 / Accepted: 4 October 2024 / Published: 10 October 2024

Abstract

:
Extreme weather, such as rainstorms, often triggers faults in the distribution network, and power outages occur. Some serious faults cannot be repaired by one team alone and may require equipment replacement or engineering construction crews to work together. Rainstorms can also lead to road damage or severe waterlogging, making some road sections impassable. Based on this, this paper first establishes a road network model to describe the dynamic changes in access performance and road damage. It provides the shortest time-consuming route suggestions for the traffic access of mobile class resources in the post-disaster recovery task of power distribution networks. Then, the model proposes a joint repair model with general repair crew (GRC) and senior repair crew (SRC) collaboration. Different types of faults match different functions of repair crews (RCs). Finally, the proposed scheme is simulated and analyzed in a road network and power grid extreme post-disaster recovery model, including a mobile energy storage system (MESS) and distributed power sources. The simulation finds that considering road damage and severe failures produces a significant difference in the progress and load loss of the recovery task. The model proposed in this paper is more suitable for the actual scenario requirements, and the simulation results and loss assessment obtained are more accurate and informative.

1. Introduction

As the final link between end-users and utilities, distribution networks must have a reliable and efficient electricity supply to customers. However, extreme natural disasters have resulted in severe power outages. The 2008 ice disaster in China caused 10 kV outages in 36,000 transmission lines. Hurricane Sandy landed in the United States in 2012, causing over 1000 power outages [1]. Hurricane Harvey in 2017 caused more than 291,000 people to lose power. Moreover, historical data show that power outages occur mainly in power distribution systems [2]. Weather-related outages in the distribution system directly affect the continuity of the electricity services provided to customers [3]. Therefore, in response to such extreme weather-induced low-probability and high-impact distribution network security events, strengthening the disaster defense and recovery capabilities of distribution networks is essential for improving the robustness of distribution networks.
Rainstorms account for a considerable proportion of the causes of power grid outages [4]. Rainstorms show a tendency of frequent occurrence. It is essential to conduct targeted research on the recovery of distribution network faults caused by rainstorms. Pre-planning [5], pre-disaster warning [6], emergency response [7], and post-disaster recovery [8] are essential measures for strengthening the resilience of distribution networks [9]. Among them, emergency response and post-disaster recovery are both measures taken after a disaster, so studies categorize them as post-disaster recovery [9]. We focus on reviewing the primary measures of emergency response and post-disaster recovery.
Network reconfiguration is among the most common measures for restoring lost power in distribution networks. Network reconfiguration can isolate grid faults and increase the percentage of distributed power access. The reference [10] reinforces the Distributed Generation (DG) advantage with the help of a topology adjustment to support the disaster-in-disaster recovery model. Reconfiguration technology can facilitate the rapid restoration of multi-energy systems after extreme disasters and reduce energy operation costs [11]. In addition, network reconfiguration can be conveniently performed via remote control switches [12] or soft open points [13]. The dynamic reconfiguration approach also allows for a real-time response to the damage sustained by the distribution system [14]. DG is an essential driver for network reconfiguration, and microgrids and islands can significantly improve the flexibility and utilization efficiency of DG access during the disaster recovery phase. The reference [15] suppresses the uncertainty of wind turbines and photovoltaics by constructing microgrids. In system islanding, microgrids can harmonize frequency, voltage, and power to connect local power sources and users, which is critical for users in areas that have suffered severe and extreme disasters and have been disconnected from the primary grid [16,17]. The contribution of microgrids in post-disaster recovery is to integrate access to local and recovery resources to make up for system shortfalls due to failures and to establish power and user connectivity quickly. So microgrids can also integrate access to generators and electric vehicles (EV) [18], as well as coordinate repair crews (RC) and mobile power sources (MPS) [19].
Truck-mounted mobile emergency generators (MEGs) are considered as flexible and critical resources to restore customers from power supply outages. Refueling trucks can also refuel MEGs to provide energy capacity of up to several megawatts [20]. MEGs prioritize deployment to locations with the highest outage losses to reduce economic losses [21]. Reference [22] establishes multiple mobile energy storage system (MESS) operation modes through a two-stage model to realize its chronological scheduling. To shorten the vehicle’s travel time, reference [23] proposes pre-positioning MEGs in staging locations before a natural disaster to shorten the post-disaster response time. EVs have been used in various applications due to their excellent flexibility, high capacity, low cost, and bi-directional charging [24,25]. EVs can be deployed with MEGs and MESSs to provide emergency power at faulty nodes [26]. The limitation of EV participation in fault recovery is that its spatio-temporal distribution is time-varying. Reference [27]’s pre-disaster scheduling of potentially responsive EVs based on travel chains can solve this challenge. Induced compensation mechanisms can also incentivize EV customers to respond to the system’s supply needs [28,29]. In contrast, electric buses (EB) have relatively fixed trips [30]. On the other hand, an EB scheduling model [30] with predefined optional service trips can mitigate the characteristics of EV distribution uncertainty and obtain vehicle trajectories in advance. Further, hydrogen fuel cell vehicles can complement EVs and have fewer carbon emissions [31].
In the above study, multiple types of restoration resources can provide a temporary power supply to the lost nodes of the faulty grid in the first instance to mitigate the losses caused by a power shortage [32]. We categorize them as part of the emergency response [7]. However, RCs and emergency supplies are critical components to repair a fault completely [9]. They may exist in different locations and arrive at the fault location at different moments. Models can create personnel dispatch schemes that plan the order of arrival of supplies and thus coordinate the order of other resources [33]. However, most schemes use the personnel dispatch sequence as the main line and then coordinate the transportation process of resources such as supplies [34,35]. This is because RCs are often scarcer than supplies in restoration missions. Changes in the number of RCs and fluctuations in the restoration time can also directly affect the schedule of the overall restoration program [36]. Of course, RCs and supplies can also be assigned to sites in advance [37], reducing their passage time after a disaster. It is important to note that emergency response resources, such as DG, MEGs, and MESSs, should always be operational while the RC is involved in the restoration. They should be continuously optimized and adjusted as fault elimination advances [36,38].
Further, the details of the RC’s involvement should not be neglected. Upon receipt of a customer’s report on a fault, the utility crew should first send basic maintenance crews to the point of failure to assess the type and location of system damage and project the sequence of fault repairs and the materials required [39]. If necessary, before the arrival of equipment replacement personnel, tree trimming and other clearing crews should first be dispatched to clear the surrounding environment to carry out the repair work [40]. Even the fault restoration simultaneously requires the grid maintenance personnel operating the feeder switch and the RC to cooperate [41]. RCs can only carry limited restoration resources to cope with some faults because each maintenance crew possesses limited skills [33]. In a failure-type statistic, the sum of critters, vegetation, and fuses accounted for about one-tenth of the failure types [42]. Many faults in extreme weather are short circuits caused by tree branch contact and hanging foreign objects [43], which basic repair crews can easily handle. For example, trees cause yearly transient outage events on overhead lines [44]. Of course, equipment damage, collapses, broken wires, and other types of faults also account for a significant percentage [45,46]. These types of faults then require the arrival of basic repair crews who continue to call the corresponding kinds of engineers and equipment to participate in complex repairs. There is undoubtedly a distinction between the severity of faults in distribution networks [47]. In the field of research on the post-disaster recovery of faults in distribution networks, there are very few studies on modeling multiple types of RCs. The reference [33] makes restorers travel repeatedly to the warehouse to replenish their resources when they run out, but this is too inefficient. The two types of personnel arrivals in reference [41] are at different target locations, and the model cannot distinguish the crew requirements for various types of faults.
Whether RCs, MESSs, or MEGs, they depend highly on road access. In particular, the wide application of EVs has brought much attention to the study of the coupling between the grid and the road network [48,49]. The Floyd and Dijkstra algorithm is a commonly used basic model for calculating the path length [50,51]. The determined vehicle travel time can provide an orderly reference for the dispatch of emergency power vehicles [52]. Modeling road travel distance and risk assessment can give decision-makers a concise and clear cost reference [53] without requiring complex travel times. The dispatch of both RCs and MESSs is rooted in routing and scheduling problems, which are travel routes and access objectives [19,26]. Both of them are affected by roadway travel times. Therefore, the RC and mobile class emergency power dispatch should be included in evaluating traffic efficiency [54]. Congestion is a constant feature of transportation networks, especially after extreme disasters [55,56]. The consideration of the vehicle’s elapsed time in traffic due to factors including congestion can significantly improve the accuracy of recovery plans [57]. However, the environment, after an extreme disaster rapidly changes, and the traffic status can change even hours after the repair. On the other hand, dynamic traffic assignment models can extrapolate the change in the traffic state and develop the current optimal routes for MESSs or RCs based on the latest traffic attributes [51,58]. In addition, the time-consuming waiting at traffic lights in urban areas with dense intersections cannot be ignored. Adding traffic light elapsed time constraints to the dynamic traffic flow model can further refine the passing time [59]. Furthermore, road damage becomes more common in extreme disaster environments. Adding road damage modeling can simulate the post-disaster environment, pushing the coupling between the road network and power grid to a new level [60].
Shortcomings of existing studies
Although the existing research results have provided an in-depth study of diverse restoration resources from multiple perspectives, based on the statistics and discussion of distribution network fault types, it can be seen that, after extreme weather such as rainstorms, there are almost always some severe faults in the distribution network. It is very challenging for a single team to restore all faults. Existing models rarely consider this problem, and there is a lack of research on two teams traveling to the same fault for repair in cooperation.
Meanwhile, although a few studies have modeled road damage after extreme weather, the models involve too few resources. For example, reference [60] only modeled access to MESSs and should have included RCs. In addition, traffic conditions after a disaster rapidly change, and traffic flows more smoothly as various sectors carry out relief. In contrast, traffic at the peak of the workday and off-peak can be particularly congested. The current results do not comprehensively portray road damage and the dynamic change process.
Contribution of this paper
Therefore, this study proposes a post-disaster fault recovery model for distribution grids that considers road damage and the demand for dual repair teams. The main contributions of this study are as follows:
  • A post-disaster traffic access model describing the dynamic changes in congestion and road damage is proposed, which can simulate the traffic access performance at different stages after extreme rainstorms. It can also bypass damaged roads, thus providing a more accurate calculation of the elapsed passage time. Based on this, a road network/distribution network integrated fault recovery system is established to provide more accurate post-disaster recovery traffic scenario simulation for various types of mobile resources involved in fault recovery.
  • Classify distribution network faults into ordinary faults and severe faults and set ordinary faults to be repaired by only one maintenance team, while serious faults require the cooperation of general repair teams and senior repair teams in turn. The SRC represents the multiple types of equipment replacement, engineering work, tree trimming, etc. that may be required for fault repair. This simulates the need for various types of personnel in practice.

2. Problem Description and Technical Framework

Extreme weather events can damage not only power distribution systems but also transportation networks. For example, after a rainstorm, the city’s low-lying areas will be submerged, significantly reducing vehicles’ free speed and saturation. Local sections of the tree or subgrade collapse directly and cut off road access. This problem can be summarized as a traffic obstruction, producing intense uncertainty in the recovery task.
At the same time, extreme disasters may cause some severe faults, which cannot be repaired by only one team and require multiple batches and multiple types of personnel to collaborate on repair. This study generalized this problem into a joint repair model using two batches of repair teams. The second batch of repair crews involved in repairing serious failures is called the senior repair crew (SRC). Expressly, ordinary faults only need to be repaired by the general repair crew (GRC), and serious faults need to be repaired by the GRC and SRC in turn to restore them. The logical relationship of RCs is shown in Figure 1. GRCs can travel to any faulty node without restriction and move to the next one after the repair is completed. The SRC can only travel from the base after the GRC has arrived at a severe fault. This is because the type of fault and the need for it can only be confirmed after the GRC has assessed it.
Among them, the SRC here refers not only to the repair crew with advanced technology. The accident of falling pole towers caused by heavy rain erosion requires the cooperation of the road administration and other scenarios involving the cooperation of a third party.
Distribution network fault restoration resources mainly contain emergency repair teams and power resources. Emergency power resources such as diesel generators (DEGs), stationary energy storage systems (SMSS), and MESSs can compensate for the lack of load caused by system faults in time to reduce the loss of power outages. Simultaneously, the RC eliminated the fault and restored the operation. RCs and emergency power resources work in tandem and complement each other.
For the road congestion and damage scenarios faced in complex traffic environments, we use the cell transmission model (CTM) to model the post-disaster road traffic and dynamically reproduce the attributes of smoothness, congestion, and damage to the post-disaster road traffic by adjusting the model parameters at the right time so that we can simulate the traffic routes of the mobile class of restoration resources in different road scenarios and study the impact of the differentiated traffic environments on the restoration tasks.
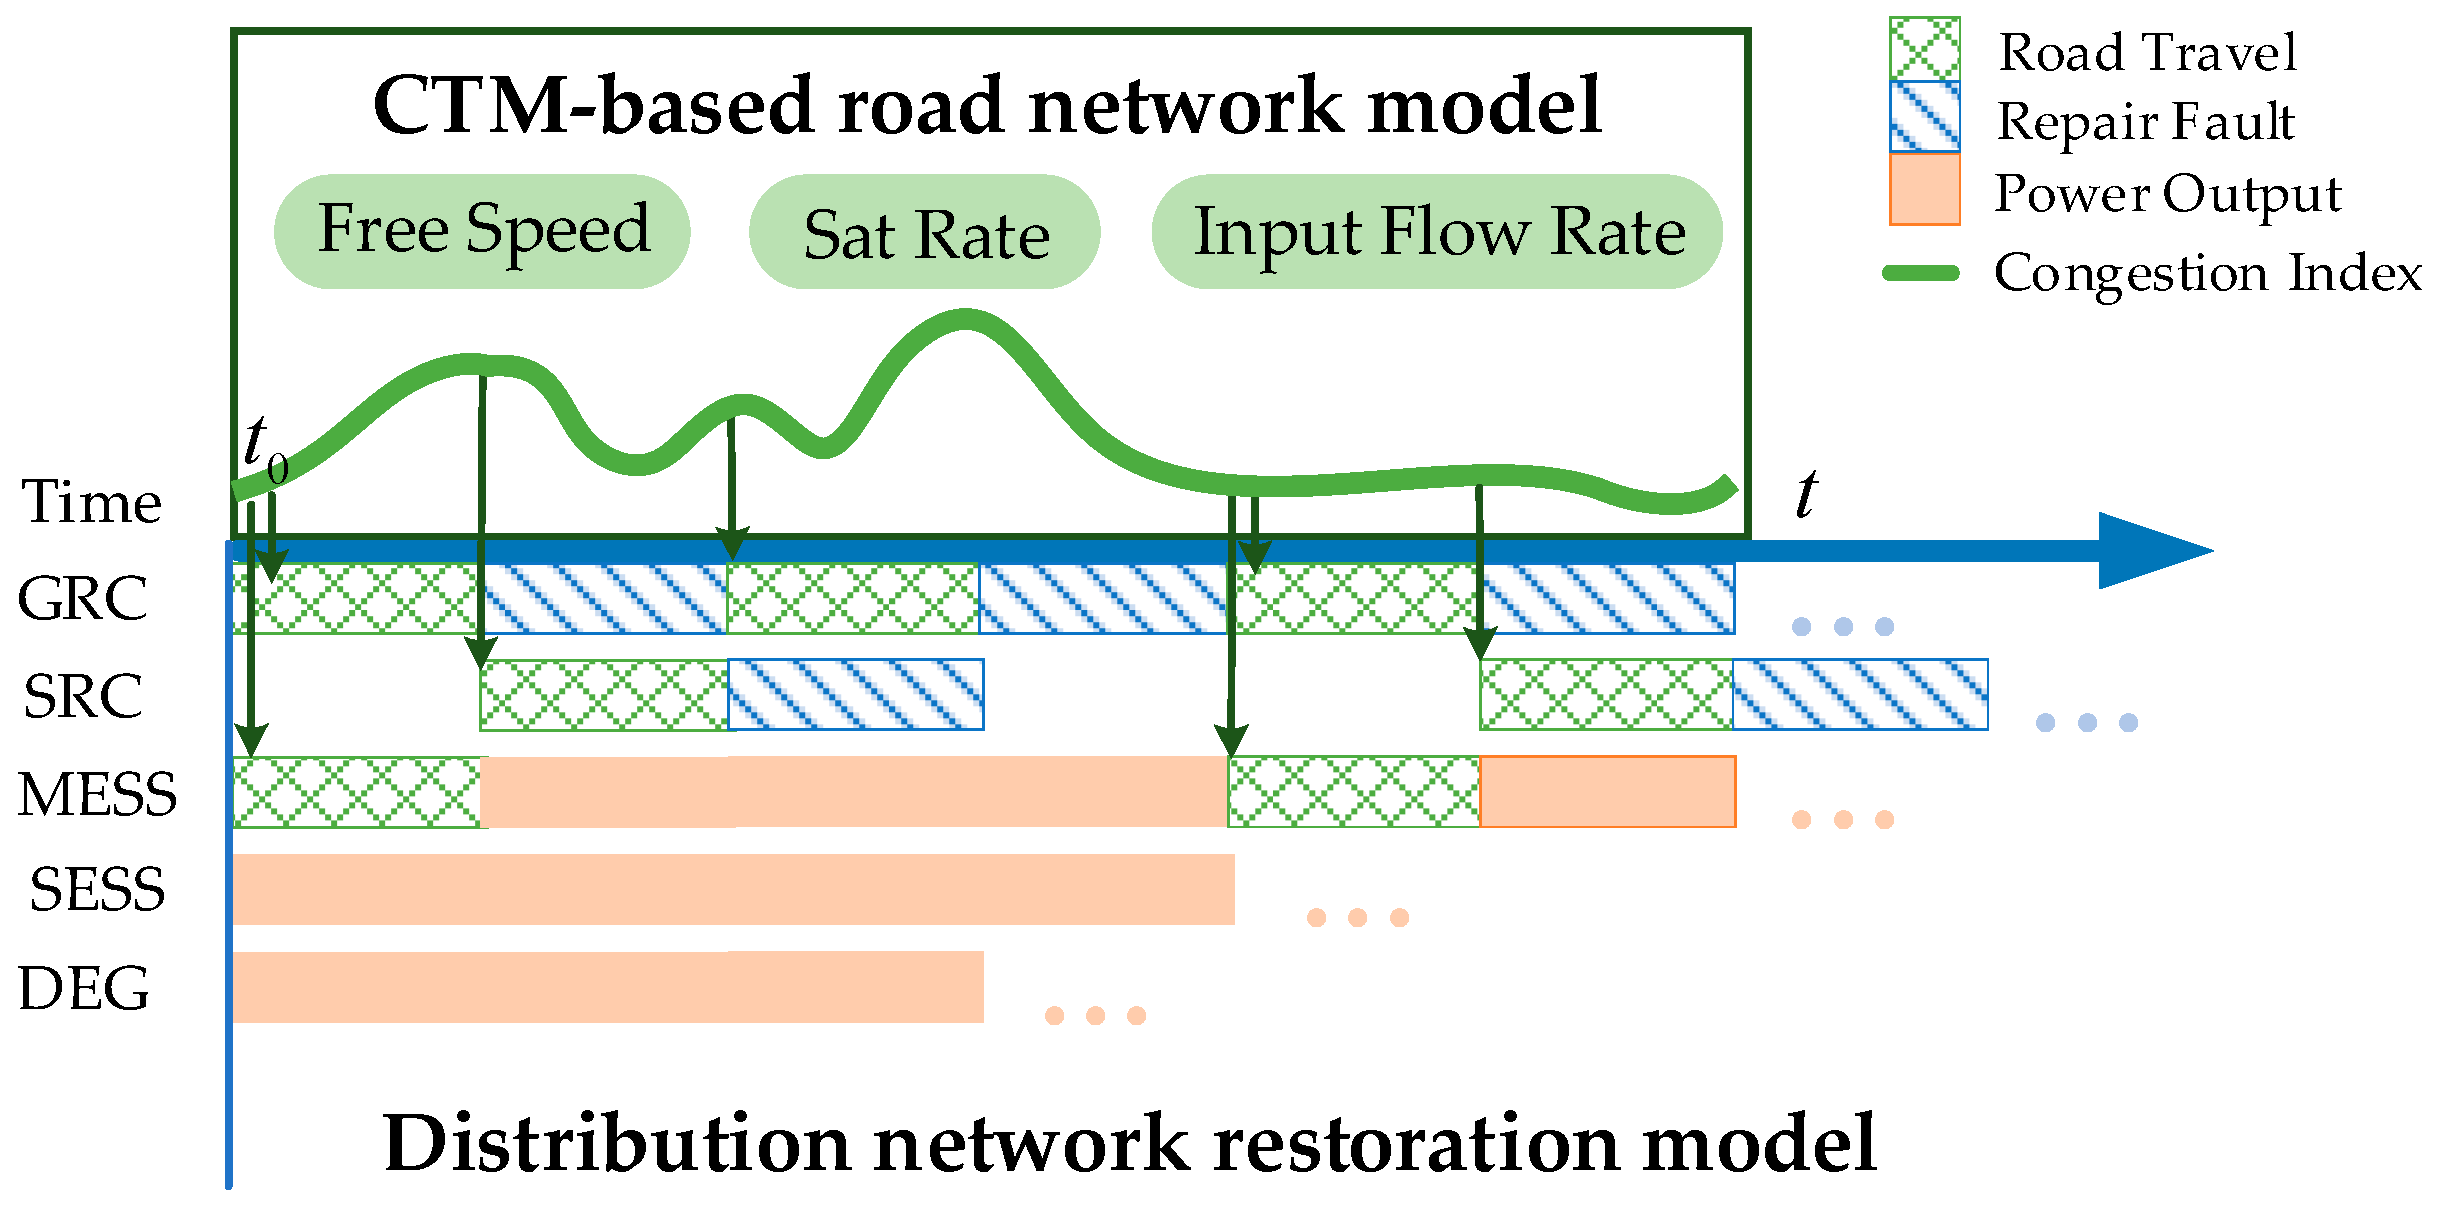
Based on this, the post-disaster recovery task of the distribution network needs to dispatch emergency power supply resources such as DEGs, SMSSs, and MESSs to supply power to the lost nodes first. At the same time, according to the fault location, the RC’s passage time and repair time, the number and type of faults, the system’s power loss, and other factors, the emergency power supply resources and repair teams are coordinated for optimization. The collaborative relationship between various types of resources is shown in Figure 2. The road network model simulates the road access environment by the CTM to provide mobile restoration resources with access time. The GRC has only access and repair states. The SRC also has waiting states. CTM changes the parameter, which is reflected in the congestion index and access time change.

3. Traffic Model

The cell transmission model (CTM) can simulate the formation and dissipation of surges and queues and capture traffic flow dynamics. The significance of using CTM for traffic flow modeling is to respond more realistically to changes in road traffic after extreme meteorological disasters. The CTM is a discretized approximation of the LWR (Lighthill–Whitham–Richards) macroscopic traffic flow model [61], whose basic principle is that the road section is divided into many head-to-tail cells. Under conditions such as flow conservation and capacity, constraints are satisfied, the input and output traffic volumes of the cells are calculated, and the state of the cells is iteratively updated according to a specific time step to obtain the dynamic traffic characteristic index of the cells [62].
The traffic flow model has two parts: the road segment and node models. The road segment model describes the relationship between the density, speed, demand, and supply of roads. The node model describes the upstream and downstream traffic distribution rules followed by vehicles at intersections [63]. Because the tuples that comprise the CTM are discrete, differentiated speed and density parameters can be updated in real-time for tuples at different times and locations. It can stimulate the formation and propagation of flow fluctuations, traffic congestion [64,65], and the impact of traffic signals on vehicles [66]. Thus, a dynamic response is achieved. Dynamic traffic modeling is suitable for traffic flow simulation and prediction over short periods, e.g., to characterize traffic flows for accidents or construction. The CTM has a wide range of applications in the field of transportation, such as intersection queuing simulation [66] and traffic state surveillance [67]. It is also widely used in other traffic-related domains, such as dynamic lane reversal with autonomous vehicles [68], aircraft traffic flow prediction [69], pedestrians sharing roads with vehicles [70], and the orderly charging of electric vehicles [71,72]. It has also performed well in studies considering the traffic-related post-disaster recovery of distribution networks [73].
Then, the LWR model can be approximated by a set of difference equations, which in turn establishes discrete equations for continuous traffic flow:
x i t + 1 = x i t + y i t y i + 1 t
y i , i + 1 t = min x i t , Q i + 1 t , w / v f r e e N i + 1 t x i + 1 t
where x i t is the number of vehicles in cell i at time t. y i , i + 1 t is the number of vehicles flowing into cell i + 1 from cell i at time t. Q i , i + 1 t is the saturation flow rate of cell i at time t + 1, indicating the maximum inflow acceptable to the cell. v f r e e is the free speed, which represents the theoretical traffic speed when the traffic density and interference are zero. w is the spillback speed, representing the speed at which congestion in the traffic stream propagates upstream. And N i + 1 t is the blocking density of cell i + 1 at time t, indicating the maximum number of vehicles to withstand when vehicles are stationary and closely spaced. Equation (1) is the updated equation of the cell, and Equation (2) is the traffic flow measurement formula.
The CTM is used to model road traffic flow in this study, which aims to describe the dynamic flow distribution and vehicle traffic attributes of each road in the traffic network given the traffic network, travel demand, and flow allocation principles, to project the objective passage time of mobile rescue resources during the post-disaster restoration of the distribution network. However, the CTM enforces balanced traffic flow diversion rules at intersections, which do not meet road access characteristics under significant disturbances such as severe weather. Therefore, the diversion rules for intersections in the CTM are set differentially to describe the reduced capacity due to waterlogging and the breakdown of some roads. The free-flow rate discount coefficient is set for road sections with reduced capacity owing to waterlogging and breakdowns to match the actual road access evolution law [74].

3.1. Shortest Path Generation

After the CTM provides the traffic status of each road, the shortest path needs to be calculated according to the starting location supplied by the scheme as the final choice of the driving route. In this study, the Dijkstra algorithm computes the shortest path, and each road segment’s weight is the corresponding period’s elapsed time.

3.2. Vehicle Travel Time

The CTM provides the number of vehicles experiencing delays as they move through a congested roadway, which allows for calculating the delay time for vehicle movements [75]. The delay time is the portion of time that a vehicle exceeds its free-flow speed. Based on this, we can calculate the actual passage time of a vehicle:
t t r a v e l = r θ ( l r r o a d / v f r e e + v r d e l a y / N i + 1 t t s i m u l )
where t t r a v e l is the vehicle’s actual passage time. v r d e l a y is the number of vehicles delayed on road r in the simulation cycle, which can be output directly by the model. t s i m u l is the time of the simulation step. l r r o a d is the length of road r, and θ is all road sections passed by vehicles participating in the grid fault rescue at the starting and finishing points.

3.3. Model Correction after Extreme Rainstorms

Studies have shown that rain and snow inclement weather significantly affect roadway free-flow velocities. The saturation rates of the effects of rain and snow are a function of their intensity. The proportion of impacts at different times of the day can also exhibit slight differences [55,56]. We can simulate the change in the traffic state after a rainstorm by modifying these two parameters, affecting the global vehicle traveling time and path selection. To show the effect of traffic on the post-disaster fault restoration task of distribution networks after extreme rainstorms and to avoid increasing the model complexity, this study introduces some correction coefficients to the CTM as follows:
v c = λ 1 v c
Q r c = λ 2 Q c
where v c and v c are free-stream velocities. Q r c and Q c are saturation rates. λ 1 and λ 2 are correction factors. Equations (4) and (5) represent the effects of extreme rainstorms on the CTM parameters.

4. Disaster Recovery Model

Model optimization involves numerous disaster recovery resources that must satisfy the constraints of the road network traffic model and attribute limitations of various fixed and mobile recovery resources. The constraint model is reflected in this section. It is important to note that the CTM model provides deterministic quantitative results for access, so there are no decision variables. However, the CTM outputs of road access times are used as a parameter to move resources, which affects the constraint model.

4.1. The Objective Function

The goal of distribution system restoration is to restore the lost loads quickly. Different levels of loads need to be treated differently, and this study ensures that high-priority loads are restored first by assigning different weights to multiple types of loads. Therefore, the main objective of the optimization is to minimize the amount of load lost in the system, followed by the shortest restoration time of the faulted line. Since the presence of faults weakens the grid’s defense capability and affects the surrounding production and life, the duration of faults is shortened while the amount of lost load is optimal.
o b j = max λ o b j t i w i P i , t ( 1 λ o b j ) T f a u l t
where P i , t is the restored active power of bus i at time t. w i denotes the load weight at bus i. T f a u l t denotes the equivalent variable of the time consumed for faulty branch restoration, and λ o b j is the weighting factor of the system’s load loss. t i w i p i , t denotes the load of system recovery.

4.2. Constraints

The model constraints include the basic constraints of the distribution network operation, and the resource constraints involved in post-disaster distribution recovery tasks. SESSs, MESSs, DEGs, GRCs, and SRCs are among the recovery resources. During fault recovery, SESSs and DEGs supply power to the underloaded nodes of the line in which they are located, but they cannot be moved. The MESS supplies power to the nodes that have suffered an outage and do not have a backup power source. Of course. It must experience a certain amount of road traveling time to move between nodes. The GRC and SRC repair faults from the depot. All faults need to be reached and repaired by the GRC. Some of the severe faults cannot be eliminated by the GRC alone, and they call the SRC to travel with supplies from the depot and participate in the repairs.

4.2.1. The Mobile Energy Storage System

The constraints of the MESS include scheduling constraints and power constraints for energy storage. The mission of the MESS is to supply power to outage nodes during emergency response and post-disaster recovery. Its scheduling constraint objective is to reduce the road travel time and avoid road congestion and road damage.
The scheduling constraints for the MESS is as follows:
e Ω m V b , e , t 0 m e s s = N m e s s
n Ω node V n , e , t m e s s 1
n Ω n o d e , e Ω m V n , e , t m e s s N m e s s
V n , e , t m e s s + ω = 1 m n t n , m , t m e s s , t r a V m , e , t + ω m e s s 1
x n , e , t m e s s , c h + x n , e , t m e s s , d i s V n , e , t m e s s
where Ω m denotes the set of MESSs. N m e s s denotes the number of MESSs. V n , e , t m e s s denotes the state variable of whether the MESS is connected to node n at moment t, V n , e , t m e s s   is 1 if connected and 0 if not. m, n denote the nodes that connect with the MESS, and m , n Ω n o d e . t m , n , t m e s s , t r a denotes the time taken by the MESS to pass from node n to node m at time t. x n , e , t m e s s , c h and x n , e , t m e s s , d i s are the 0–1 variables of the charging and discharging states of the MESS. x n , e , t m e s s , c h = 1 denotes charging and x n , e , t m e s s , d i s = 1 denotes discharging.
Equation (7) indicates that the MESS is located at base b at the initial moment t 0 . Equations (8) and (9) indicate that the MESS can only be connected to at most one node at moment t. The number of MESSs connected to a node at moment t is not more than the number of available nodes. The number of all MESSs connected to a node at time t is not more than the number available. The voltage–current–power relationship equation is referred to as Equation (44) after relaxing the quadratic constraints. Equation (10) indicates that the MESS from node n to node m must undergo a passage time t n , m , t m e s s , t r a at least before connecting with a second node. t n , m , t m e s s , t r a is calculated by the CTM. Equation (11) represents the coupling between the MESS charging and discharging states and the connection state. The MESS cannot be charged and discharged simultaneously.
The power constraints of the MESS are consistent with those of the SESS and are presented in Equations (30)–(33) of Section 4.2.3 below.

4.2.2. The General Repair Crew and Senior Repair Crew

The GRC and the SRC need to develop reasonable driving routes to move between the warehouse and all the faults, aiming for the least time-consuming road traveling time. They both need to plan the sequence of fault repairs and should first travel to the node with the most significant load recovery to eliminate the fault.
(1)
The constraints of the GRC are as follows:
The scheduling of the RC involves two interdependent subtasks: routing and scheduling. Routing is selecting a route for each RC between the warehouse and the damaged node, and scheduling is establishing a schedule for the passage and repair of the RC.
c Ω g c V b , c , t 0 g c = N n u m g c
l Ω f gc F l , t end gc = N f gc
t V l , c , t g c = 1      c Ω g c , l Ω f gc
t V l , c , t g c = N f gc      c Ω g c , l Ω f gc
F l , t d gc = t = t 0 t d V l , c , t g c      t d N T    c Ω g c ,   l Ω f gc
V l , c , t g c + η = 1 t l , k , t c r e , t r a V k , c , t + T g c + η g c 1      c Ω g c ,   l , k Ω f gc
where V l , c , t g c is the 0–1 state variable of the GRC arriving at the faulty branch l at time t. If the GRC arrives, V l , c , t g c is 1; otherwise, V l , c , t g c is 0. V b , c , t 0 g c is the 0–1 state variable for whether the GRC is located at base b at moment t 0 . Ω g c denotes the set of GRCs, and N n u m g c is the total number of GRCs. F l , t d g c denotes the 0–1 state variable of whether the faulty line l has an ordinary fault at the time. F l , t d g c is 1 if there is a fault and 0 otherwise. N f g c denotes the number of ordinary faulty lines. And Ω f g c denotes the set of ordinary faulty lines, which contains the set of severely faulty lines. N T denotes the disaster recovery period. T g c denote the time taken by the GRC to repair the faulty lines. t n , m , t m e s s , t r a denotes the road traveling time that the RC needs to experience from node l to node k at time t, and CTM calculates its value.
Equation (12) indicates that the GRC starts from the base, and Equation (13) demonstrates that all ordinary faulty lines are eventually repaired. Equations (14) and (15) indicate that ordinary faulty lines are visited by the GRC only once. Equation (16) represents the logical relationship between the arrival of the repair team at the faulty line and the fault state. After the repair team arrives at the faulty line and stays for a time T g c , the fault repair is completed. Equation (17) denotes the time required for the interval between the previous faulted line l reached by the emergency repair team and the next faulted line k reached by the emergency repair team, including the fault repair and passage time. Constraints (13)–(16) ensure that the GRC reaches all failure points and participates in repairs. Constraint (17) ensures that the GRC needs to experience road traveling time when transferring between different failure points.
(2)
The constraints of SRC are as follows:
Some serious faults cannot be completed by the GRC repair alone, requiring a second repair team. In this study, we refer to them as senior repair crews, and we assume that the GRC first repairs a severe fault and then continues with the SRC to complete the fault repair. Like the GRC, the SRC has scheduling, time, and collaboration constraints for the different teams.
c Ω s c V b , c , t 0 s c = N n u m s c
l Ω f s c F l , t end s c = N f s c      c Ω s c
t V l , c , t s c = 1      l Ω f sc ,   c Ω s c
t V l , c , t s c = N f s c      l Ω f sc , c Ω s c
F l , t d s c = t = t 0 t d V l , c , t s c    t d N T    l Ω f sc , c Ω s c
V l , c , t s c + η = 1 t b , k , t c r e , t r a V k , c , t + T s c + η s c 1      l , k Ω f sc    c Ω s c
V l , c , t s s c t = t 0 t d V l , c r , t g c      t d N T      t d t 0      l Ω f sc      c Ω s c      c r Ω g c      t s t d + t b , k , t c r e , t r a
where V l , c , t s c is the 0–1 state variable of SRCs arriving at the faulted line l at time t. If it arrives, V l , c , t s c is 1; otherwise, V l , c , t s c is 0. V b , c , t 0 s c is the 0–1 state variable for whether the SRC is located at base b at moment t 0 . Ω s c denotes the set of SRCs, and N n u m s c is the total number of SRCs. F l , t d s c denotes the 0–1 state variable of whether there is a serious fault on the faulted line l at time t d . If there is a fault, F l , t d s c is 1; otherwise, F l , t d s c is 0. N f s c denotes the number of severe faulted lines, and Ω f s c denotes the set of severely faulted lines with Ω f s c Ω f g c . T s c denotes the time spent by the SRC in repairing the faulted lines, and t b , k , t c r e , t r a denotes the passage time of an arbitrary repair team from the base depot b to faulted line k. The starting point for the SRC is always the warehouse and may not be transferred between failure points.
Equation (18) denotes that all SRCs start from the base and Equation (19) to all severely faulty lines being eventually repaired. Equations (20) and (21) indicate that the severely faulty lines must be visited by the SRCs once and only once. Equation (22) indicates the logical relationship between the arrival of SRCs at the faulty line and the faulty state. Equation (23) denotes the time needed to intervene between SRCs arriving at faulty line l and faulty line k, including the fault repair time and the time for the SRC to pass from the base depot to the faulty line. Large equipment has to be shipped separately from the warehouse for replacement. Equation (24) indicates that the SRC departs from the base depot only after the GRC arrives at the faulty line and confirms that it is a severe fault. The above constraints can see the main difference between SRCs and GRCs: each SRC dispatch is from the base. Only severe faults that the GRC has reached can be traveled by the SRC.
(3)
The logical constraints on fault recovery are as follows:
The GRC and SRC models are responsible for repairing all fault points one by one. However, for the overall model, a distinction must be made between repaired and unrepaired fault points at each moment. This is because only normal nodes are allowed to pass through. Normal faults can be marked as normal nodes after the GRC repairs them. Severe faults must be repaired by the GRC first, and then the SRC is dispatched to repair them before they can be marked as normal nodes. The recovery task is completed when all the faults are marked as normal.
F l , t F l , t gc + F l , t s c 1      l N f gc
F l , t F l , t gc      l N f gc
F l , t F l , t s c      l N f gc
T f a u l t = t l F l , t      l N f gc
α l = t = t 0 t d F l , t      t d N T      l N f gc
where F l , t denotes the 0–1 state variable of whether there is any fault on faulty line l at moment t, and 1 indicates a fault on the faulty line; otherwise, F l , t is 0. α l denotes the 0–1 state variable of the connectivity of line l of the distribution network, and 1 indicates that line l is connected; otherwise, it is disconnected. Equations (25)–(27) indicate the logical relationship between the ordinary faults and severe fault pairs. The line restoration is complete when no type of fault exists on the line. Equation (28) represents the equivalent variable for calculating the time to restore the faulty line. This is because F l , t marks the presence or absence of a fault at each moment, and a “1” indicates the presence of a fault. Adding up the F l , t will tell us the sum of the times the fault was present. Equation (29) describes the relationship between the faulted line connectivity and the restoration state.

4.2.3. The Stationary Energy Storage System and Diesel Generator

The MESS, GRC, and SRC are movable and require the establishment of routing and power constraints. In contrast, the SESS and DEG are immovable and have only power constraints.
The SESS model constraints are mainly charging and discharging power and energy storage capacity constraints.
0 P E S i , t ch P E S , E , max x E S i , t ch 0 P E S i , t d i s P E S , E , max x E S i , t d i s
x E S i , t ch + x E S i , t d i s 1
S E S min S E S i , t S E S max
S E S i , t = S E S i , t 1 + ( P E S i , t 1 ch η E S ch P E S i , t 1 d i s η E S d i s )
where E S i N E S is the set of nodes accessing the SESS. P E S , E , m a x is the rated charging and discharging power of the SESS. P E S i , t c h and P E S i , t d i s are the charging power and discharging power of the SESS at the moment t. x E S i , t c h and x E S i , t d i s are the 0–1 variables of the charging and discharging states of the SESS. When the SESS is charged, x E S i , t c h = 1 , x E S i , t d i s = 0 , and when it is discharged, x E S i , t d i s = 1 ,   x E S i , t c h = 0 . S E S i , t is the capacity of the SESS at time t. S E S m i n and S E S m a x are the minimum and maximum values of the capacity. η E S c h and η E S d i s   are the charging and discharging efficiencies, respectively.
Equation (30) is the limit value of the charging and discharging power of the energy storage, and Equations (31)–(33) are the charging and discharging state, capacity, and charging state constraints of the energy storage, respectively.
The constraints of DEGs are as follows:
P DE min P DE i , t P DE max
0 S DE i , t S DE max
S DE i , t 0 = S DE max
S DE i , t = S DE i , t 1 P DE i , t 1
where D E i N D E is the set of nodes connected to the DEG. P D E i , t is the output power of the DEG obtained by node D E i at moment t. P D E m i n and P D E m a x are the output power limits of the DEG. t 0 is the initial moment of the fault recovery. S D E m a x is the installed capacity of the DEG. S D E i , t is the capacity of the diesel generator at moment t.
Similarly, Equations (34) and (35) represent the DEG constraints regarding power and capacity. Equation (36) indicates that the capacity at the initial moment is the upper limit of the DEG discharge. Equation (36) indicates that the current remaining capacity is the remaining capacity of the previous moment minus the output of the previous moment.

4.2.4. Current Constraints and Network Reconfiguration in Distribution Networks

The above constraints only constrain the power and capacity of the emergency power sources. Regardless of whether they are connected to the network, the system should always follow the trending constraints. For the radial topological constraints of the distribution network, the DistFlow model is used to obtain the distribution network trend equations based on the network flow form. Because the distribution network line connectivity is a 0–1 state variable denoted by α l , we use the big M method to transform the nonlinear terms in the DistFlow [76,77].
P m DG P m L + P m Lcld = ( m , n ) E P m n ( n , g ) E P m k ( n , m ) E R m n I m n sqr
Q n DG Q n L Q n Lcld = ( n , m ) E Q n m ( m , g ) E Q m g ( n , m ) E X m n I m n sqr
U n sqr U m sqr 2 R n m P n m + X n m Q n m R n m 2 + X n m 2 P n m 2 + Q n m 2 U n sqr + 1 α n m M
U n sqr U m sqr 2 R n m P n m + X n m Q n m R n m 2 + X n m 2 P n m 2 + Q n m 2 U n sqr 1 α n m M
U n , min sqr U n sqr U n , max sqr
0 I n m sqr α n m I n m , max sqr
2 P n m 2 Q n m I n m sqr U n sqq 2 I n m sqr + U n sqr
where P m DG , P m L ,   P m L c l d , P m n ,     P m k ,    R m n I m n s q r are the distributed active output, active load, active cut load, m-node-injected active power, node outflow active power, and active line loss, respectively. Q n D G , Q n L , Q n L c l d , Q n m , Q m g ,   X m n I m n s q r are the distributed reactive power output, reactive load, reactive cut load, m-node-injected reactive power, node outflow reactive power, and reactive line loss. U n s q r , I n m s q r denote the square of the voltage and the current at node n, respectively.
The nonlinear equation constraints of Equations (40) and (41) are non-convex, so they are relaxed with respect to the inequality constraints shown in the above equations. Moreover, the big M method added to the model can introduce 0–1 state variables representing the connectivity state of the line. Equations (42) and (43) represent the upper and lower voltage–current limits. Equation (44) is the voltage–current–power relationship equation after relaxing the quadratic constraints [16].
Adding a distributed power supply requires the network reconstruction and island division of the faulty distribution network. At the same time, the network needs to maintain radial topology constraints, so this study introduces a virtual power flow for the constraints [78].
α n m = N B S n st
S n m p b S g n p b = S n p 1
M S n st S n p M S n st
M S n st S n m p b M S n st
where N B is the total number of nodes in the distribution network. S n s t is the 0–1 state variable of the virtual source node. S n m P b and S n P are the virtual power of the line and node, respectively. Islanding requires self-sufficient power sources that are replaced by virtual source nodes. The above equation provides the constraints of the virtual power and virtual source nodes for islanding.

5. Case Studies

In this section, a coupled grid road network system is created for simulation to verify the validity of the proposed model. The model is divided into two components: firstly, the CTM model, which simulates the congestion, clearance, and road damage that occurs on the roads after the rainstorm, reflected in the change in the road access time elapsed. Then, various types of post-disaster recovery resources are required to simulate the MESS, SESS, and DEG to power the outage nodes of the system and to simulate how the MESS, GRC, and SRC choose their travel routes to their destinations. The key to simulation for the MESS, GRC, and SRC is that the CTM can provide the optimal route to be trusted. At the same time, a repair model that distinguishes between the GRC and SRC can more realistically reflect the fault repair process in practice.
The model contains integer decision variables and continuous variables, the objective function is convex, and some constraints are second-order cone constraints, so the overall model behaves as a Mixed-Integer second-order code programming (MLSOCP) model. This model type is mostly solved using commercial solvers, such as GUROBI or CPLEX, and the results can be obtained conveniently. This paper solves this problem using YALMIP-GUROBI 9.7 based on the MATLAB R2019 platform.

5.1. Simulation Parameters

5.1.1. Distribution Network Parameters

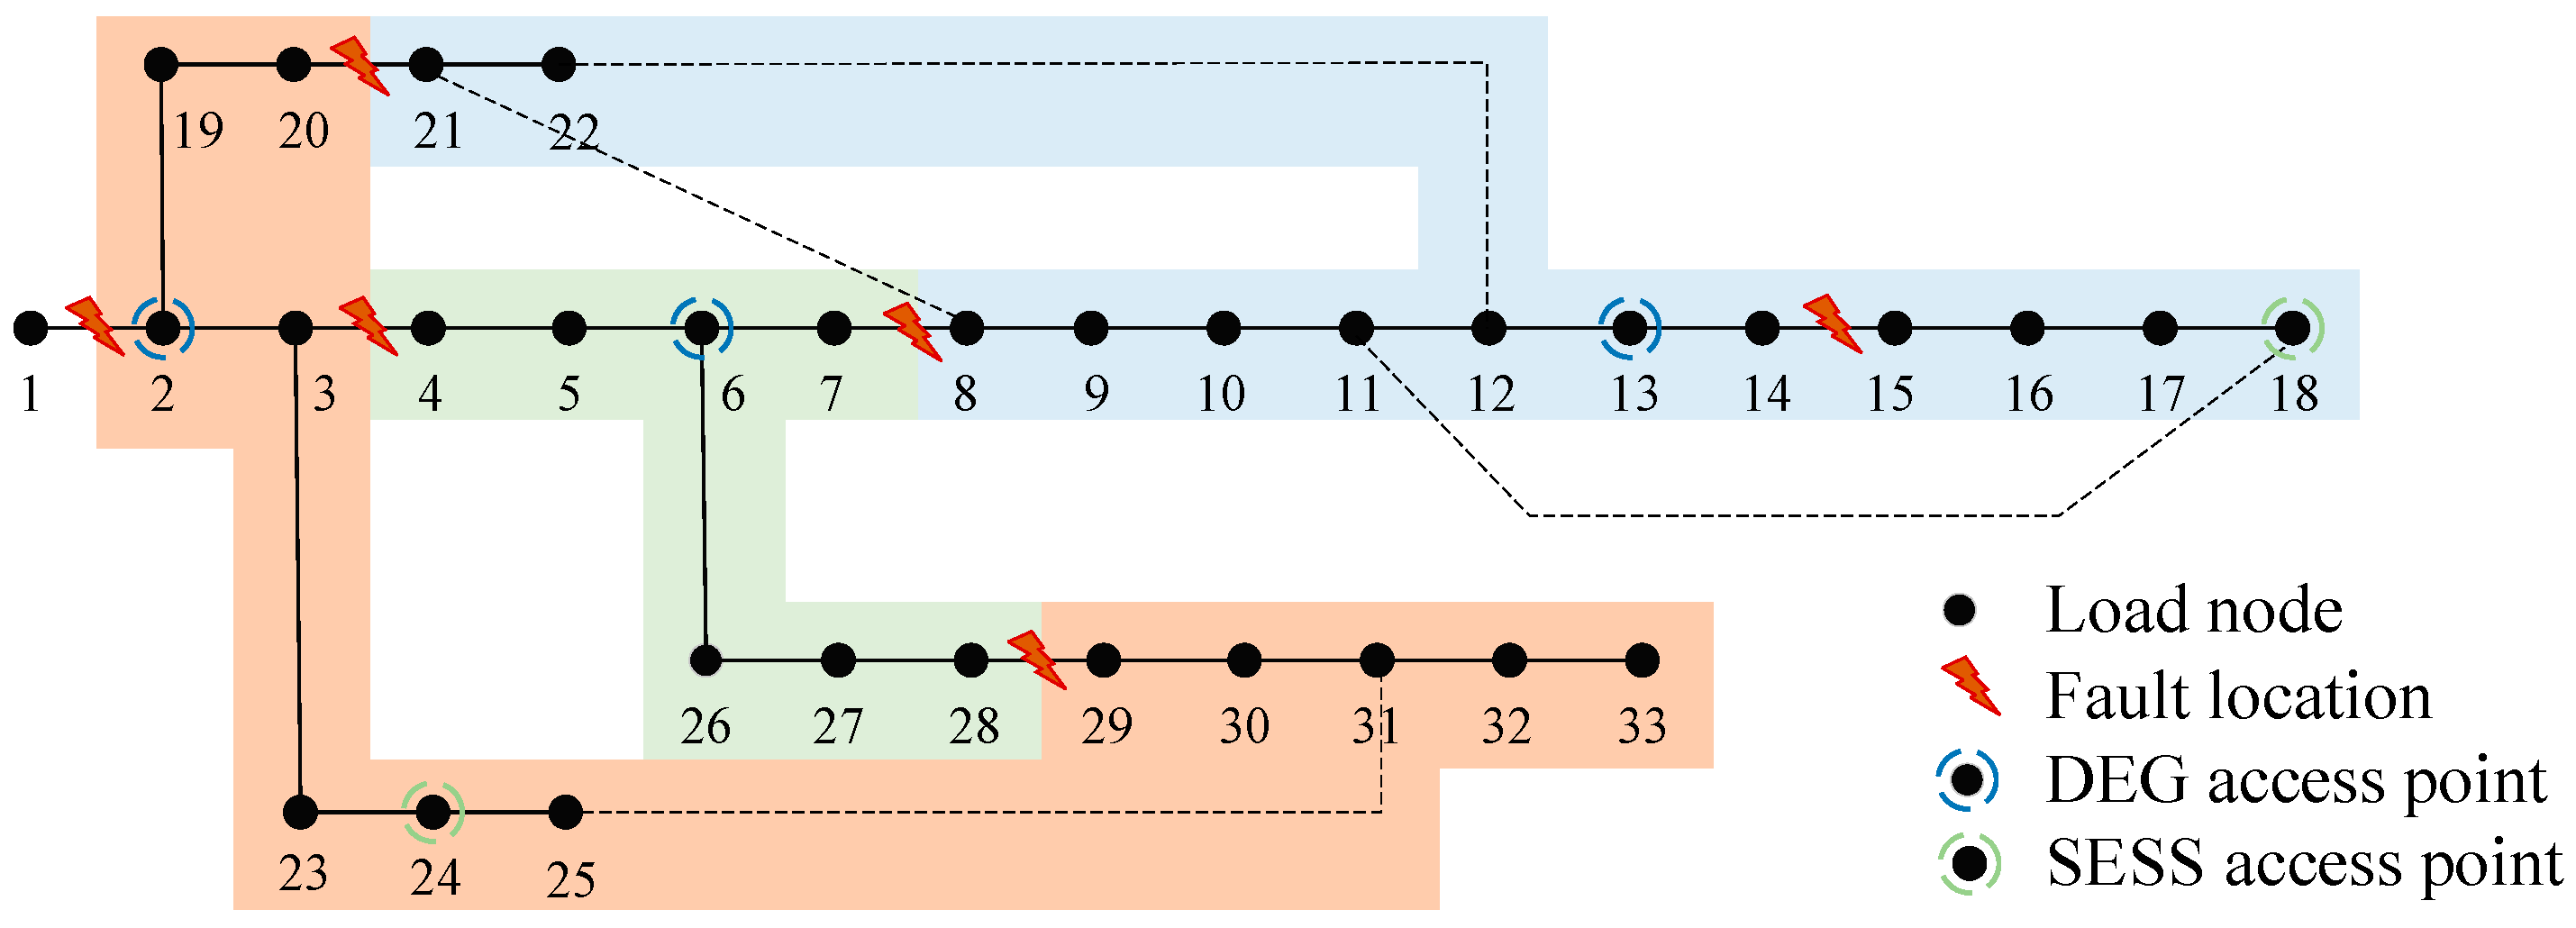
The distribution simulation uses an improved IEEE 33-node distribution network with a rated voltage of 12.66 kV. The nodes are categorized into primary, secondary, and tertiary loads weighing 100, 10, and 1, respectively. The parameters of each node are the generalized network parameters. The network is set with six system faults, which are lines f1: 1–2, f2: 3–4, f3: 7–8, f4: 14–15, f5: 20–21, and f6: 28–29, of which, lines f5 and f6 are serious faults, and f1-f4 are ordinary faults, as shown in Figure 3.

5.1.2. Road Network Parameters

The road network is a modified 33-node road network [79], corresponding to 33 road intersections and 104 road segments. All roads are set up with two lanes of traffic in both directions, and signal lights are set up at intersections. The road network model is modeled and simulated using the CTM. The required parameters of the CTM are shown in Table 1.
The input flow rate refers to the number of vehicles entering a downstream metacell from an upstream metacell. The output flow rate refers to the exit flow rate to all input flows. Changing the input and output flow rates will affect the upstream and downstream cells. For example, an entire downstream cell will cause the upstream output flow rate to decrease, thus creating congestion. The values of these parameters come from the collection of actual road traffic conditions. Based on the above parameters, the average 24 h congestion index for all roads is obtained by adjusting the input flow rate at the right time according to the city travel data reference. In the post-disaster phase of a rainstorm, a lower free-flow speed and saturation flow rate can simulate the low capacity due to the low speed and long distance between vehicles on the road after a rainstorm. Road improvement can be simulated as the free speed and the saturation flow rate increase. Increasing the input flow rate for the input cell can simulate the increasing number of vehicles during the peak commuting period. Among them, the congestion index is the ratio of the actual traveling time to the unimpeded traveling time, and the larger the congestion index is, the more congested the traffic is.
The CTM simulation step is 10 s, the simulation period is 120 s, and the total simulation time is 86,400 s, i.e., 24 h. The time resolution of the fault recovery model simulation is 30 min, and as a time unit of the resulting output, the time scale of 24 h is noted as moment 1–48. The time of all simulation results in this study is expressed as moment 1 to moment 48. The simulated time scene at the initial moment 1 of this model is 05:00.

5.1.3. Distribution Network Fault Recovery Resources

The system sets two MESSs, three DEGs, and two SESSs. The distribution location is shown in Figure 3, and the related parameters are shown in Table 2. One GRC and one SRC are set up, and each team’s repair time for each fault is one hour. Ordinary faults can be restored after repair by the GRC, and severely faulty nodes can be restored only after GRC and SRC repairs.

5.2. Fault Scenarios

The setting of model parameters. To simulate road congestion after heavy rainfall, according to the literature [56] on the impact of rainfall on traffic movement, this paper sets λ 1 = 0.73 ,   λ 2 = 0.82 in the CTM.
The primary optimization objective of the model is to achieve MAX( t i w i p i , t ) , subject to all constraints. To satisfy this basic objective, T f a u l t is made to take the minimum value to shorten the repair time. Therefore, this paper combines the two optimization objectives by setting weights, and MAX( t i w i p i , t ) is required to be the primary optimization objective. It is found that setting an enormous value ( λ o b j > 0.95 ) for λ o b j gives priority to satisfying the main objective, while constraining T f a u l t to be minimal. In this paper, we take λ o b j = 0.98.
The main simulation scenario is set up according to the model proposed in this study. Two comparison scenarios are set to compare and analyze the simulation results to verify the necessity. The characteristics of each scenario can be seen in Table 3.
Scenario 1: Emulates the main scenario. To simulate the collaboration requirement of the GRC and SRC, this study sets the fault types of the distribution network, including ordinary and severe faults. This study makes three lanes impassable to simulate some roadway obstacles caused by localized waterlogging.
Scenario 2: Compare the scenes. To compare the impact of the impassability of some roads on the progress of post-disaster recovery, we set all roads as passable, and other parameters are the same as in Scenario 1.
Scenario 3: Compare the scenes. All faults in Scenario 1 are set to be repaired by the GRC only to compare the impact of the joint GRC and SRC repair on the progress of fault recovery, and other parameters are the same as in Scenario 1.

5.3. Analysis of Result

5.3.1. Post-Disaster Fault Recovery Considering Transportation Access Barriers and Joint Repair Team Needs

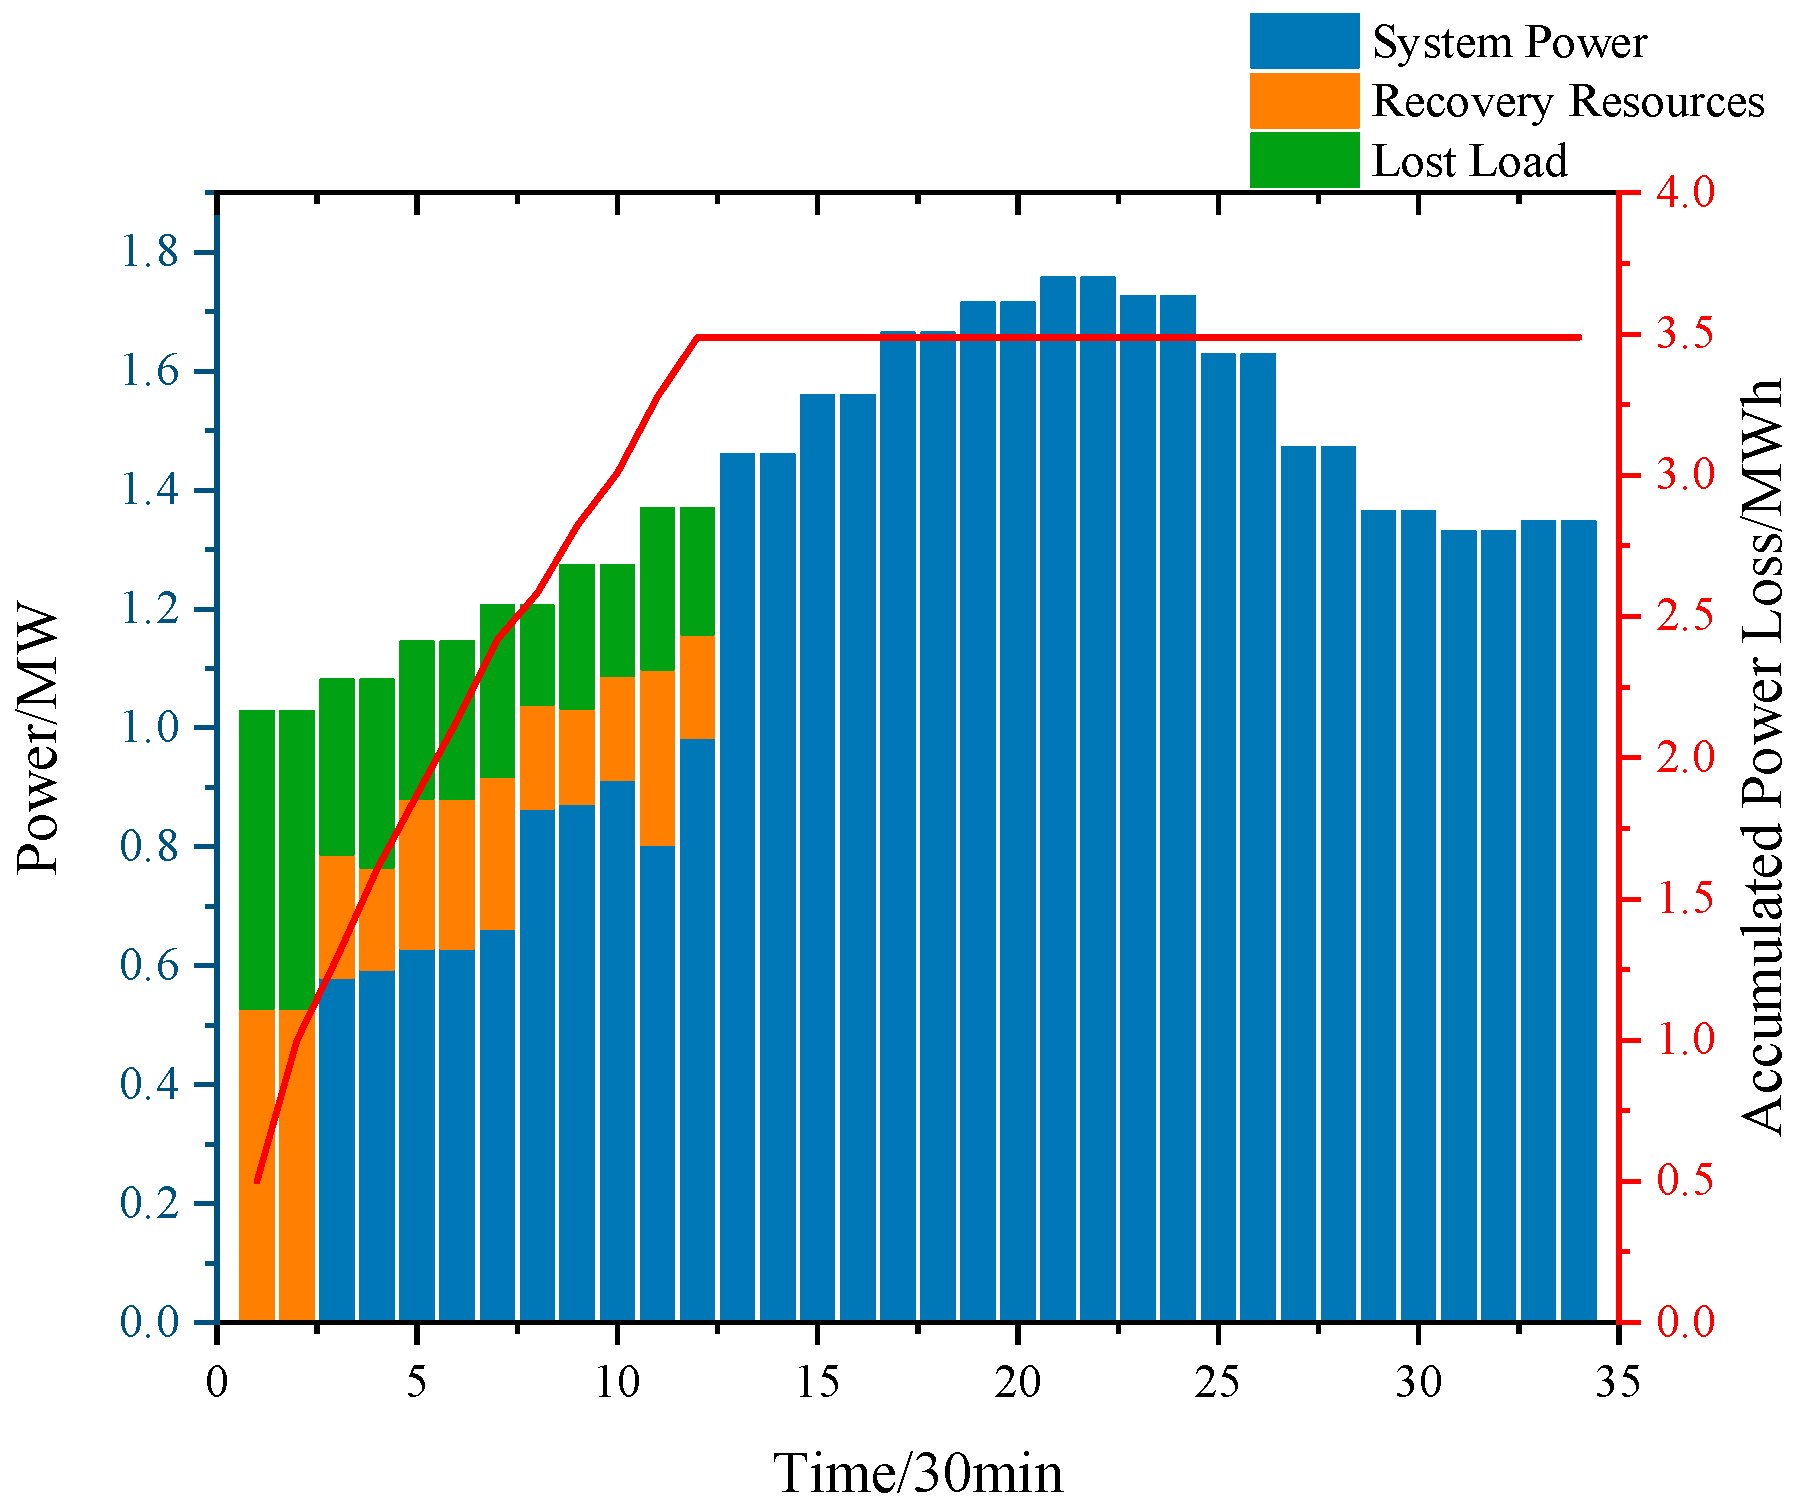
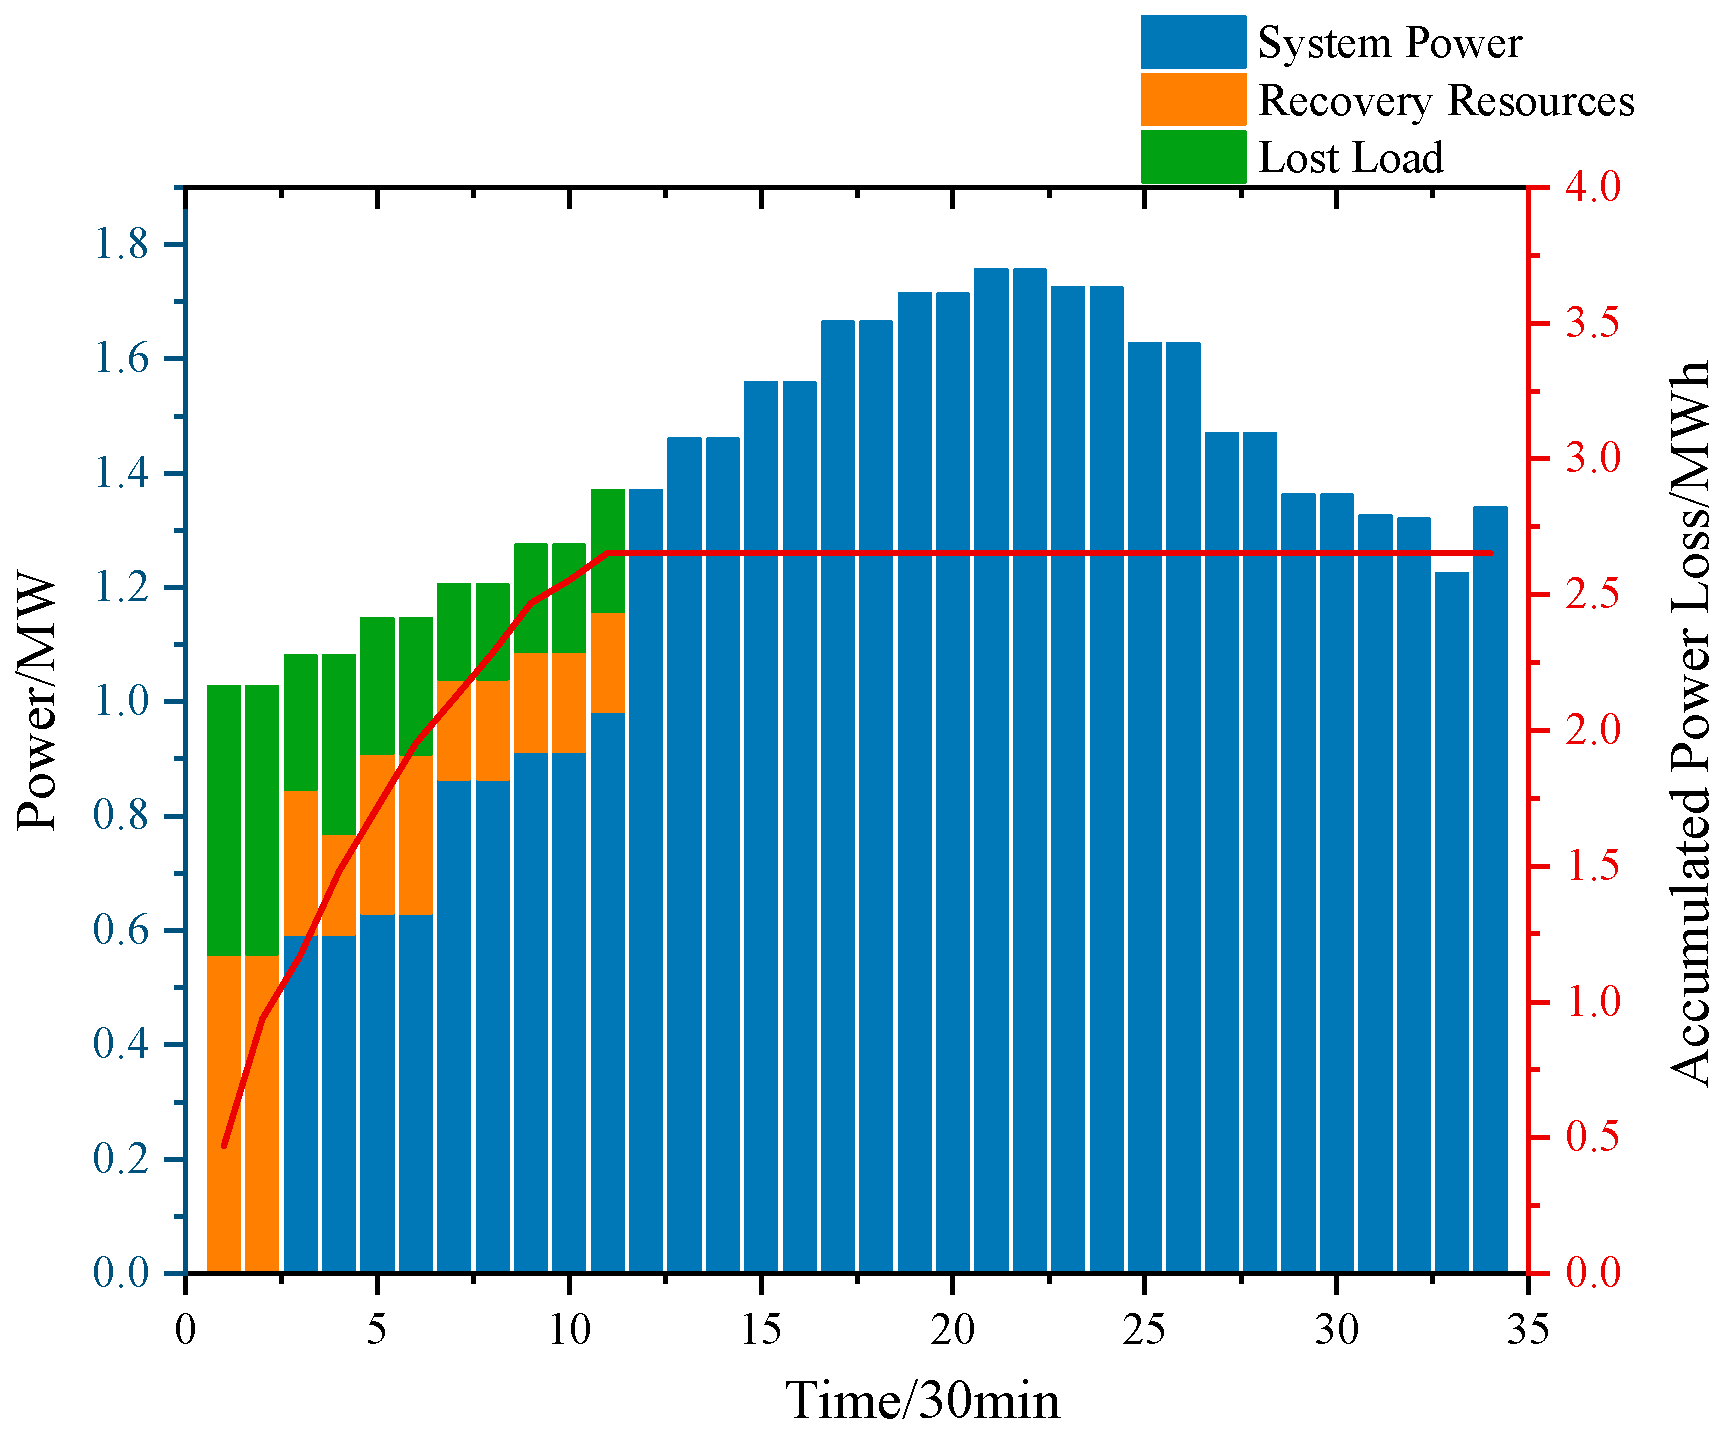
There are six faults at the initial moment, dividing the grid into three islands. Starting from moment 1, the GRC, SRC, SESS, DEG, and MESS respond. After the intervention of the disaster recovery resources, the faulted lines are repaired sequentially, as shown in Table 4. The grid load changes during the restoration period are shown in Figure 4.
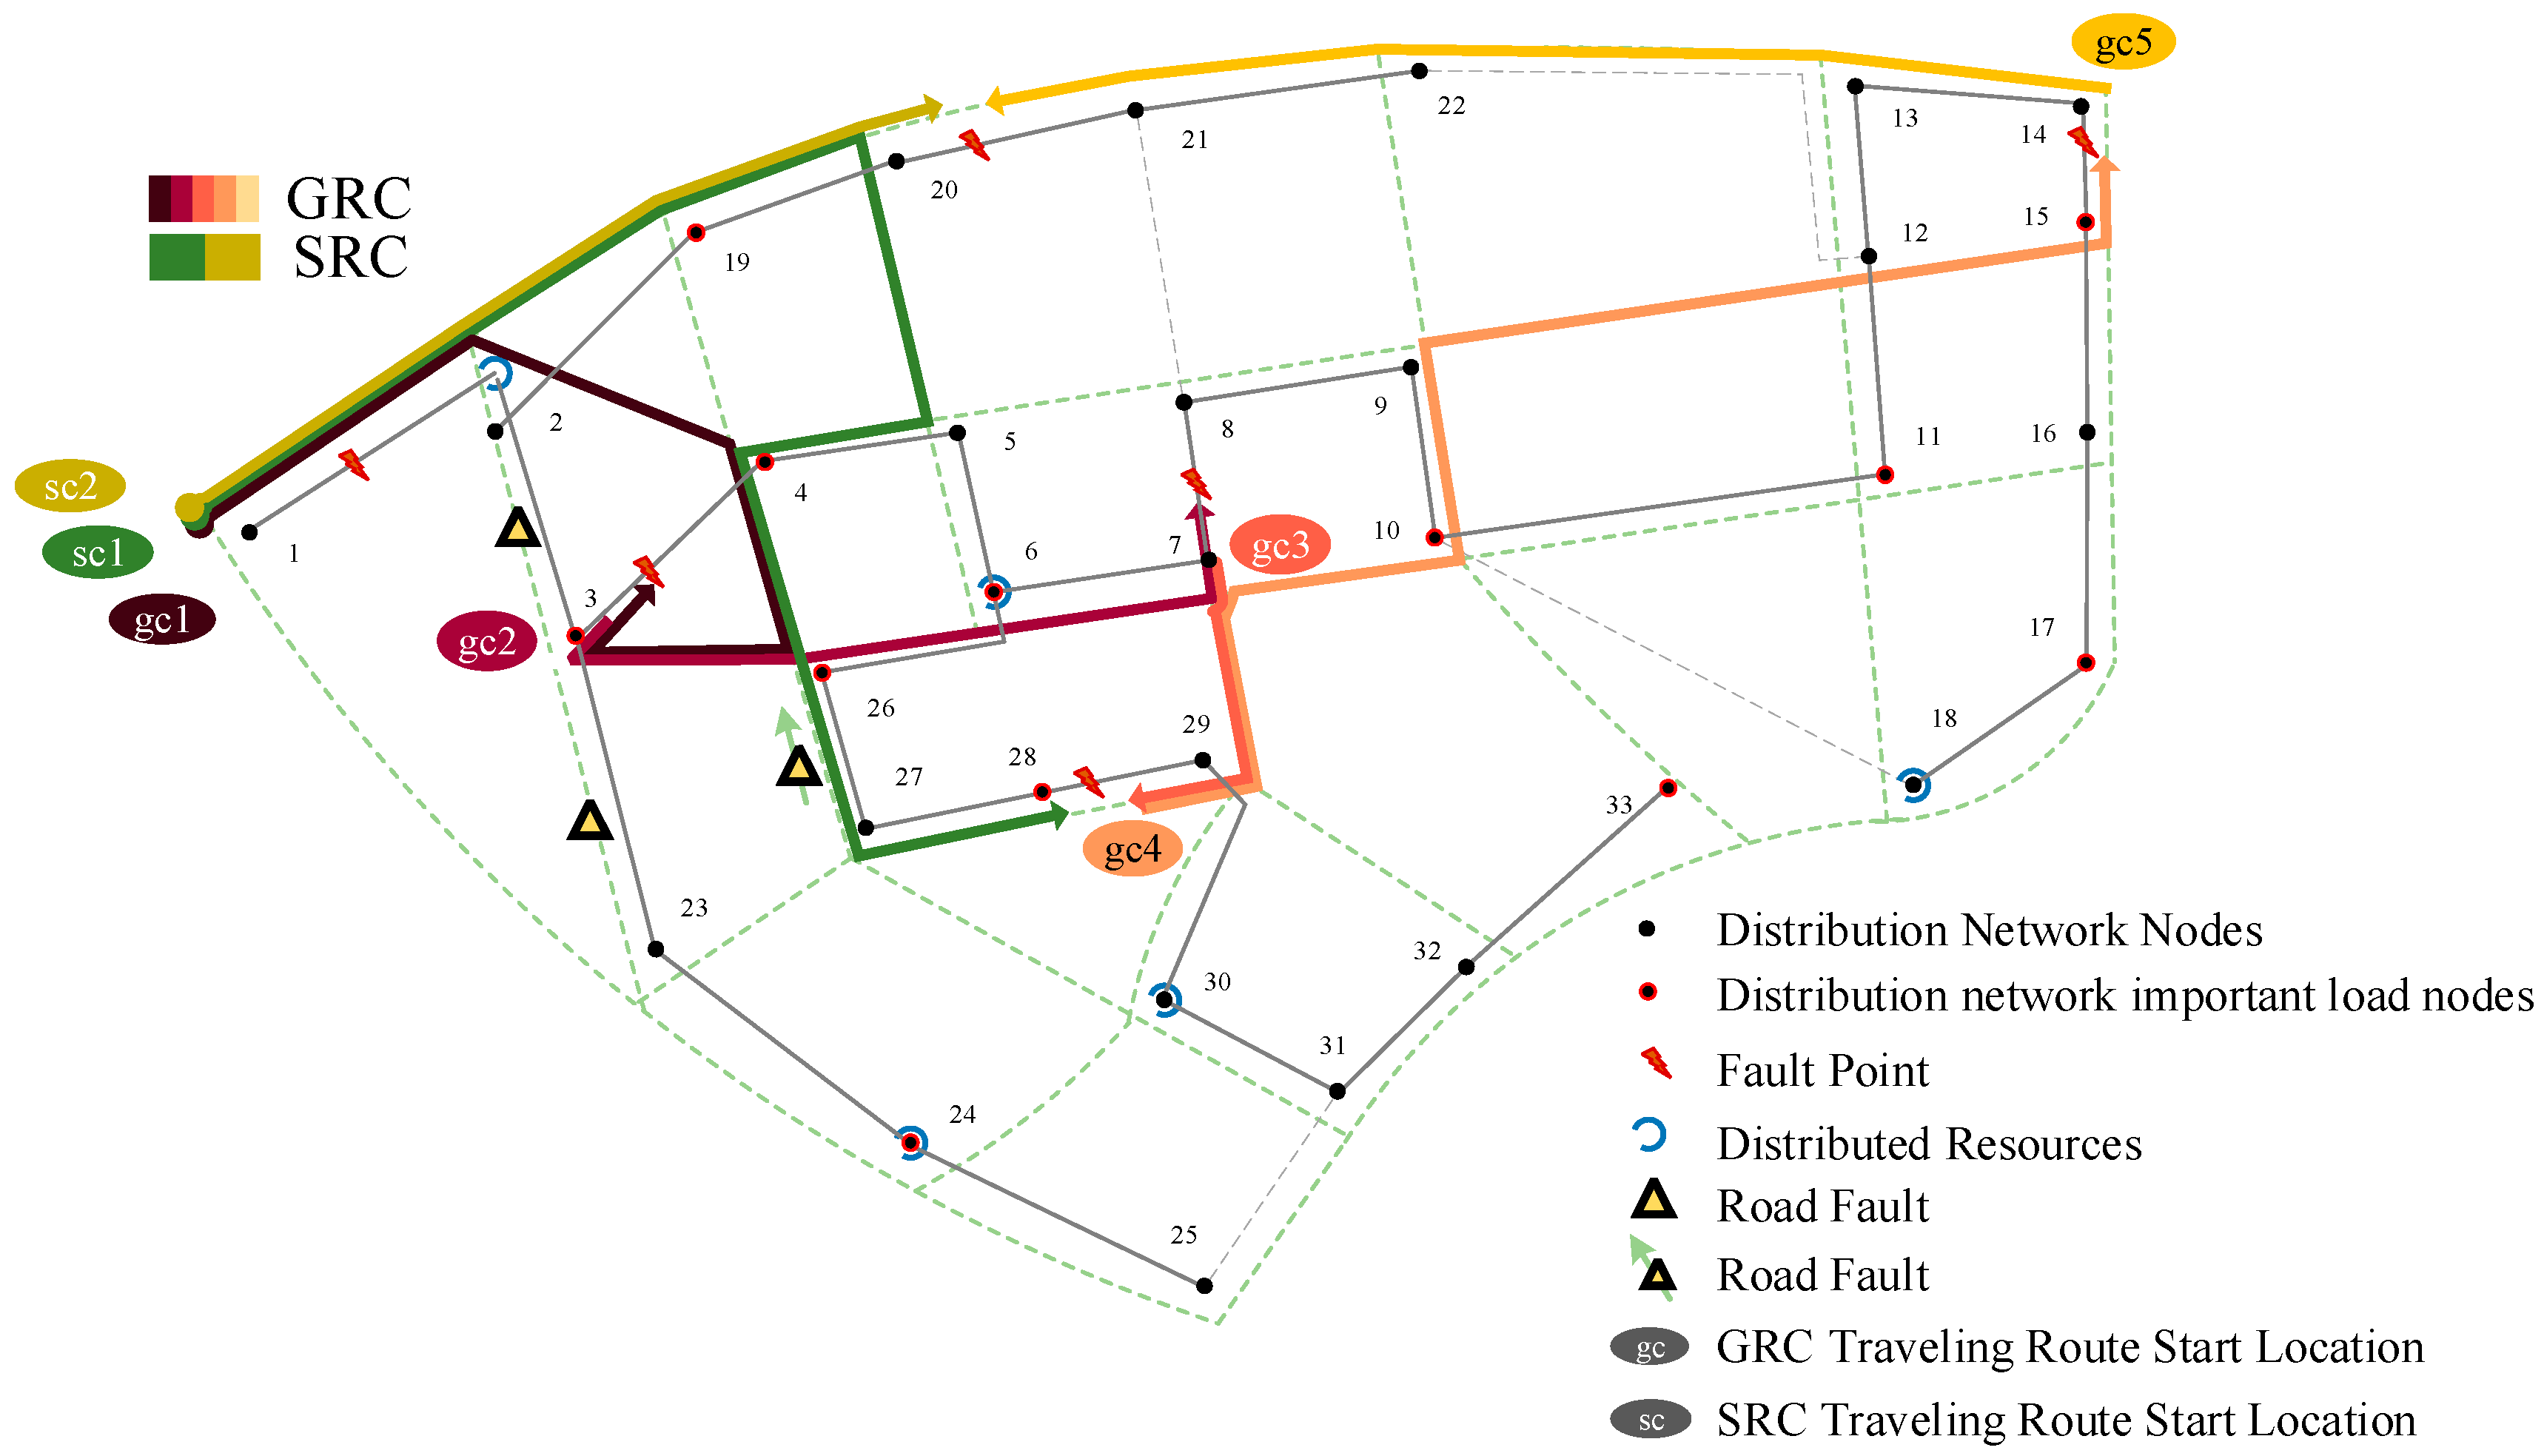
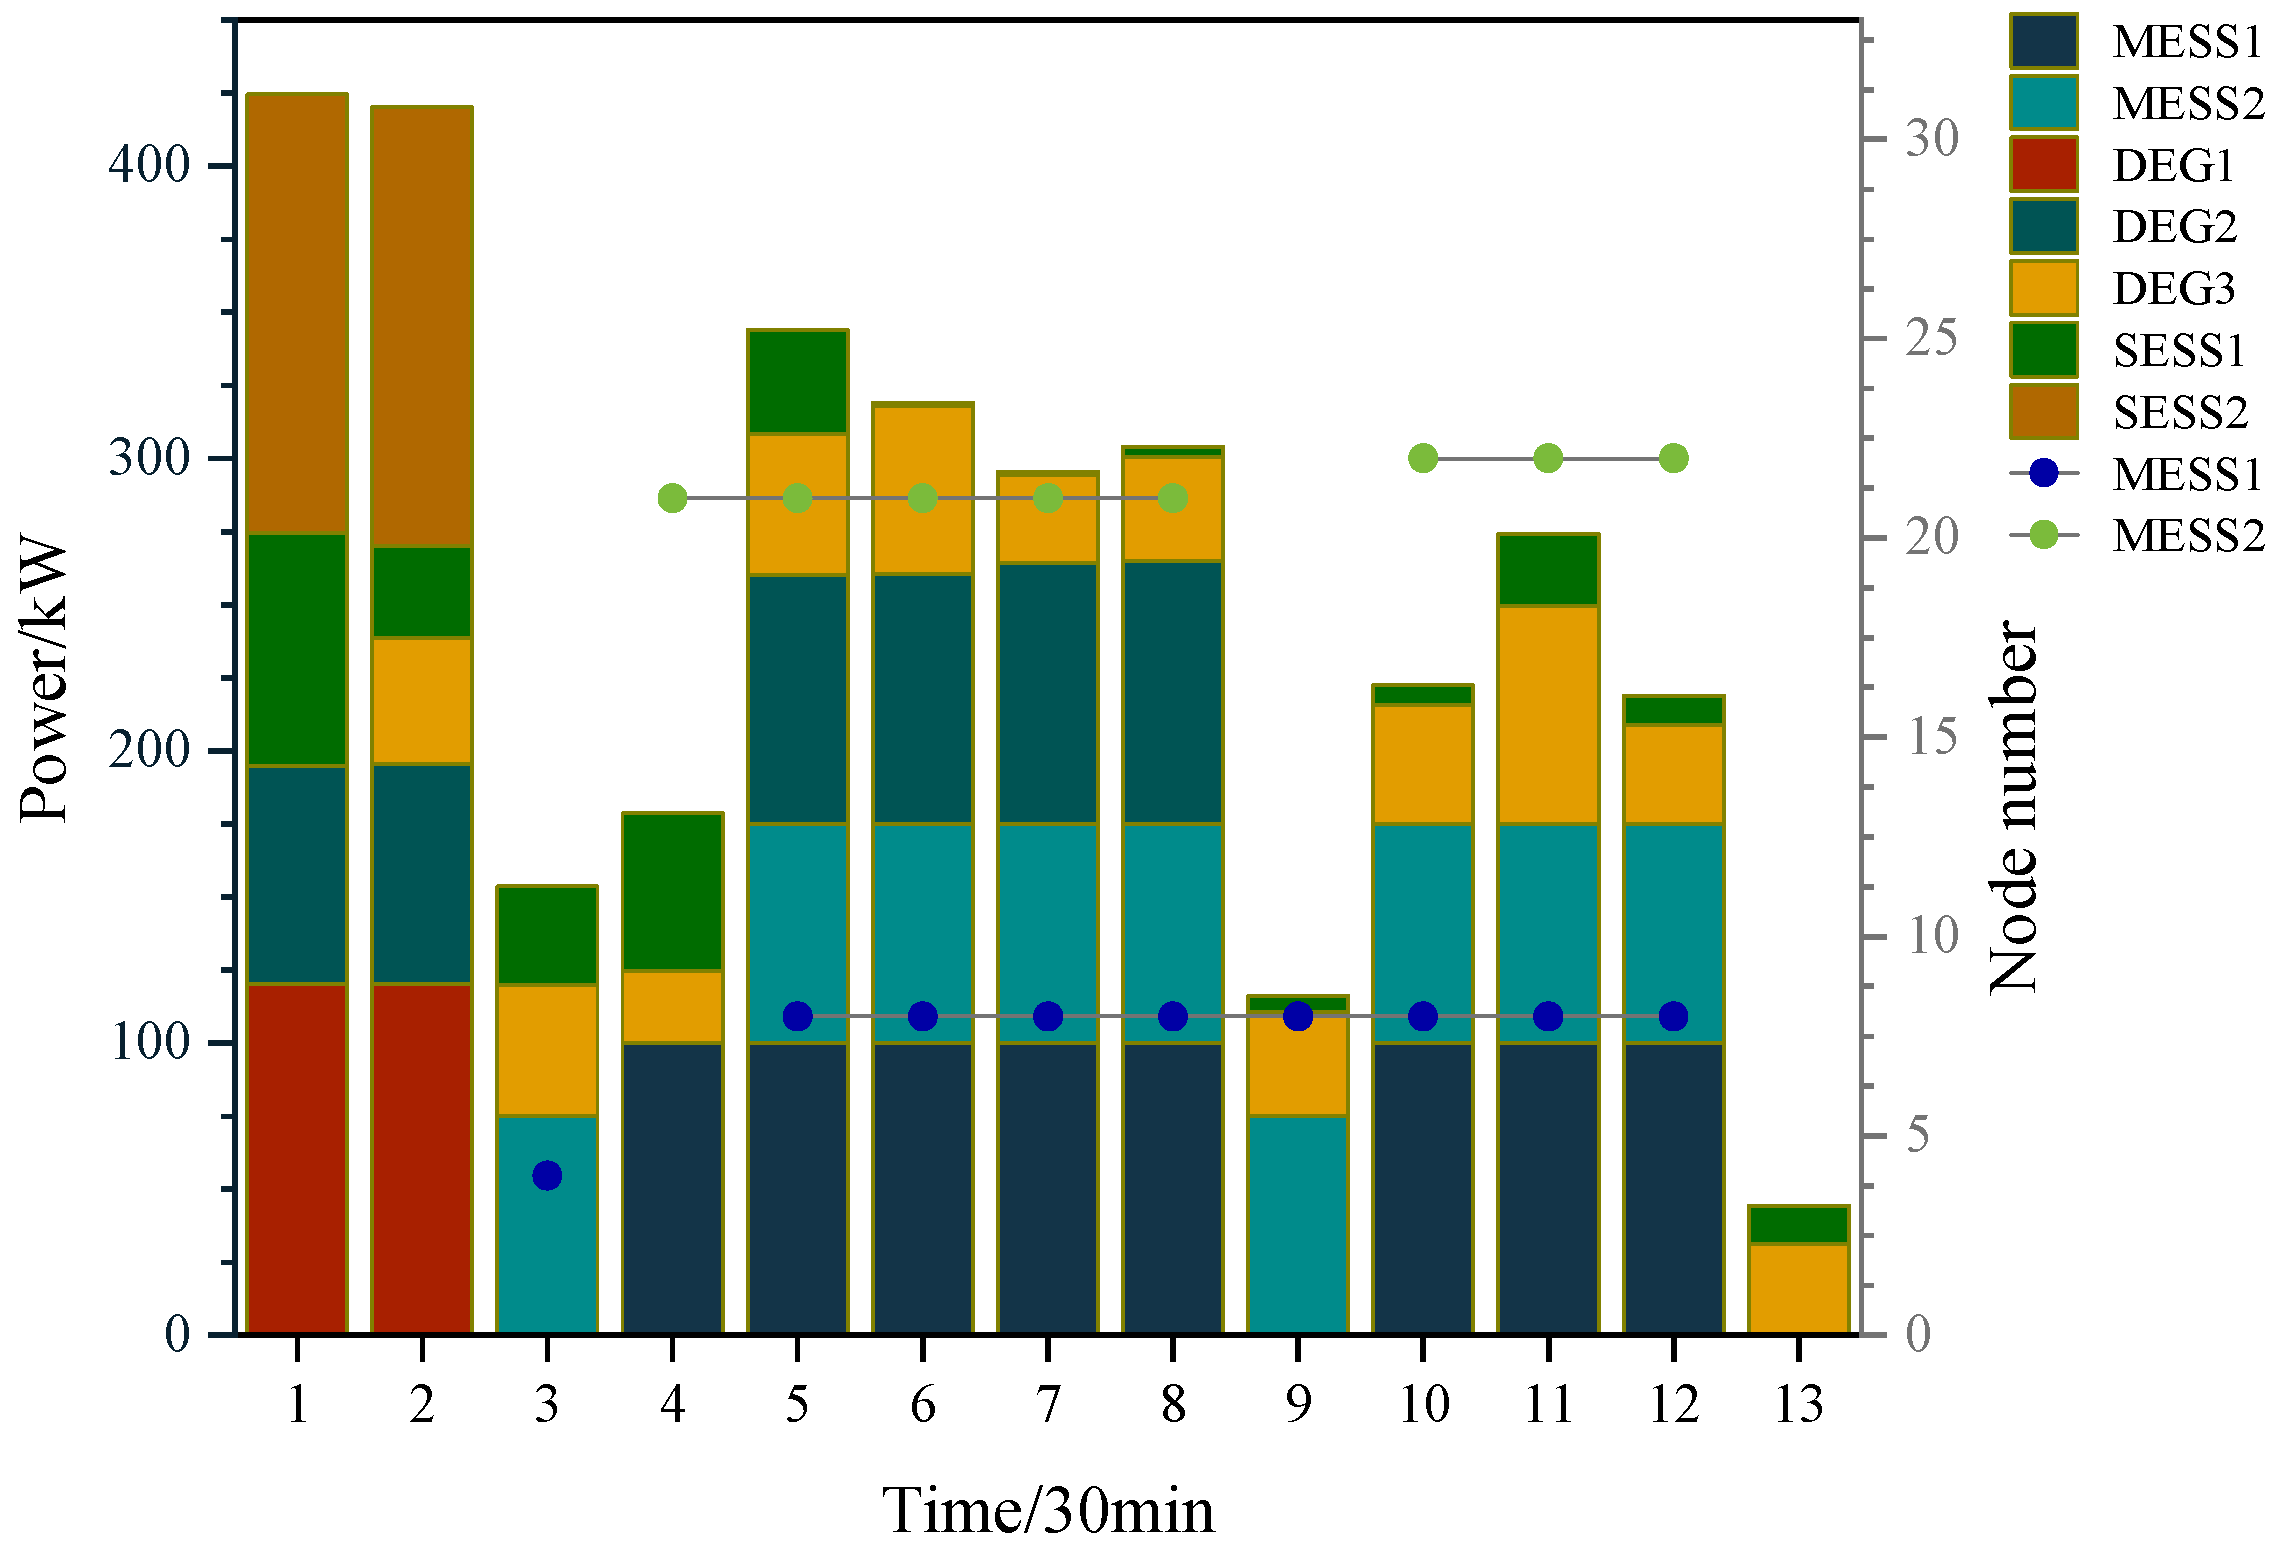
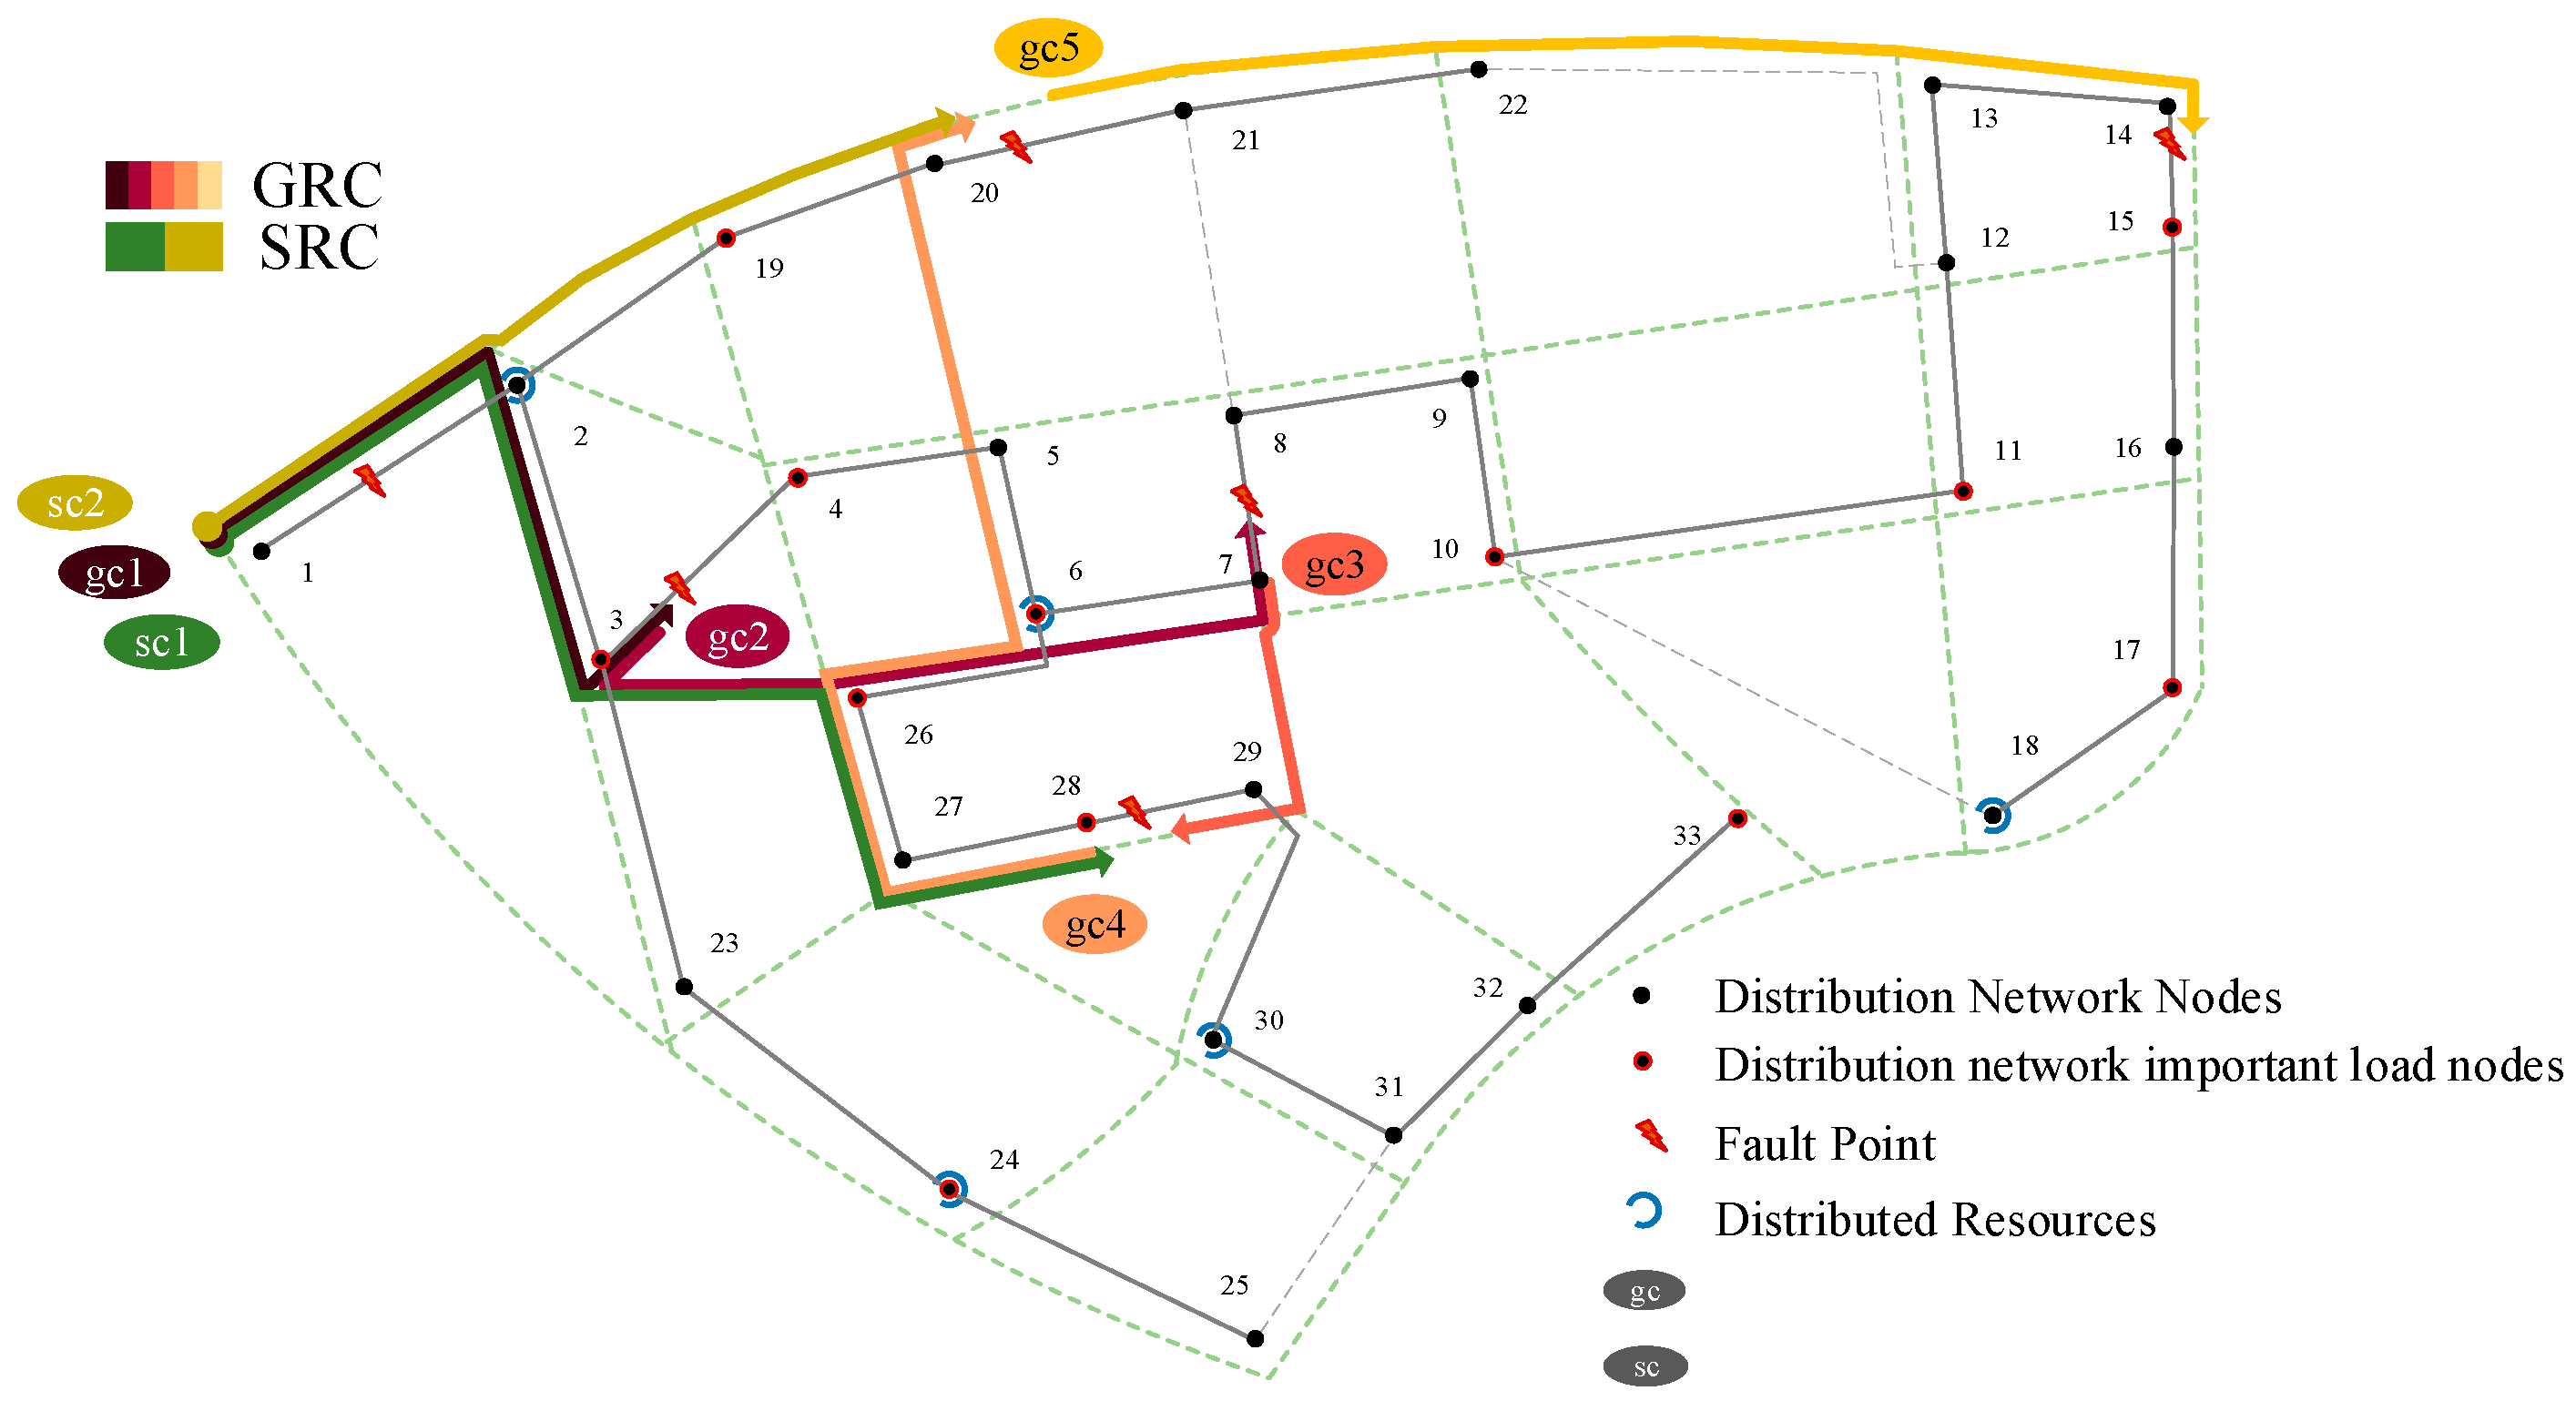
Figure 5 illustrates the GRC and SRC’s traveling routes. Figure 6 shows the discharge power of distributed resources and the MESS at each moment. In Figure 5, gc1~gc5 denote the traveling routes of the GRC for each trip based on chronological order. sc1 and sc2 denote the routes of the SRC from the base to f6 and f5, respectively. The dotted line graphs in Figure 6 indicate the node serial numbers accessed by MESS1 and MESS2 at a given moment. The bar graph represents the output power of the corresponding type of power supply at a specific moment.
At the beginning of the fault, owing to the line f1 fault disconnecting the entire network from the bus and losing the support of the higher grid, the system had more shortage loads, and the distribution and the MESS took many loads. At time 1, the GRC starts from node one and restores node one first. The distribution network restores the connection to a higher-level grid, and some nodes restore the system power supply. The system is still islanded, and the distribution and MESS provide power support to multiple nodes. The GRC then repairs lines f2 and f3 to achieve connectivity to all islands in the shortest possible time to mitigate the increasing loss of power loads that are difficult for emergency power resources to cope with. Figure 4 shows that, at moment 13, the system no longer has power loss nodes after lines f2 and f3 are connected. The system’s power loss load is 0, and the emergency power resources are withdrawn. However, the system still has unrepaired lost nodes. The GRC then repairs line f6 first so the SRC can take over the fault for in-depth repair.
Table 4 shows that severe faults f6 and f5 are scheduled to be repaired later in recovery because severe faults take longer to repair. In the same maintenance window, the program chooses to prioritize the repair of multiple common faults rather than a small number of severe faults, which results in more load recovery.
The flexible mobilities of MESS1 and MESS2 can access different islands. However, we can see from Figure 6 that both MESS1 and MESS2 have accessed only two nodes because, for the exact mileage of access, the access elapsed time in the early stage of the disaster (the initial time is 5 a.m., when road congestion is much less than at 8 a.m., during the morning rush hour) is relatively less. The elapsed access time will crowd out the discharging time of the MESS. Therefore, under the dynamic CTM, the MESS will arrive at the access location with a higher load deficit in the early stage of fault recovery to avoid access during traffic deterioration.

5.3.2. Recovery Scenarios Considering Only Traffic Barriers

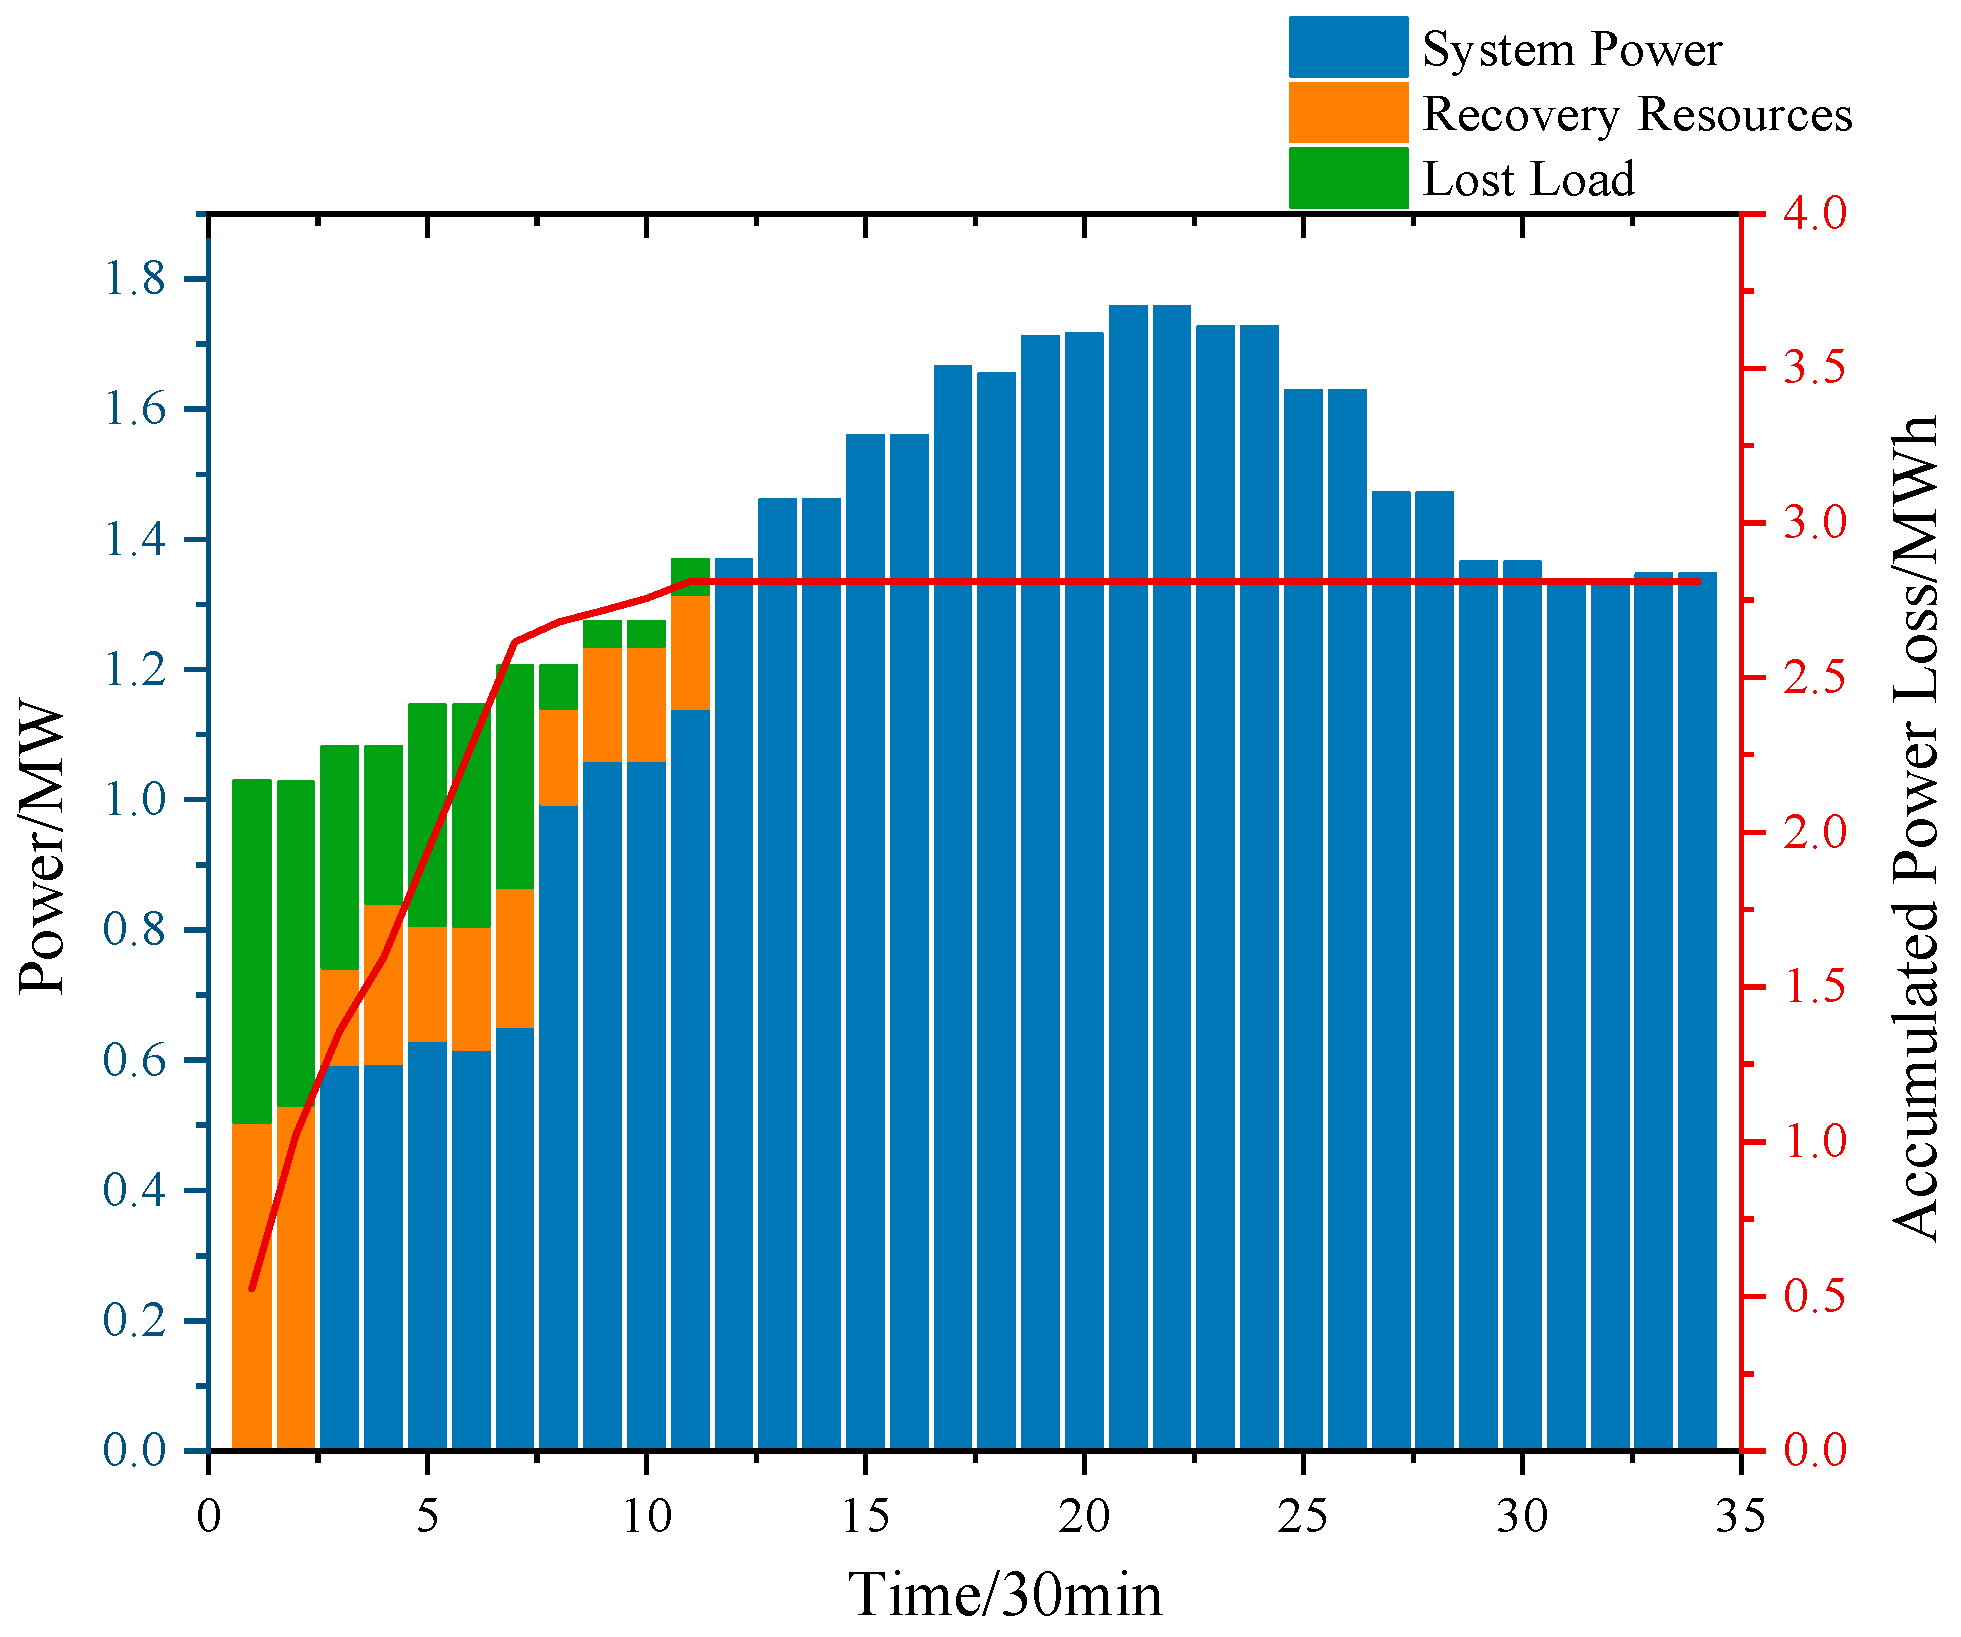
Scenario 2 indicates that the model cannot simulate road damage, and all roads are passable. Then, the simulation results of the fault restoration sequence are shown in Table 5. The load changes during fault restoration are shown in Figure 7. The fault restoration routes of the GRC and SRC are demonstrated in Figure 8.
As seen from Table 5 and Figure 7, the fault repair speed for Scenario 2 takes less time than Scenario 1; therefore, the simulation for Scenario 2 gives less total load loss. Firstly, the comparison between Scenarios 1 and 2 leads to the conclusion that the presence or absence of road damage significantly affects the fault repair progress and the total load loss. It can be seen from the traveling routes of the GRC and SRC in Figure 8 that the GRC and SRC in Scenario 1 detoured part of the road due to the road failure, accumulating an extra 47 km of traveling distance (the traveling distance for all the crews in Scenario 1 is 296 km, and the traveling distance for all the crews in Scenario 2 is 249 km), which is a non-negligible amount of traveling time.
Then, from the data results, Scenario 2 achieves better data performance than Scenario 1. However, we need to be clear that Scenario 2 ignores the actual situation of the road damage, and the simulation results of Scenario 2 are too optimistic compared to the actual situation. Although the data performance is good, it is inconsistent with the exact scenario, and the results are bound to have huge errors. Finally, in the actual engineering environment, if the RC traveled according to the simulation route in Scenario 2, they would encounter unexpected road impassability. They would have to turn back and re-plan the route, which would take longer and cause unnecessary delays.

5.3.3. Recovery Programs Considering Only the GRC

Scenario 3 indicates that the model dispatches only the GRC for all faults and assumes all faults can resume regular operation after GRC repair. Then, the fault repair sequence and moments are shown in Table 6. The system load changes during fault recovery are shown in Figure 9.
As seen from Table 6 and Figure 9, the recovery scenario of Scenario 3 advances the repair order of f5 and f6 after the repair requirements for severe failures f5 and f6 are reduced. This is because f5 and f6 incur more load loss due to failure than the nodes after their repair order. By comparing Scenario 3 with Scenario 1, we can see that the overall recovery time of the system in Scenario 3 is shorter. The islands were also eliminated earlier, corresponding to a minor cumulative load loss. Firstly, the fault requirements of the first and second repair teams can produce significant differences in the restoration task’s process (repair sequence) and the result (load loss). Second, although the simulation results of Scenario 3 are more optimistic, it ignores that it takes two teams to repair a severe failure point. Therefore, the simulation results of Scenario 3 are bound to have significant errors and do not accurately simulate the actual process and outcome of the restoration task.

5.3.4. The Significance of the Model Proposed in This Paper

Based on the discussion of the types of distribution network faults in the first section of this paper, in actual engineering, after the distribution network suffers from extreme rainstorm disasters, there are bound to be some serious faults, and these types of faults must be repaired by the cooperation of multiple maintenance teams to complete the construction. Road damage after extreme rainstorms also occurs sometimes. In this section, the above scenarios are simulated and compared, and it is found that severe failure repair and road damage do produce significant differences in the progress and outcome of the restoration task. The model proposed in this paper can accurately simulate these two working conditions, which is very important to provide an accurate reference for specifying an orderly and efficient rescue plan for the grid company. Predicting the possible duration of the restoration task and the damage caused can better coordinate with other rescue departments and reassure the customers in the outage area.
Although this paper only adds SRCs to the model, its mathematical model can cover multiple types of personnel, such as equipment replacement crews, engineering construction crews, and tree trimming crews. At the same time, the model assisted by the two maintenance teams can be similarly generalized to model the needs of multiple teams. On the other hand, although the background of this paper is extreme rainstorms, its nature is that there are damages and faults in the road to repair that demand multiple types of personnel, and these characteristics will also exist in other kinds of extreme weather scenarios. Therefore, this model also applies to scenarios of distribution network failures caused by different types of extreme weather.

6. Conclusions

In this study, a traffic network and distribution network fusion model describing road damage is first established to give the exact elapsed time of traffic access after extreme disasters. Based on this, an optimization scheme of mobile restoration resources facing the obstruction of traffic access in the post-disaster restoration of the distribution network is given. The extreme post-disaster restoration model of the distribution network considering road damage is established so that the simulation model is more in line with the complex characteristics of the actual restoration task. Then, this study establishes a joint repair model in which the ordinary and senior repair teams work together to meet the demand for multiple repair teams for some serious faults after a disaster. The necessity and effectiveness of the road damage and joint repair models are compared and verified, and the simulation results show a more conservative and robust recovery strategy, which is suitable for the multiple characteristic attributes of post-disaster fault recovery of distribution networks and the actual recovery needs.
The simulation of the proposed model shows that the scenarios of repairing severe faults and post-disaster road damage significantly affect the progress and outcome of the post-disaster recovery task of the distribution network. Although the restoration task is more time-consuming and causes load loss when considering these scenarios, this is more in line with the actual scenario characteristics and reduces the simulation error. The model in this paper can simulate conditions that occur in real projects well, thus providing more accurate and comprehensive reference suggestions and loss assessment for the restoration task through simulation.

Author Contributions

Conceptualization, W.L. and Q.X.; methodology, Y.Y.; software, W.L. and M.Q.; formal analysis, Y.Y.; investigation, Q.X.; resources, Q.X. and Y.Y.; data curation, W.L.; writing—original draft preparation, W.L.; writing—review and editing, W.L.; visualization, W.L.; supervision, W.L.; project administration, Q.X. All authors have read and agreed to the published version of the manuscript.

Funding

This research received no external funding.

Data Availability Statement

The data are contained within the paper.

Conflicts of Interest

All authors of this manuscript declare that the research was conducted in the absence of any commercial or financial relationships that could be construed as potential conflicts of interest.

Abbreviations

GRCGeneral Repair CrewMEGMobile Emergency Generator
SRCSenior Repair CrewMESSMobile Energy Storage
MESSMobile Energy Storage SystemEBElectric Buse
DGDistributed GenerationDEGDiesel Generator
EVElectric VehicleSESSStationary Energy Storage System
RCRepair CrewCTMCell Transmission Model
MPSMobile Power SourceLWRLighthill–Whitham–Richards

References

  1. Zhang, G.; Zhang, F.; Zhang, X.; Wu, Q.; Meng, K. A Multi-Disaster-Scenario Distributionally Robust Planning Model for Enhancing the Resilience of Distribution Systems. Int. J. Electr. Power Energy Syst. 2020, 122, 106161. [Google Scholar] [CrossRef]
  2. Pan, H.; Zhou, F.; Ma, Y.; Ma, Y.; Qiu, P.; Guo, J. Multiple Factors Coupling Probability Calculation Model of Transmission Line Ice-Shedding. Energies 2024, 17, 1208. [Google Scholar] [CrossRef]
  3. Jiang, R.; Wang, J.; Guan, Y. Robust Unit Commitment with Wind Power and Pumped Storage Hydro. IEEE Trans. Power Syst. 2012, 27, 800–810. [Google Scholar] [CrossRef]
  4. Wang, Y.; Chen, C.; Wang, J.; Baldick, R. Research on Resilience of Power Systems Under Natural Disasters—A Review. IEEE Trans. Power Syst. 2016, 31, 1604–1613. [Google Scholar] [CrossRef]
  5. Yuan, W.; Wang, J.; Qiu, F.; Chen, C.; Kang, C.; Zeng, B. Robust Optimization-Based Resilient Distribution Network Planning Against Natural Disasters. IEEE Trans. Smart Grid 2016, 7, 2817–2826. [Google Scholar] [CrossRef]
  6. Du, Y.; Liu, Y.; Wang, X.; Fang, J.; Sheng, G.; Jiang, X. Predicting Weather-Related Failure Risk in Distribution Systems Using Bayesian Neural Network. IEEE Trans. Smart Grid 2021, 12, 350–360. [Google Scholar] [CrossRef]
  7. Huang, G.; Wang, J.; Chen, C.; Qi, J.; Guo, C. Integration of Preventive and Emergency Responses for Power Grid Resilience Enhancement. IEEE Trans. Power Syst. 2017, 32, 4451–4463. [Google Scholar] [CrossRef]
  8. Poudel, S.; Dubey, A. Critical Load Restoration Using Distributed Energy Resources for Resilient Power Distribution System. IEEE Trans. Power Syst. 2019, 34, 52–63. [Google Scholar] [CrossRef]
  9. Jufri, F.H.; Widiputra, V.; Jung, J. State-of-the-Art Review on Power Grid Resilience to Extreme Weather Events: Definitions, Frameworks, Quantitative Assessment Methodologies, and Enhancement Strategies. Appl. Energy 2019, 239, 1049–1065. [Google Scholar] [CrossRef]
  10. Liu, Y.; Zhang, F.; Zhang, G.; Ding, L. In- and Post-disaster Two-stage Coordinated Resilience Recovery Decision of Distribution Network Considering Distributed Generators. Autom. Electr. Power Syst. 2024, 48, 48–59. [Google Scholar]
  11. Li, Z.; Xu, Y.; Wang, P.; Xiao, G. Restoration of a Multi-Energy Distribution System with Joint District Network Reconfiguration via Distributed Stochastic Programming. IEEE Trans. Smart Grid 2024, 15, 2667–2680. [Google Scholar] [CrossRef]
  12. Chen, C.; Wang, J.; Qiu, F.; Zhao, D. Resilient Distribution System by Microgrids Formation after Natural Disasters. IEEE Trans. Smart Grid 2016, 7, 958–966. [Google Scholar] [CrossRef]
  13. Cao, W.; Wu, J.; Jenkins, N.; Wang, C.; Green, T. Operating Principle of Soft Open Points for Electrical Distribution Network Operation. Appl. Energy 2016, 164, 245–257. [Google Scholar] [CrossRef]
  14. Ma, N.; Xu, Z.; Wang, Y.; Liu, G.; Xin, L.; Liu, D.; Liu, Z.; Shi, J.; Chen, C. Strategies for Improving the Resiliency of Distribution Networks in Electric Power Systems during Typhoon and Water-Logging Disasters. Energies 2024, 17, 1165. [Google Scholar] [CrossRef]
  15. Wang, Z.; Shen, C.; Xu, Y.; Liu, F.; Wu, X.; Liu, C.-C. Risk-Limiting Load Restoration for Resilience Enhancement with Intermittent Energy Resources. IEEE Trans. Smart Grid 2019, 10, 2507–2522. [Google Scholar] [CrossRef]
  16. Tang, Y.; Wu, Z.; Gu, W. Research on Active Distribution Network Fault Recovery Strategy Based on Unified Model Considering Reconstruction and Island Partition. Power Syst. Technol. 2020, 44, 2731–2740. [Google Scholar] [CrossRef]
  17. Schneider, K.P.; Tuffner, F.K.; Elizondo, M.A.; Liu, C.-C.; Xu, Y.; Ton, D. Evaluating the Feasibility to Use Microgrids as a Resiliency Resource. IEEE Trans. Smart Grid 2017, 8, 687–696. [Google Scholar] [CrossRef]
  18. Momen, H.; Abessi, A.; Jadid, S.; Shafie-khah, M.; Catalão, J.P.S. Load Restoration and Energy Management of a Microgrid with Distributed Energy Resources and Electric Vehicles Participation under a Two-Stage Stochastic Framework. Int. J. Electr. Power Energy Syst. 2021, 133, 107320. [Google Scholar] [CrossRef]
  19. Lei, S.; Chen, C.; Li, Y.; Hou, Y. Resilient Disaster Recovery Logistics of Distribution Systems: Co-Optimize Service Restoration with Repair Crew and Mobile Power Source Dispatch. IEEE Trans. Smart Grid 2019, 10, 6187–6202. [Google Scholar] [CrossRef]
  20. Zhang, G.; Zhang, F.; Zhang, X.; Wang, Z.; Meng, K.; Dong, Z.Y. Mobile Emergency Generator Planning in Resilient Distribution Systems: A Three-Stage Stochastic Model with Nonanticipativity Constraints. IEEE Trans. Smart Grid 2020, 11, 4847–4859. [Google Scholar] [CrossRef]
  21. Kim, J.; Dvorkin, Y. Enhancing Distribution System Resilience with Mobile Energy Storage and Microgrids. IEEE Trans. Smart Grid 2019, 10, 4996–5006. [Google Scholar] [CrossRef]
  22. Zheng, X.; Khodayar, M.E.; Wang, J.; Yue, M.; Zhou, A. Distributionally Robust Multistage Dispatch with Discrete Recourse of Energy Storage Systems. IEEE Trans. Power Syst. 2024, 99, 1–14. [Google Scholar] [CrossRef]
  23. Lei, S.; Wang, J.; Chen, C.; Hou, Y. Mobile Emergency Generator Pre-Positioning and Real-Time Allocation for Resilient Response to Natural Disasters. IEEE Trans. Smart Grid 2016, 9, 2030–2041. [Google Scholar] [CrossRef]
  24. Abousleiman, R.; Scholer, R. Smart Charging: System Design and Implementation for Interaction Between Plug-in Electric Vehicles and the Power Grid. IEEE Trans. Transp. Electrif. 2015, 1, 18–25. [Google Scholar] [CrossRef]
  25. Mohsen, S.; Nezhad, M.H.; Fereidunian, A.; Lesani, H.; Gavgani, M.H. Enhancement of Self-Healing Property of Smart Grid in Islanding Mode Using Electric Vehicles and Direct Load Control. In Proceedings of the 2014 Smart Grid Conference (SGC), Tehran, Iran, 9–10 December 2014; pp. 1–6. [Google Scholar]
  26. Lei, S.; Chen, C.; Zhou, H.; Hou, Y. Routing and Scheduling of Mobile Power Sources for Distribution System Resilience Enhancement. IEEE Trans. Smart Grid 2019, 10, 5650–5662. [Google Scholar] [CrossRef]
  27. Li, M.; Yang, Q.; Li, G.; Liu, D.; Bie, C. Two-stage Power Supply Recovery Strategy of Resilient Distribution Network Based on the Coordination of Multiple Distributed Resources in Typhoon Scenario. High Volt. Eng. 2024, 50, 93–104. [Google Scholar] [CrossRef]
  28. Yang, N.; Xun, S.; Liang, P.; Ding, L.; Yan, J.; Xing, C.; Wang, C.; Zhang, L. Spatial-Temporal Optimal Pricing for Charging Stations: A Model-Driven Approach Based on Group Price Response Behavior of EVs. IEEE Trans. Transp. Electrif. 2024, 99, 1. [Google Scholar] [CrossRef]
  29. Yang, Q.; Li, G.; Bie, C.; Wu, Y.; Ji, C.; Liu, D. Vehicle-to-grid Based Resilience Promotion Strategy for Urban Distribution Network Under Typhoon Disaster. Autom. Electr. Power Syst. 2022, 46, 130–139. [Google Scholar]
  30. Gao, H.; Chen, Y.; Mei, S.; Huang, S.; Xu, Y. Resilience-Oriented Pre-Hurricane Resource Allocation in Distribution Systems Considering Electric Buses. Proc. IEEE 2017, 105, 1214–1233. [Google Scholar] [CrossRef]
  31. Xia, W.; Ren, Z.; Qin, H.; Dong, Z. A Coordinated Operation Method for Networked Hydrogen-Power-Transportation System. Energy 2024, 296, 131026. [Google Scholar] [CrossRef]
  32. Wang, Y.; Xu, Y.; He, J.; Liu, C.; Schneider, K.P.; Hong, M.; Ton, D.T. Coordinating Multiple Sources for Service Restoration to Enhance Resilience of Distribution Systems. IEEE Trans. Smart Grid 2019, 10, 5781–5793. [Google Scholar] [CrossRef]
  33. Arif, A.; Wang, Z.; Wang, J.; Chen, C. Power Distribution System Outage Management with Co-Optimization of Repairs, Reconfiguration, and DG Dispatch. IEEE Trans. Smart Grid 2018, 9, 4109–4118. [Google Scholar] [CrossRef]
  34. Zeng, Y.; Qin, C.; Liu, J.; Xu, X. Coordinating Multiple Resources for Enhancing Distribution System Resilience against Extreme Weather Events Considering Multi-Stage Coupling. Int. J. Electr. Power Energy Syst. 2022, 138, 107901. [Google Scholar] [CrossRef]
  35. Arab, A.; Khodaei, A.; Khator, S.K.; Ding, K.; Emesih, V.A.; Han, Z. Stochastic Pre-Hurricane Restoration Planning for Electric Power Systems Infrastructure. IEEE Trans. Smart Grid 2015, 6, 1046–1054. [Google Scholar] [CrossRef]
  36. Arif, A.; Ma, S.; Wang, Z.; Wang, J.; Ryan, S.M.; Chen, C. Optimizing Service Restoration in Distribution Systems with Uncertain Repair Time and Demand. IEEE Trans. Power Syst. 2018, 33, 6828–6838. [Google Scholar] [CrossRef]
  37. Arif, A.; Ma, S.; Wang, Z. Optimization of Transmission System Repair and Restoration with Crew Routing. In Proceedings of the 2016 North American Power Symposium (NAPS), Denver, CO, USA, 18–20 September 2016; pp. 1–6. [Google Scholar]
  38. Ding, T.; Wang, Z.; Jia, W.; Chen, B.; Chen, C.; Shahidehpour, M. Multiperiod Distribution System Restoration with Routing Repair Crews, Mobile Electric Vehicles, and Soft-Open-Point Networked Microgrids. IEEE Trans. Smart Grid 2020, 11, 4795–4808. [Google Scholar] [CrossRef]
  39. Chen, C.; Wang, J.; Ton, D. Modernizing Distribution System Restoration to Achieve Grid Resiliency Against Extreme Weather Events: An Integrated Solution. Proc. IEEE 2017, 105, 1267–1288. [Google Scholar] [CrossRef]
  40. Arif, A.; Wang, Z.; Chen, C.; Wang, J. Repair and Resource Scheduling in Unbalanced Distribution Systems Using Neighborhood Search. IEEE Trans. Smart Grid 2020, 11, 673–685. [Google Scholar] [CrossRef]
  41. Zhang, G.; Meng, K. Sequential Disaster Recovery Model for Distribution Systems with Co-Optimization of Maintenance and Restoration Crew Dispatch. IEEE Trans. Smart Grid 2020, 11, 4700–4713. [Google Scholar] [CrossRef]
  42. Dehbozorgi, M.R.; Rastegar, M.; Dabbaghjamanesh, M. Decision Tree-Based Classifiers for Root-Cause Detection of Equipment-Related Distribution Power System Outages. IET Gener. Transm. Distrib. 2020, 14, 5809–5815. [Google Scholar] [CrossRef]
  43. Wang, J.; Yao, J.; Liu, Z.; Ou, Y.; Xiong, X. Fault statistical analysis and probability distribution fitting for a power distribution network in adverse weather conditions. Power Syst. Prot. Control. 2022, 50, 143–153. [Google Scholar] [CrossRef]
  44. Kuntz, P.A.; Christie, R.D.; Venkata, S.S. Optimal Vegetation Maintenance Scheduling of Overhead Electric Power Distribution Systems. IEEE Power Eng. Rev. 2002, 17, 1164–1169. [Google Scholar] [CrossRef]
  45. Hou, G.; Muraleetharan, K.K. Modeling the Resilience of Power Distribution Systems Subjected to Extreme Winds Considering Tree Failures: An Integrated Framework. Int. J. Disaster Risk Sci. 2023, 14, 194–208. [Google Scholar] [CrossRef]
  46. Wallnerstrom, C.J.; Dalheim, M.; Seratelius, M.; Johansson, T. Power Outage Related Statistics in Sweden since the Early 2000s and Evaluation of Reliability Trends. In Proceedings of the 2020 International Conference On Probabilistic Methods Applied To Power Systems (Pmaps), Liege, Belgium, 18–21 August 2020; IEEE: New York, NY, USA, 2020. [Google Scholar]
  47. Perrier, N.; Agard, B.; Baptiste, P.; Frayret, J.-M.; Langevin, A.; Pellerin, R.; Riopel, D.; Trépanier, M. A Survey of Models and Algorithms for Emergency Response Logistics in Electric Distribution Systems. Part II Conting. Plan. Level. Comput. Oper. Res. 2013, 40, 1907–1922. [Google Scholar] [CrossRef]
  48. Brown, M.A.; Soni, A. Expert Perceptions of Enhancing Grid Resilience with Electric Vehicles in the United States. Energy Res. Soc. Sci. 2019, 57, 101241. [Google Scholar] [CrossRef]
  49. Xie, S.; Hu, Z.; Wang, J. Two-Stage Robust Optimization for Expansion Planning of Active Distribution Systems Coupled with Urban Transportation Networks. Appl. Energy 2020, 261, 114412. [Google Scholar] [CrossRef]
  50. Xing, Q.; Chen, Z.; Leng, Z.; Lu, Y.; Liu, Y. Route Planning and Charging Navigation Strategy for Electric Vehicles Based on Real-time Traffic Information. Proc. CSEE 2020, 40, 534–550. [Google Scholar] [CrossRef]
  51. Jiang, X.; Chen, J.; Chen, M.; Wei, Z. Multi-Stage Dynamic Post-Disaster Recovery Strategy for Distribution Networks Considering Integrated Energy and Transportation Networks. CSEE J. Power Energy Syst. 2021, 7, 408–420. [Google Scholar] [CrossRef]
  52. Yang, L.; Zhao, Y.; Zhao, Y.; Qin, Y.; Wang, D. Balanced Fault Recovery of Active Distribution Network Considering Emergency Power Supply Vehicle Scheduling in Traffic Network. Autom. Electr. Power Syst. 2021, 45, 170–180. [Google Scholar]
  53. Zhou, Y.; Wang, G.; Wu, Z.; Zhu, J.; Huang, J. Distribution Network Disaster Recovery Strategy Considering Road Risk Based on Multi-Source Coordination Strategy. Electr. Power Syst. Res. 2024, 229, 110154. [Google Scholar] [CrossRef]
  54. Li, Z.; Tang, W.; Lian, X.; Chen, X.; Zhang, W.; Qian, T. A Resilience-Oriented Two-Stage Recovery Method for Power Distribution System Considering Transportation Network. Int. J. Electr. Power Energy Syst. 2022, 135, 107497. [Google Scholar] [CrossRef]
  55. Keay, K.; Simmonds, I. The Association of Rainfall and Other Weather Variables with Road Traffic Volume in Melbourne, Australia. Accid. Anal. Prev. 2005, 37, 109–124. [Google Scholar] [CrossRef] [PubMed]
  56. Tsapakis, I.; Cheng, T.; Bolbol, A. Impact of Weather Conditions on Macroscopic Urban Travel Times. J. Transp. Geogr. 2013, 28, 204–211. [Google Scholar] [CrossRef]
  57. Su, S.; Wei, C.; Li, Z.; Xia, M.; Chen, Q. Critical Load Restoration in Coupled Power Distribution and Traffic Networks Considering Spatio-Temporal Scheduling of Electric Vehicles. Int. J. Electr. Power Energy Syst. 2022, 141, 108180. [Google Scholar] [CrossRef]
  58. Wang, X.; Shahidehpour, M.; Jiang, C.; Li, Z. Resilience Enhancement Strategies for Power Distribution Network Coupled with Urban Transportation System. IEEE Trans. Smart Grid 2019, 10, 4068–4079. [Google Scholar] [CrossRef]
  59. Wang, Y.; Xu, Y.; Li, J.; Li, C.; He, J.; Liu, J.; Zhang, Q. Dynamic Load Restoration Considering the Interdependencies Between Power Distribution Systems and Urban Transportation Systems. CSEE J. Power Energy Syst. 2020, 6, 772–781. [Google Scholar] [CrossRef]
  60. Yao, S.; Wang, P.; Liu, X.; Zhang, H.; Zhao, T. Rolling Optimization of Mobile Energy Storage Fleets for Resilient Service Restoration. IEEE Trans. Smart Grid 2020, 11, 1030–1043. [Google Scholar] [CrossRef]
  61. Gomes, G.; Horowitz, R.; Kurzhanskiy, A.A.; Varaiya, P.; Kwon, J. Behavior of the Cell Transmission Model and Effectiveness of Ramp Metering. Transp. Res. Part C Emerg. Technol. 2008, 16, 485–513. [Google Scholar] [CrossRef]
  62. Ukkusuri, S.V.; Han, L.; Doan, K. Dynamic User Equilibrium with a Path Based Cell Transmission Model for General Traffic Networks. Transp. Res. Part B Methodol. 2012, 46, 1657–1684. [Google Scholar] [CrossRef]
  63. Yi, W.; Qu, Y.; Wu, J. Node traffic assignment model for urban road network under severe weather conditions. J. Transp. Eng. Inf. 2022, 20, 59–71. [Google Scholar] [CrossRef]
  64. The cell transmission model, part II: Network traffic. Transp. Res. Part B Methodol. 1995, 29, 79–93. [CrossRef]
  65. Wang, Y.; Szeto, W.Y.; Han, K.; Friesz, T.L. Dynamic traffic assignment: A review of the methodological advances for environmentally sustainable road transportation applications. Transp. Res. Part B Methodol. 2018, 111, 370–394. [Google Scholar] [CrossRef]
  66. Srivastava, A.; Jin, W.-L.; Lebacque, J.-P. A Modified Cell Transmission Model with Realistic Queue Discharge Features at Signalized Intersections. Transp. Res. Part B Methodol. 2015, 81, 302–315. [Google Scholar] [CrossRef]
  67. Sumalee, A.; Zhong, R.X.; Pan, T.L.; Szeto, W.Y. Stochastic Cell Transmission Model (SCTM): A Stochastic Dynamic Traffic Model for Traffic State Surveillance and Assignment. Transp. Res. Part B Methodol. 2011, 45, 507–533. [Google Scholar] [CrossRef]
  68. Levin, M.W.; Boyles, S.D. A Cell Transmission Model for Dynamic Lane Reversal with Autonomous Vehicles. Transp. Res. Part C Emerg. Technol. 2016, 68, 126–143. [Google Scholar] [CrossRef]
  69. Sun, D.; Bayen, A.M. Multicommodity Eulerian-Lagrangian Large-Capacity Cell Transmission Model for En Route Traffic. J. Guid. Control Dyn. 2008, 31, 616–628. [Google Scholar] [CrossRef]
  70. Levin, M.W.; Boyles, S.D. A Multiclass Cell Transmission Model for Shared Human and Autonomous Vehicle Roads. Transp. Res. Part C Emerg. Technol. 2016, 62, 103–116. [Google Scholar] [CrossRef]
  71. Cui, Y.; Hu, C.; Duan, X. Review on the Electric Vehicles Operation Optimization Considering the Spatial Flexibility of Electric Vehicles Charging Demands. Power Syst. Technol. 2022, 46, 981–994. [Google Scholar] [CrossRef]
  72. Sun, G.; Li, G.; Xia, S.; Shahidehpour, M.; Chan, K.W. ALADIN-Based Coordinated Operation of Power Distribution and Traffic Networks with Electric Vehicles. IEEE Trans. Ind. Appl. 2020, 56, 5944–5954. [Google Scholar] [CrossRef]
  73. Wan, H.; Liu, X.; Shi, X.; He, J. Multiple-time-section Optimization Strategy for Post-disaster Recovery of Distribution Network Considering Dynamic Changes of Traffic Flow. Autom. Electr. Power Syst. 2022, 46, 119–129. [Google Scholar]
  74. Lu, B.; Xie, Z.; Kang, X.; Zhao, M. Resilience Assessment on Urban Road Network by Dynamic Shunt Cell Transmission Model. J. Transp. Syst. Eng. Inf. Technol. 2022, 22, 134–143+211. [Google Scholar] [CrossRef]
  75. Lo, H.K. A Novel Traffic Signal Control Formulation. Transp. Res. Part A 1999, 433–448. [Google Scholar] [CrossRef]
  76. Baran, M.; Wu, F.F. Optimal Sizing of Capacitors Placed on a Radial Distribution System. IEEE Trans. Power Deliv. 1989, 4, 735–743. [Google Scholar] [CrossRef]
  77. Wang, H.; Liu, X.; Yao, Q.; Wan, Y.; He, J. Pre-layout and Dynamic Scheduling Strategy of Mobile Energy Storage for Resilience Enhancement of Distribution Network. Autom. Electr. Power Syst. 2022, 46, 37–45. [Google Scholar]
  78. Ding, T.; Lin, Y.; Li, G.; Bie, Z. A New Model for Resilient Distribution Systems by Microgrids Formation. IEEE Trans. Power Syst. 2017, 32, 4145–4147. [Google Scholar] [CrossRef]
  79. Xiang, Y.; Jiang, Z.; Gu, C.; Teng, F.; Wei, X.; Wang, Y. Electric Vehicle Charging in Smart Grid: A Spatial-Temporal Simulation Method. Energy 2019, 189, 116221. [Google Scholar] [CrossRef]
Figure 1. Rules for repairing ordinary and severe faults.
Energies 17 05020 g001
Figure 2. Collaborative relationships across resources.
Energies 17 05020 g002
Figure 3. The improved IEEE 33 node system.
Energies 17 05020 g003
Figure 4. The power supply ratio and accumulated power loss of various power supplies in Scenario 1.
Energies 17 05020 g004
Figure 5. The route of the repair crew in Scenario 1.
Energies 17 05020 g005
Figure 6. The bar graph represents the discharge power of each type of power source, and the dotted line represents the access nodes of the MESS.
Energies 17 05020 g006
Figure 7. The power supply ratio and accumulated power loss of various power supplies in Scenario 2.
Energies 17 05020 g007
Figure 8. The route of the repair crew in Scenario 2.
Energies 17 05020 g008
Figure 9. The power supply ratio and accumulated power loss of various power supplies in Scenario 3.
Energies 17 05020 g009
Table 1. CTM simulation parameters.
Parameter NameNumeric ValueParameter NameNumeric Value
free speed of the vehicles km/h50input flow rate veh/s0.3
spillback speed km/h5output flow rate %0.9
saturation flow rate veh/s0.5number of lanes104
blocking density veh/km200number of input/output lane56
Table 2. Distributed resources and MESS parameters.
Capacity (kWh)Maximum Discharge Power (kW)Charging Efficiency
SESS3001500.98
DEG500120
MESS9002000.98
Table 3. The characteristics of each scenario.
Type of FaultRCRoad Scenario
Scenario 1Ordinary Fault/Severe FaultGRC/SRCRoad fault
Scenario 2Ordinary Fault/Severe FaultGRC/SRCRoad intact
Scenario 3Ordinary FaultGRCRoad fault
Table 4. The sequence and moments of RC restoration for Scenario 1.
Repair CrewRepair Sequence and Time
GRCf1(3)→f2(8)→f3(13)→f6(17)→f4(25)→f5(30)
SRCf6(21)→f5(34)
The contents in “( )” indicate the time of completion of repair.
Table 5. The sequence and moments of RC restoration for Scenario 2.
Repair CrewRepair Sequence and Time
GRCf1(3)→f2(7)→f3(12)→f6(16)→f5(24)→f4(29)
SRCf6(20)→f5(28)
Table 6. The sequence and moments of RC restoration for Scenario 3.
Repair crewRepair Sequence and Time
GRCf1(3)→f5(8)→f3(12)→f6(16)→f2(21)→f4(30)
The contents in “( )” indicate the completion time of repair.
Disclaimer/Publisher’s Note: The statements, opinions and data contained in all publications are solely those of the individual author(s) and contributor(s) and not of MDPI and/or the editor(s). MDPI and/or the editor(s) disclaim responsibility for any injury to people or property resulting from any ideas, methods, instructions or products referred to in the content.