Abstract
This study aims to improve an H-Darrieus vertical-axis wind turbine (VAWT) by imposing a novel double-deflector design. A computational fluid dynamics (CFD) model was implemented to examine the aerodynamic characteristics of the VAWT with double deflectors. Geometrics factors related to the locations of the two deflectors were considered, and the orthogonal array based on the Taguchi method was constructed for CFD simulation. The CFD results were further provided as the training data for the artificial neural network (ANN) to forecast the optimal configuration. The results indicate that the performance of a VAWT with a double-deflector design could exceed that of a bare VAWT or that of one using a single deflector. The mean power coefficient for a bare VAWT is 0.37, although it could be much higher with a proper setup using double deflectors. The prediction of ANN analysis is consistent with the result of CFD simulation, in which the difference between the ANN prediction and CFD simulation is generally less than 4.48%. The result confirms the accuracy of the prediction of the optimal VAWT performance with a double-deflector design.
1. Introduction
The exhaustion of fossil fuels and the significant increase in the global population has led to a growing shortage of clean energy worldwide. The energy crisis has brought to our attention renewable energy sources such as biomass, solar, and wind [1,2]. Wind energy is promising among these because it is green, plentiful, and cost-effective. Although wind energy has a broad distribution, the Global Wind Energy Council (GWEC) estimated that wind power installation needs to be quadrupled by 2030 to achieve net-zero emissions [3].
Horizontal-axis wind turbines (HAWTs) have been widely deployed in oceans and coastal areas. On the other hand, vertical-axis wind turbines (VAWTs) are also popular due to their compactness, adaptability, and suitability for urban and domestic installations [4]. In general, VAWTs can be classified into lift-type (H-Darrieus) and drag-type (Savonius) [5]. Lift-type VAWTs present a lower self-start capability and higher efficiency than the drag-type, such as the Darrieus rotor and H-rotor, which both have airfoil-shaped blades [6].
Employing power augmentation devices in front of wind turbines significantly impacts wind turbine performance, requiring less effort than redesigning the structure of wind turbines. The pressure on the returning blades can be reduced by installing a deflector as a flow-augmented device. This can increase positive net torque and performance from 20% to 50% [7]. Additionally, such an augmented device does not introduce extra complexity to the structure of rotors. Among various augmenters, using a deflector to enhance airflow offers the maximum improvement in the power coefficient [7]. A basic form of the deflector is a flat-plate deflector positioned upstream of the VAWT. Proper orientation and placement are crucial for the installation of a deflector. Studies have demonstrated that incorrect orientations can negatively impact wind turbine performance, which often results in worse performance than that of a bare turbine [8]. Positioning the turbine rotors within the wake region behind the deflector leads to a marginal performance increase, whereas placing the rotors outside the near-wake region presents a significant performance boost [9]. Hence, understanding these characteristics of the deflector is of utmost importance [10].
CFD simulation can visualize the flow field and calculate the VAWT performance at a low cost during the optimization and design phases [6]. It also enables the parametric study to evaluate various design configurations and optimize the deflector’s placement, orientation, and size for maximizing VAWT performance. The artificial neural network (ANN) method can be employed to enhance and verify the optimization process. This method is capable of learning complex relationships between input and output parameters, making it well-suited for capturing the intricate interaction between various design variables and turbine performance. Training ANN on CFD-generated data can be used to accurately predict VAWT performance with deflectors under various operating conditions. This model allows for the rapid evaluation of numerous design possibilities and facilitates the identification of optimal configurations.
Several studies have investigated the performance of VAWT with deflectors under various wind conditions. For example, Zhao et al. [11] used numerical simulation to analyze the aerodynamic performance of two VAWTs with a deflector. The results showed that the deflector creates a larger relative velocity and a more favorable angle of attack to the blades, which causes an increase of up to 23% of the torque coefficient compared with the configuration without the deflector. Chen et al. [12] used Taguchi and modified additive methods to intensify the operational efficiency of a Darius wind turbine. Several deflector configurations were examined, including upper and lower deflector designs. They found that the average power coefficient was raised by 20% for the upper deflector, whereas it was raised by 17% in the case of the lower deflector. The analysis of variance (ANOVA) confirmed that the power coefficient of VAWT could be improved significantly with the proper installation of a deflector. Kim and Gharib [13] have experimentally investigated the influence of the upstream deflector on two counter-rotating VAWTs. The height, width, and relative position of the deflector with respect to the turbines have been confirmed as important factors affecting the output power. The study by Qasemi and Azadani [14] investigated the effect of an augmented VAWT with a flat plate deflector. In their study, VAWT performance was influenced most by the angle and length of the deflector in relation to the rotation axis. The optimal configuration raised the power efficiency by 16.42% compared with the turbine without a deflector. Zidane et al. [15] first introduced the design of multiple upstream deflectors to improve the moment coefficient of H-Darrieus VAWT. The power coefficients of three different configurations were compared, including the bare wind turbine and the wind turbine with single and double deflectors. The single-deflector turbine may raise the moment coefficient by 24%, whereas the enhancement for the turbine with two deflectors is 22%.
Jamieson [16] studied the generalized limits for energy extraction from wind that could be applied to ducts, diffusers, or any systems that augmented local inflow. The essential aspect of this analysis involved defining an ideal system and determining the axial induction that would be present at the energy extraction plane in the absence of an energy extraction system. The Lanchester–Betz limit was revealed as a particular case for open flow and could be exceeded. Experimental work on the diffuser by Oman et al. [17] showed that a power coefficient exceeding the Betz limit could be achieved. Hansen et al. [18] performed a CFD simulation to verify the general actuator disc theory by exceeding the Betz limit. Several experimental, theoretical, and numerical studies using the design of diffusers have demonstrated that it is possible to exceed the Betz limit. Freda et al. [19] formulated a theory concerning power extraction from passive accelerators and confined flows. Their study highlights the significance of a system with a value greater than one, indicating that such a system can extract more energy than the kinetic energy in the stream tube of the maximum area of the accelerator projected forward. Vaz and Wood [20] proposed an optimization procedure based on the classical blade element theory to design the blades of a diffuser-augmented wind turbine. The comparison between the optimized rotor, proposed methodology, and classical Glauert optimization reveals that both approaches attain a power coefficient exceeding the Betz limit within the range of TSR from 7 to 10. Building upon the research of Vaz and Wood [20], Rio Vaz et al. [21] further explored hydrokinetic blades, demonstrating that the power coefficient remains relatively stable and only slightly exceeds the Betz limit at a speed-up ratio of 1.3. Siavash et al. [22] developed a novel mathematical model incorporating new equations to forecast the effects of and speed-up ratio. Their findings reveal that the power coefficient of a shrouded wind turbine can reach a value of one for an optimal design.
Chen et al. [23] used the Taguchi and ANN methods to optimize VAWT performance under unstable wind conditions. The tip speed ratio (TSR) was the most crucial factor among the considered variables that could affect the average power coefficient. Svorcan et al. [24] combined the finite volume method with artificial intelligence (AI) techniques to explore the VAWT performance. Their results demonstrate that using a flow concentrator can lead to an increase in wind speed of approximately 20–25%. Moreover, this study highlights that contemporary AI techniques play important roles in expediting and improving the design process for wind engineering research.
The H-Darrieus wind turbine, with its distinctive vertical-axis design and curved blades, has been recognized for its great potential to harness wind energy efficiently. Incorporating a deflector, however, can further improve H-Darrieus turbine performance. The deflector modifies the airflow around the turbine, optimizing the blades’ angle of attack and improving overall turbine efficiency. By directing and guiding the wind more effectively, the deflector can increase the power output and stability of the H-Darrieus turbine, making it a more attractive option for wind energy generation. In this study, we aim to investigate the employment of double deflectors for a VAWT and explore the optimal geometric design to achieve the potentially maximum power coefficient. The orthogonal array based on the Taguchi method was constructed, and CFD simulation was performed for each run in the array. Furthermore, the results of the CFD simulation were utilized as the training data for the ANN analysis. Accordingly, this study can develop a data-driven model to accurately predict system behavior under different operating conditions. The integration of CFD and ANN for optimization exhibits an excellent ability to accelerate the design process for discovering optimal solutions and enable breakthrough innovations for investigating VAWT performance with double-deflector design.
2. Numerical Simulation
2.1. Governing Equations
The flow field around the VAWT was simulated using the software ANSYS Fluent 2022 R2. A 2D model was built to avoid massive computation, and the airflow was assumed to be isothermal and incompressible. The continuity and momentum equations are as follows:
where , , , , are the velocity, air density, time, pressure, and body force, respectively. The viscous stress tensor τ and Reynolds stress τR are defined using the following:
where μ is the dynamic viscosity, μt is the Eddy viscosity, and k is the turbulence kinetic energy. The flow induced by the wind turbine and deflector is turbulent in nature. Hence, the shear-stress transport (SST) k-ω model based on detached eddy simulation (DES) was used to model the impact of turbulent fluctuations on the mean flow in the present study. According to the study of Almohammadi et al. [25], the power curve derived from the shear-stress transport (SST) transition model aligns with the results obtained from the RNG k-model [26]. The SST k-ω model could be expressed using the following form [27]:
where is the effective diffusivity of k, is the turbulent generation rate due to the mean flow, is the dissipation of k due to turbulence, and is the user-defined source term for k, and Additionally, is the specific dissipation rate, Γω is the effective diffusivity of , is the generation of , is the dissipation of ω due to turbulence, is the cross-diffusion term, and is the user-defined source term for . After the transient flow simulation, the power coefficient of the VAWT can be determined using the following:
where , and are the torque, angular velocity, blade swept area, and free stream speed, respectively. It is noted that the variation in the power coefficient with the tip speed ratio is mainly interested, which is defined as:
where R is the rotor radius. The time step in the simulation was set up as the time for the wind turbine to rotate one degree, as follows:
2.2. Time-Averaged Power Coefficient
Because the interaction between the wind turbine and deflectors is nonlinear, the power coefficient fluctuates with time. It raises a need for time-averaging the power coefficient. The power coefficient can be expressed in terms of monochromatic oscillations. The discrete Fourier transform (DFT) can then be used to analyze the spectrum of the moment, as shown in Figure 1. Oh et al. [28] employed the DFT to formulate the sizing of energy storage systems and operational approaches, revolving around frequency domain analysis. Xiao et al. [29] introduced an approach for concurrently determining the optimal sizes of energy storage systems and diesel generators with an isolated microgrid based on DFT. The output moment from Ansys Fluent was imported into Python code, and we used a built-in DFT function to analyze the spectrum components.
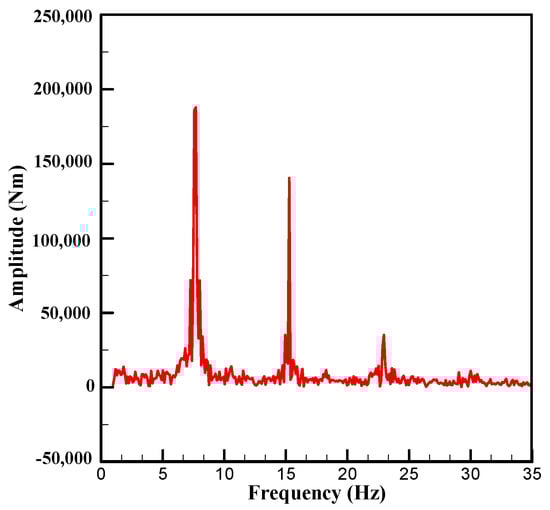
The lowest frequency with the highest amplitude represents the dominant wave contributing to the power generation. This value is used as the characteristic time to calculate the time-average power coefficient as follows:
where is selected to be equal to five times the period of the highest amplitude wave.
Because the time step in the CFD simulation is kept constant, the time-average power coefficient can be reduced to:
where N = 20. In each case is the number of characteristic cycles, which is equivalent to 50 complete rotations of the turbine and 18,000 time-steps. The last 20 characteristic cycles would be used to calculate the average power coefficient, as shown in Figure 2 for the typical case L4.
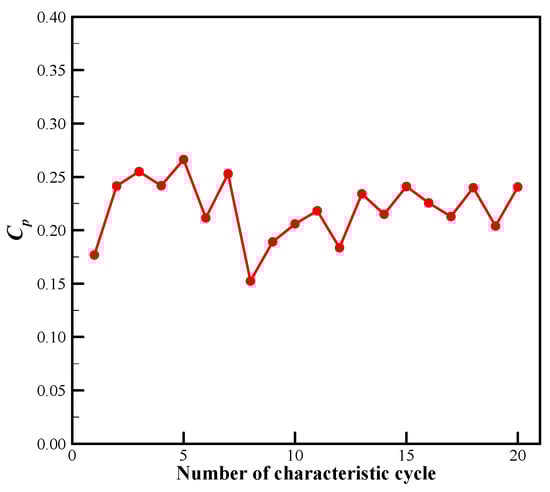
Figure 2.
Power coefficient variation of the case L4 during 20 characteristic cycles.
2.3. Operation Conditions with Double Deflectors
The physical model of VAWT with double deflectors is shown in Figure 3. The simulation was conducted on the rectangular domain (125 m × 100 m), where the VAWT is located at the center with a circular area of 3 m diameter. The flow field could be separated into windward and leeward domains [30] with respect to the center of the VAWT. The VAWT consists of three blades with the shape of a NACA 0015 airfoil. The chord length of each blade is 0.4 m, and the rotor diameter is 2.5 m. A uniform wind profile is assumed at the inlet with the magnitude of wind velocity of 10 m·s−1 and a left-to-right flow direction. The surface of the turbine blade satisfies the no-slip condition, and the initial conditions for the simulation are 0 Pa of gauge pressure, 0.375 m2·s−2 of turbulent kinetic energy, and 2567.201 s−1 of specific dissipation rate. The Reynolds number remains at 264,708 [31], with the chord length of the blade as the characteristic length at a temperature of 20 ℃. The geometric factors for the locations of both the upper and lower deflectors are illustrated in Figure 4a,b, respectively. The three levels of each factor based on the design of the Taguchi method are listed in Table 1. The orthogonal arrays with different level combinations are constructed for both the upper and lower deflectors, as listed in Table 2. There are 9 cases in each of the upper and lower deflectors, which results in a total of 81 cases for simulation.
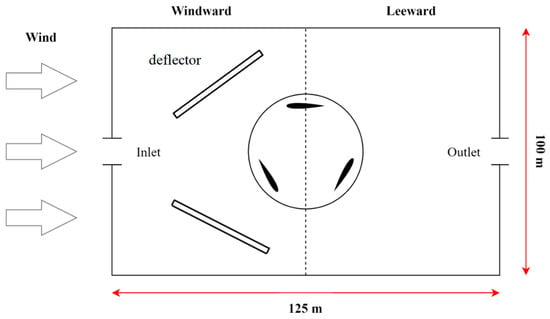
Figure 3.
Flow field configuration of the VAWT.
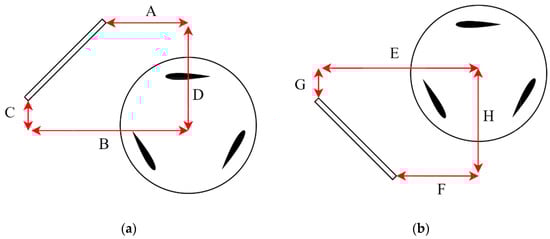
Figure 4.
The definitions of the geometric factors for the (a) upper and (b) lower deflectors.

Table 1.
Factors and levels of double deflectors.
Table 2.
The orthogonal arrays with different level combinations for both the upper and lower deflectors.
The flowchart for the optimization process of the VAWT with a double-deflector design is illustrated in Figure 5. The VAWT model was set up first, and the flow field was then meshed. Next, the numerical result was validated by comparing it with previous studies’ experimental and numerical data. CFD simulation was then executed for each case in the orthogonal array. The results were employed as the training data for the constructed ANN model to predict the optimal design of the double-deflector VAWT to give the maximum mean power coefficient. Finally, the CFD simulation was performed again for the optimal design predicted by ANN to confirm the prediction of ANN for the optimal configuration.
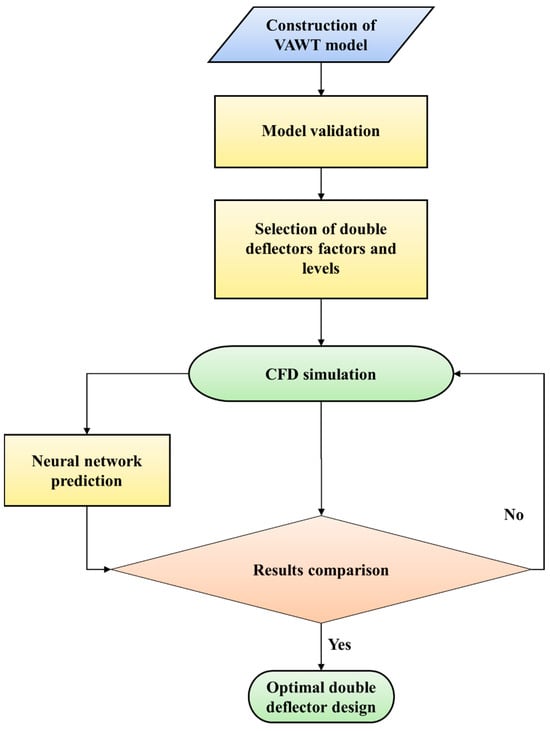
Figure 5.
Flowchart for the optimization of VAWT performance.
2.4. Validation and Grid-Independent Test
The built CFD model was validated by comparing the simulation results with those of the previous numerical [12,26] and experimental studies [32] at different TSR values from 1 to 2.5, as shown in Figure 6 under the condition without a deflector and 10 m s−1 of the inlet flow velocity. The comparison of the geometric features of these works is listed in Table 3. It is demonstrated that the present model generates the closest maximum value to the maximum of experimental data compared with the previous numerical studies. At lower TSR, the current model presents similar results as the studies [12,26] in which the VAWT performance was underestimated. This is because the computational domains of simulation are much larger than the experiment wind tunnel. In addition, the initial conditions for simulation are also different from the experimental operation. The better match at high values of TSR with the experimental data compared to the studies’ [12,26] results from the y+ on the surface of the turbine blades is consistently below 1. However, at higher TSR, the present model obviously demonstrates lower performance than the simulation studies [12,26], which is more consistent with the experimental result. The main reasons for the difference are the meshing method and the y+ value, which is a crucial parameter in CFD meshing to characterize the near-wall behavior of the fluid flow. The y+ value provides critical information about how well-resolved the near-wall region is by the computational meshes. This study used a built-in meshing method in Ansys Fluent, and the y+ was kept at the value of 1, whereas the conventional GAMBIT 2.5 software was employed in previous studies [12,26] with a y+ of 0.12. This study aims to determine the average power coefficient at optimal TSR, and the validation result proves the accuracy of the constructed model that the VAWT performance at optimal TSR could be predicted closer to the practical condition by the present model.
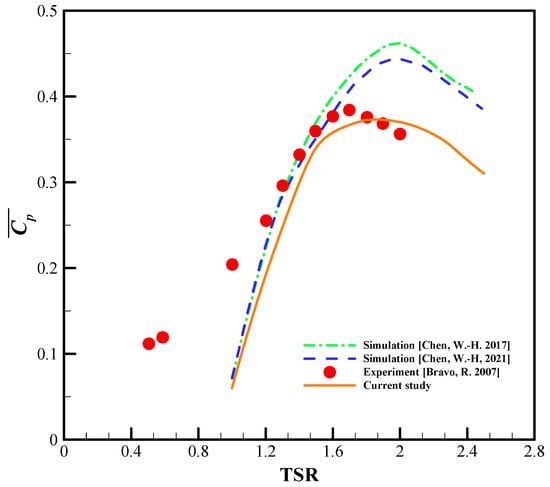
Figure 6.
Validation of the CFD model with previous numerical [12,26] and experimental [32] studies.
Table 3.
The geometric features of the present study and previous experimental and numerical works.
The distribution of meshes within the computational domain is shown in Figure 7a, and the meshes in the rotating domain, region around the airfoil, and region of the rotating blades with double deflectors are shown in Figure 7b–d, respectively. The unstructured triangular meshes were used, except on the surfaces of the airfoils and deflectors, where the meshes with thickness inflation were used. There are 40 and 35 layers of inflation around airfoils and deflectors, respectively. The grid-independence test was then performed to ensure the convergence of numerical solutions and determine the suitable number of meshes to obtain accurate results with reasonable time consumption. The case with double deflectors composed of U7 and L3 was selected to perform the test. Five different mesh numbers, named Mesh 1–5, were constructed, where the total number of nodes are 50,019, 85,321, 164,106, 207,386, and 276,338, respectively. The edge sizing was adjusted at the interfaces between the rotation domain, the outer domain, and the area around airfoils and deflectors. The result is shown in Figure 8. Obviously, the averaged power coefficient rises significantly from Mesh 1 to Mesh 3. But from Mesh 3 to Mesh 5, the relative differences are always less than 2%. Hence, Mesh 3 with 164,106 nodes was used in this study for all simulations.
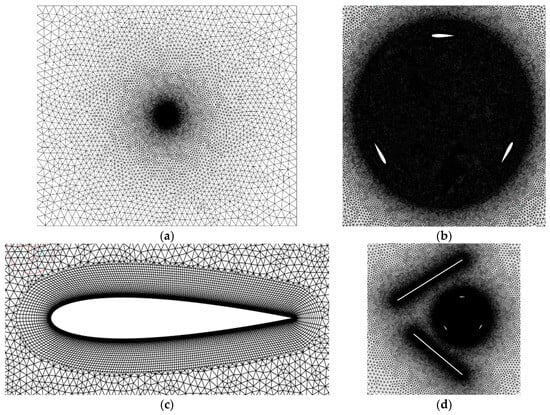
Figure 7.
The generated meshes of (a) the whole flow field, (b) the region of the rotating domain, (c) the region around the airfoil, and (d) the region around the two deflectors.
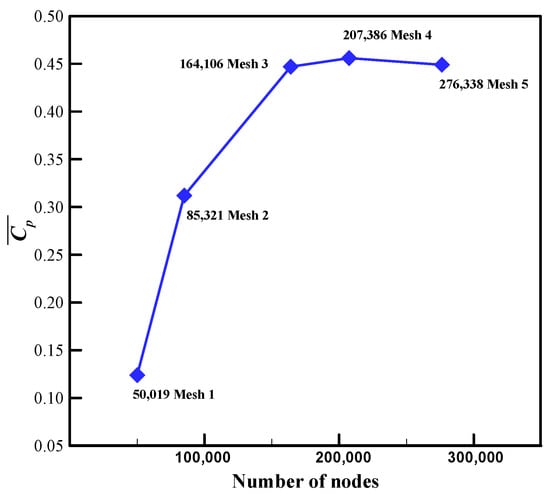
Figure 8.
Grid-independent test.
2.5. Artificial Neural Networks
Artificial Neural Networks (ANNs) are machine learning models inspired by the intricate structure and functionality of neurons in the human brain. These networks have extensive applications across diverse fields, including image recognition, natural language processing, speech recognition, and predictive modeling. The back-propagation algorithm is widely used for training ANNs. It is a supervised learning technique that focuses on adjusting the weights of the connections between neurons in the networks. By minimizing the error between the output of the network and the desired output, back-propagation enables the network to learn and improve its performance over time.
To find a solution in which the time is as short as possible, two kinds of approaches have been widely employed. The first is to adjust the single or global learning rate, and the other is to explicitly incorporate the second derivative of the error with respect to each weight. Fahlman [33] and Chen et al. [34] developed algorithms based on both the approaches and Newton’s method, a second-order method called quick propagation. Two assumptions have been made. The first assumption is that the errors and weight curve can be approximated using a parabola with open upward arms, and the second assumption is that the simultaneous changes in other weights do not impact the change in the slope of the error curve. The formula for updated weight is as follows:
where S(t) and S(t − 1) are the current and previous values of error derivative, Δw(t) is the current weight, and Δw(t − 1) is the previous weight.
3. Results and Discussion
3.1. VAWT Performance with a Single Deflector
The maximum of bare VAWT remained 0.37 as TSR equals 2. This value is very close to the experimental data, proving the accuracy of the CFD model. The orthogonal array based on the geometric factors of the position of the upper deflector was developed using the Taguchi method, which is the same as that in study [12]. The results of mean power coefficients for all the cases in the orthogonal array were compared with those of study [12], as listed in Table 4. The percentage difference of was calculated based on the value of 0.37 for the bare VAWT. In comparison with the bare VAWT, the cases U3, U5, and U7 respectively exhibit 43.24%, 24.32%, and 16.22% improvement in the mean power coefficient. The other cases, however, may reduce the VAWT performance. This result is in agreement with the studies by Wong et al. [35] and Nimvari et al. [36], which found that installing a deflector at the proper position can effectively enhance the torque generated by the rotors, increasing the power coefficient. The difference arises from the fact that in study [12], there were no inflation layers on the deflectors, whereas in the present study, the mesh includes inflation layers. For the comparison of the present model with study [12], both the variational trends of are similar, but the maximum was determined using case U3 rather than case U7 in study [12]. This result revealed that the optimization of VAWT performance by CFD simulation depends heavily on the developed CFD model.
Table 4.
Comparison of the mean power coefficients with the bare VAWT ( = 0.37) for the VAWT with upper-deflector design.
The velocity distribution of case U3, as depicted in Figure 9a, demonstrated that installing the upper deflector can enhance the wind speed in the upwind region. As a result, the peak power in the positive torque generation process could be boosted effectively. The upper deflector redirected and accelerated the oncoming wind toward the leeward side. Consequently, the airflow in the vicinity of the wake region behind the deflector exhibited higher velocity, which tweaked the mean power coefficient of the VAWT. In addition, a low-velocity region appeared around the returning blades, reducing the negative torque and positively impacting the wind turbine performance. A study by Wong et al. [35] also found that the region near the wake of the deflector experiences an increased velocity by 25% compared with the coming wind flow due to the deflection caused by the edge of the deflector.
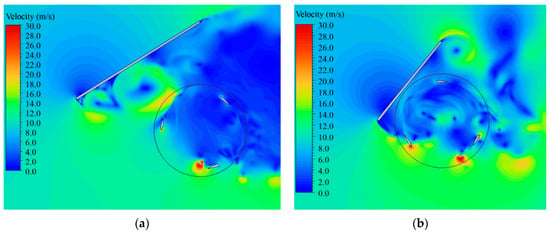
Figure 9.
Velocity contours of the VAWT with upper deflector for cases (a) U3 and (b) U1.
In contrast, as shown in Figure 9b for case U1, the upper deflector obstructed a segment of the upwind airflow. The vortices produced behind the deflector disrupted the airflow entering the rotor area, reducing the upwind region’s flow velocity. This phenomenon hampered the ability of the VAWT to harness wind energy and resulted in lower power output.
For the VAWT with a lower deflector design, the considered geometric factors followed the same setup of the upper deflector, except for factor G, which was increased by 0.5 m in each level, as shown in Table 1. The reason was to avoid the condition in which the installation of the double deflectors totally covered the inlet of airflow in front of the VAWT. The simulation results for each case in the corresponding orthogonal array are listed in Table 5. It is demonstrated that the employment of a lower deflector can generally enhance the VAWT performance, except in case L3, which presented a small negative effect. The maximum VAWT performance was determined using cases L2 and L4 approximately, in which the values of were 0.58 and 0.57 for cases L2 and L4, respectively. This corresponded to a 56.76% and 54.05% increase in the average power coefficient compared with the case of the bare turbine. Such efficiency is already quite close to 0.59 of the Betz limit. Note that only cases U3, U5, and U7 positively affected VAWT performance single upper deflector condition. The other cases generally displayed negative effects. This can be explained by the fact that the upper deflector could reduce the negative torque of the returning blade while simultaneously reducing the wind speed moving toward the turbine by blocking the flow field. The occurrence of flow separation with forward momentum dropping in the boundary layer [12,37,38] may also negatively affect the turbine blades. In contrast, the employment of a lower deflector seemed to have a more positive effect on the increment of wind speed caused by the deflector-created vortices, as shown in Figure 10 for the velocity contour of case L4. This flow characteristic enhanced the VAWT performance rather than blocking the flow field observed in the condition using a single upper deflector.
Table 5.
Comparison of the mean power coefficients with the bare VAWT ( = 0.37) for the VAWT with lower-deflector design.
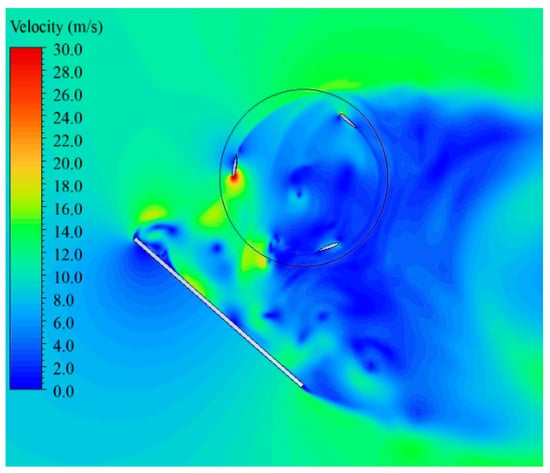
Figure 10.
Velocity contour of the VAWT with lower deflector for case L4.
3.2. VAWT Performance with Double Deflectors
The variations of VAWT performance with TSR are shown in Figure 11 for the cases with and without single-/double-deflector designs for comparison. The case of double-deflector design is composed of the typical single-deflector cases U3 and L4. For a VAWT with deflectors, wind turbines achieve outstanding performance in the high TSR region. The peak of the curve moves from 1.75 of TSR for the bare VAWT to the right for the cases L4, U3 and L4, and the optimal case SP4. The use of a deflector not only broadens the operation range of TSR but also improves the VAWT performance.
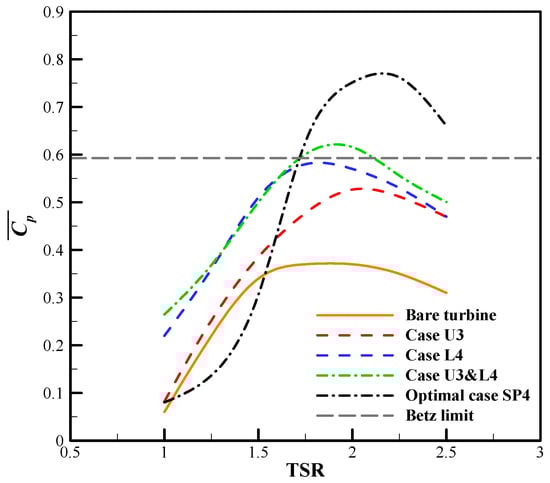
Figure 11.
Comparison of the VAWT performance for the VAWT with and without single-/double-deflector designs.
For the VAWT with a single deflector, in either case U3 or L4, the VAWT performance was always higher than that of the bare VAWT configuration for an assigned TSR. Notably, at the condition of TSR = 2, the average power coefficient of case L4 increased by about 54.05%, which is very close to the Betz limit. Furthermore, it was found that the VAWT with the double-deflector design for the case U3 and L4 could exceed the Betz limit under a moderate value of TSR, which is quite a significant finding that has never been proposed before in studies on VAWT with a deflector design. As shown in Figure 11, the mean power coefficient of VAWT with a double-deflector design is much higher than that of bare VAWT in all the ranges of TSR. The improvement is more than tripled at TSR = 1, for example. Zidane et al. [15] indicated that with a double-deflector configuration, low was observed at a lower value of TSR due to the poor startup torque capability of the Darrius turbine, which can also be seen in Figure 11 for the optimal case SP4.
At higher TSR, the operation range of the rotor was enhanced by putting two deflectors in front of the rotor. The maximum mean power coefficient was achieved at TSR = 2.25 for case SP4, whereas the maximum for the bare VAWT without deflectors occurs at TSR = 1.75. The difference between the optimal case and bare wind turbine at 1.75 and 2.25 of TSR are 70.27% and 117.14%, respectively. Similar phenomena have been observed in some previous studies. The study by Qasemi and Azadani [14] found that the value of VAWT can be increased by 16.42% by imposing a single deflector compared with the configuration without any deflectors. Zidane et al. [15] observed that the utilization of a double-deflector design led to the creation of a nozzle action, resulting in an approximate 22% enhancement in the average moment coefficient compared with the bare H-Darrieus wind turbine. A unique porous deflector was introduced in the work by Nimvari et al. [36] to improve Savonius wind turbine performance. The maximum power coefficient increased by 10% compared with the original configuration without a deflector.
In the present simulation, the combinations of upper and lower deflectors with a total of 81 configurations were conducted. The initial optimal combination was found in the cases of single-deflector U3 and L4. It was observed that with the factors C and D remaining at 1 m, the VAWT will present the optimal performance; therefore, level 3 of factor C and level 2 of factor G were fixed, and the other factors were changed individually to investigate the effect of each factor on the VAWT performance. There are 12 cases from SP1 to SP12 around the initial optimal case, U3 and L4, that were selected to perform CFD simulation. Detailed configurations of the additional cases are provided in Table 6. In the first 81 combinations, the highest performance of VAWT occurred at case U3 and L4 with a mean power coefficient of 0.63, which is 70.27% higher than that of the wind turbine without a deflector. In contrast, the case U1 and L9 resulted in the poorest value of 0.09, which is 75.68% lower than that of the bare wind turbine. These results indicate that a proper configuration of the double-deflector design can significantly impact the performance of the Darrius turbine, which agrees with the proposition achieved for the single-deflector design. The additional CFD simulations provide outstanding results, with a minimum improvement of 13.51% at SP2 and a maximum of 102.70% at SP4. Figure 12 and Figure 13 show the velocity contour of the VAWT with double deflectors for the cases SP4 and U1 and L9. It is demonstrated that the high performance of case SP4 is due to the high-velocity region created by the two imposed deflectors. This high-velocity flow region highly concentrated on the area adjacent to the rotating blades. In contrast, for cases U1 and L9, the upper deflector was too close to the wind turbines and blocked the airflow, resulting in a low-velocity region near the rotating blades. In addition, the lower deflector was located too far away from the VAWT, which produced little impact on the increment of flow velocity.
Table 6.
Configurations of the additional cases with different levels around the initial optimal point.
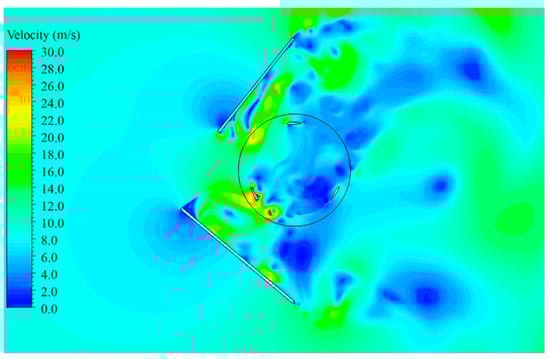
Figure 12.
Velocity contour of the VAWT with double-deflector design for case SP4.
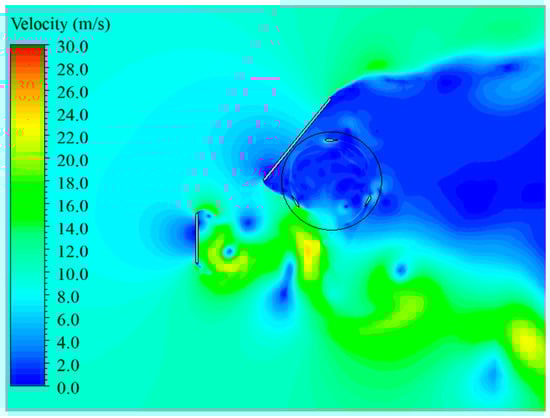
Figure 13.
Velocity contour of the VAWT with double-deflector design for cases U1 and L9.
The variation of the average power coefficient in the first 81 simulations was quite significant due to the diverse configurations, in which some cases showed an increase in , whereas the others negatively affected VAWT performance compared with the bare turbine. However, for the 12 cases (i.e., SP1~SP12) around the initial optimal point, the VAWT performance always remained positive. This result is due to fixing the distances from the deflectors to the flow field center (i.e., factors C and G), thereby confirming that the two factors significantly affect the VAWT performance.
The interaction between the two deflectors and the incoming flow intricately affected the VAWT performance because it involves the effects of both upper and lower deflectors and the distance and angle between them. The results of Zidane et al. [15] indicated that implementing a single deflector increased the maximum torque value as it enhanced the flow velocity over the turbine blade. However, it also resulted in an adverse effect on the negative torque. To address this issue, using two deflectors positioned upstream of the turbine rotors proved advantageous. Such an arrangement effectively blocked the flow in the region where the rotor blade rotated opposite to the wind direction and simultaneously concentrated the flow in the zone where a more favorable angle of attack occurred. As a result, the double-deflector design helped overcome the drawbacks associated with the negative torque and enhanced overall VAWT performance. Note that the single-deflector configuration exhibited a disadvantage wherein certain azimuthal angles would result in a negative momentum coefficient. However, this drawback can be effectively eliminated using the double-deflector configuration. The negative coefficient of momentum at specific azimuthal angles can be mitigated by the imposed two deflectors, improving the system’s overall performance.
According to the findings presented in [39], an adverse pressure gradient induced the separation of the boundary layer from the surface of the airfoil, causing the formation of a transitional separation bubble. Following the separation of the laminar boundary layer, an unstable detached shear layer emerged, which then underwent a transition to turbulence. The turbulent flow facilitated enhanced momentum transport, allowing for reattachment and the development of a turbulent boundary layer downstream. The presence of the separation bubble caused the boundary layer to thicken and increased the pressure drag on the airfoil. This increase in drag can be several times higher than that of an airfoil without a separation bubble. Moreover, the existence of a transitional separation bubble can affect the lift, potentially affecting the aerodynamic performance of the airfoil.
3.3. Neural Network Model Architecture and Data Training
As depicted in Figure 14, the network architecture comprises a hidden layer containing 40 neurons. The input parameters are the distances from the VAWT to the deflectors, defined as factors A, B, C, D, E, F, G, and H, and is the output parameter. The training algorithm employs a one-layer network with quick propagation. The hidden layer utilizes the Gaussian function, and the output layer uses the linear piece function. The database for the neural network analysis is from the CFD simulation acquired from the orthogonal array presented in Table 7. The data are divided into training and test data, with a ratio of 8:2 for training to test data. The evaluation of the artificial neural network (ANN) performance entailed the utilization of test data to assess its generalization capability subsequent to training. The training process concluded upon attaining an error threshold below 0.03 between the training and validation data. The error profile of the training and validation data is shown in Figure 15, in which the training epoch reached termination at 271. The outcome of regression analysis, as illustrated in Figure 16, presented a commendable concordance between the predicted output and the target during the training phase of the ANN model. Notably, the coefficient of determination (R2) between the targets and predicted outputs for the train test stands at 0.9695, whereas the test set achieved a value of 0.9472, which indicates a noteworthy level of conformity within the regression equation. Compared to Chen et al. [23] using back-propagation in model training, quick propagation in this study helped the model converge faster. It saved more time and effort in the training process.
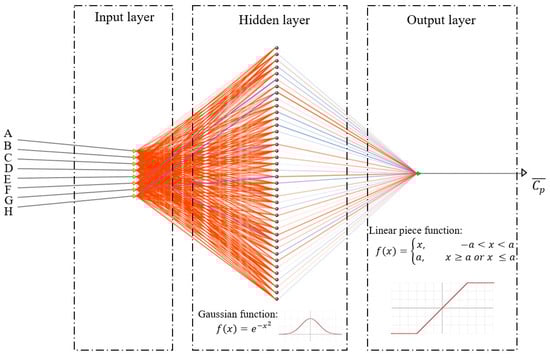
Figure 14.
Schematic of neural networks with eight input factors and one hidden layer with 40 nodes [23].
Table 7.
Time-averaged power coefficients of the VAWT with various double-deflector designs compared with the case of bare VAWT.
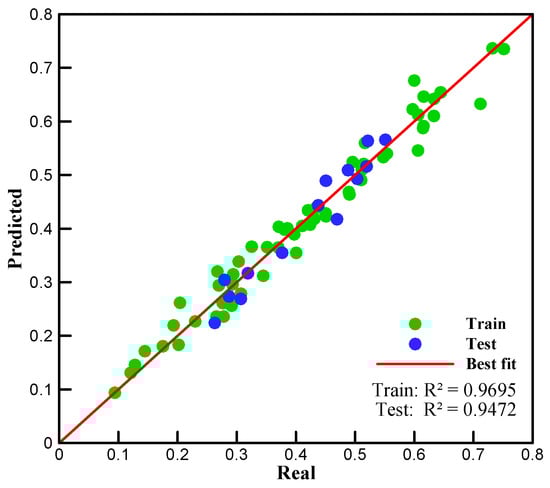
Figure 15.
Scatter plot of real value and ANN predicted values for a training set and test set.
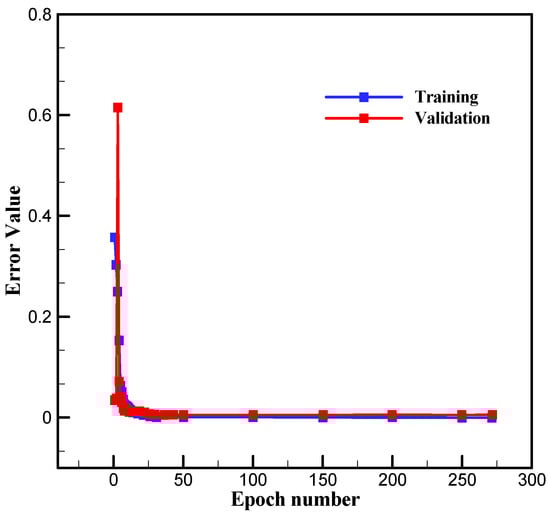
Figure 16.
Training and validation of the error of data versus interactions.
The proficient descent and notable R2 values substantiated the precision of the artificial neural network analysis in relation to CFD simulation. In addition, they underscored its capacity to discern optimal combinations of the factors unhampered by the limitations imposed by the factor levels. Throughout the ANN training, designated weights were allocated to the chosen factors, enabling subsequent calculations. By scrutinizing the outcomes against CFD data and assessing the associated errors, quick propagation adapted the weights and iterated the calculation procedures until the program identified the set of minimum errors and sensitivity. Figure 17 shows the sensitivity values for the eight factors. Their importance can be ranked as follows: G > E > C > B > D > A > H > F. This result once again confirms the importance of two factors, G and C. Installing the upper and lower deflectors too close to each other causes the airflow to be blocked and hence, lowers the overall VAWT performance.
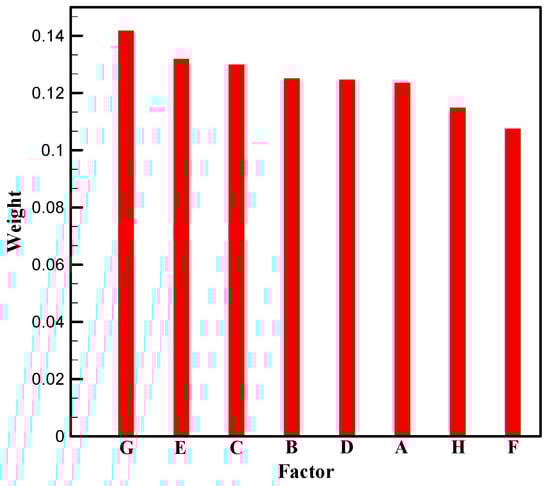
Figure 17.
Importance of the eight factors by weight.
3.4. The Optimization of VAWT Performance and CFD Confirmation
The utilization of the ANN model enables the prediction of the optimal for a VAWT via various deflector configurations. The result of ANN prediction is listed in Table 8, and the comparison with CFD simulation for some selected cases is given in Table 9. Following the result obtained by the simulations around the initial optimal point and the important levels of the ANN model, there was a total of 36 combinations used in the ANN analysis, in which the factors C and G was kept at levels 3 and 2, respectively. In contrast, the other factors were adjusted with different levels in predicting optimal performance.
Table 8.
The predictions of by ANN at various levels of the factors.
Table 9.
Comparison between the results of ANN predictions and CFD simulations for the selected cases.
The CFD simulations used the same deflector configurations as those in the ANN analysis to verify the ANN predictions. The predicted values by the ANN are in excellent agreement with the results of CFD simulations as the data listed in Table 9. The highest with a double-deflector design can achieve 0.75, which almost doubles the VAWT performance of a bare wind turbine. The present findings provide significant evidence that the ANN model accurately predicts VAWT performance. Moreover, it can be effectively utilized to evaluate the optimal operating condition of TSR for a VAWT.
4. Conclusions
The VAWT system with a double-deflector design was investigated in this study. The influences of geometric factors related to the deflector locations on the mean power coefficient () were analyzed using ANN. The ANN model was built by using the CFD simulation results based on the Taguchi method’s orthogonal array as training data. The results yield the following conclusions:
- Installing a single lower deflector positively impacts VAWT performance more than installing a single upper deflector. The major reason is that the lower deflector does not block airflow and may accelerate incoming wind velocity.
- The double-deflector design, composed of a lower deflector and an upper deflector, can greatly enhance VAWT performance. VAWT performance seems to be able to exceed the Betz limit with the proper installation of the two deflectors. However, this conclusion was found based on a 2D turbulent viscous flow model and needs to be further verified both theoretically and experimentally.
- The developed ANN model demonstrated precise prediction capability for the evaluation of the optimal for a VAWT with a double-deflector design, as evidenced by a coefficient of determination (R2) of 0.95 between the outputs and targets in the test data.
Further exploration of the effects of a double-deflector design on VAWT performance via experimental measurement or 3D CFD simulation would be helpful to validate the predictions made using the present 2D VAWT model.
Author Contributions
Conceptualization, W.-H.C.; methodology, T.T.L., L.J. and G.L.A.; software, W.-H.C.; validation, T.T.L., M.-H.C. and L.J.; formal analysis, W.-H.C., M.-H.C., L.J. and C.-C.C.; investigation, W.-H.C., M.-H.C., L.J. and C.-C.C.; resources, W.-H.C.; data curation, T.T.L., C.-C.C. and G.L.A.; writing—original draft preparation, T.T.L.; writing—review and editing, W.-H.C., M.-H.C., L.J., C.-C.C. and G.L.A.; visualization, T.T.L. and G.L.A.; supervision, W.-H.C.; project administration, W.-H.C.; funding acquisition, W.-H.C. All authors have read and agreed to the published version of the manuscript.
Funding
This research was funded by the National Science and Technology Council, Taiwan, R.O.C., NSTC 112-2221-E-006-111-MY3.
Data Availability Statement
Data are contained within the article.
Acknowledgments
This research was supported in part by the Higher Education Sprout Project, Ministry of Education to the Headquarters of University Advancement at National Chen Kung University (NCKU), which is gratefully acknowledged.
Conflicts of Interest
The authors declare no conflicts of interest.
Nomenclature
| A | Blade swept area (m2) |
| Power coefficient | |
| Time-averaged power coefficient | |
| D | Rotor diameter (m) |
| Dω | Cross-diffusion term |
| E | Error function |
| fc | Fluctuation frequency (Hz) |
| Turbulent generation rate due to the mean flow (kg∙m−1∙s−3) | |
| Generation rate of | |
| Turbulence kinetic energy | |
| N | Number of time intervals per revolution |
| P | Average absolute pressure (Pa) |
| R | Rotor radius (m) |
| User-defined source term for | |
| User-defined source term for | |
| Current values of error derivative | |
| Previous values of error derivative | |
| T | Torque (N∙m) |
| Characteristic time (s) | |
| TSR | Tip speed ratio |
| Velocity vector (m·s−1) | |
| V = Vmean | Freestream speed (m·s−1) |
| Specific dissipation rate | |
| Current weight | |
| Previous weight | |
| Dissipation of due to turbulence | |
| Dissipation of due to turbulence | |
| Greek letters | |
| Effective diffusivity of | |
| Effective diffusivity of | |
| Kronecker delta | |
| Rotor azimuth | |
| Dynamic viscosity (kg·m−1·s−1) | |
| Eddy viscosity (kg·m−1·s−1) | |
| Density (kg·m−3) | |
| Closure coefficients of | |
| Closure coefficients of | |
| Angular velocity (rad·s−1) |
References
- Jabbar Al-Quraishi, B.; Asmuin, N.; Mohd, S.; Abd Al-Wahid, W.; Mohammed, A.; Didane, D. Review on Diffuser Augmented Wind Turbine (DAWT). Int. J. Integr. Eng. 2019, 11. [Google Scholar] [CrossRef]
- Sedaghat, A.; Hassanzadeh, A.; Jamali, J.; Mostafaeipour, A.; Chen, W.-H. Determination of rated wind speed for maximum annual energy production of variable speed wind turbines. Appl. Energy 2017, 205, 781–789. [Google Scholar] [CrossRef]
- GWEC—Global Wind Energy Council. 2023. Available online: https://gwec.net/globalwindreport2023/ (accessed on 10 December 2023).
- Shah, S.R.; Kumar, R.; Raahemifar, K.; Fung, A.S. Design, modeling and economic performance of a vertical axis wind turbine. Energy Rep. 2018, 4, 619–623. [Google Scholar] [CrossRef]
- Zhao, Z.; Wang, D.; Wang, T.; Shen, W.; Liu, H.; Chen, M. A review: Approaches for aerodynamic performance improvement of lift-type vertical axis wind turbine. Sustain. Energy Technol. Assess. 2022, 49, 101789. [Google Scholar] [CrossRef]
- Wong, K.H.; Chong, W.T.; Poh, S.C.; Shiah, Y.-C.; Sukiman, N.L.; Wang, C.-T. 3D CFD simulation and parametric study of a flat plate deflector for vertical axis wind turbine. Renew. Energy 2018, 129, 32–55. [Google Scholar] [CrossRef]
- Alom, N.; Saha, U.K. Four Decades of Research Into the Augmentation Techniques of Savonius Wind Turbine Rotor. J. Energy Resour. Technol. 2018, 140, 050801. [Google Scholar] [CrossRef]
- Golecha, K.; Eldho, T.I.; Prabhu, S.V. Influence of the deflector plate on the performance of modified Savonius water turbine. Appl. Energy 2011, 88, 3207–3217. [Google Scholar] [CrossRef]
- Jin, X.; Wang, Y.; Ju, W.; He, J.; Xie, S. Investigation into parameter influence of upstream deflector on vertical axis wind turbines output power via three-dimensional CFD simulation. Renew. Energy 2018, 115, 41–53. [Google Scholar] [CrossRef]
- Rajpar, A.H.; Ali, I.; Eladwi, A.E.; Bashir, M.B. Recent Development in the Design of Wind Deflectors for Vertical Axis Wind Turbine: A Review. Energies 2021, 14, 5140. [Google Scholar] [CrossRef]
- Zhao, P.; Jiang, Y.; Liu, S.; Stoesser, T.; Zou, L.; Wang, K. Investigation of fundamental mechanism leading to the performance improvement of vertical axis wind turbines by deflector. Energy Convers. Manag. 2021, 247, 114680. [Google Scholar] [CrossRef]
- Chen, W.-H.; Wang, J.-S.; Chang, M.-H.; Mutuku, J.K.; Hoang, A.T. Efficiency improvement of a vertical-axis wind turbine using a deflector optimized by Taguchi approach with modified additive method. Energy Convers. Manag. 2021, 245, 114609. [Google Scholar] [CrossRef]
- Kim, D.; Gharib, M. Efficiency improvement of straight-bladed vertical-axis wind turbines with an upstream deflector. J. Wind. Eng. Ind. Aerodyn. 2013, 115, 48–52. [Google Scholar] [CrossRef]
- Qasemi, K.; Azadani, L.N. Optimization of the power output of a vertical axis wind turbine augmented with a flat plate deflector. Energy 2020, 202, 117745. [Google Scholar] [CrossRef]
- Zidane, I.F.; Ali, H.M.; Swadener, G.; Eldrainy, Y.A.; Shehata, A.I. Effect of upstream deflector utilization on H-Darrieus wind turbine performance: An optimization study. Alex. Eng. J. 2023, 63, 175–189. [Google Scholar] [CrossRef]
- Jamieson, P. Generalized limits for energy extraction in a linear constant velocity flow field. Wind. Energy 2008, 11, 445–457. [Google Scholar] [CrossRef]
- Oman, R.A.; Foreman, K.M.; Gilbert, B.L. Investigation of Diffuser-Augmented Wind Turbines. Part II; Technical Report; Grumman Aerospace Corp.: Bethpage, NY, USA, 1977. [Google Scholar]
- Hansen, M.O.L.; Sørensen, N.N.; Flay, R.G.J. Effect of Placing a Diffuser around a Wind Turbine. Wind Energy 2000, 3, 207–213. [Google Scholar] [CrossRef]
- Freda, R.; Knight, B.; Pannir, S. A Theory for Power Extraction from Passive Accelerators and Confined Flows. Energies 2020, 13, 4854. [Google Scholar] [CrossRef]
- Vaz, J.R.P.; Wood, D.H. Aerodynamic optimization of the blades of diffuser-augmented wind turbines. Energy Convers. Manag. 2016, 123, 35–45. [Google Scholar] [CrossRef]
- Do Rio Vaz, D.A.T.D.; Vaz, J.R.P.; Silva, P.A.S.F. An approach for the optimization of diffuser-augmented hydrokinetic blades free of cavitation. Energy Sustain. Dev. 2018, 45, 142–149. [Google Scholar] [CrossRef]
- Keramat Siavash, N.; Najafi, G.; Tavakkoli Hashjionfn, T.; Ghobadian, B.; Mahmoodi, E. Mathematical modeling of a horizontal axis shrouded wind turbine. Renew. Energy 2020, 146, 856–866. [Google Scholar] [CrossRef]
- Chen, W.-H.; Wang, J.-S.; Chang, M.-H.; Tuan Hoang, A.; Shiung Lam, S.; Kwon, E.E.; Ashokkumar, V. Optimization of a vertical axis wind turbine with a deflector under unsteady wind conditions via Taguchi and neural network applications. Energy Convers. Manag. 2022, 254, 115209. [Google Scholar] [CrossRef]
- Svorcan, J.; Peković, O.; Simonović, A.; Tanović, D.; Hasan, M.S. Design of optimal flow concentrator for vertical-axis wind turbines using computational fluid dynamics, artificial neural networks and genetic algorithm. Adv. Mech. Eng. 2021, 13, 168781402110090. [Google Scholar] [CrossRef]
- Almohammadi, K.M.; Ingham, D.B.; Ma, L.; Pourkashan, M. Computational fluid dynamics (CFD) mesh independency techniques for a straight blade vertical axis wind turbine. Energy 2013, 58, 483–493. [Google Scholar] [CrossRef]
- Chen, W.-H.; Chen, C.-Y.; Huang, C.-Y.; Hwang, C.-J. Power output analysis and optimization of two straight-bladed vertical-axis wind turbines. Appl. Energy 2017, 185, 223–232. [Google Scholar] [CrossRef]
- ANSYS Fluent. Ansys Fluent 12.0 Theory Guide—4.5.2 Shear-Stress Transport (SST)—Model; ANSYS Inc.: Canonsburg, PA, USA, 2023. [Google Scholar]
- Oh, E.; Son, S.-Y. Energy-storage system sizing and operation strategies based on discrete Fourier transform for reliable wind-power generation. Renew. Energy 2018, 116, 786–794. [Google Scholar] [CrossRef]
- Xiao, J.; Bai, L.; Li, F.; Liang, H.; Wang, C. Sizing of energy storage and diesel generators in an isolated microgrid using discrete Fourier transform (DFT). IEEE Trans. Sustain. Energy 2014, 5, 907–916. [Google Scholar] [CrossRef]
- Ferreira, C.S. The Near Wake of the Vawt—2d and 3d Views of the Vawt Aerodynamics; TuDelf: Delf, The Netherlands, 2023. [Google Scholar]
- Reynolds number calculator. 2023. Available online: http://airfoiltools.com/calculator/reynoldsnumber (accessed on 10 December 2023).
- Bravo, R.; Tullis, S.; Ziada, S. Performance testing of a small vertical-axis wind turbine. In Proceedings of the 21st Canadian Congress of Applied Mechanics, Toronto, OT, Canada, 3–7 June 2007. [Google Scholar]
- Fahlman, S.E. An Empirical Study of Learning Speed in Back-Propagation Networks; Carnegie Mellon University, Computer Science Department: Pittsburgh, PA, USA, 1988. [Google Scholar]
- Chen, W.-H.; Ocreto, J.B.; Wang, J.-S.; Hoang, A.T.; Liou, J.-H.; Hwang, C.-J.; Chong, W.T. Two-stage optimization of three and four straight-bladed vertical axis wind turbines (SB-VAWT) based on Taguchi approach. e-Prime Adv. Electr. Eng. Electron. Energy 2021, 1, 100025. [Google Scholar] [CrossRef]
- Wong, K.H.; Chong, W.T.; Sukiman, N.L.; Shiah, Y.-C.; Poh, S.C.; Sopian, K.; Wang, W.C. Experimental and simulation investigation into the effects of a flat plate deflector on vertical axis wind turbine. Energy Convers. Manag. 2018, 160, 109–125. [Google Scholar] [CrossRef]
- Eshagh Nimvari, M.; Fatahian, H.; Fatahian, E. Performance improvement of a Savonius vertical axis wind turbine using a porous deflector. Energy Convers. Manag. 2020, 220, 113062. [Google Scholar] [CrossRef]
- Sears, W.R.; Telionis, D.P. Boundary-Layer Separation in Unsteady Flow. SIAM J. Appl. Math. 1975, 28, 215–235. [Google Scholar] [CrossRef]
- Simpson, R.L. Turbulent Boundary-Layer Separation. Annu. Rev. Fluid Mech. 1989, 21, 205–232. [Google Scholar] [CrossRef]
- Zidane, I.; Swadener, G.; Saqr, K.; Ma, X.; Shehadeh, M. CFD Investigation of Transitional Separation Bubble Characteristics on NACA 63415 Airfoil at Low Reynolds Numbers. In Proceedings of the 25th UKACM Conference on Computational Mechanics, Birmingham, UK, 12–13 April 2017. [Google Scholar]
Disclaimer/Publisher’s Note: The statements, opinions and data contained in all publications are solely those of the individual author(s) and contributor(s) and not of MDPI and/or the editor(s). MDPI and/or the editor(s) disclaim responsibility for any injury to people or property resulting from any ideas, methods, instructions or products referred to in the content. |
© 2024 by the authors. Licensee MDPI, Basel, Switzerland. This article is an open access article distributed under the terms and conditions of the Creative Commons Attribution (CC BY) license (https://creativecommons.org/licenses/by/4.0/).