Next Article in Journal
Energy-Efficient Implementation of the Lattice Boltzmann Method
Previous Article in Journal
A Scoping Review of Energy-Efficient Driving Behaviors and Applied State-of-the-Art AI Methods
 
 
Correction published on 11 July 2024, see Energies 2024, 17(14), 3402.
Article

Assessing the Impact of First-Life Lithium-Ion Battery Degradation on Second-Life Performance

Warwick Manufacturing Group (WMG), University of Warwick, Coventry CV4 9AL, UK
*
Authors to whom correspondence should be addressed.
Energies 2024, 17(2), 501; https://doi.org/10.3390/en17020501
Submission received: 13 December 2023 / Revised: 11 January 2024 / Accepted: 16 January 2024 / Published: 19 January 2024 / Corrected: 11 July 2024
(This article belongs to the Section D2: Electrochem: Batteries, Fuel Cells, Capacitors)

Abstract

:
The driving and charging behaviours of Electric Vehicle (EV) users exhibit considerable variation, which substantially impacts the battery degradation rate and its root causes. EV battery packs undergo second-life application after first-life retirement, with SoH measurements taken before redeployment. However, the impact of the root cause of degradation on second-life performance remains unknown. Hence, the question remains whether it is necessary to have more than a simple measure of state of health (SoH) before redeployment. This article presents experimental data to investigate this. As part of the experiment, a group of cells at around 80% SoH, representing retired EV batteries, were cycled using a representative second-life duty cycle. Cells with a similar root cause of degradation in the first life (100–80% SoH) exhibited the same degradation rate in second life after being cycled with the same duty cycle during the second life. When the root cause of degradation in the first life is different, the degradation rate in the second life may not be the same. These findings suggest that the root cause of a cell’s first-life degradation impacts how it degrades in its second life. Postmortem analysis (photographic and SEM images) reveals the similar physical condition of negative electrodes which have similar degradation rates in their second life cycle. This demonstrates that cells with a similar first life SoH and root cause of degradation indeed experience a similar life during their second life. The experimental results, along with the subsequent postmortem analysis, suggest that relying solely on SoH assessment is insufficient. It is crucial to take into account the root causes of cell degradation before redeployment.

1. Introduction

At present, electric vehicles are experiencing a significant triumph over traditional vehicles, attributable to the advancements in lithium-ion battery (LIB) and electric powertrain technology. Many believe that EVs have already been proven to be safer and more reliable than their gasoline-powered counterparts [1,2,3]. EVs play a significant role in reducing local air pollution and the overall use of fossil fuels. The average lifespan of an EV battery is reported to range from 8 to 10 years [4]. To optimise both the environmental and financial benefits, retired lithium-ion batteries are often being deployed in second-life applications [5].
When the LIB of an EV reaches its end-of-life (EoL) it can be either recycled [6], directly reused (without any changes) [7], or reused through remanufacturing [8]. Opting for the recycling of all battery packs at the end of their first lifespan does not contribute to extending the usage of LIBs. Direct reuse of the EoL-EV battery packs will likely incur additional servicing downstream. In addition, a pack’s capacity and power capability will be defined by the weakest cell/module [9]. It may also require adding additional electrical hardware, control systems and, safety systems [10], which will add further costs and mass. Alternatively, remanufacturing the packs may create a balanced battery pack, which can address most of these issues.
Modules/cells should be graded and matched in a remanufactured pack to avoid excessive pack imbalances and degradation gradients in the battery’s second life [9,11,12]. At present, grading is performed considering the previous capacity or resistance, i.e., SoH [13,14]. Generally, a battery is considered to have reached its end of life when its capacity decreases to 0.8 times its original value or its resistance doubles from its initial level [15]. Earlier investigations [16] propose that, during the initial phase of a battery’s lifespan, resistance tends to rise gradually, while the capacity loss becomes more apparent. Hence, capacity testing is far more effective than resistance estimation in detecting degradation and delivering trustworthy data during the early stage s of a battery’s lifespan. Therefore, in this study, the SoH of the cells is assessed by utilising capacity tests. More details of the capacity test can be found in [17].
Barai et al. [18] and Dubarry et al. [19] proposed that the root cause of degradation, i.e., Degradation Mode (DM), in addition to SoH, might need to be considered to understand the previous degradation. Battery degradation [19] is impacted by numerous factors, whether at the individual cell level or the assembly level, and their effects are frequently interconnected. When transitioning from single cells to modules and packs in a scaled-up system, the quantity of stress factors rises, and their interdependence intensifies. Therefore, it is crucial to address these factors as thoroughly as possible in advance. Martinez et al. [20] proposed that the previous degradation of a cell needs to be considered before redeploying the cell for a second life. The findings of Barai et al. [18], Dubarry et al. [19] and Martinez et al. [20] indicate that the DM might also need to be considered in the grading process, along with SoH.
It is difficult to attribute all causes of degradation to a single source because Degradation Modes interact and depend on each other significantly. In order to improve comprehension of the DM, Dubarry et al. [21], Birkl et al. [22], and Marongiu et al. [23] have suggested categorizing them into three distinct groups:
  • Loss of active material (LAM);
  • Loss of lithium inventory (LLI), and;
  • Conductivity loss (CL).
Degradation resulting from binder dissolution or the corrosion of the current collector is associated with CL [24]. During the charge/discharge process, lithium ions intercalate and de-intercalate from electrodes, playing a crucial role in storing and distributing electrical charges within the cell. The reduction in these lithium ions defines LLI [24]. Changes in the composition of the positive and negative electrode constituents facilitate the intercalation and de-intercalation of lithium, leading to the creation of active materials. The term “LAM” primarily refers to the reduction of active material and electrolyte components [24]. More details of DMs are provided in [17].
However, until now there is no experimental evidence for the impact of first-life DM on a battery’s second life. Hence, the question remains whether it is necessary to know about the DM along with SoH before redeployment. In other words, whether previous-life DM impacts second-life degradation. Therefore, before including DM identification in the grading technique (as DM identification is a time consuming and expensive process), knowing whether first-life DM impacts second-life ageing is required.
To achieve this the first step, we must have an indexing method for DM. A suitable indexing method for DM was not available in the current literature. Therefore, the authors of this article previously proposed a DM identification technique [12]. Exploiting this indexing method, this article presents an experimental research programme to ascertain whether first-life DM influences the second-life degradation rate.
In addition to the non-invasive technique, forensic analysis is a direct method for observing cell degradation through postmortem analysis. For example, Xie et al. [25] noticed that the new negative electrode exhibited a black surface with a uniform covering. In contrast, the cycled negative electrode exhibited metallic grey deposits, indicating the deposition of metallic lithium. Moreover, the appearance of wrinkles on the exterior of aged anodes can be linked to the electrode’s expansion caused by rapid charging. Laforgue et al. [26] visually observed whitish deposits on the cells cycled at a lower temperature. Bach et al. [27] and Wu et al. [28] confirmed that the area’s whitish/silver-grey colour was the consequence of lithium plating [29]. Wu et al. [28] also showed that, in some locations, the anode material has exfoliated off the copper foil, resulting in the loss of electrical contact between the active material and the current collector. Hence, the outcome of the second-life experimental data is verified using the features visible on electrodes. Electrode features are observed by performing a postmortem analysis.
The experimental detail is outlined in Section 2. The second-life degradation rate was analysed with and without DM in Section 3. Section 4 represents the post-mortem analysis. Finally, future work and a summary of this research outcomes are provided in Section 5 and Section 6, respectively.

2. Experimental Details

The cells used for this experiment are cylindrical 21,700 format (capacity: 5 Ah), consisting of NMC 811 positive electrodes and bi-component graphite SiOx as the negative electrode. The data sheet for the cells employed for this experiment is provided in [17].
The experiment was performed on a group of cells at around 80% SoH. These cells were cycled using a representative second-life duty cycle. The second-life duty cycle was adopted from a real-world second-life EV battery deployed for grid services. At regular intervals, the cell’s SoH and DM were measured, and the experimental details are provided in Section 2.
The DM of each cell as they degraded from 100% to 80% SoH in first life was known. This allowed these cells to be graded by employing the indexing method developed by the authors of this article [12]. Finally, to understand the effect of first-life DM on second-life ageing, second-life experimental data is analysed in two ways:
Second-life data are analysed by considering only the first-life SoH of the cells.
Second-life data are analysed by considering both first-life SoH and DM of the cells.
In these experiments, SoH of the cells is determined by assessing their energy capacity. Table 1 displays the SoH of the cells at the end of their first life. Details of the first life test are provided in [17]. As reported in the literature [30], cell degradation varies slightly even in a controlled degradation experiment when exposed to the same usages and environmental conditions. Consequently, achieving a precise 80% SoH for a group of cells based on their first-life degradation is challenging. Furthermore, various articles have acknowledged an error margin of 1–2% when determining cell SoH [31,32]. Hence, this research employs a margin of ±1.5%, i.e., cells with a SoH that falls within a range of 80 ± 1.5% are regarded as having a similar SoH. Table 1 illustrates that the SoH of the cells during their first life varies within the range of 80% (±1.5%). Cells with SoH in the range of 78.5–81.5% are included in this study. Only three cells (Cell 4, 14, and 15) slightly exceed this limit. As first-life ageing aims to reduce the SoH of the cells from approximately 100% to 80%, analysis of the first-life data is beyond the scope of this article. Hence, this article does not analyse the first-life experimental data. Details of the first life experiment can be found in [17].
However, for post-second-life SoH analysis, the cells provided in Table 1 were used, except for Cells 4, 14, and 15 (as these three cells slightly exceeded the ±1.5% range at the end of the first-life experiment). The experiment was designed for the cells to reach the same SoH level. After achieving a similar SoH level, the DM of the cells could be identified.
DM identification was performed following the process described in [17], and a description of these processes will not be repeated here. When the DM of each peak of each cell’s IC curve is matched, the cells are in the same DM state, whereas the opposite conditions result in cells being in a different DM state. The identified DM and the corresponding IC curves are illustrated in Table 1 and Figure 1, respectively. Figure 1 shows that the DM of the four IC peaks (e.g., 1st, 2nd, 3rd and 4th peaks are denoted as P1, P2, P3 and P4 as shown in Figure 1d) is similar for Cells 1–4, (P1 and P3, LLI dominated, and P3 and P4, LAM dominated). Likewise, the four IC peaks are similar for Cells 5 and 14–18 (P4 = LAM, P3 = P2 = P1 = LLI), Cell 7–10 (P4 = PD, P3 = P2 = P1 = LLI) and Cells 6 and 11–13 (P4 = P3 = P2 = P1 = LLI).
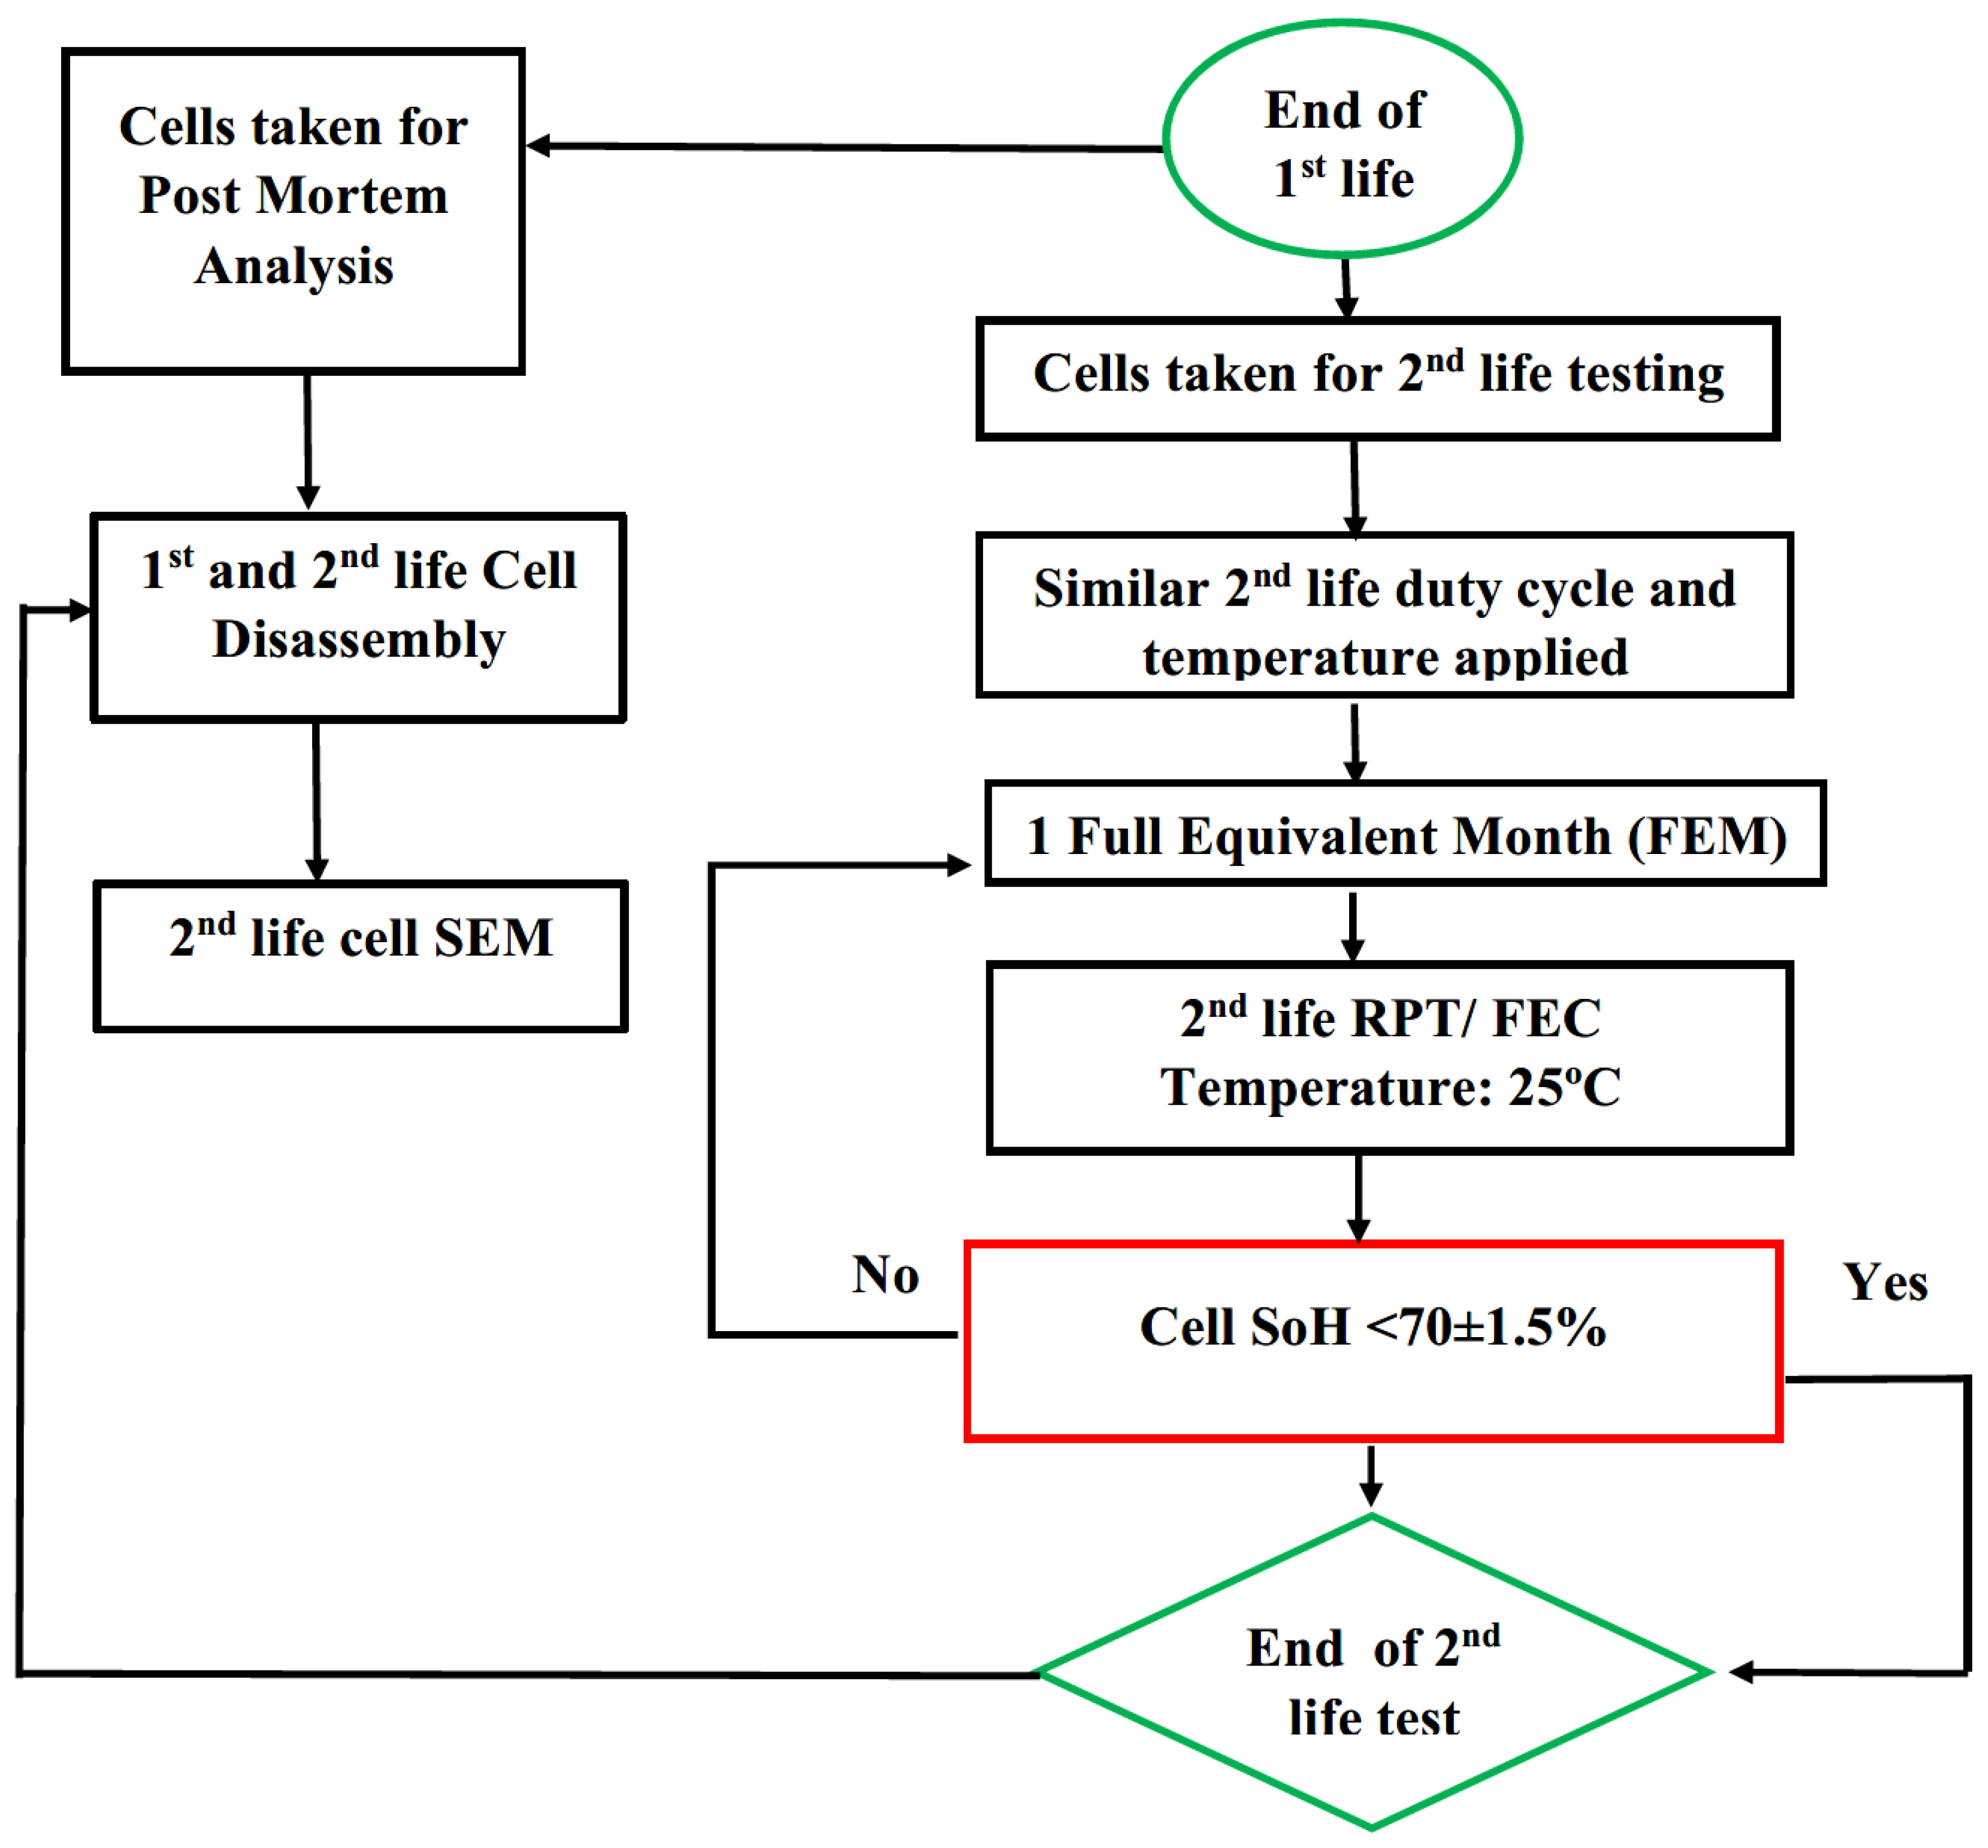
After DM identification, a second-life test was conducted, as detailed in Section 2.2. As previously mentioned, the objective of this second-life test was to observe how cells degrade during their second life. The SoH values at the end of the second-life testing are presented in Section 3.1. Subsequently, the data were analysed in three distinct ways after the second-life testing. The degradation during the second life was analysed considering the first-life SoH and then considering both first-life SoH and DM. The second life experimental flowchart is shown in Figure 2.

2.1. Reference Performance Test (RPT)

The RPT of the cells was performed at 25 °C. RPT consists of a capacity test using C/3 current and a pOCV test using C/10 current. For the capacity test, cells were charged first following CC-CV protocol. During the CC phase, the cell underwent charging at a rate of C/3 until the charge voltage reached its designated endpoint of 4.2 V. Following this, during the CV phase, the cells underwent charging at a voltage of 4.2 V until the current reached a value of C/20 (0.25 A). For the p-OCV test; cells were initially discharged at 2.5 V, then charged to 4.2 V using C/10 current following the CC-CV protocol with a cutoff current of C/20 (0.25 A) in the CV phase. C/10 discharge step is used to derive the IC curve.

2.2. Second Life Degradation Test

Second-life degradation was performed by cycling every cell using the same duty cycle. After cycling for a full equivalent month (FEM) of real-world usage, an RPT was performed, and cycling resumed afterwards. All cycling was carried out at an ambient temperature of 25 °C. The test continued until the cells reach around 70% SoH.
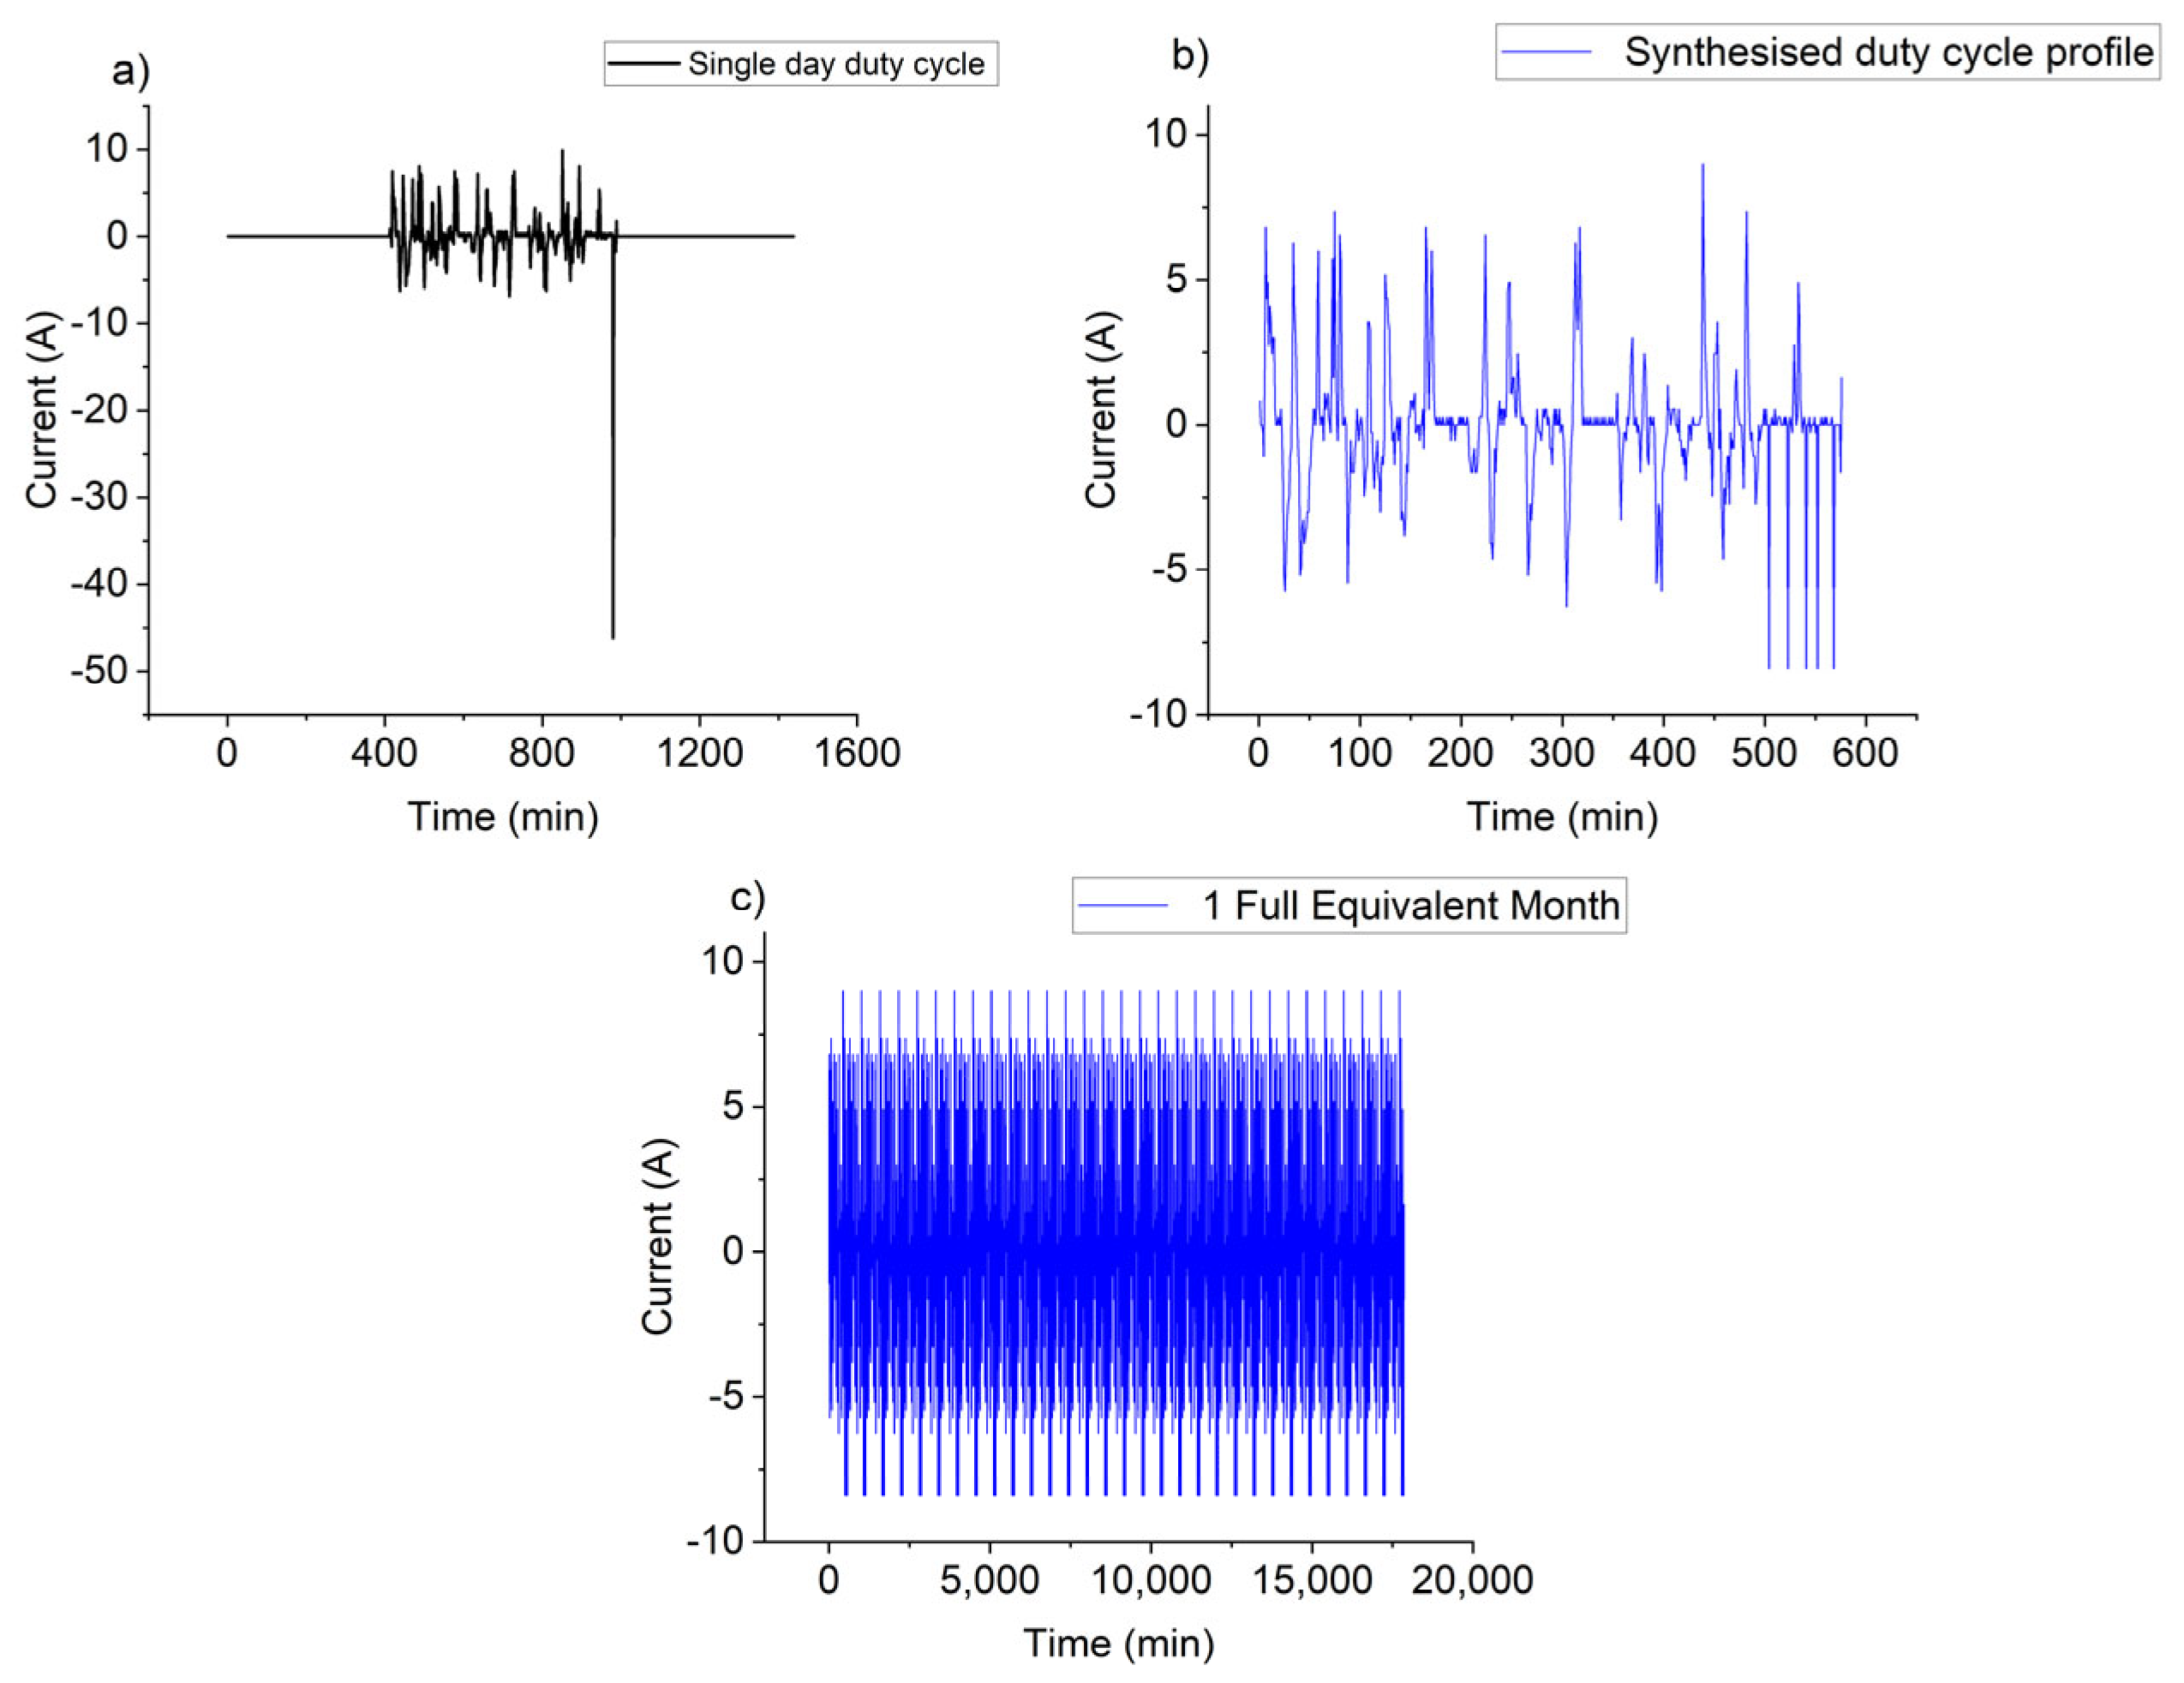
The second-life duty cycle was derived from second-life battery packs performing grid services. The original duty cycle profile is shown in Figure 3 and was provided by an independent industrial partner. The battery pack was a first-generation Nissan leaf battery with 33 Ah capacity. Thus, the duty cycle profile needs to be scaled down to match the capacity level of 21,700 NMC for the cells used for this study.
The profile (Figure 3a) experienced an extended rest period, around 14 h, on that day. To accelerate the second life experiment, this rest period can be reduced. This will reduce the calendar life degradation and may affect the cycle life performance of the cell compared to the real world [22]. However, this will not have a major implication for the research question being investigated as part of this research as this study only investigates the degradation of cells in their second life that have undergone a similar second-life profile, and the influence of the reduced calendar life degradation is beyond the scope of this article.
After reducing the rest period, the duty cycle duration was reduced from 24 h to approximately 10 h, as shown in Figure 3b. Nissan Leaf battery cells have a higher power capability than the cells used here. Therefore, on a couple of occasions, the high current pulse was scaled to the maximum capability of the cell used here; this profile can be seen in Figure 3a. To create a cycling profile representing one month of real world cycling, the profile in Figure 3b is repeated 31 times, as shown in Figure 3c. This synthesised monthly profile is considered as one FEM. Due to the accelerated duty cycle, the degradation mechanism of the cells can change or cause the evolution of a new degradation mechanisms. However, it will be the same for all the cells. Hence, it is argued that it will not impact the authors’ aim with this dataset.
After second-life testing, post-second-life test results are validated by further postmortem analysis. Hence, details of the cell disassembly and postmortem characterisation technique (i.e., scanning electron microscopy) are provided below.

2.3. Cell Disassembly

To reduce the risk of cell damage and reactivity during dismantling, the cells were discharged to 2.7 V with a continuous current of 0.5 A (C/10) until the current was reduced to 0.2 A (C/25). After being discharged, the cells were opened in an argon-filled glove box with a concentration of oxygen and water below 0.1 ppm. The jelly roll was unwound gently after the cell container was opened. The outer separator, anode, inner separator, and cathode were isolated from one another with care. For visual inspection of the jellyroll, digital photographs were taken with a Nikon (D3400) camera (Nikon, Minato City, Tokyo) with fixed camera settings (ISO = 800, shutter speed 1/60 s, aperture F5, white balance = fluorescent) under similar light conditions.

2.4. Scanning Electron Microscopy (SEM)

A field-emission scanning electron microscope (FE-SEM) (Sigma, Zeiss, XmaxN 80, Oxford Instruments, Abingdon, UK), integrated with an energy-dispersive X-ray spectrometer, was utilised for SEM. To retain the microstructure, the cycled electrodes were carried to the SEM chamber using a specially built airless transfer tool (Kammrath and Weiss, Schwerte, Germany). During the image collection an Inlense detector, 5 kV acceleration voltage, and 30 µm aperture were used. SEM was performed to evaluate the morphological changes of the electrodes (aged and fresh condition).

3. Results and Discussion

3.1. Second-Life SoH Analysis Considering Only First Life SoH

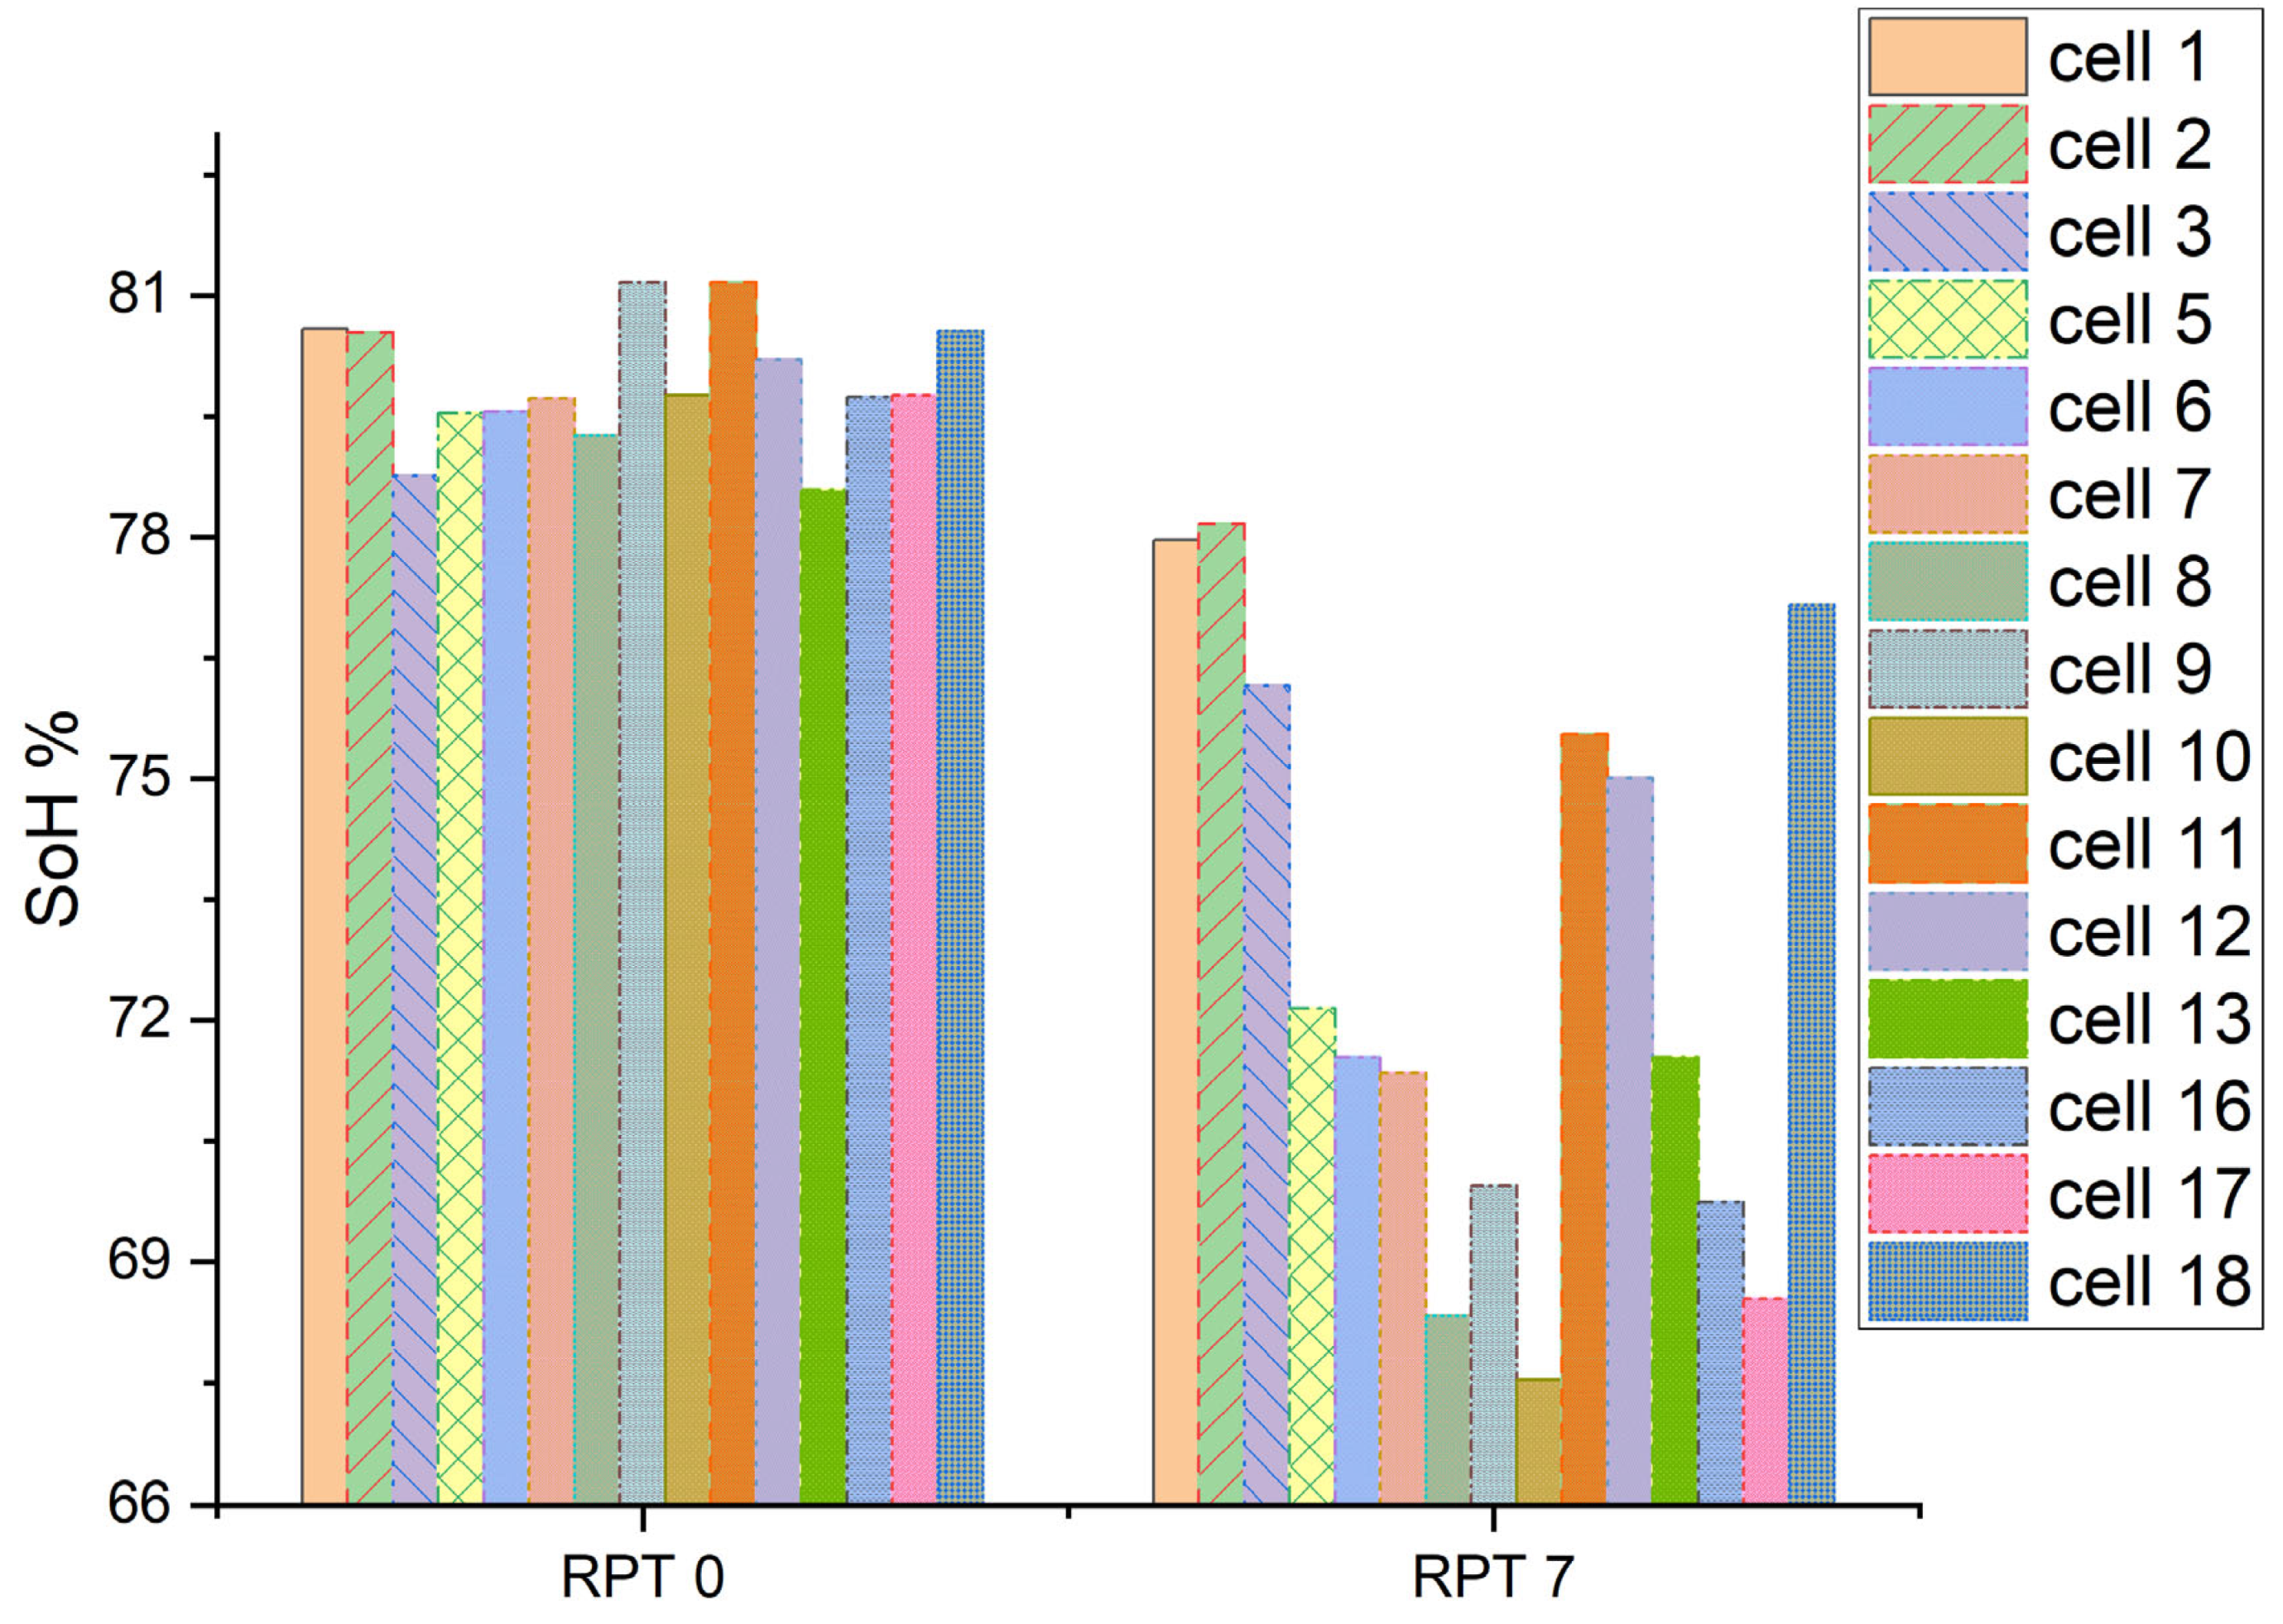
At the beginning of the second-life testing, the SoH of the 15 cells (except Cells 4, 14, and 15) were within the ±1.5% range. However, in the post-second-life test, the cell’s SoH variations exceeded the ±1.5% range, as shown in Figure 4. In Figure 4, RPT 0 represents the SoH of the cell at the beginning of the second-life testing, and RPT 7 represents the SoH of the cell at the end of the second-life testing. However, at the end of the second-life test, the lowest SoH is recorded for Cell 10, at 67.54%, while the highest SoH is observed for Cell 2, reaching 78.16%. Post-second-life test SoH data (Figure 4) reveal the SoH of Cells 1, 2, 3, 11, 12, and 18; 5, 6, 7, and 13; or 9, 10, 16, and 17 within the ±1.5% range. Post-second-life test SoH data also reveal that the SoH of Cells 1, 5, and 10; Cell 2, 5, and 8; or 3, 7, and 16 exceeded the ±1.5% range.
Upon examining the post-second-life SoH, it becomes evident that, when cells are classified solely based on their initial SoH, there is approximately a 20% to 30% likelihood of achieving similar SoH levels during the cell’s second life. As the post-second-life test SoH variations exceeded the ±1.5% range, it is suggested that relying solely on first-life SoH estimation before a second-life application is insufficient to maintain SoH variations within the ±1.5% range during the second-life phase. The wide variation observed in post-second-life SoH underscores that cells with only similar SoH values at the end of the first life do not consistently demonstrate similar ageing characteristics during their second life. Hence, to obtain similar ageing characteristics during the second life, the DMs of the cells need be considered, and cells should be grouped based on the first-life SoH and DM at approximately 80% SoH. Details of the analysis are discussed in the following section.

3.2. Second-Life SoH Analysis Considering First-Life SoH and DM at Approximately 80% SoH

In this section, the second-life SoH of the cells are analysed based on cell’s first-life SoH and DM at approximately 80% SoH. All the cells provided in Table 1 are considered for analysis. However, though most of the cells provided in Table 1 are within the ±1.5% range of SoH, there is variation among the cell’s DMs. Table 1 reveals that four DM types (Type 1, 2, 3, and 4) are mainly observed, and the cells are categorised based on DM. Group 1, Group 2, Group 3, and Group 4 comprise cells of DM types 1, 2, 3, and 4, respectively, as provided in Table 2.
Group 1 cells’ second-life degradation patterns are depicted in Figure 5. It reveals that, in the second life, Cell 1, 2, and 3 degraded almost linearly from RPT 1 to RPT 3; a sharp decrease is observed from RPT 3 to RPT 4. The SoH of these three cells are again slightly increased from RPT 4 to RPT 5, and finally almost linearly decreased from RPT 5 to RPT 7. On the other hand, the SoH of Cell 4 decreased sharply from RPT 1 to RPT 4, slightly increased from RPT 4 to RPT 5, and rapidly decreased from RPT 5 to RPT 7. Given the SoH vs. RPT pattern, it can be inferred that Cell 4 underwent different ageing in its second life in comparison with Cell 1, 2, and 3. Furthermore, Figure 5 suggests that, if cells are graded based on first-life SoH and DM at 80% SoH, among the four cells, three cells degrade similarly during their second life.
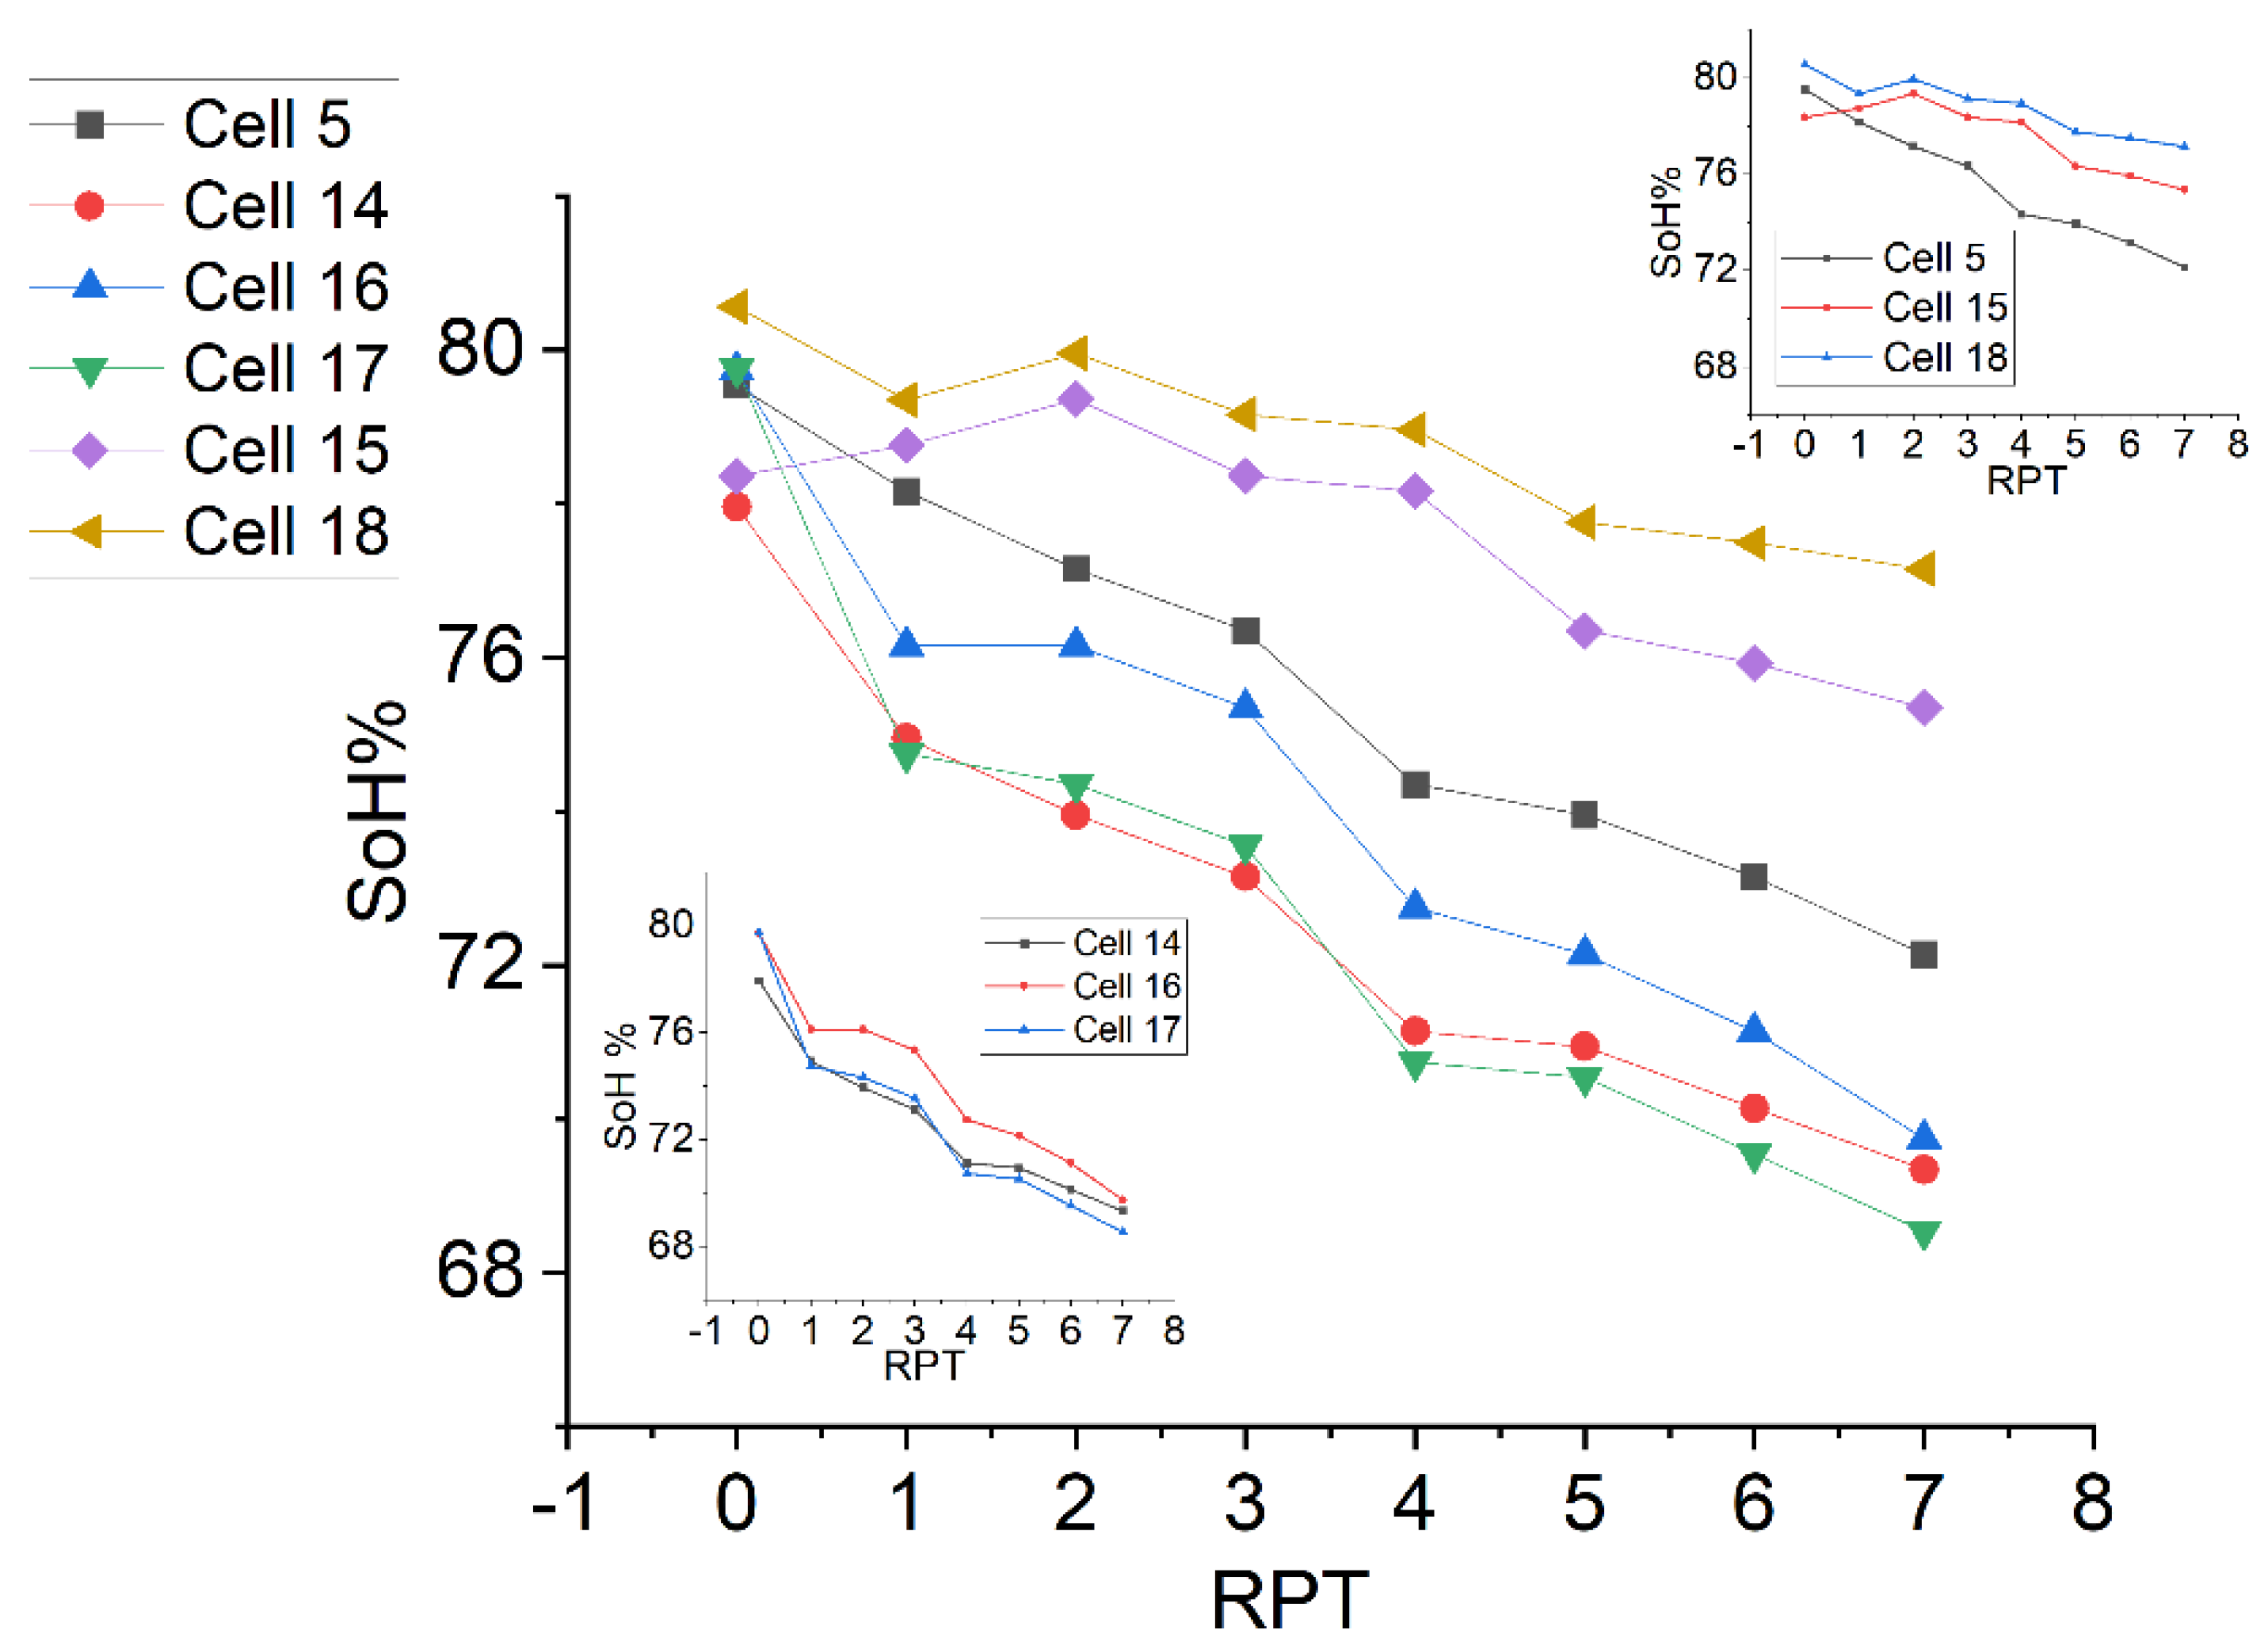
The second-life degradation patterns for the cells in Group 2 are shown in Figure 6. Figure 6 illustrates that the SoH for Cells 14, 16, and 17 experiences a moderate degradation from RPT 1 to RPT 7. Notably, for Cell 16, the SoH remains consistent between RPT 2 and 3, resulting in a flat line instead of a decline during that period. Nevertheless, when examining the second-life SoH vs. RPT pattern for Cells 14, 16, and 17, it becomes evident that these three cells share a remarkably similar degradation pattern. This suggests that these cells underwent similar levels of degradation during their second life. However, Figure 6 illustrates that the second-life SoH vs. RPT patterns for Cells 5, 15, and 18 display noticeable dissimilarities, indicating that these three cells experienced distinct forms of degradation during their second life. This finding indicates that, among the six cells from Group 2, 50% of the cells aged similarly during their second life.
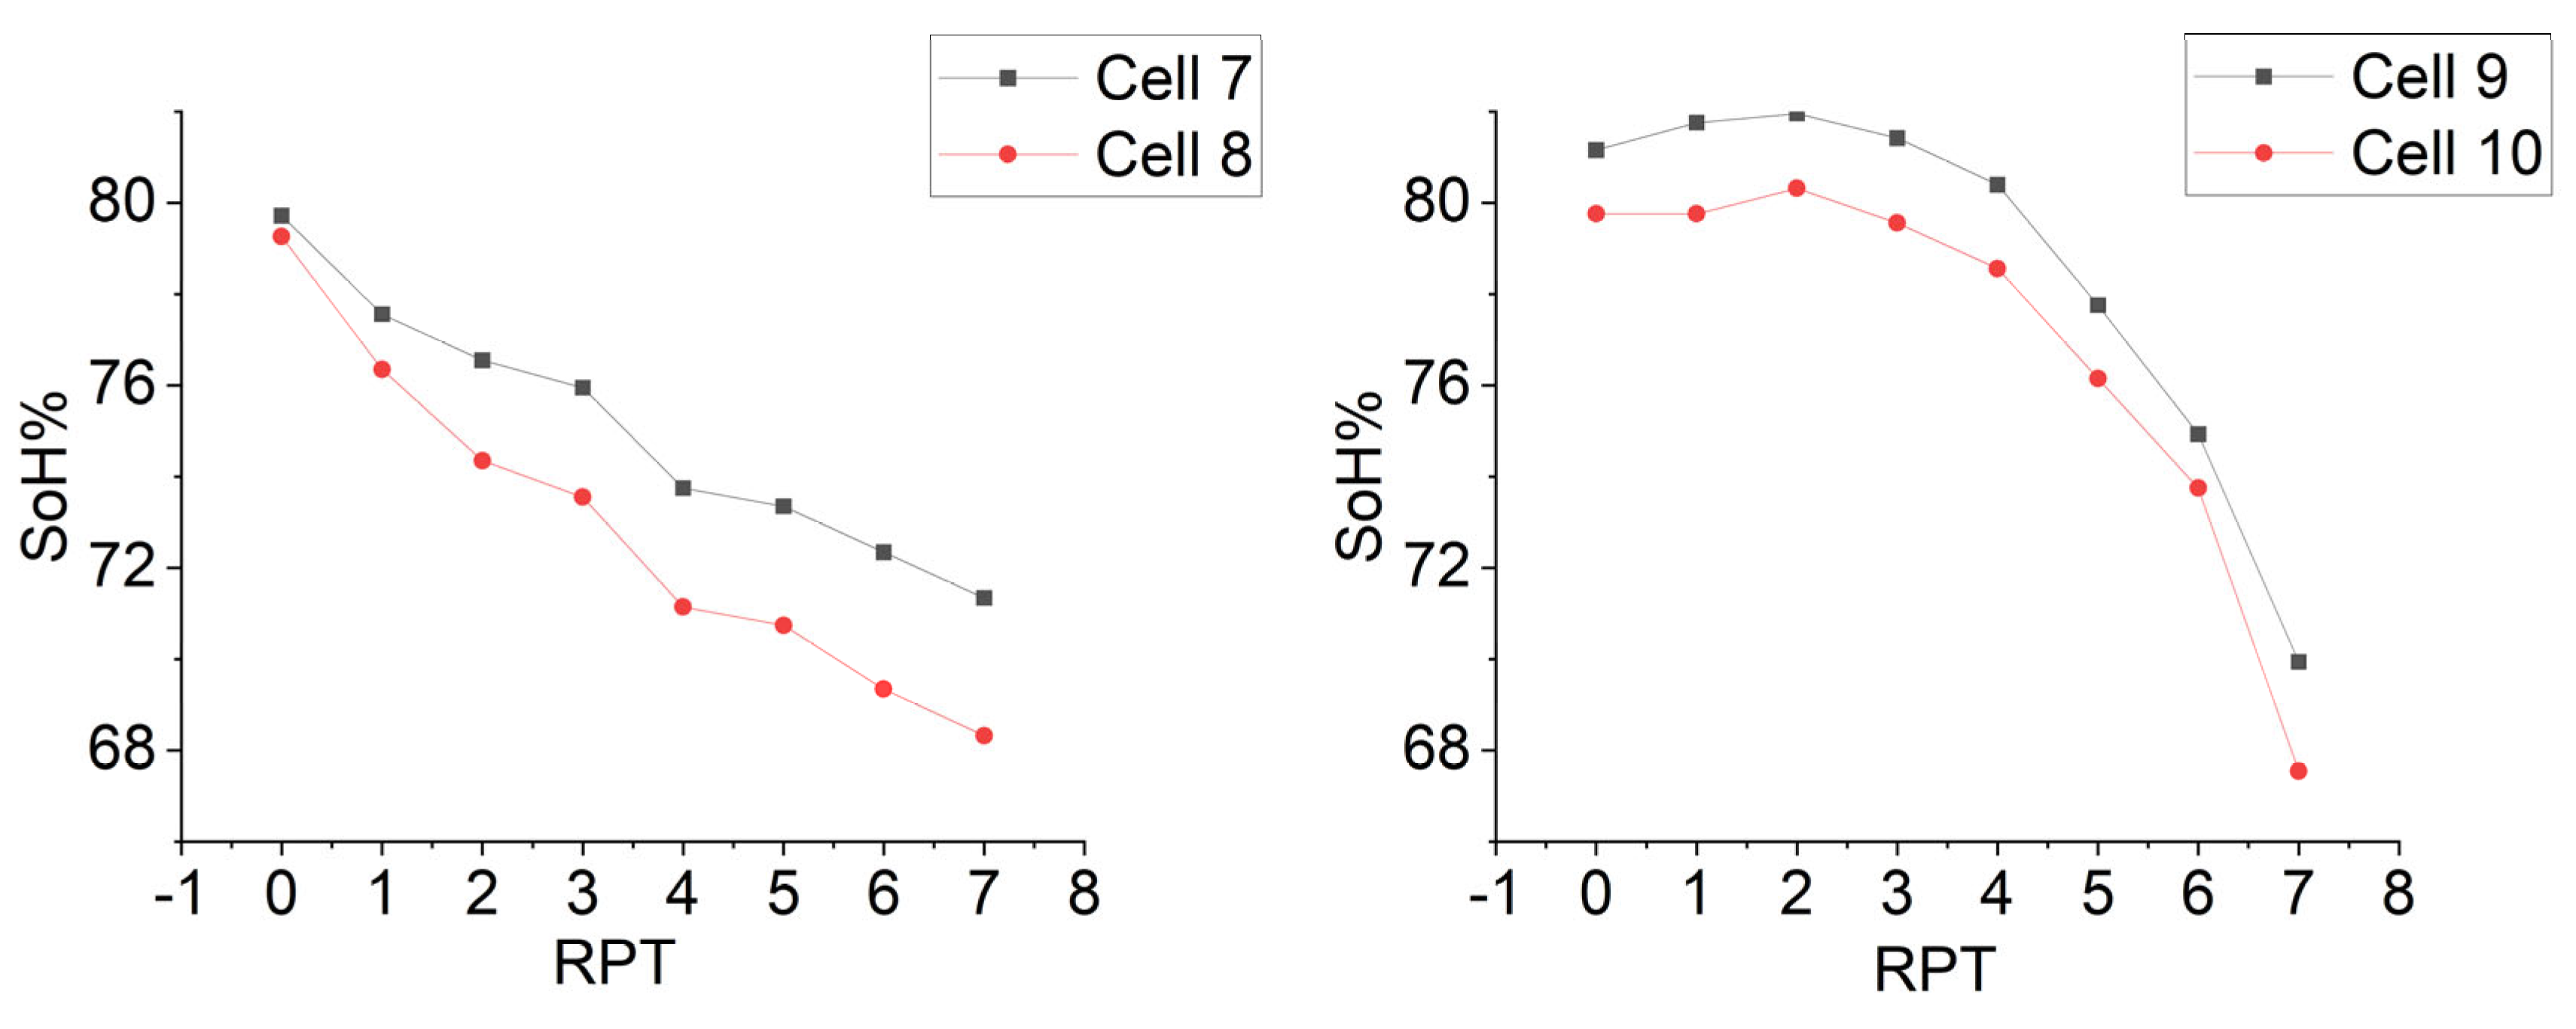
The degradation pattern of Group 3 cells during their second life is illustrated in Figure 7. Figure 7 indicates that the SoH for Cell 7 and 8 experienced nearly linear degradation with a moderate decrease, while for Cell 9 and 10, SoH exhibited a decline following a polynomial order (y = ax2 + bx + c). Consequently, when examining the second-life SoH vs. RPT pattern, it becomes evident that Cell 7 and 8/Cell 9 and 10 share a similar profile. This suggests that Cell 7 and 8/Cell 9 and 10 underwent similar types of degradation during their second life. In the case of Group 3, two cells (either Cell 11 and 12 or 6 and 13) out of four display a similar second-life degradation.
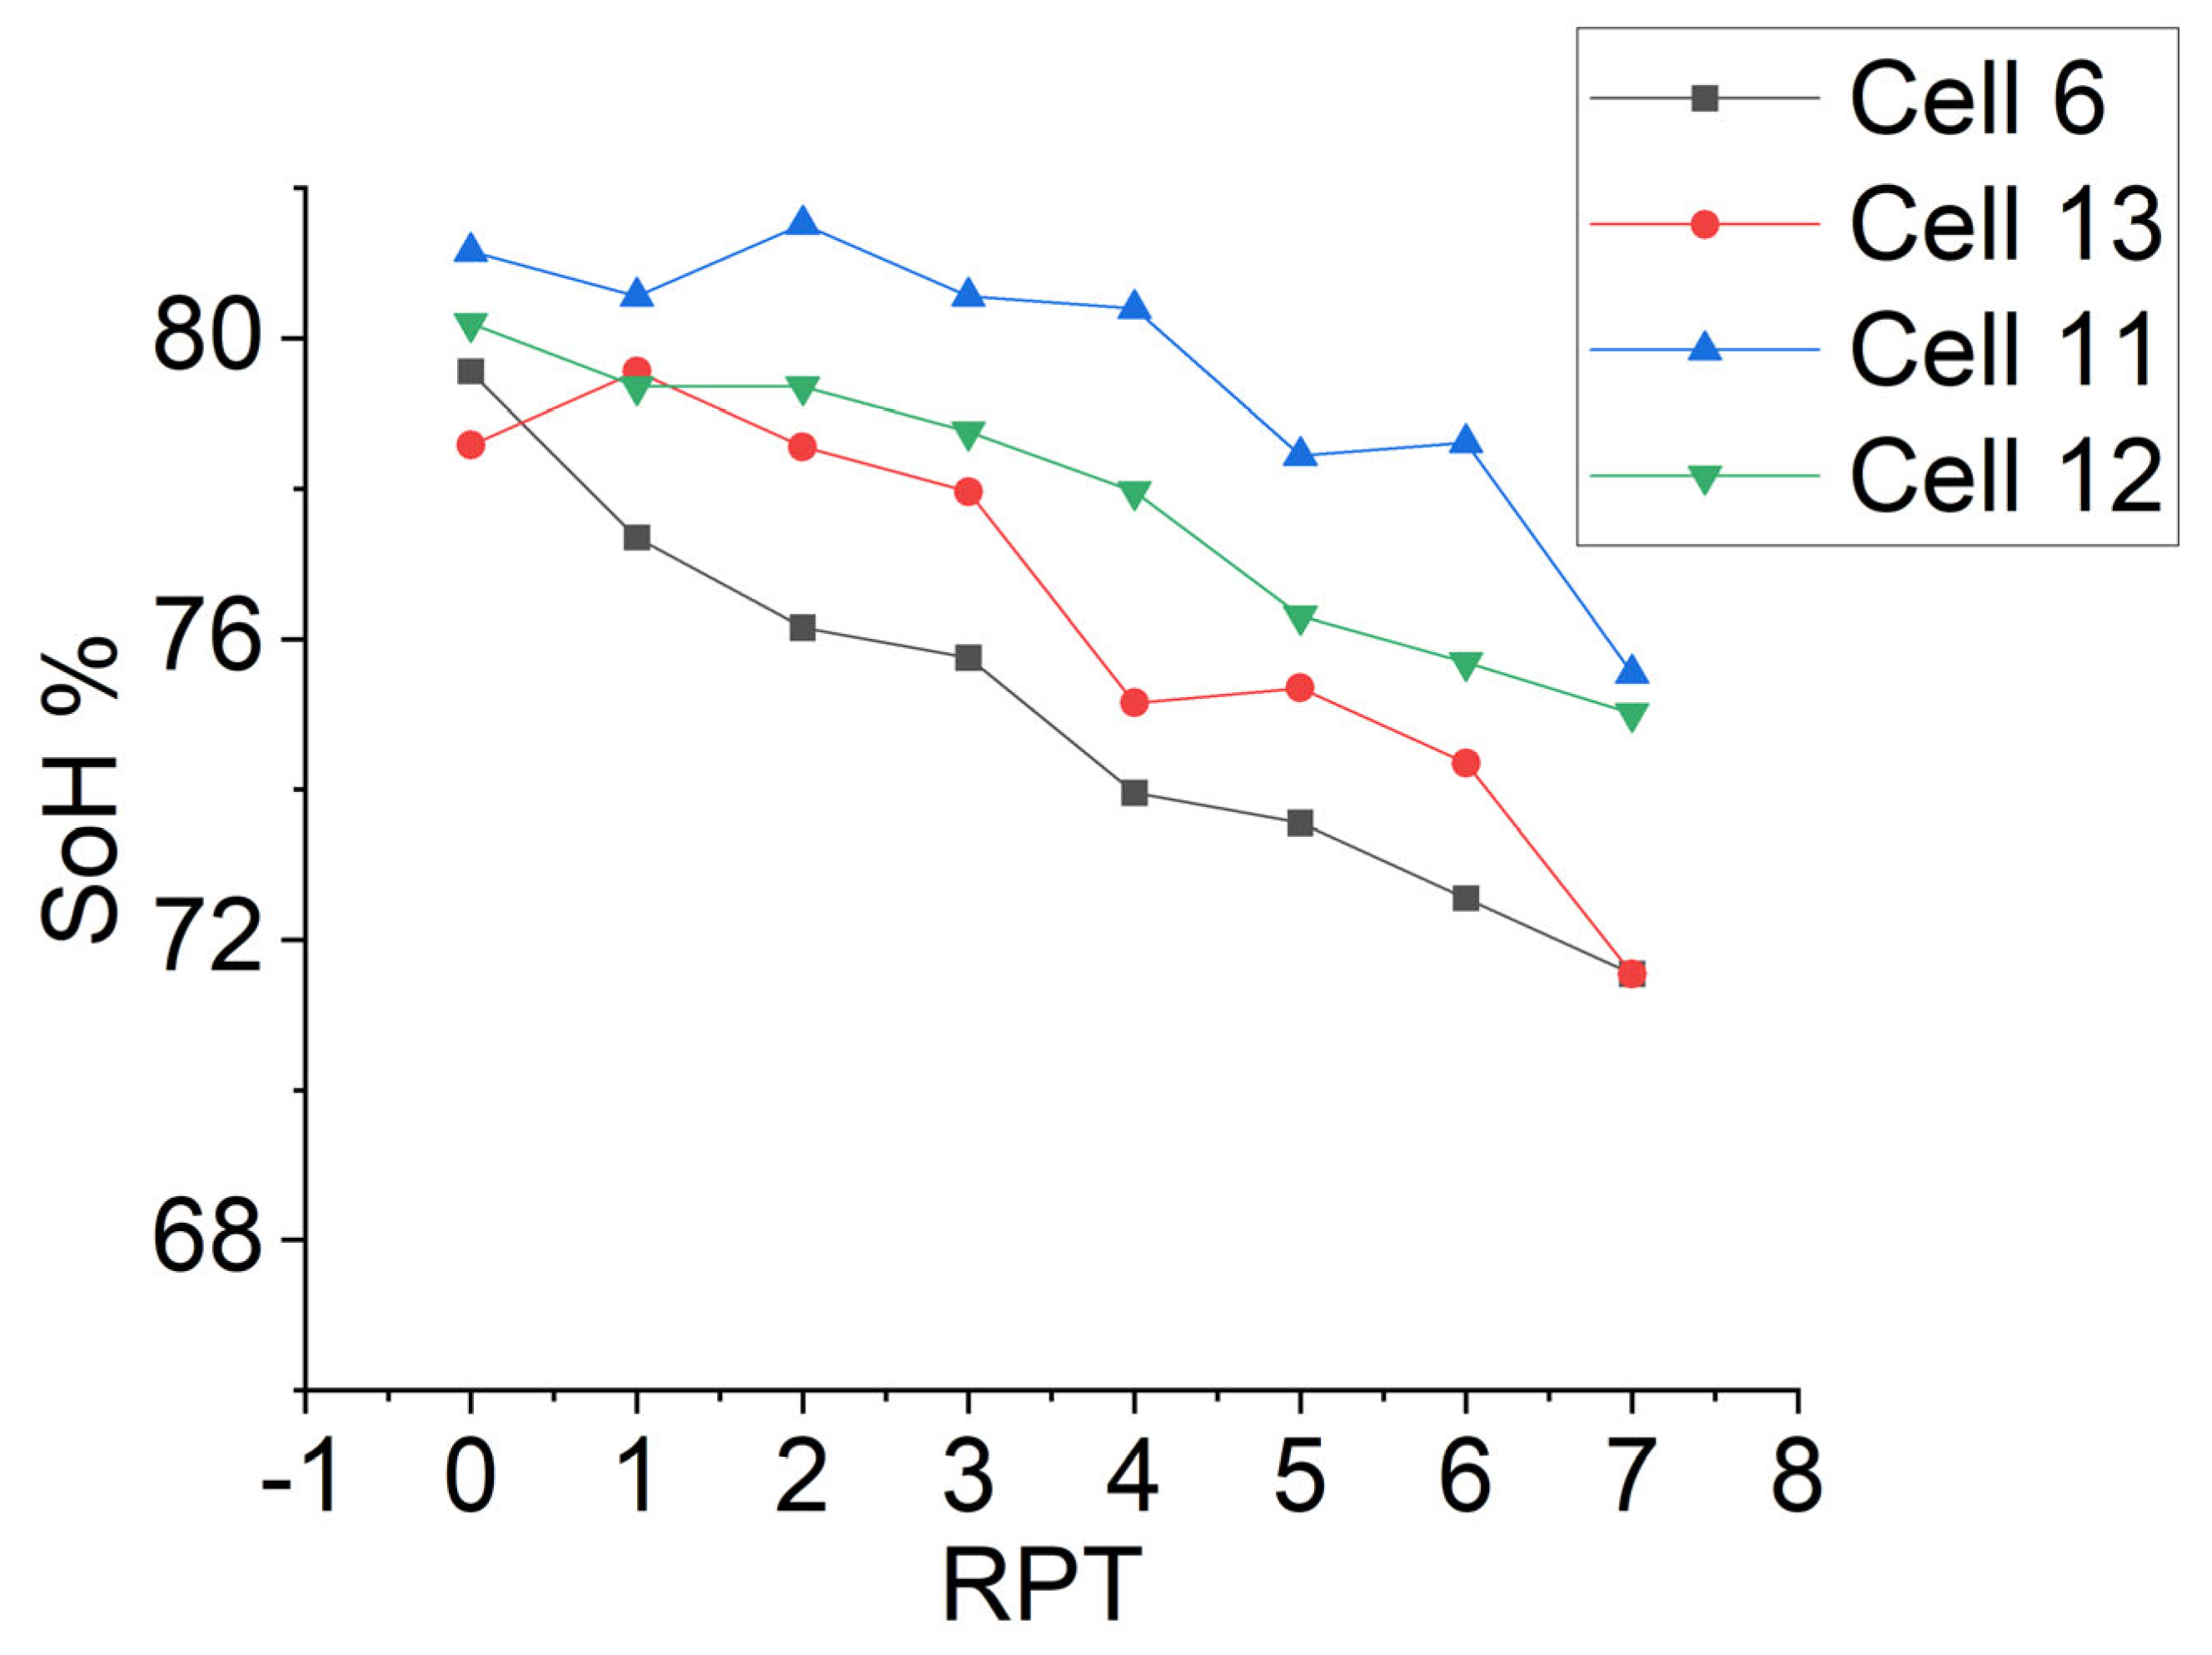
Figure 8 illustrates the degradation pattern of Group 4 cells during their second life. It reveals that the SoH pattern of these four cells degraded randomly and differed from each other.
Comparing the second-life SoH of the cells across these four groups, it becomes evident that approximately 50–75% of the cells exhibited a similar second-life degradation rate when categorised based on their similar first-life SoH and DM at 80% SoH. Though the first life SoH and DM at 80% SoH was similar for the cells in Group 4, the second-life ageing pattern of the Group 4′s cells were different from each other.
In this section, cells are clustered based on first life SoH and DM at 80% SoH. Due to variations in usage patterns in the first life, different DMs might have been activated at different stages of the first life, which may not have been captured when the DM was identified at only 80% SoH. This could explain witnessing different second life ageing patterns for cells which had a similar first life SoH and DM at 80% SoH. Therefore, the authors wanted to investigate a scenario in which the DMs at certain intervals during first life (100–80% SoH) are available for the grading process, which is discussed in the following section.

3.3. Second Life SoH Analysis Considering First Life SoH and DM at Approximately 95%, 90%, 85% and 80% SoH

Utilising the Table 3. DM of the cells from Group 1 at around 95%, 90%, 85%, and 80% SoH, Table 2 can be revised. The DMs of cells from Group 1 across four distinct SoH levels are identified, as summarised in Table 3. Table 3 suggests that, although Cell 4 was included with Cell 1, 2, and 3 based on its DM at 80% SoH, when DMs at 85, 90, and 95% SoH were considered, it no longer belonged to this group. This is because, for Cell 1, 2, and 3, peak 4 (P4) DM was dominated by LLI, LLI, LLIs and LAM at approximately 95%, 90%, 85% and 80% SoH, but for Cell 4 it was dominated by LLI, LLI, LAMs, and LAM at the same SoH intervals. For P2 and P1, dissimilarities were seen over the same SoH intervals. Consequently, it can be said that the DM of Cell 4 at different SoH was different from Cell 1, 2, and 3. Thus, Cell 4 aged differently in its second life (Figure 5). The DMs of Cell 1, 2, and 3 were similar at different SoH levels (i.e., approximately 95%, 90%, 85%, and 80%), thus Cell 1, 2, and 3 displayed similar ageing patterns (Figure 5).
At 95 and 90% SoH, the peak P1 and P2 height increased instead of decreased. The increase in peak height is also mentioned by Dubarry et al. [33], and the most pertinent DM to the increase in peak height has yet to be identified. However, peak height should decrease according to the Degradation Mode identification technique [12,17,34]. Thus, when peak height increases, those peaks are defined as unidentified peaks (U) in this article.
A consistent pattern emerges when assessing the DM of Group 2’s cells at approximately 95%, 90%, 85%, and 80% SoH: the DM profiles for Cell 14, 16, and 17 closely resemble each other. Only P4 in Cell 16 at 95% SoH differs from Cells 14 and 17 (Table 4). Given the consistent DM profiles observed during a cell’s first lifespan, it can be inferred that Cell 14, 16, and 17 underwent similar ageing in their first life. Table 4 also depicts that, for Cell 15, LAM, LLI, LLI and LAM are observed for P4 at approximately 95%, 90%, 85%, and 80% SoH, and U, U, LLI, and LLI are observed for P1; whereas, for Cell 18, LLI, LLI, LAM, and LAM are observed for P4 and U, U, U, and LLI are observed for P1. This finding indicates that three IC peaks are different between Cell 15 and 18. Considering that uniform DM profiles are not consistently observed during a cells’ first lifespan, it can be deduced that Cell 15 and Cell 18 experienced distinct ageing in their first life compared to Cell 14, 16, and 17. As shown in Figure 6, Cell 15 and Cell 18 exhibited distinct ageing patterns in their second life compared to Cell 14, 16, and 17, as evidenced by the disparities in their DM at different SoH levels. In contrast, Cell 14, 16, and 17 exhibited similar ageing characteristics in their second life, as depicted in Figure 6. Their DMs were similar at different SoH levels. The 90% and 85% SoH data sets are not available for Cell 5. Hence, it was not possible to compare its 90% and 85% DM with other cells.
For Group 3, it is found that the first-life DMs of Cell 7 and 8 at 95% and 80% SoH are similar, as shown in Table 5. Meanwhile, the first-life DMs of Cell 9 and 10 at approximately 95%, 90%, 85%, and 80% SoH are almost the same, as shown in Table 5 (only P1 at approximately 90% SoH varied). Figure 7 illustrates that the ageing patterns of Cell 7 and 8 or Cell 9 and 10 were similar, and Table 5 confirms that the DMs of Cell 7 and 8 or Cell 9 and 10 at different SoH levels were also similar. Hence, it can be concluded that, if first-life SoH and DM at different SoH levels are similar, cells experience similar ageing in their second life.
The DMs of Group 4’s cells at different SoH levels are provided in Table 6. Table 6 illustrates that, for Cell 11, P4 is dominated by LLI, LLI, LLI, and LLI and P2 is dominated by LLI, LAM, LAM, and LLI at approximately 95%, 90%, 85%, and 80% SoH. Figure 8 illustrates that the second-life ageing patterns of Cell 11 and 12 are different. Table 6 confirms that the DMs of Cell 11 and 12 are different at approximately 95%, 90%, and 85% SoH. DM similarity is only observed at 80% SoH. This finding indicates that, DM similarity at 80% SoH is not enough to experience a similar degradation in the next life. The 90% and 85% SoH data set is not available for Cell 6 or Cell 13; it was not possible to compare their 90% and 85% DMs with other cells.
Analysing the first-life DM at different SoH levels and second-life ageing patterns (discussed in Section 3.2), it can be concluded that, if the cell’s first-life SoH and DM (one or two IC peak could vary) at different SoH levels (i.e., 95%, 90%, 85%, etc.) are similar, cells age similarly in their second life.
From a practical point of view, it is ideal to identify the DM at 80% SoH or at the end of the first life; however, additional measures of DM might also be available from the first life. This could be the case when a battery is serviced yearly (e.g., with battery health test offered by Tesla [35]). This health test is a long-duration test; thus it is believed that, during a battery health test, cells are charged and discharged at a low C-rate. This low C-rate data can be used to identify the DM at different SoH levels.

4. Postmortem Analysis

In addition to non-invasive techniques, cell disassembly provides a direct method for investigating the cell’s internal changes through postmortem analysis. Cells provided in Table 2 are disassembled, and the photographic and SEM images of these are collected following the process described in Section 2.3 and Section 2.4, respectively. After that, images of the cells from each group are compared with each other to observe any similarities and dissimilarities among the images of the cells.

4.1. Cell Disassembly

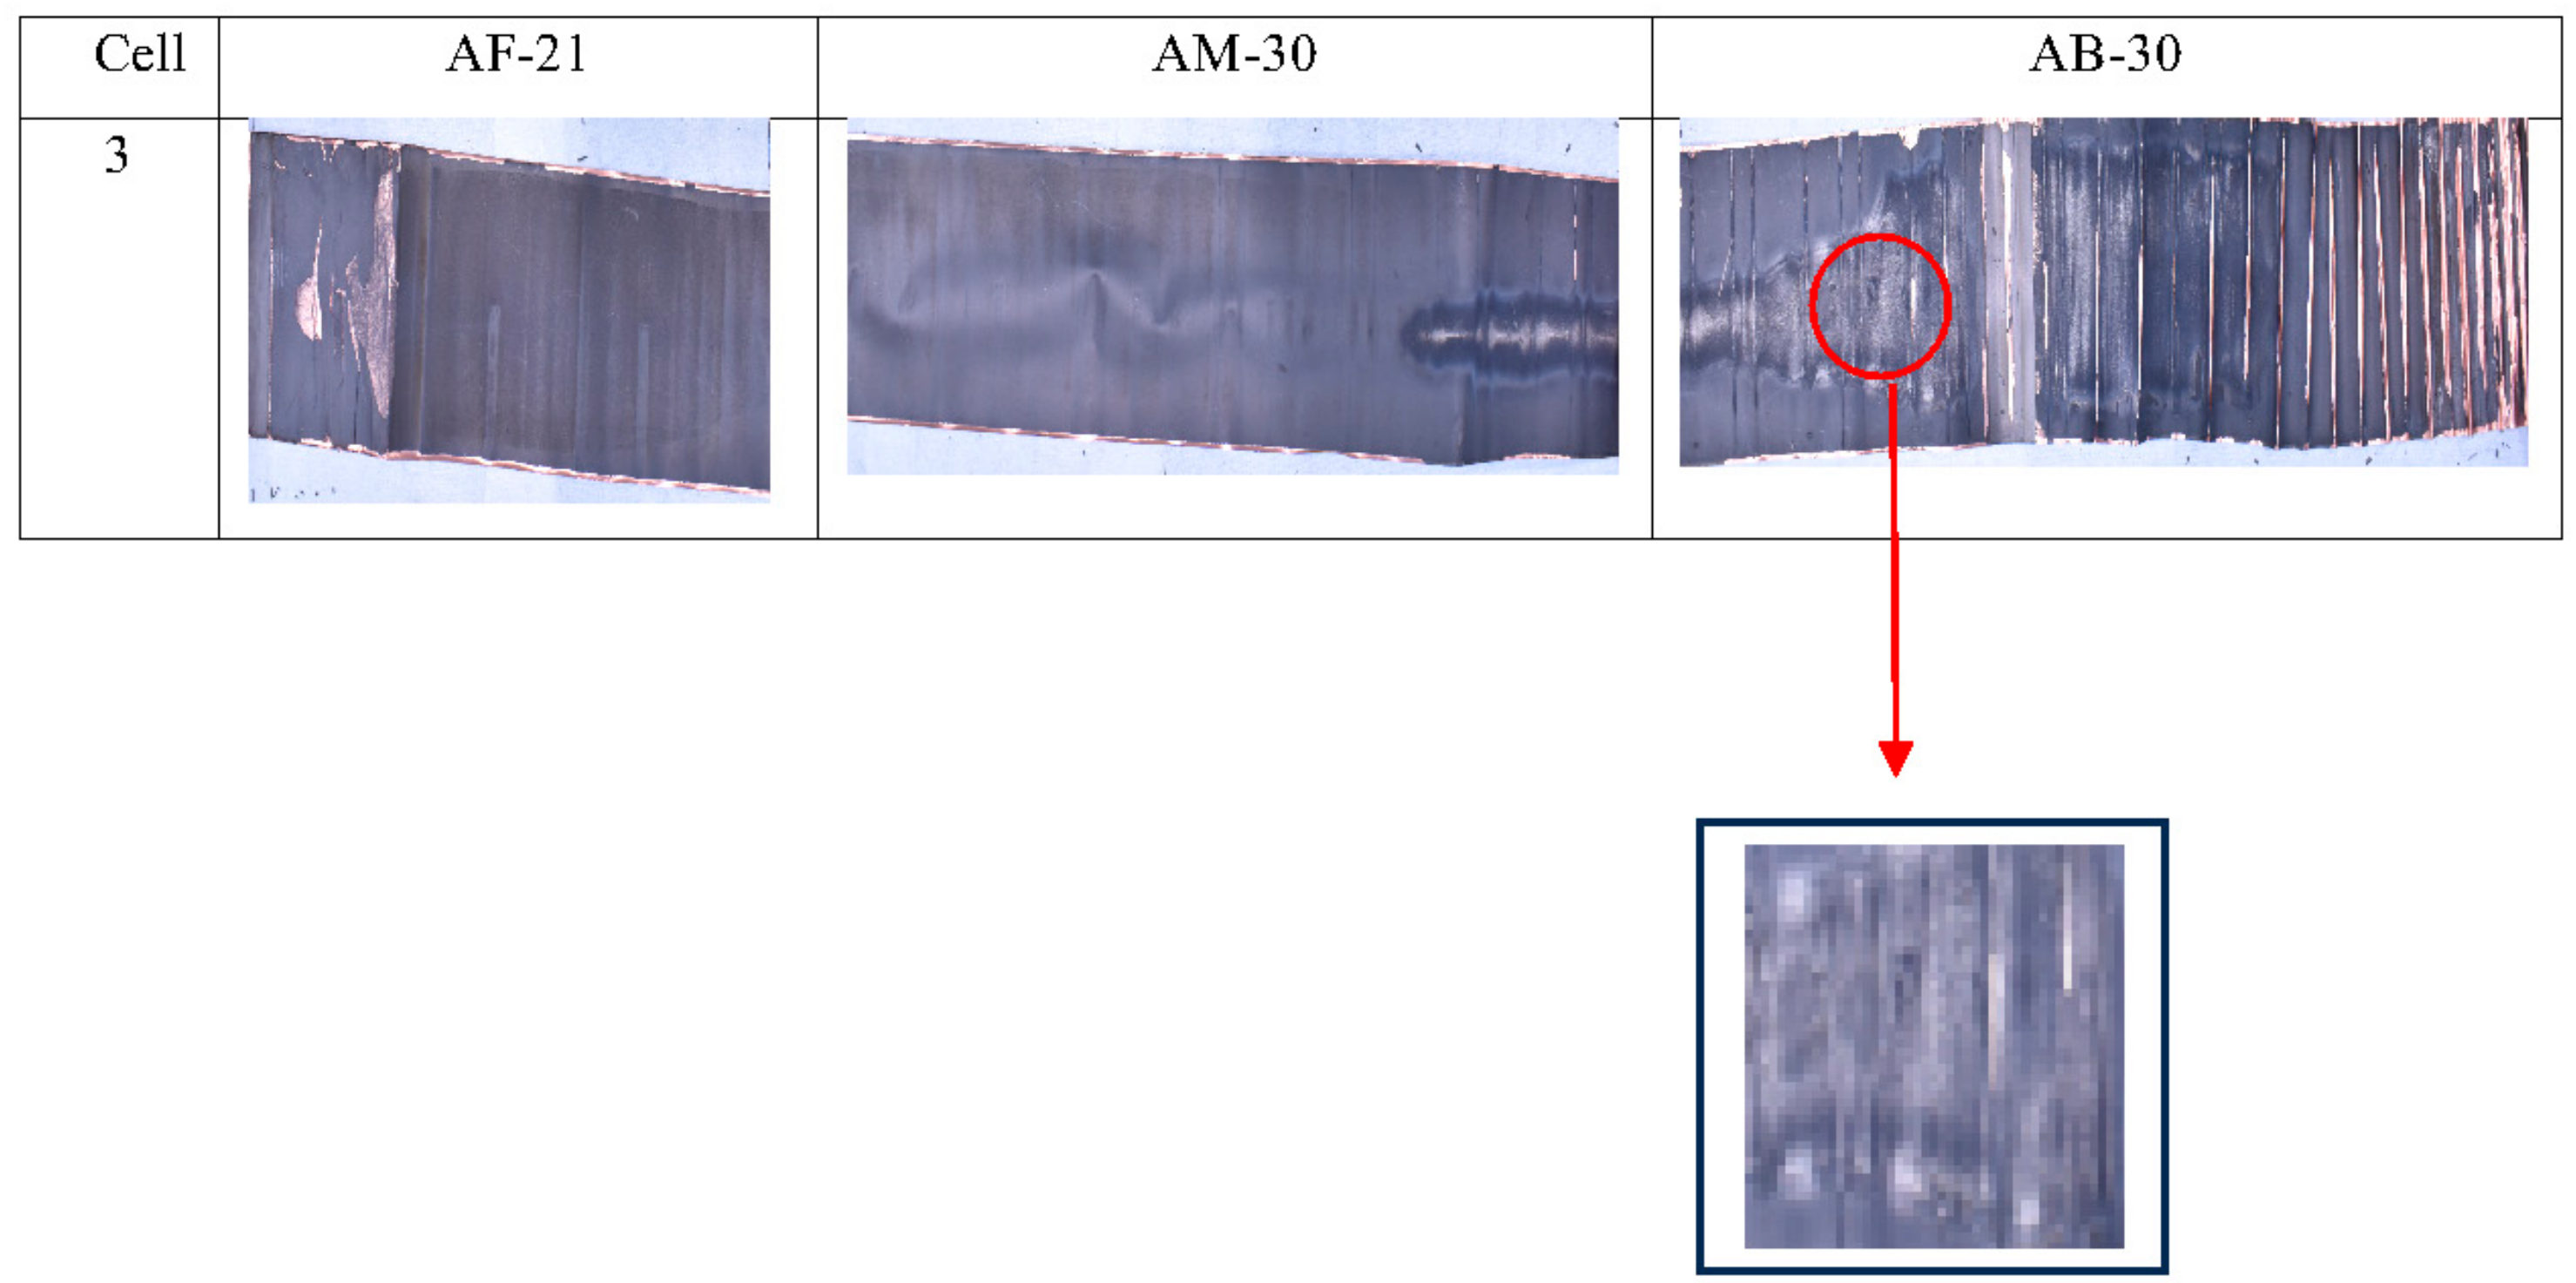
In this article, cells undergo disassembly using the procedure outlined in Section 2.3. After disassembly and the separation of the anode, cathode, and separator components, each anode and cathode sheet is divided into three segments: a front section measuring 21 cm (AF-21), a middle section measuring 30 cm (AM-30), and an end section also measuring 30 cm (AE-30), as depicted in Figure 9. This division is necessary because capturing the entire 81 cm long electrode in a single image is challenging. Upon visual inspection, no discernible changes are noted in the cathode of the aged cells, in line with findings by Bach et al. [27] and Xie et al. [25] In contrast, substantial alterations are observed in the aged anode. Consequently, photographic images of the anode are provided for reference.
Previous research explored changes in the colour of aged electrodes. The authors noted that the anode’s colour transitioned to whitish, metallic grey, or metallic sheen after ageing [25,27,28]. Regardless of the specific colour descriptions, the underlying cause of this change is attributed to either lithium deposition or lithium plating. However, limited literature addresses the specific shape of the regions in which colour changes occur. In most of the published articles, authors often present images of a specific small area of the electrode rather than providing a complete view of the entire electrode. When only a small portion of the electrode is examined, it can be challenging to discern the shape of the areas where the colour change has taken place. For example, when focusing on a particular region of Cell 3’s anode rather than the complete electrode, just the change in colour may be perceived, but the shape remains indistinguishable, as depicted in Figure 9.
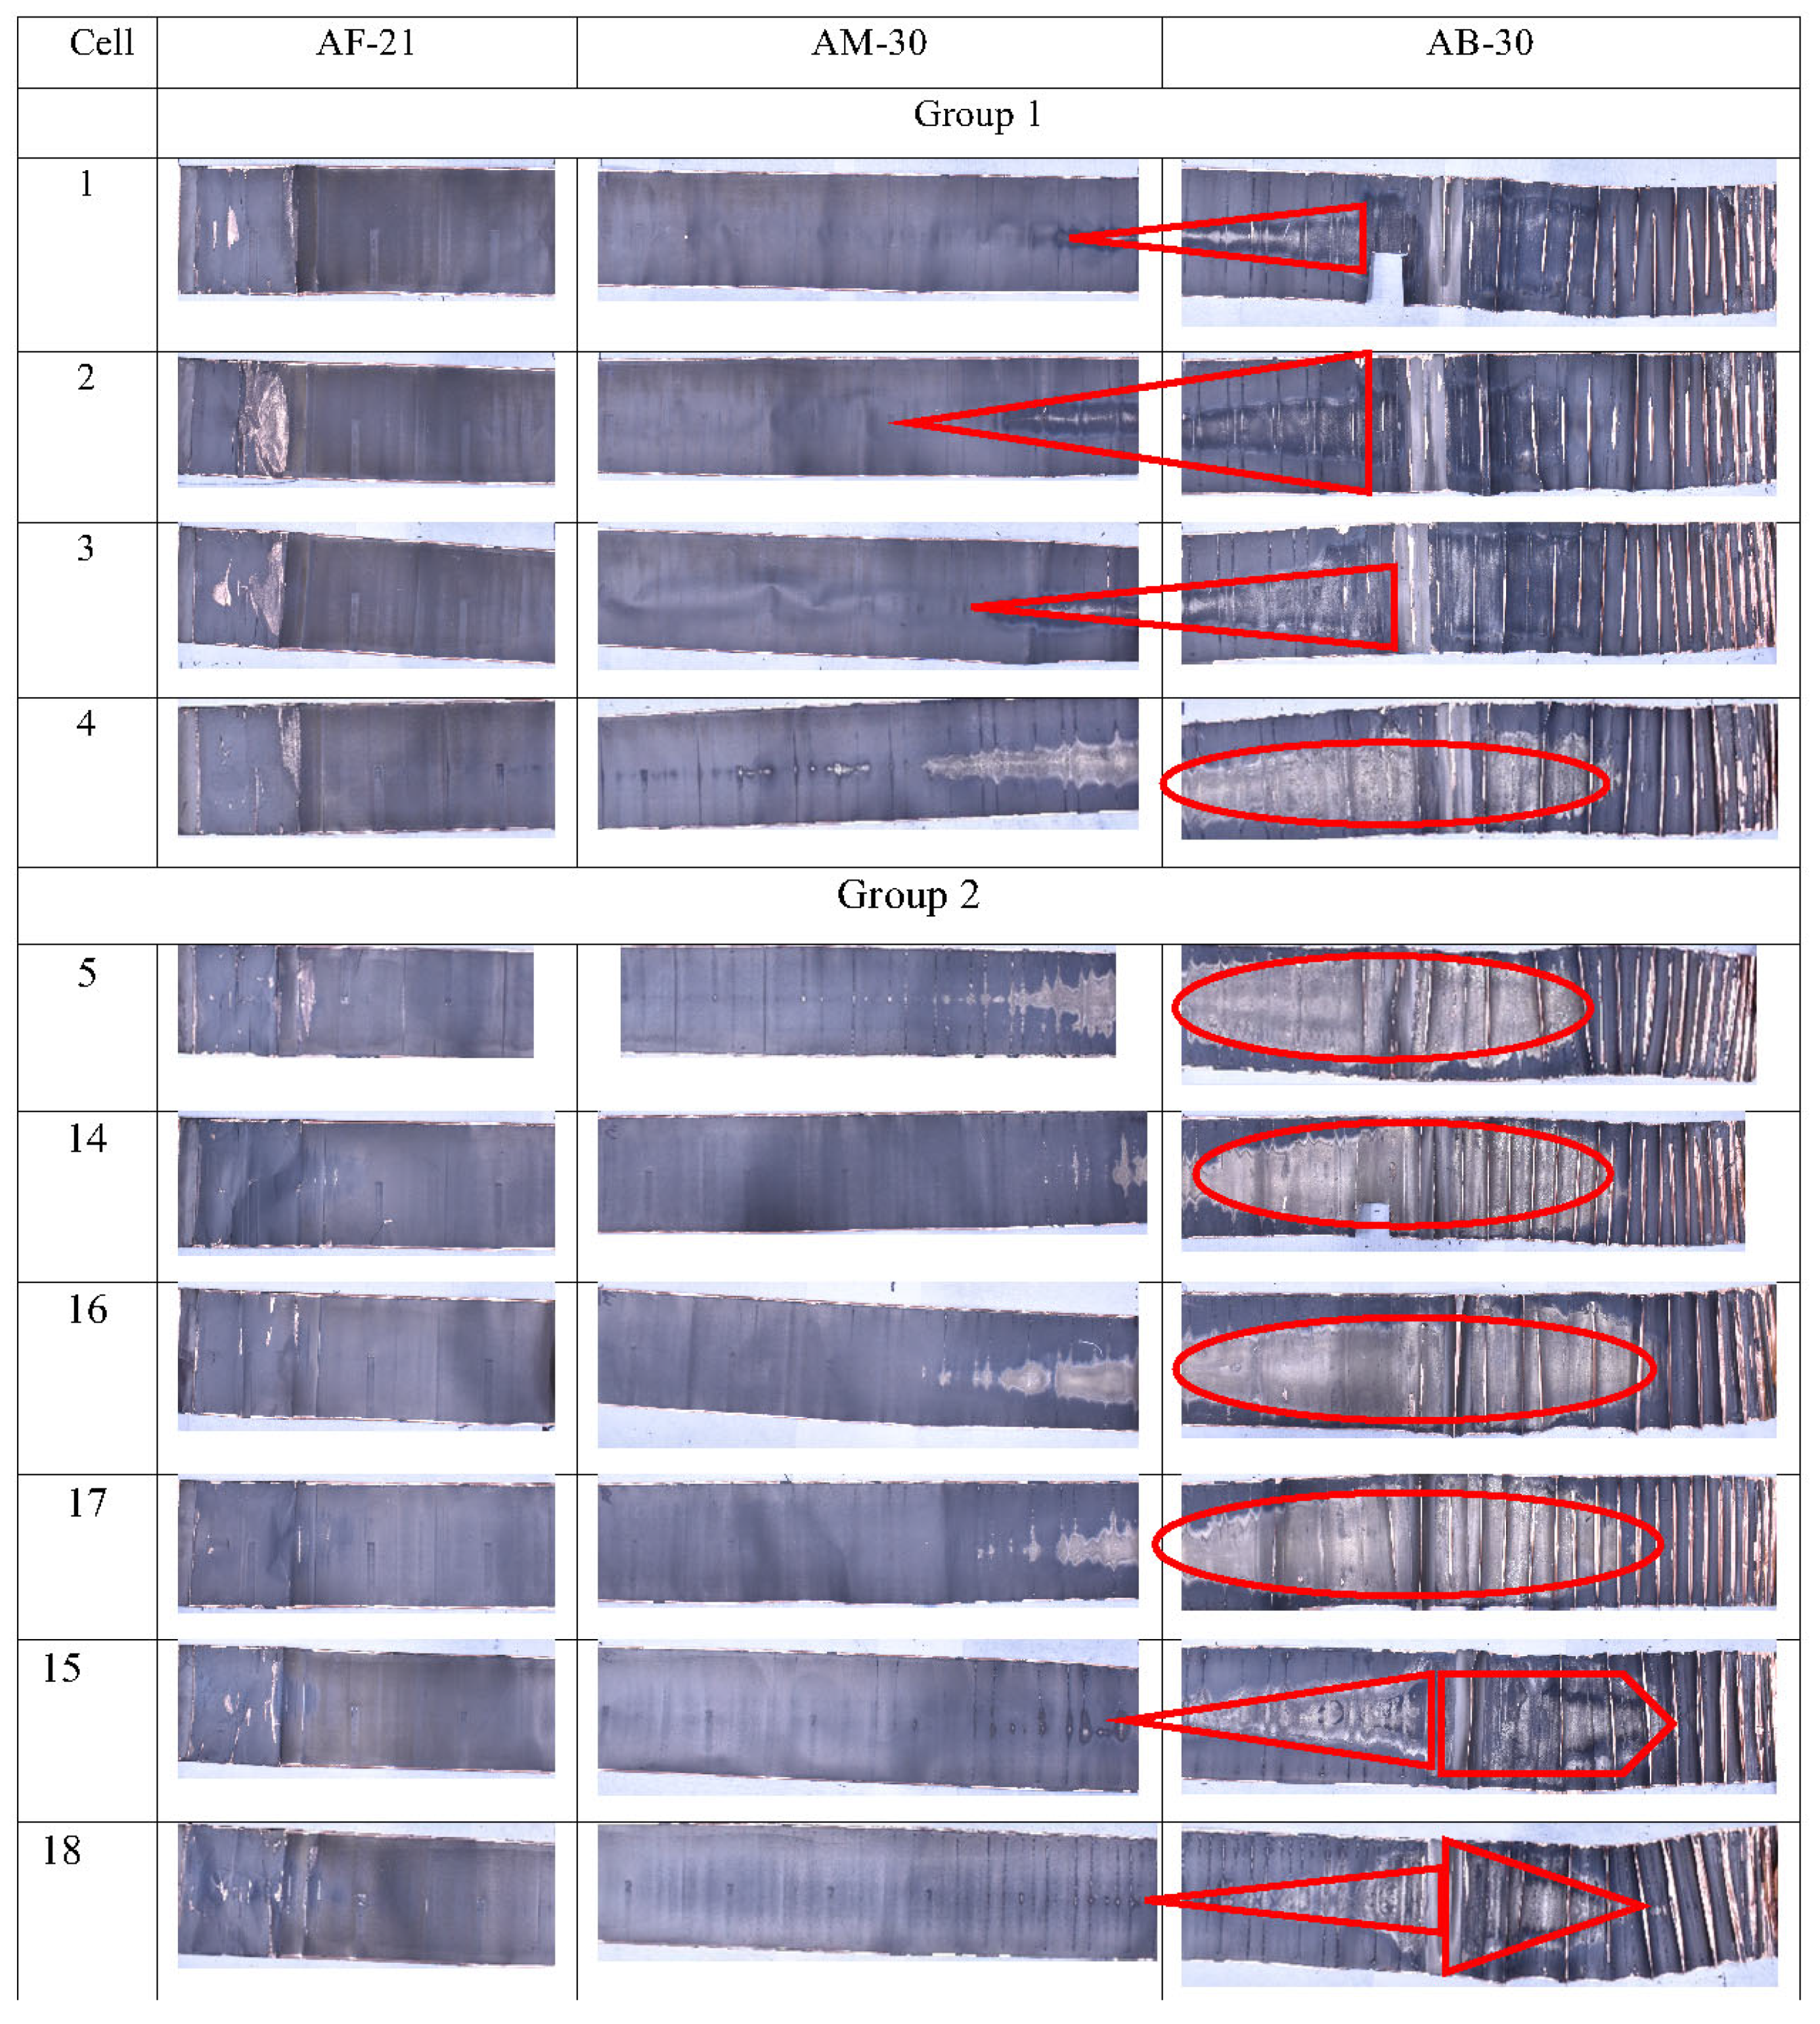
In Group 1, the photographic analysis (Figure 10) reveals the distinct characteristics of the cells. Cell 1, 2, and 3 display cone-shaped black and white shaded areas, while Cell 4 exhibits a whitish oval-shaped region at the end of the jelly roll, with a few whitish dots in the middle. Notably, some copper foil is exposed at the front of all four cells, potentially occurring during the separation of the anode and separator. The photographic image analysis shows that the changes in the anodes of Cell 1, 2, and 3 are similar, while Cell 4’s anode differs from the others. This observation aligns with the findings in Section 3.2 and Section 3.3. It is known from the previous section that Cell 1, 2, and 3 had similar first-life ageing, with similar initial SoH and DM values. Consequently, the second-life ageing of these cells is also similar, as depicted in Figure 5. The photographic images of these three cells confirm that their internal changes during second-life ageing align, indicating that there is a correlation, in that Cell 1, 2, and 3 indeed underwent similar ageing during their second life, while Cell 4 experienced different ageing.
Photographic images of the Group 2 cells reveal distinct characteristics. Specifically, Cell 14, 16, and 17 display oval-shaped whitish areas at the ends of their jelly rolls with irregular patterns in the middle, while the frontal part remains mostly unaffected, except for a few tiny, exposed copper foil areas. In contrast, Cell 15 and 18 have less prominent whitish cone-shaped regions at the end of their jelly rolls, with no significant colour changes in the rest. Visually, Cell 14, 16, and 17 have similar colour-change areas, suggesting extensive lithium plating [25]. Table 1 shows that Cell 14, 16, and 17 exhibited similar ageing in their first life, sharing similar-first life SoH and DM values. Moreover, their second-life ageing patterns are also similar, as illustrated in Figure 6. Photographic evidence of these three cells affirms that their internal changes during second-life ageing align, suggesting a correlation, and confirming that Cell 14, 16, and 17 indeed underwent similar ageing experiences during their second life. Cell 15 and 18, on the other hand, exhibit distinct ageing characteristics. An exception is Cell 5, which visually resembles Cell 14, 16, and 17, with an oval-shaped whitish area at the end of the jelly roll and irregular pattern. However, as Table 4 notes, Cell 5’s first-life ageing differs from the other three, leading to divergent second-life ageing pattern (Figure 6). Nevertheless, the similarity in colour change in their jelly rolls remains unexplained and requires further investigation.
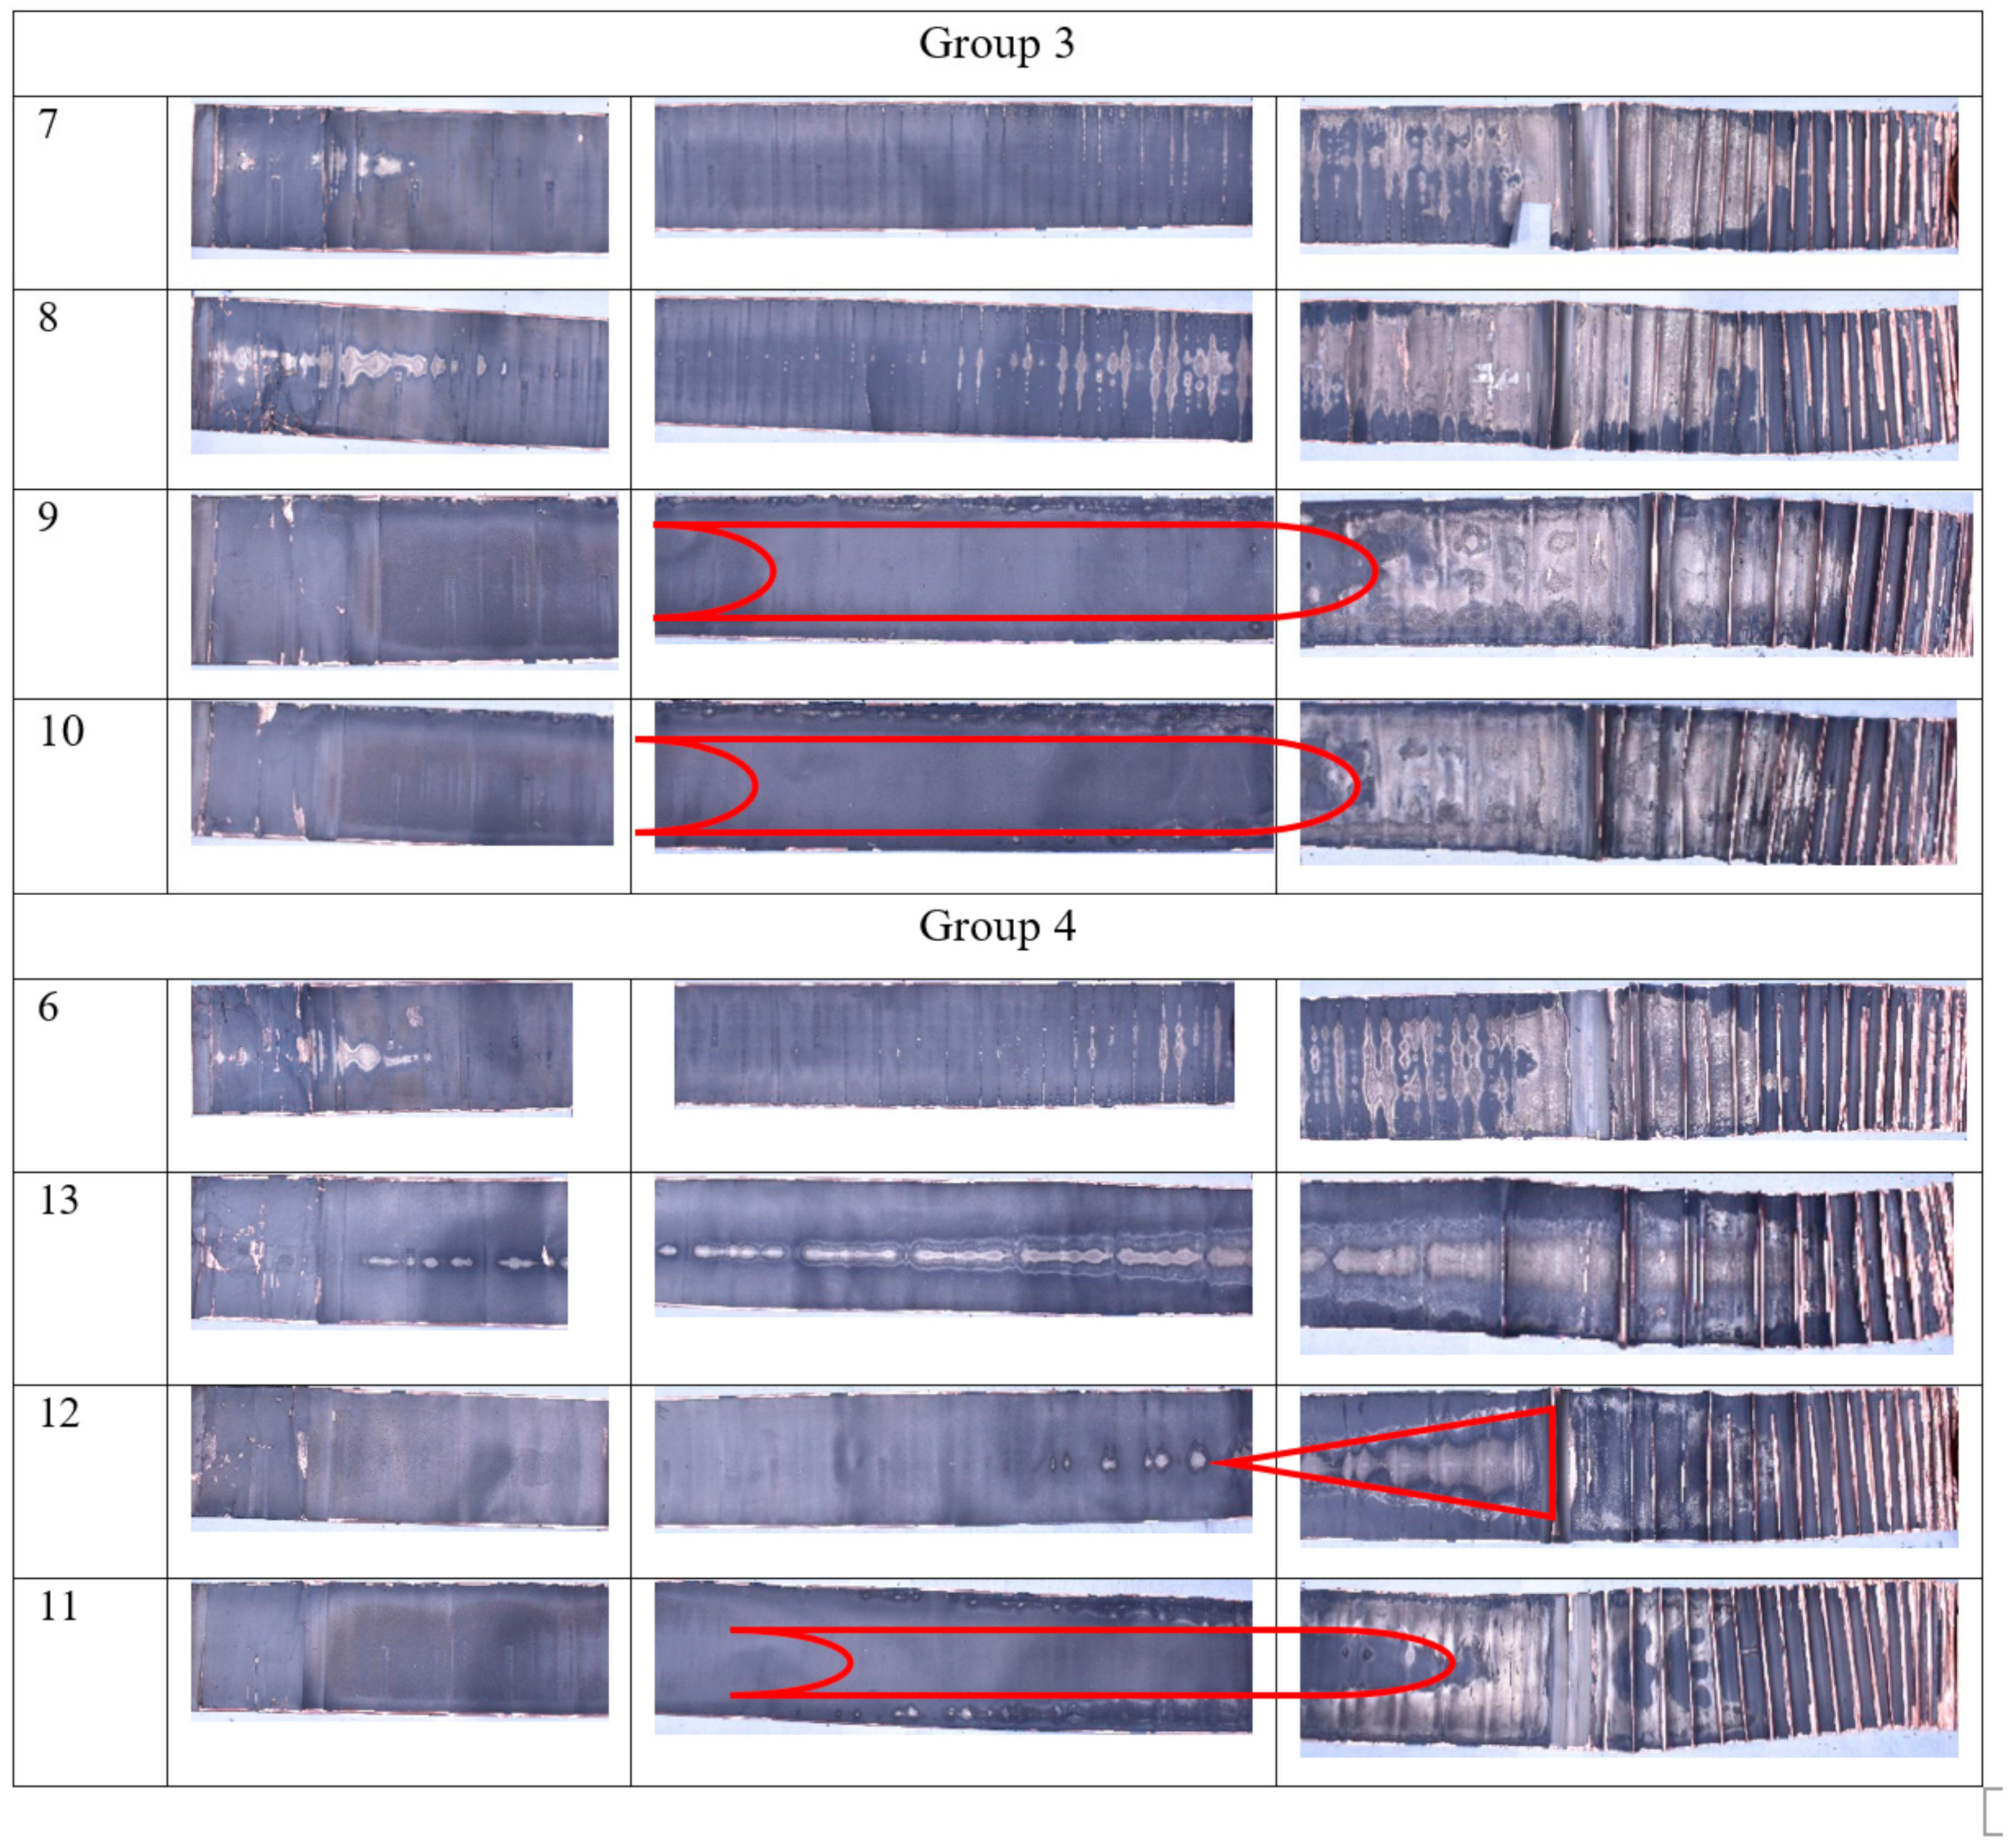
Images of the Group 3 cells exhibit distinguishing characteristics. For example, Cell 7 and 8 have irregular whitish areas at the end of their jelly rolls (as depicted in Figure 10), and vertical stripes in the middle and irregular patterns on the jelly roll’s front area. Cell 9 and 10 exhibit U-shaped whitish regions at the ends of their jelly rolls, with no visible colour change throughout the remainder of the jelly roll. Analysing the photographic images of Group 3’s cells reveals that the anode changes in Cell 7 and 8 are quite similar, while the anode changes in Cell 9 and 10 are similar but different from those in Cell 7 and 8. As described in Table 5 and Figure 7, Cell 7 and 8 experienced similar ageing during their first and second life. The photographic images of these cells reveal that their internal changes also correspond, indicating that Cell 7 and 8, as well as Cell 9 and 10, underwent similar ageing processes in their second life.
The photographs of Group 4’s cells suggest that at the end of the jelly roll, an irregular whitish area is observed for Cell 6, a grey and white shaded area is observed for Cell 13, a cone-shaped grey and white shaded area is observed for Cell 12, and U-shaped whitish area is observed for Cell 11. Details of the visual observation of all the cells are provided in Figure 10. Analysing the photographic image of Group 4’s cells, it is evident that changes in the anode for Cell 6, 11, 12 and 13 are quite different. Moreover, Table 6 and Figure 8 suggest that the first DM and second-life ageing of Cell 6, 11, 12 and 13 are also different.
No signs of degradation were observed on the positive electrode; all the aged positive electrodes remained uniformly black. However, since the photographic images of the cathodes did not offer any valuable information about cell degradation, they were not utilized for further analysis. Summarising the above discussion, it is observed that cells had similar first-life SoH and DM and similar second-life degradation, show similar colour and shape changes at the anode. In order to gather additional evidence supporting the likeness between cells that underwent similar ageing experiences in both their first and second lives, as well as those that exhibited similar photographic images of their anodes, SEM images were acquired for a few cells, which are provided in the following section. Cell 1, 2, 3; Cell 14, 16, 17; Cell 7 and 8; and Cell 9 and 10 experienced similar first- and second-life ageing and presented with similar photographic anode images. Among them, SEM images of Cell 1, 2; Cell 14, 16, 17; and Cell 7 and 8 were collected and are described below.

4.2. Scanning Electron Microscopy (SEM)

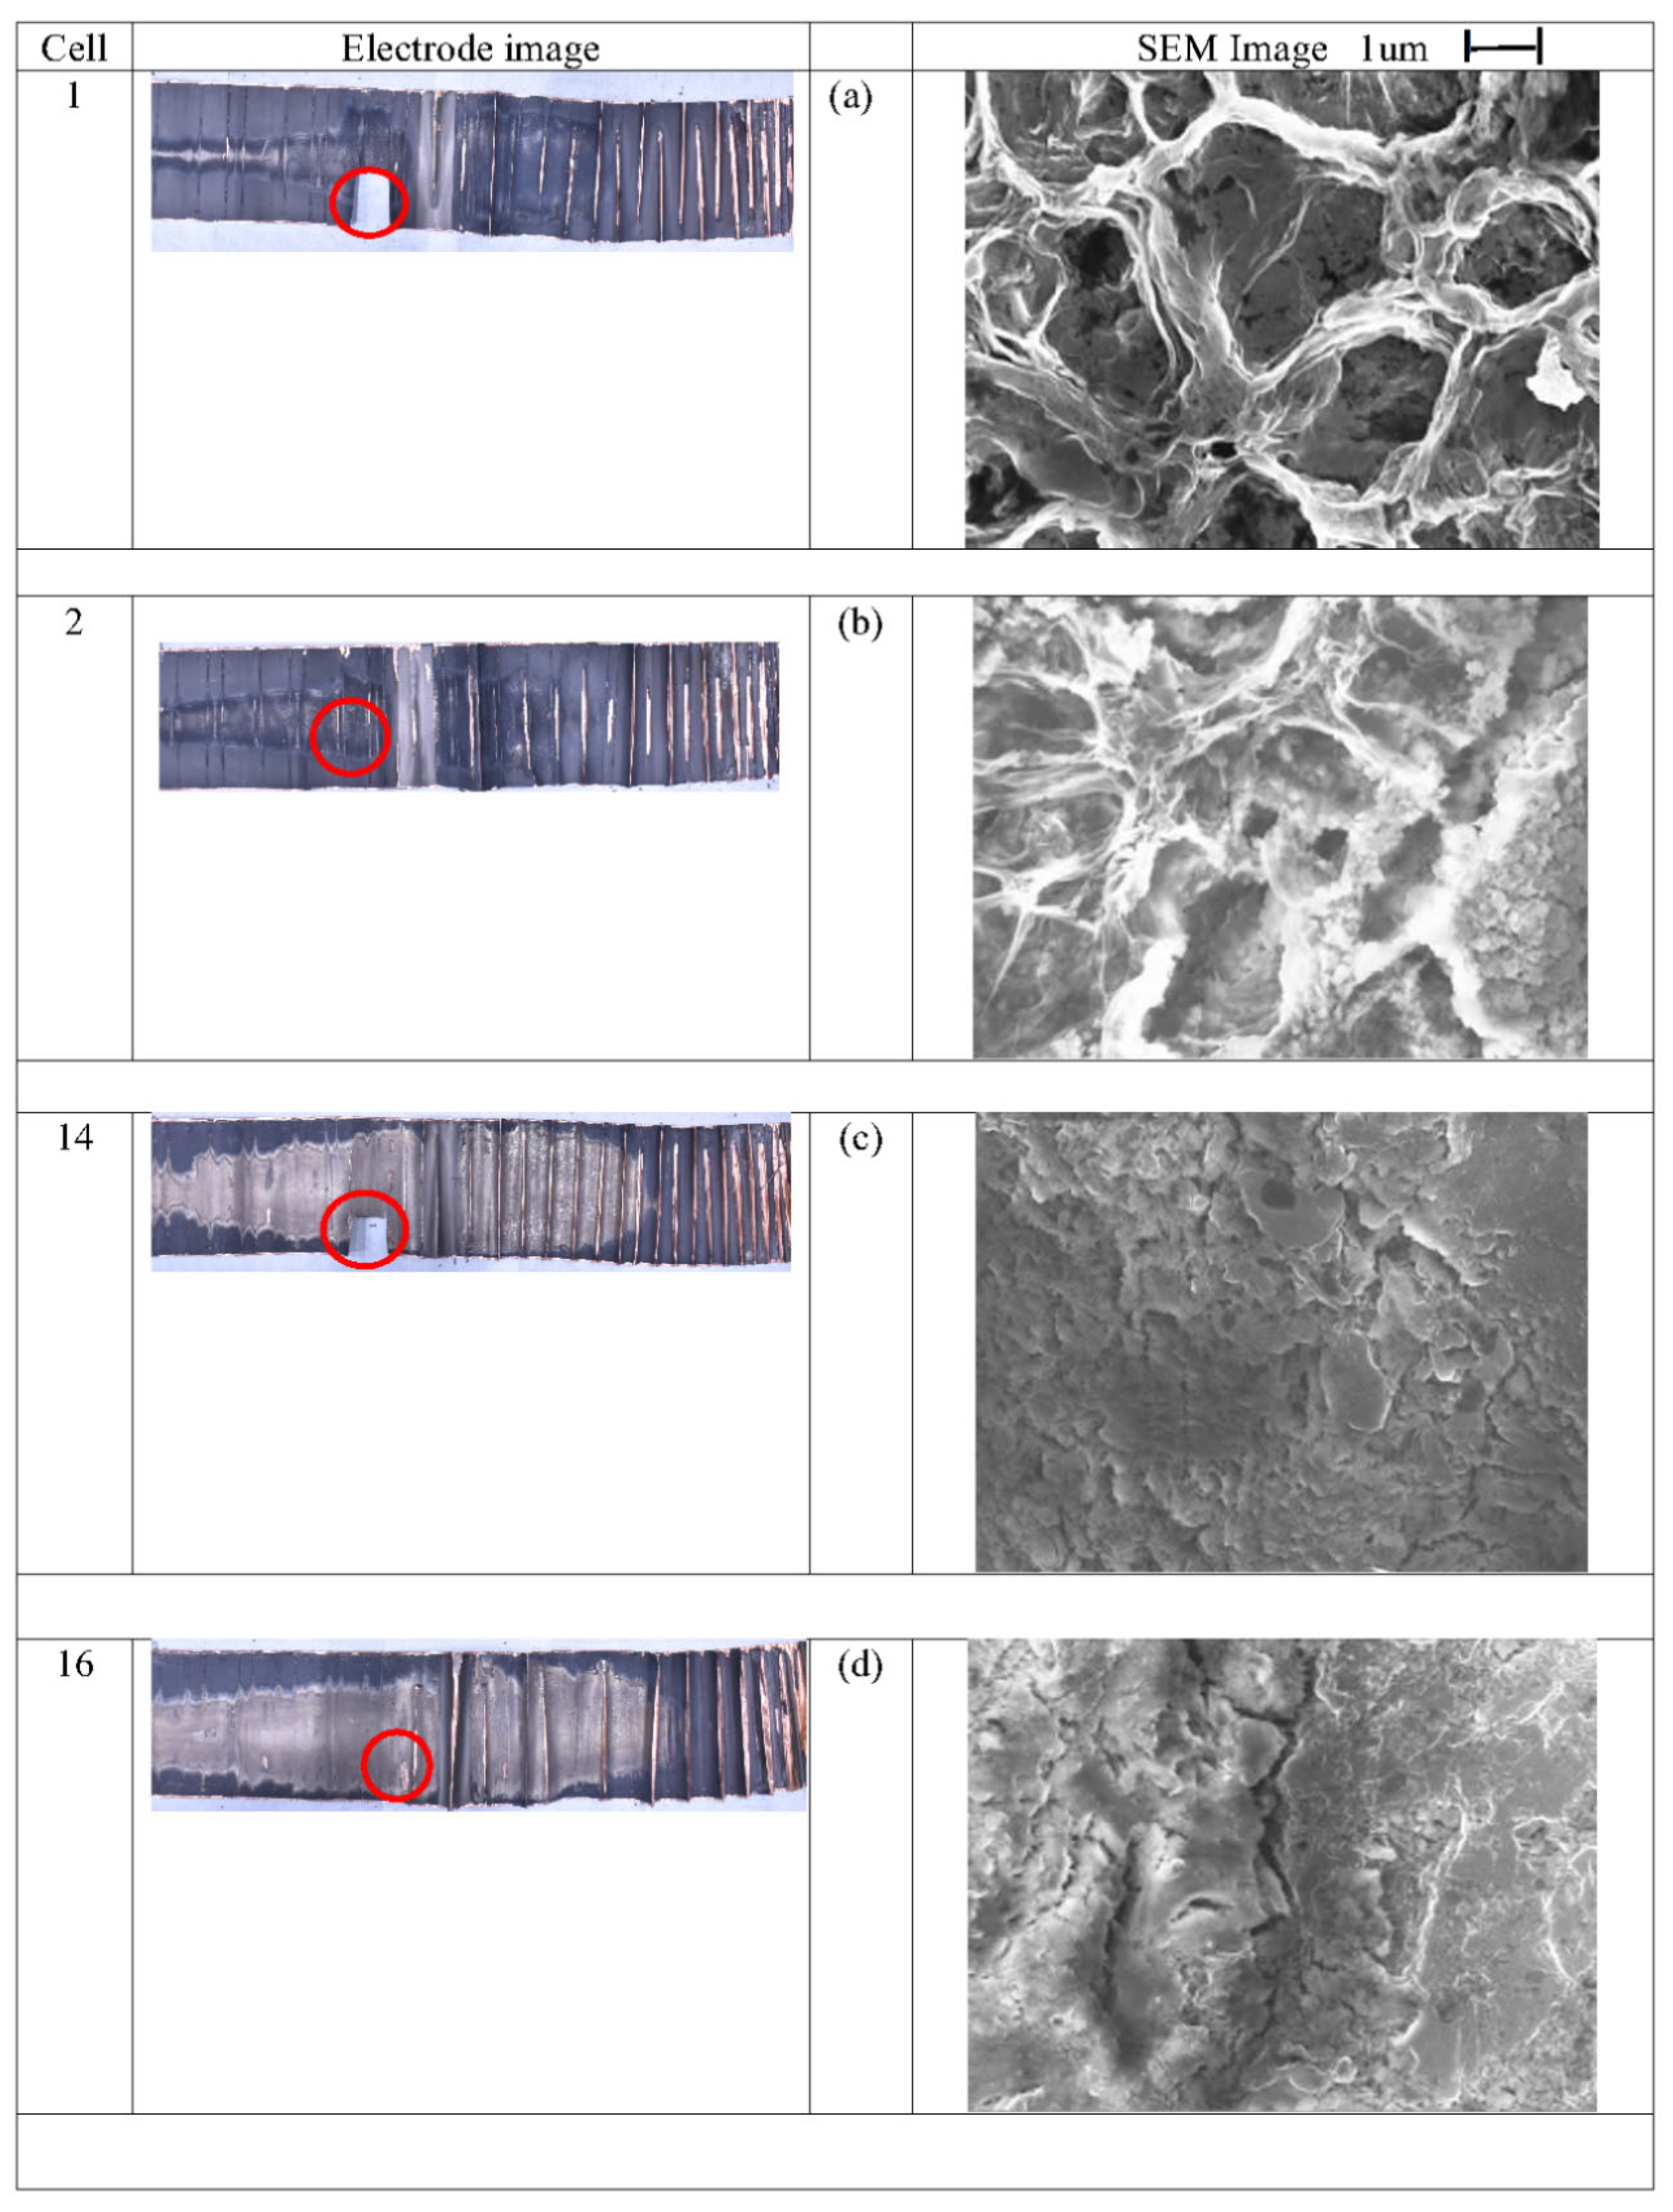
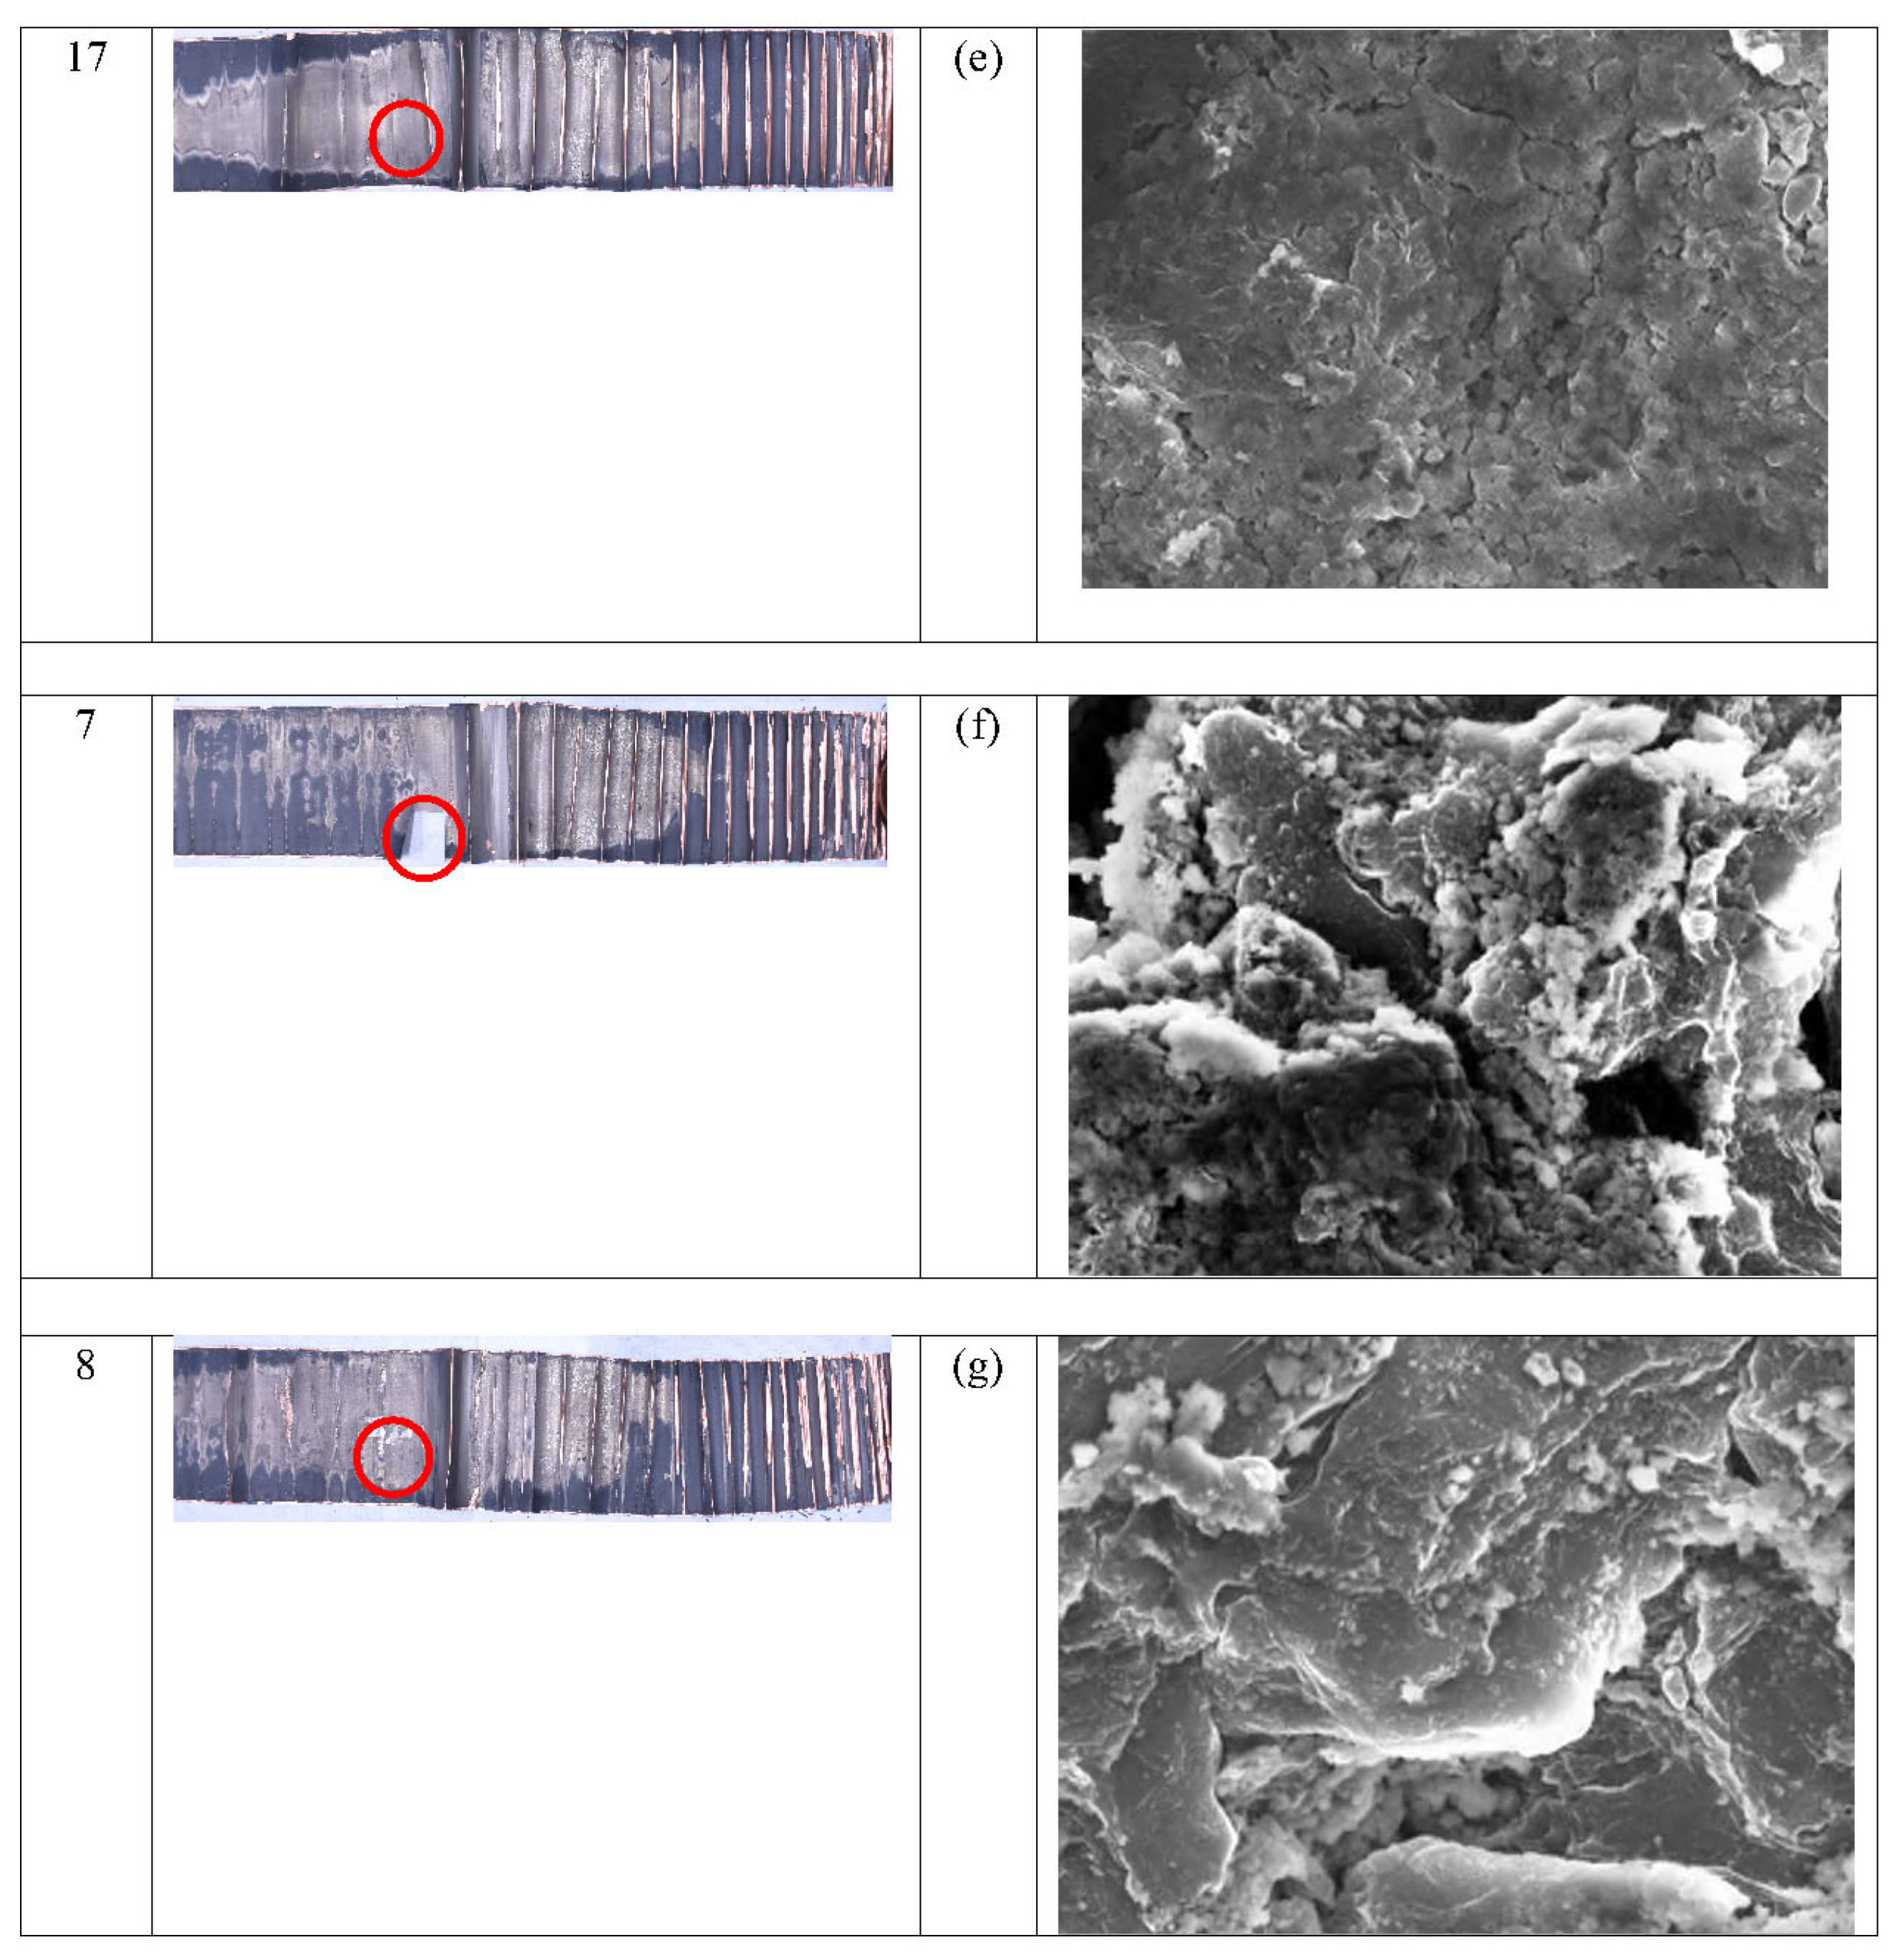
In this article, SEM images were obtained from the end section of the jelly roll; the precise sampling location is indicated by a red circle. SEM images of Cell 1 and 2 display a spider-web-shaped area, as shown in Figure 11a,b.
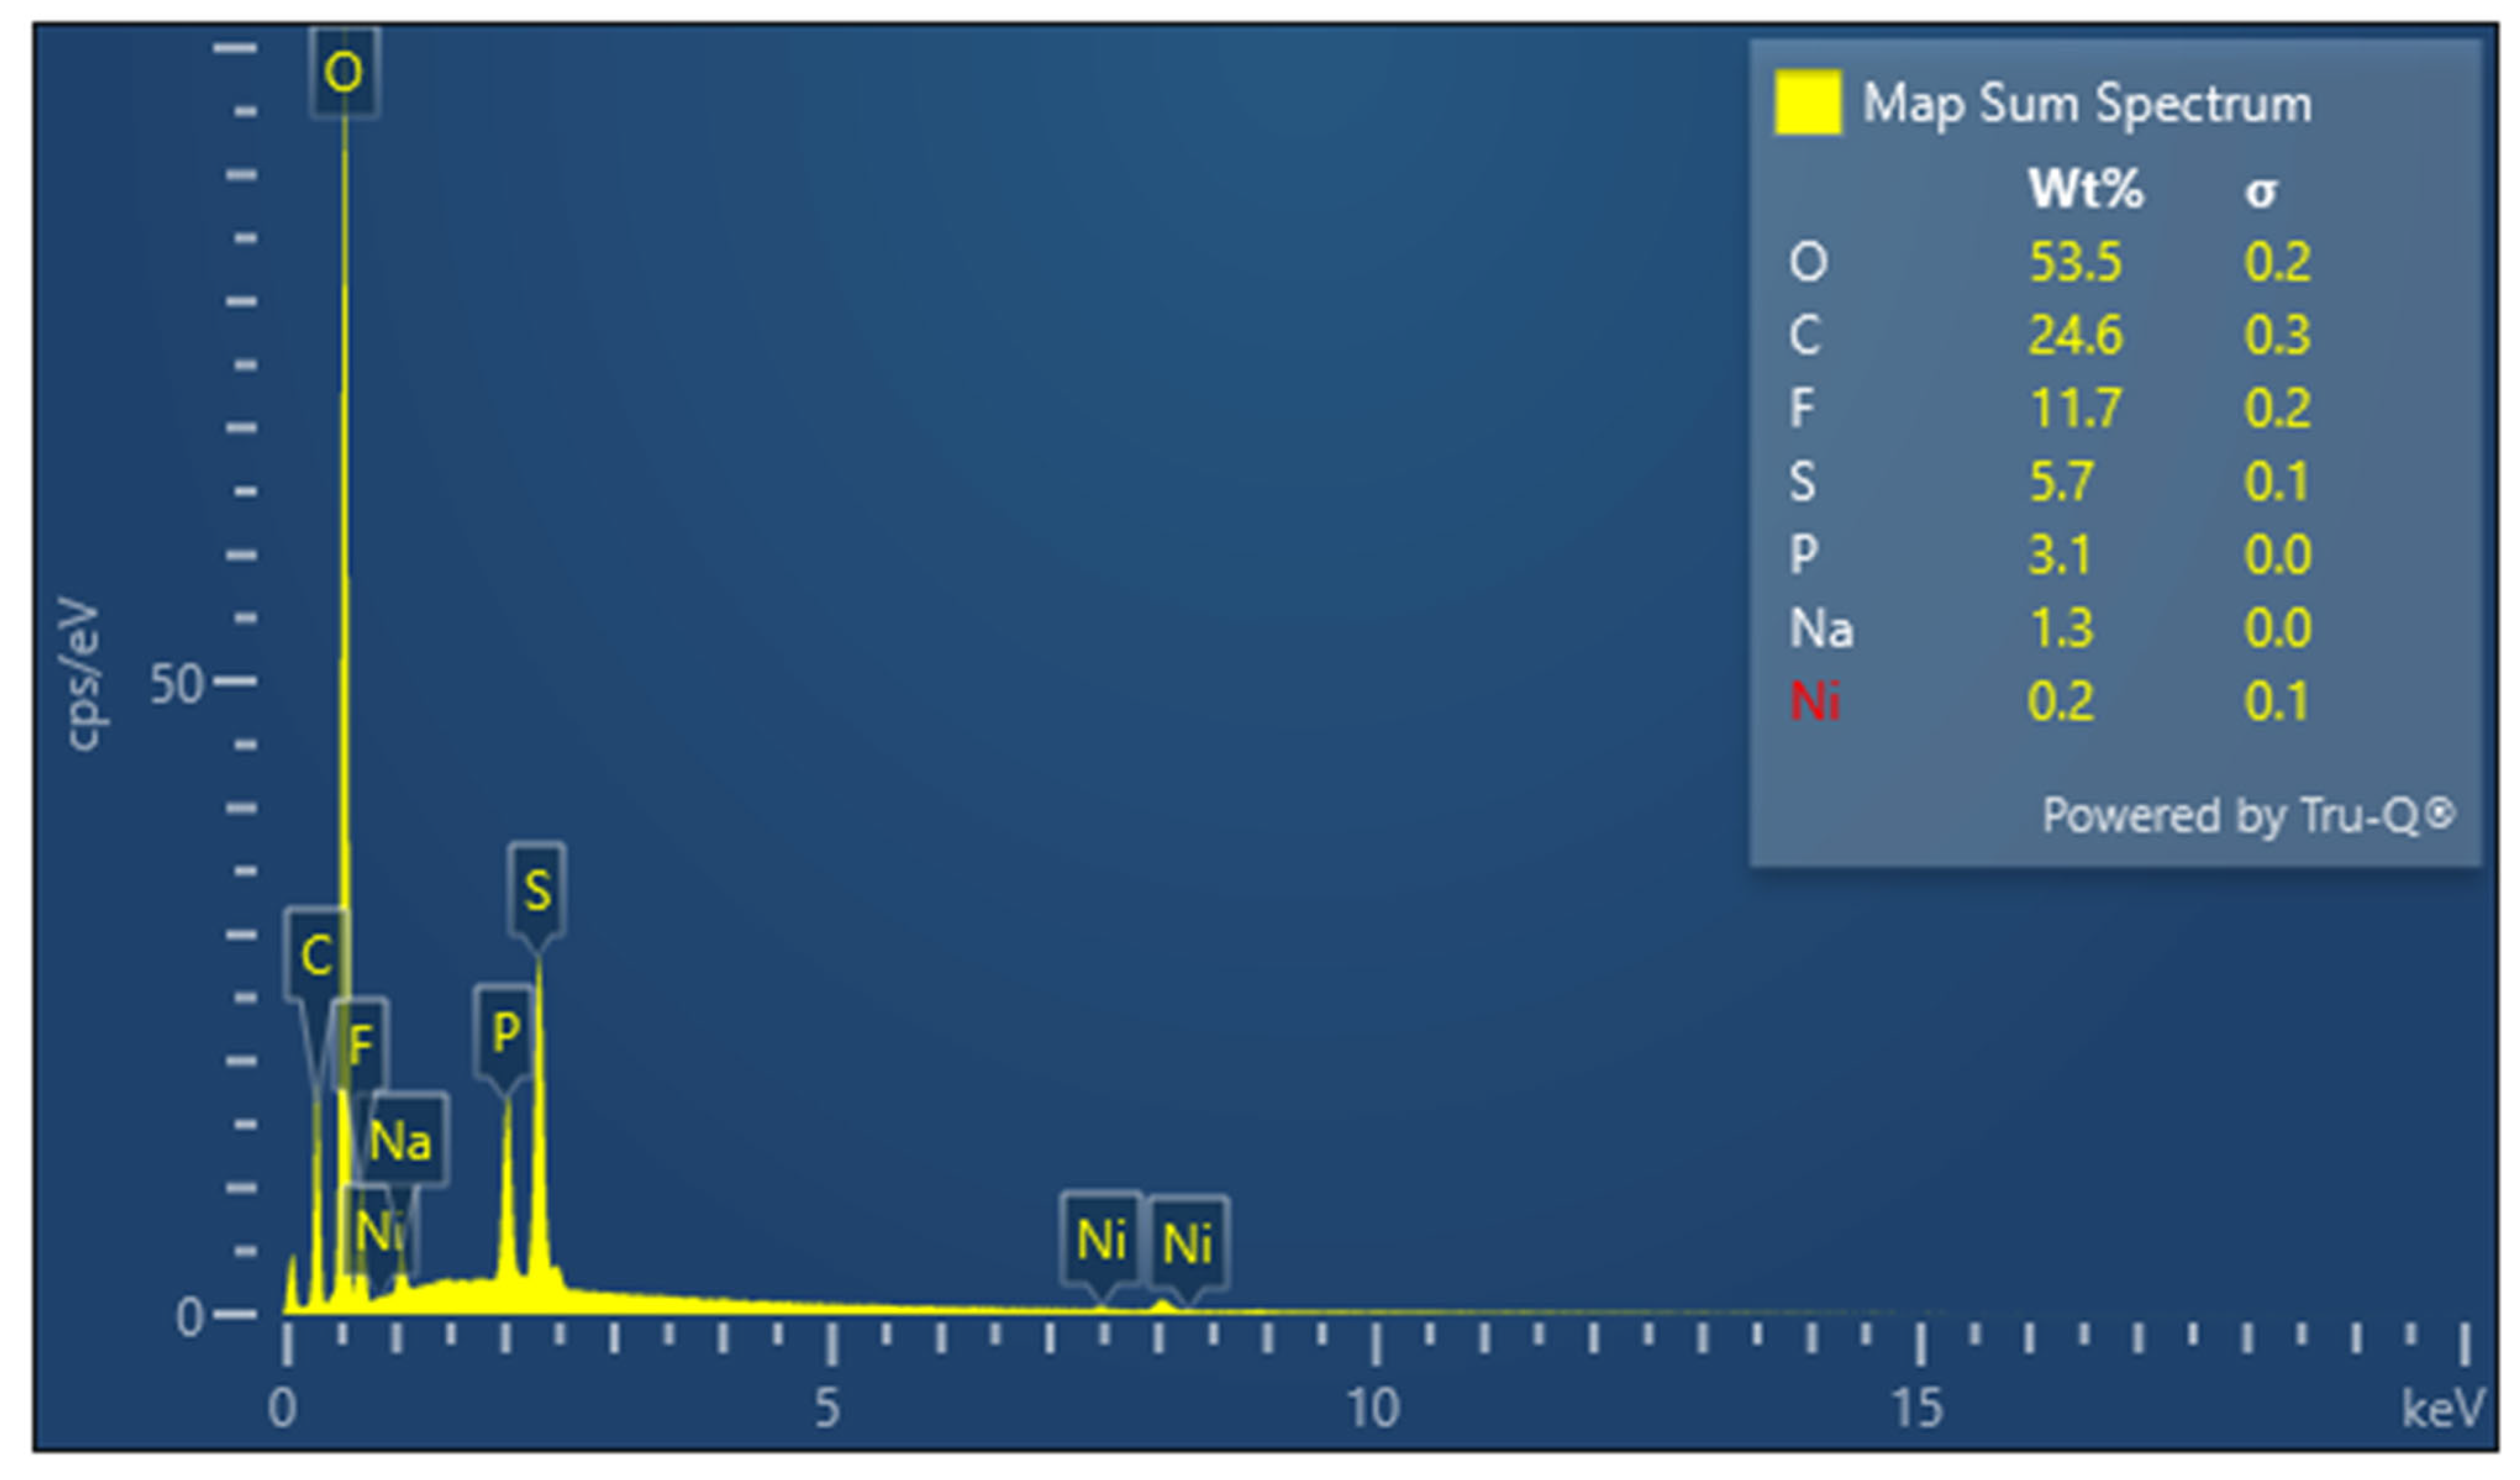
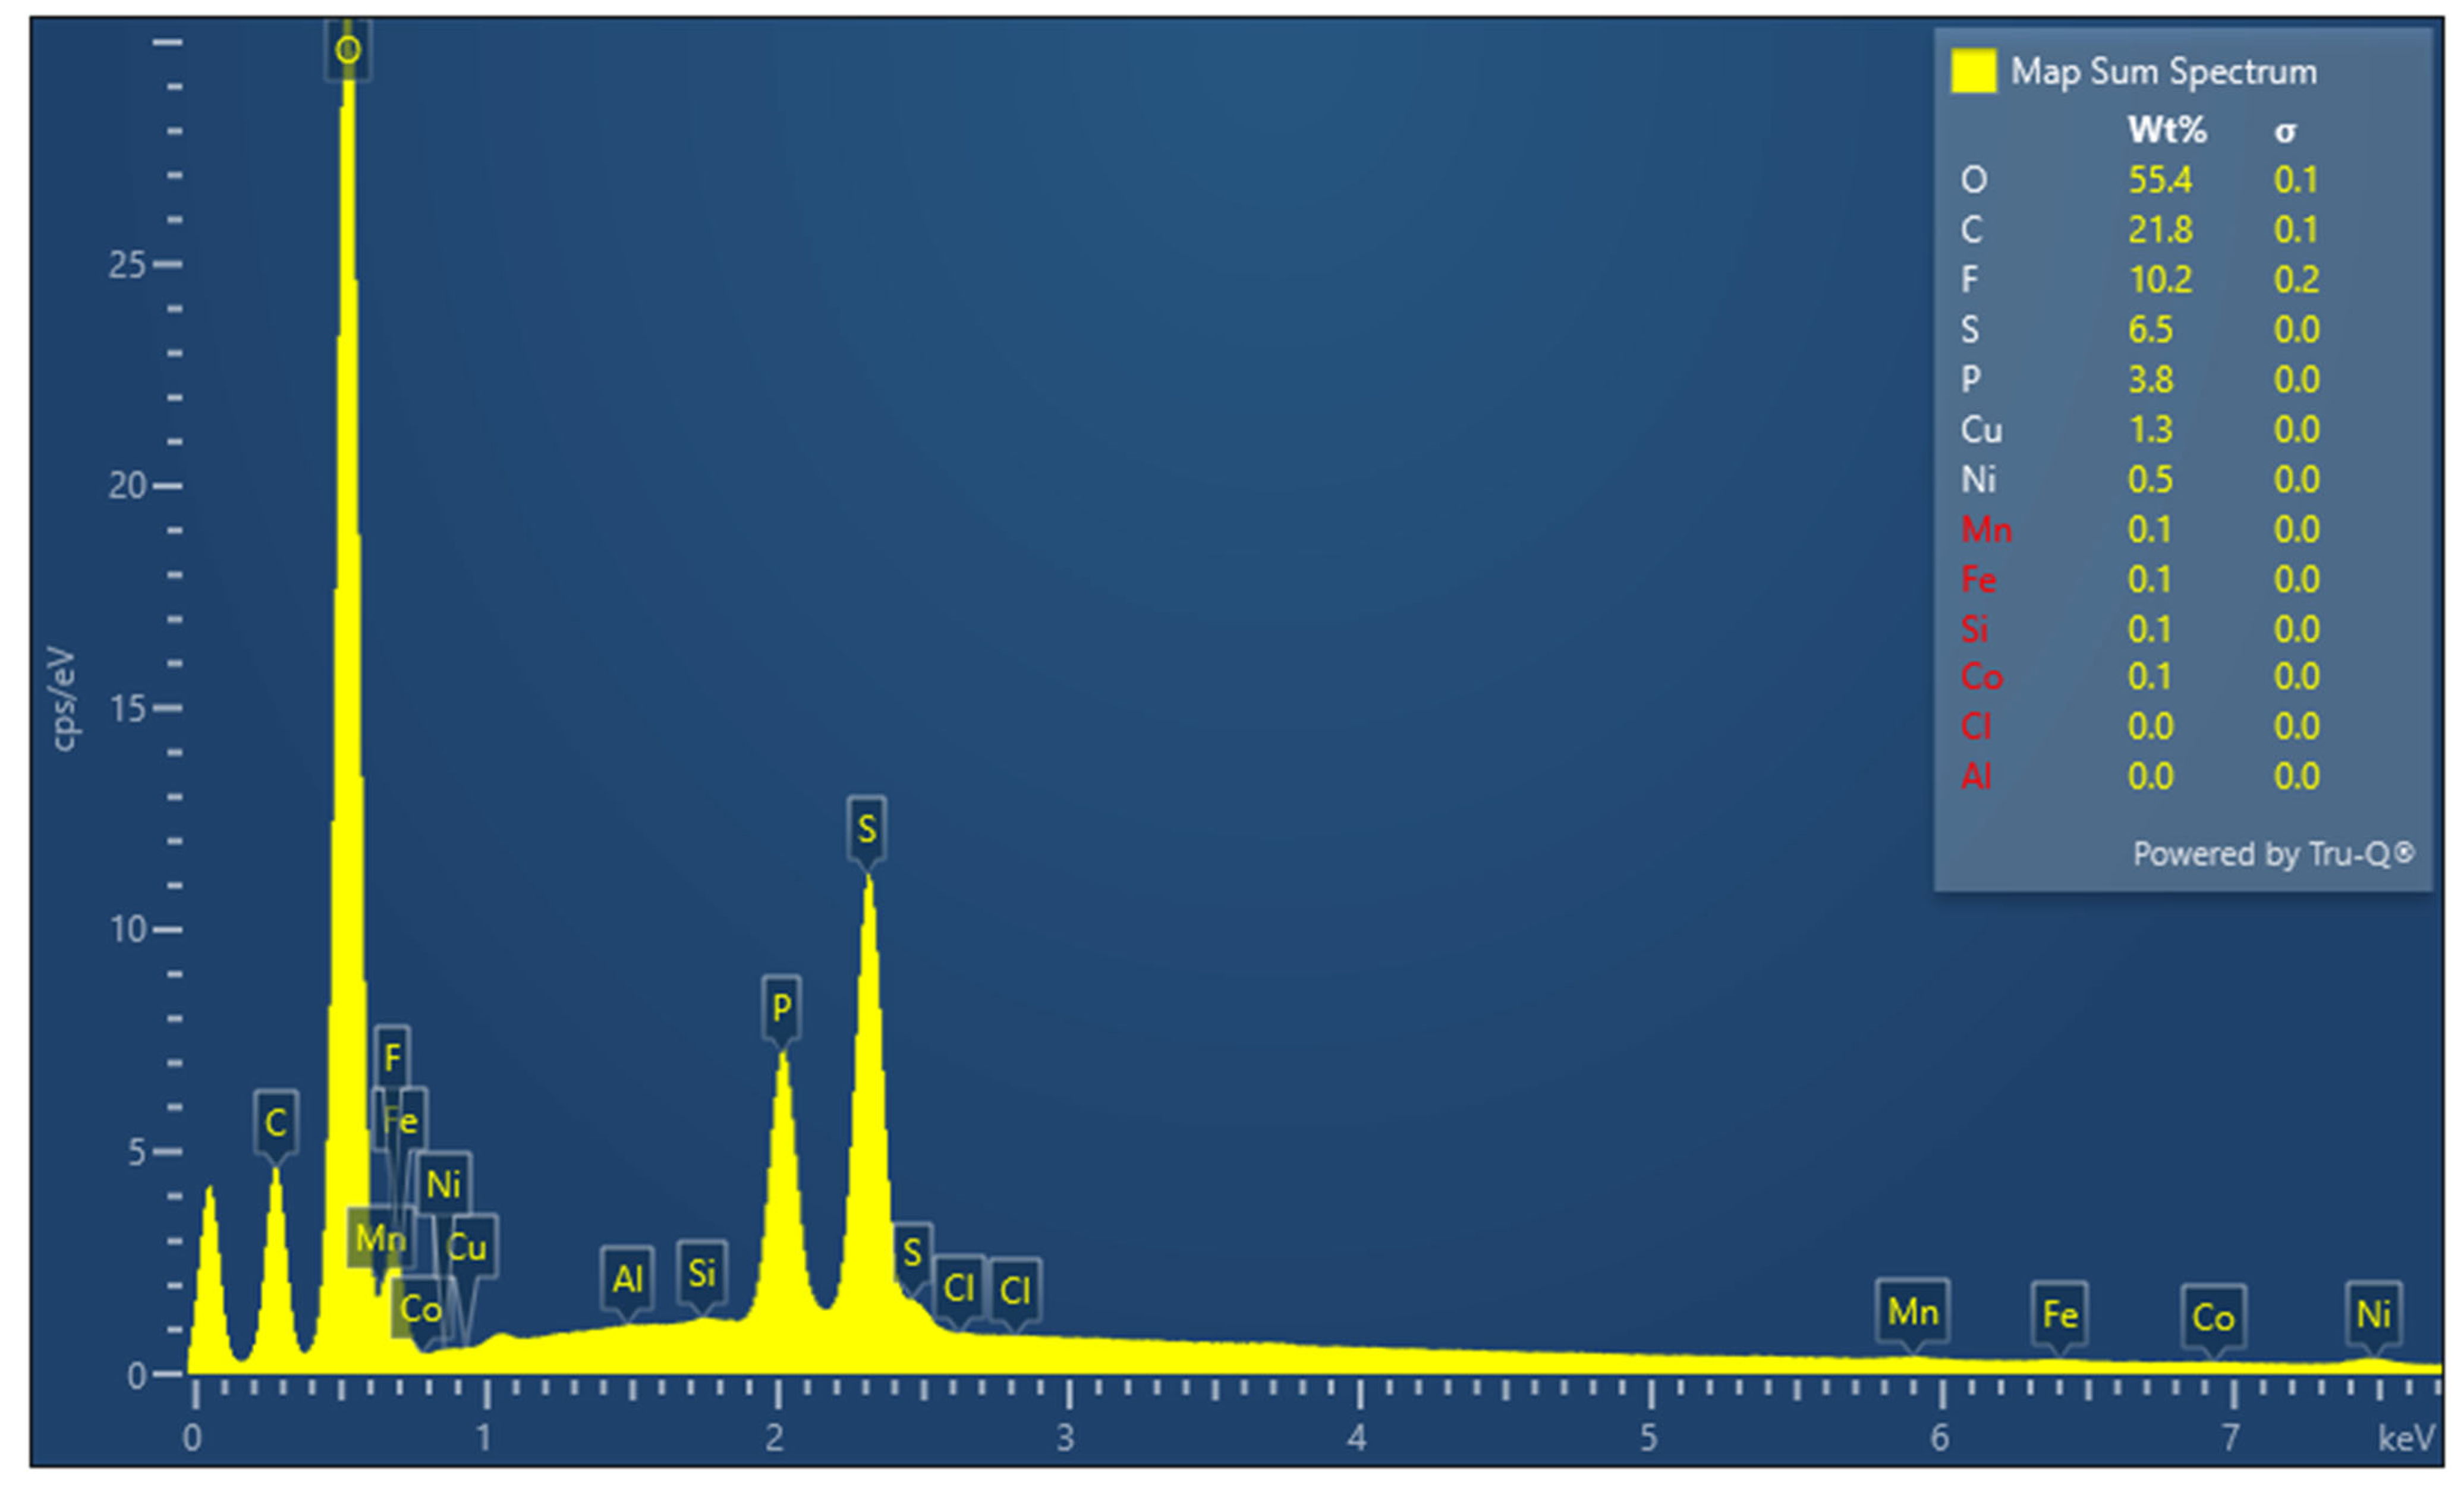
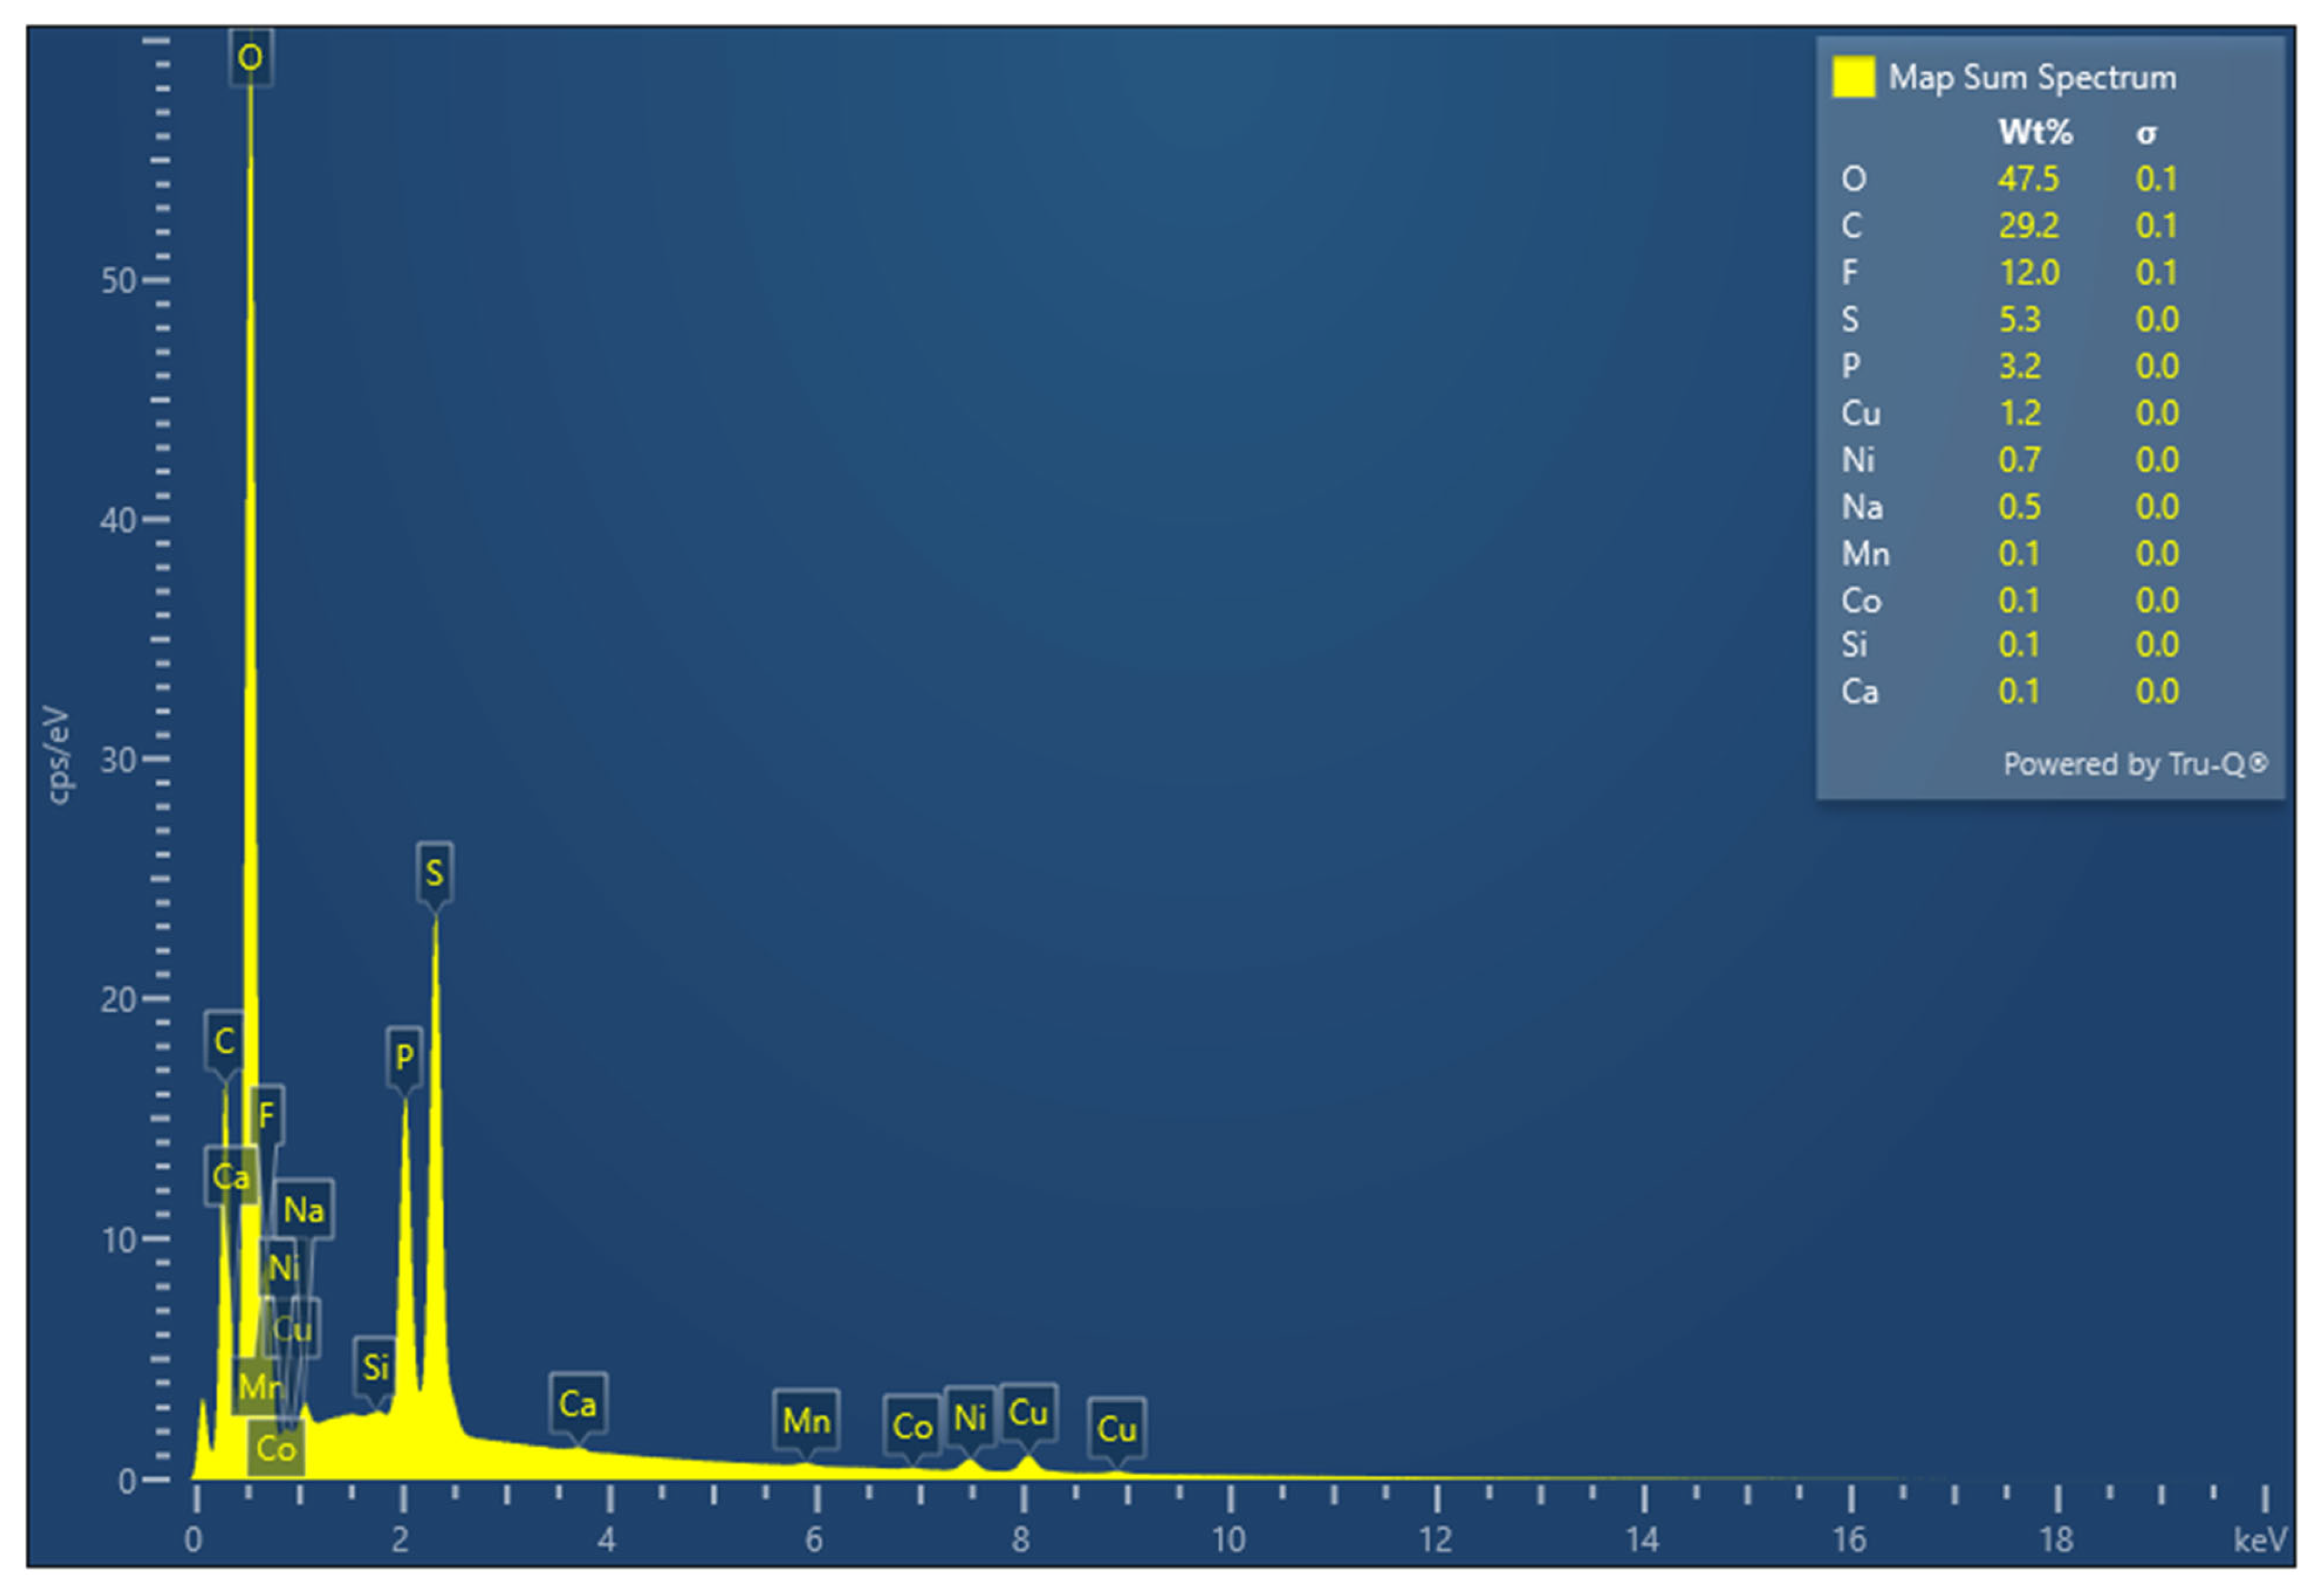
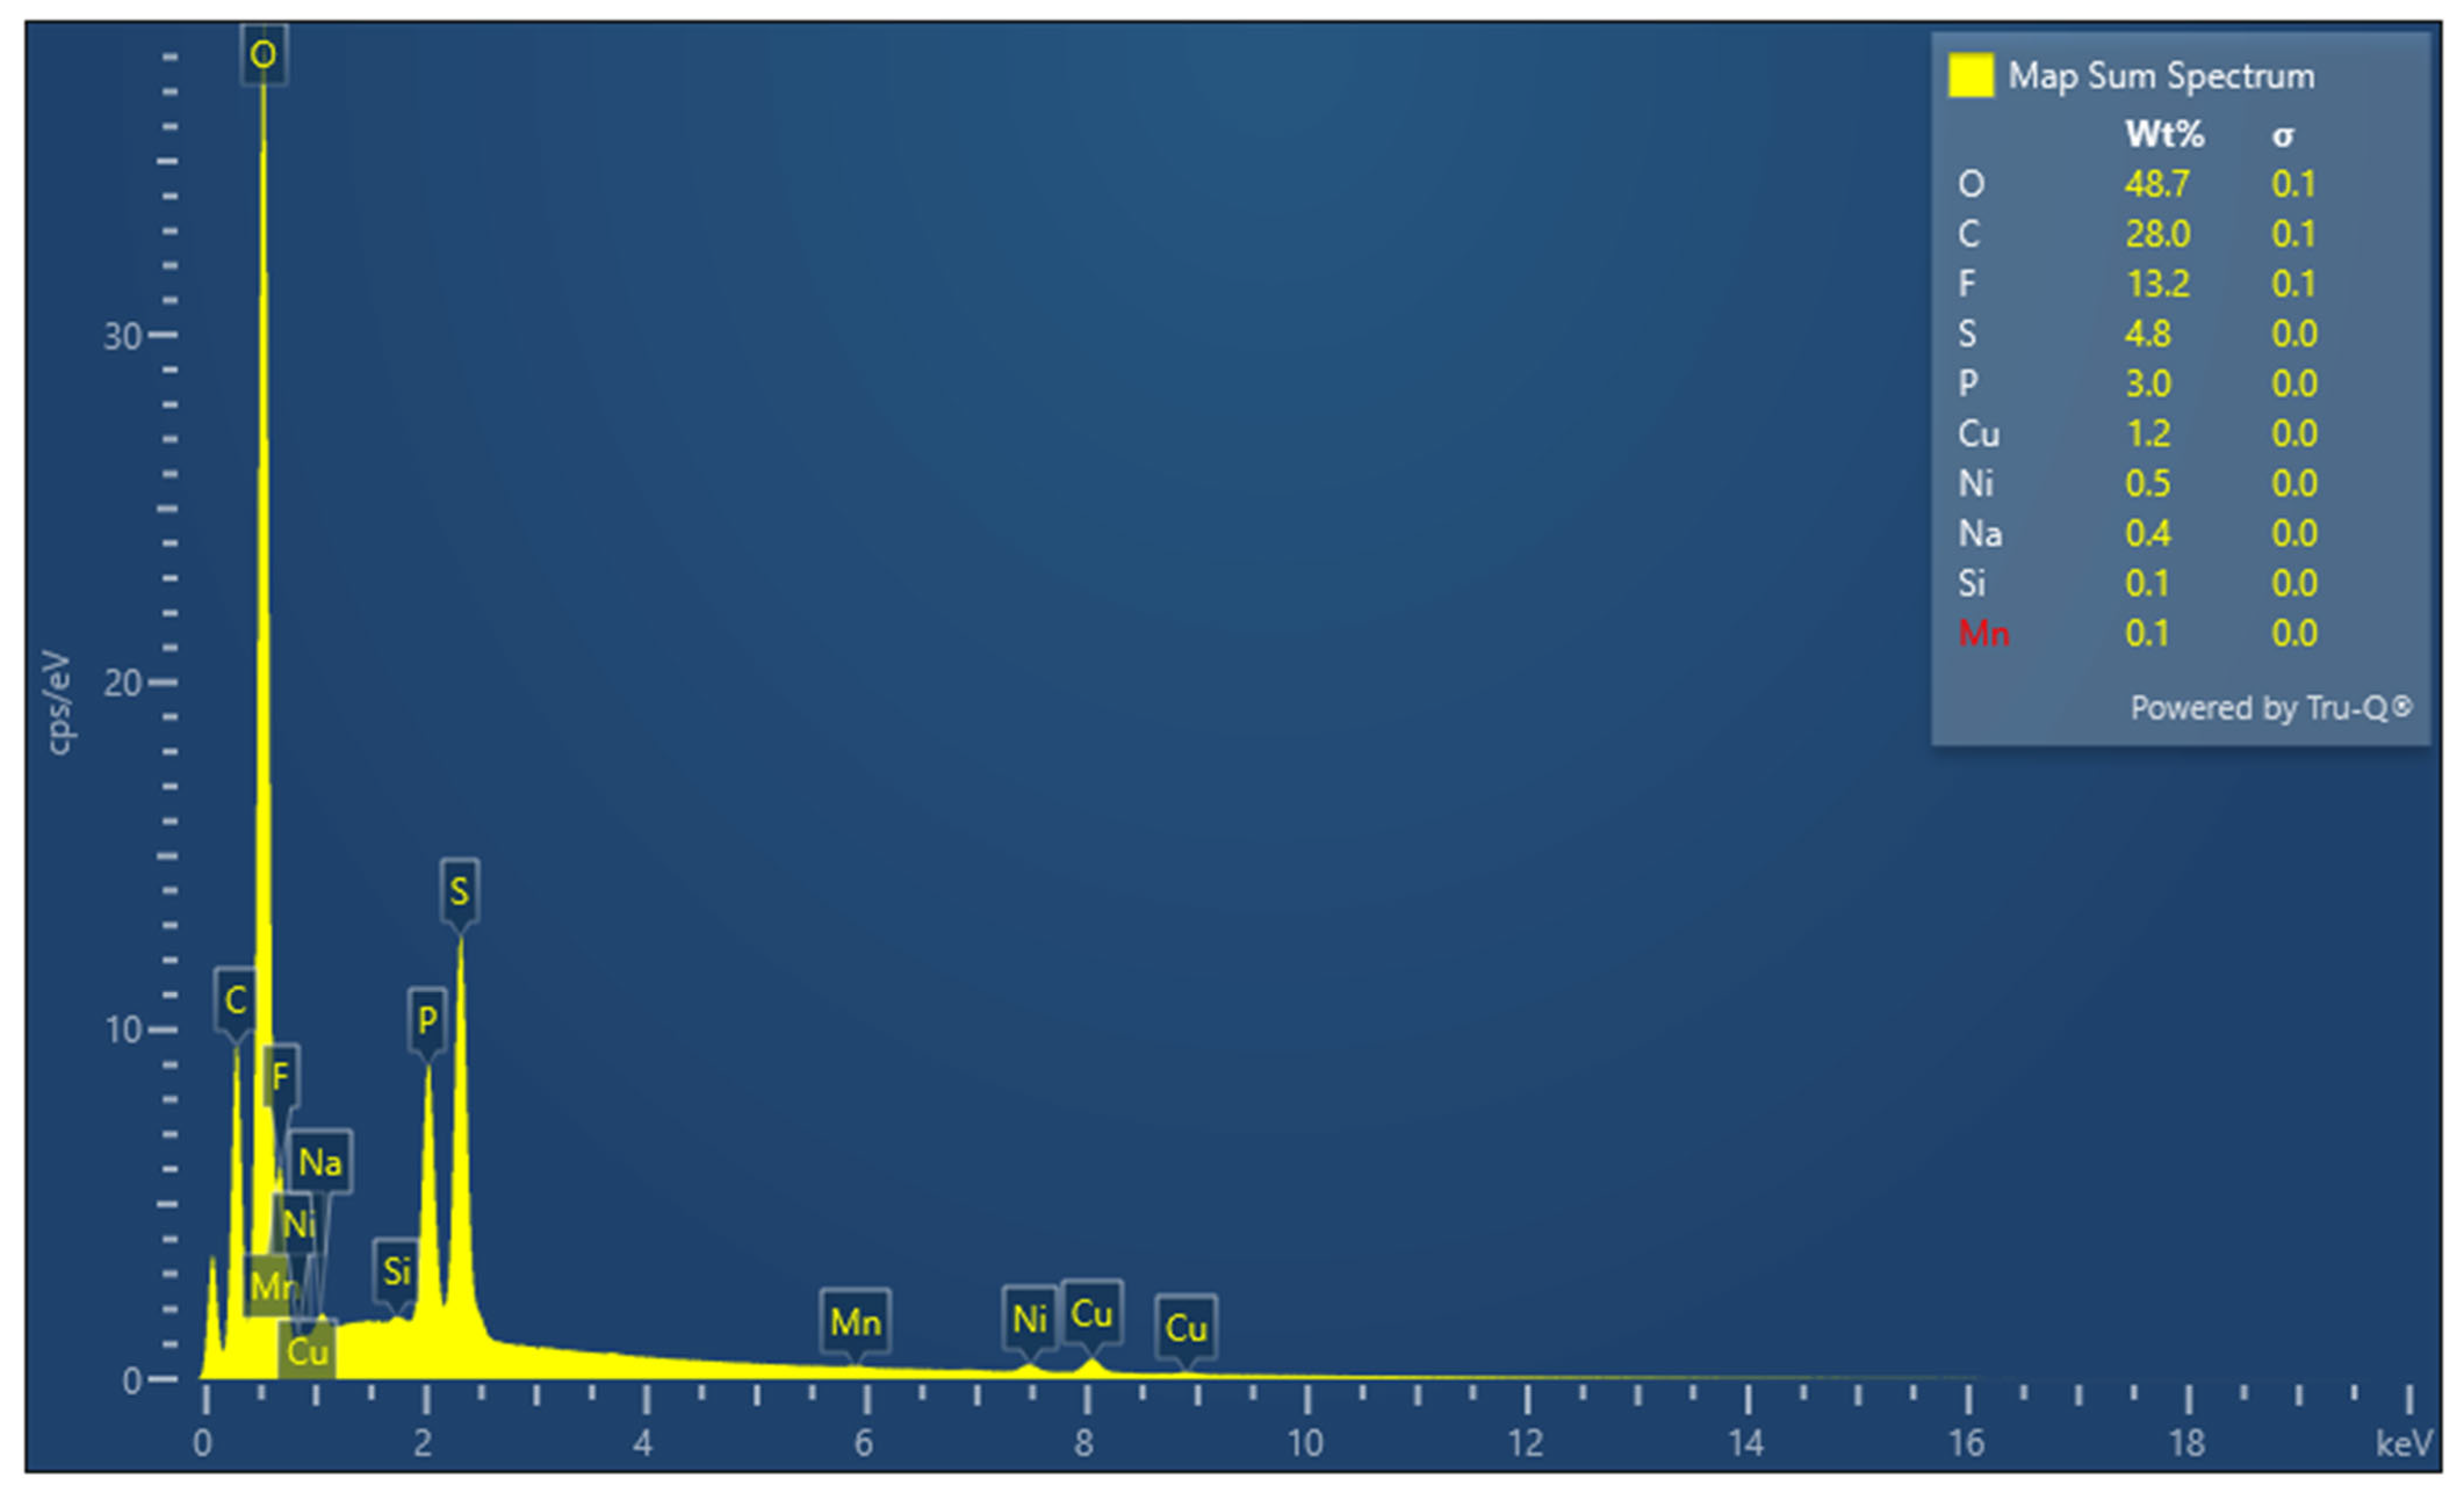
It is presumed that the lithium dendrites have become interconnected, forming a spider-web-like structure [27]. Since Energy Dispersive X-ray (EDX) is not suitable for lithium detection, the confirmation of lithium deposition comes from the layer observed in the photographic images of the anodes in Cells 1 and 2. However, the typical appearance of lithium deposition is usually more whitish or shiny, as shown in Figure 10 (Cell 1 and 2). The greyish deposition observed in these cells can be explained through EDX analysis. The analysis of Cell 1 and 2 (see Appendix A, Figure A2 and Figure A3) indicates a nickel (Ni) transition from the cathode side, but the Ni deposition is <0.5% wt for these cells. Despite the detected nickel quantity, it is not considered a primary contributor [26]. Bach et al. [27] observed that the deposition appears to be less white when NMC does not play a major role. Therefore, the presence of a grey colour in Cell 1 and 2, rather than white, can be ascribed to this occurrence. Thus, a greyish deposition is noticed for Cells 1 and 2 instead of a whitish one.
SEM images of Cell 14, 16, and 17 reveal a noticeable rough surface, as illustrated in Figure 11c–e. EDX analysis further confirms (c.f. Figure A4, Figure A5 and Figure A6) the presence of nickel (Ni), manganese (Mn), and cobalt (C) with Ni concentrations exceeding 0.5% on the rough surface of Cell 14, 16, and 17. The nickel content observed in these three cells is a primary contributing factor [26]. However, electrode images of these three cells confirm the presence of lithium deposition. Hence, it is evident that the whitish layer consists of Lithium, Ni, Mn and Co. The reason behind the white colour of the deposition on the electrode is the existence of an NMC element with lithium. As a result of this substantial electrode deposition, a rough surface layer is evident in the SEM images. Bach et al. also obtained SEM images from areas with whitish deposits, which displayed a similar rough surface texture [27]. Small amounts of Ni, Mn and Co are recognised to dissolve from the positive electrode and subsequently accumulate on the graphite electrode [27]. This occurs because lithiated graphite rapidly reduces many metal ions to their metallic state [36]. It is widely believed that these deposits significantly impact the ageing of graphite and the formation of surface films.
In the case of Cell 7 and 8, some scattered mossy-like substances were observed on the surface of graphite particles (refer to Figure 11f,g). Xie et al. [25] also observed similar mossy-like substances. It was hypothesised that these substances predominantly consisted of lithium plating induced by the high current during charging [37,38]. During their first life cycling, Cell 7 and 8 were charged at a rate of 0.7 C, which corresponds to the maximum charge current specified in the data sheet for these cells. However, this high current caused the once pristine appearance of the graphite particles to become blurred, with occasional amorphous deposits forming on the graphite surfaces due to parasitic reactions between the plated lithium and the electrolyte [25].

5. Further Work

The second-life experiment continued until cells reached around 70% SoH. In terms of time, most cells took eight months. However, previous literature mentions that a cell’s second life ends when cells reach 40% SoH [5]. Hence, the test might be required to continue until cells reach 40% SoH, and further analysis is required when cells reach 40% SoH.
Furthermore, in this article, only cell-level second-life experimental results are provided; module-level experimental results are required to gain more confidence about the effect of first-life DM on second-life degradation. From this experiment, it is known that Cells with similar first-life SoH and DM at approximately 95%, 90%, 85%, and 80% SoH experienced similar second-life degradation. Hence, if a module is manufactured by employing the cells with similar first-life SoH and DM at approximately 95%, 90%, 85%, and 80% SoH, it is expected that the life of the module would be extended compared to the cells with a similar first-life SoH but a different DM at approximately 95%, 90%, 85%, and 80% SoH.

6. Conclusions

In this work, a second-life test was conducted, and the results were analysed with respect to various scenarios: considering only the first-life SoH, the first SoH along with DM at approximately 80% SoH, and the first-life SoH along with DM at approximately 95%, 90%, 85%, and 80% SoH. The results show that, among the cells that only had similar first-life SoH levels before the second-life test, only 20% to 30% experienced similar second-life degradation. In contrast, for cells with similar first-life SoH and DM at 80% SoH before the second-life test, 62% of these cells demonstrated comparable second-life degradation. Furthermore, cells with a similar first-life SoH and DM at different stages of first life (in this article measured at 95%, 90%, 85%, and 80% SoH) exhibited similar degradation in their second life. The postmortem analysis found that these cell’s electrodes displayed similar visible patterns on their photographic and SEM images.
Hence, it can be concluded that, if DM is considered before a second-life test, it is observed that cells with similar first-life SoH and DM provide a similar second-life SoH or degradation. Postmortem analysis of the second-life-degraded cells verified that the cells degraded similarly, as similarities were observed among these electrode’s photographic and SEM images. Conversely, cells that shared a similar first-life SoH but had a different DM at approximately 95%, 90%, 85%, and 80% SoH exhibited a distinct second-life SoH or degradation. A postmortem analysis of these cells confirmed that cells degraded differently, with disparities being evident in the electrode and SEM images of these cells.
Finally, it can be stated that the first-life DM of a cell significantly impacts the cell’s second-life ageing. Experimental evidence demonstrates that the likelihood of achieving similar second-life ageing increases when the first-life DM is taken into account, along with SoH, before the second-life application.

Author Contributions

Conceptualization, S.T.M.; Methodology, S.T.M.; Software, A.G.; Formal analysis, S.T.M. and A.G.; Resources, S.M.; Data curation, S.M.; Writing—original draft, S.T.M.; Writing—review & editing, A.B. and J.M.; Supervision, A.B. and J.M. All authors have read and agreed to the published version of the manuscript.

Funding

This research received no external funding.

Data Availability Statement

The data presented in this study are available on request from the corresponding author. The data are not publicly available as degree of the one of the corresponding author (STM) is not awarded yet.

Conflicts of Interest

The authors declare no conflict of interest.

Appendix A

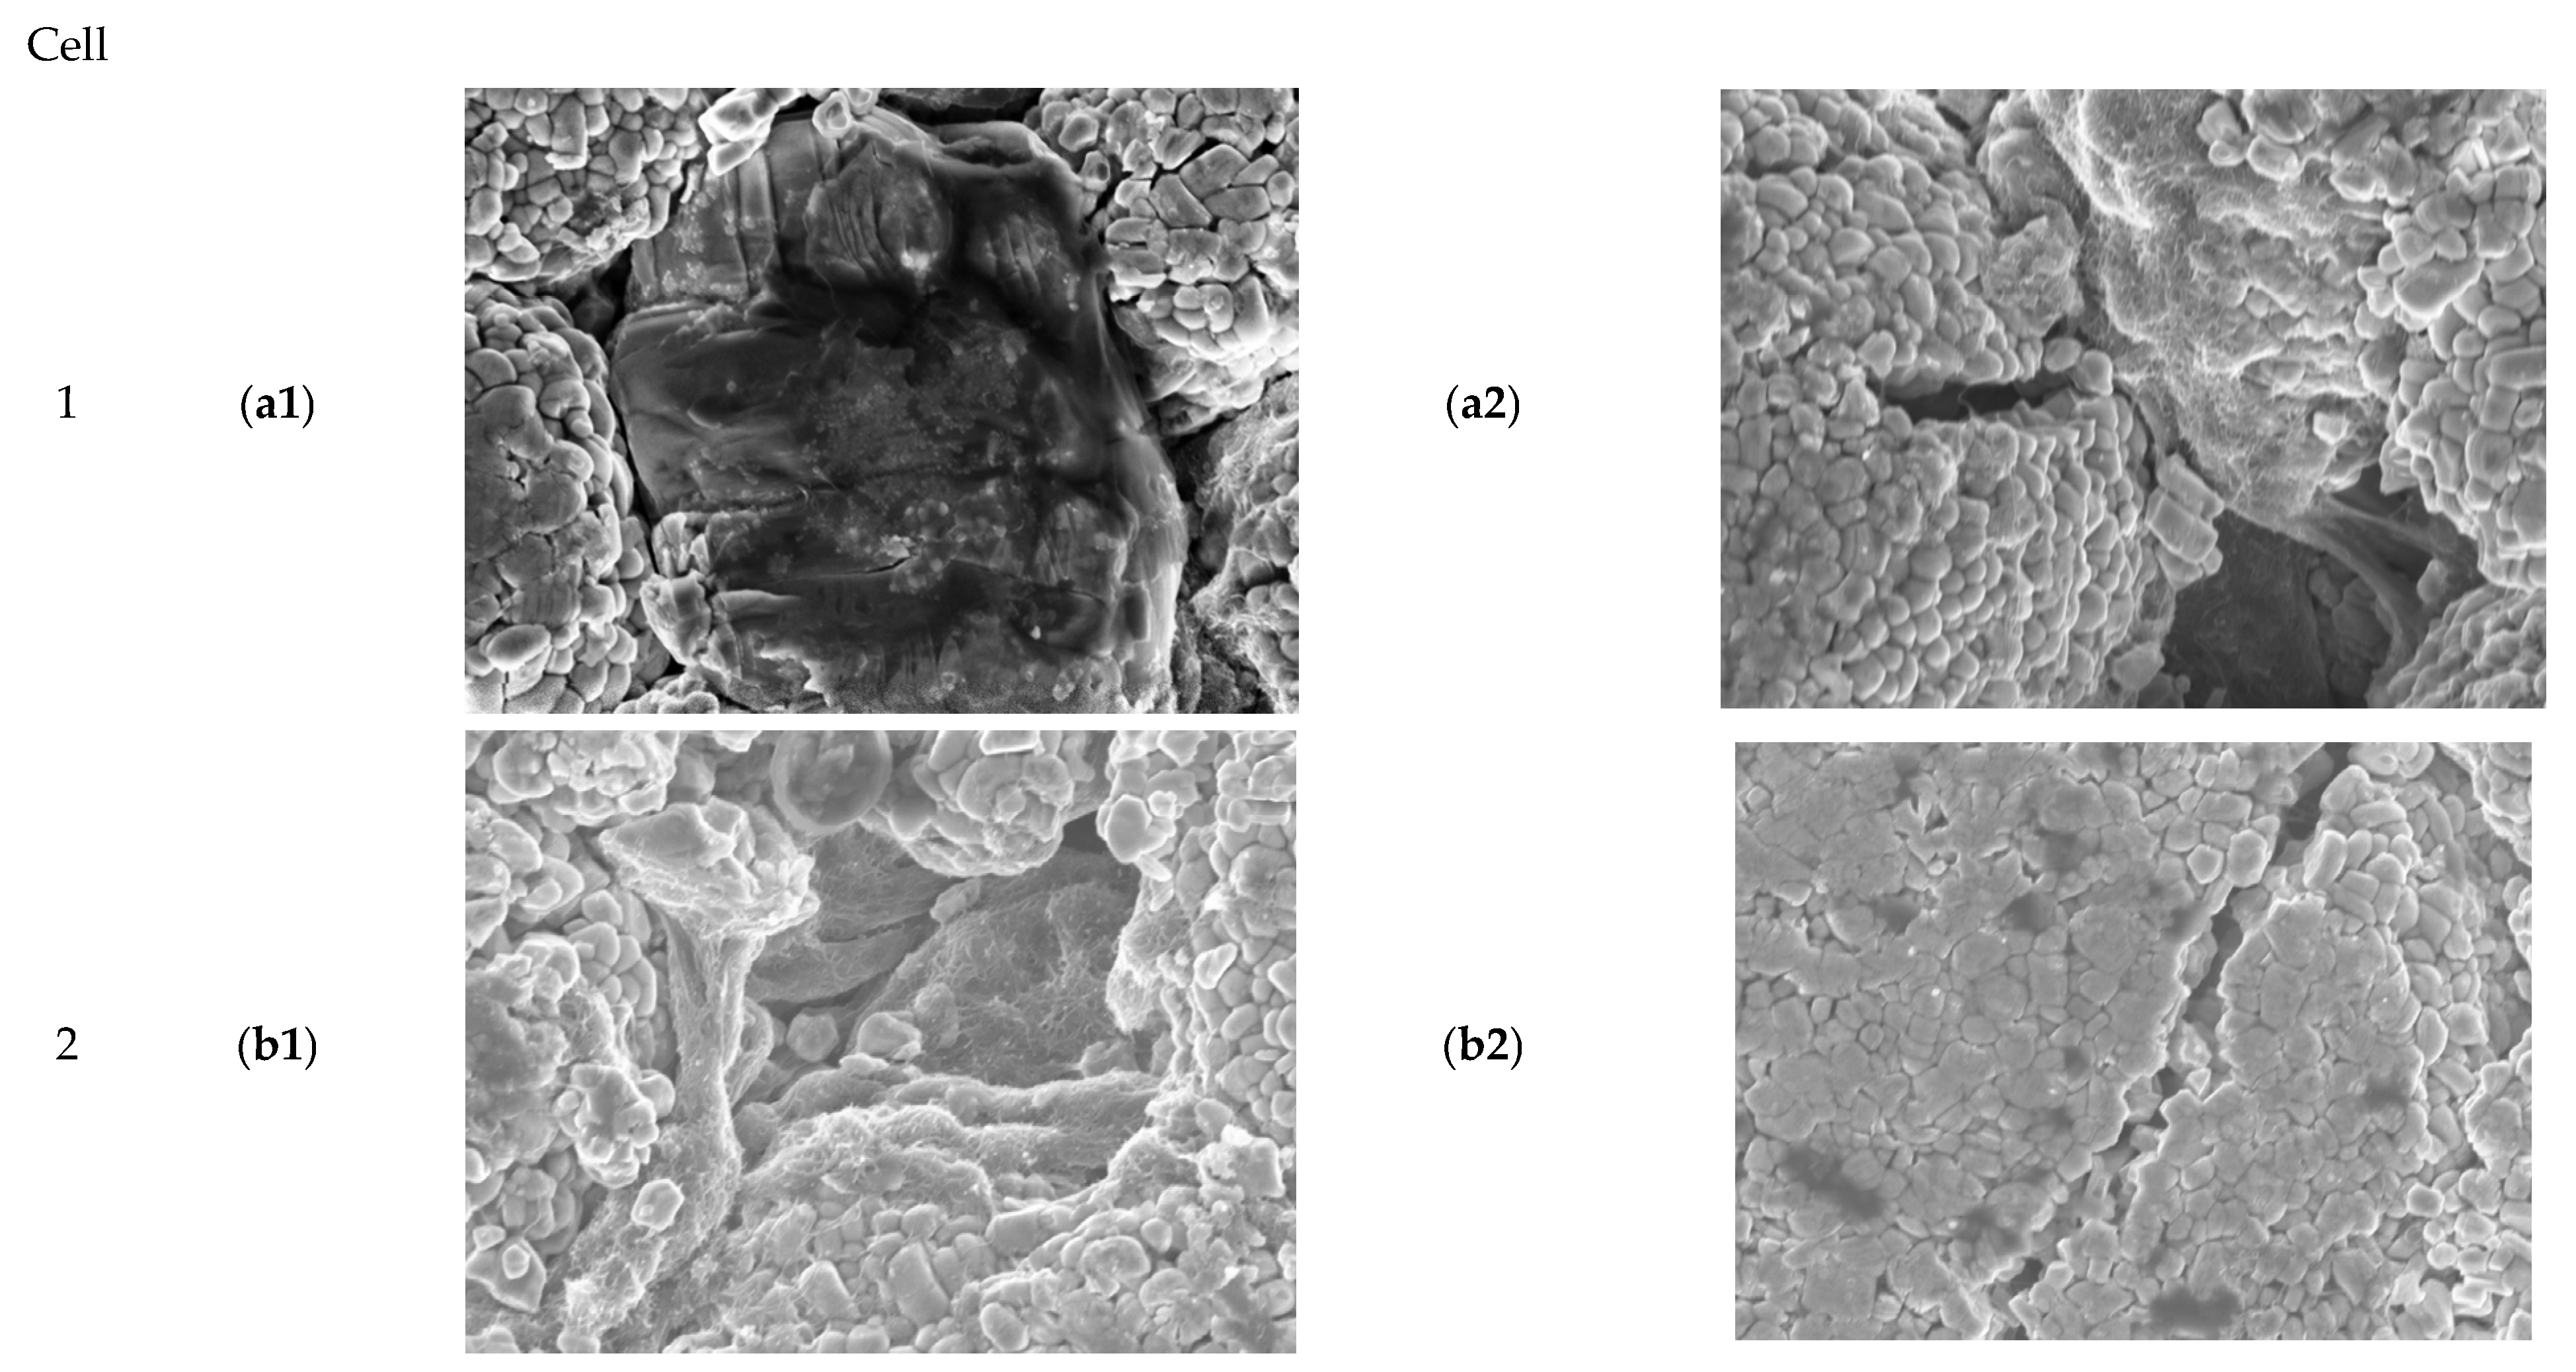
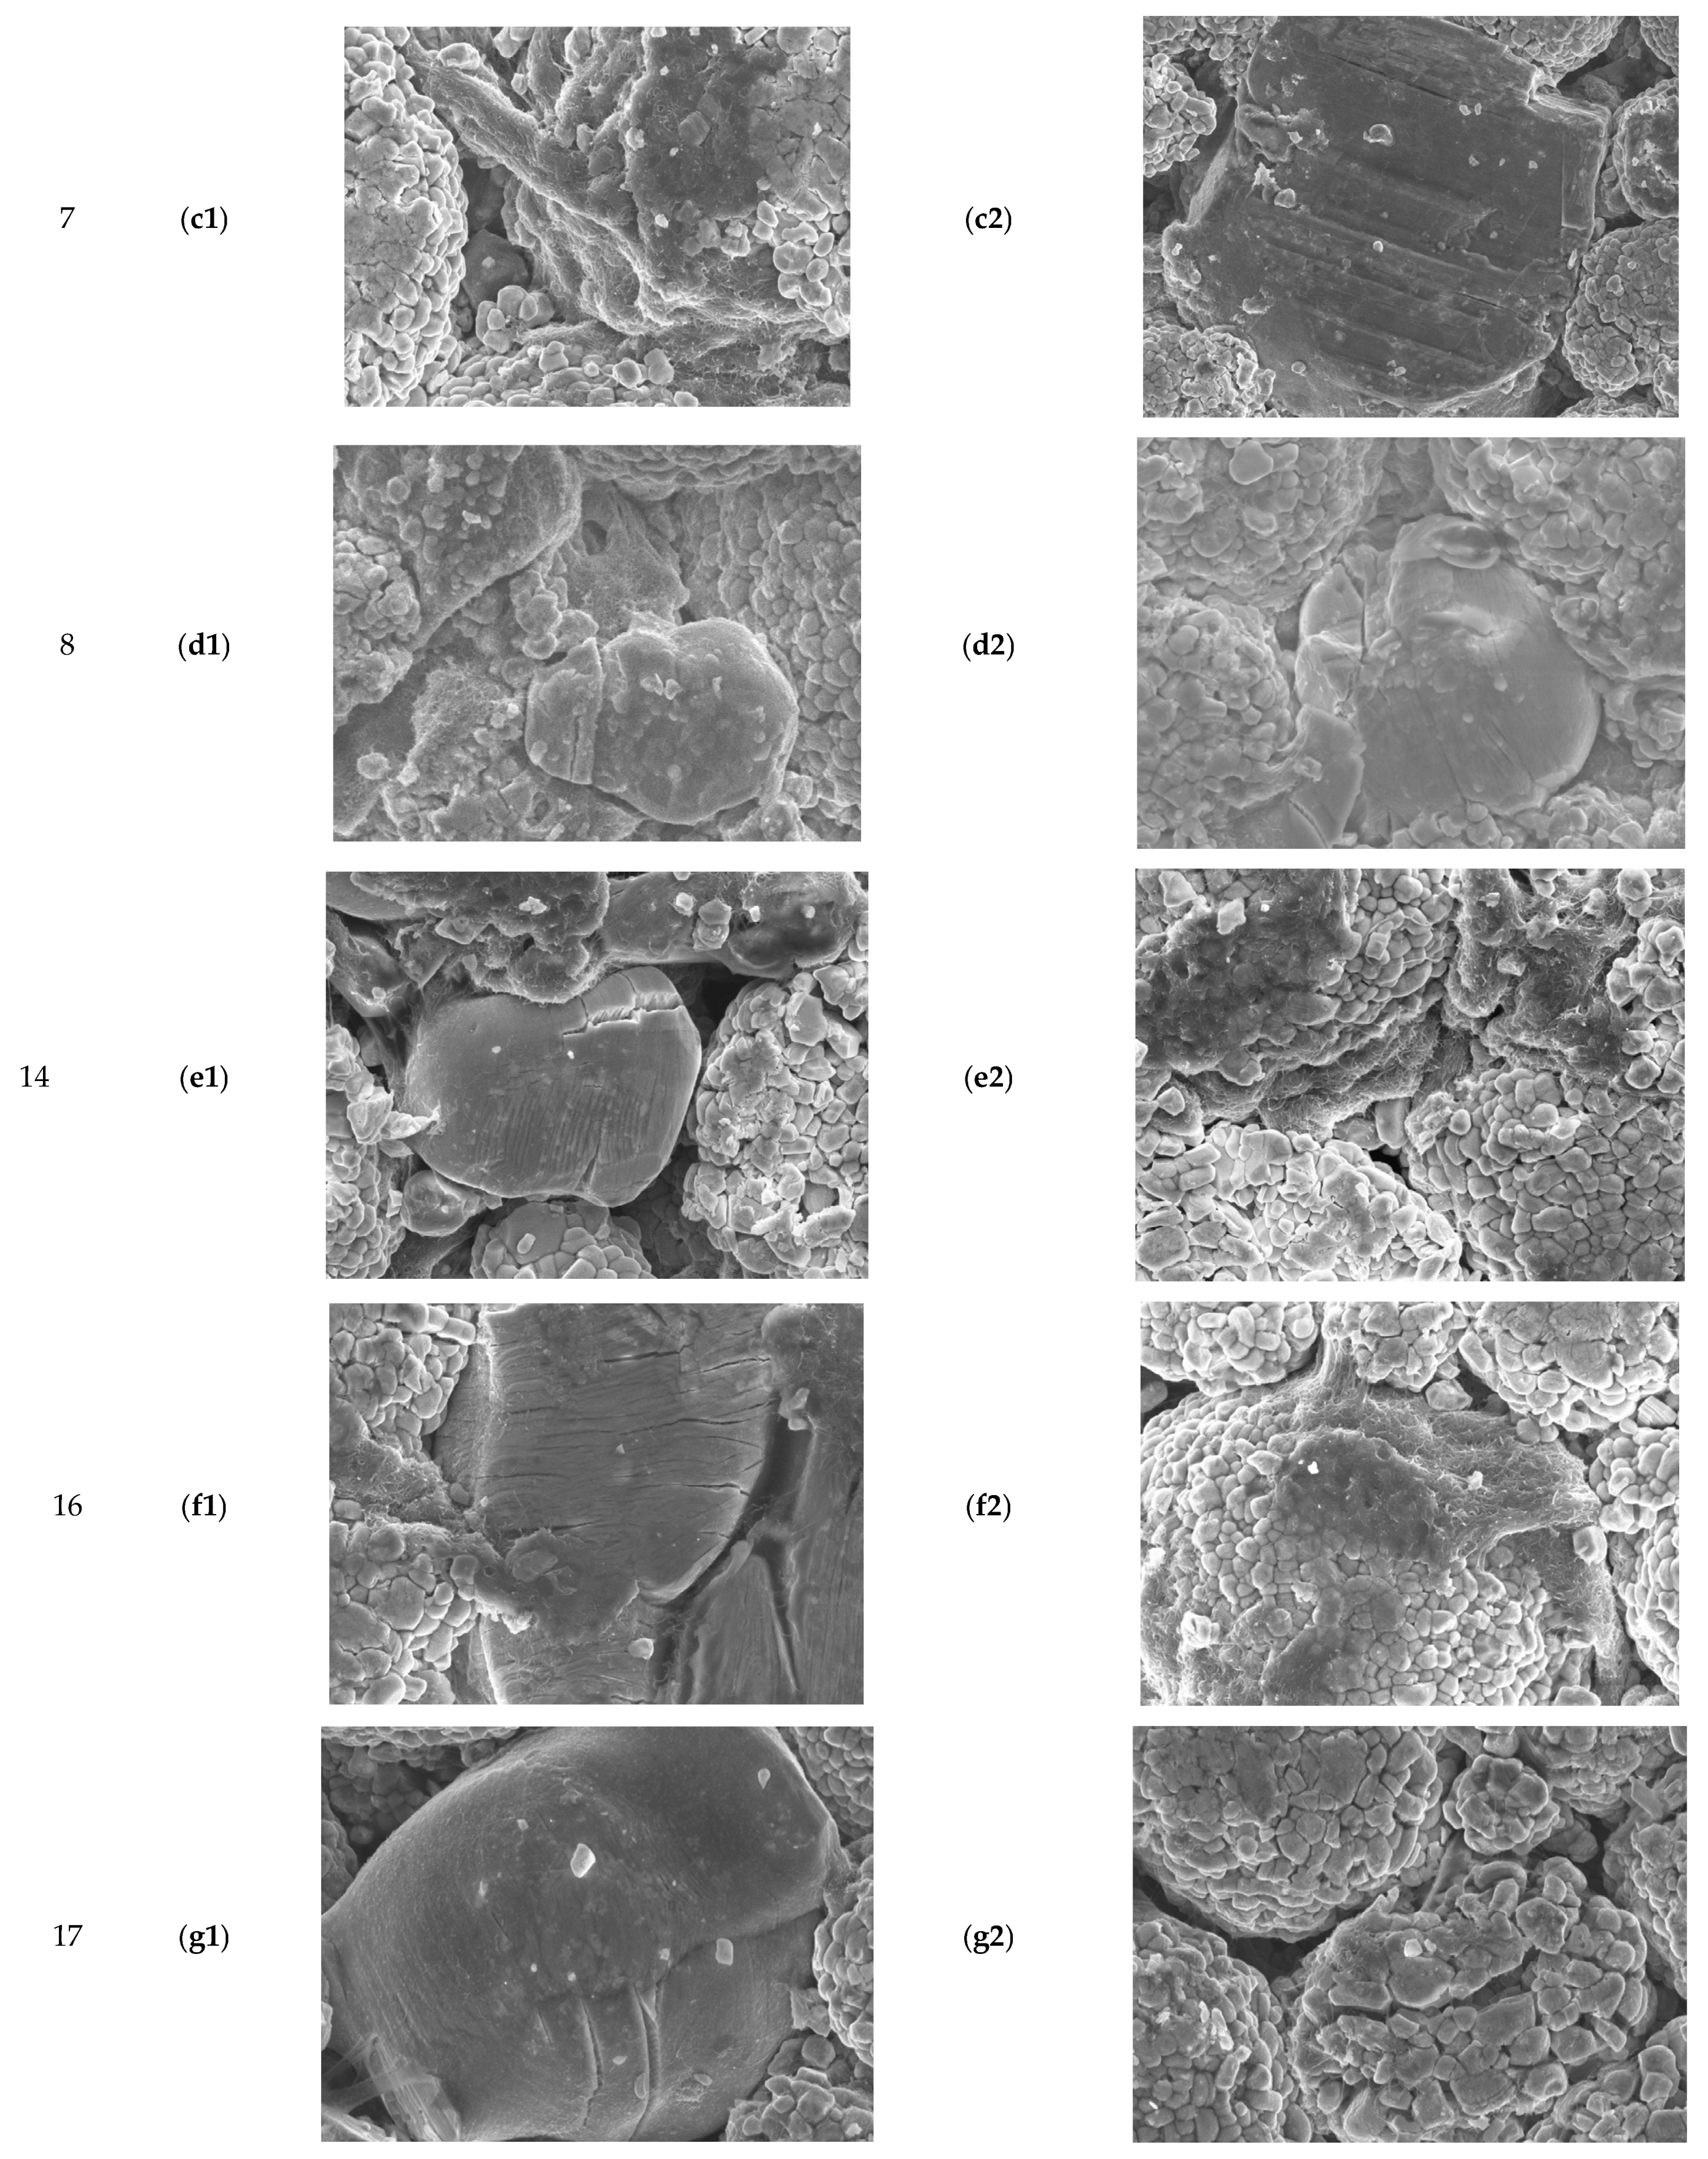
Figure A1. Cathode SEM images for (a1,a2) Cell 1 (b1,b2) Cell 2 (c1,c2) Cell 7 (d1,d2) Cell 8 (e1,e2) Cell 14. (f1,f2) Cell 16 (g1,g2) Cell 17.
Energies 17 00501 g0a1aEnergies 17 00501 g0a1b
Figure A2. EDX spectra of Cell 1 anode.
Energies 17 00501 g0a2
Figure A3. EDX spectra of Cell 2 anode.
Energies 17 00501 g0a3
Figure A4. EDX spectra of Cell 14 anode.
Energies 17 00501 g0a4
Figure A5. EDX spectra of Cell 16 anode.
Energies 17 00501 g0a5
Figure A6. EDX spectra of Cell 17 anode.
Energies 17 00501 g0a6

References

  1. Huang, Y.; Surawski, N.C.; Organ, B.; Zhou, J.L.; Tang, O.H.; Chan, E.F. Fuel consumption and emissions performance under real driving: Comparison between hybrid and conventional vehicles. Sci. Total Environ. 2019, 659, 275–282. [Google Scholar] [CrossRef]
  2. Grahn, M.; Azar, C.; Williander, M.; Anderson, J.E.; Mueller, S.A.; Wallington, T.J. Fuel and vehicle technology choices for passenger vehicles in achieving stringent CO2 targets: Connections between transportation and other energy sectors. Environ. Sci. Technol. 2009, 43, 3365–3371. [Google Scholar] [CrossRef]
  3. Van Vliet, O.P.; Kruithof, T.; Turkenburg, W.C.; Faaij, A.P. Techno-economic comparison of series hybrid, plug-in hybrid, fuel cell and regular cars. J. Power Sources 2010, 195, 6570–6585. [Google Scholar] [CrossRef]
  4. Ramoni, M.O.; Zhang, H.-C. End-of-life (EOL) issues and options for electric vehicle batteries. Clean Technol. Environ. Policy 2013, 15, 881–891. [Google Scholar] [CrossRef]
  5. Casals, L.C.; García, B.A.; Canal, C. Second life batteries lifespan: Rest of useful life and environmental analysis. J. Environ. Manag. 2019, 232, 354–363. [Google Scholar] [CrossRef]
  6. Hendrickson, T.P.; Kavvada, O.; Shah, N.; Sathre, R.; Scown, C.D. Life-cycle implications and supply chain logistics of electric vehicle battery recycling in California. Environ. Res. Lett. 2015, 10, 014011. [Google Scholar] [CrossRef]
  7. Neubauer, J.S.; Wood, E.; Pesaran, A. A second life for electric vehicle batteries: Answering questions on battery degradation and value. SAE Int. J. Mater. Manuf. 2015, 8, 544–553. [Google Scholar] [CrossRef]
  8. Schuster, S.F.; Brand, M.J.; Berg, P.; Gleissenberger, M.; Jossen, A. Lithium-ion cell-to-cell variation during battery electric vehicle operation. J. Power Sources 2015, 297, 242–251. [Google Scholar] [CrossRef]
  9. Gong, X.; Xiong, R.; Mi, C.C. Study of the characteristics of battery packs in electric vehicles with parallel-connected lithium-ion battery cells. IEEE Trans. Ind. Appl. 2014, 51, 1872–1879. [Google Scholar] [CrossRef]
  10. Ahmadi, L.; Yip, A.; Fowler, M.; Young, S.B.; Fraser, R.A. Environmental feasibility of re-use of electric vehicle batteries. Sustain. Energy Technol. Assess. 2014, 6, 64–74. [Google Scholar] [CrossRef]
  11. Gogoana, R.; Pinson, M.B.; Bazant, M.Z.; Sarma, S.E. Internal resistance matching for parallel-connected lithium-ion cells and impacts on battery pack cycle life. J. Power Sources 2014, 252, 8–13. [Google Scholar] [CrossRef]
  12. Mowri, S.T.; Barai, A.; Gupta, A.; Marco, J. Modification of Degradation Mechanism Identification Technique for Cell Grading. In Proceedings of the 2021 IEEE Vehicle Power and Propulsion Conference (VPPC), Virtual, 25 October–14 November 2021; pp. 1–7. [Google Scholar] [CrossRef]
  13. Faraji-Niri, M.; Rashid, M.; Sansom, J.; Sheikh, M.; Widanage, D.; Marco, J. Accelerated state of health estimation of second life lithium-ion batteries via electrochemical impedance spectroscopy tests and machine learning techniques. J. Energy Storage 2023, 58, 106295. [Google Scholar] [CrossRef]
  14. WMG, University of Warwick. Used Nissan LEAF Batteries Given “Second Life” Thanks to WMG, University of Warwick. Available online: https://warwick.ac.uk/newsandevents/pressreleases/used_nissan_leaf/ (accessed on 25 May 2020).
  15. Pastor-Fernández, C.; Bruen, T.; Widanage, W.D.; Gama-Valdez, M.A.; Marco, J. A Study of Cell-to-Cell Interactions and Degradation in Parallel Strings: Implications for the Battery Management System. J. Power Sources 2016, 329, 574–585. [Google Scholar] [CrossRef]
  16. Andre, D.; Appel, C.; Soczka-Guth, T.; Sauer, D.U. Advanced mathematical methods of SOC and SOH estimation for lithium-ion batteries. J. Power Sources 2013, 224, 20–27. [Google Scholar] [CrossRef]
  17. Mowri, S.T.; Barai, A.; Gupta, A.; Marco, J. Verification of the Modified Degradation Mode Identification Technique by Employing Electrochemical Impedance Spectroscopy and Differential Voltage Analysis. Batteries 2022, 8, 274. [Google Scholar] [CrossRef]
  18. Barai, A.; Uddin, K.; Dubarry, M.; Somerville, L.; McGordon, A.; Jennings, P.; Bloom, I. A comparison of methodologies for the non-invasive characterisation of commercial Li-ion cells. Prog. Energy Combust. Sci. 2019, 72, 1–31. [Google Scholar] [CrossRef]
  19. Dubarry, M.; Devie, A.; Liaw, B.Y. The value of battery diagnostics and prognostics. J. Energy Power Sources 2014, 1, 242–249. [Google Scholar]
  20. Martinez-Laserna, E.; Sarasketa-Zabala, E.; Sarria, I.V.; Stroe, D.-I.; Swierczynski, M.; Warnecke, A.; Timmermans, J.-M.; Goutam, S.; Omar, N.; Rodriguez, P. Technical viability of battery second life: A study from the ageing perspective. IEEE Trans. Ind. Appl. 2018, 54, 2703–2713. [Google Scholar] [CrossRef]
  21. Dubarry, M.; Truchot, C.; Liaw, B.Y. Synthesize battery degradation modes via a diagnostic and prognostic model. J. Power Sources 2012, 219, 204–216. [Google Scholar] [CrossRef]
  22. Birkl, C.R.; Roberts, M.R.; McTurk, E.; Bruce, P.G.; Howey, D.A. Degradation diagnostics for lithium ion cells. J. Power Sources 2017, 341, 373–386. [Google Scholar] [CrossRef]
  23. Marongiu, A.; Nlandi, N.; Rong, Y.; Sauer, D.U. On-board capacity estimation of lithium iron phosphate batteries by means of half-cell curves. J. Power Sources 2016, 324, 158–169. [Google Scholar] [CrossRef]
  24. Pastor-Fernández, C.; Yu, T.F.; Widanage, W.D.; Marco, J. Critical review of non-invasive diagnosis techniques for quantification of degradation modes in lithium-ion batteries. Renew. Sustain. Energy Rev. 2019, 109, 138–159. [Google Scholar] [CrossRef]
  25. Xie, W.; He, R.; Gao, X.; Liu, X.; Wang, H.; Liu, X.; Yan, X.; Yang, S. Degradation identification of LiNi0. 8Co0. 1Mn0. 1O2/graphite lithium-ion batteries under fast charging conditions. Electrochim. Acta 2021, 392, 138979. [Google Scholar] [CrossRef]
  26. Laforgue, A.; Yuan, X.-Z.; Platt, A.; Brueckner, S.; Perrin-Sarazin, F.; Toupin, M.; Huot, J.-Y.; Mokrini, A. Effects of fast charging at low temperature on a high energy Li-ion battery. J. Electrochem. Soc. 2020, 167, 140521. [Google Scholar] [CrossRef]
  27. Bach, T.C.; Schuster, S.F.; Fleder, E.; Müller, J.; Brand, M.J.; Lorrmann, H.; Jossen, A.; Sextl, G. Nonlinear aging of cylindrical lithium-ion cells linked to heterogeneous compression. J. Energy Storage 2016, 5, 212–223. [Google Scholar] [CrossRef]
  28. Wu, W.; Ma, R.; Liu, J.; Liu, M.; Wang, W.; Wang, Q. Impact of low temperature and charge profile on the aging of lithium-ion battery: Non-invasive and post-mortem analysis. Int. J. Heat Mass Transf. 2021, 170, 121024. [Google Scholar] [CrossRef]
  29. Ouyang, M.; Chu, Z.; Lu, L.; Li, J.; Han, X.; Feng, X.; Liu, G. Low temperature aging mechanism identification and lithium deposition in a large format lithium iron phosphate battery for different charge profiles. J. Power Sources 2015, 286, 309–320. [Google Scholar] [CrossRef]
  30. Schindler, M.; Sturm, J.; Ludwig, S.; Schmitt, J.; Jossen, A. Evolution of initial cell-to-cell variations during a three-year production cycle. ETransportation 2021, 8, 100102. [Google Scholar] [CrossRef]
  31. Huang, S.-C.; Tseng, K.-H.; Liang, J.-W.; Chang, C.-L.; Pecht, M.G. An online SOC and SOH estimation model for lithium-ion batteries. Energies 2017, 10, 512. [Google Scholar] [CrossRef]
  32. Ungurean, L.; Cârstoiu, G.; Micea, M.V.; Groza, V. Battery state of health estimation: A structured review of models, methods and commercial devices. Int. J. Energy Res. 2017, 41, 151–181. [Google Scholar] [CrossRef]
  33. Dubarry, M.; Truchot, C.; Liaw, B.Y.; Gering, K.; Sazhin, S.; Jamison, D.; Michelbacher, C. Evaluation of commercial lithium-ion cells based on composite positive electrode for plug-in hybrid electric vehicle applications. Part II. Degradation mechanism under 2C cycle aging. J. Power Sources 2011, 196, 10336–10343. [Google Scholar] [CrossRef]
  34. Pastor-Fernández, C.; Uddin, K.; Chouchelamane, G.H.; Widanage, W.D.; Marco, J. A Comparison between Electrochemical Impedance Spectroscopy and Incremental Capacity-Differential Voltage as Li-ion Diagnostic Techniques to Identify and Quantify the Effects of Degradation Modes within Battery Management Systems. J. Power Sources 2017, 360, 301–318. [Google Scholar] [CrossRef]
  35. TeslaInfo. Tesla Battery Degradation and Health. Available online: https://tesla-info.com/blog/battery-degradation.php (accessed on 5 January 2024).
  36. Lin, F.; Markus, I.M.; Nordlund, D.; Weng, T.-C.; Asta, M.D.; Xin, H.L.; Doeff, M.M. Surface reconstruction and chemical evolution of stoichiometric layered cathode materials for lithium-ion batteries. Nat. Commun. 2014, 5, 3529. [Google Scholar] [CrossRef]
  37. Gao, X.-L.; Liu, X.-H.; Xie, W.-L.; Zhang, L.-S.; Yang, S.-C. Multiscale observation of Li plating for lithium-ion batteries. Rare Met. 2021, 40, 3038–3048. [Google Scholar] [CrossRef]
  38. Li, Y.; Feng, X.; Ren, D.; Ouyang, M.; Lu, L.; Han, X. Thermal runaway triggered by plated lithium on the anode after fast charging. ACS Appl. Mater. Interfaces 2019, 11, 46839–46850. [Google Scholar] [CrossRef]
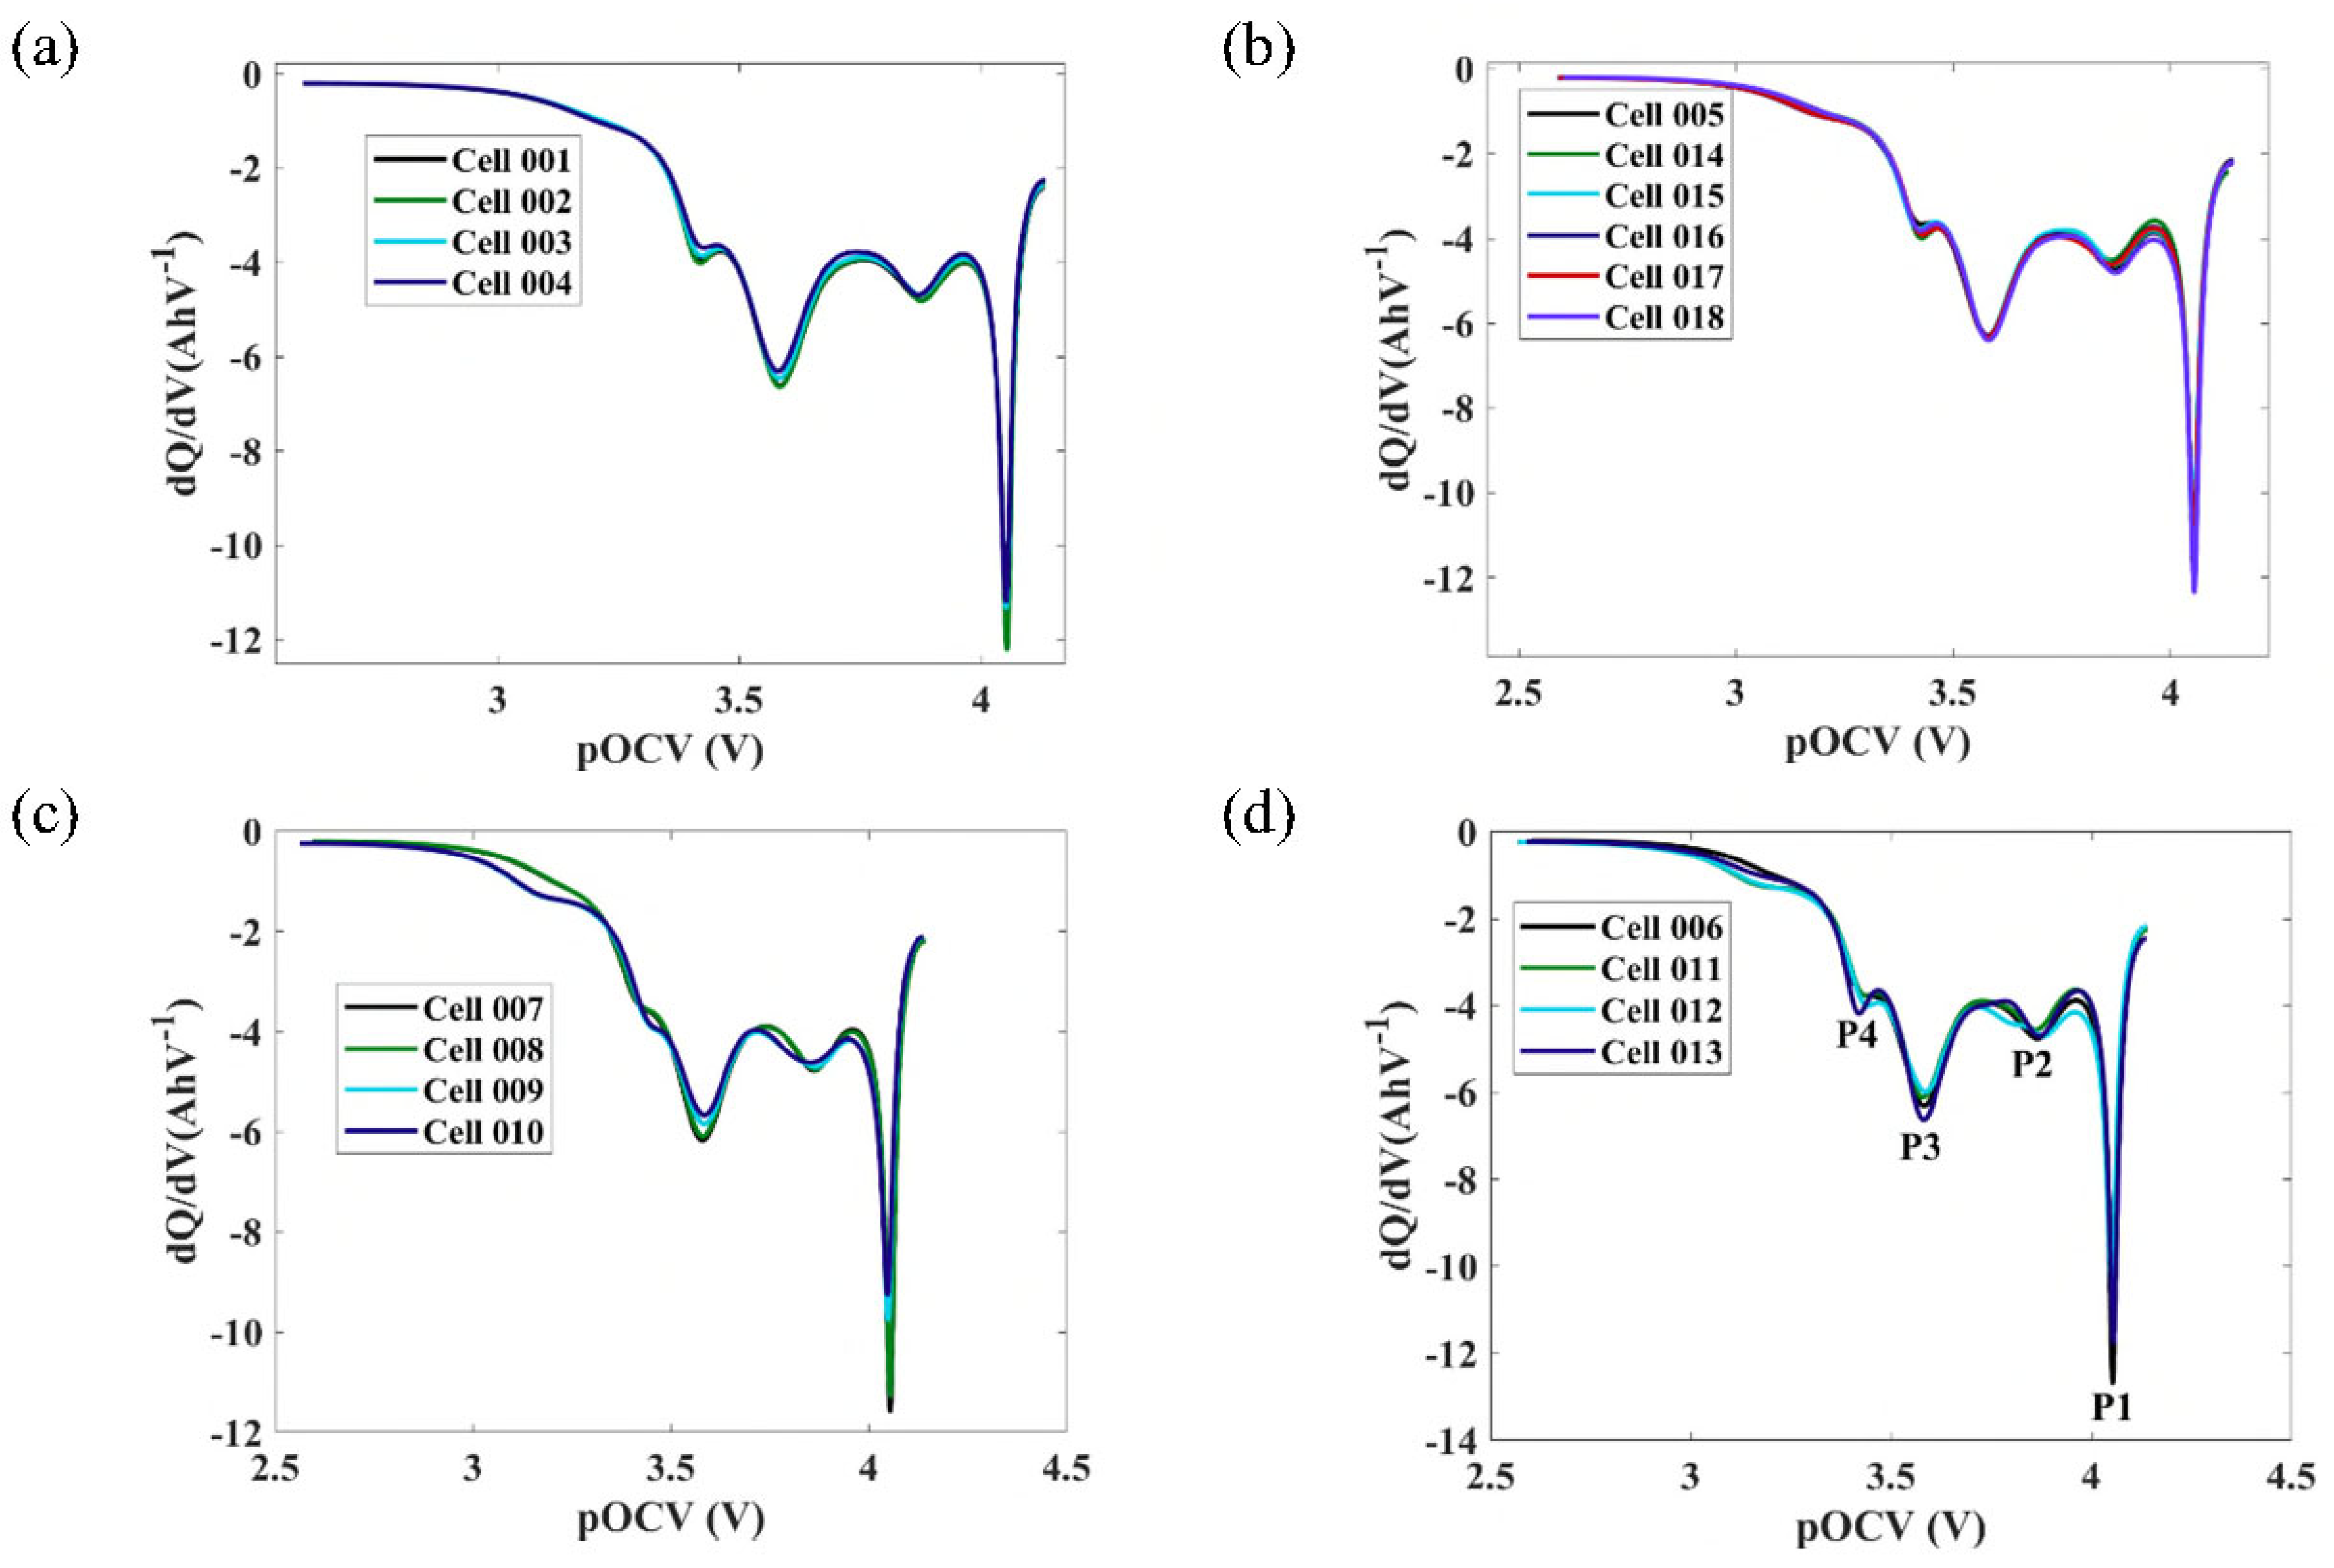
Figure 1. IC curves of the cells at the end of their first life (a) Cell 001 to 004 (b) Cell 005, 014 to 018 (c) Cell 007 to 010 (d) Cell 006, 011 to 013.
Energies 17 00501 g001
Figure 2. The progression of the second life degradation test for the individual cells.
Energies 17 00501 g002
Figure 3. (a) Single-day duty cycle profile. (b) Synthesised duty cycle profile (c) 1 Full Equivalent Month.
Energies 17 00501 g003
Figure 4. End of first life and post-second-life SoH of the cells.
Energies 17 00501 g004
Figure 5. Second-life SoH of the cells in Group 1.
Energies 17 00501 g005
Figure 6. Second-life SoH of the cells in Group 2.
Energies 17 00501 g006
Figure 7. Second-life SoH of the cells in Group 3.
Energies 17 00501 g007
Figure 8. Second life SoH of the cells in Group 4.
Energies 17 00501 g008
Figure 9. Magnified version of anode from Cell 3.
Energies 17 00501 g009
Figure 10. Negative Electrode images after second life testing.
Energies 17 00501 g010aEnergies 17 00501 g010b
Figure 11. Anode SEM images after second-life degradation for (a) Cell 1 (b) Cell 2 (c) Cell 14 (d) Cell 16 (e) Cell 17 (f) Cell 7 (g) Cell 8.
Energies 17 00501 g011aEnergies 17 00501 g011b
Table 1. End of first or starting of second-life SoH and first-life DM of the cells.
CellP4P3P2P1DM TypeEnd of First Life SoH%/Starting of Second Life SoH%
Cell 1LAMLLILAMLLIType-180.57
Cell 2LAMLLILAMLLIType-180.54
Cell 3LAMLLILAMLLIType-178.76
Cell 4LAMLLILAMLLIType-177.56
Cell 5LAMLLILLILLIType-279.35
Cell 6LLILLILLILLIType-379.35
Cell 7PDLLILLILLIType-479.83
Cell 8PDLLILLILLIType-479.42
Cell 9PDLLILLILLIType-481.16
Cell 10PDLLILLILLIType-479.75
Cell 11LLILLILLILLIType-381.16
Cell 12LLILLILLILLIType-380.2
Cell 13LLILLILLILLIType-378.58
Cell 14LAMLLILLILLIType-277.96
Cell 15LAMLLILLILLIType-278.36
Cell 16LAMLLILLILLIType-279.74
Cell 17LAMLLILLILLIType-279.76
Cell 18LAMLLILLILLIType-280.56
Table 2. Cell grading considering first-life SoH and DM (identified at 80% SoH).
Group DM Type
Group 1Cell 1Cell 2Cell 3Cell 4 Type-1
Group 2Cell 5Cell 14Cell 15Cell 16Cell 17Cell 18Type-2
Group 3Cell 6Cell 11Cell 12Cell 13 Type-3
Group 4Cell 7Cell 8Cell 9Cell 10 Type-4
Table 3. DM of the cells from Group 1 at around 95%, 90%, 85%, and 80% SoH.
CellCycleSoHP4P3P2P1
112094.17LLILAMUU
35590.38LLILLILAMU
58584.15LLILLILAMLLI
59680.58LAMLLILAMLLI
212094.55LLILAMUU
35590.74LLILLILAMU
58584.07LLILLILAMLLI
59680.54LAMLLILAMLLI
312094.07LLILAMUU
35590.28LLILLILAMU
58583.33LLILLILAMLLI
59678.76LAMLLILAMLLI
412094.51LLILAMUU
35590.58LLILLIUU
50585.57LAMLLILAMU
52577.56LAMLLILAMLLI
Table 4. DM of the cells from Group 2 at around 95%, 90%, 85%, and 80% SoH.
CellCycleSoHP4P3P2P1
55295.59LLILAMLAMU
23079.54LAMLLILLILLI
148094.15LAMLAMLLIU
12589.52LLILLILLIU
17584.47LAMLLILLILLI
18777.96LAMLLILLILLI
158094.37LAMLAMLAMU
17589.18LLILLILLIU
23085.37LLILLILLILLI
28578.36LAMLLILLILLI
168094.31LLILAMLLIU
12590.06LLILLILLIU
17583.65LAMLLILLILLI
18279.74LAMLLILLILLI
178094.11LAMLAMLLIU
12589.18LLILLILLIU
17583.17LAMLLILLILLI
18379.76LAMLLILLILLI
1810093.39LLILAMLAMU
18089.38LLILLILLIU
24584.37LAMLLILLIU
28080.56LAMLLILLILLI
Table 5. DM of the cells from Group 3 at around 95%, 90%, 85%, and 80% SoH.
CellCycleSoH %P4P3P2P1
75295.25LAMLAMUU
22581.30LLILLILLILLI
23079.72PDLLILLILLI
85295.11LAMLAMUU
22581.24LLILLILLILLI
23079.26PDLLILLILLI
915094.39LLILAMLAMU
52089.98LLILAMLLIU
57085.57PDLLILAMLLI
60081.16PDLLILLILLI
1015094.34LLILAMLAMU
52088.98LLILAMLLILLI
57084.37PDLLILAMLLI
60079.76PDLLILLILLI
Table 6. DMs of the cells from Group 4 at around 95%, 90%, 85%, and 80% SoH.
CellCycleSoH %P4P3P2P1
65295.45LAMLAMLAMU
24779.56LLILLILLILLI
1115094.28LLILAMLAMU
30091.88LLILAMLLIU
37085.97LLILLILAMLLI
40381.16LLILLILLILLI
124095.87LAMLAMLAMU
12089.58LAMLAMLAMU
19084.23LAMLLILLILLI
20180.2LLILLILLILLI
134096.13LAMLAMLAMU
12078.58LLILLILLILLI
Disclaimer/Publisher’s Note: The statements, opinions and data contained in all publications are solely those of the individual author(s) and contributor(s) and not of MDPI and/or the editor(s). MDPI and/or the editor(s) disclaim responsibility for any injury to people or property resulting from any ideas, methods, instructions or products referred to in the content.