Article

A Pore Scale Study on Heat Transfer Characteristics of Integrated Thermal Protection Structures with Phase Change Material

1
State Key Laboratory of Environment-Friendly Energy Materials, Southwest University of Science and Technology, Mianyang 621010, China
2
State Key Laboratory of Aerodynamics, China Aerodynamics Research and Development Center, Mianyang 621000, China
3
School of Aerospace, Xi’an Jiaotong University, Xi’an 710049, China
*
Authors to whom correspondence should be addressed.
Energies 2024, 17(2), 465; https://doi.org/10.3390/en17020465
Submission received: 23 December 2023 / Revised: 11 January 2024 / Accepted: 15 January 2024 / Published: 18 January 2024
(This article belongs to the Special Issue Advances in Solar Thermal Energy Harvesting, Storage and Conversion)

Abstract

:
Phase change material (PCM) are characterized by their high latent heat and low density. Combining PCM with building walls, aircraft fuselages, and other structures can significantly enhance the thermal sink capability of these structures. In order to address the issue of low heat storage efficiency resulting from the low thermal conductivity of PCM, a novel integrated thermal protection structure (ITPS) architecture with a supportive structure based on a porous lattice has been designed. Experimental and numerical methods were employed to investigate the thermal response characteristics of the ITPS with and without PCM, the melting behavior of PCM within the porous lattice, and the effects of lattice configuration and pore size on the PCM melting rate. The current ITPS study includes evaluation of two types of lattice configurations and three different pore sizes. The results indicate that the inclusion of PCM reduces the internal panel temperature of the ITPS by approximately 15%. The melting of PCM occurs primarily at the central region of the porous lattice and gradually spreads towards the periphery until complete melting is achieved. Specifically, the Gibson–Ashby lattice configuration enhances the PCM melting rate by 43.5%, while the tetradecahedron lattice configuration yields a 53.1% improvement. Furthermore, for PCM with different pore sizes, smaller pores exhibit faster melting rates during the early and intermediate stages, whereas larger pores exhibit faster melting rates in the later stages as the proportion of liquid PCM increases. The conclusions of this study provide valuable insights for the application of PCM in the field of thermal management.

1. Introduction

PCM possess numerous outstanding characteristics, such as high latent heat, low density, and sustained stability during phase transition [1,2,3,4,5]. Integrating PCM with structures like building walls and aircraft shells can significantly enhance the thermal sink capabilities of these structures [6,7,8]. This integrated approach enables the structures to regulate their internal temperature by storing and releasing solar energy when exposed to sunlight, thereby achieving temperature control and energy conservation.
However, conventional PCM often exhibit low thermal conductivity, which limits their heat storage efficiency when used directly as heat-absorbing materials. To enhance the heat storage efficiency of PCM, researchers have employed various optimization methods. Among them, the preparation of phase change microcapsules [9,10], the addition of high thermal conductivity materials [11,12], and the insertion of metallic fins [13,14] are commonly used methods. However, compared to these methods, embedding high thermal conductivity porous foam as a thermal conductive framework [15,16,17,18,19] has shown more significant and stable performance improvements [20]. To investigate the impact of porous metal foam on heat storage performance, Yang et al. [21] conducted numerical simulations and found that the application of porous metal foam can significantly improve the heat transfer efficiency and temperature uniformity of PCMs. In addition, Xiao et al. [22] prepared foam copper/paraffin composite phase change materials (PCMs) using a vacuum impregnation method and measured their effective thermal conductivity, showing that the thermal conductivity of PCMs is 15 times higher than that of pure paraffin. Lafdi et al. [23] experimentally studied the influence of pore size and porosity of porous metal foam on the PCM melting process, revealing that an increase in aluminum foam porosity leads to faster attainment of steady-state temperature for the PCMs. In conclusion, embedding high thermal conductivity porous foam as a thermal conductive framework can effectively improve the heat storage rate of PCMs, reduce the melting time, and decrease temperature gradients. However, porous foam does possess some limitations, such as a closed-cell structure, irregular pore shapes, and variable pore sizes, which impede further enhancement of the heat storage capacity of PCMs and optimization possibilities.
The porous lattice manufactured using 3D printing technology overcomes the drawbacks of traditional porous foam structures such as non-connectivity and irregularity, while offering strong design flexibility, making it an ideal thermal enhancement material [24]. By optimizing geometric parameters such as lattice configuration, porosity, and pore size, the heat storage capacity of PCMs can be further improved. Hu et al. [25] conducted numerical simulations to investigate the impact of a cubic lattice configuration on the heat transfer characteristics of paraffin. The numerical results demonstrate that paraffin impregnated in an aluminum lattice exhibits a significantly shortened melting time and more uniform temperature distribution compared to pure paraffin. Zhang et al. [26] prepared PCMs with different types and pore sizes, studying their heat storage performance on a visualized phase change heat storage experimental platform. Experimental results indicate that the introduction of lattice structures can enhance the thermal conductivity and heat storage density of PCMs. Qureshi et al. [27] fabricated PCMs with four different structures and measured their effective thermal conductivity. The research findings reveal that the thermal conductivity of the diamond structure increased by 11.9 times compared to pure paraffin, the gyro structure increased by 10.4 times, and the original structure increased by 7.3 times. Sriharsha et al. [28] investigated the influence of pore size and porosity of porous lattices on the heat transfer characteristics of PCMs. The results demonstrate that smaller pore sizes and higher porosity can make higher heat storage efficiency of PCMs.
In summary, the lattice configurations of interest in the current study include Kelvin, body-centered cubic, face-centered cubic, primitive, gyroid, and Gibson–Ashby structures et al. Pore sizes of porous lattice structures in practical applications typically fall within the millimeter range. As a result, millimeter-sized pore sizes are commonly employed in related studies [29,30,31]. Furthermore, the addition of a porous lattice has been found to effectively enhance the heat storage efficiency of PCMs. Therefore, this study combines the metallic shell structure of a certain aircraft to design an ITPS containing a periodic porous lattice. The lattice units serve as both the supporting structure and the thermal conductivity enhancement material for PCMs. The thermal response characteristics of the ITPS samples with and without PCMs were obtained through experiments. A numerical model of the ITPS containing PCMs was established, and the melting process of the PCMs inside the ITPS was numerically simulated using numerical methods. Additionally, an analysis of the factors influencing the melting rate of PCMs was conducted. The conclusions of this research provide important references for the application of PCMs in energy storage and thermal management fields.
The paper is organized as follows: Section 2 describes the experimental models, numerical models, and materials employed for the analysis. Section 3 presents the experimental methods, numerical methods, and validation results used for the analysis. Section 4 presents and discusses the obtained results, while Section 5 provides the conclusions.

2. Models and Materials

2.1. Experimental Models

The experiments are divided into two cases: with and without PCMs. Additionally, in order to compare the influence of different lattice structure on the heat transfer characteristics of ITPS, an experimental model as shown in Figure 1 was created. The left cavity of the metallic base was filled with an alumina ceramic component containing a Gibson–Ashby lattice (GA) to obtain GA-ITPS. The right cavity of the metallic base was filled with an alumina ceramic component containing a tetradecahedron lattice [14] to obtain 14-ITPS. The porous lattice units in the alumina ceramic components had a porosity ( ε ) of 0.75, and the cell size was 8 mm. The flat plate in the alumina ceramic component served as the inner plate of ITPS, while the bottom panel of the metallic base served as the outer plate of ITPS. The thickness of both plates was 2 mm. The dimensions of the two cavities in the metallic base were 76 mm × 36 mm × 10 mm. PCM was filled through the holes on the inner plate, resulting in GA-PCMs when combined with the GA lattice, and 14-PCMs when combined with the tetradecahedron lattice.

2.2. Simulation Models

To further investigate the PCM melting process inside the ITPS and factors affecting the melting rate of PCMs, a simulation model was established as shown in Figure 2a. In the left cavity of the metallic base, the PCM is integrated with porous lattices of varying structures (Gibson–Ashby and tetradecahedron) and diverse pore sizes (8 mm, 6 mm, and 4 mm), while the right cavity was filled with pure PCM. The primary role of PCM is to provide latent heat, while the lattice structure serves to enhance thermal conduction. Therefore, the model was designed with one side featuring the lattice structure and the other side without it. This configuration aims to demonstrate the ability of the lattice structure to enhance thermal conduction and thereby accelerate the melting of PCM. The simulation model was subjected to boundary conditions as shown in Figure 2b: a constant temperature boundary (Th) of 353.15 K was applied to the lower surface of the model, while the walls surrounding the model were treated as adiabatic boundaries. The ambient temperature was set to 298.15 K.

2.3. Material Properties Parameters

In this study, the material of the metal base is S-06 stainless steel, and the material of the lattice is alumina ceramic. Considering requirements such as phase transition temperature, latent heat of fusion, density, and chemical stability, slice paraffin (China National Pharmaceutical Group Chemical Reagent Co., Ltd., Shanghai, China) with a phase transition temperature ranging from 324.45 K to 334.25 K was chosen as the PCM. First, the paraffin was subjected to DSC testing using a DSC instrument (NETZSCH, DSC 200 F3). Then, the thermal conductivity of paraffin, aluminum oxide ceramic, and S-06 stainless steel was measured using a thermal conductivity analyze, and the material properties are listed in Table 1 [32].

3. Methods and Verifications

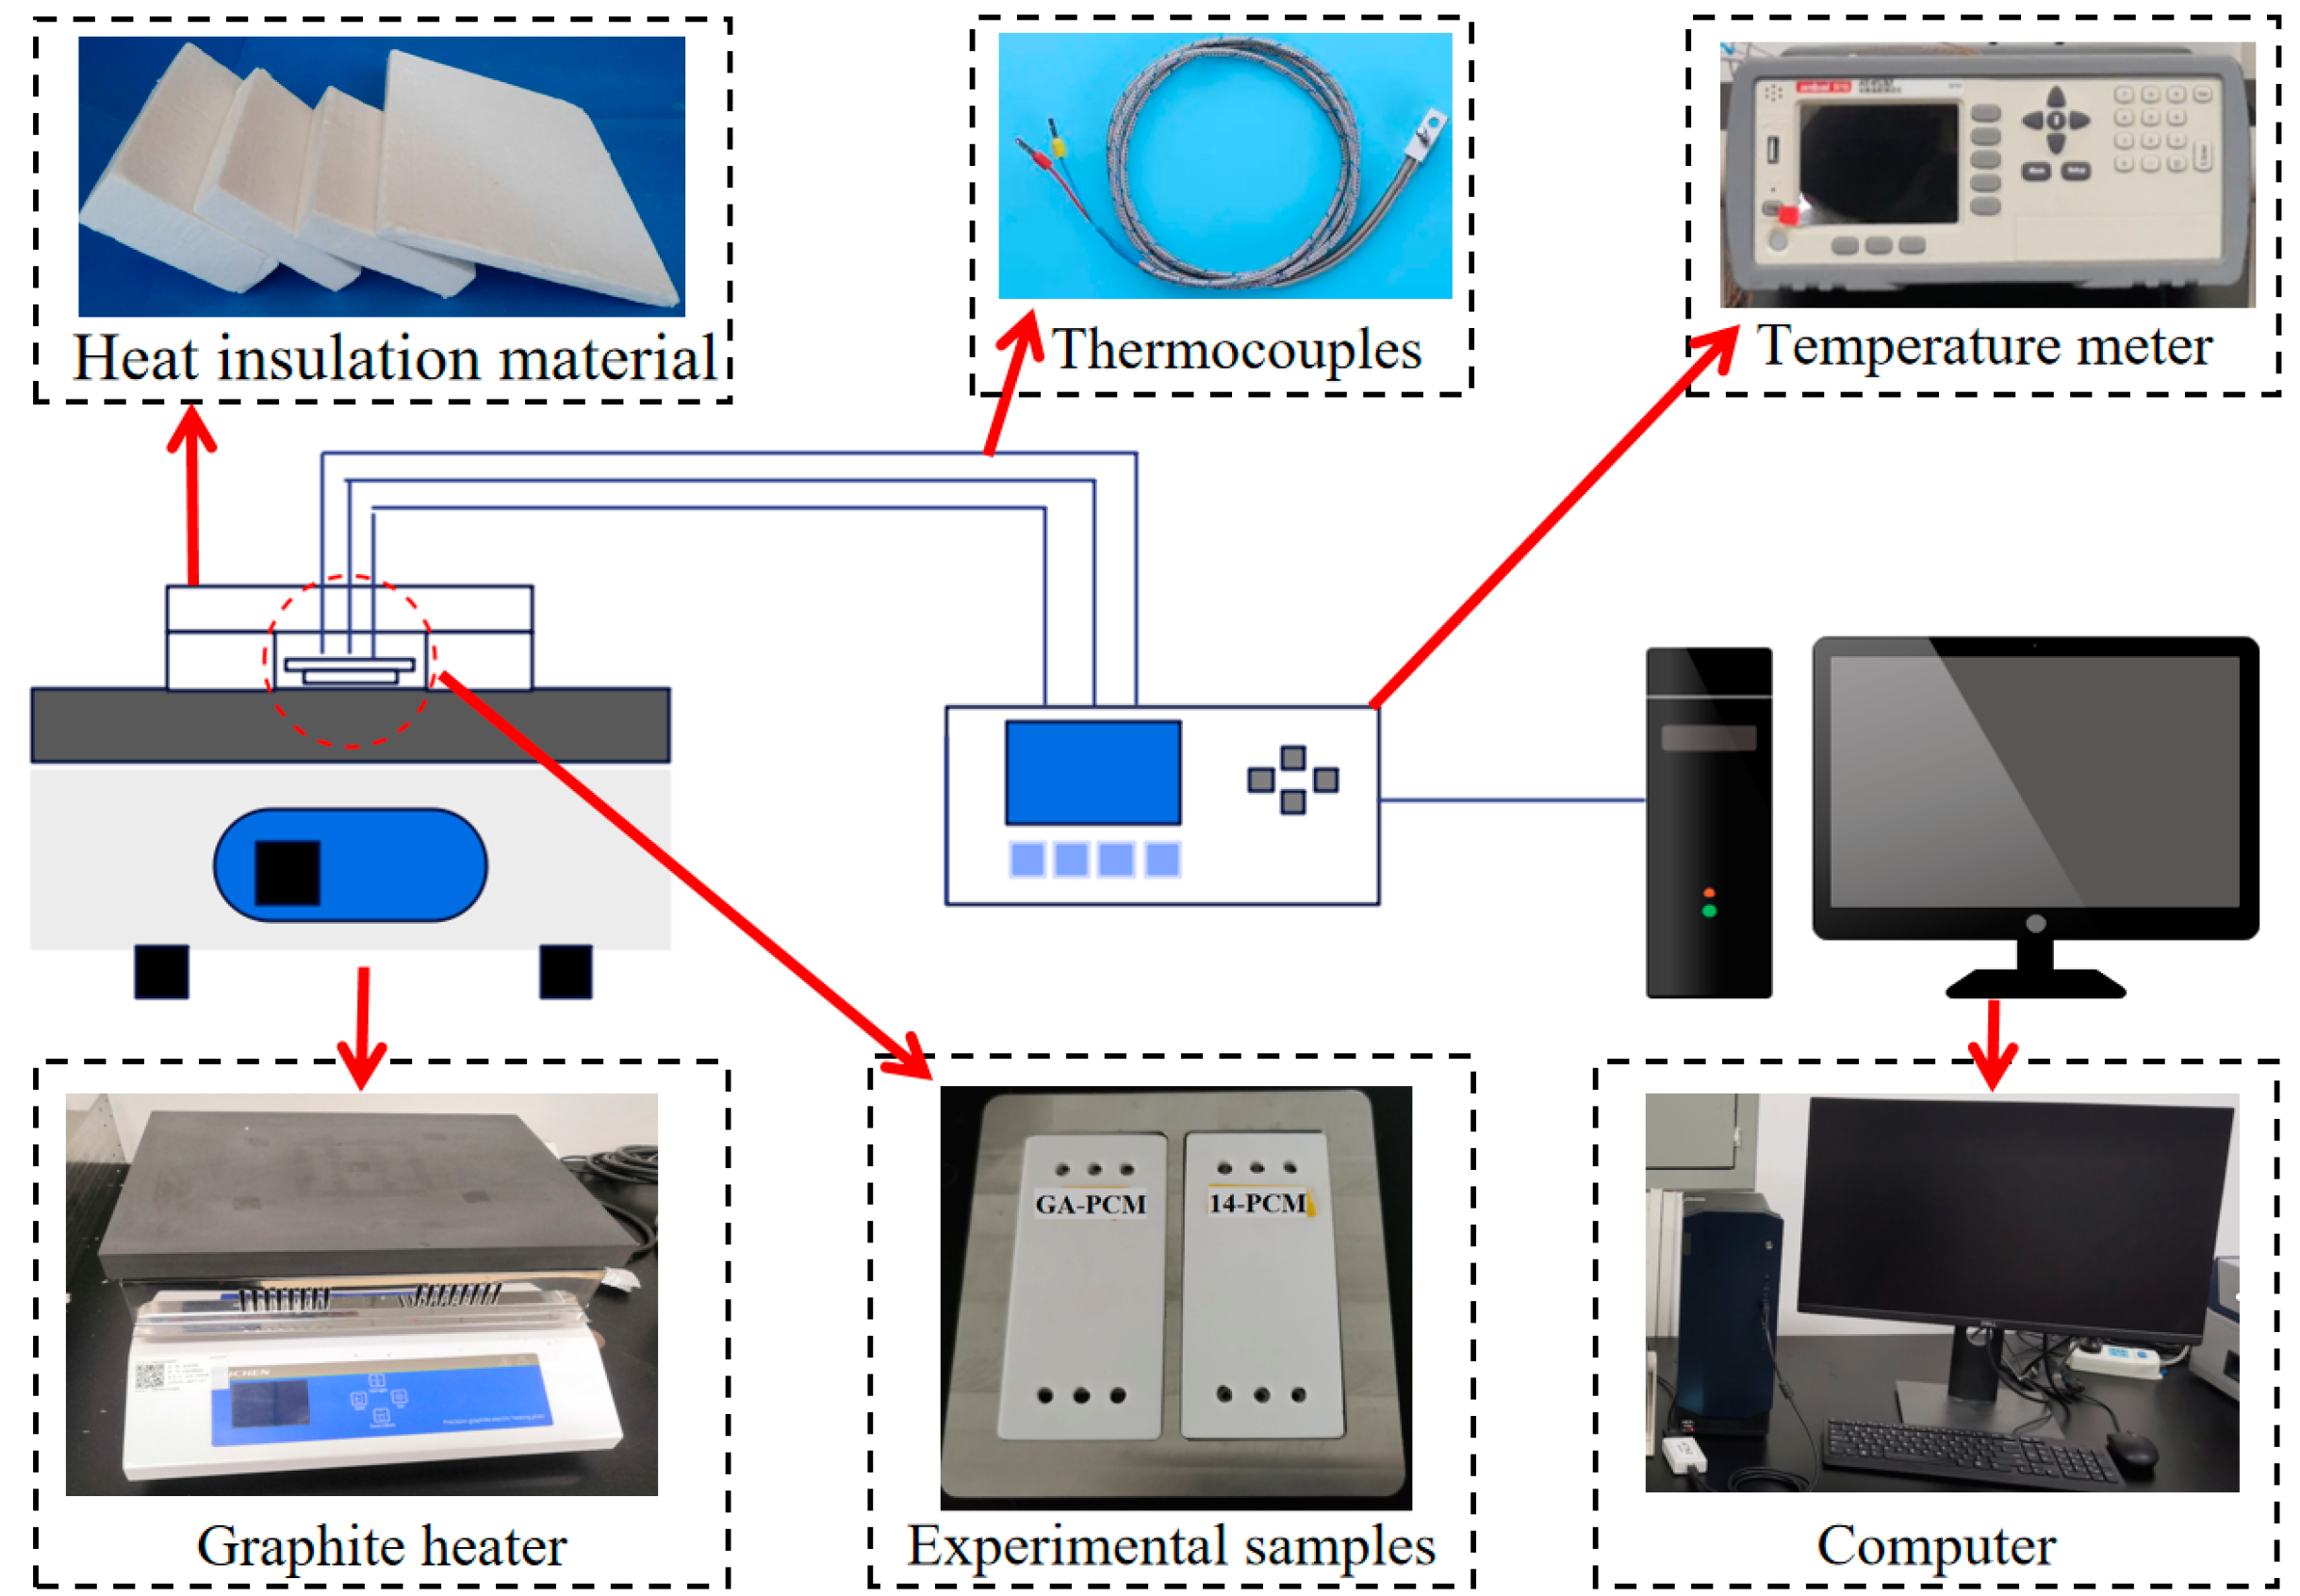
3.1. Experimental Methods

Two alumina ceramic components containing different lattice units (Gibson–Ashby lattice and tetradecahedron lattice) were manufactured through 3D printing. These components were then filled into the respective grooves of the metallic base to create ITPS experimental specimens with different lattice structures. For the thermal response experiments of ITPS with PCM, the following steps were taken to prepare the ITPS specimens containing PCMs:
(1)
The 3D-printed alumina ceramic components were combined with the metallic base to form the ITPS experimental specimens.
(2)
The paraffin and the ITPS specimens were heated to 353.15 K to completely liquefy paraffin.
(3)
The liquefied paraffin was poured into the porous lattice units through pre-designed holes, and the system was allowed to thermally equilibrate for a certain period to ensure complete filling of the porous lattice.
(4)
The paraffin was cooled and solidified at room temperature (298.15 K), resulting in the formation of ITPS specimens containing PCMs.
A phase change thermal storage experimental platform was set up to conduct heating experiments on the prepared specimens. As shown in Figure 3, the platform consists of a graphite heating plate, insulation cotton, a thermocouple, a temperature tester, and a computer. The process of this heating experiment is as follows:
(1)
First, heat the temperature of the graphite heating plate to 353.15 K.
(2)
Then, wrap the experimental sample with thermal insulation cotton around its surroundings. And place a thermocouple at the center point on the surface of the inner plate.
(3)
Next, place the experimental sample on a graphite heating platform at a temperature of 353.15 K. The temperature data are transmitted to the temperature tester through the thermocouple.
(4)
Finally, the collected temperature data was processed and analyzed using a computer.

3.2. Numerical Methods

The heat transfer in PCMs during the phase transition process is highly complex and involves heat conduction between the lattice framework and the solid PCM, convective heat transfer between the lattice framework and the liquid PCM and natural convection within the liquid PCM, among others. Therefore, to simplify the analysis and solution, the following assumptions are introduced in the computational model [33]:
(1)
The molten liquid paraffin is considered as an incompressible Newtonian fluid, and its flow within the enclosed space is assumed to be laminar.
(2)
Except for density differences caused by the Boussinesq assumption, all other thermophysical properties of the material are assumed to be constant.
(3)
Thermal radiation within the PCMs is neglected.
(4)
The distribution of paraffin and aluminum oxide is assumed to be uniform and isotropic.
This study employs the enthalpy-porosity model in Fluent 2022 R1 software package to simulate the melting process of PCM [34]. In this model, the solid–liquid mixture region of PCM is treated as a porous medium, and the liquid fraction β of PCM is equivalent to the porosity of the porous medium. β = 0 indicates that PCM is in the solid state, 0 < β < 1 indicates the solid–liquid mixture state of PCM, and β = 1 indicates that PCM is in the liquid state. The liquid fraction β is defined as follows [29]:
β = 0 T < T s T T s T l T s T s < T < T l 1 T > T l
Based on the assumptions mentioned above, the governing equations can be expressed as follows:
Continuity equation:
ρ t + ρ v = 0
Momentum equation:
ρ v t + ρ v i v = μ v i p x i + S
Energy equation:
ρ H t + ρ v H = λ c p 2 H + F
In Equations (2)–(4), ρ represents the density of the PCM, kg/m3; v represents the fluid velocity, m/s; μ represents the liquid phase viscosity of the PCM; p represents the pressure, Pa; S represents the source term in the momentum equation; λ represents the thermal conductivity, W/(m·K); H represents the specific enthalpy; cp represents the specific heat; F represents the source term in the energy equation.
H = h + Δ L
h = h ref + T ref T c p d T
Δ L = β L
In Equations (5)–(7), h represents the sensible enthalpy, J/(kg·K); ΔL represents the released latent heat, kJ/kg; L represents the latent heat, kJ/kg.

3.3. Method Verification

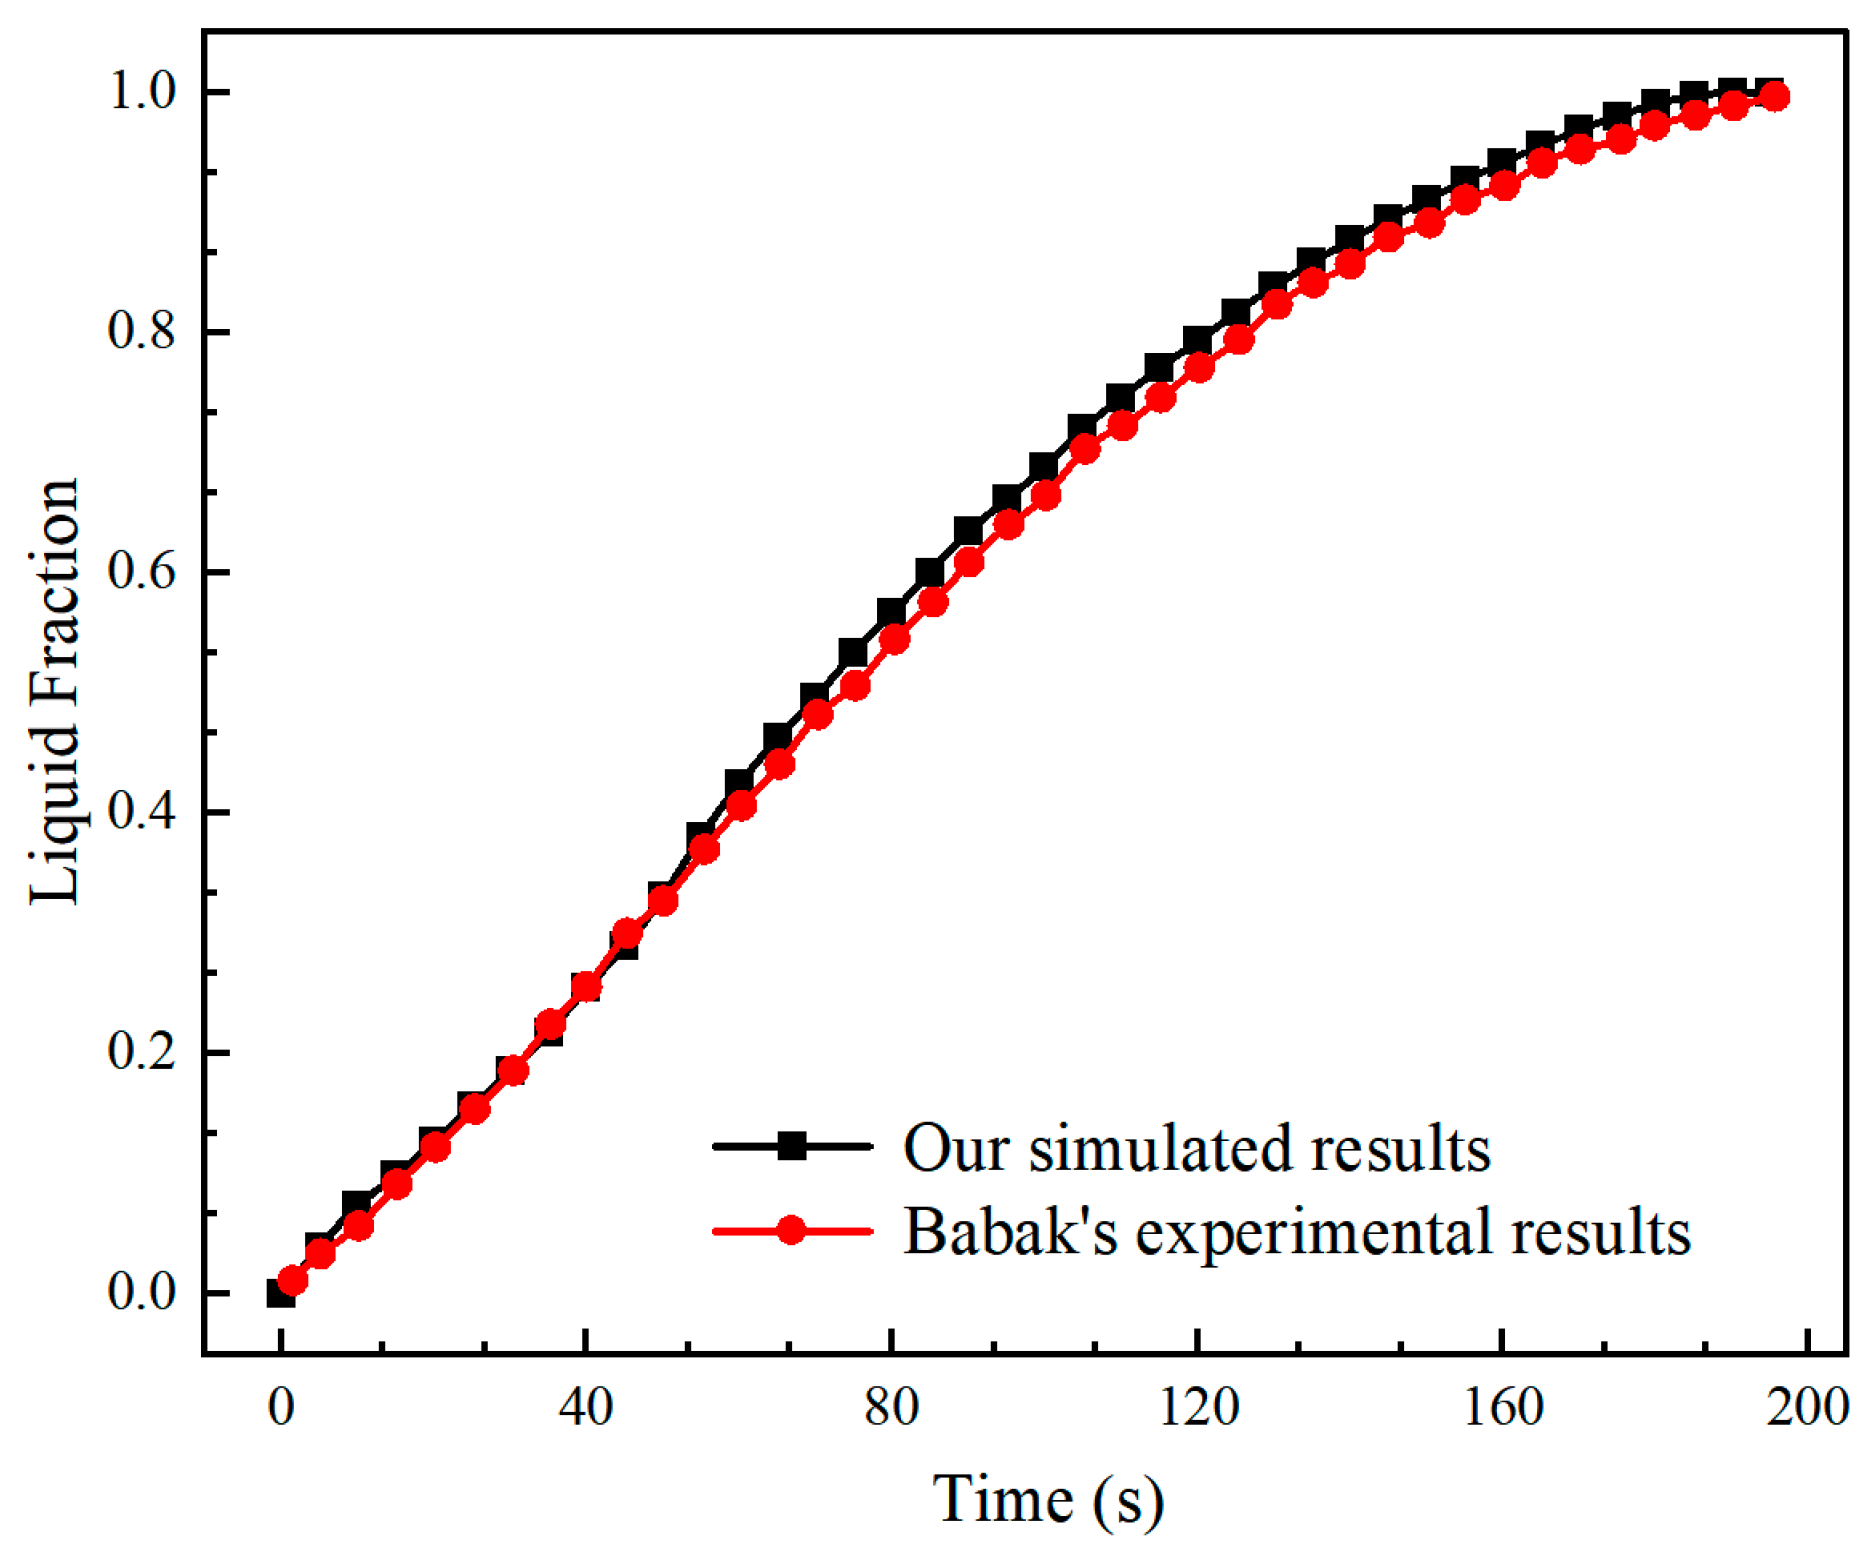
3.3.1. Numerical Method Verification

To verify the accuracy of the numerical simulation method employed in this study, we conducted numerical simulations of the PCM melting experiment performed by Babak et al. [34]. The numerically simulated PCM liquid fraction variation curve was compared with Babak’s experimental results, as shown in Figure 4. The two curves exhibited a good agreement, with a relative error of less than 2% for the liquid fraction. Next, the numerically simulated PCM phase interface evolution was compared with the experimental results, as illustrated in Figure 5. The transverse melting rate obtained from the numerical simulation was faster than the experimental rate, while the longitudinal melting rate was slower than the experimental rate. The main source of error was attributed to slight heat losses during the experimental process. However, the deviations between the numerical simulation and experimental results were relatively small. These findings demonstrate that the proposed numerical simulation method can accurately solve PCM melting-related problems.

3.3.2. Mesh Independence Analysis

In this study, we employed a GA-ITPS model with a lattice pore of 8 mm. Three simulation models were established with grid quantities of 4.2 × 10⁵, 1.2 × 10⁶, and 2.0 × 10⁶, respectively. The purpose was to validate the mesh independence by comparing the time-dependent liquid fraction curves obtained from these models. The results are presented in Figure 6, where the liquid fraction curves of the three grid quantities exhibit similar trends. However, upon closer examination in the zoomed-in section, a more pronounced change in the liquid fraction can be observed when the grid quantity increases from 418,286 to 1,192,057. Nevertheless, further increasing the grid quantity beyond 1,192,057 has minimal effect on the numerical simulation results. Therefore, we selected the model with a grid quantity of 1,192,057 for conducting the numerical simulations.

4. Results and Discussion

4.1. Heat Transfer Characteristics of ITPS

Heating experiments were conducted on ITPS specimens with and without paraffin using a heating platform. The ITPS specimens comprised both a G-A lattice and tetradecahedron lattice. The temperature response characteristics of GA-ITPS with and without paraffin are shown in Figure 7a. During the heat storage process, the maximum temperature decrease on the inner plate surface was 16 K, with an average decrease of 8.3 K, resulting in an overall temperature reduction of approximately 15.1%. The temperature response characteristics of 14-ITPS with and without paraffin are shown in Figure 7b. During the heat storage process, the maximum temperature decrease on the inner plate surface was 17.4 K, with an average decrease of 8.8 K, resulting in an overall temperature reduction of approximately 15.6%. The experimental results indicate that the addition of paraffin can effectively reduce the inner plate surface temperature of the ITPS specimens. Therefore, paraffin can be considered as a heat-absorbing layer material in ITPS.
The temperature rise process of the ITPS specimens containing paraffin can be divided into three stages. The first stage is the sensible heat storage stage before paraffin melts, during which heat energy is stored through the material’s sensible heat, leading to a rapid temperature increase. The second stage is the latent heat storage stage during paraffin melting, where a significant amount of heat is absorbed as paraffin undergoes a phase change, resulting in a gradual temperature increase. The third stage is the sensible heat storage stage after the complete melting of paraffin, during which heat energy is stored again through the sensible heat of paraffin, leading to an accelerated temperature increase that eventually approaches the heating temperature of the outer plate.
The temperature response characteristics of GA-ITPS and 14-ITPS with paraffin were compared, as shown in Figure 8. The inner plate surface temperature of GA-ITPS was consistently lower than that of 14-ITPS, with an average temperature difference of 3.1 K and a maximum difference of 6.7 K. Additionally, the latent heat storage stage of 14-ITPS with paraffin was shorter than that of GA-ITPS with the PCM. These results indicate that the lattice configuration has a significant impact on the temperature response of ITPS and the melting rate of the internal PCM.

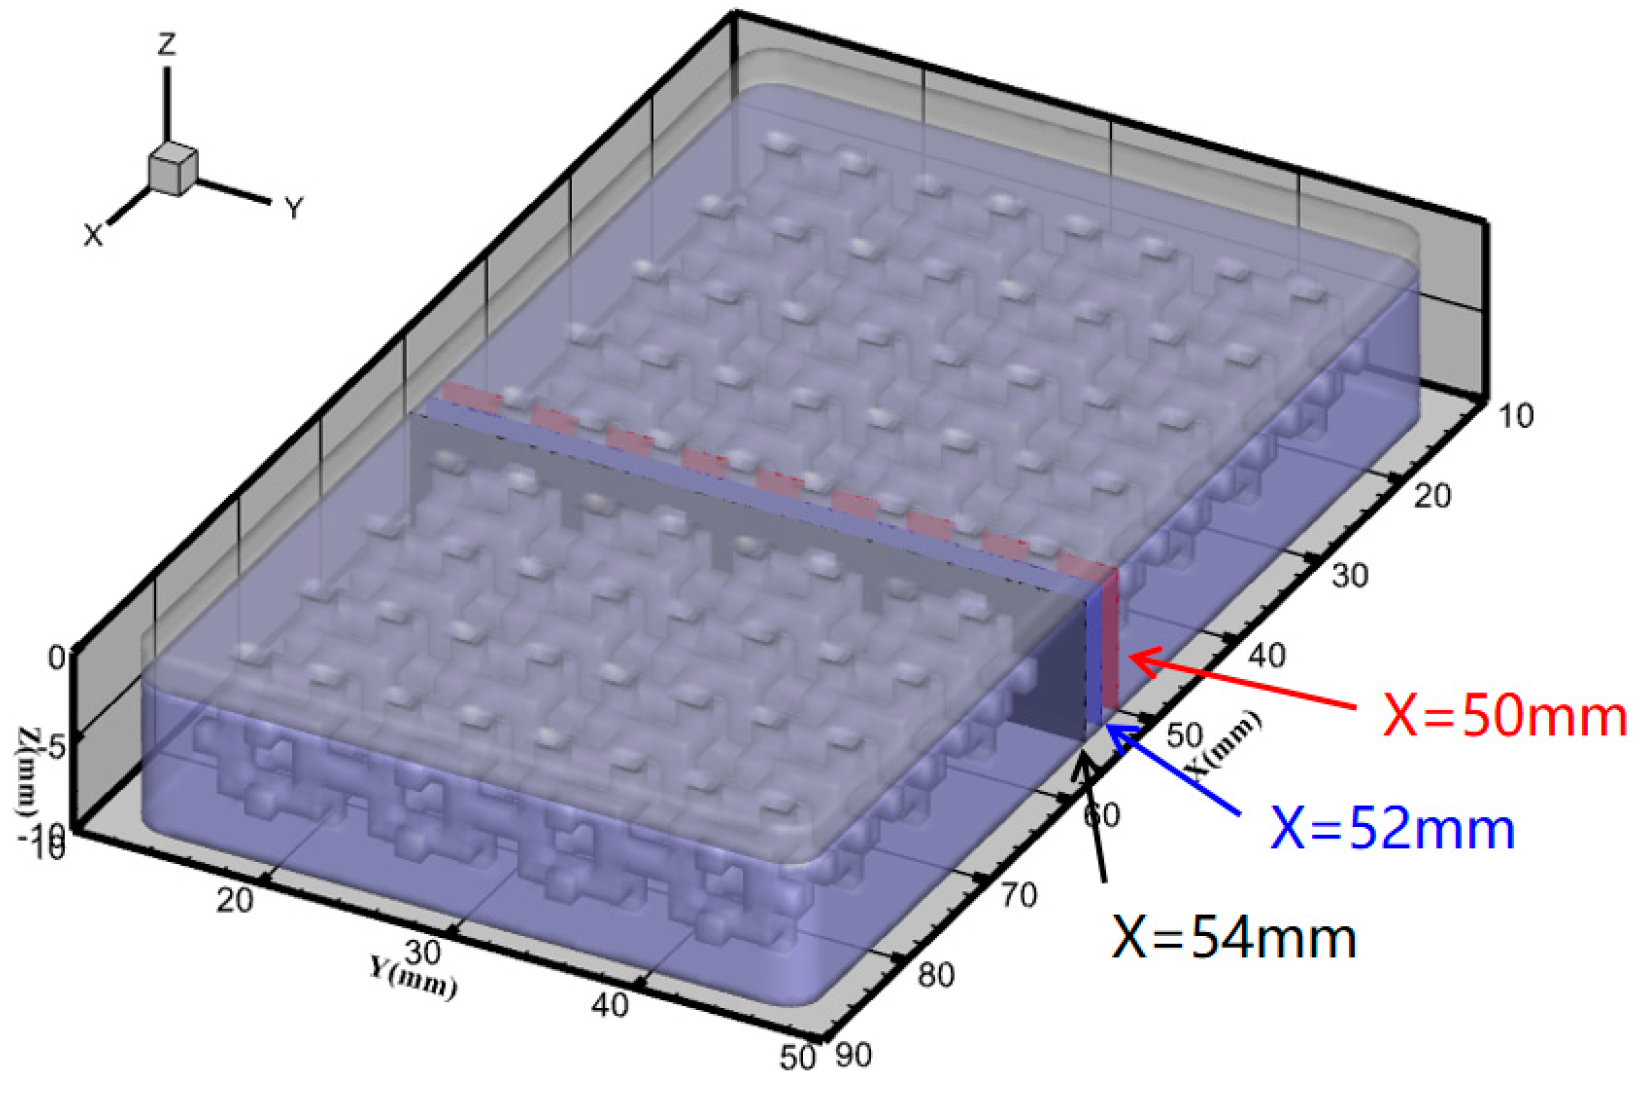
4.2. Evolution of Solid–Liquid Interface

To investigate the melting process and flow behavior of paraffin, a selected row of lattices in the middle of the ITPS configuration was chosen. Three interfaces at X = 50, 52, and 54 mm were extracted, representing the 1/2, 3/4, and 1 positions of the selected lattice, as shown in Figure 9.
The melting process of pure paraffin is depicted in Figure 10a, where the solid–liquid interface is approximately planar at t = 20 s. Due to uneven heating from the base, the left and right sides of the paraffin melt first after t = 20 s. At this stage, heat conduction from the metal base to paraffin dominates, resulting in a trapezoidal approximation of the solid–liquid interface. As the proportion of liquid paraffin increases within the chamber, natural convection starts to strengthen. Combining the velocity contour map of pure paraffin in Figure 11a, multiple upward and downward convection loops are observed at the bottom, with stronger flow closer to the metal base around the periphery. This natural convection path leads to a transition of the solid–liquid interface from trapezoidal to an irregular shape.
During the melting process of PCMs shown in Figure 10b,c, the solid–liquid interface spreads gradually from the porous lattice at the center towards the surrounding area until the paraffin is completely transformed into a liquid state. The reason behind this phenomenon is that the heat from the metal base is rapidly transferred to the porous lattice, which has a high thermal conductivity. Subsequently, the heat is conducted to the paraffin encapsulated near the porous lattice, leading to rapid melting of paraffin. Additionally, as evident from Figure 11b,c, in PCMs, natural convection only occurs within the pore channels of the porous lattice, and its intensity is significantly lower than that observed in pure paraffin. This indicates that natural convection is restrained by the porous lattice, thereby weakening its impact on the solid–liquid interface.

4.3. Effects of Structure

The effects of lattice structure on the melting rate of PCMs was investigated through numerical simulations. The liquid fraction variation of paraffin in different lattice structures is shown in Figure 12. Pure paraffin completely melts at t = 254 s. GA-PCMs reach complete melting at t = 144 s, reducing the melting time by 43.5% compared to pure paraffin. Similarly, 14-PCMs achieve complete melting at t = 119 s, shortening the melting time by 53.1% compared to pure paraffin. Despite the paraffin content in PCMs being only 25% lower than pure paraffin, the melting time differs by nearly twice as much. Therefore, incorporating a porous lattice in paraffin significantly reduces the required melting time.
The melting time of 14-PCMs is 17.36% shorter than that of GA-PCMs. From Figure 11b,c, it can be observed that the strength of natural convection inside 14-PCMs and GA-PCMs is similar. Therefore, the primary factor that affects the rate of paraffin melting is the thermal conductivity between porous lattice and paraffin. The thermal conductivity between porous lattice and paraffin depends on the contact area between porous lattice and paraffin. As shown in Table 2, since the specific surface area (A) of GA-PCMs and 14-PCMs is 2.61 mm−1 and 3.29 mm−1, respectively, the melting time of 14-PCMs is shorter than that of GA-PCMs.

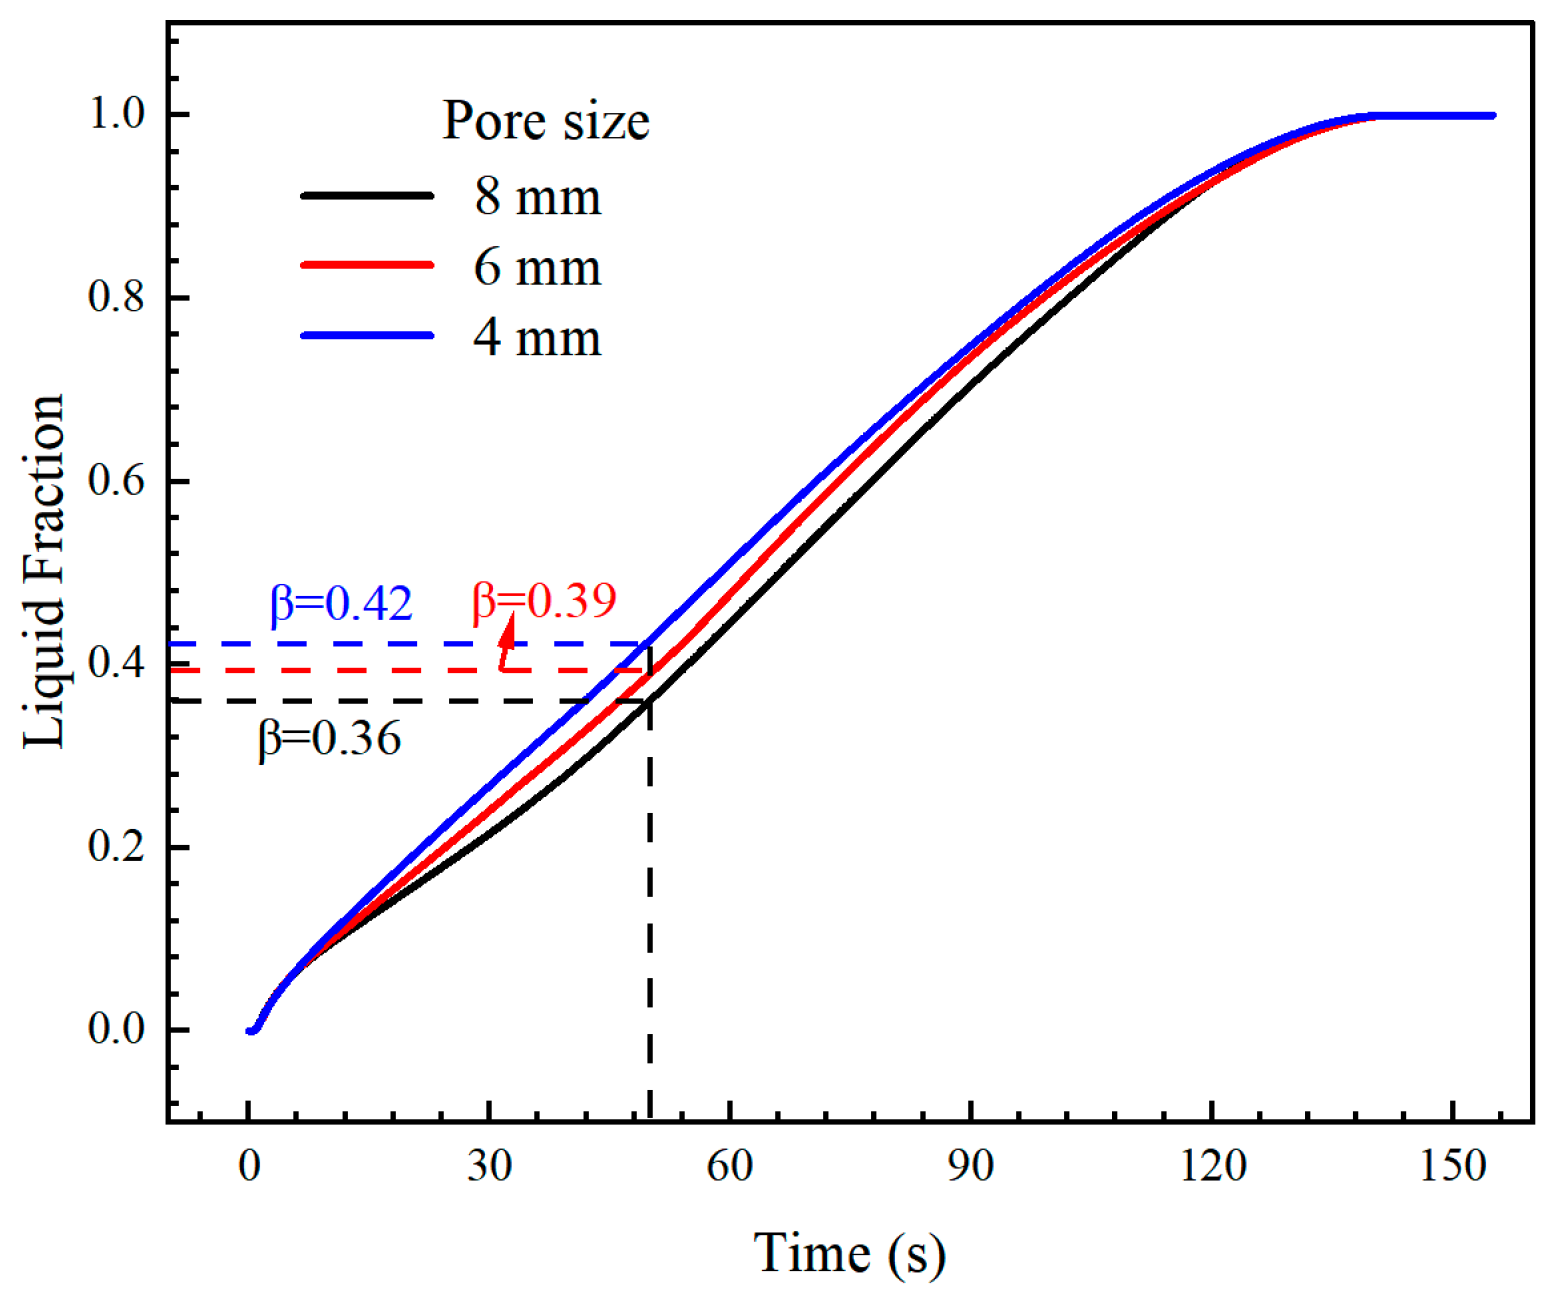
4.4. Effects of Pore Size

The effects of lattice pore size (dp) on the melting rate of PCMs was investigated through numerical simulations. The GA lattice was selected as the research object, and three different pore sizes of 8, 6, and 4 mm were designed for the GA lattice, with their geometric parameters shown in Table 2. The interfaces at 1/2, 3/4, and 1 positions of the single cell in the center row of the porous lattice were chosen as the display interfaces for demonstration.
The variation of liquid fraction with different pore sizes of GA-PCMs is depicted in Figure 13. During the early to mid-stage of melting, smaller pore sizes result in faster melting rates and higher liquid fractions. For instance, at t = 50 s, the PCMs with an 8 mm pore size had a liquid fraction of 0.36, while the PCMs with a 6 mm pore size had a liquid fraction of 0.39, and the PCMs with a 4 mm pore size had a liquid fraction of 0.42. This can be attributed to the scarcity of liquid paraffin during the early to mid-stage of melting, which weakens the natural convection effect within the PCMs, as illustrated in Figure 14a. Consequently, heat transfer primarily occurs through conduction, and thus, smaller pore sizes with a larger surface area exhibit stronger heat transfer capability. In the later stage of melting, as the proportion of liquid paraffin increases, natural convection becomes more prominent. As shown in Figure 14b, lattices with larger pore sizes exhibit stronger natural convection. Therefore, in the later stage of melting, PCMs with larger pore sizes melt at a faster rate.
The Rayleigh number (Ra) represents the ratio between buoyancy and viscous forces in a fluid and is primarily used to characterize the intensity of natural convection. A higher Ra indicates a more pronounced convective behavior and more vigorous fluid flow. It is mathematically defined as shown in Equation (8).
R a = g α Δ T l 3 μ κ
In Equation (8), g represents the acceleration due to gravity, m/s2; α represents the thermal expansion coefficient, K−1; l represents the characteristic length, mm; μ represents the kinematic viscosity, m2/s; and κ represents the thermal diffusivity, m2/s.
For porous lattices, the characteristic length is consistent with the pore size. Therefore, as the characteristic length of the porous lattice increases, the Ra also increases, indicating a more pronounced natural convection phenomenon. Additionally, Table 2 reveals that smaller pore sizes in the porous lattice correspond to larger surface areas, resulting in increased contact area with the liquid paraffin. This increased contact area leads to an increase in viscous resistance against the liquid paraffin within the porous lattice. Consequently, as the pore size decreases, the natural convection effect becomes weaker.

5. Conclusions

This paper based on experimental and numerical methods, investigated the influence of PCMs on the thermal insulation performance of ITPS, as well as the simulation and analysis of the PCM melting process and factors affecting its melting rate. The concluding remarks can be drawn as follows:
(1)
PCMs can effectively enhance the thermal insulation capability of ITPS. The addition of paraffin can decrease the average temperature of the inner plate of ITPS by approximately 15%.
(2)
Porous lattices can significantly improve the heat storage efficiency of PCMs. The incorporation of porous lattices can increase the melting rate of paraffin wax by around 50%.
(3)
The geometrical characteristics of the porous lattices have a significant effect on the melting rate of PCMs, and the heat storage efficiency of PCMs can be accurately adjusted by modifying these geometrical characteristics. Among different lattice structures, a larger specific surface area results in a faster melting rate of PCMs. Regarding different pore sizes, a smaller pore size leads to a faster melting rate when thermal conduction dominates heat transfer. However, a larger pore size results in a faster melting rate when natural convection dominates the heat transfer.

Author Contributions

Conceptualization, Z.H., W.T. and G.X.; methodology, Z.H.; software, Z.H.; validation, Z.H., H.Z. and C.Z.; formal analysis, Z.H.; investigation, Z.H.; resources, Z.H.; data curation, Z.H.; writing—original draft preparation, Z.H.; writing—review and editing, Z.H., H.Z. and C.Z.; visualization, Z.H.; supervision, W.T. and G.X.; project administration, G.X. and Y.D.; funding acquisition, Y.D. All authors have read and agreed to the published version of the manuscript.

Funding

This research was supported by the National Key Research and Development Program of China (No. 2019YFA0405202).

Data Availability Statement

The data that support the findings of this study are available from the first author upon reasonable request.

Conflicts of Interest

The authors declare no conflicts of interest.

Nomenclature

A Specific surface area (mm−1).
d p Pore size (mm).
c p Specific heat (J/(kg·K)).
F Source term used in the energy equation (W/m3).
g Acceleration due to gravity (m/s2).
H Specific enthalpy (kJ/kg).
Δ L Released latent heat (kJ/kg).
h Sensible enthalpy (J/(kg·K)).
h ref Reference sensible enthalpy (J/(kg·K)).
L Latent heat (kJ/kg).
l Characteristic length (mm).
p Pressure (Pa).
R a Rayleigh number.
S Source term used in the momentum equation (N/m3).
T Temperature (K).
T h Constant temperature (K).
T l Liquidus temperature (K).
T s Solidus temperature (K).
T ref Reference temperature (K).
Δ T Temperature difference (K).
t Time (s).
v Velocity (m/s).
α Thermal expansion coefficient (K−1).
β Liquid fraction.
ε Porosity.
κ Thermal diffusivity (m2/s).
λ Thermal conductivity (W/(m·K)).
μ Kinematic viscosity (m2/s).
ρ Density (kg/m3).

References

  1. Yuan, Y.P.; Xiang, B.; Cao, X.L.; Zhang, N.; Sun, L.L. Research status and development on latent energy storage technology of building. J. Southwest Jiaotong Univ. 2016, 51, 585–598. [Google Scholar]
  2. Jiang, Z.; Zou, B.Y.; Cong, L.; Xie, C.; Li, C.; Qiao, G.; Zhao, Y.; Nie, B.; Zhang, T.; Ge, Z.; et al. Research progress and outlook of thermal energy storage technologies. Energy Storage Sci. Technol. 2022, 11, 2746–2771. [Google Scholar]
  3. Li, Z.; Li, B.R.; Chen, H.Z.; Wen, B.; Du, X.Z. State of the art review on phase change thermal energy storage technology. Chem. Ind. Eng. Prog. 2020, 39, 5066–5085. [Google Scholar]
  4. Sun, W.C.; Feng, J.X.; Zhang, Z.G.; Fang, X.M. Research progress of phase change heat storage technology for passive energy conservation in buildings. Chem. Ind. Eng. Prog. 2020, 39, 1824–1834. [Google Scholar]
  5. Shang, B.; Hu, J.; Hu, R.; Cheng, J.; Luo, X. Modularized thermal storage unit of metal foam/paraffin composite. Int. J. Heat Mass Transf. 2018, 125, 596–603. [Google Scholar] [CrossRef]
  6. Verdier, D.; Falcoz, Q.; Ferriere, A. Design of a protection thermal energy storage using phase change material coupled to a solar receiver. High Temp. Mater. Process. 2014, 33, 509–523. [Google Scholar] [CrossRef]
  7. Cao, C.Y.; Wang, R.X.; Xing, X.D.; Song, H.W.; Huang, C.G. Design and experimental investigation of integrated thermal protection structure containing phase change material layer. J. Astronaut. 2019, 40, 352–361. [Google Scholar]
  8. Du, Y.X.; Xiao, G.M.; Gui, Y.W.; He, L.X.; Liu, L. Heat transfer characteristics inside phase change thermal control device. J. Chem. Ind. Eng. 2012, 63, 107–113. [Google Scholar]
  9. Zhao, C.Y.; Zhang, G.H. Review on microencapsulated phase change materials (MEPCMs): Fabrication, characterization and applications. Renew. Sustain. Energy Rev. 2011, 15, 3813–3832. [Google Scholar] [CrossRef]
  10. Zhang, N.; Yuan, Y. Synthesis and thermal properties of nanoencapsulation of paraffin as phase change material for latent heat thermal energy storage. Energy Built Environ. 2020, 1, 410–416. [Google Scholar] [CrossRef]
  11. Zhang, Y.; Ding, J.; Wang, X.; Yang, R.; Lin, K. Influence of additives on thermal conductivity of shape-stabilized phase change material. Sol. Energy Mater. Sol. Cells 2006, 90, 1692–1702. [Google Scholar] [CrossRef]
  12. Motahar, S.; Alemrajabi, A.A.; Khodabandeh, R. Experimental study on solidification process of a phase change material containing TiO2 nanoparticles for thermal energy storage. Energy Convers. Manag. 2017, 138, 162–170. [Google Scholar] [CrossRef]
  13. Agyenim, F.; Eames, P.; Smyth, M. A comparison of heat transfer enhancement in a medium temperature thermal energy storage heat exchanger using fins. Sol. Energy 2009, 83, 1509–1520. [Google Scholar] [CrossRef]
  14. Yang, X.; Lu, Z.; Bai, Q.; Zhang, Q.; Jin, L.; Yan, J. Thermal performance of a shell-and-tube latent heat thermal energy storage unit: Role of annular fins. Appl. Energy 2017, 202, 558–570. [Google Scholar] [CrossRef]
  15. Meng, Z.N.; Zhang, P. Experimental and numerical investigation of a tube-in-tank latent thermal energy storage unit using composite PCM. Appl. Energy 2017, 190, 524–539. [Google Scholar] [CrossRef]
  16. Zhu, F.; Zhang, C.; Gong, X. Numerical analysis and comparison of the thermal performance enhancement methods for metal foam/phase change material composite. Appl. Therm. Eng. 2016, 109, 373–383. [Google Scholar] [CrossRef]
  17. Xiao, G.M.; Du, Y.X.; Liu, L.; Wei, D.; Yang, X.F.; Gui, Y.W. Numerical simulation and experimental study on the thermal characteristics of composite phase change materials for heat storage. J. Exp. Fluid Mech. 2018, 32, 6. [Google Scholar]
  18. Zhang, N.; Liu, H.; Xia, Q.; Zhang, Z.; Tong, Z.; Du, Y.; Yuan, Y. Experimental investigation of the effect of copper foam pore structure on the thermal performance of phase change material in different centrifugal force fields. Int. J. Heat Mass Transf. 2023, 206, 123945. [Google Scholar] [CrossRef]
  19. Chen, H.; Liu, X.L.; Yang, Y.X.; Zhong, L.Q.; Wang, L.; Gao, N. Numerical simulation of foam metal copper/paraffin phase change thermal storage process. CIESC J. 2019, 70, 86–92. [Google Scholar]
  20. Chintakrinda, K.; Weinstein, R.D.; Fleischer, A.S. A direct comparison of three different material enhancement methods on the transient thermal response of paraffin phase change material exposed to high heat fluxes. Int. J. Therm. Sci. 2011, 50, 1639–1647. [Google Scholar] [CrossRef]
  21. Yang, X.; Yu, J.; Guo, Z.; Jin, L.; He, Y.-L. Role of porous metal foam on the heat transfer enhancement for a thermal energy storage tube. Appl. Energy 2019, 239, 142–156. [Google Scholar] [CrossRef]
  22. Xiao, X.; Zhang, P.; Li, M. Preparation and thermal characterization of paraffin/metal foam composite phase change material. Appl. Energy 2013, 112, 1357–1366. [Google Scholar] [CrossRef]
  23. Lafdi, K.; Mesalhy, O.; Shaikh, S. Experimental study on the influence of foam porosity and pore size on the melting of phase change materials. J. Appl. Phys. 2007, 102, 759. [Google Scholar] [CrossRef]
  24. Al-Ketan, O.; Rowshan, R.; Abu Al-Rub, R.K. Topology-mechanical property relationship of 3D printed strut, skeletal, and sheet based periodic metallic cellular materials. Addit. Manuf. 2018, 19, 167–183. [Google Scholar] [CrossRef]
  25. Hu, X.; Gong, X. Pore-scale numerical simulation of the thermal performance for phase change material embedded in metal foam with cubic periodic cell structure. Appl. Therm. Eng. 2019, 151, 231–239. [Google Scholar] [CrossRef]
  26. Zhang, T.; Liu, F.; Deng, X.; Zhao, M.; Zhou, H.; Zhang, D.Z. Experimental study on the thermal storage performance of phase change materials embedded with additively manufactured triply periodic minimal surface architected lattices. Int. J. Heat Mass Transf. 2022, 199, 123452. [Google Scholar] [CrossRef]
  27. Qureshi, Z.A.; Omari, S.A.; Elnajjar, E.; Mahmoud, F.; Al-Ketan, O.; Abu Al-Rub, R. Thermal characterization of 3D-Printed lattices based on triply periodic minimal surfaces embedded with organic phase change material. Case Stud. Therm. Eng. 2021, 27, 101315. [Google Scholar] [CrossRef]
  28. Sundarram, S.S.; Li, W. The effect of pore size and porosity on thermal management performance of phase change material infiltrated microcellular metal foams. Appl. Therm. Eng. 2014, 64, 147–154. [Google Scholar] [CrossRef]
  29. Yang, Z.; Liu, F.; Zhang, T.; Deng, X.; Zhang, Z.W. Numerical simulation and experiment of heat storage process of TPMS porous aluminum-paraffin composite phase change material. Chem. Ind. Eng. Prog. 2022, 41, 4918–4927. [Google Scholar]
  30. Caket, A.G.; Wang, C.; Nugroho, M.A.; Celik, H.; Mobedi, M. Recent studies on 3D lattice metal frame technique for enhancement of heat transfer: Discovering trends and reasons. Renew. Sustain. Energy Rev. 2022, 167, 112697. [Google Scholar] [CrossRef]
  31. Molteni, M.; Candidori, S.; Graziosi, S.; Gariboldi, E. Improving the thermal response flexibility of 2- and 3-phase composite phase change materials by metallic triply periodic minimal surface structures. J. Energy Storage 2023, 72, 108185. [Google Scholar] [CrossRef]
  32. Cai, W.; Yang, W.; Zhang, K.; Fan, J.H.; Wu, J.Y.; Xing, T.; He, R. Experimental and numerical simulation of the melting process of paraffin phase change material. J. Southwest Univ. Sci. Technol. 2018, 33, 6–9+81. [Google Scholar]
  33. Qureshi, Z.A.; Elnajjar, E.; Al-Ketan, O.; Al-Rub, R.A.; Al-Omari, S.B. Heat transfer performance of a finned metal foam-phase change material (FMF-PCM) system incorporating triply periodic minimal surfaces (TPMS)—ScienceDirect. Int. J. Heat Mass Transf. 2021, 170, 121001. [Google Scholar] [CrossRef]
  34. Voller, V.R.; Prakash, C. A fixed grid numerical modelling methodology for convection-diffusion mushy region phase-change problems. Int. J. Heat Mass Transf. 1987, 30, 1709–1719. [Google Scholar] [CrossRef]
  35. Kamkari, B.; Shokouhmand, H.; Bruno, F. Experimental investigation of the effect of inclination angle on convection-driven melting of phase change material in a rectangular enclosure—ScienceDirect. Int. J. Heat Mass Transf. 2014, 72, 186–200. [Google Scholar] [CrossRef]
Figure 1. Experimental model. (a) Photos of ITPS; (b) ITPS schematic.
Energies 17 00465 g001
Figure 2. Simulation model and boundary conditions. (a) Photos of ITPS; (b) ITPS schematic.
Energies 17 00465 g002
Figure 3. Phase change thermal storage experimental platform.
Energies 17 00465 g003
Figure 4. Comparison of liquid fractions: Babak’s experimental results [35] and our simulated results.
Energies 17 00465 g004
Figure 5. Comparison of solid–liquid phase distribution: Babak’s experimental results [35] (left) and our simulated results (right). (a) t = 10 min; (b) t = 20 min; (c) t = 40 min; (d) t = 60 min.
Energies 17 00465 g005
Figure 6. Mesh independence analysis.
Energies 17 00465 g006
Figure 7. Temperature response of ITPS. (a) GA-ITPS; (b) 14-ITPS.
Energies 17 00465 g007
Figure 8. Comparison of temperature response between GA-ITPS with PCM and 14-ITPS with PCM.
Energies 17 00465 g008
Figure 9. Position as displayed in the contour map.
Energies 17 00465 g009
Figure 10. Evolution of solid–liquid interface during melting of paraffin. (a) Pure PCM; (b) GA-PCMs; (c) 14-PCMs.
Energies 17 00465 g010
Figure 11. Flow velocity of paraffin at β = 0.6. (a) Pure PCM; (b) GA-PCMs; (c) 14-PCMs.
Energies 17 00465 g011
Figure 12. Liquid fraction variation in PCMs with different pore structure.
Energies 17 00465 g012
Figure 13. Liquid fraction variation in PCMs with different pore sizes.
Energies 17 00465 g013
Figure 14. Velocity distribution of GA-PCMs with different pore. (a) t = 30 s; (b) t = 100 s.
Energies 17 00465 g014
Table 1. Thermophysical properties of the materials.
Materialρ (kg/m3)cp (J/(kg·K))λ (W/(m·K))L (kJ/kg)Ts (K)μ (kg/(m·s))α (K−1)
Paraffin82422000.2977213.05324.450.006890.00583
Steel (S-06)8030502.4816.27----
Alumina ceramic350088027.5----
Table 2. Geometric parameters of a porous lattice.
Lattice Structure d p (mm) ε A (mm−1)l (mm)
Tetradecahedron80.753.298
Gibson–Ashby80.752.618
Gibson–Ashby60.753.486
Gibson–Ashby40.755.124
Disclaimer/Publisher’s Note: The statements, opinions and data contained in all publications are solely those of the individual author(s) and contributor(s) and not of MDPI and/or the editor(s). MDPI and/or the editor(s) disclaim responsibility for any injury to people or property resulting from any ideas, methods, instructions or products referred to in the content.

