Article

Three-Dimensional Spatial Microscopic Characteristics and Developmental Influencing Factors of Tight Gas Layers in Hangjinqi Prospect Area, Ordos Basin, China

1
School of Geosciences, Yangtze University, Wuhan 430100, China
2
Hubei Cooperative Innovation Center for Unconventional Oil and Gas, Yangtze University, Wuhan 430100, China
*
Author to whom correspondence should be addressed.
Energies 2024, 17(2), 399; https://doi.org/10.3390/en17020399
Submission received: 4 December 2023 / Revised: 29 December 2023 / Accepted: 4 January 2024 / Published: 13 January 2024
(This article belongs to the Special Issue Challenges and Research Trends of Unconventional Oil and Gas II)

Abstract

:
The unconventional tight oil and gas resources in the Xinzhao East belt of the Hangjinqi Prospect area in the Ordos Basin of China are abundant. However, the reservoir’s internal storage space is complex, and the microscopic pore throat structural features are not well recognized, which has led to some trouble in the deployment of oil and gas exploration. To reveal the microscopic characteristics of the dense sandstone gas layer in the first member of the Lower Stone Box Formation of the D-well Zone in the Xinzhao East belt of the Hangjinqi Prospect area, a three-dimensional space digital core was built, and the stored set spatial data were extracted, based on rock sheet and coring data and X-CT scanning technology. Quartz grain size was segmented and analyzed based on an adaptive approach. The microscopic characteristics of the gas layer in the studied section and the factors influencing its development were studied, combining the use of a field emission scanning electron microscope, helium porosimeter, and gas permeability meter. We found that in the studied section, the porosity is relatively high, the pore throat size is large, and the pore permeability correlation is good. The reservoir space, which consists of intergranular pores, intragranular pores, and microcracks at the grain edges in the study area, is characterized by a complex distribution pattern. Within the gas layer, isolated pores are connected by microcracks to form a network of reservoir spaces, which increases the pore throat size, enhances the connectivity of the pore throat, and makes the microscopic characteristics of the reservoir space better. The first member of the Lower Stone Box Formation could be an advantageous reservoir. Hole–throat connectivity is poor because of the gas layer having underdeveloped primary pores, the blockage of pores by unstable minerals (kaolinite, etc.), and poorly connected pore throats based on insoluble mud cementation. The high content of quartz brittle minerals and the development of natural microcracks within the gas formation are favorable conditions for fracking development. The quartz grain size within the gas layer is positively correlated with the pore throat size, which suggests that the quartz grain size somewhat influences the microscopic characteristics of the reservoir space. This comprehensive study shows that the methodology of the study is more advantageous than traditional methods in the fine and three-dimensional spatial characterization of the microstructure of dense sandstone reservoirs. The research results of this paper have certain guiding significance for further reservoir evaluation and advantageous reservoir prediction in the Hangjinqi Prospect area in the Ordos Basin. We also provide the basis for the subsequent efficient development of the gas reservoir.

1. Introduction

In recent years, significant progress has been made in the exploration and development of unconventional oil and gas reservoirs around the world. Unconventional gas, including shale and tight gas, accounts for more than 47% of global natural gas reserves [1,2]. Unconventional reservoirs are becoming an increasingly important source of natural gas. Unconventional hydrocarbon reservoirs are mainly located in the Paleozoic strata, including the Lower Ordovician, Silurian, Devonian, and Permian [3,4]. Tight sandstone gas reservoirs are one of the unconventional reservoir types, which are widely distributed around the world [5,6]. The Ordos Basin, China, is subject to the composite superposition of three generations of Mesozoic and late and early Paleozoic large-scale craton, forming the present “Middle (Biocene) oil and ancient” “basin full of gas, half of oil” oil and gas distribution patterns [7]. The Ordos Basin in China is one of the major enrichment areas for tight sandstone gas reservoirs, with tight gas production reaching 256 × 108 m3 in 2019 [8]. The first member of the Lower Stone Box Formation is the main reservoir of tight gas in the Ordos Basin. In recent years, the natural gas exploration results obtained in the first member of the Lower Stone Box Formation of the Hangjinqi Prospect area in the northern Ordos Basin have been remarkable [9]. In 2021, four appraisal wells were deployed in the Xinzhao belt, and 13 billion cubic meters of proven natural gas reserves were discovered, which proved that the Xinzhao belt has huge exploration potential. The formation of large gas reservoirs in this zone is closely related to the extensive and continuous distribution of sandstone reservoirs. So, it has become particularly important to investigate the microstructural characteristics and influencing factors of the dense sandstone gas layer in the studied section. A lot of research has been carried out on reservoir characterization in the studied section by previous researchers. They found that the studied section is predominantly clastic sandstone in a braided river setting [10], and it is a typical low-permeability sandstone or dense sandstone reservoir [11]. However, there are relatively few studies on the microscopic characterization of the gas layer in the studied section. Hao Ting proved the longitudinal stacking relationship, pore penetration characteristics, and influence of the sedimentary phase and diagenesis on the non-homogeneity of the reservoir in the studied section [12], and Xun Xiaoquan studied the reservoir characteristics and influencing factors in the studied section by using particle size analysis, thin-section identification, and mercury compression experiments [13]. In existing studies, reservoir characteristics are mostly characterized by traditional 2D image techniques. However, the study of the three-dimensional spatial microscopic features of dense sandstones and the factors affecting them has been neglected. The three-dimensional spatial microscopic characterization of dense sandstone reservoirs is not well understood. Tight sandstone reservoirs are characterized by a small pore throat size, a complex pore structure, and strong non-homogeneity [14], and the study of their microscopic characteristics, especially the quantitative characterization of microscopic pore throats, is of great significance to the evaluation of reservoir quality and capacity. Current techniques for characterizing pore microstructure include cast thin sections, scanning electron microscopy, constant-velocity mercury pressing, high-pressure mercury pressing, nitrogen adsorption, and X-CT scanning. The cast sheet method can effectively identify the type of reservoir space in tight sandstone gas formations and calculate the face porosity, but it cannot reflect the three-dimensional pore space characteristics of the samples [15]. A scanning electron microscope can observe the characteristics of pore distribution on the surface of rock samples, and analyze the mineral morphology and the content of various elements [16], but what is reflected is only two-dimensional spatial characteristics [17,18]. Constant-velocity mercury pressure can be used to obtain pore and throat size parameters, based on the pressure drop during the mercury feed process, but the field of view of the pore and throat that can be recognized is small, because of the limitation of the pressure of the mercury [19]. High-pressure mercury pressing can quantitatively determine the spatial size and distribution of pore throats in dense sandstones, but the pore structure of rock samples may be damaged due to high pressure [20]. X-CT digital coring is an unconventional testing technique for characterizing rock structures with X-rays, and can be used to characterize the three-dimensional spatial structure of pores and to quantitatively study the microscopic characteristics of reservoir pore throats [21,22]. In the 1990s, Dunsmuri et al. used CT technology in petroleum engineering to improve the resolution of pore identification [23]. In 2004, Conenen et al. constructed micrometer-scale digital cores, which promoted the application of this technology in the petroleum industry [24]. In recent years, the technique has gradually matured in all-round non-destructive scanning imaging and characterize the three-dimensional spatial structure of the pore–throat [25,26,27]. Compared with cast thin sections and the high-pressure mercuric pressure method, X-CT scanning has the advantages of non-destructive, high efficiency, and fine calculation of reservoir microstructural parameters [28], which can be combined with rock thin sections and scanning electron microscopy to accurately characterize the microscopic features of the gas layer in dense sandstone.
To investigate the microscopic characteristics and factors influencing the development of the tight sandstone gas layer in the southwestern part of the Hangjinqi Prospect area in the Ordos Basin, in this paper, basic features such as petrological characteristics of the first member of the Lower Stone Box Formation in the D-well Zone of the Xinzhao East Zone of the Hangjinqi Prospect area were studied, based on rock sheets, field emission scanning electron microscopy, helium porosimetry, a gas permeability meter, and coring data. X-CT scanning technology was used to establish a three-dimensional spatial digital core and extract the reservoir space data. The quartz grain size was segmented and analyzed based on an adaptive approach. The above methods were used to characterize the microscopic features of the tight gas layer in the study area. We also analyzed the effect of lithological features and grain size on the microscopic characteristics of the reservoir space. This paper provides the scientific basis for further oil and gas exploration and development and advantageous reservoir prediction.

2. Regional Geological Profile

The Ordos Basin is the second largest basin on land in China. Geographically, it spans the five provinces of Shaanxi, Gansu, Ningxia, Mongolia, and Jin (Figure 1a,b). Tectonically, it is located in the southwestern part of the North China Plate. The basin is characterized by the development of several hydrocarbon-bearing formations, such as the Upper Paleozoic Benxi Formation, Taiyuan Formation, Shanxi Formation, Shangshibang Formation, and the Mesozoic Yan’an Formation and Yanchang Formation [29]. Several oil and gas fields have been discovered in and around the Ordos Basin, such as Surig, Shenmu, Dainiu Di, Dongsheng, Changqing, Ji Plateau, etc. The Hangjinqi Prospect area is located in the northern part of Ordos Basin, spanning three tectonic units: Ishaan Slope, Tianhuan Depression, and the Northern Uplift of the IU. The Xinzhao East belt D-well Zone is located in the southwestern part of the Hangjinqi Prospect area. It is located in the northern part of the Ishaan slope, south of the three-eyed well fault fracture (Figure 1a). In the studied section, the combination of birth, storage, and cover is lower birth and upper storage. The Lower Stone Box Formation is the reservoir. Hydrocarbon source rocks are developed in the lower Shanxi Formation and Taiyuan Formation [9] (Figure 1b,c). The study area has many favorable features for reservoir formation, such as extensive overlying hydrocarbon production in coal hydrocarbon source rocks, multi-layer stacked continuous development of sand bodies, and wide distribution of regional cover [30]. The first member of the Lower Stone Box Formation is the destination layer, with a burial depth of about 3000 m. During the Late Permian, the studied section was in a period of unification of tectonic patterns and depositional environments in the northern Ordos Basin [31]. The sedimentary phase of the studied section is controlled by the quartz-rich source zone of the Middle Proterozoic in the northwestern Yinshan Paleoland. The first member of the Lower Stone Box Formation is in a braided river depositional environment. This environment develops sedimentary microfacies such as heart beaches and channel fills in the depositional environment. The lithology in the studied section is greyish-white and gravelly, with coarse-grained quartz sandstone and conglomerate.

3. X-CT Test Methods and Procedures

3.1. X-CT Scanning Test Principle

A cone beam of X-rays was emitted from the source to penetrate the sample and project onto the detector. We simultaneously rotated the source, detector, and sample through 360°. Thousands of angular images were acquired and reconstructed using a low-speed circular trajectory scanning mode. We obtained a three-dimensional model of the sample via the above method to realize the function of the CT microscope. CT images reflect information about the degree of energy attenuation of X-rays as they penetrate an object. The imaging principle is that the grey value of the image is proportional to the density of the internal structure of the sample [32]. The higher the sample density, the higher the X-ray attenuation and the larger the gray value. The CT test instruments used in this paper were a nanoVoxel-4000 micro-nano CT scanner and a Geoscan-1000 full-diameter CT scanner produced by Tianjin Sanying Precision Instrument Company.

3.2. Sample Selection and Testing Procedure

Using the Geoscan-1000 Full Diameter CT Scanner, under 10 μm resolution conditions, five samples of 10 mm in diameter and length were scanned for full-diameter CT test porosity studies. Using the nanoVoxel-4000 micro- and nano-CT scanner, under 0.5 μm resolution conditions, two samples of 2 mm in diameter and length were scanned for microcrack characterization; under 8.2 μm resolution conditions, moderate-precision scans were performed on six samples of 25 mm in both diameter and length for quartz particle characterization; under 0.5 μm resolution conditions, six samples of quartz particles were cut out to a diameter and length of 4 mm for fine scanning for pore microscopic characterization. The best scans were reconstructed separately to obtain the images and data needed for the study in question.

3.3. Reservoir Spatial Identification and Pore Throat Ball and Stick Modeling

3.3.1. Reservoir Space Identification and Image Acquisition

The experimental samples were scanned using a CT scanner to obtain a three-dimensional data body of the core (see Section 3.1 for the scanning principle). Based on CT image imaging principles and threshold segmentation, the CT image thresholds were rationally defined. In turn, rock particles and reservoir spaces can be identified. To obtain 2D and 3D images, the storage space was segmented and extracted in 3D image processing software, version 2022.

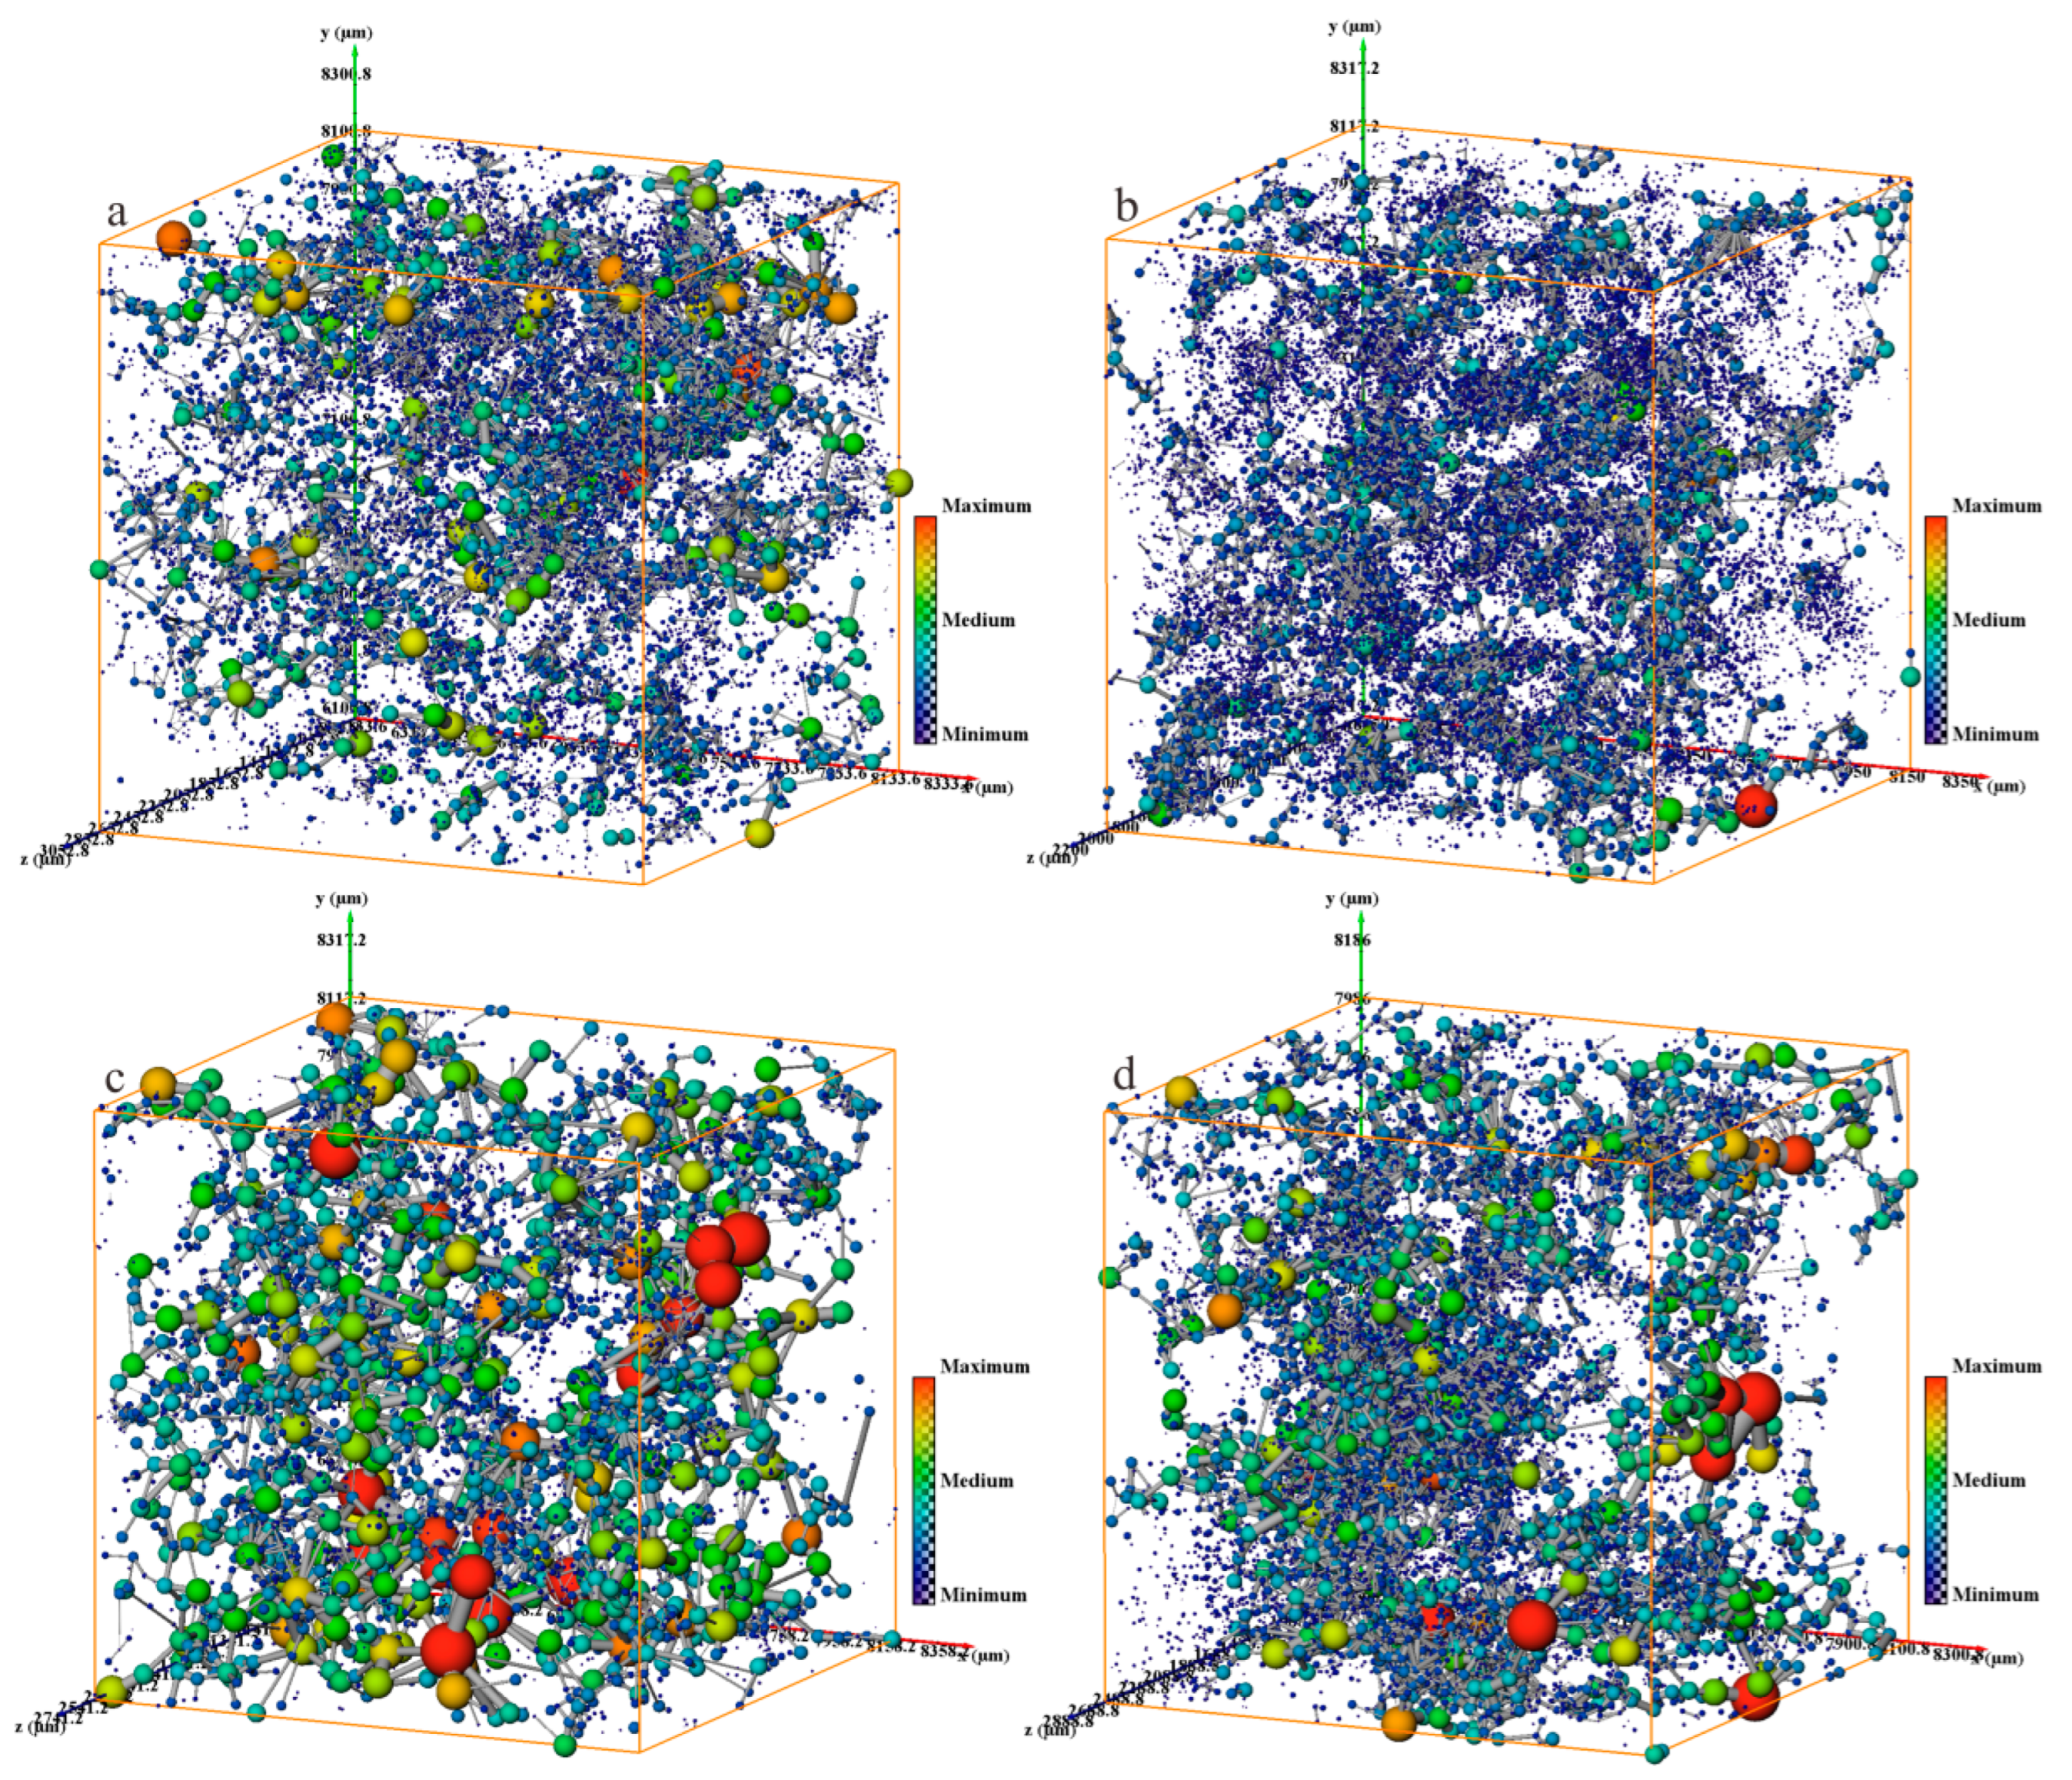
3.3.2. Modeling of Pore–Throat Ball and Stick

Based on the experimental sample pore 3D scanning data body, the “Maximum Ball Algorithm” was used to extract the pore and throat [33]. Based on this, the hole–throat ball-and-stick model was developed. The maxball algorithm has the following elements: using a set of pore voxels as the center of the sphere, using skeletal (matrix) voxels as boundaries, all pore voxels in the interior of the maximal sphere are taken to be all voxels inside the boundary. The largest ball constructed is the pore. Structuring the constructed maximal sphere clusters, depending on the size and relative position of the largest ball, orifices and throats are created. The passage between the balls is known as the throat.

3.4. Quartz Grain Segmentation and Pore Throat Parameter Analysis

3.4.1. Segmentation of Quartz Particles

In order to reduce the image noise, the 3D scanned data volume of the core samples was subjected to two Gaussian filtering processes. The mineral components in the CT scan samples were identified and calibrated, which was based on the segmentation principle of the watershed algorithm in 3D image processing software [34], as well as field emission scanning electron microscope images, petrographic thin sections, and other data. Using an adaptive method, the quartz particle size was segmented to obtain a three-dimensional image of the particle segmentation. Based on the 3D image software, the particle diameter size was calculated and counted.

3.4.2. Analysis of Pore Throat Parameters

Based on six lithologic samples of 3D scanning data body and 3D image software, pore and throat parameters (pore radius, throat radius, pore shape factor, throat shape factor, etc.) were computed, and the pore and throat parameter probability distribution plots were exported. Based on the logic algorithm tool, porosity and microfracture rates were calculated. The logical formula is: Porosity = V (pore volume) ÷ V (core volume); microfracture rate = V (microfracture volume) ÷ V (core volume)

4. Results

4.1. Basic Characteristics of Tight Gas Layer

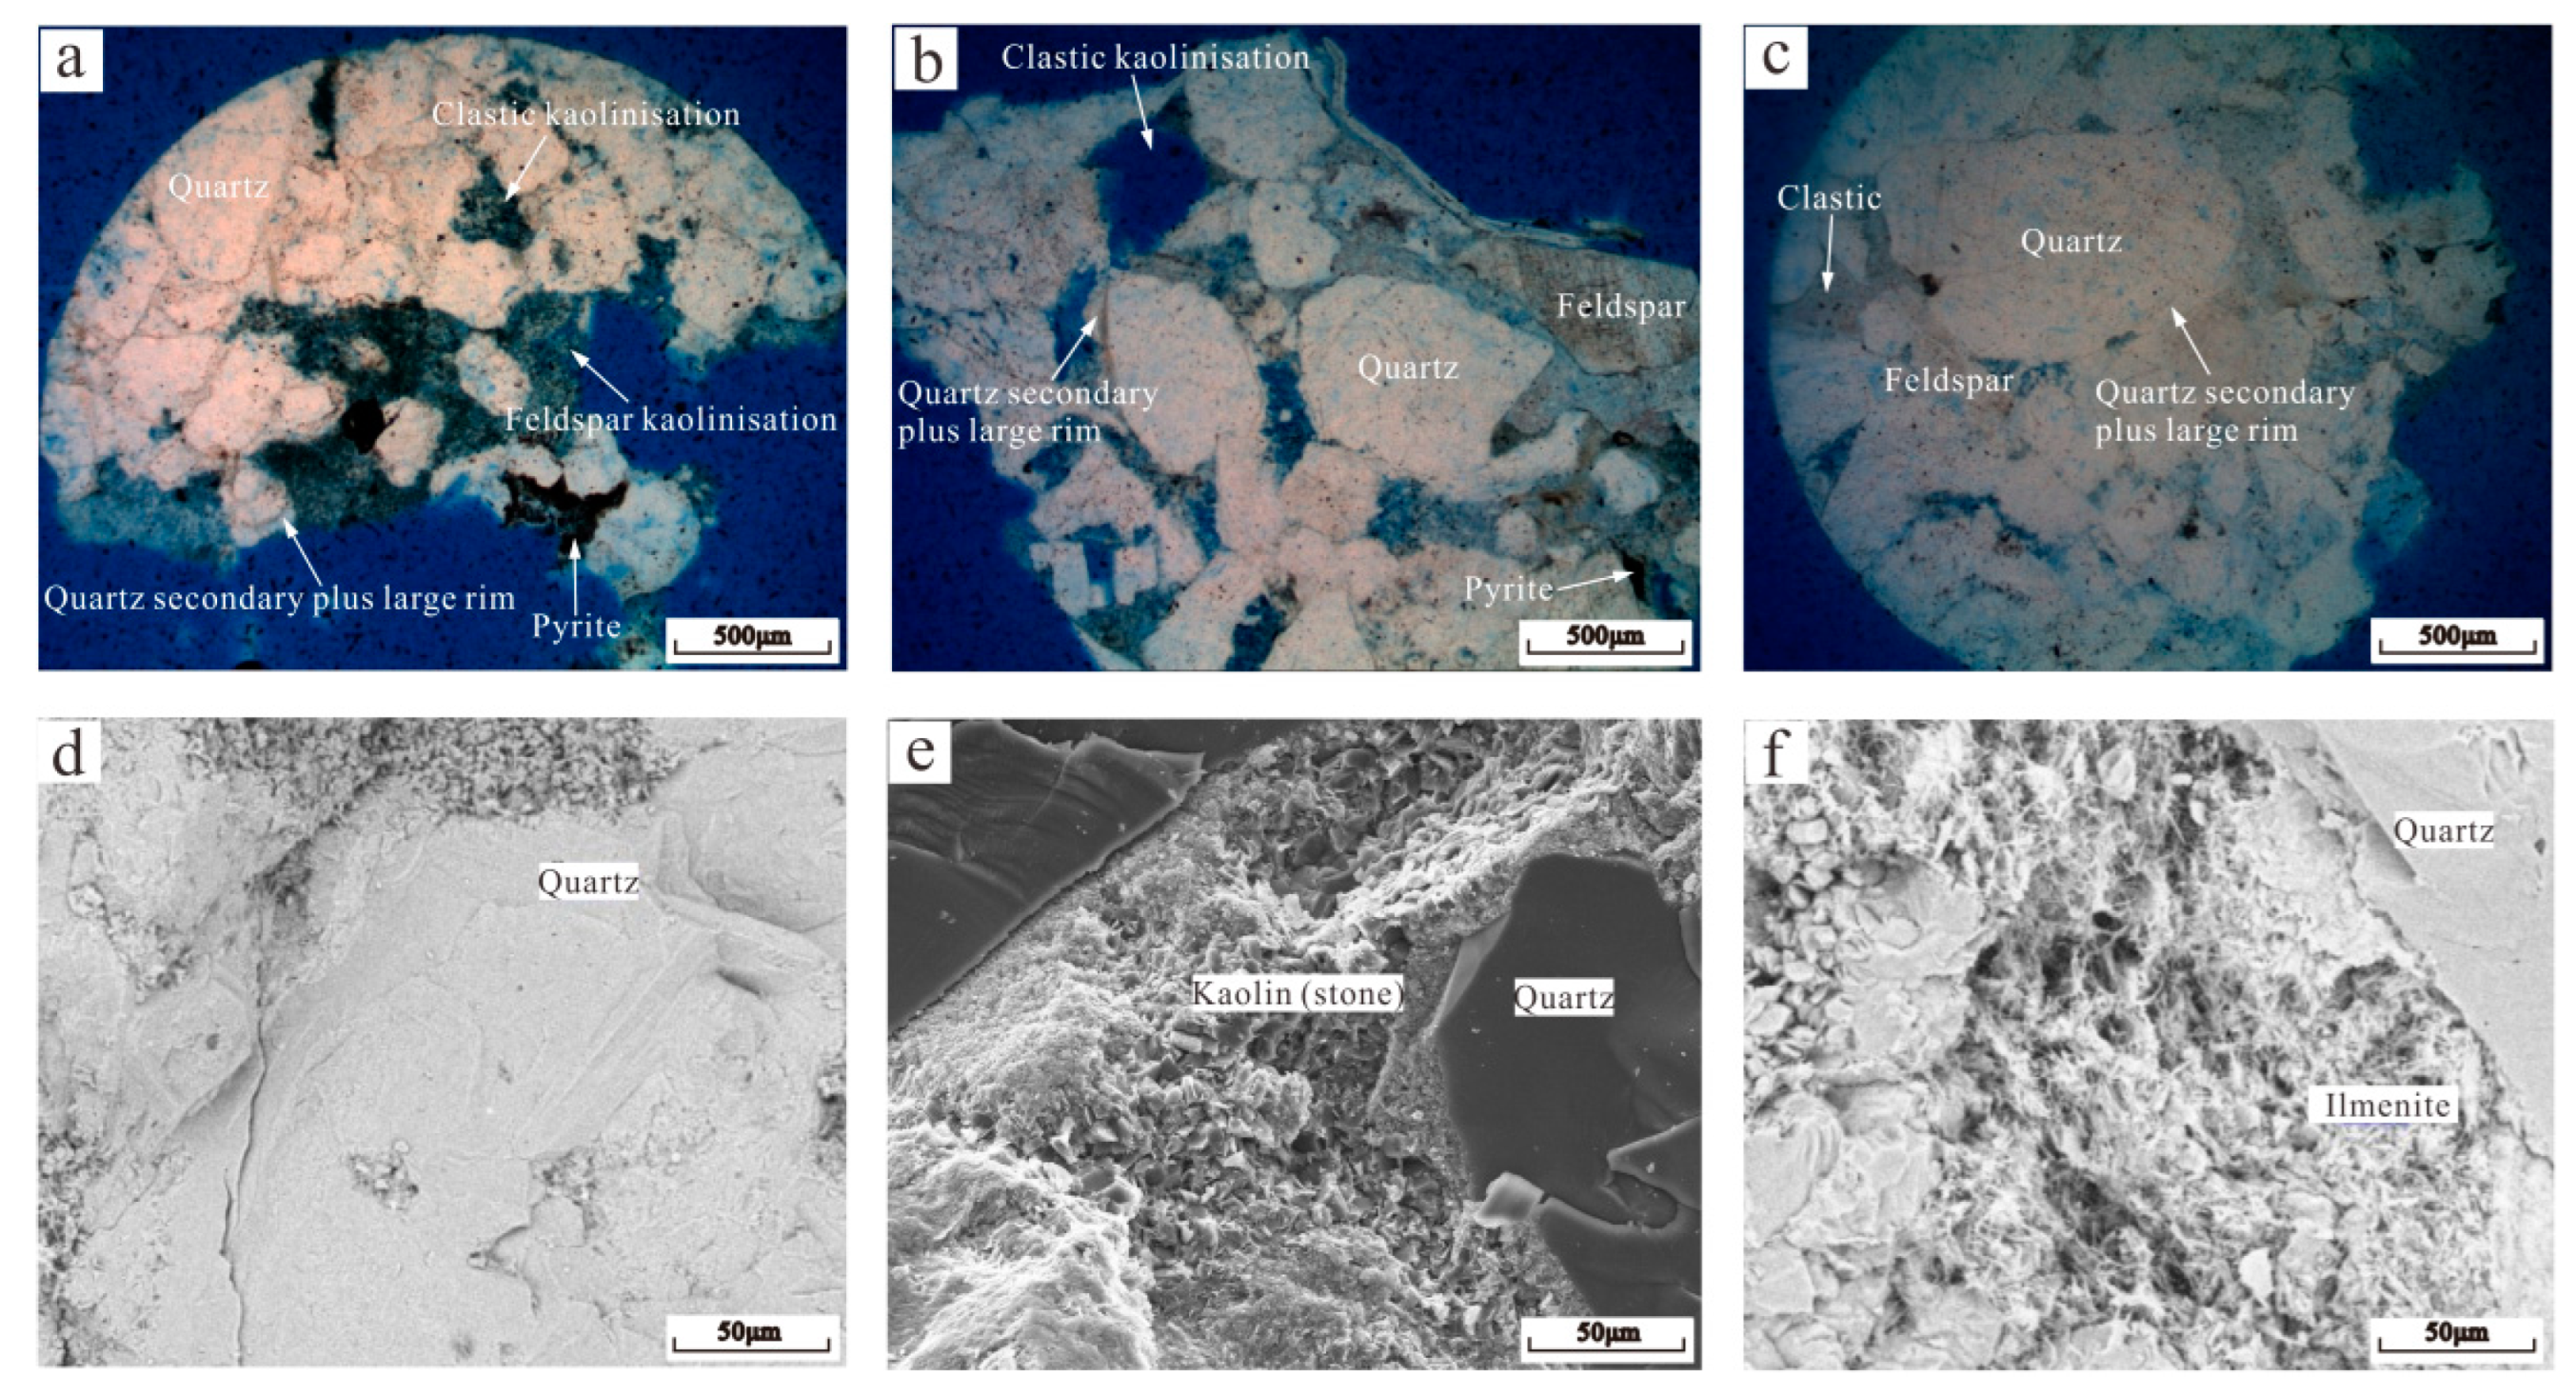
4.1.1. Petrological Features

According to three rock sheets, six CT scan images of 25 mm diameter samples, three field emission scanning electron microscope images, and coring wells, the lithology of the studied section is dominated by gravelly coarse-grained clastic quartz sandstone and sandy conglomerate. The gravel content of is about 10%, dominated by quartz gravel, which is rounded-subrounded. The mineral grain fractions are mainly quartz, feldspar, and clastic, with 55~85% quartz, 5~8.5% feldspar, and 7.5~40% clastic (Figure 2). The fillings are mainly ilmenite and kaolin (stone) (Figure 3c,d), as well as some white mica, black mica, and chlorite [35], with kaolin (stone) formed mainly from feldspars and labile clasts. The rock matrix grains are predominantly sub-prismatic-sub-rounded, poorly sorted and rounded, with low structural and compositional maturity (Figure 3). The grain structure is predominantly gravel-bearing unequal grains (Figure 4). The support is mainly pellet support and heterogeneous base support. The particle contact relations are mainly linear and concave–convex contacts (Figure 4).
According to logging data from the studied section, the mud content is 1.7~11.7%. The mud content of the gravelly coarse-grained clastic quartz sandstone is 5.3~11.7%, and that of the sandy conglomerate is 1.7~5.8%. The gravelly coarse-grained clastic quartz sandstone is significantly more muddy than the sandy conglomerate, and some of the gravelly coarse-grained clastic quartz sandstone has obvious bands of muddy cement.

4.1.2. Quartz Particle Size Features

According to the quartz grain size frequency distribution graph, the grain size frequency distribution is basically consistent with the rock sample naming standard [36], which proves the accuracy and reliability of the result.
The quartz grains in the studied section are strongly distorted and densely distributed (Figure 5). The quartz particle size showed a bimodal distribution, with the main peak particle diameter of 250~500 μm and the secondary peak particle diameter of 500~1000 μm. The percentage of main peak particle diameter is <75%. The size of the particle diameters varies widely, between 44.98 and 3157.04 μm (Table 1), indicating poor sorting of quartz particles in the studied section (Figure 6). The average grain size of quartz particles is between 426.63 and 510.91 μm (Table 1), which is coarse sand. The percentage of gravel in the sandy conglomerate is higher than that in the gravelly coarse-grained clastic quartz sandstone in the studied section.

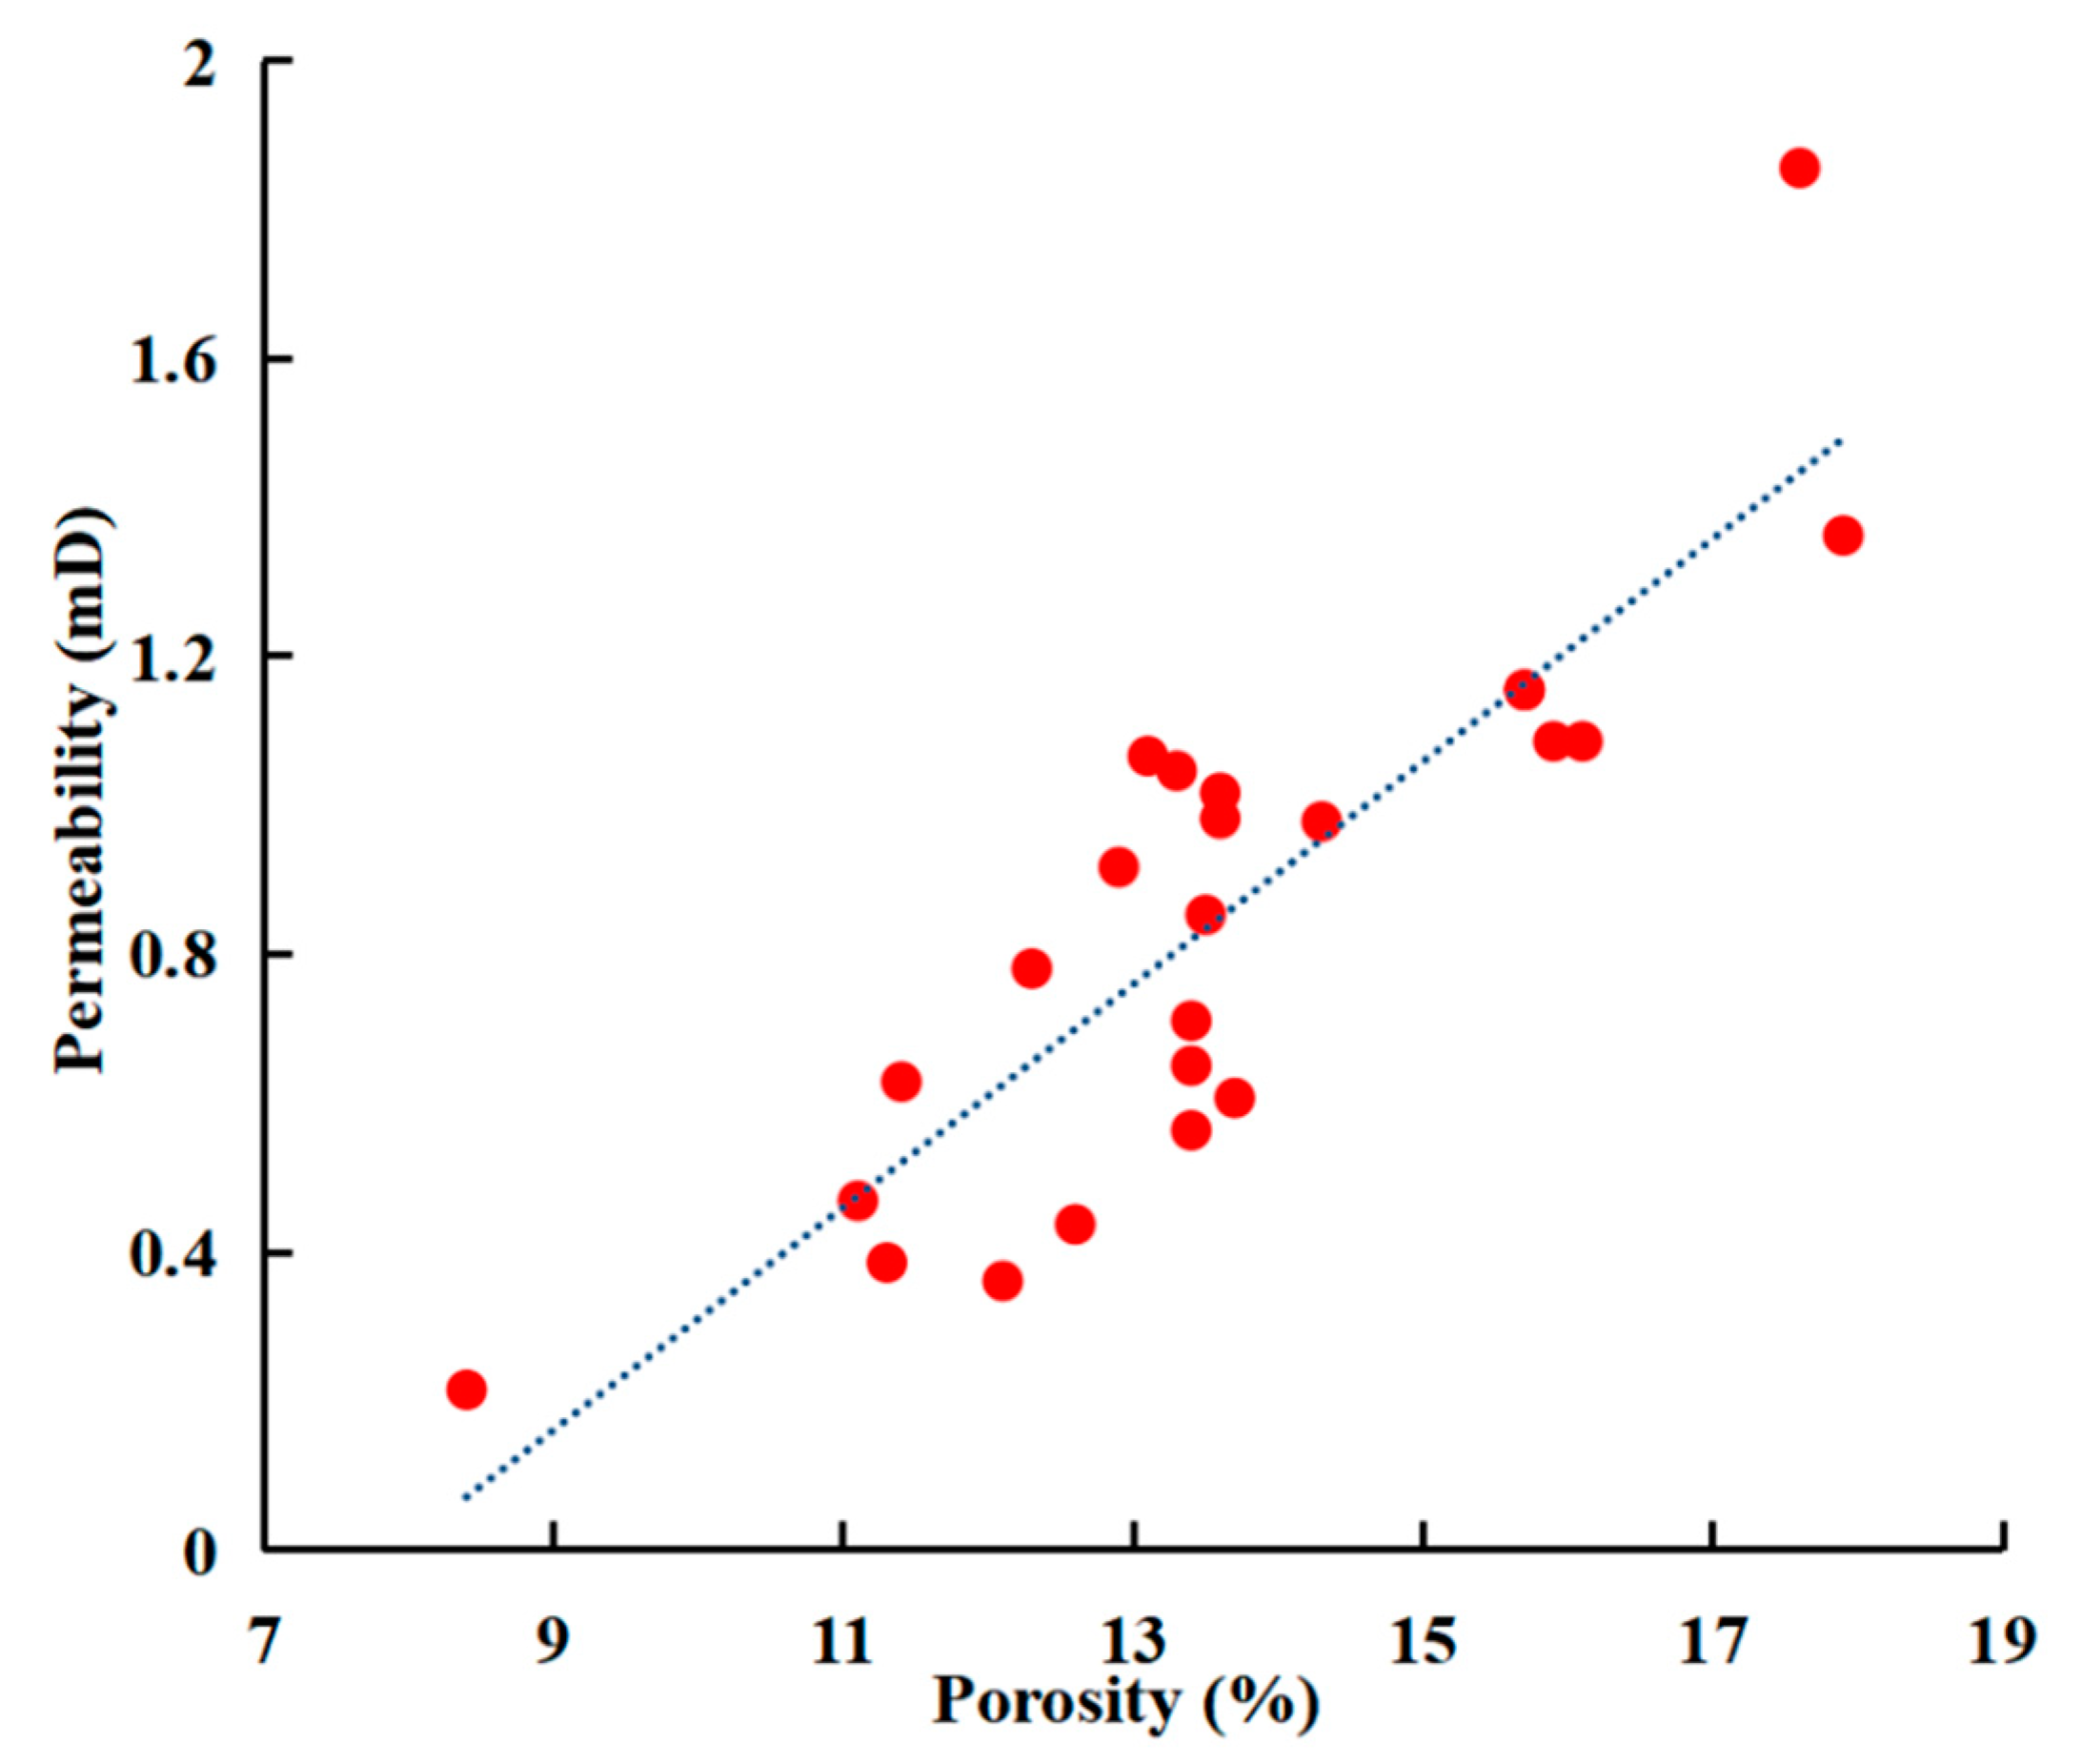
4.1.3. Reservoir Physical Features

The porosity distribution of the first member of the Lower Stone Box Formation in the Hangjinqi Prospect area ranges from 4% to 16%, with an average value of about 9.8% [30]. The average porosity of the full-diameter core CT scan experiments of the studied section is 9.15%. The average porosity of the gravelly coarse-grained clastic quartz sandstones from CT scan experiments of cut samples within 25 mm diameter samples is 10.53% and the average permeability is 0.73 mD; the average porosity of the sandy conglomerates is 13.40% and the average permeability is 1 mD. Based on helium porosimetry and gas permeability meter test results, the porosity distribution of the studied section ranged from 8.4% to 17.9%, with an average porosity of 13.60%. The permeability distribution is 0.22~1.88 mD, with an average permeability of 0.85 mD. The overall porosity and permeability of the study section showed a significant positive correlation with a good correlation (Figure 7). The reservoir’s physical characteristics indicate that the studied section belongs to the dominant reservoir class of dense sandstone.

4.2. Microscopic Characterization of Tight Gas Layers

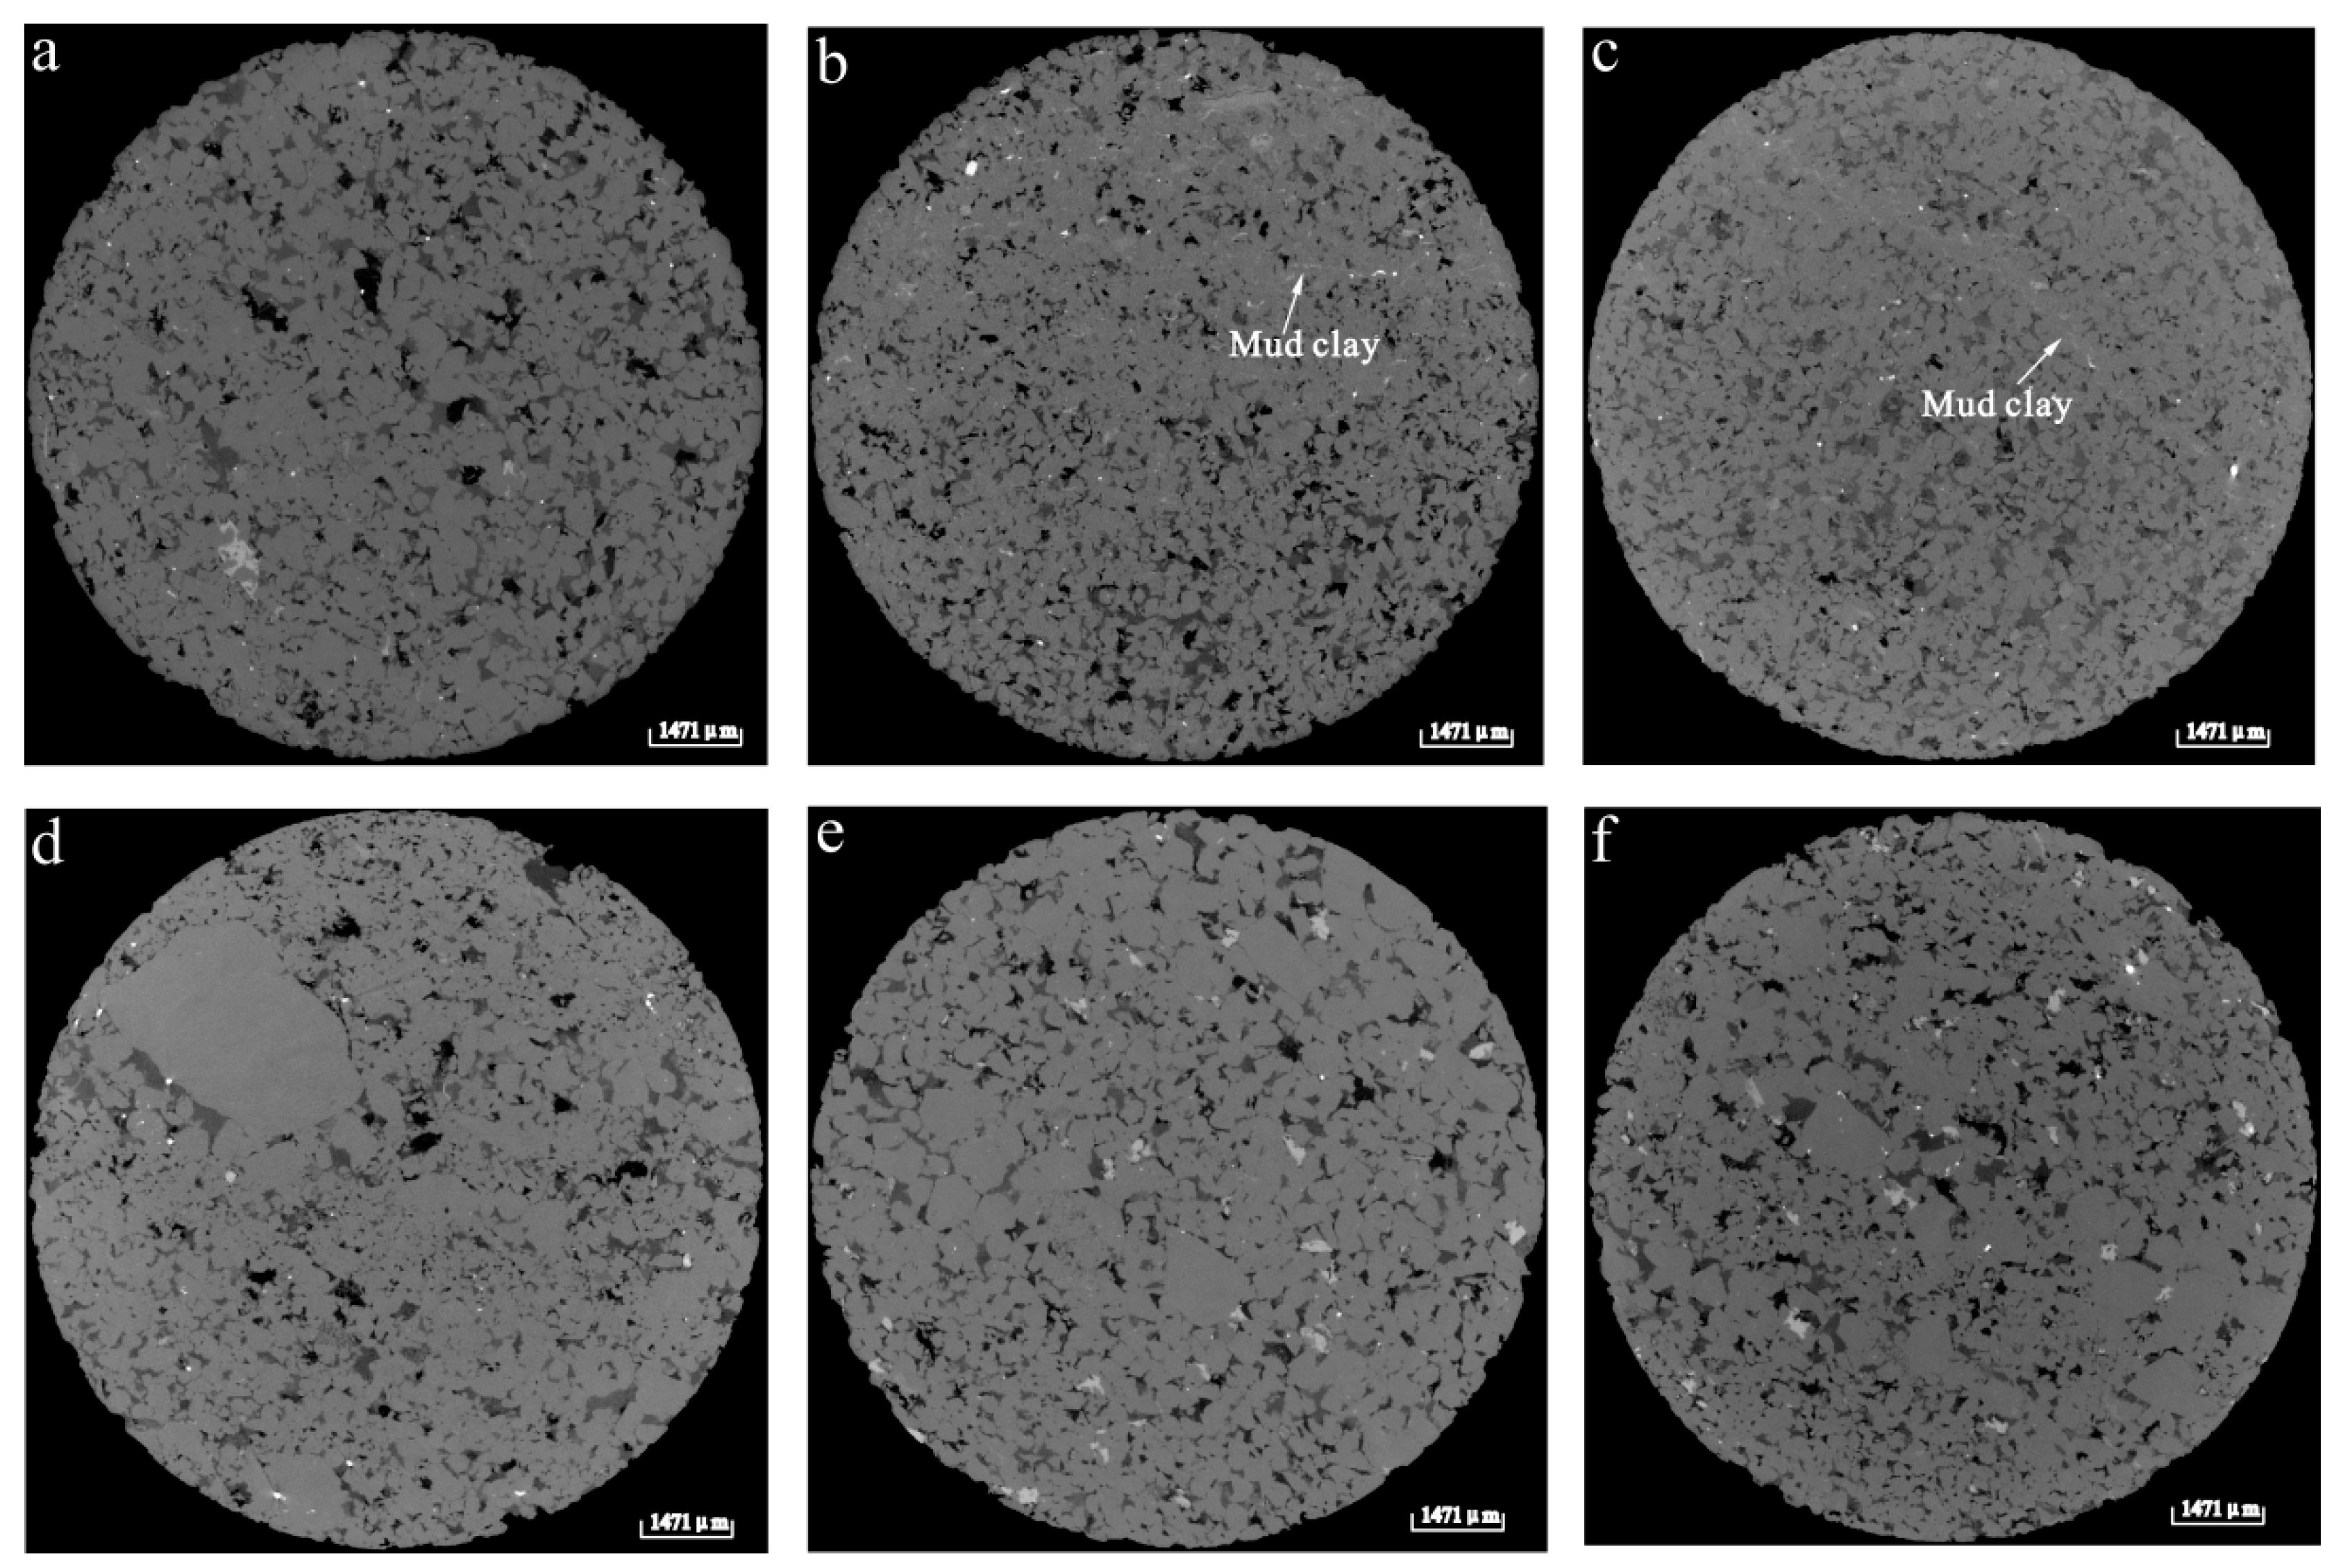
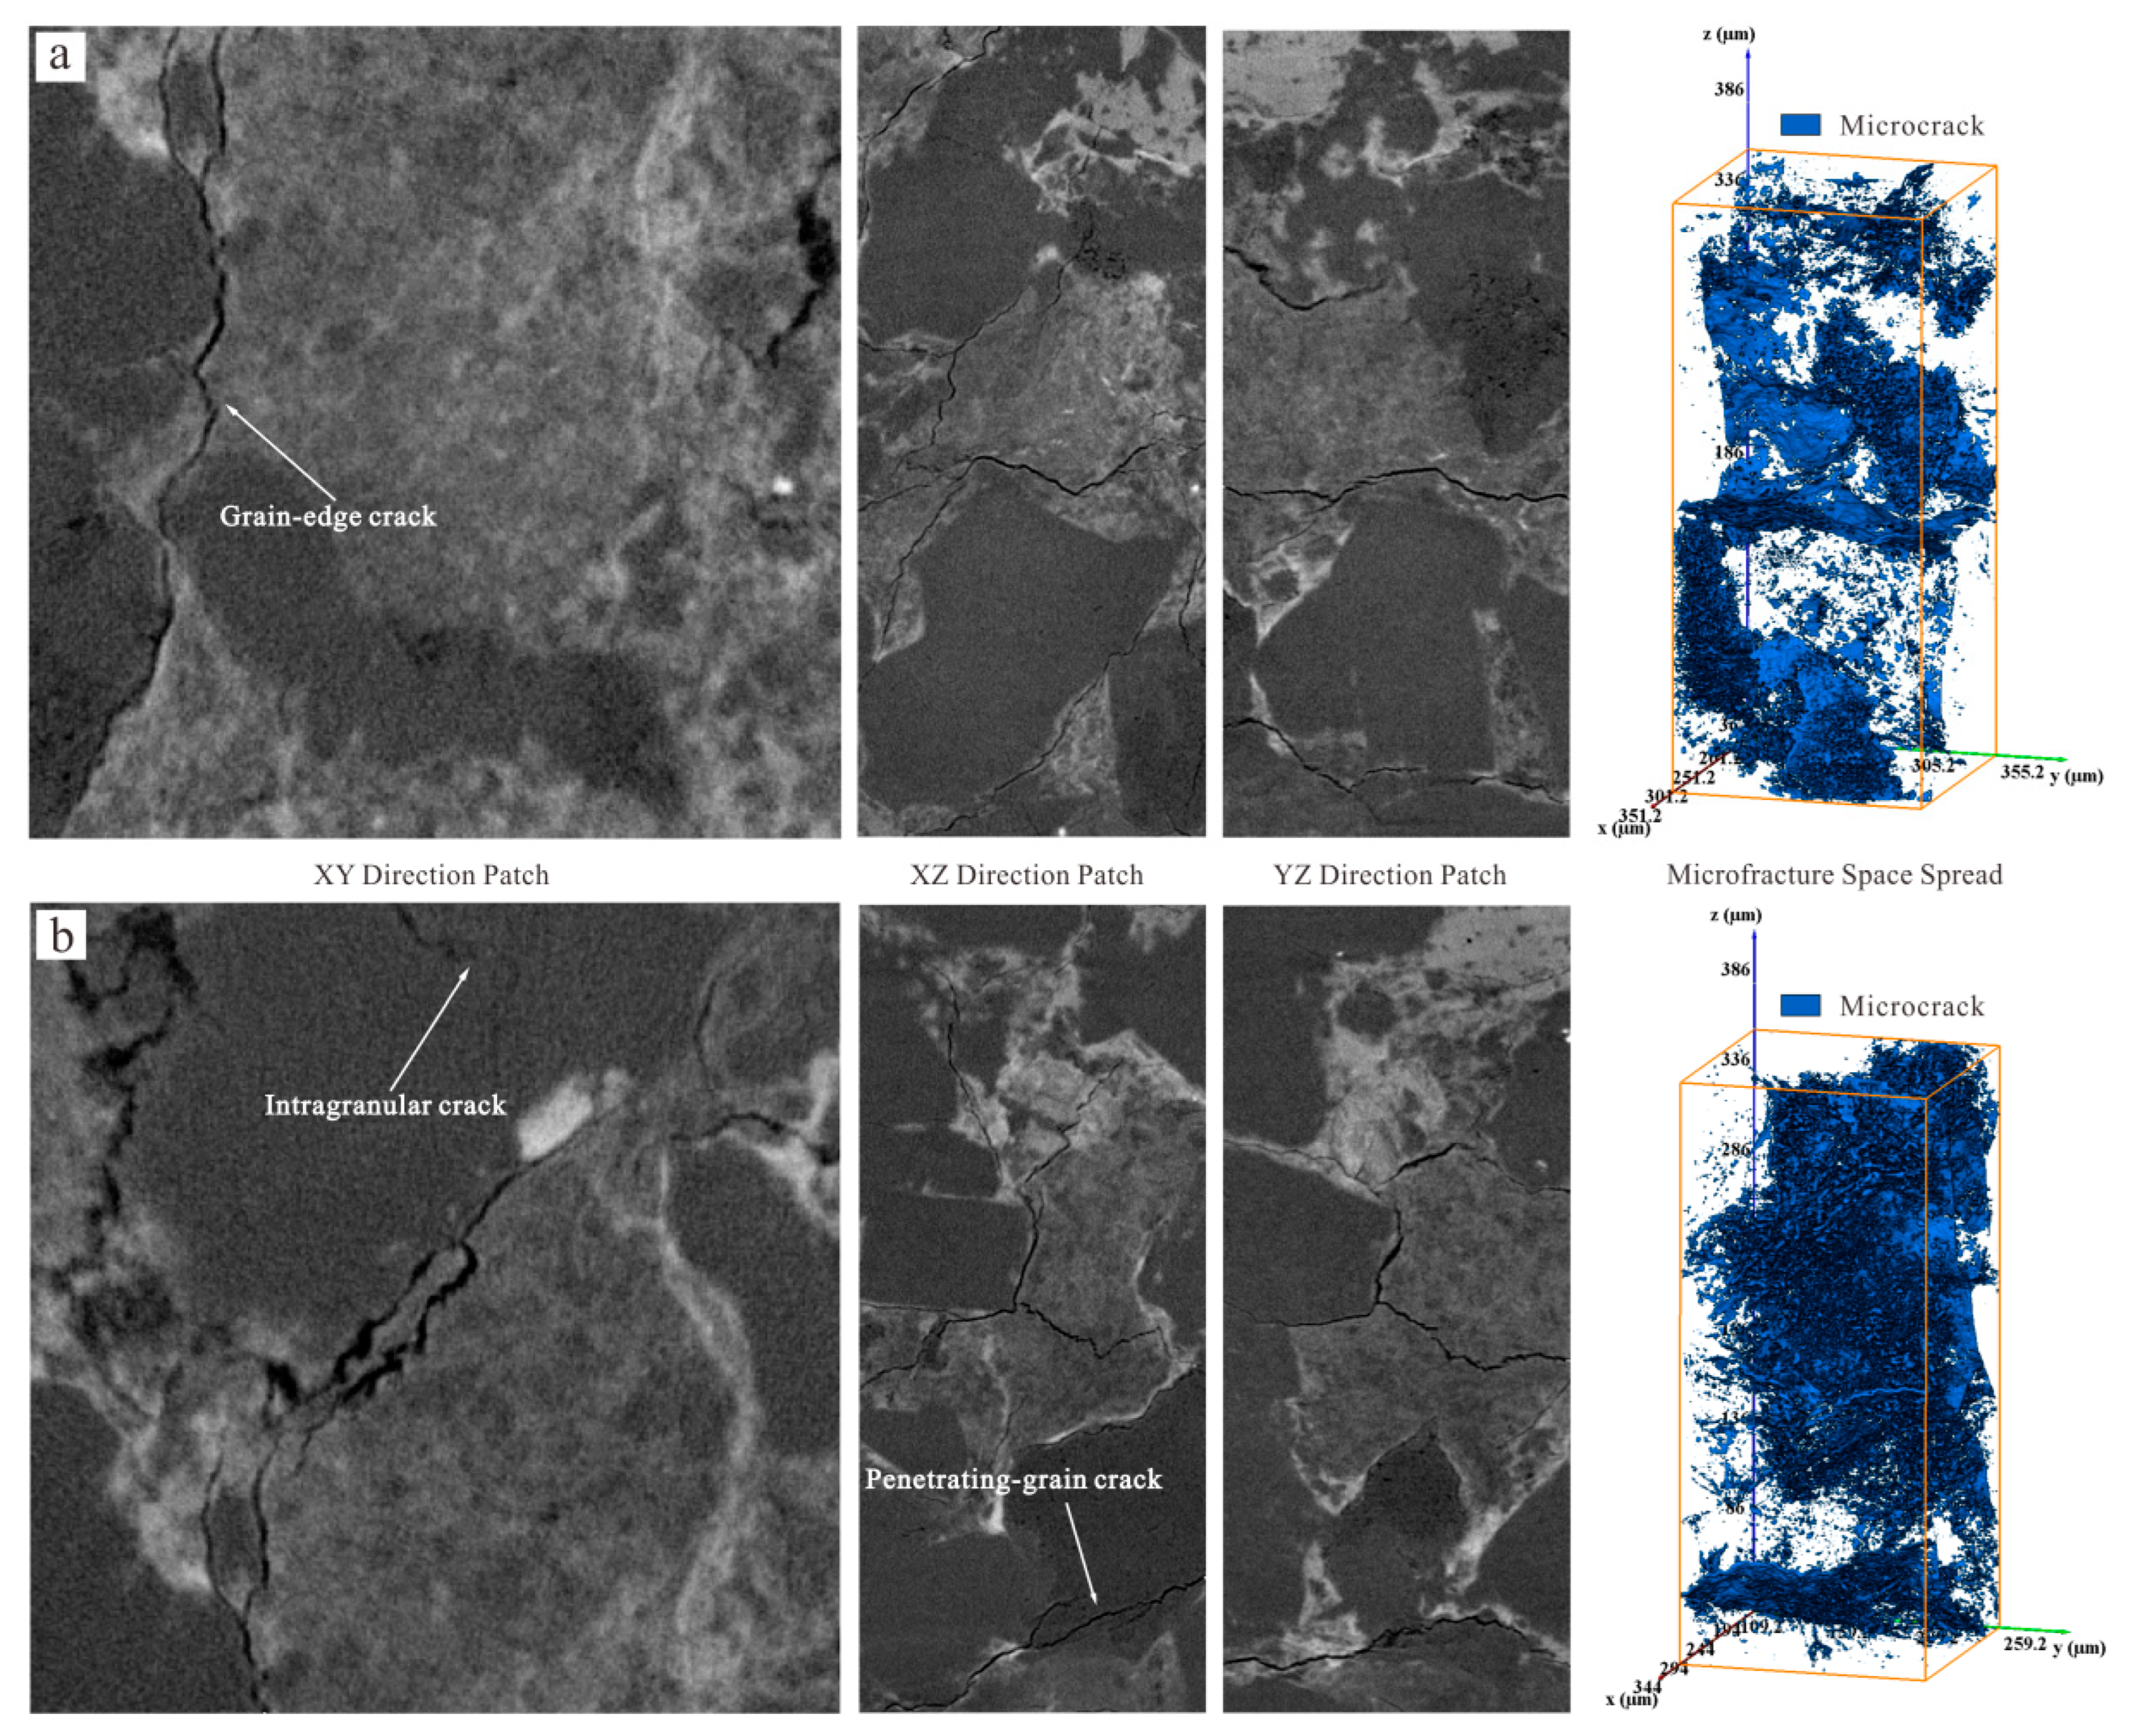
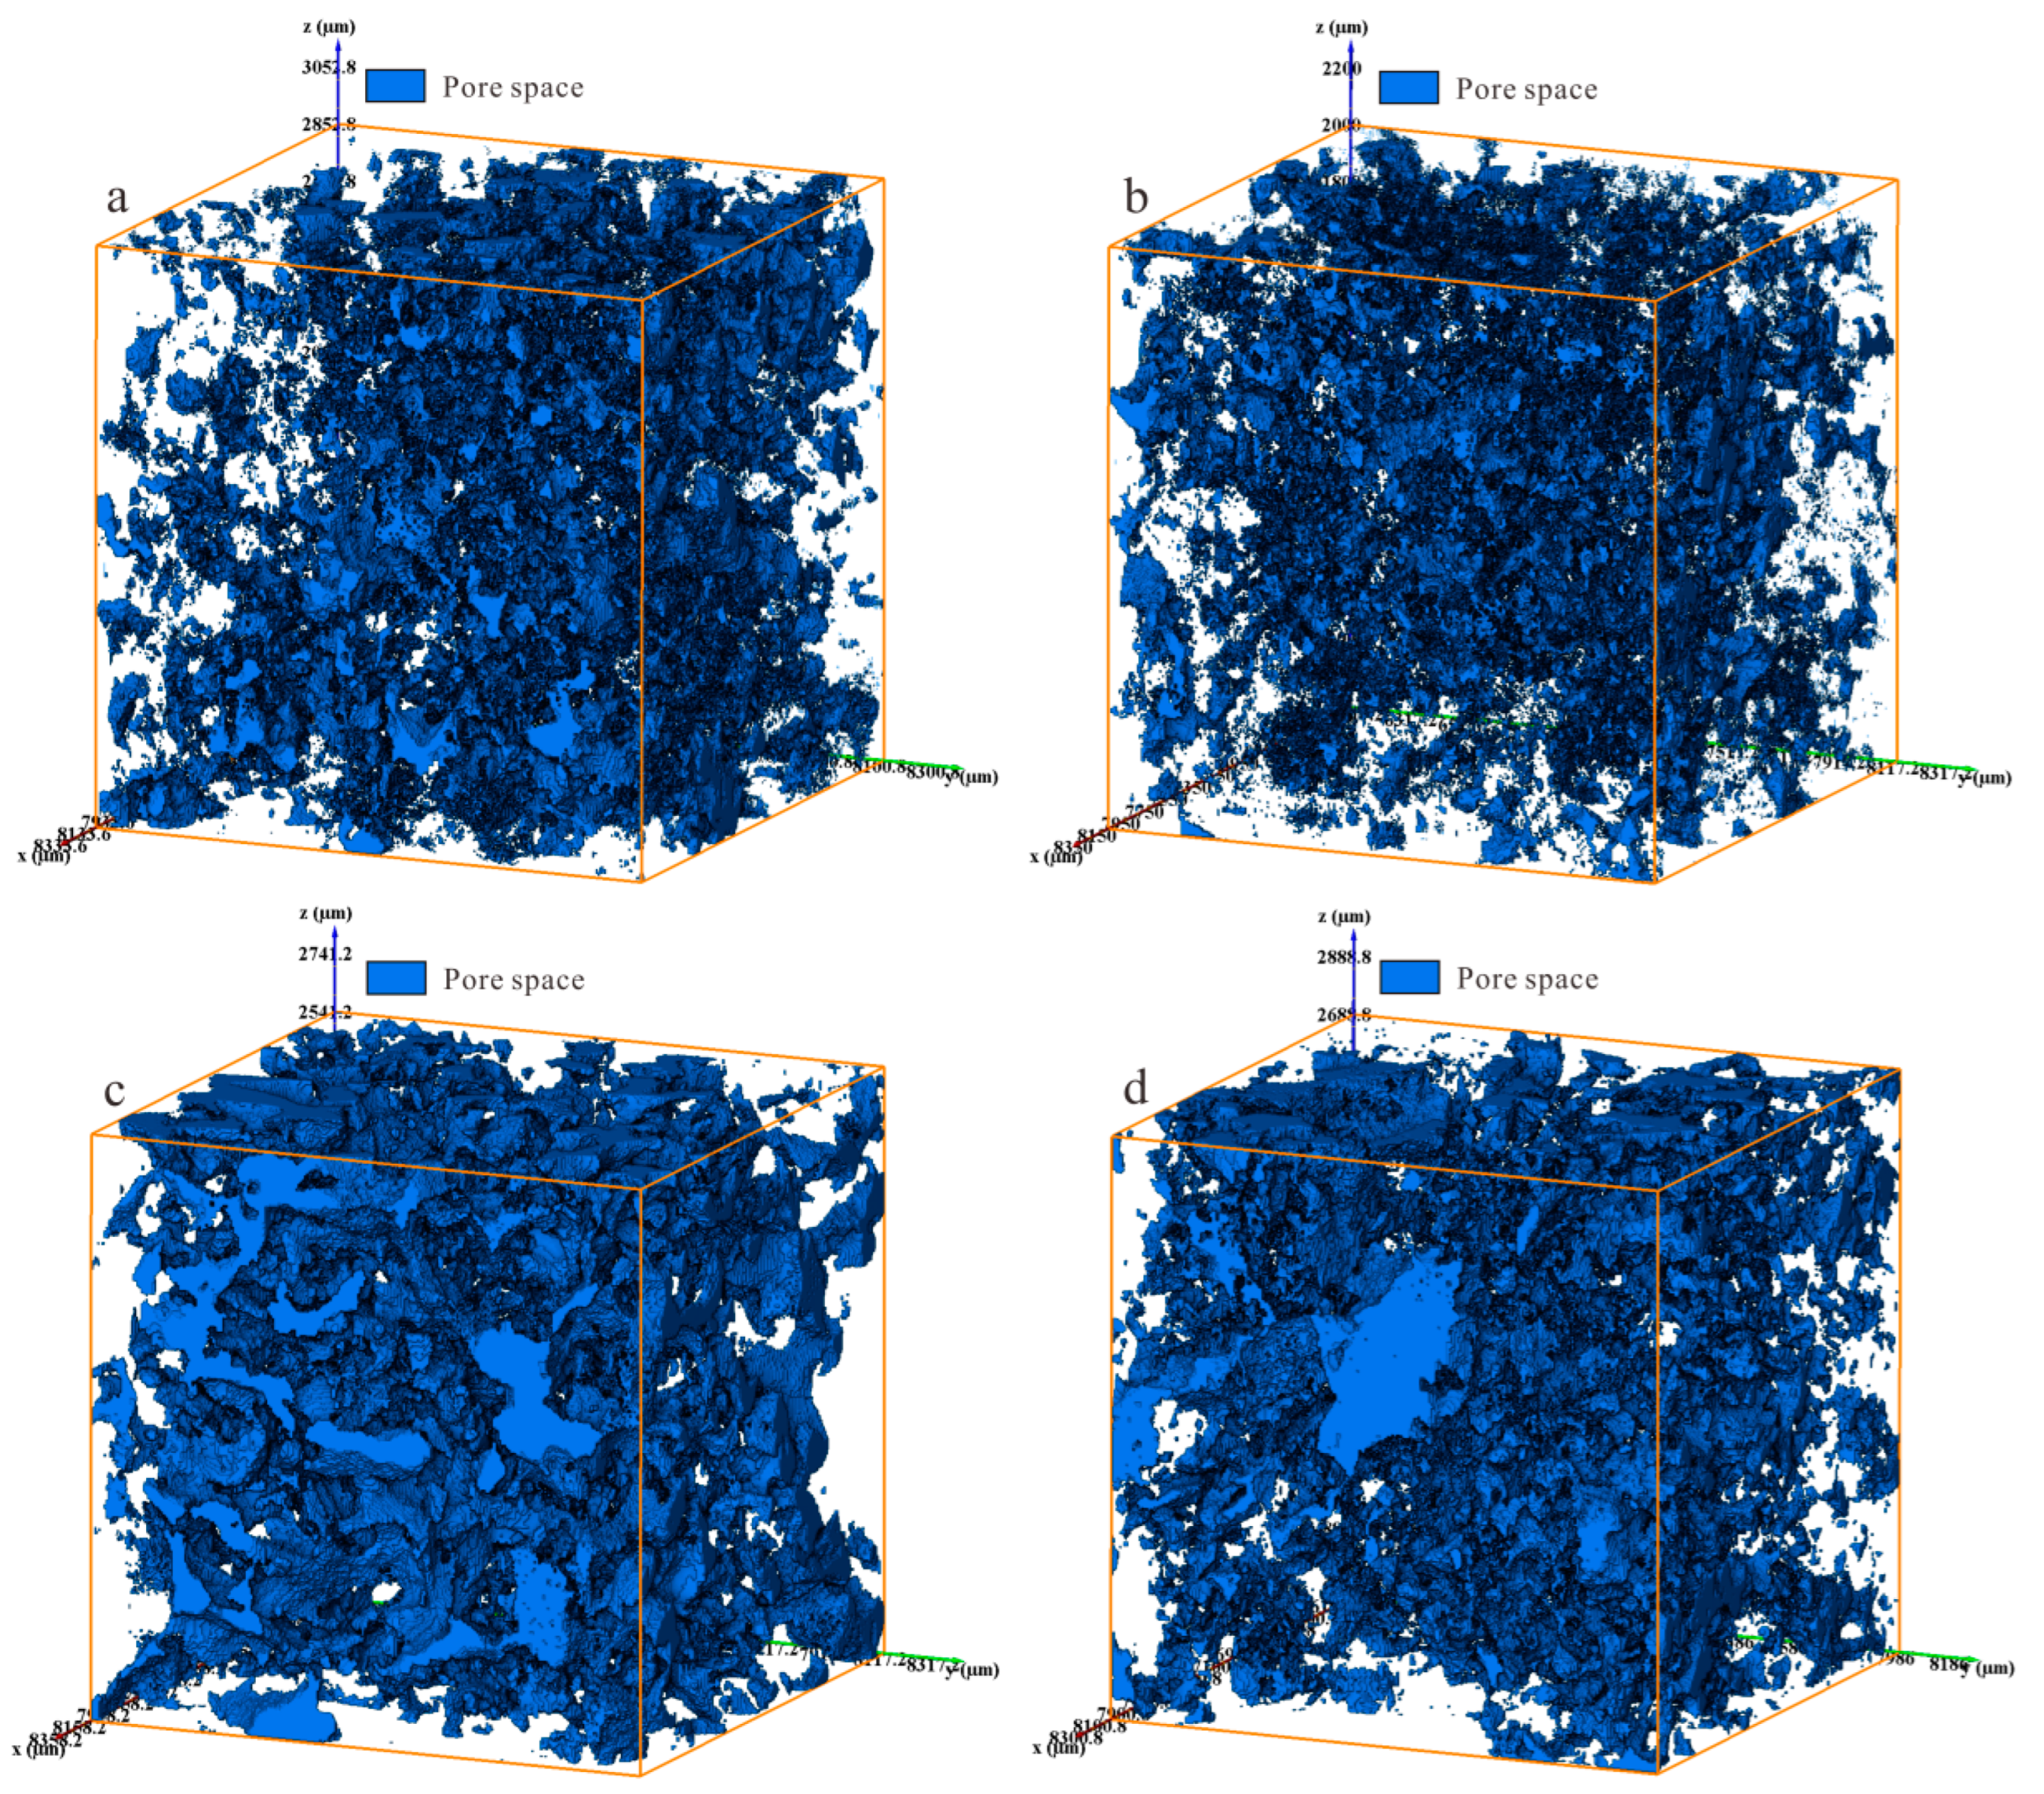
4.2.1. Microscopic Characterization of Reservoir Space

We investigated the various types of gas reservoir space in the first member of the Lower Stone Box Formation in the Hangjinqi Prospect area. In particular, we studied the development of secondary pores, microcracks, and intergranular pores, with secondary pores being the most developed [37]. The studied section reservoir space has intergranular solution pores, intragranular solution pores, and microcracks. Intergranular pores in quartz are locally visible. The types of microcracks are three types: grain-edge cracks, intragranular cracks, and penetrating-grain cracks, of which the grain-edge cracks are the most developed (Figure 8). The three-dimensional spatial spreading of the reservoir within the studied section is morphologically diverse, heterogeneous, and non-homogeneous (Figure 9). Figure 10 shows the “Maximum Ball Algorithm” model of the pore–throat bat. The different colored spheres in the model represent pores, with the colors progressively decreasing from red to blue pore sizes. The grey stick between the spheres is the throat. According to the model, the pores of gravelly coarse-grained clastic quartz sandstones are mostly small balls and the throats are mostly rod-shaped; the pores of sandy conglomerates are mostly large balls and thick; the throats are mostly thick rods, indicating relatively large pore–throat sizes in the sandy conglomerates (Figure 10). The average microcrack rate of the studied section is 1.22%, the average microfracture rate of the gravelly coarse-grained clastic quartz sandstones is 0.93%, and the average microfracture rate of the sandy conglomerates is 1.44%. However, the spatial spreading of microcracks within the sandy conglomerates is more continuous and complete than in the gravelly coarse-grained clastic quartz sandstones. The three-dimensional spatial network of microcracks is mainly composed of high- and low-angle grain-edge cracks spreading around the rock particles. Microcracks connect intergranular and intragranular solution pores and improve the physical properties of the studied section (Figure 8).

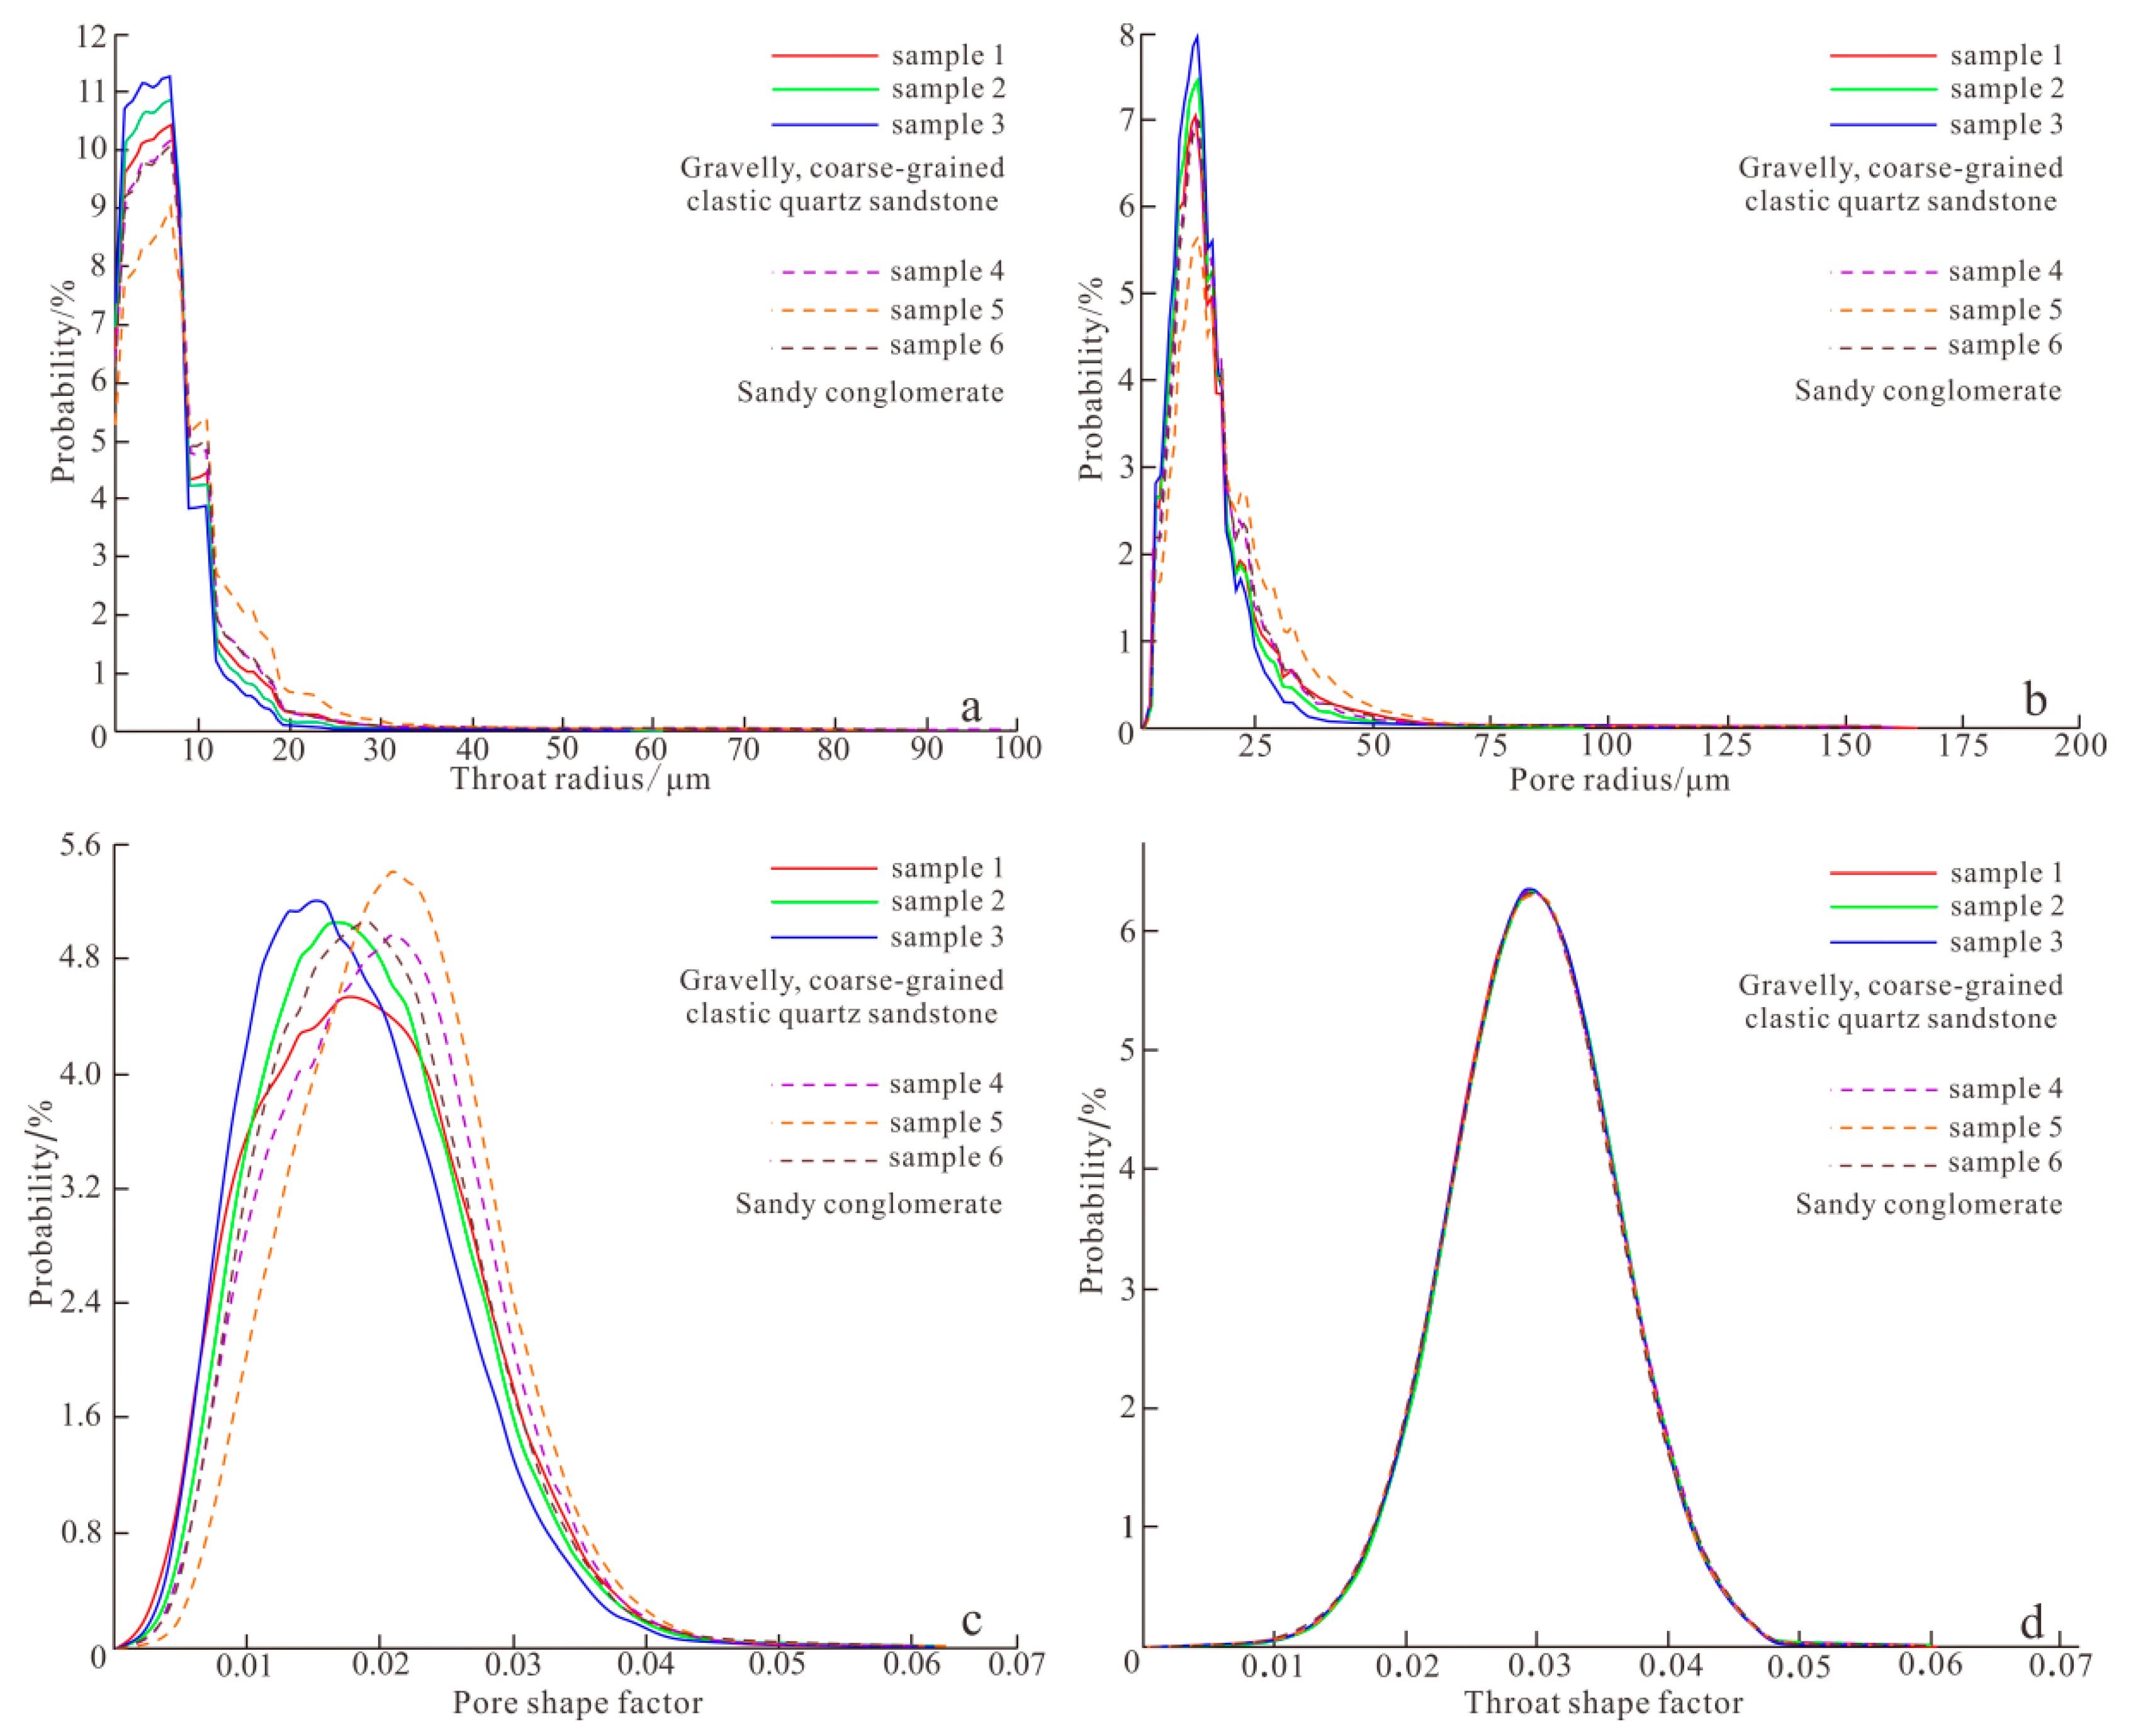
4.2.2. Characterization of Pore–Throat Microstructure

The sample throat radius of the studied section is mainly between ~1 and ~25 μm, with peaks mostly smaller than 7 μm (Figure 11a). The pore radius is mainly distributed in the range of 3~42 μm, with a peak of about 14 μm (Figure 11b). The pore shape factors are mainly distributed in (0, 0.0481] (Figure 11c), indicating that the pore cross-section shape is mainly dominated by triangles [38]. The throat shape factors are the same for each sample, and the curves approximate the normal distribution (Figure 11d); it is shown that the shape characteristics of the throat shape defined with the maximal ball algorithm are essentially the same [39]. The maximum number of coordination numbers ranges from ~45 and ~97 and the average number of coordination numbers ranges from ~2 and ~4 (Table 2). The above data show that the throats of the studied section are dominated by fine throats, the pores are dominated by small pores, and the connectivity of the pores and throats is good (Table 2). Various types of pore–throat structural parameters of the sandy conglomerates are better than those of the gravelly coarse clastic quartz sandstone (Figure 11). Meanwhile, the permeability of the sandy conglomerates gas layer in the studied section is good, indicating that the pore–throat structural parameter is an important factor influencing the physical properties of the reservoir of the gas layer.

5. Discussion

5.1. Influence of Petrological Characteristics on the Microscopic Characterization of Reservoir Space

The source of gas in the first member of the Lower Stone Box Formation of the Xinzhao East belt in the Hangjinqi Prospect area is not far away from the northern Yinshan Paleocontinent. The rocks in the studied section have a lot of features, such as a high overall content of unstable minerals and lower compositional maturity and structural maturity. These characteristics determine the strong non-homogeneity of the spatial microscopic characteristics of gas reservoirs in the studied section. The studied section was subjected to compaction and cementation, which led to plastic deformation and thus more dense contact with the particles. The particle contact relationship was dominated by line and bump contacts, resulting in a lack of development of primary pores in the gas layer. Dissolution pores serve as the main storage space within the gas layer, and their main types are feldspar dissolution pores. When dissolution occurs, authigenic minerals such as kaolinite precipitate. When dissolution occurs, authigenic minerals such as kaolin (stone) precipitate, which clogs the pore space and further enhances the non-homogeneity of the microscopic features of the reservoir space (Figure 3). The first member of the Lower Stone Box Formation has a high content of the brittle mineral quartz. The gas layer is prone to forming microcracks when it is squeezed. The mud content in the gravelly coarse-grained clastic quartz sandstones is higher than that in the sandy conglomerates gas layer. The mud cementation is not easily dissolved. On the one hand, it leads to gravelly coarse-grained clastic quartz sandstone gas formations with low microcrack rates. On the other hand, it makes the microcracks of this rock spread discontinuously and incompletely in space.

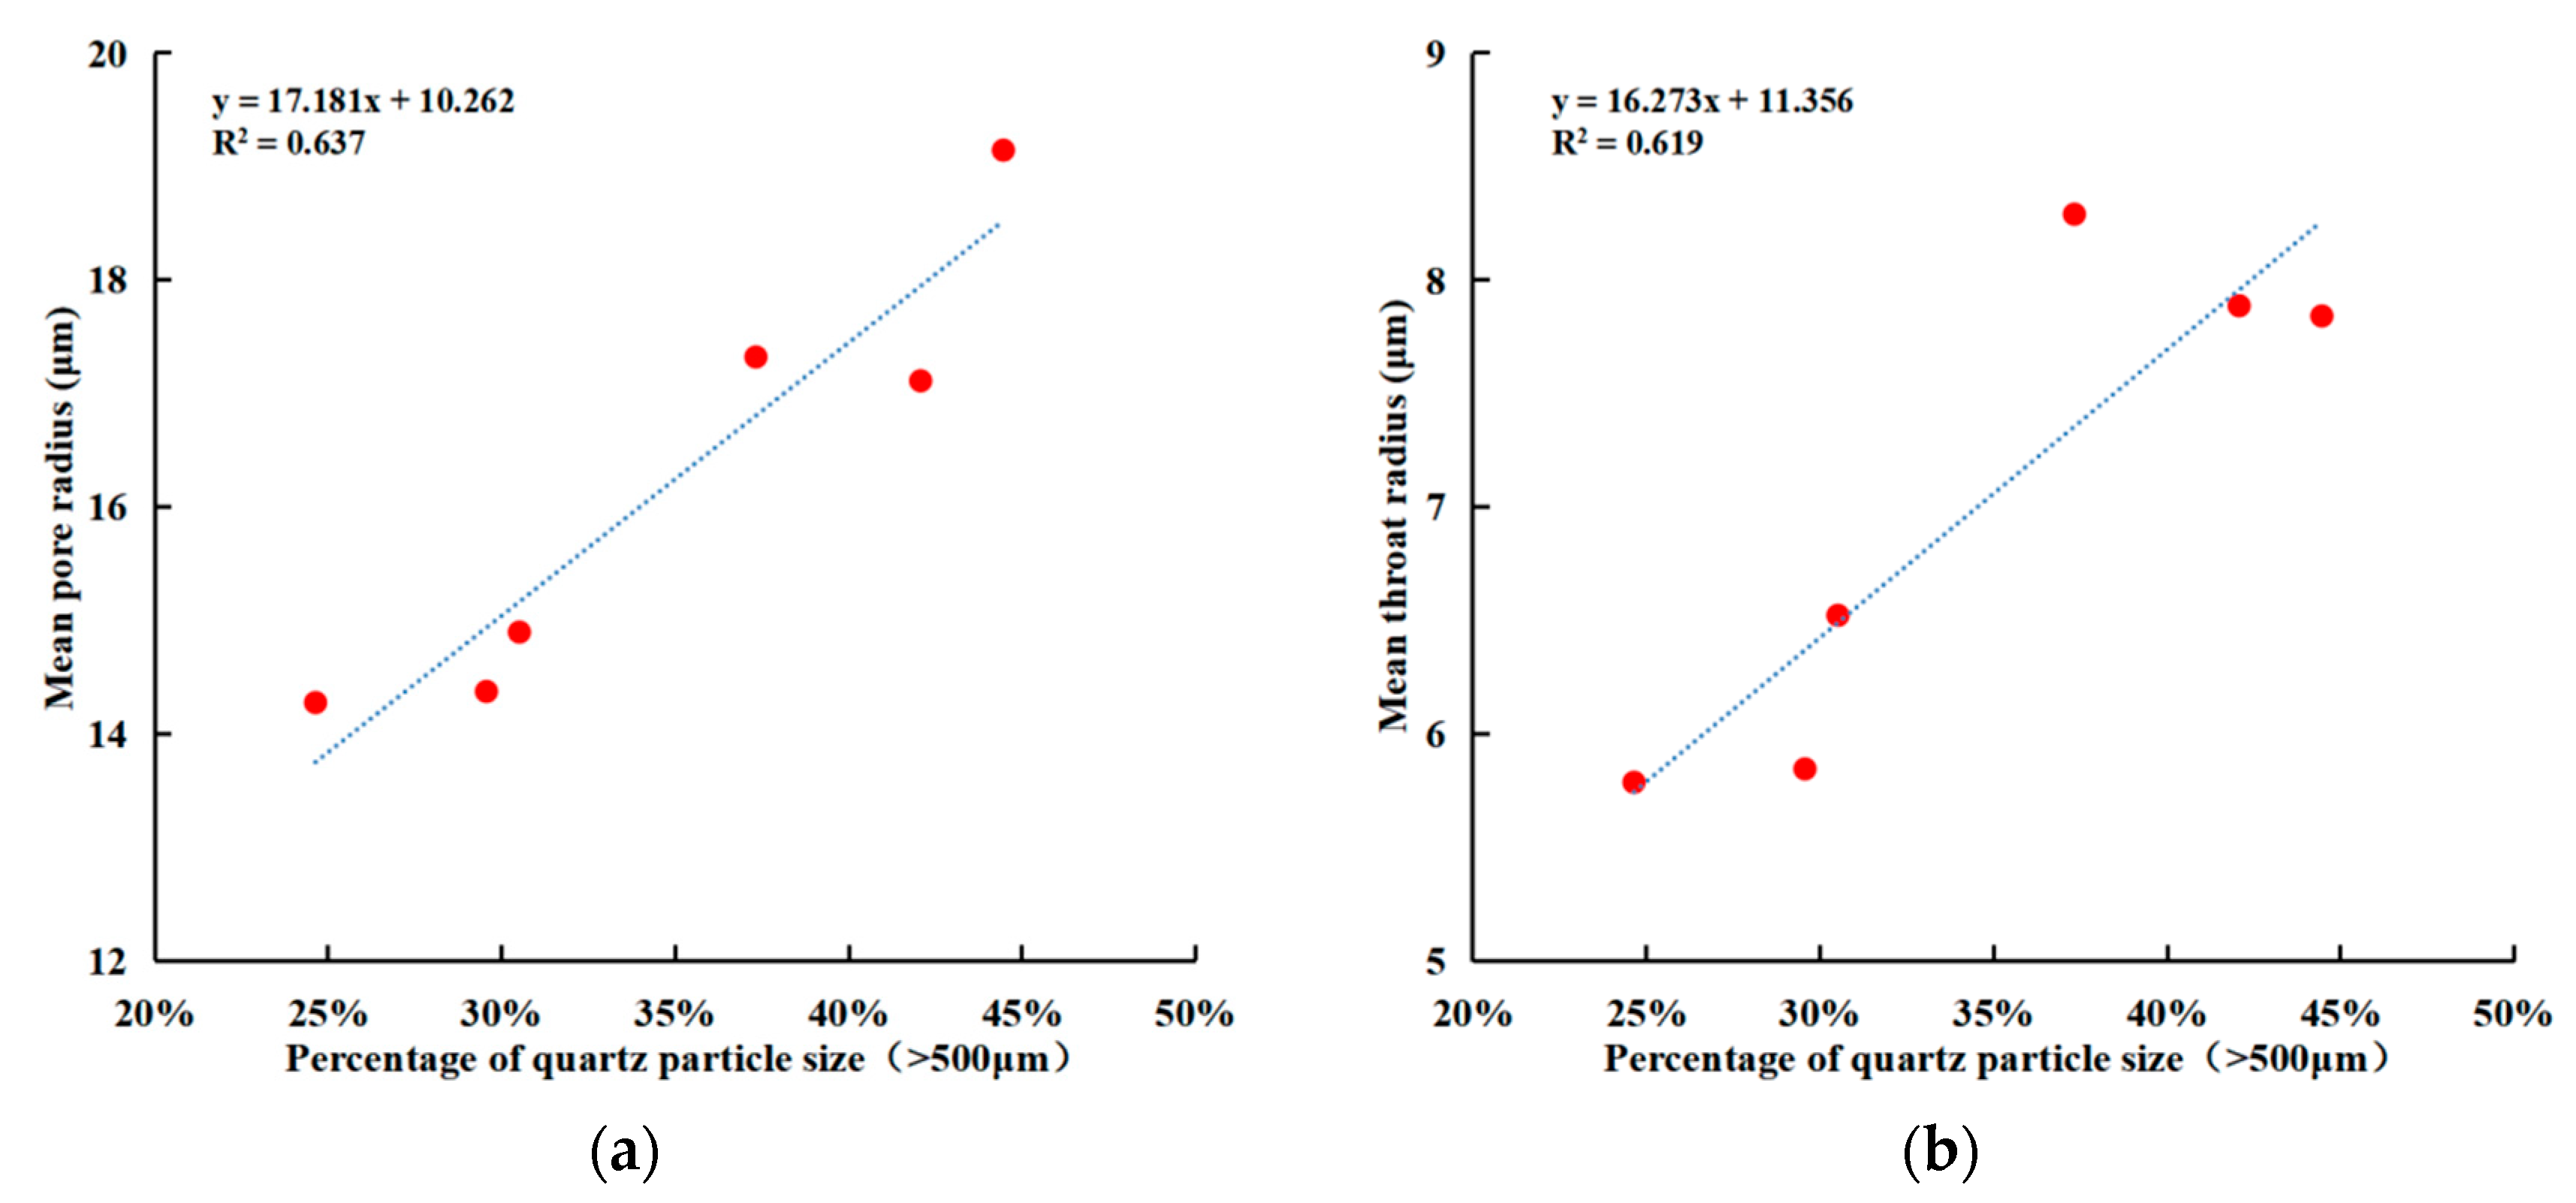
5.2. Relationship between Particle Size and Microscopic Characteristics of Reservoir Space

Quartz grain size is closely related to the microscopic characteristics of the reservoir space [40]. There is a correlation between quartz grain size and both pore and throat sizes within the gas formation in the studied section. With the increase in large-diameter quartz particle size content, the pore radius and throat radius of samples increased synchronously. The above phenomena indicate a good positive correlation between large-diameter quartz grain size in the gas layer and the pore radius and throat radius (Figure 12). The quartz grain size in the studied section changes the microscopic characteristics of the reservoir space to a certain extent by affecting the size of the pore throat radius. Compared to gravelly coarse-grained clastic quartz sandstones, the sandy conglomerates have larger quartz grains, better connected storage space, and larger pore–throat sizes. This is one of the reasons for the higher porosity, permeability, and better storage material properties of the sandstones compared to the gravelly coarse-grained clastic quartz sandstones.
Comprehensive studies have shown that, tight sandstones reservoirs have small pore–throats, complex pore structures, and high non-homogeneity. Compared to traditional methods, X-CT 3D core scanning, which can model the spatial distribution of pores and cracks and the pore–throat ball-and-stick model, is better for fine characterization of such reservoirs. This paper can serve as a reference for global microscopic characterization of dense sandstones. Meanwhile, the gas reservoir of the first member of the Lower Stone Box Formation in the studied section has good reservoir properties. It can be used as a high-quality reservoir. The gravelly sandstones have better reservoir properties than gravelly coarse-grained clastic quartz sandstones, which can be used as the next key research object of reservoir in the Hangjinqi Prospect area.

6. Conclusions

(1) The gas reservoir space in the first member of the Lower Stone Box Formation of the D-well Zone in the Xinzhao East belt is mainly composed of intergranular pores, intragranular pores, and grain-edge micro-cracks. The gas reservoir space in the study area is characterized by complex three-dimensional spatial distribution, varying morphology and size, and strong non-homogeneity. Microcracks within the gas layer communicate with isolated pores to form a reservoir space network, which increases the size of the pore–throat and enhances the connectivity of the pore–throat. The microscopic characteristic within the gas layer is good. The first member of the Lower Stone Box Formation in the studied section can be a high-quality reservoir.
(2) The contact relationship of gas layer particles in the first member of the Lower Stone Box Formation of the D-well Zone in the Xinzhao East belt is dominated by line contact and concave–convex contact. The primary porosity of the gas layer is not developed. The development of secondary lysimeters is due to dissolution. At the same time, unstable minerals such as kaolin (stone) and illite clog the pores. Reservoir properties within the gas layer are affected. The difficult-to-dissolve mud cement within the gas layer further deteriorates pore–throat connectivity. Further, the gravelly coarsegrained clastic quartz sandstones, which have a higher content of muddy cement, have poorer microscopic characteristics and reservoir material properties compared to the conglomerates. The high content of quartz brittle minerals and the development of natural microfractures within the gas formation are favorable conditions for fracture development.
(3) Quartz grain size and pore throat size are positively correlated within the gas layer in the first member of the Lower Stone Box Formation of the D-well Zone in the Xinzhao East belt. The microscopic characterization of gas reservoir space is somewhat influenced by quartz grain size. Compared with gravelly coarse-grained clastic quartz sandstones within gas formations, larger-grained conglomerates have superior reservoir space connectivity and pore–throat size dimensions.

Author Contributions

Conceptualization, N.G. and W.H.; methodology, N.G. and W.H.; software, N.G., L.G. and G.L.; investigation, N.G. and L.G.; writing, N.G., L.G. and G.L.; data curation and visualization, N.G. and L.G.; supervision, G.L.; funding acquisition, W.H. All authors have read and agreed to the published version of the manuscript.

Funding

National Natural Science Foundation of China (Grant No. 51704033).

Institutional Review Board Statement

Not applicable.

Informed Consent Statement

Not applicable.

Data Availability Statement

All data and materials are available on request from the corresponding author. The data are not publicly available due to ongoing research using a part of the data.

Conflicts of Interest

The authors declare no conflicts of interest.

References

  1. Arogundade, O.; Sohrabi, M. A review of recent developments and challenges in shale gas recovery. In Proceedings of the SPE Saudi Arabia Section Technical Symposium and Exhibition, Al-Khobar, Saudi Arabia, 8–11 April 2012; pp. 621–651. [Google Scholar]
  2. McGlade, C.; Speirs, J.; Sorrell, S. Unconventional gas—A review of regional and global resource estimates. Energy 2013, 55, 571–584. [Google Scholar] [CrossRef]
  3. Masters, J.A. Deep Basin gas trap, western Canada. AAPG (Am. Assoc. Pet. Geol.) Bull. 1979, 63, 152–181. [Google Scholar]
  4. Meckel, L. Course Notes on Tight Gas Exploration. In Proceedings of the EAGE Second Middle East Tight Gas Reservoirs Workshop, Manama, Bahrain, 12–15 December 2010; pp. 12–15. [Google Scholar]
  5. Holditch, S.A. Tight gas sands. Pet. Technol. 2006, 58, 86–93. [Google Scholar] [CrossRef]
  6. Hayton, S.; Heine, C.; Gratto, B.E. Tight Gas Exploration in Saudi Arabia. 2010. Available online: https://onepetro.org/spedgas/proceedings-abstract/10DGAS/All-10DGAS/SPE-131065-MS/106141 (accessed on 1 December 2023).
  7. Liu, C.Y.; Wang, J.Q.; Zhang, D.D.; Zhao, H.G.; Zhao, J.F. Genesis of rich hydrocarbon resources and their occurrence and accumulation characteristics in the Ordos Basin. Oil Gas Geol. 2021, 42, 1011–1029. [Google Scholar]
  8. Li, G.X.; Zhu, R.K. Progress, challenges and key issues of unconventional oil and gas development of CNPC. China Pet. Explor. 2020, 25, 1–13. [Google Scholar]
  9. Zhang, Y.Y.; Zhang, W. Well loggi Hangjinqiexploration ng assessment of tight sandstone gas reservoirs from the He-1 member of the Permian Lower Shihezi Formation in the area, Ordos Basin. Sediment. Geol. Tethyan Geol. 2016, 36, 53–59. [Google Scholar]
  10. Zhang, X.L.; Wang, D.G.; Chen, S.H. Characteristics of the mesozoic reservoir bed in Ordos basin south Xun Yi-YiJun area. J. Earth Sci. Environ. 2000, 4, 17–21. [Google Scholar]
  11. Xie, R.C.; Zhou, W.; Li, L.; Su, Y.; Wang, X. Characteristics of upper Paleozoic sandstone reservoir in Hangjinqi area of Prdos basin. Xinjiang Geol. 2010, 28, 86–90. [Google Scholar]
  12. Hao, T. Heterogeneous reservoirs of Shihezi 1 Member, Jin 30 well block, Dongsheng gasfield. Nat. Gas Technol. Econ. 2021, 15, 7–13+21. [Google Scholar]
  13. Xun, X.Q. Reservoir characteristics and influential factors of physical property: An example fromShihezi 1 Member, East Xinzhao block, Dongsheng gasfield, Ordos Basin. Nat. Gas Technol. Econ. 2022, 16, 10–16. [Google Scholar]
  14. Ortiz-Orduz, A.; Ríos-Reyes, C.A.; Vargas-Escudero, M.A.; García-González, M. Impact of diagenesis on the reservoir rock quality of the cachiri group tight sandstones in cesar sub basin (colombia): A case of study from anh-cr-montecarlo 1x well. J. Nat. Gas Sci. Eng. 2021, 95, 104138. [Google Scholar] [CrossRef]
  15. Wang, X.C.; Luo, J.L.; Li, W.H.; Hu, Q. Diagenetic evolution and facies of the Shan23 reservoir in Su 77 and Zhao 51 blocks, Ordos basin. Geol. Explor. 2018, 54, 193–202. [Google Scholar]
  16. Xi, K.L.; Cao, Y.C.; Jahren, J.; Zhu, R.K.; Bjorlykke, K.; Haile, B.G.; Zheng, L.J.; Helge, H. Diagenesis and reservoir quality of the Lower Cretaceous Quantou Formation tight sandstones in the southern Songliao Basin, China. Sediment. Geol. 2015, 330, 90–107. [Google Scholar] [CrossRef]
  17. Loucks, R.G.; Ruppel, S.C. Mississippian Barnett Shale: Lithofacies and depositional setting of a deep-water shale-gas succession in the Fort Worth Basin, Texas. AAPG Bull. 2007, 91, 579–601. [Google Scholar] [CrossRef]
  18. Loucks, R.G.; Reed, R.M.; Ruppel, S.C.; Jarvie, D.M. Morphology, genesis, and distribution of nanometer-scale pores in siliceous mudstones of the Mississippian Barnett Shale. J. Sediment. Res. 2009, 79, 848–861. [Google Scholar] [CrossRef]
  19. Mbia, E.N.; Fabricius, I.L.; Krogsbøll, A.; Frykman, P.; Dalhoff, F. Permeability, compressibility and porosity of Jurassic shale from the Norwegian-Danish Basin. J. Pet. Geosci. 2014, 20, 257–281. [Google Scholar] [CrossRef]
  20. Medina, C.R.; Mastalerz, M.; Rupp, J.A. Characterization of porosity and pore-size distribution using multiple analytical tools: Implications for carbonate reservoir characterization in geologic storage of CO2. Environ. Geosci. 2017, 24, 51–72. [Google Scholar] [CrossRef]
  21. Dmitriy, A.M.; Shadfar, D.; Ali, K.; Masoud, R.; Yousef, K.; Ma, T.S. Multiscale and diverse spatial heterogeneity analysis of void structures in reef carbonate reservoirs. Geoenergy Sci. Eng. 2024, 233, 212569. [Google Scholar]
  22. Ali, A.A.; Namam, M.S.; Dmirriy, A.M. Paleoenvironmental Evaluation Using an Integrated Microfacies Evidence and Triangle Model Diagram: A Case Study from Khurmala Formation, Northeastern Iraq. J. Mar. Sci. Eng. 2023, 11, 2162. [Google Scholar]
  23. Dunsmuir, J.H.; Ferguson, S.R.; D’Amico, K.L.; Stokes, J.P. X-ray microtomography: A new tool for the characterization of porous media. In Proceedings of the SPE Annual Technical Conference and Exhibition, Dallas, TX, USA, 6–9 October 1991. [Google Scholar]
  24. Coenen, J.; Tchouparova, E.; Jing, X. Measurement parameters and resolution aspects of micro X-ray tomography for advanced core analysis. In Proceedings of the International Symposium of the Society of Core Analysts, Abu Dhabi, UAE, 5–9 October 2004. [Google Scholar]
  25. Attood, D. Microscopy: Nanotomography Comes of age. Nature 2006, 442, 642–643. [Google Scholar] [CrossRef]
  26. Sakdinawat, A.; Attwood, D. Nanoscale X-ray Imaging. Nat. Photonics 2010, 267, 840–848. [Google Scholar]
  27. Bai, B.; Zhu, R.K.; Wu, S.T.; Yang, W.J.; Jeff, G.; Allen, G.; Zhang, X.X.; Ling, S. Multi-scale method of Nano(Micro)-CT study on microscopic pore structure of tight sandstone of Yanchang Formation, Ordos Basin. Pet. Explor. Dev. 2013, 40, 329–333. [Google Scholar] [CrossRef]
  28. Zhang, F.F. Characterization and evaluation of pore-throat structures in ultra-low permeability and tight sandstones and their impacts on petropysical properties: A case study of the lower Cretace-ous in northern Songliao Basin. J. Northeast Pet. Univ. 2018, 42, 54–62+8-9. [Google Scholar]
  29. Jiang, F.J.; Jia, C.Z.; Pang, X.Q.; Zhang, C.L. Upper Paleozoic total petroleum system and geological model of natural gas enrichment in Ordos Basin, NW China. Pet. Explor. Dev. 2003, 50, 250–261. [Google Scholar] [CrossRef]
  30. Li, J. Sedimentary Facies Analysis and Its Influence on Reservoirs in Hangjinqi area Lower Shihezi Formation. Master’s Thesis, Chengdu University of Technology, Chengdu, China, 2013. [Google Scholar]
  31. Xue, H.; Zhang, J.C.; Wang, Y.; Xu, B.; Guo, H.Q. Relationship Between Tectonic Evolution and Hydr-ocarbon in Hangjinqi Block of North Ordos Basin. Geotecton. Metallog. 2009, 33, 206–214. [Google Scholar]
  32. Li, Y.L.; Zhang, Y.F.; Cong, L.; Xie, Z.; Yan, J.M. Application of X-CT Scanning Technique in the Characterization of Micro Pore Structure of Tight Sandstone Reservoir: An Example from Fuyu Oil Layer in Daan Oilfield. J. Jilin Univ. 2016, 46, 379–387. [Google Scholar]
  33. Dennis, D. Robust determination of porespace morphology in sedimentary rocks. Pet. Technol. 2004, 56, 69–70. [Google Scholar]
  34. Dai, Z.; Luo, D.L.; Xie, M.Y. A new method for particle size analysis of cutti-ngs images based on improved watershed algorithm. China Offshore Oil Gas 2019, 31, 103–107. [Google Scholar]
  35. Liu, F.; Zhou, W.; Li, X.H.; Xie, R.C.; Li, L.; Liu, F.; Zhou, W.; Li, X.H.; Xie, R.C.; Li, L. Analysis of Characteritics of the Clay minerals In the Up-per Palaeozoic Sandstone Reservoir of Hangjinqi Area in North Ordos Basin. Mineral. Petrol. 2006, 26, 92–97. [Google Scholar]
  36. He, Y.B.; Wang, W.G. Sedimentary Rocks and Sedimentary Phases; Petroleum Industry Press: Beijing, China, 2007; pp. 61–63. [Google Scholar]
  37. Qiu, L.W.; Mu, X.J.; Li, H.; Zhang, J.; Ge, J.; Xu, S.; Zhou, S.B. Characteristics of detritus development in the Permian lower Shihezi Formation in Hangjinqi area and its influence on reservoir physical properties. Oil Gas Geol. 2019, 40, 24–33. [Google Scholar]
  38. Wu, Y.Q.; Tahmasebi, P.; Lin, C.Y.; Zahid, M.A.; Dong, C.M.; Golab, A.N.; Ren, L.H. A comprehensive study on geometric, topological and fractal characterizations of pore systems in low-permeability reservoirs based on SEM, MICP, NMR, and X-ray CT experiments. Mar. Pet. Geol. 2019, 103, 12–28. [Google Scholar] [CrossRef]
  39. Li, X.B. Characterization of Pore Structure and Simulation of Elasticity and Permeability Based on 3D Digital Cores. Ph.D. Thesis, China University of Geosciences, Wuhan, China, 2021. [Google Scholar]
  40. Chen, C.B.; Fu, L.; Chen, X.J.; Zhang, T.; Xie, Y.H.; Wang, H.B.; Zhu, Y.S. Quantitative Evaluation Method for Micro Heter-ogeneity of Tight Sandstone: A case study of Chang-6 reservoir of Yanchang Formationin Huaqing area, Ordos Basin. Acta Sedimentol. Sin. 2021, 39, 1086–1099. [Google Scholar]
Figure 1. (a) Location of study area; (b) lithologic histogram of destination; (c) profile of the study area.
Energies 17 00399 g001
Figure 2. Rock type triangulation of the studied section (modified from [12]).
Energies 17 00399 g002
Figure 3. Microscopic photograph of a typical rock type. (a) Gravelly, coarse-grained clastic quartz sandstone, 3514.63 m; (b) gravelly, coarse-grained clastic quartz sandstone, 3515.31 m; (c) sandy conglomerate, 3516.07 m; (d) gravelly, coarse-grained clastic quartz sandstone, 3514.70 m; (e) sandy conglomerate, 3516.51 m; (f) gravelly, coarse-grained clastic quartz sandstone, 3515.57 m.
Energies 17 00399 g003
Figure 4. CT scan image of 25 mm diameter samples. (a) Gravelly, coarse-grained clastic quartz sandstone, 3514.50 m; (b) gravelly, coarse-grained clastic quartz sandstone, 3515.41 m; (c) gravelly, coarse-grained clastic quartz sandstone, 3515.59 m; (d) sandy conglomerate, 3516.03 m; (e) sandy conglomerate, 3516.91 m; (f) sandy conglomerate, 3517.51 m.
Energies 17 00399 g004
Figure 5. Segmentation image of quartz particles. (a) Gravelly, coarse-grained clastic quartz sandstone, 3514.50 m; (b) gravelly, coarse-grained clastic quartz sandstone, 3515.41 m; (c) gravelly, coarse-grained clastic quartz sandstone, 3515.59 m; (d) sandy conglomerate, 3516.03 m; (e) sandy conglomerate, 3516.91 m; (f) sandy conglomerate, 3517.51 m.
Energies 17 00399 g005
Figure 6. Frequency distribution of quartz grain size.
Energies 17 00399 g006
Figure 7. The porosity–permeability relationship.
Energies 17 00399 g007
Figure 8. CT scan image and spatial spread of microcracks. (a) Gravelly, coarse-grained clastic quartz sandstone, 3513.96 m; (b) sandy conglomerate, 3517.02 m.
Energies 17 00399 g008
Figure 9. Spatial distribution of microscopic pores. (a) Gravelly, coarse-grained clastic quartz sandstone, 3515.41 m; (b) gravelly, coarse-grained clastic quartz sandstone, 3515.59 m; (c) sandy conglomerate, 3516.91 m; (d) sandy conglomerate, 3517.51 m.
Energies 17 00399 g009
Figure 10. “Maximum ball algorithm” pore–throat bat model. (a) Gravelly, coarse-grained clastic quartz sandstone, 3515.41 m; (b) gravelly, coarse-grained clastic quartz sandstone, 3515.59 m; (c) sandy conglomerate, 3516.91 m; (d) sandy conglomerate, 3517.51 m.
Energies 17 00399 g010
Figure 11. Distribution of microstructural parameters of the pore throat. (a) Probability distribution of throat radius; (b) probability distribution of pore radius; (c) probability distribution of pore shape factor; (d) probability distribution of throat shape factor.
Energies 17 00399 g011
Figure 12. The relationship between quartz particle size and pore throat radius. (a) Relationship between quartz particle size and pore radius; (b) relationship between quartz particle size and throat radius.
Energies 17 00399 g012
Table 1. Quartz grain size parameters.
Serial NumberLithologyParticle Size/μm
MinimumMaximumMeanMedian
1Gravelly, coarse-grained clastic quartz sandstone47.062090.71426.63408.59
247.221541.39510.91479.69
344.981543.47434.57419.88
4Sandy conglomerate46.093157.04494.64474.92
548.152006.57472.73451.23
646.091644.26488.97463.52
Table 2. Microstructural parameters of the aperture throat.
Serial NumberLithologyPore Radius/μmThroat Radius/μmCoordination Number
MaximumMeanMaximumMeanMaximumMean
1Gravelly, coarse-grained clastic quartz sandstone164.65415.27467.2986.788553
295.30414.89560.6486.223452
3113.06413.67257.2875.847463
4Sandy conglomerate161.81917.14199.3547.841974
5140.17819.31983.3398.289614
6158.94317.10990.6007.886764
Disclaimer/Publisher’s Note: The statements, opinions and data contained in all publications are solely those of the individual author(s) and contributor(s) and not of MDPI and/or the editor(s). MDPI and/or the editor(s) disclaim responsibility for any injury to people or property resulting from any ideas, methods, instructions or products referred to in the content.

