
Allowable Pillar Width for Salt Cavern Gas Storage Based on Triangular Well Layout: A Case Study in China


Abstract
1. Introduction
- For shallow caves (top of the rock salt layer at a depth of 600 m), the grid spacing should be at least 3.5 D.
- For caves located at moderate depths (top of rock salt layer at 1000 m depth), the grid spacing should be at least 4.0 D.
2. Background of Jintan Salt Mine
3. Numerical Simulation
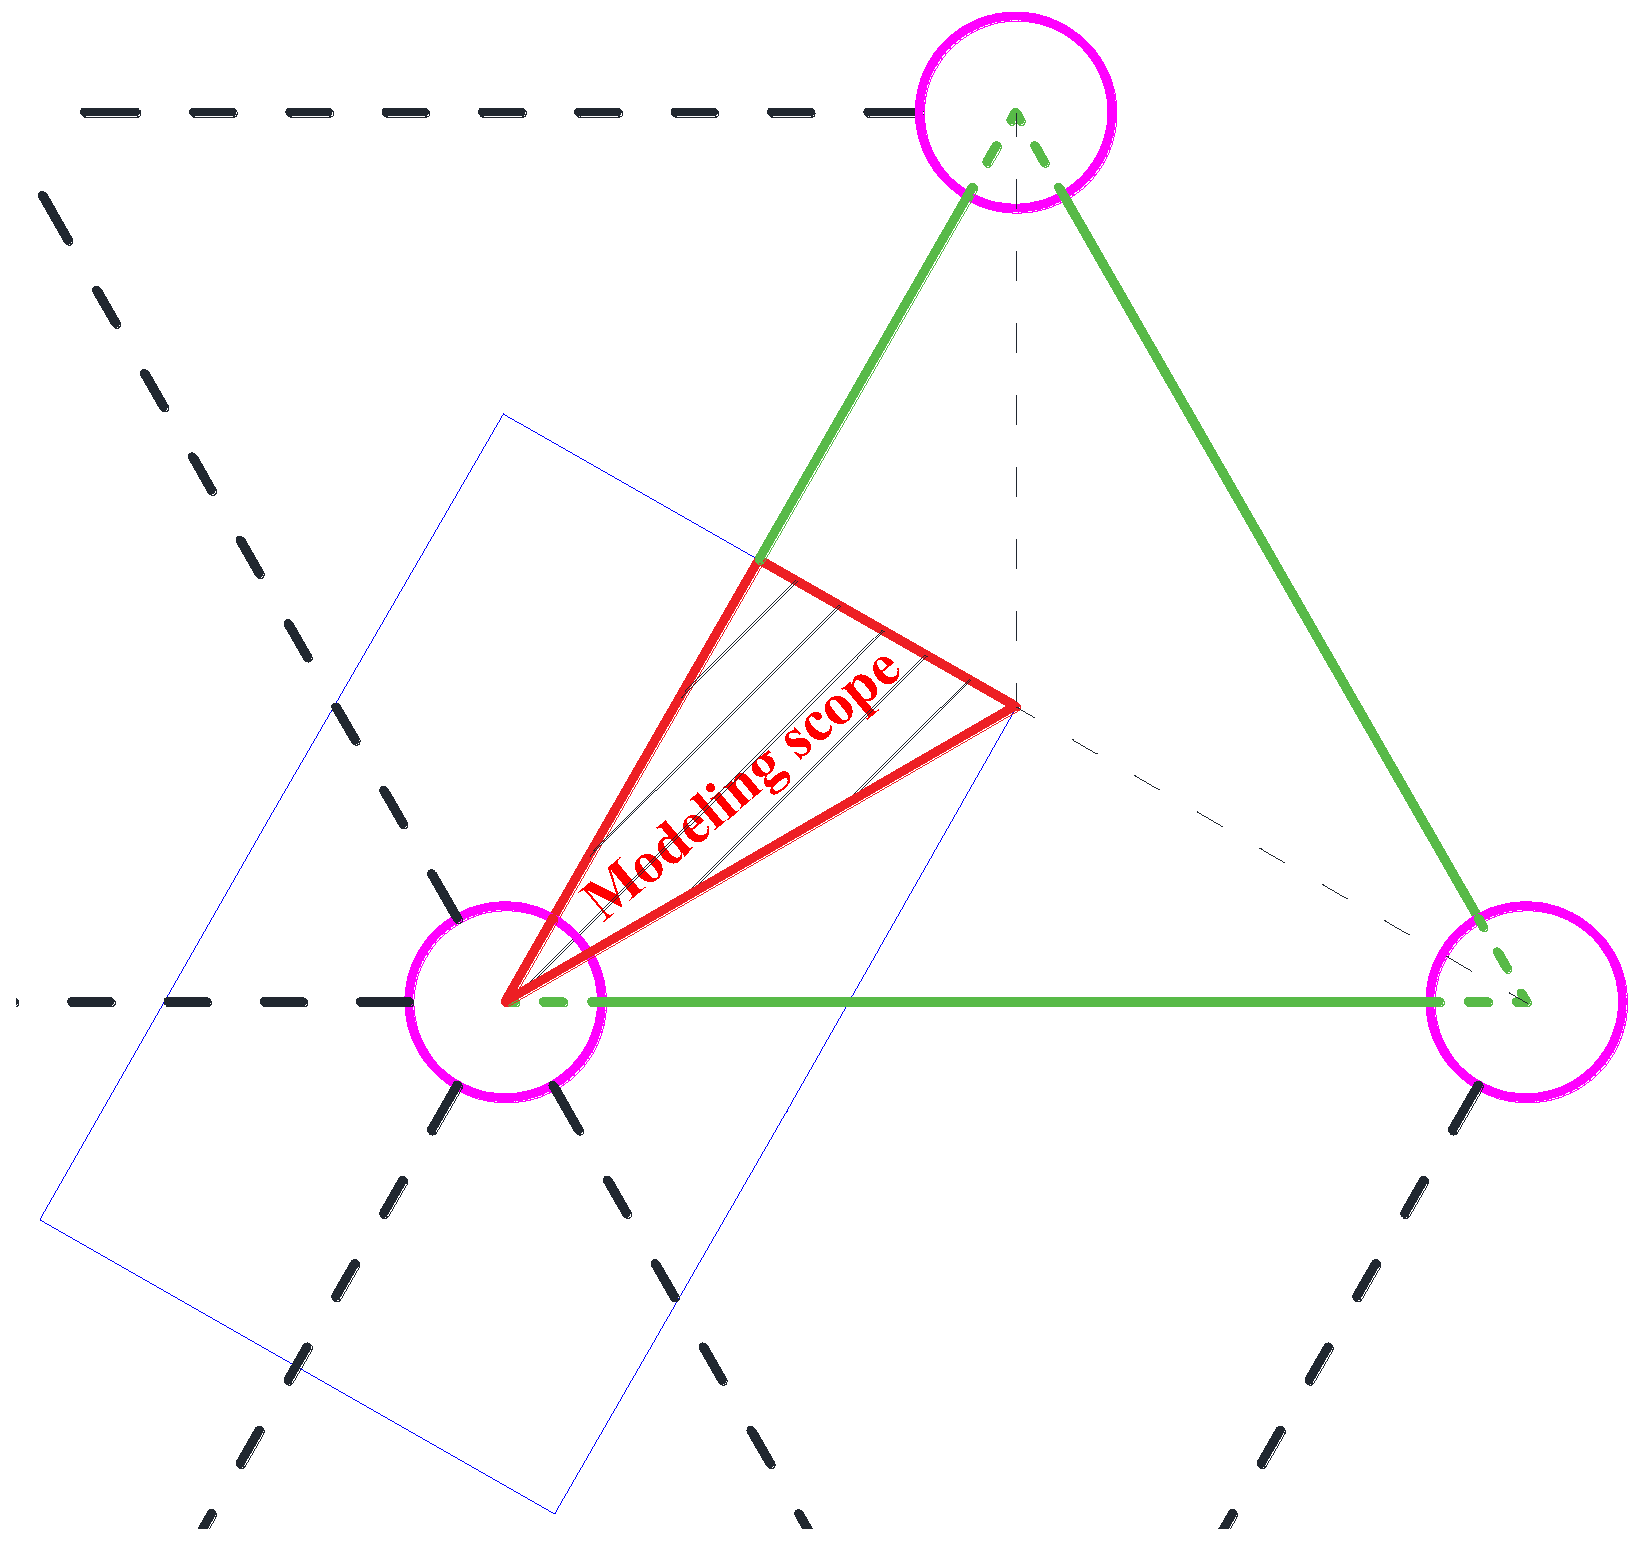
3.1. 3D Geomechanical Model
3.2. Determination of Parameters
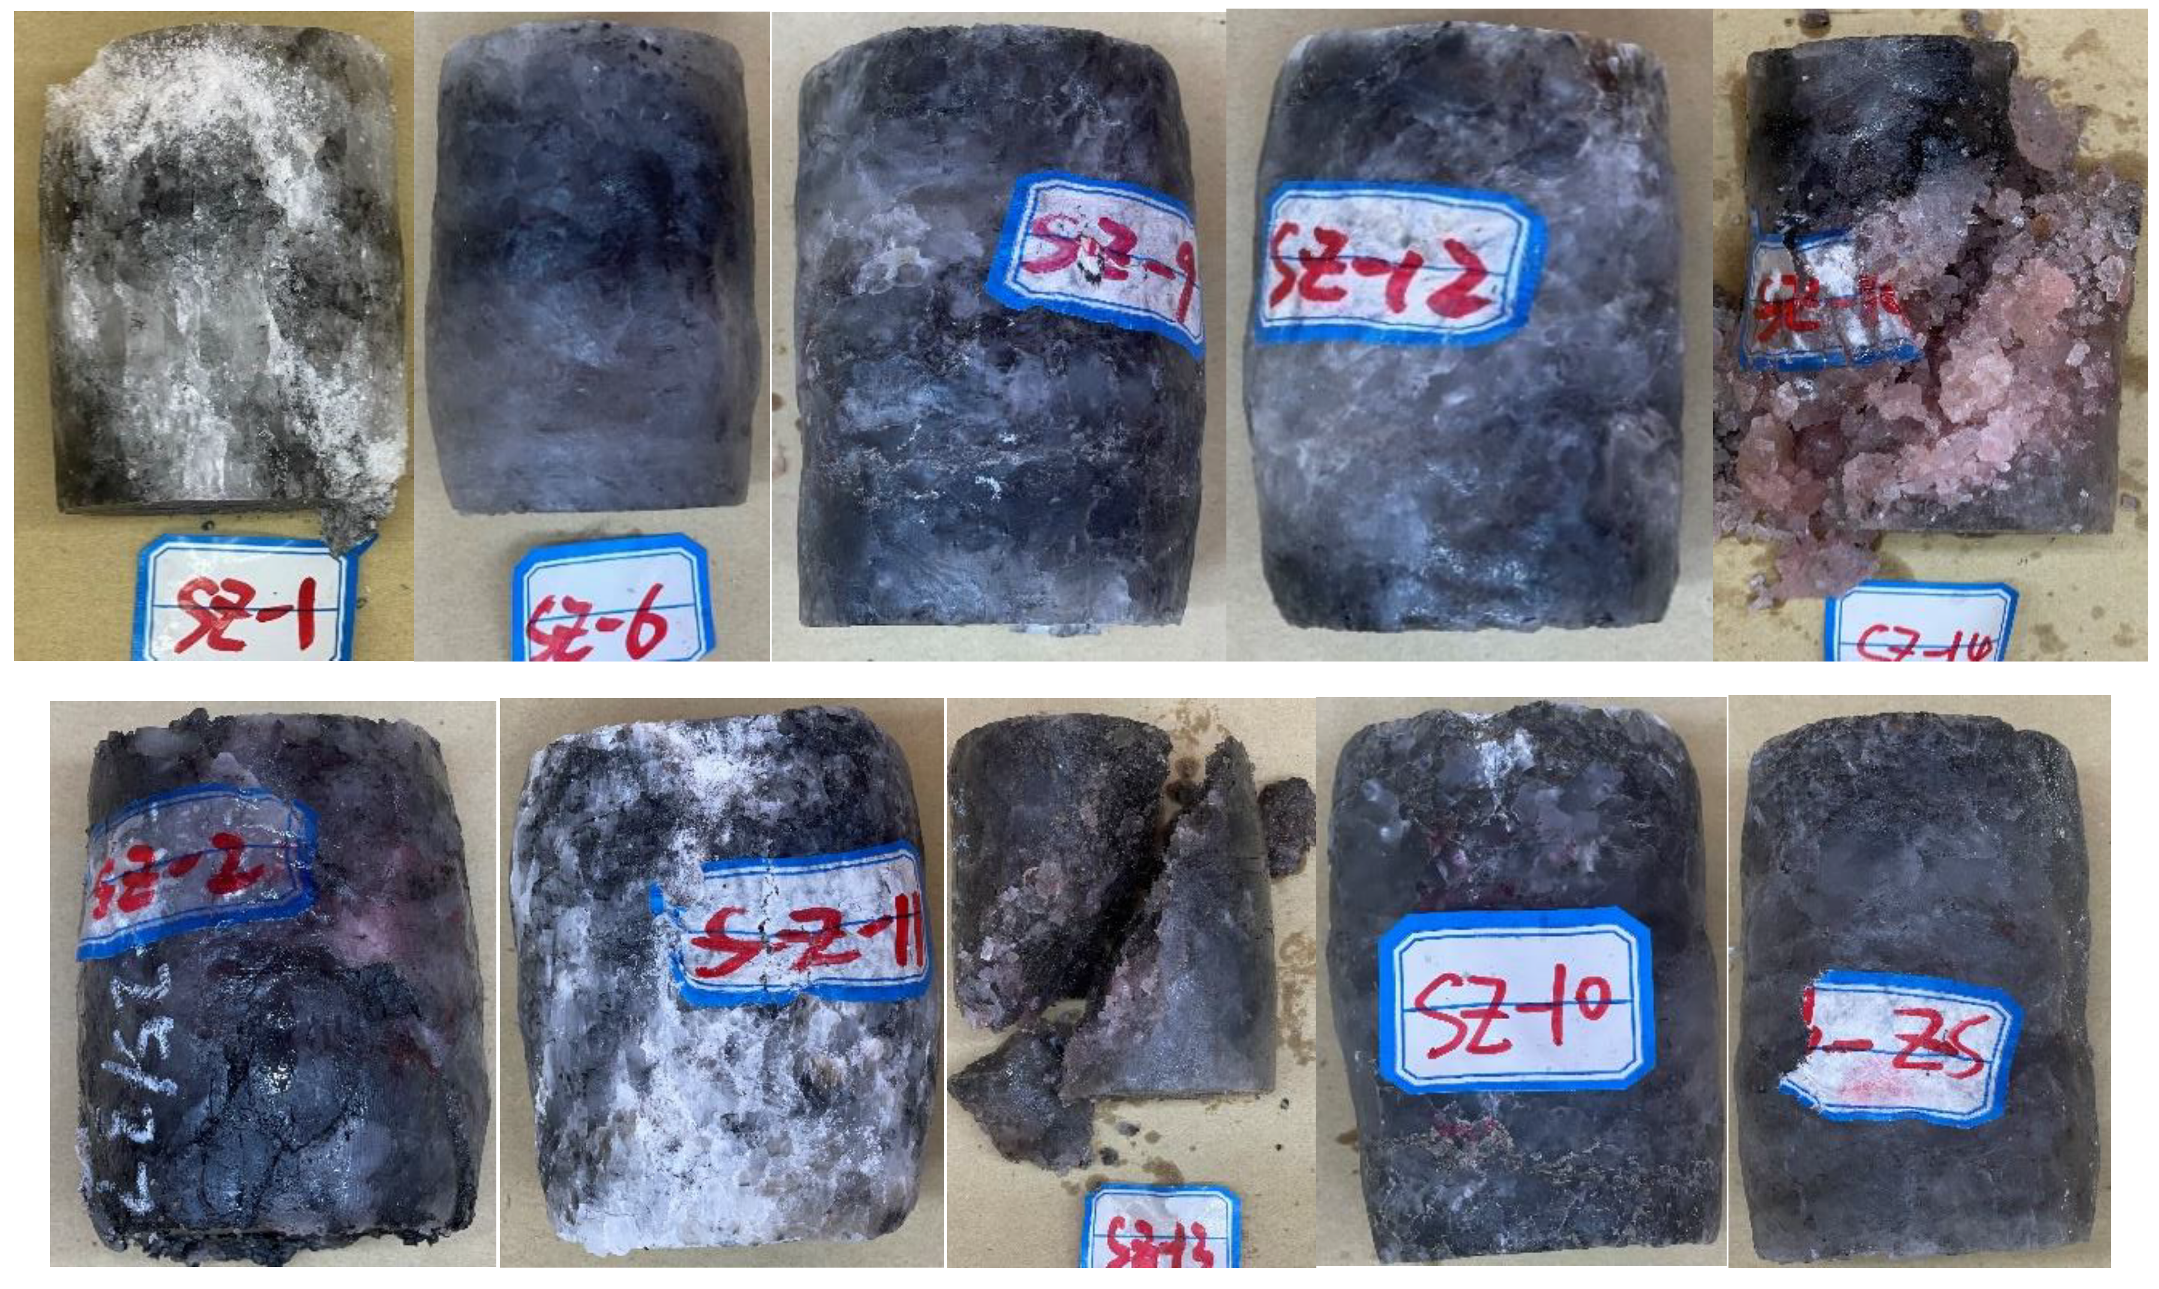
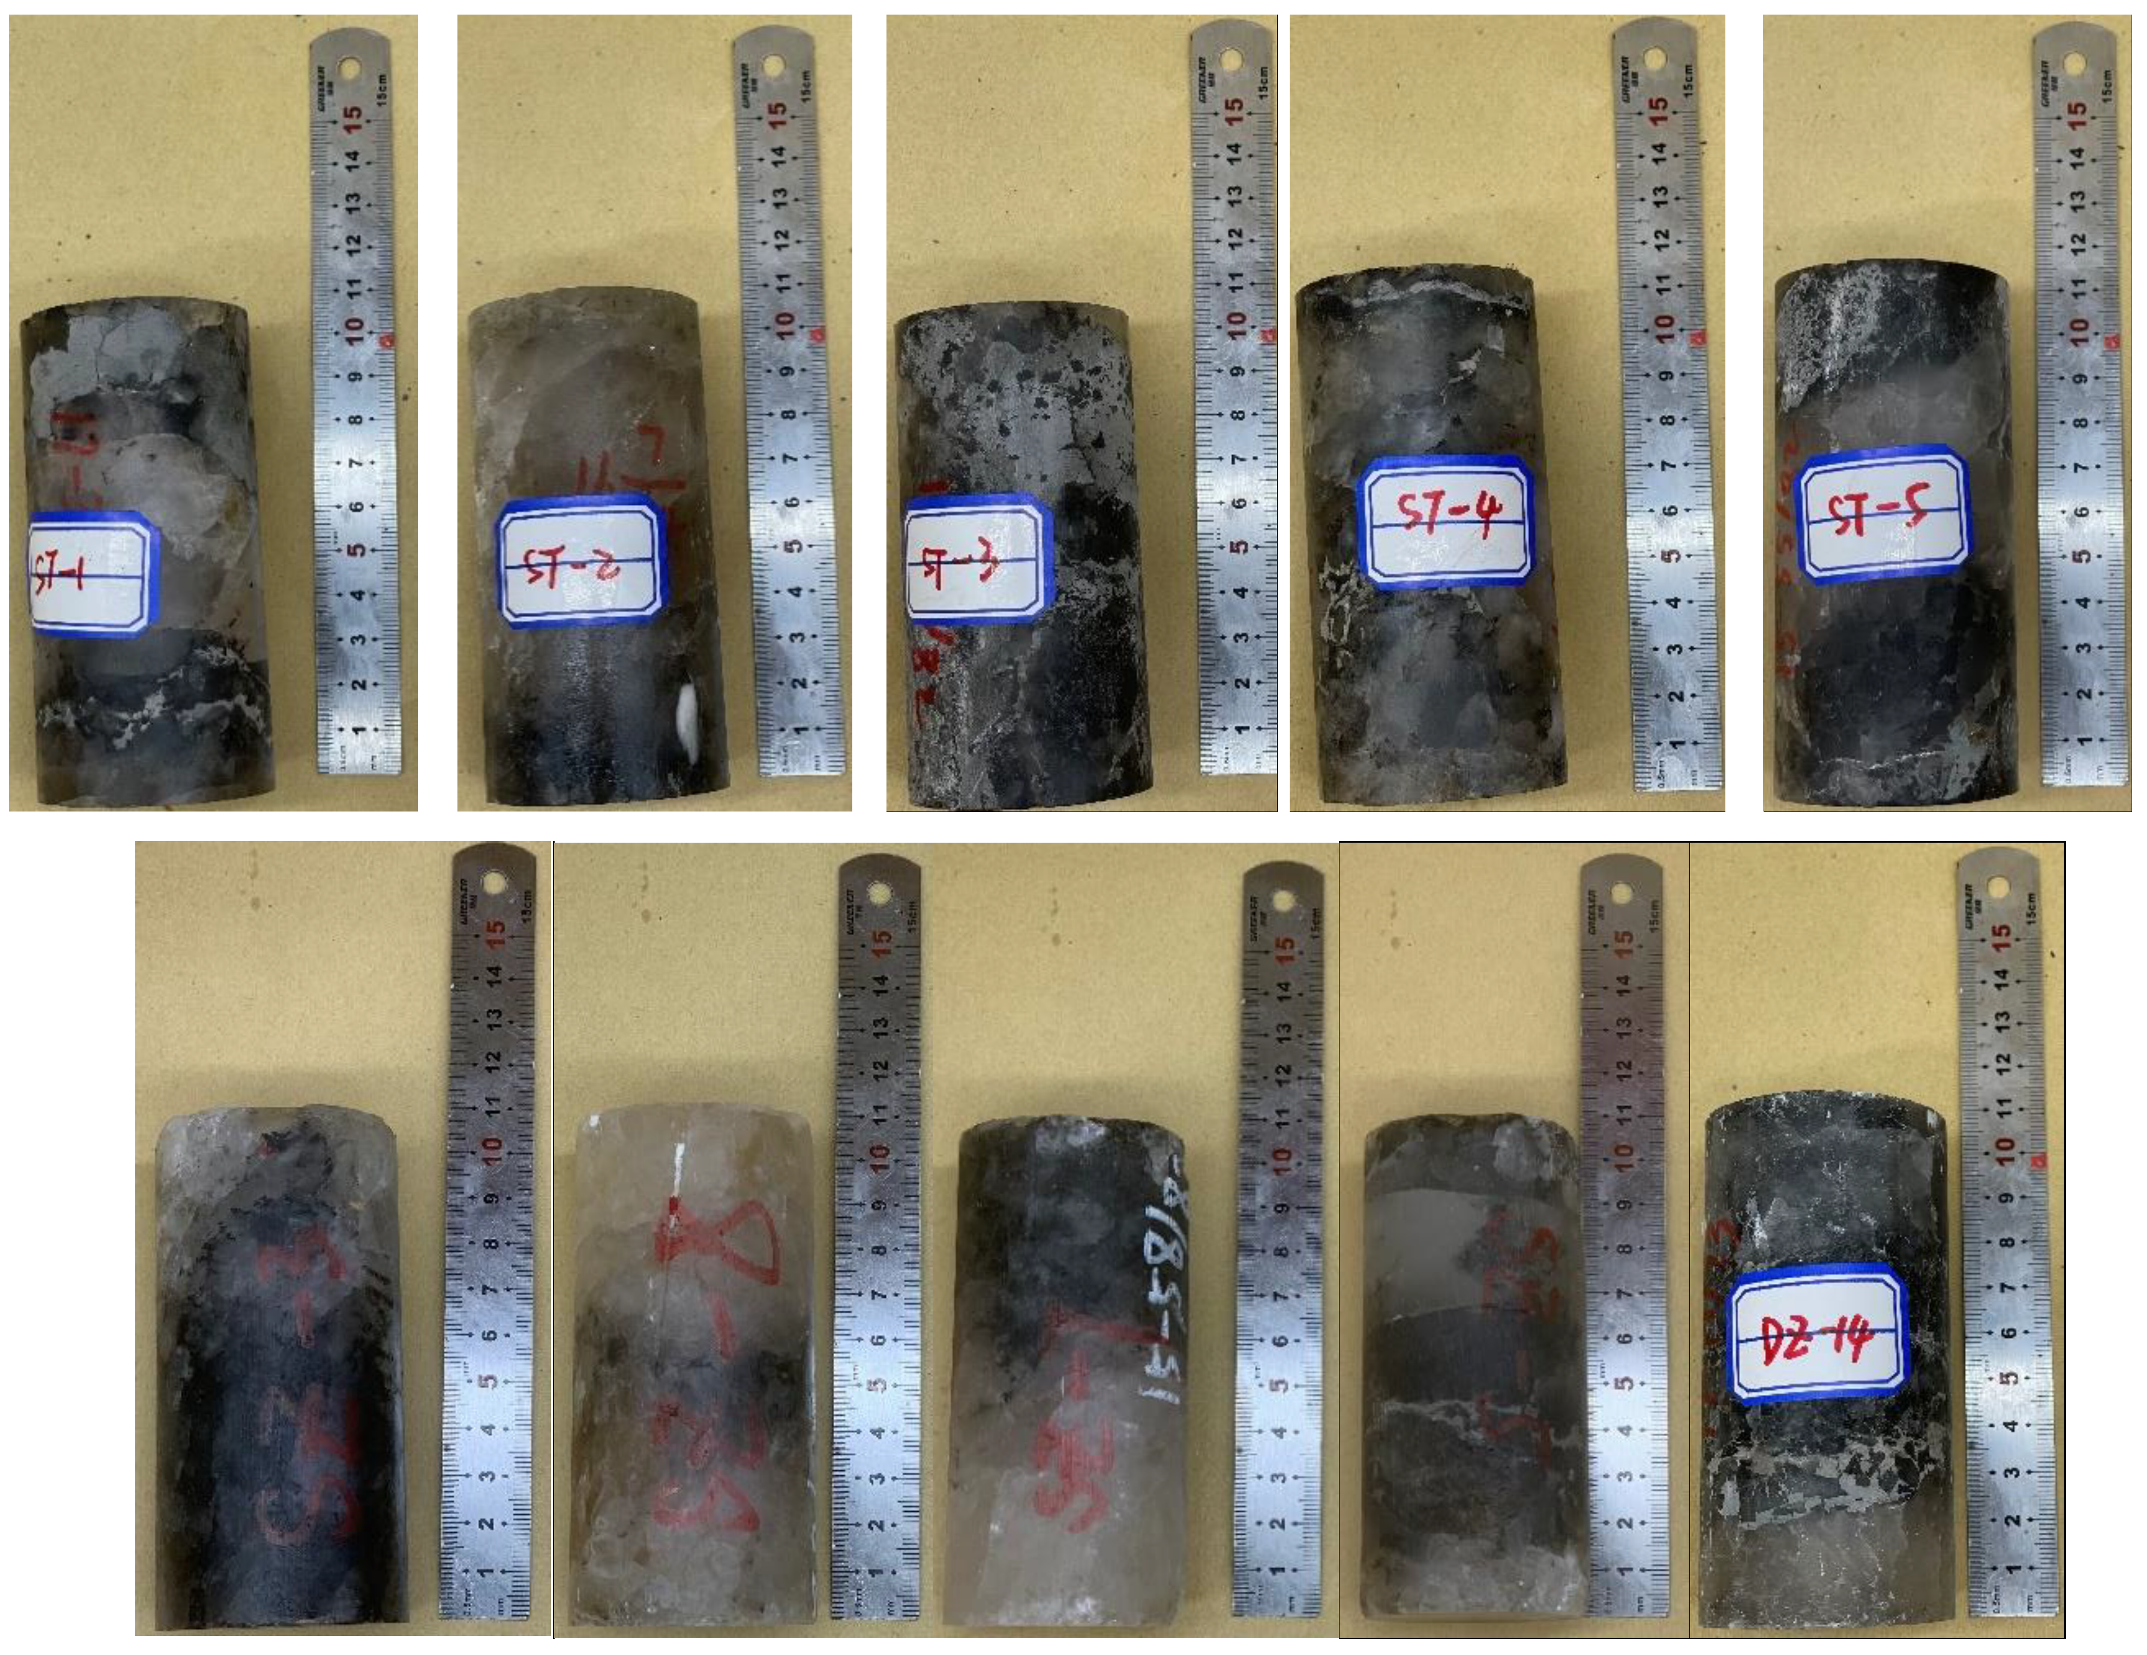
3.2.1. Experimental Analysis
3.2.2. Settled Parameters
4. Results and Analysis
4.1. Stability Analysis
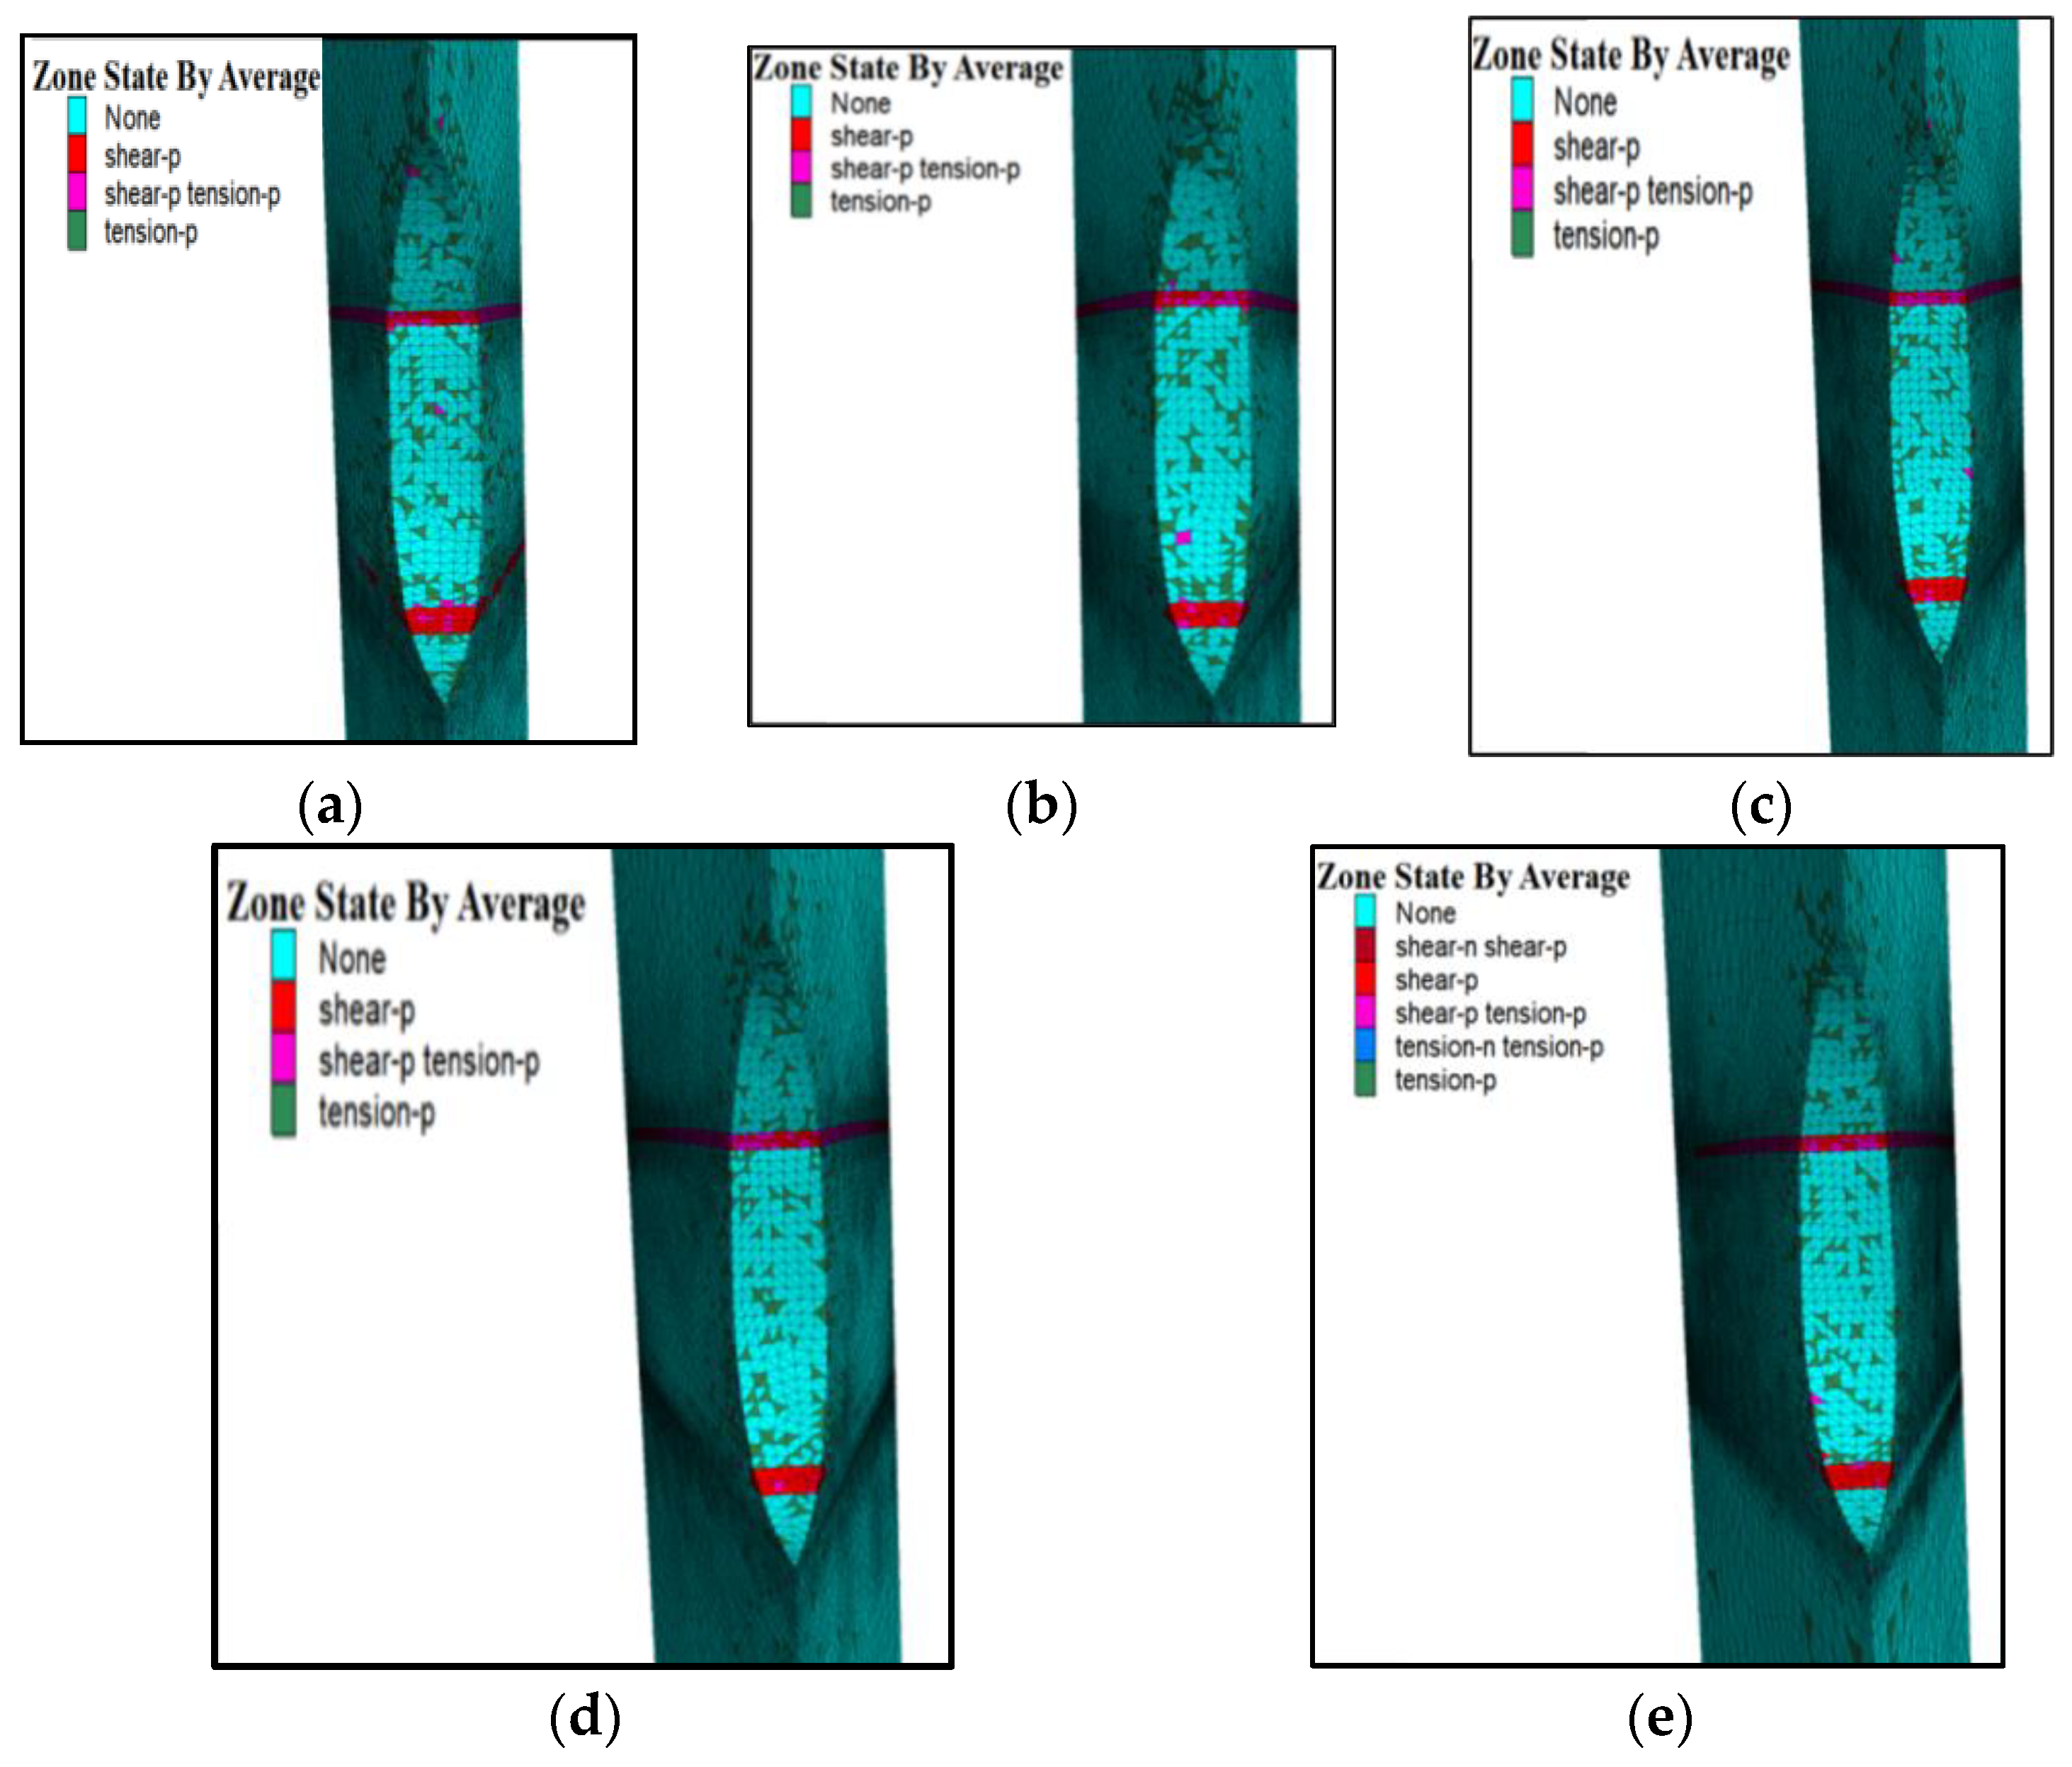
4.1.1. Plastic Zone
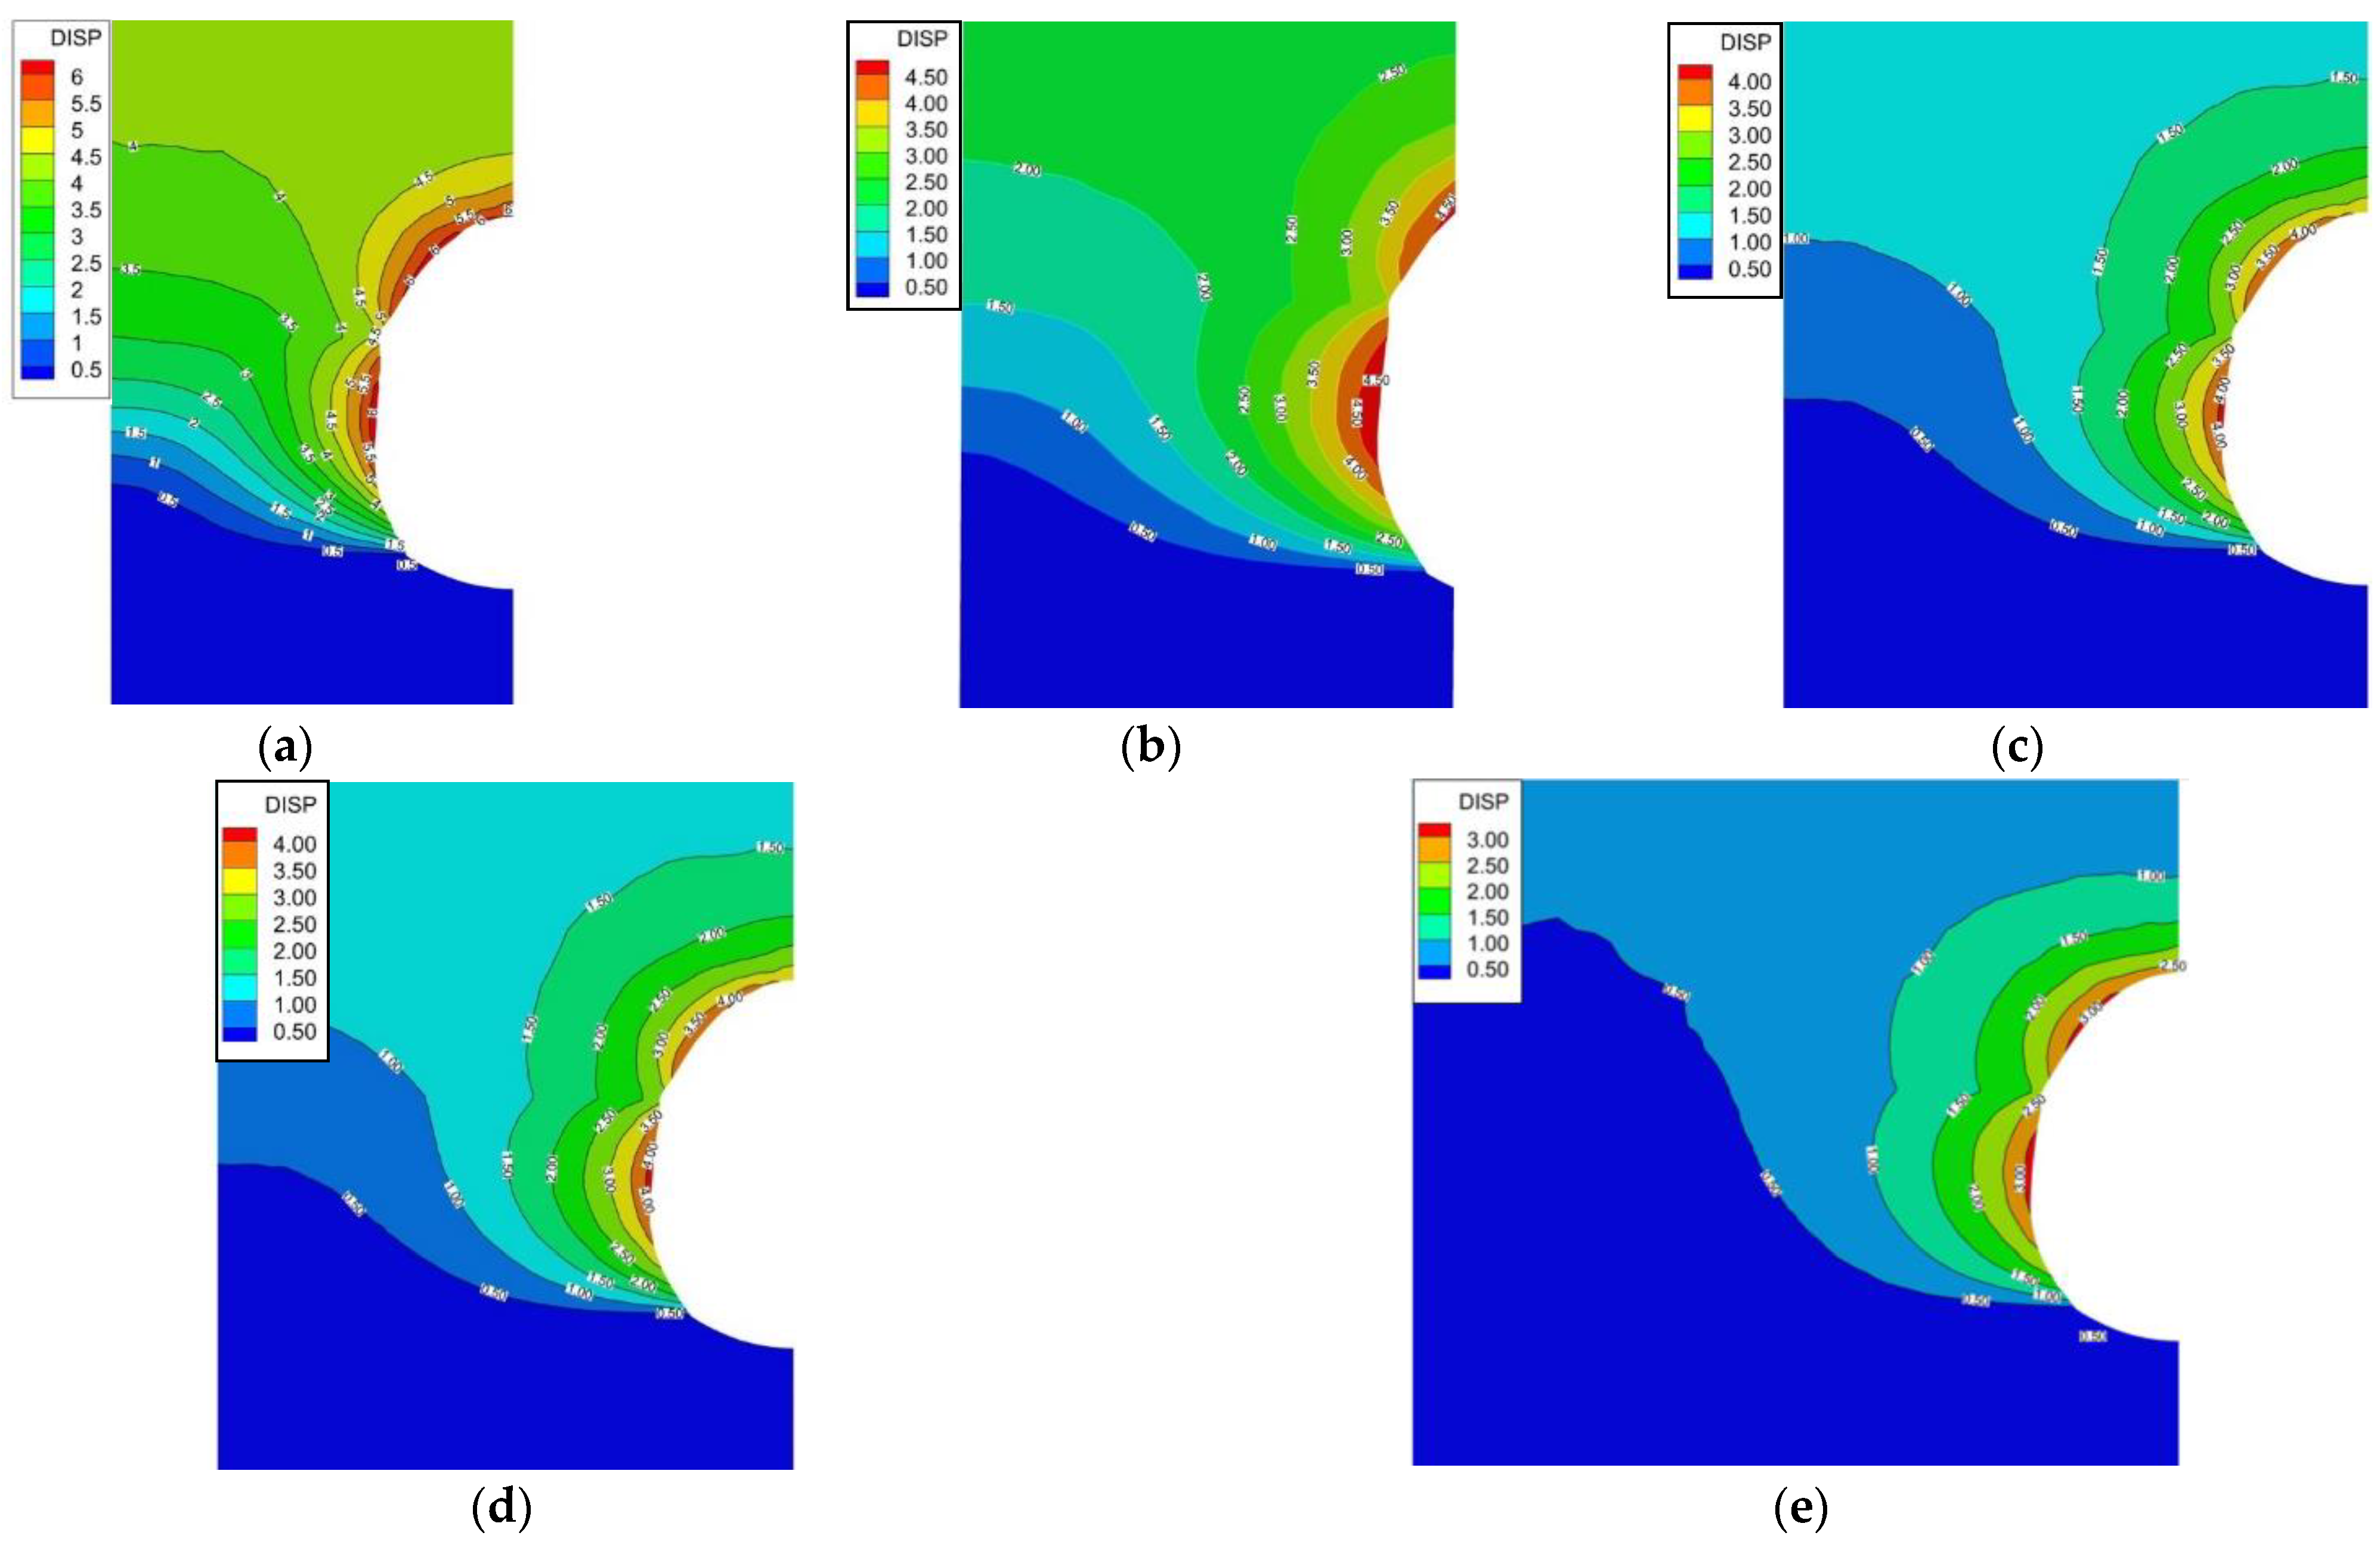
4.1.2. Displacement
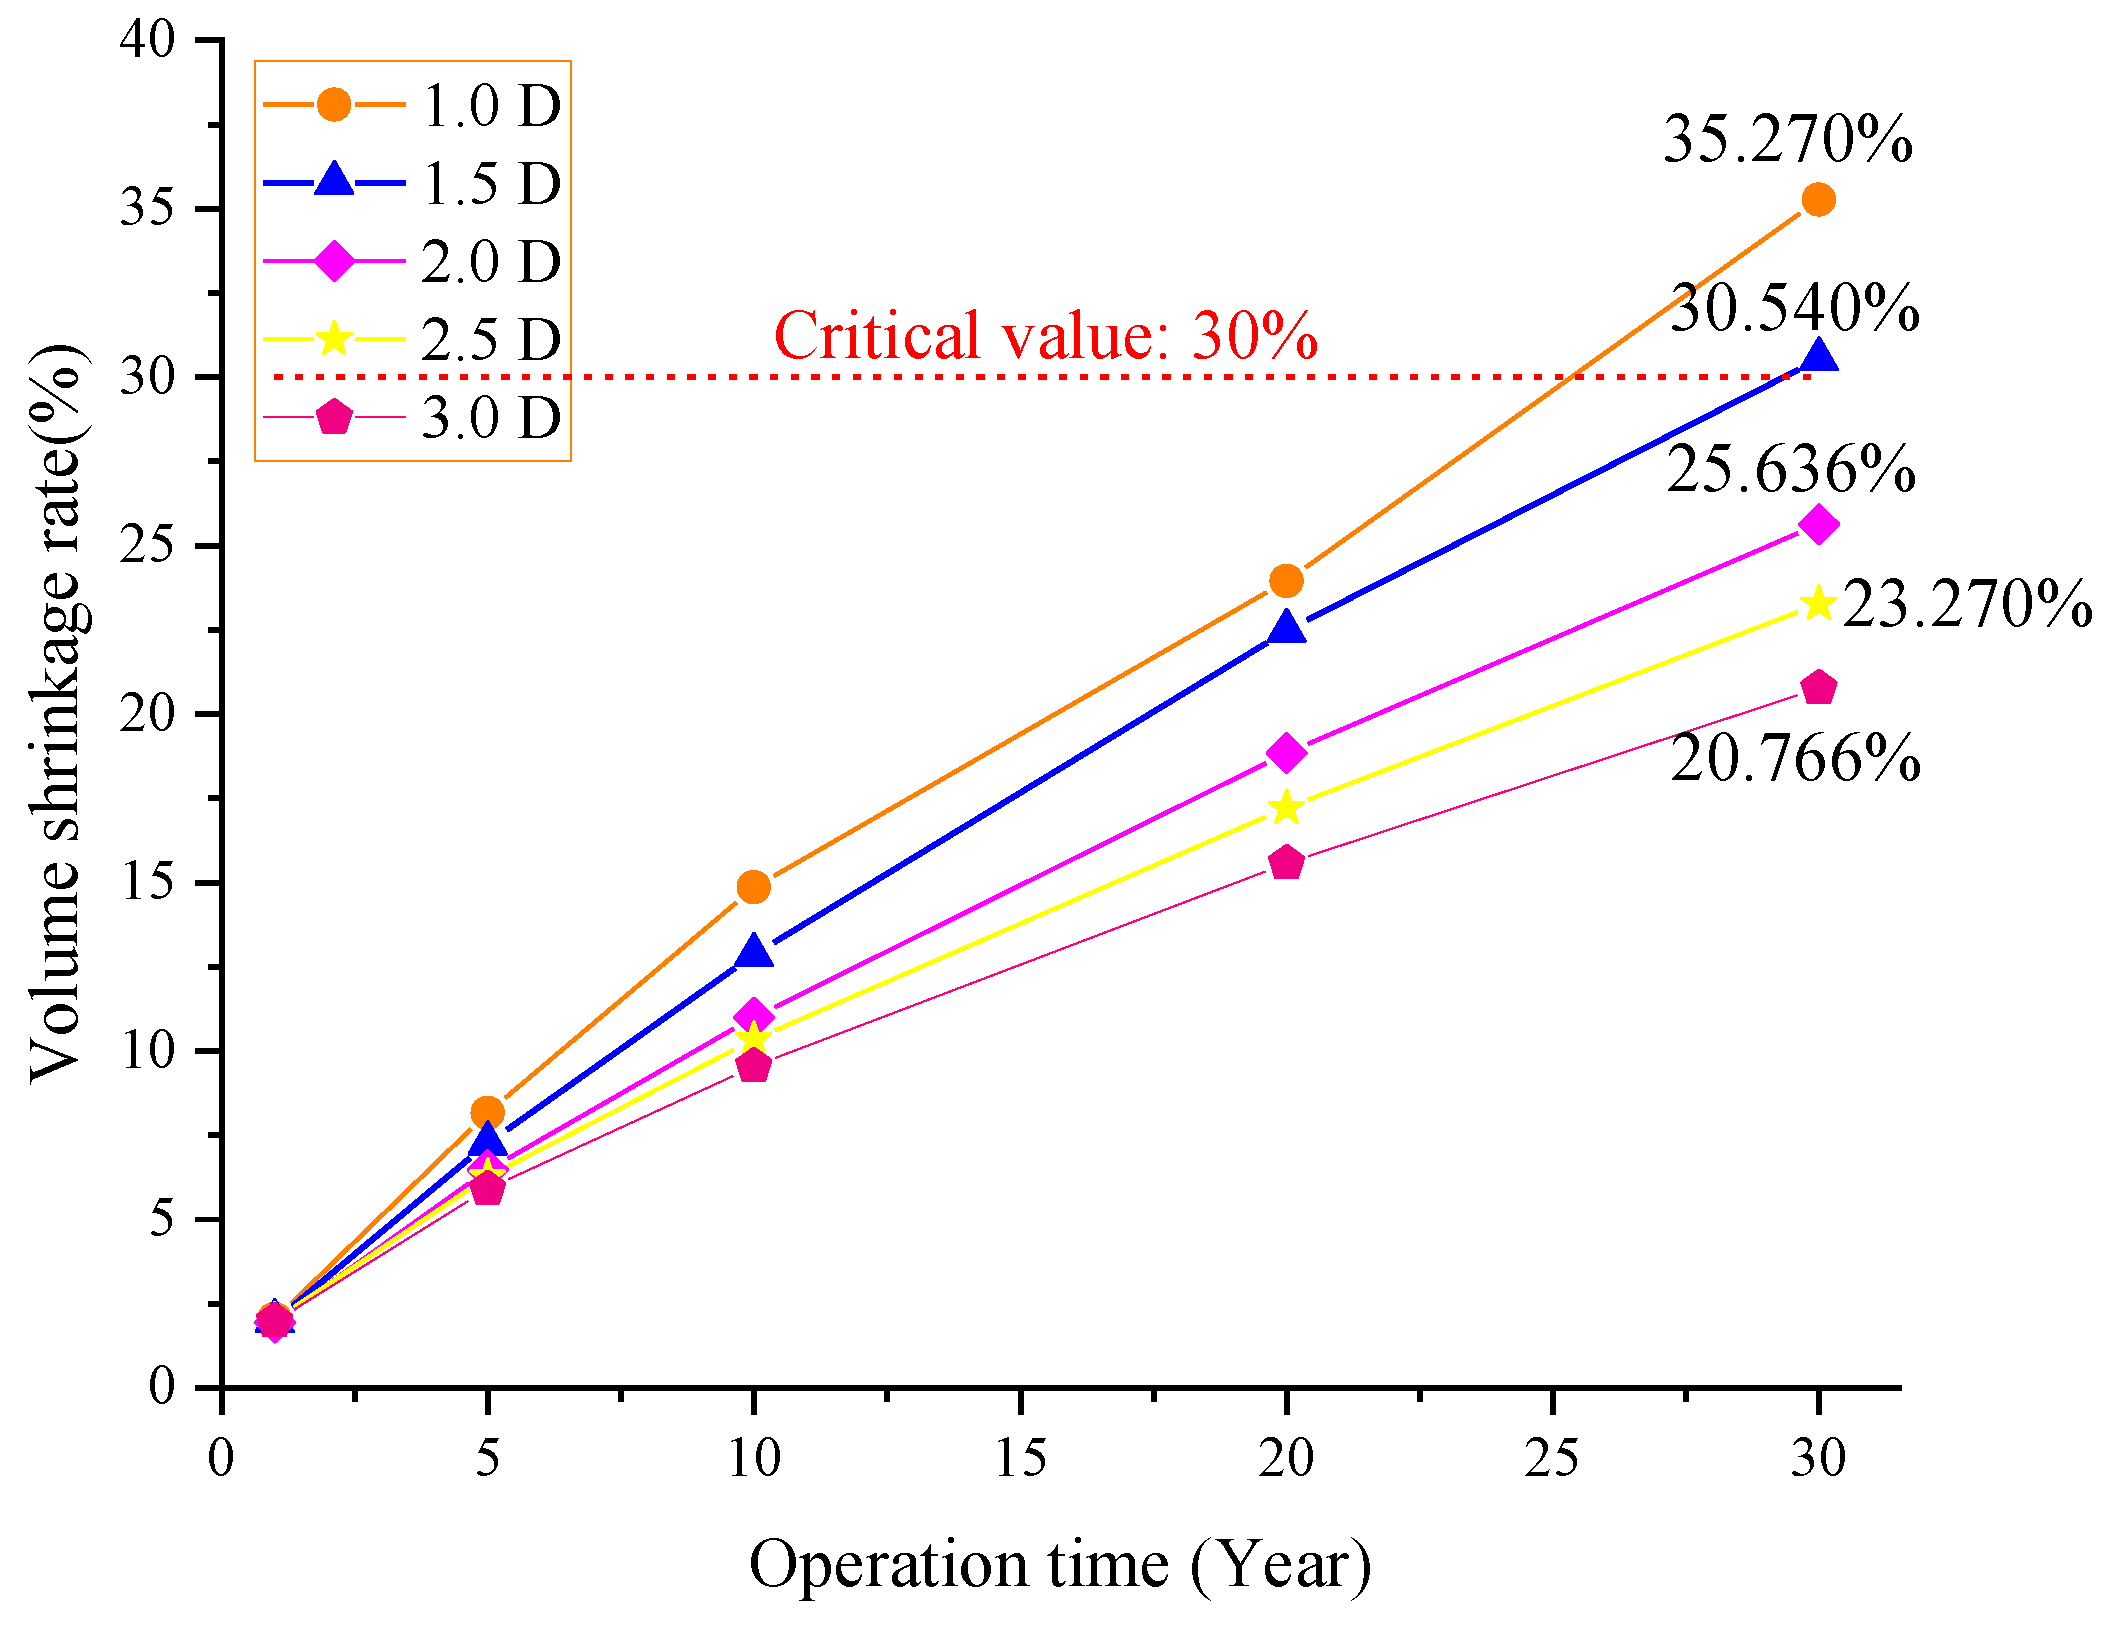
4.1.3. Volume Shrinkage
4.1.4. Dilatancy Safety Factor
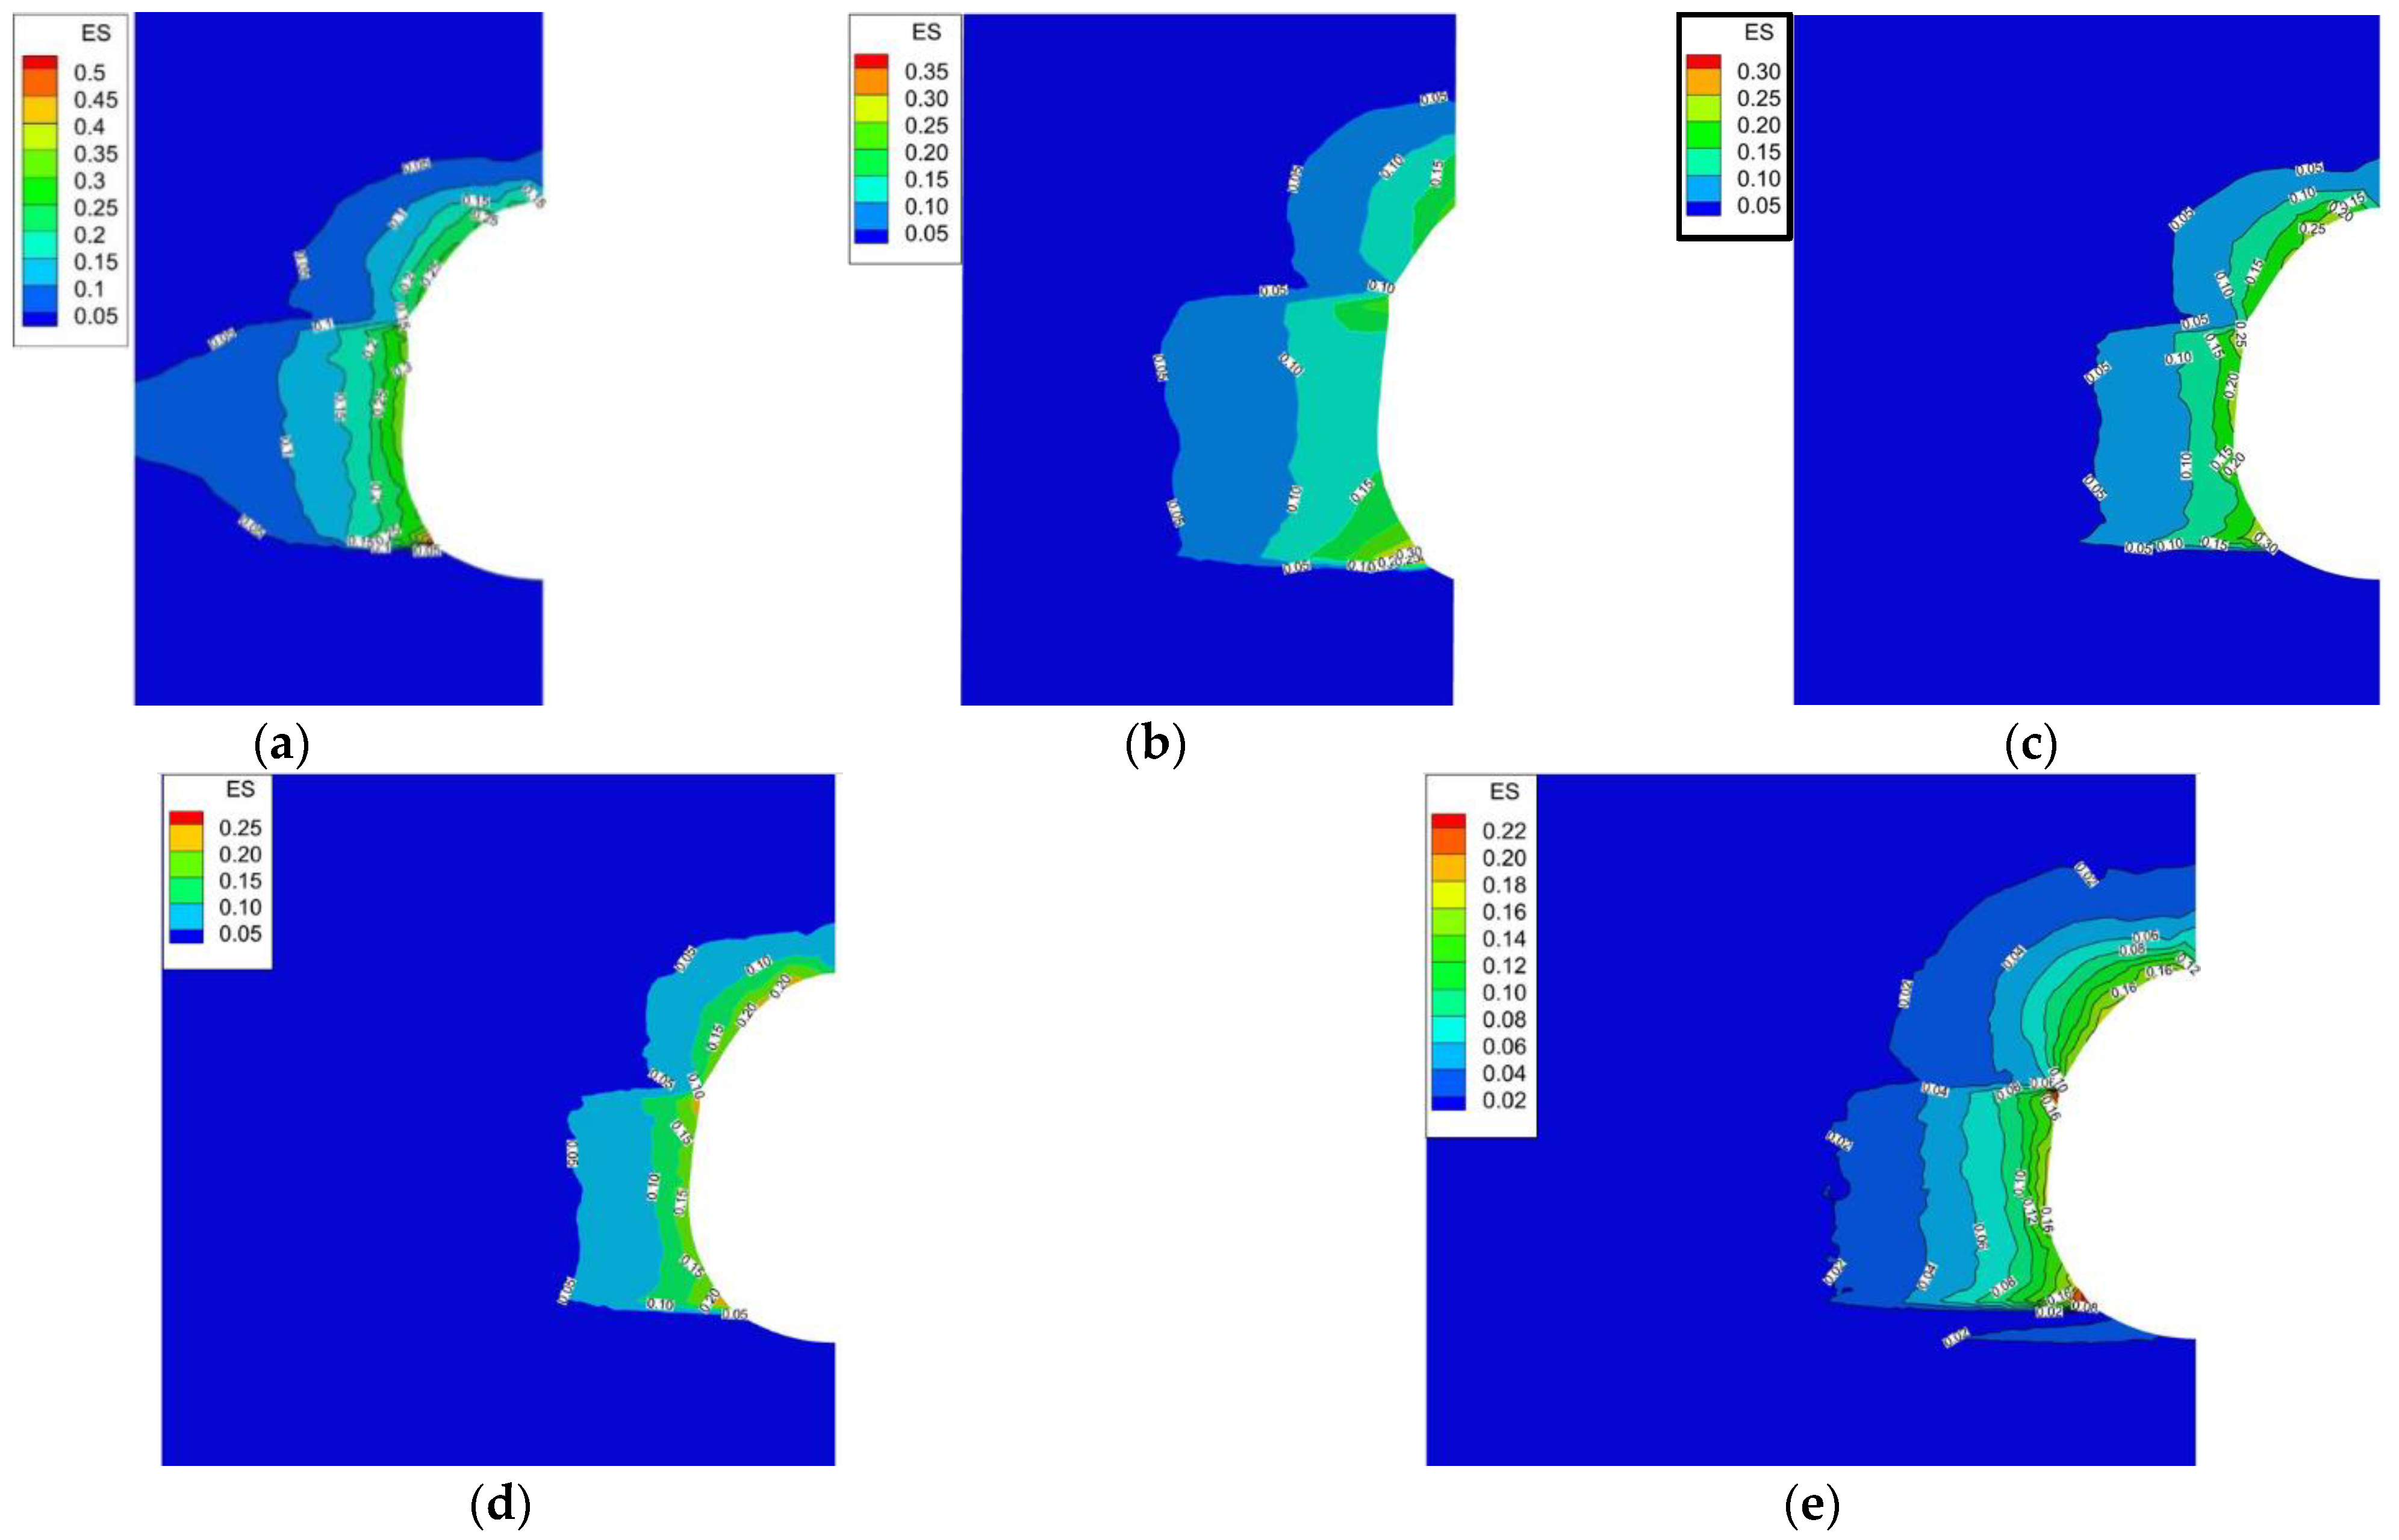
4.1.5. Equivalent Strain
4.2. Tightness Analysis
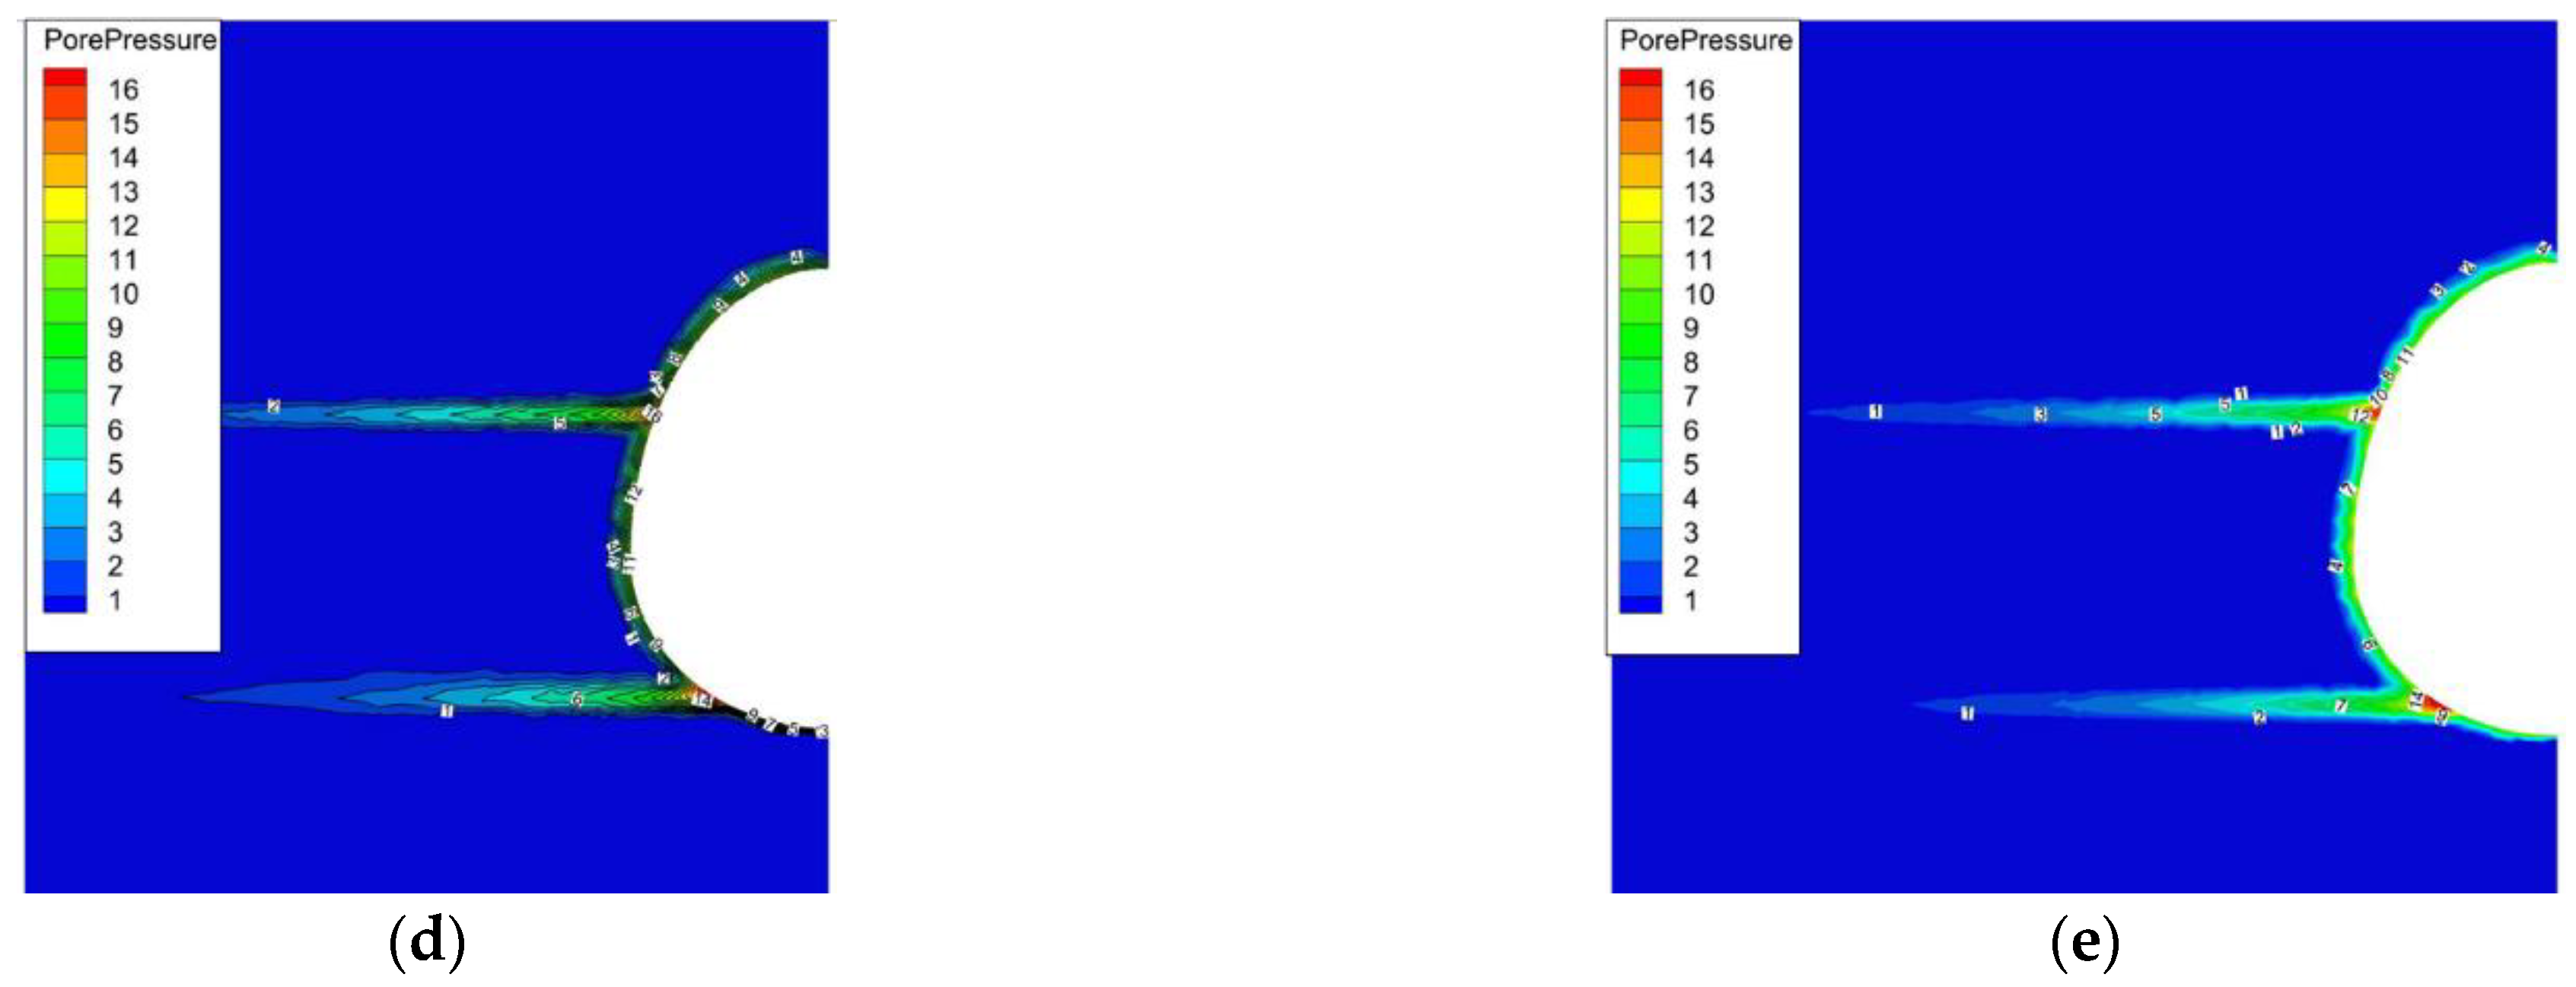
4.2.1. Seepage around the Salt Cavern USG
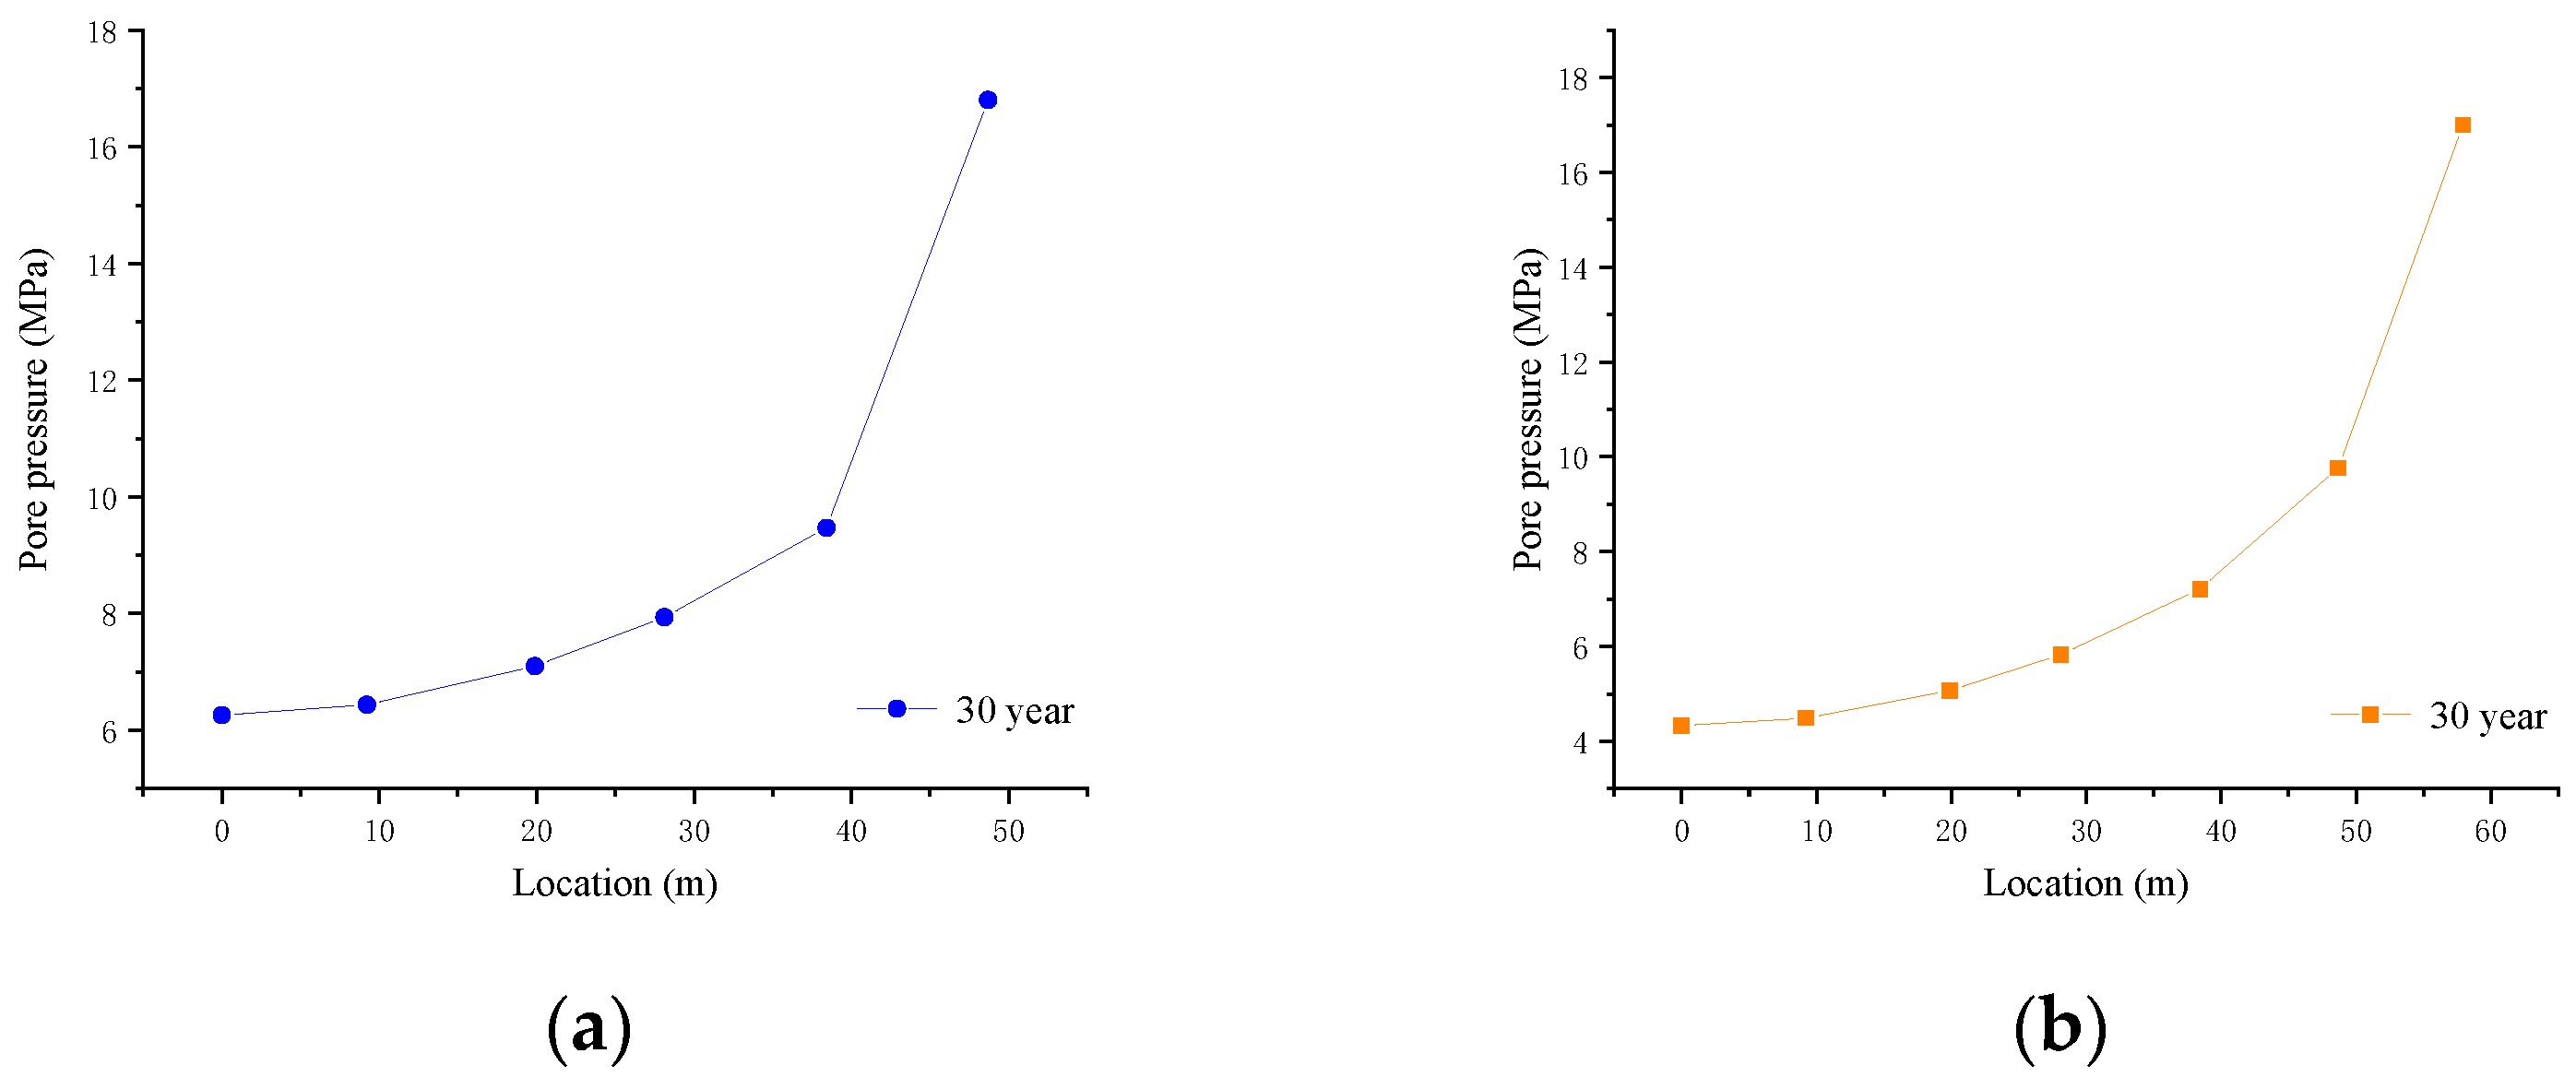
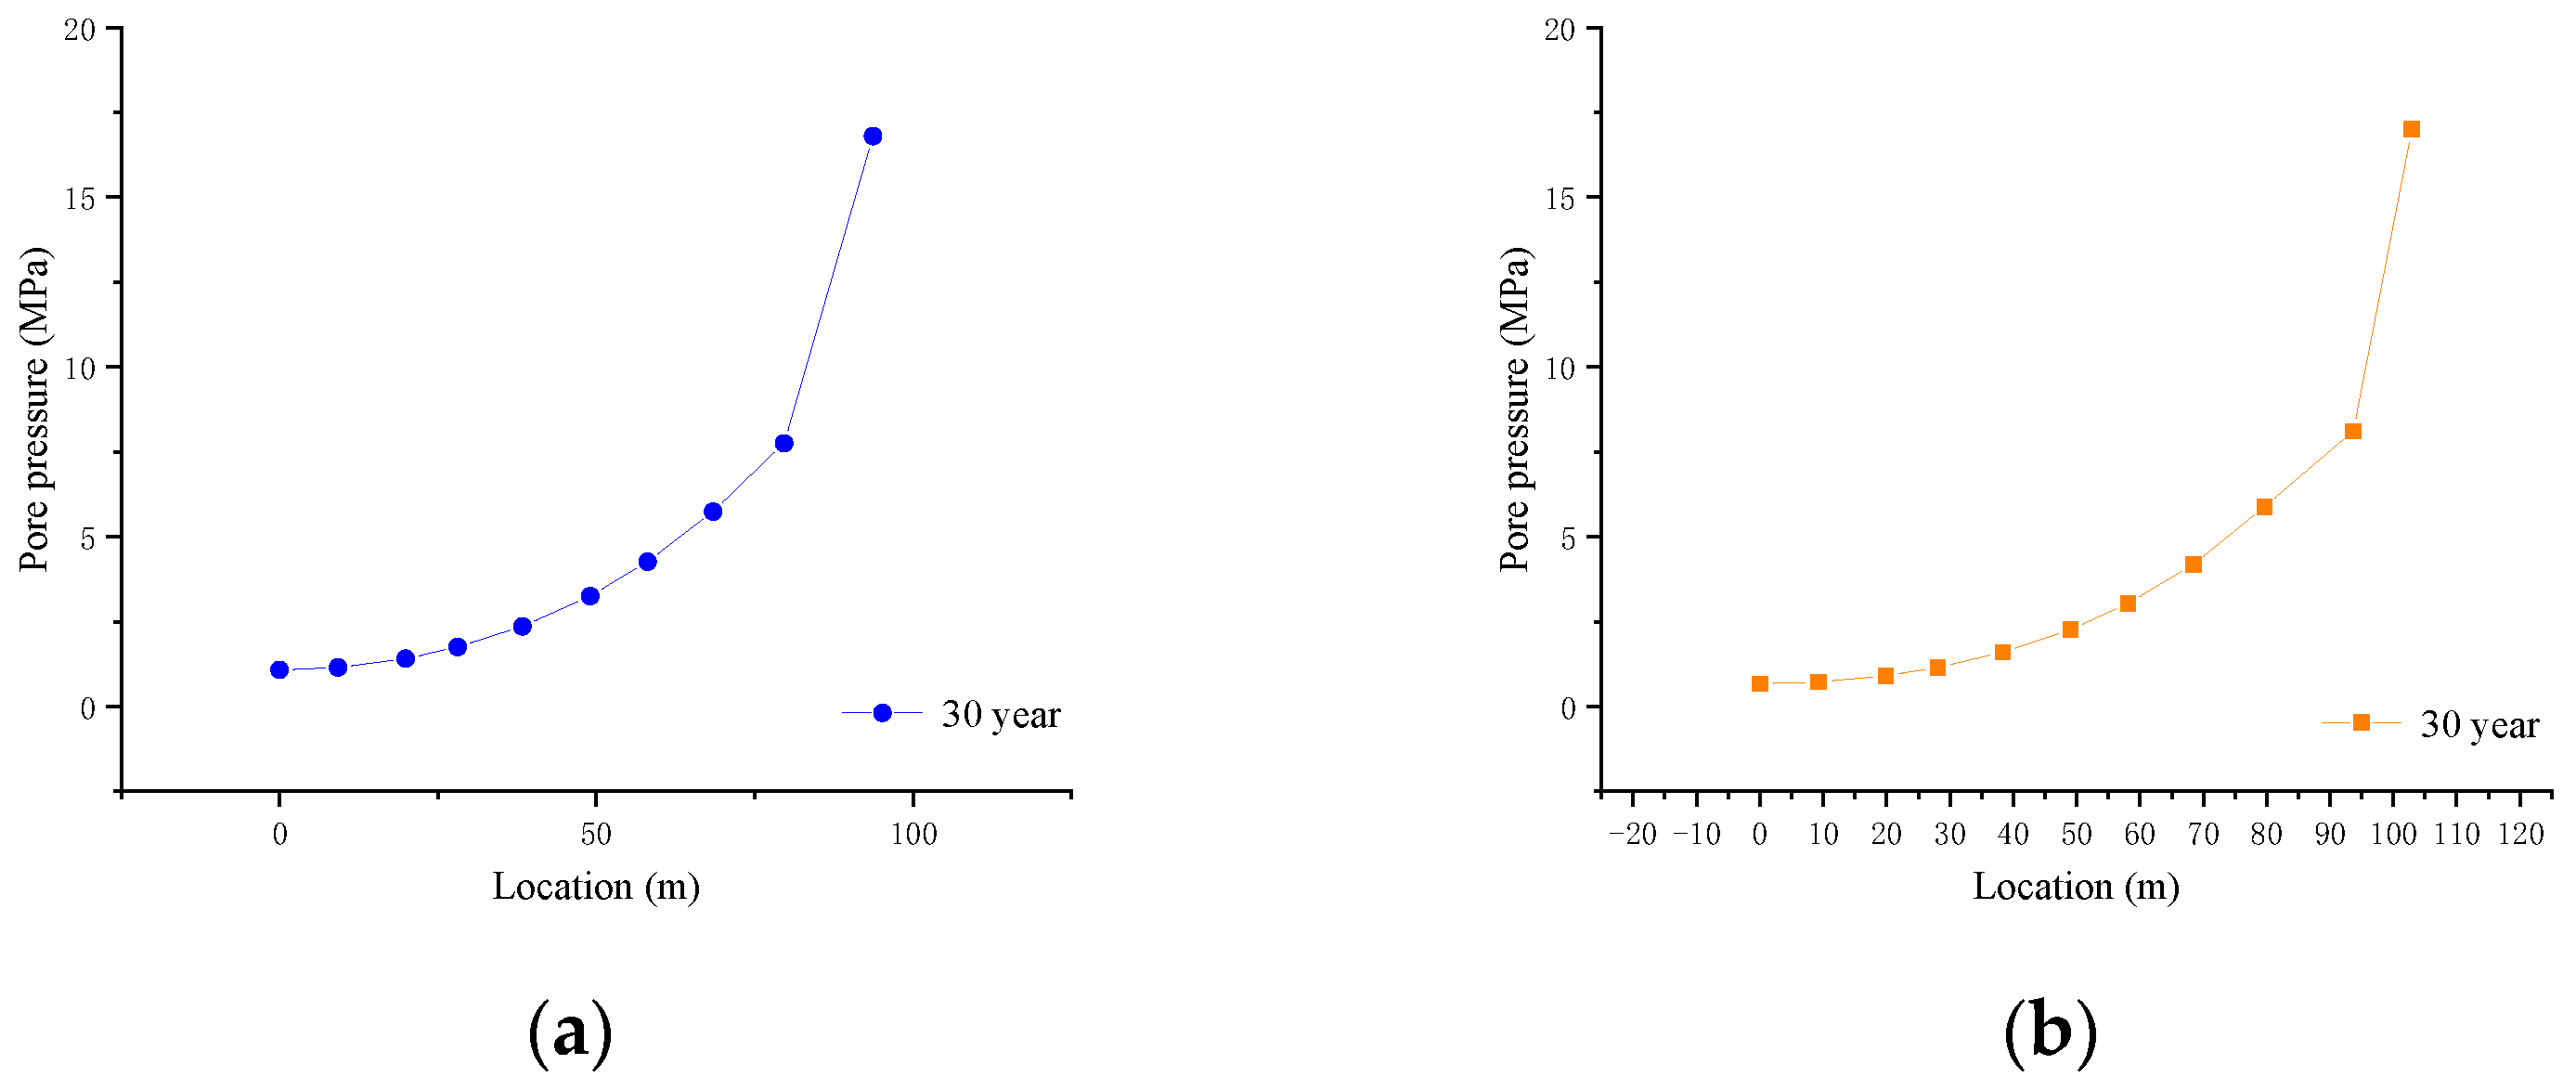
4.2.2. Pore Pressure Variation along the Interlayer
4.2.3. Loss Rate of the Leakage
4.3. Overall Analysis
5. Conclusions
- A set of evaluation criteria for the long-term operational safety analysis of salt cavern gas reservoirs has been proposed. The stability and integrity of these caverns are assessed through indicators such as cavity wall displacement, plastic zone characteristics, volume shrinkage, safety factors, seepage range, changes in pore pressure, and seepage rates.
- Numerical simulations were performed, utilizing the Jintan salt cavern in China as a case study. The results of these simulations were analyzed based on the criteria for assessing long-term operational safety, leading to the optimization of pillar safety. For a triangular well layout, the suggested pillar width is 1.67 times the maximum diameter of the salt cavern.
- The evaluation criteria for long-term operational safety analysis of salt cavern gas storage reservoirs and the optimization results for pillar safety obtained through numerical simulations presented in this study can offer valuable recommendations for the construction of salt cavern storage reservoirs that include interbedded layers.
Author Contributions
Funding
Data Availability Statement
Conflicts of Interest
References
- Yang, C.; Wang, T. Advance in deep underground energy storage. Chin. J. Rock Mech. Eng. 2022, 41, 1729–1759. [Google Scholar]
- Liu, E.; Lv, L.; Yi, Y.; Xie, P. Research on the Steady Operation Optimization Model of Natural Gas Pipeline Considering the Combined Operation of Air Coolers and Compressors. IEEE Access 2019, 7, 83251–83265. [Google Scholar] [CrossRef]
- Wang, T.; Chai, G.; Cen, X.; Yang, J.; Daemen, J. Safe distance between debrining tubing inlet and sediment in a gas storage salt cavern. J. Pet. Sci. Eng. 2021, 196, 107707. [Google Scholar] [CrossRef]
- Crotogino, F. Traditional bulk energy storage—Coal and underground natural gas and oil storage. Storing Energy 2016, 19, 391–409. [Google Scholar]
- Vlachopoulos, N.; Diederichs, M.S. Improved Longitudinal Displacement Profiles for Convergence Confinement Analysis of Deep Tunnels. Rock Mech. Rock Eng. 2009, 42, 131–146. [Google Scholar] [CrossRef]
- Ślizowski, J.; Lankof, L.; Urbańczyk, K.; Serbin, K. Potential capacity of gas storage caverns in rock salt bedded deposits in Poland. J. Nat. Gas Sci. Eng. 2017, 43, 167–178. [Google Scholar] [CrossRef]
- Cheng, L.; Li, Z.; Xu, B.; Yang, Q. Study of layout optimization and chain destruction of dense storage group in salt rock. Chin. J. Rock Mech. Eng. 2011, 30, 296–305. [Google Scholar]
- Zhengjie, L. Stability Analysis and Application of Gas Storage Pillar in Deep Salt Rock. Ph.D. Thesis, Shandong University, Jinan, China, 2018. [Google Scholar]
- Wen, W. Investigations on evaluating criteria of stabilities for energy (petroleum and natural gas) storage caverns in rock salt. Chin. J. Rock Mech. Eng. 2005, 24, 2497–2505. [Google Scholar]
- Ślizowski, K.; Janeczek, J.; Przewłocki, K. Suitability of salt-mudstones as a host rock in salt domes for radioactive-waste storage. Appl. Energy 2003, 75, 119–128. [Google Scholar] [CrossRef]
- Research on the Characteristics of Dilatation and Deformation of Layered Rock Salt Storage. Master’s Thesis, Hebei University of Technology, Hebei, China, 2010.
- Weizhong, C. Experimental Study On Permeability in Low Permeability Media. Chin. J. Rock Mech. Eng. 2008, 27, 236–243. [Google Scholar]
- Wendong, J. Experimental Investigation on Meso-Pore Structure Properties of Bedded Salt Rock. Chin. J. Rock Mech. Eng. 2013, 32, 2036–2044. [Google Scholar]
- Baoping, Y. Investigation on rheodestruction and permeability of surrounding rock for long-term running storage cavern in bedded rock salt. Rock Soil Mech. 2008, 29, 241–246. [Google Scholar] [CrossRef]
- Li, P.; Li, Y.; Shi, X.; Zhao, A.; Hao, S.; Gong, X.; Jiang, S.; Liu, Y. Stability analysis of U-shaped horizontal salt cavern for underground natural gas storage. J. Energy Storage 2021, 38, 102541. [Google Scholar] [CrossRef]
- Ma, H.; Yang, C.; Li, Y.; Shi, X.; Liu, J.; Wang, T. Stability evaluation of the underground gas storage in rock salts based on new partitions of the surrounding rock. Environ. Earth Sci. 2015, 73, 6911–6925. [Google Scholar] [CrossRef]
- Zhao, K.; Liu, Y.; Li, Y.; Ma, H.; Hou, W.; Yu, C.; Liu, H.; Feng, C.; Yang, C. Feasibility analysis of salt cavern gas storage in extremely deep formation: A case study in China. J. Energy Storage 2022, 47, 103649. [Google Scholar] [CrossRef]
- Fan, J.; Liu, W.; Jiang, D.; Chen, J.; Tiedeu, W.N.; Daemen, J.J.K. Time Interval Effect in Triaxial Discontinuous Cyclic Compression Tests and Simulations for the Residual Stress in Rock Salt. Rock Mech. Rock Eng. 2020, 53, 4061–4076. [Google Scholar] [CrossRef]
- Zhang, G.; Liu, Y.; Wang, T.; Zhang, H.; Wang, Z.; Zhao, C.; Chen, X. Pillar stability of salt caverns used for gas storage considering sedimentary rhythm of the interlayers. J. Energy Storage 2021, 43, 103229. [Google Scholar] [CrossRef]
- Qiua, Y.; Zhoua, S.; Wang, J.; Choub, J.; Fangb, Y.; Pana, G.; Gua, W. Feasibility analysis of utilising underground hydrogen storage facilities in integrated energy system: Case studies in China. Appl. Energy 2020, 269, 115140. [Google Scholar] [CrossRef]
- Tongtao, W. Study on Deformation and Safety of Rock Msurrounding Gas Storage in Bedded Rock Salt. Ph.D. Thesis, China University of Petroleum (East China), Beijing, China, 2011. [Google Scholar]
- Shan, P.F.; Lai, X.P. Numerical Simulation of the FluidSolid Coupling Process During the Failure of a Fractured Coal-Rock Mass Based on the Regional Geostress Characteristics. Transp. Porous Media 2018, 124, 1061–1079. [Google Scholar] [CrossRef]
- Stormontf, J.C. In Situ Gas Permeability Measurements to Delineate Damage in Rock Salt. Int. J. Rock Mech. Min. Sci. 1997, 34, 1055–1064. [Google Scholar] [CrossRef]
- Popp, T.; Kern, H.; Schulze, O. Evolution of dilatancy and permeability in rock salt during hydrostatic compaction and triaxial deformation. J. Geophys. Res. Solid Earth 2001, 106, 4061–4078. [Google Scholar] [CrossRef]
- Chen, W. Research on gas seepage law in laminated salt rock gas storage. Chin. J. Rock Mech. Eng. 2009, 28, 1297–1304. [Google Scholar]
- Zhide, W. Research on permeability testing of rock salt under different permeability pressures. Chin. J. Rock Mech. Eng. 2012, 31, 3740–3746. [Google Scholar]
- Wei, L.; Jie, C.; Deyi, J.; Xilin, S.; Yinping, L.; Daemen, J.; Chunhe, Y. Tightness and suitability evaluation of abandoned salt caverns served as hydrocarbon energies storage under adverse geological conditions (AGC). Appl. Energy 2016, 178, 703–720. [Google Scholar] [CrossRef]
- Chen, X.; Li, Y.; Shi, Y.; Yu, Y.; Jiang, Y.; Liu, Y.; Dong, J. Tightness and stability evaluation of salt cavern underground storage with a new fluid–solid coupling seepage model. J. Pet. Sci. Eng. 2021, 202, 108475. [Google Scholar] [CrossRef]
- Nan, Z. Research on Surrounding Rock Permeability and Mechanical Properties of Crude Oil Storage Caverns in Bedded Rock Salt and the Cavern Safety Evaluation. Ph.D. Thesis, Chongqing University, Chongqing, China, 2019. [Google Scholar]
- Xiaolan, H. Tightness evaluation test on underground energy storage in bedded salt rock formation of Qianjiang area. Rock Soil Mech. 2011, 32, 1473–1478. [Google Scholar] [CrossRef]
- Wang, G.; Ren, T.; Wang, K.; Zhou, A. Improved apparent permeability models of gas flow in coal with Klinkenberg effect. Fuel 2014, 128, 53–61. [Google Scholar] [CrossRef]
- Xianjun, T. Study of THM-damage coupling model of gas storage in salt rock with interlayer. Rock Soil Mech. 2009, 30, 3633–3641. [Google Scholar] [CrossRef]
- Sun, D.; Yang, Y.; Li, Z. Ningjin Salt Cavern Underground Gas Storage Construction Geological Conditions Evaluation and Key Technology Research-In-Situ Stress Measurement and Stress Field Analysis Report; Institute of Geomechanics, Chinese Academy of Geosciences: Beijing, China, 2020. [Google Scholar]
- Walder, J.; Nur, A. Permeability measurement by the pulse-decay method: Effects of poroelastic phenomena and non-linear pore pressure diffusion. Int. J. Rock Mech. Min. Sci. Geomech. Abstr. 1986, 23, 225–232. [Google Scholar] [CrossRef]
- Chen, J. Study of sealability of cavern for natural gas storage in deep salt formation based on compaction-dilatancy boundary of salt. Chin. J. Rock Mech. Eng. 2009, 28, 3302–3308. [Google Scholar]


| Schemes | Scheme 1 | Scheme 2 | Scheme 3 | Scheme 4 | Scheme 5 |
|---|---|---|---|---|---|
| Pillar width | 1.0 D (60 m) | 1.5 D (90 m) | 2.0 D (120 m) | 2.5 D (150 m) | 3.0 D (180 m) |
| Lithology | Specimen ID | Type of Test | Uniaxial Compression Strength (MPa) | Elastic Modulus (GPa) | Average (GPa) | Poisson’s Ratio | Average |
|---|---|---|---|---|---|---|---|
| Rock salt | DZ-1 | Uniaxial compression test | 23.616 | 2.12 | 2.85 | 0.293 | 0.280 |
| DZ-2 | 19.853 | 1.62 | 0.247 | ||||
| DZ-3 | 18.088 | 0.933 | 0.258 | ||||
| DZ-4 | 26.27 | 2.41 | 0.299 | ||||
| DZ-5 | 14.753 | 5.25 | 0.304 | ||||
| Lithology | Specimen ID | Type of test | Axial stress-strain (%) | Triaxial compression strength (MPa) | Cohesion (MPa) | Friction angle (°) | \ |
| Rock salt | SZ-1 | Tiaxial compression test | 5.57 | 25.01 | 5.450 | 30.510 | \ |
| SZ-2 | 20.31 | 84.12 | |||||
| SZ-6 | 6.08 | 64.82 | |||||
| SZ-11 | 13.06 | 51.39 | |||||
| SZ-9 | 19.62 | 96.53 | |||||
| SZ-13 | 6.51 | 36.71 | |||||
| SZ-12 | 21.23 | 115.90 |
| Lithology | Specimen ID | Permeability (m2) | Average (m2) | Method |
|---|---|---|---|---|
| Rock salt | ST-1 | 1.00 × 10⁻²⁰ | 5.65 × 10⁻²¹ | Unsteady-state |
| ST-2 | 9.44 × 10⁻²¹ | |||
| ST-3 | 3.01 × 10⁻²¹ | |||
| ST-4 | 1.86 × 10⁻²¹ | |||
| ST-5 | 1.20 × 10⁻²¹ | |||
| SZ-3 | 9.58 × 10⁻¹⁶ | |||
| SZ-8 | 6.78 × 10⁻²¹ | |||
| SZ-7 | 8.77 × 10⁻²¹ | |||
| SZ-5 | 6.15 × 10⁻²¹ | |||
| DZ-14 | 4.05 × 10⁻²¹ |
| Lithology | Elastic Modulus (GPa) | Poisson’s Ratio | Cohesion (MPa) | Friction Angle (°) | Tensile Strength (MPa) |
|---|---|---|---|---|---|
| Salt rock | 3.830 | 0.280 | 5.450 | 30.510 | 1.080 |
| Interlayer | 4.720 | 0.185 | 8.190 | 39.570 | 1.670 |
| Deformation Parameters | 6.00 × 10⁻⁴ | 8.00 × 10⁻⁴ | 9.00 × 10⁻⁴ | 1.00 × 10⁻³ | 3.00 × 10⁻³ | 5.00 × 10⁻³ | 1.00 × 10⁻² |
|---|---|---|---|---|---|---|---|
| c | 4.613° | 6.536° | 4.275° | 7.719° | 11.364° | 18.399° | 24.789° |
| ψ | 12.388 | 12.569 | 12.448 | 11.259 | 10.575 | 6.745 | 2.663 |
| Lithology | Creep Parameters A (MPa)−n⋅h−1 | Creep Parameters n |
|---|---|---|
| Salt rock | 2.996 × 10⁻⁹ | 4.480 |
| Conditions | Scheme 1 (1.0 D) | Scheme 2 (1.5 D) | Scheme 3 (2.0 D) | Scheme 4 (2.5 D) | Scheme 5 (3.0 D) |
|---|---|---|---|---|---|
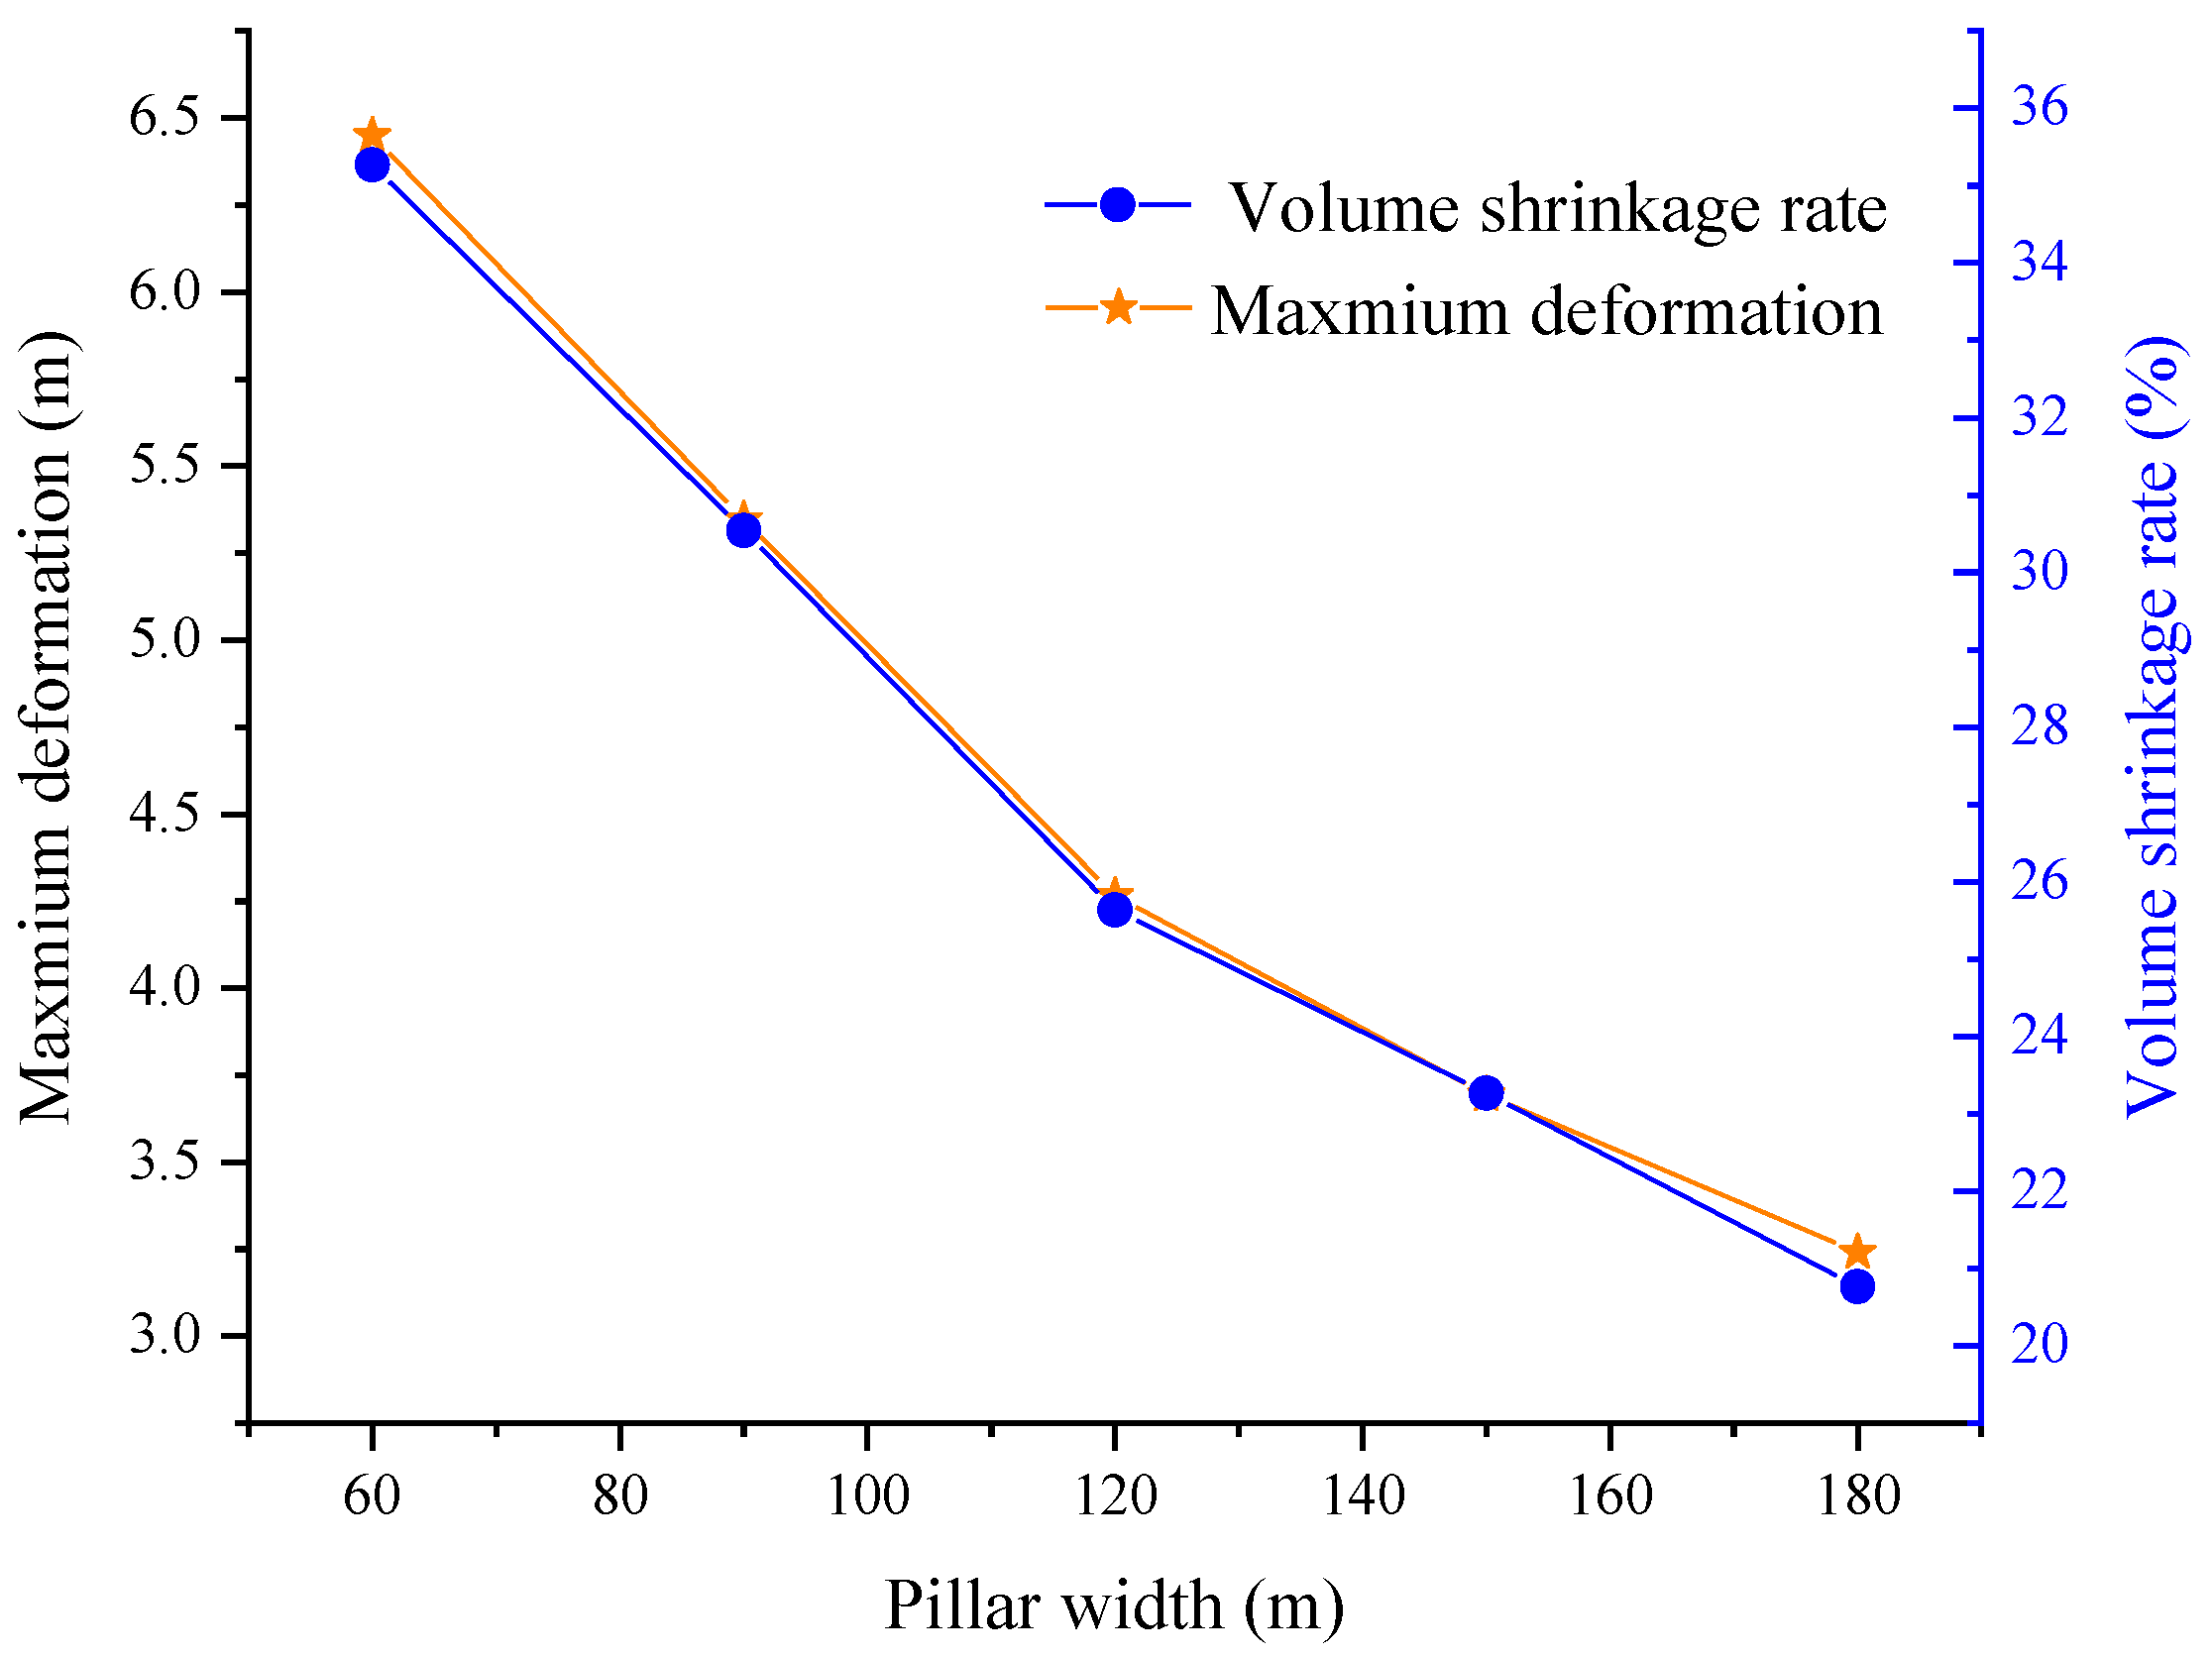
| Maximum displacement around cavern (m) | 6.4488 | 5.3460 | 4.2652 | 3.6940 | 3.2413 |
| Volume shrinkage rate (%) | 35.270 | 30.540 | 25.6360 | 23.270 | 20.766 |
| 1 Year | 5 Years | 10 Years | 20 Years | 30 Years | |
|---|---|---|---|---|---|
| Scheme 1 (1.0 D) | 2.050 | 8.160 | 14.860 | 23.950 | 35.270 |
| Scheme 2 (1.5 D) | 1.997 | 7.270 | 12.860 | 22.480 | 30.540 |
| Scheme 3 (2.0 D) | 1.950 | 6.470 | 10.999 | 18.850 | 25.636 |
| Scheme 4 (2.5 D) | 2.010 | 6.270 | 10.350 | 17.220 | 23.270 |
| Scheme 5 (3.0 D) | 1.978 | 5.910 | 9.550 | 15.570 | 20.766 |
| Conditions | PP in Interlayer 1 (MPa) | PP in Interlayer 2 (MPa) |
|---|---|---|
| Scheme 1 (1.0 D) | 9.9 | 7.47 |
| Scheme 2 (1.5 D) | 6.26 | 4.33 |
| Scheme 3 (2.0 D) | 3.53 | 2.41 |
| Scheme 4 (2.5 D) | 2.01 | 1.12 |
| Scheme 5 (3.0 D) | 1.08 | 0.672 |
| Conditions | Pillar Width (m) | Maximum Seepage Distance (m) | |
|---|---|---|---|
| Interlayer 1 | Interlayer 2 | ||
| Scheme 1 (1.0 D) | (1.0 D) 60 | 28.128 | 42.94 |
| Scheme 2 (1.5 D) | (1.5 D) 90 | 48.69 | 57.94 |
| Scheme 3 (2.0 D) | (2 D) 120 | 63.69 | 72.94 |
| Scheme 4 (2.5 D) | (2.5 D) 150 | 78.69 | 87.94 |
| Scheme 5 (3.0 D) | (3 D) 180 | 93.69 | 102.94 |
| Conditions | Pillar Width (m) | Gas Seepage Volume (m3) | ||
|---|---|---|---|---|
| Interlayer 1 | Interlayer 2 | |||
| Scheme 1 (1.0 D) | (1.0 D) 60 | 387.75 | 921.024 | 1308.774 |
| Scheme 2 (1.5 D) | (1.5 D) 90 | 1161.861 | 1676.888 | 2838.749 |
| Scheme 3 (2.0 D) | (2 D) 120 | 1988.001 | 2657.547 | 4645.548 |
| Scheme 4 (2.5 D) | (2.5 D) 150 | 3034.682 | 3862.966 | 6897.638 |
| Scheme 5 (3.0 D) | (3 D) 180 | 3291.902 | 3993.161 | 7285.063 |
| Maximum Cavity Diameter D (m) | Pillar Width P (m) | Distance between Wellheads (m) |
|---|---|---|
| 60 | 100.2 | 160.2 |
| 70 | 116.9 | 186.9 |
| 80 | 133.6 | 213.6 |
Disclaimer/Publisher’s Note: The statements, opinions and data contained in all publications are solely those of the individual author(s) and contributor(s) and not of MDPI and/or the editor(s). MDPI and/or the editor(s) disclaim responsibility for any injury to people or property resulting from any ideas, methods, instructions or products referred to in the content. |
© 2024 by the authors. Licensee MDPI, Basel, Switzerland. This article is an open access article distributed under the terms and conditions of the Creative Commons Attribution (CC BY) license (https://creativecommons.org/licenses/by/4.0/).
Share and Cite
Cai, R.; Ma, H.; Liang, X.; Zhao, K.; Yang, C. Allowable Pillar Width for Salt Cavern Gas Storage Based on Triangular Well Layout: A Case Study in China. Energies 2024, 17, 324. https://doi.org/10.3390/en17020324
Cai R, Ma H, Liang X, Zhao K, Yang C. Allowable Pillar Width for Salt Cavern Gas Storage Based on Triangular Well Layout: A Case Study in China. Energies. 2024; 17(2):324. https://doi.org/10.3390/en17020324
Chicago/Turabian StyleCai, Rui, Hongling Ma, Xiaopeng Liang, Kai Zhao, and Chunhe Yang. 2024. "Allowable Pillar Width for Salt Cavern Gas Storage Based on Triangular Well Layout: A Case Study in China" Energies 17, no. 2: 324. https://doi.org/10.3390/en17020324
APA StyleCai, R., Ma, H., Liang, X., Zhao, K., & Yang, C. (2024). Allowable Pillar Width for Salt Cavern Gas Storage Based on Triangular Well Layout: A Case Study in China. Energies, 17(2), 324. https://doi.org/10.3390/en17020324