Article

Preliminary Evaluation of Methods for Continuous Carbon Removal from a Molten Catalyst Bubbling Methane Pyrolysis Reactor

by
Zachary Cooper-Baldock
1,2,*,
Thomas De La Perrelle
1,2,
Callum Phelps
1,2,
Millicent Russell
1,2,
Lachlan Ryan
1,2,
Joshua Schofield
1,2,
Graham J. Nathan
1,3 and
Mehdi Jafarian
1,3,*
1
Centre for Energy Technology, The University of Adelaide, Adelaide, SA 5005, Australia
2
School of Mechanical Engineering, The University of Adelaide, Adelaide, SA 5005, Australia
3
School of Chemical Engineering and Advanced Materials, The University of Adelaide, Adelaide, SA 5005, Australia
*
Authors to whom correspondence should be addressed.
Energies 2024, 17(2), 290; https://doi.org/10.3390/en17020290
Submission received: 6 December 2023 / Revised: 24 December 2023 / Accepted: 29 December 2023 / Published: 6 January 2024
(This article belongs to the Section A5: Hydrogen Energy)

Abstract

:
Methane pyrolysis in molten catalyst bubble (MCB) column reactors is an emerging technology that enables the simultaneous production of hydrogen and solid carbon, together with a mechanism for separating the two coproducts. In this process, methane is dispersed as bubbles into a high temperature molten catalyst bath producing hydrogen and low-density carbon, which floats to the surface of the bath from providing a means for them to be separated. However, the removal of carbon particulates from a bubbling column reactor is technically challenging due to the corrosive nature of the molten catalysts, contamination of the product carbon with the molten catalysts, high temperatures and lack of understanding of the technology options. Four potential concepts for the removal of carbon particulate from a methane pyrolysis molten metal bubble column reactor are presented, based on the pneumatic removal of the particles or their overflow from the reactor. The concepts are evaluated using a cold prototype reactor model. To simulate the operation of a high-temperature reactor at low temperatures, the dominant dimensionless numbers are identified and matched between a reference high-temperature reactor and the developed cold prototype using water, air and hollow glass microsphere particles as the representatives of the molten catalyst, gaseous phases and solid carbon particulates, respectively. The concepts are tested in the cold prototype. High rates of particle removal are achieved, but with different tradeoffs. The applicability of each method together with their advantages and disadvantages are discussed.

1. Introduction

Hydrogen combustion produces no carbon emissions. Hence, if it can be produced either from renewable resources or from fossil fuels with CO2 capture, it can be a carbon neutral fuel. There are primarily four methods used to produce hydrogen at industrial scales, including methane reforming (SMR), coal gasification (CG), oil reforming and water electrolysis [1,2]. The dominant SMR process produces H2 at the cost of ~1.5 USD/kgH2. However, it also produces 9–11 of CO2 per kgH2 [3,4]. Integration of carbon capture to SMR for 90% CO2 capture also adds some 60% to the costs [4]. Nevertheless, it is still attracting significant investment in countries like the United Kingdom because it is judged as the technology with the greatest potential to deliver largescale supplies in the short term [5]. The coal gasification route is even more carbon intensive, producing some 18 (kgCO2/kgH2) [6]. On the other hand, water splitting via electrolysis with renewable electricity, while enabling net-zero hydrogen production, is even more expensive than SMR with CCS, despite falling costs [3]. Hence, there is a need to invest in the development of new technologies with strong potential to yield complete or near-complete mitigation of CO2 in the production of low-cost hydrogen. One of the emerging technologies under development, with strong potential to lower the cost of hydrogen production, is methane pyrolysis [5], which cracks the methane to produce solid carbon and hydrogen:
C H 4 ( g ) 2 H 2 ( g ) + C ( s )
The enthalpy of this reaction, at 75 kJ/molH2, is only ~46% of the net enthalpy of SMR and some 25% that of water electrolysis. Whilst these are different production mechanisms, the lower specific energy requirement per mole of hydrogen produced implies potential for lower production costs. In addition, this reaction produces solid carbon as a by-product, which not only avoids the direct production of CO2 and hence the cost of sequestration but it also offers the potential to coproduce valuable carbon coproducts, such as carbon black, carbon fibers, carbon nanomaterials and cement additives. Even if markets for these coproducts become saturated, the cost of sequestration of pure solid carbon would be far less than that of gaseous CO2. While the current market is too small to adsorb the amount of hydrogen anticipated to be needed in the new economy, if it is to be produced through methane pyrolysis, much larger markets are potentially possible with significant development, such as the partial replacement of steel and cement with carbon-based products [7,8]. Moreover, the full lifecycle emissions of this process depend on the source of the energy needed to drive the endothermic pyrolysis reactions, the source of the methane, and on the life of the carbon product, it has potential to be net-zero if the pyrolysis is driven with renewable energy, or even negative with the use of biomethane instead of natural gas [7]. However, various technical barriers remain to be overcome before this technology can be widely implemented commercially.
The pyrolysis of methane begins to occur at ~400 °C but does not reach completion without reaching temperatures of more than 1000 °C. Moreover, it is a kinetic control reaction. For this reason, there has been significant investment in the development of catalysts to increase reaction rates. Solid, porous catalysts have been proposed and investigated vastly [9,10,11]. However, they are quickly coked by the carbon byproduct (Equation (1)) and exhibit reduced efficiency. To address this challenge, molten catalysts, e.g., molten metals [11], molten alloys [10] and molten salts [10] under a gas bubbling flow regime within a bubble column reactor, have been proposed.
In a methane pyrolysis molten catalyst bubbling (MCB) reactor, methane is dispersed from submerged nozzles into a molten bath, where it dissociates mostly to H2 and carbon (Equation (1)) as the bubbles rise through the bath. The buoyancy force induced by the substantial difference between the density of the carbon and that of the molten bath floats the carbon product to the surface of the molten bath, from where it can be removed [1]. The methane pyrolysis MCB reactors appearing in the literature operate predominantly under a semi-batch configuration with a noncontinuous removal of the carbon product. Nonetheless, continuous operation would be desired in the case of an industrial process to minimize the capital and operational costs. However, despite the need for the development of an efficient method for the removal of carbon particulate from a molten metal bubble column reactor, this has remained a largely uninvestigated aspect of the molten metal methane pyrolysis process [12].
Recently, von Wald et al. [13] proposed a method for carbon removal from a molten metal bubble column methane pyrolysis reactor that involves entraining the carbon into the outgoing gas and flowing it through a cyclone to remove the carbon particulate. A mathematical model has also been developed based on the expected volumetric gas flow rate leaving the reactor. However, the concept has not yet been demonstrated. Additionally, a particle diameter of 0.1 mm and a completely nonporous carbon structure was assumed [13]. These could be different from the solid particles generated in a methane pyrolysis reaction, which has been found to have a range of sizes [12] and carbon structures [13,14,15]. More recently, Kudinov et al. [14] proposed a conceptual design of a desooting device that uses a floating sensor to control the catalyst level within the reactor and removes the carbon particulate using a vacuum device.
The use of mechanical methods such as skimming, similar to that found in the fuming industry [14], or entraining the carbon in the hydrogen gas stream have also been proposed [11,16]. However, mechanical separation of carbon from the top of the molten bath is technically challenging due to the corrosive nature of liquid metal, which can exacerbate the mechanical wear of the moveable metallic components in contact with the molten bath. Several conceptual designs can also be found in patents [16], which are typically based on physical overflow of the carbon product or entraining carbon particles into a gas flow. Nevertheless, these reports are mostly conceptual and lack either a systematic theoretical or experimental evaluation, so that further systematic evaluation is needed both to better identify their operational challenges and optimize them.
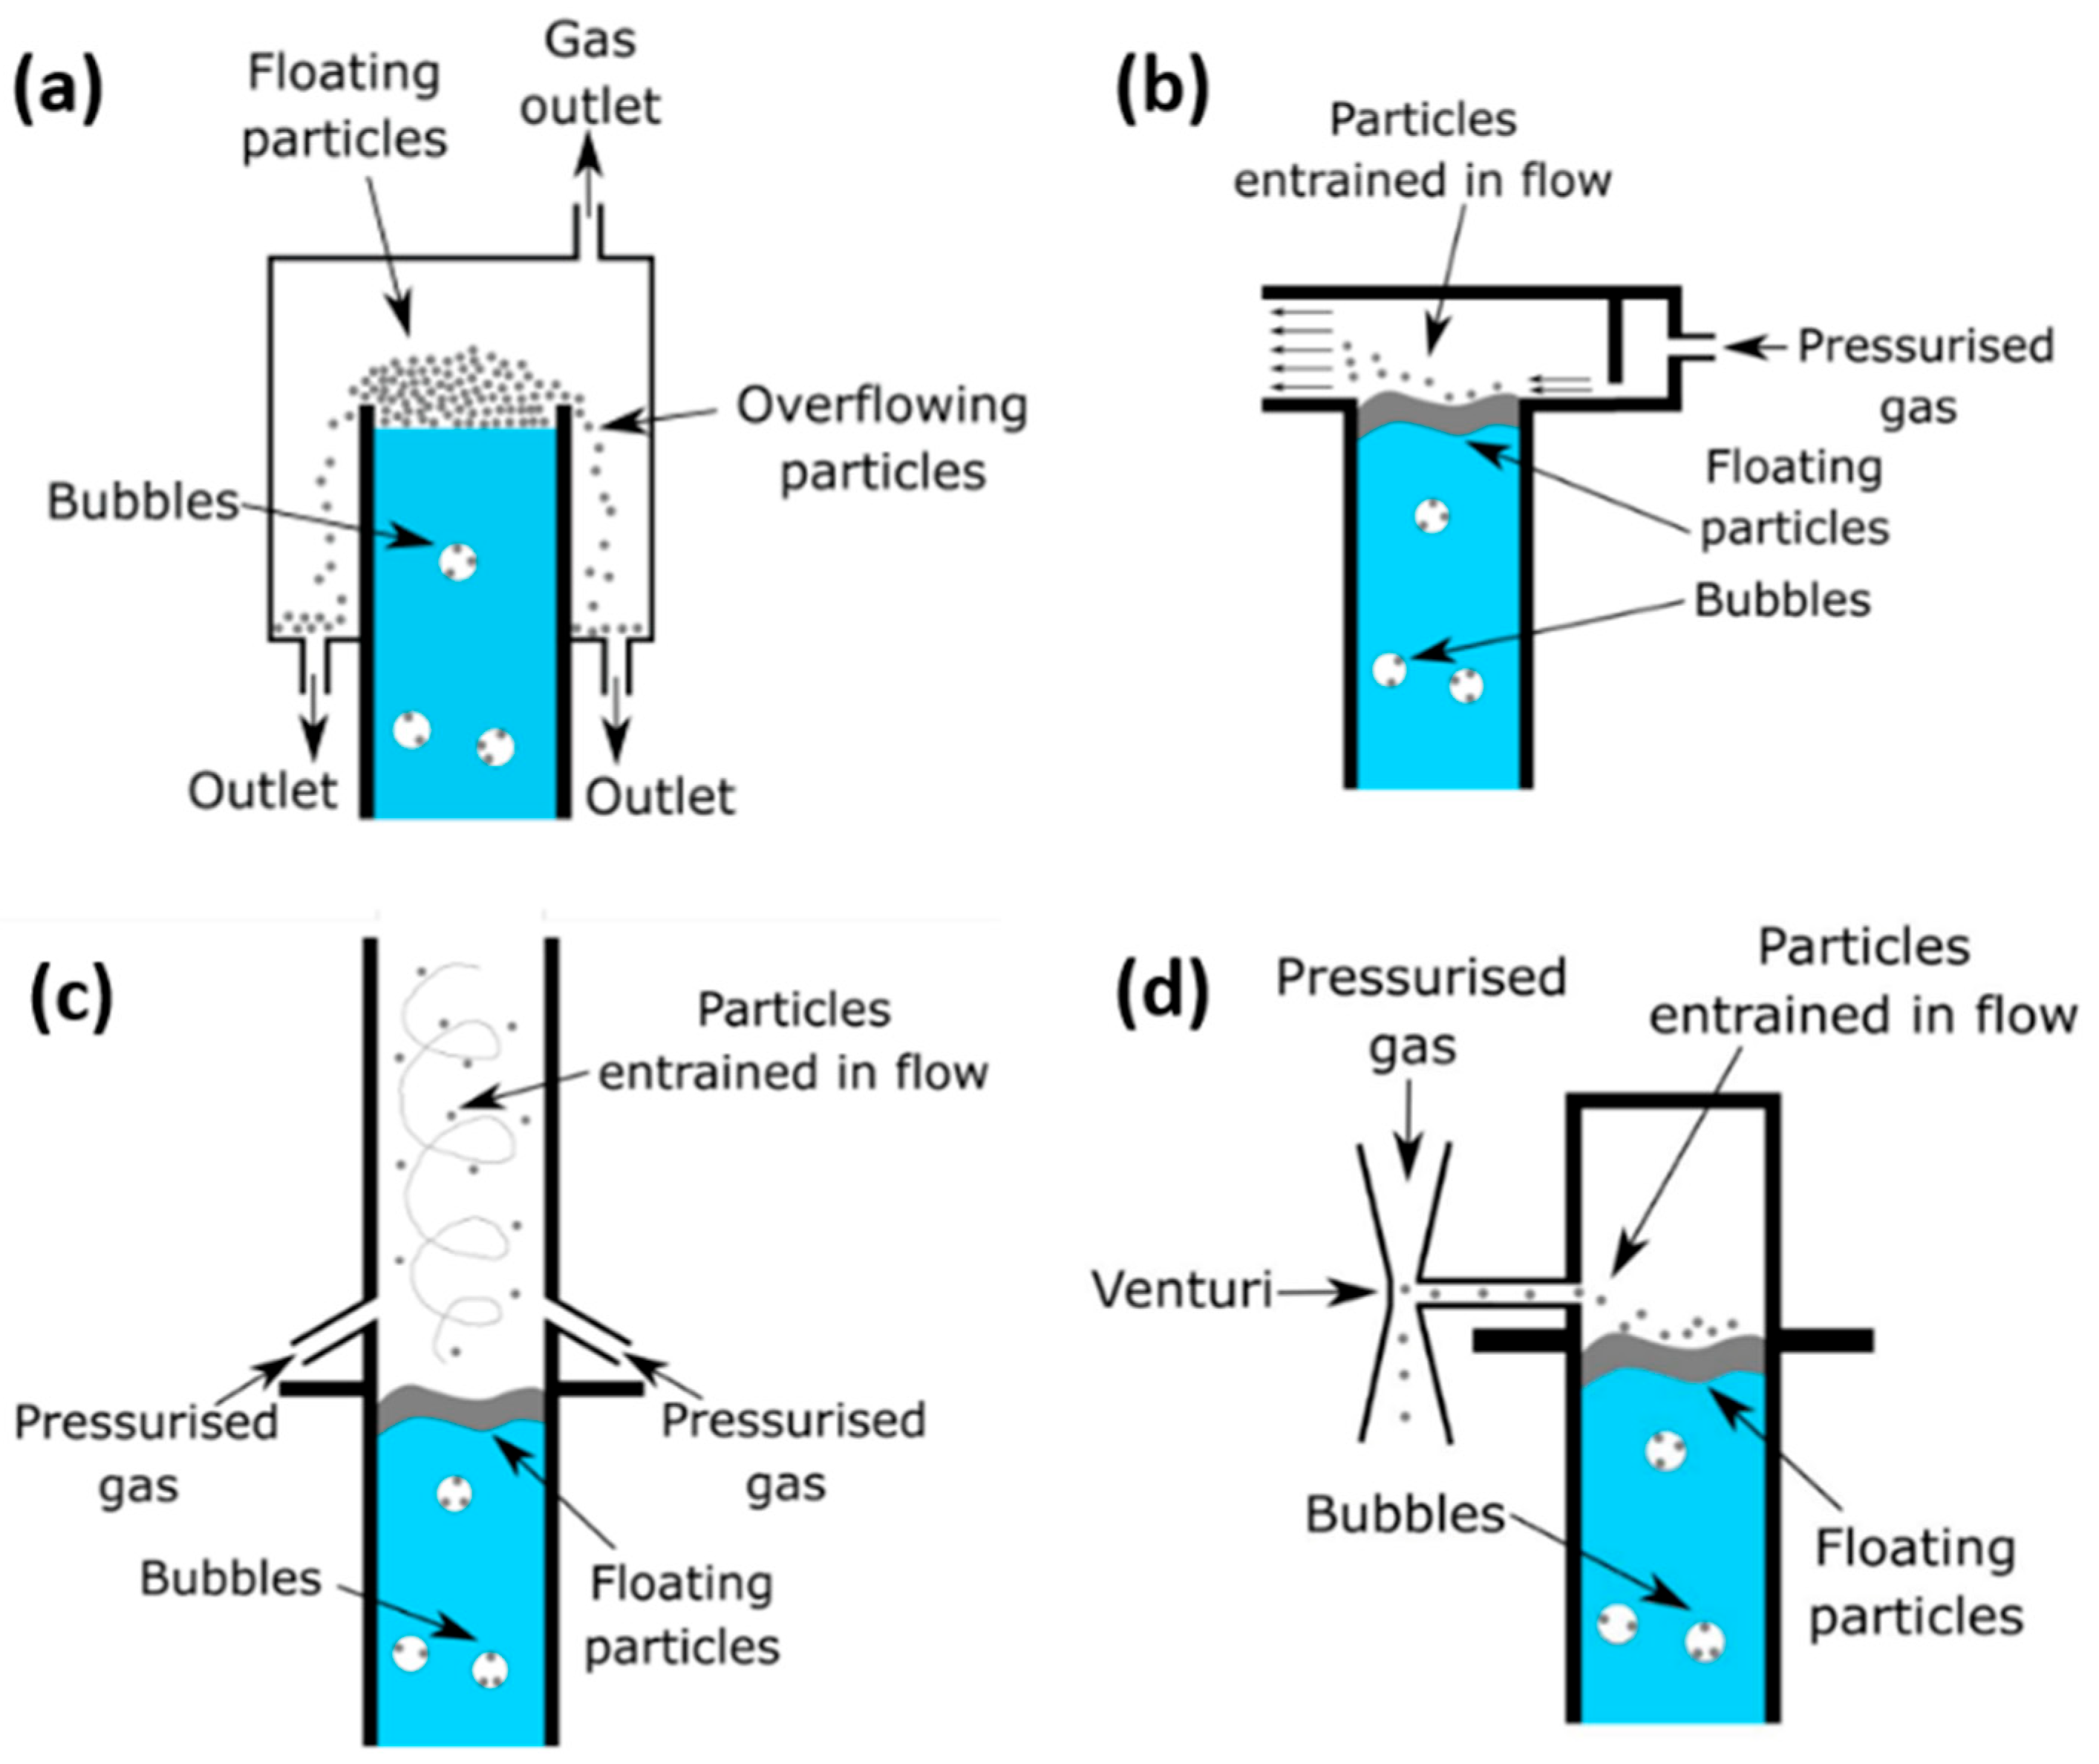
Four potential methods are identified here that appear to have the potential to be applied to the removal of solid carbon particulates from a methane pyrolysis molten catalyst reactor. These are pneumatic conveyance, venturi vacuums, cyclone flow and an overflow weir. Pneumatic conveyance, both for fluids and particulate-laden environments, has been adopted across a large range of industries and applications, e.g., burner feeding [17], feed lance injection [18] and particulate and granule mixing [19]. Venturi vacuums and injectors have also been widely used in many applications, in which a motive fluid is used to draw another fluid into a different geometry or segment of pipe [20]. In recent years, research has also been conducted into venturi scrubbers and particle-based venturi technologies [21]. These studies have reported considerable success in removing particles with a range of diameters [21,22]. The use of cyclonic flow for particle separation and mixing is also widely applied across a range of particle sizes [23], which is a specific application of cyclone separators. However, to the best of the author’s knowledge, no specific reports are available of the performance of the use of pneumatic conveyance, venturi vacuums and cyclone flow for the removal of carbon particles under conditions of relevance to a molten catalyst methane pyrolysis bubble column reactor. Moreover, while the overflow concept has been proposed [16], it has not been thoroughly investigated yet. Hence, the principle objective of the present investigation is to explore the potential benefits and limitations of these methods for the removal of carbon particulates from a molten catalyst methane pyrolysis bubble column reactor.
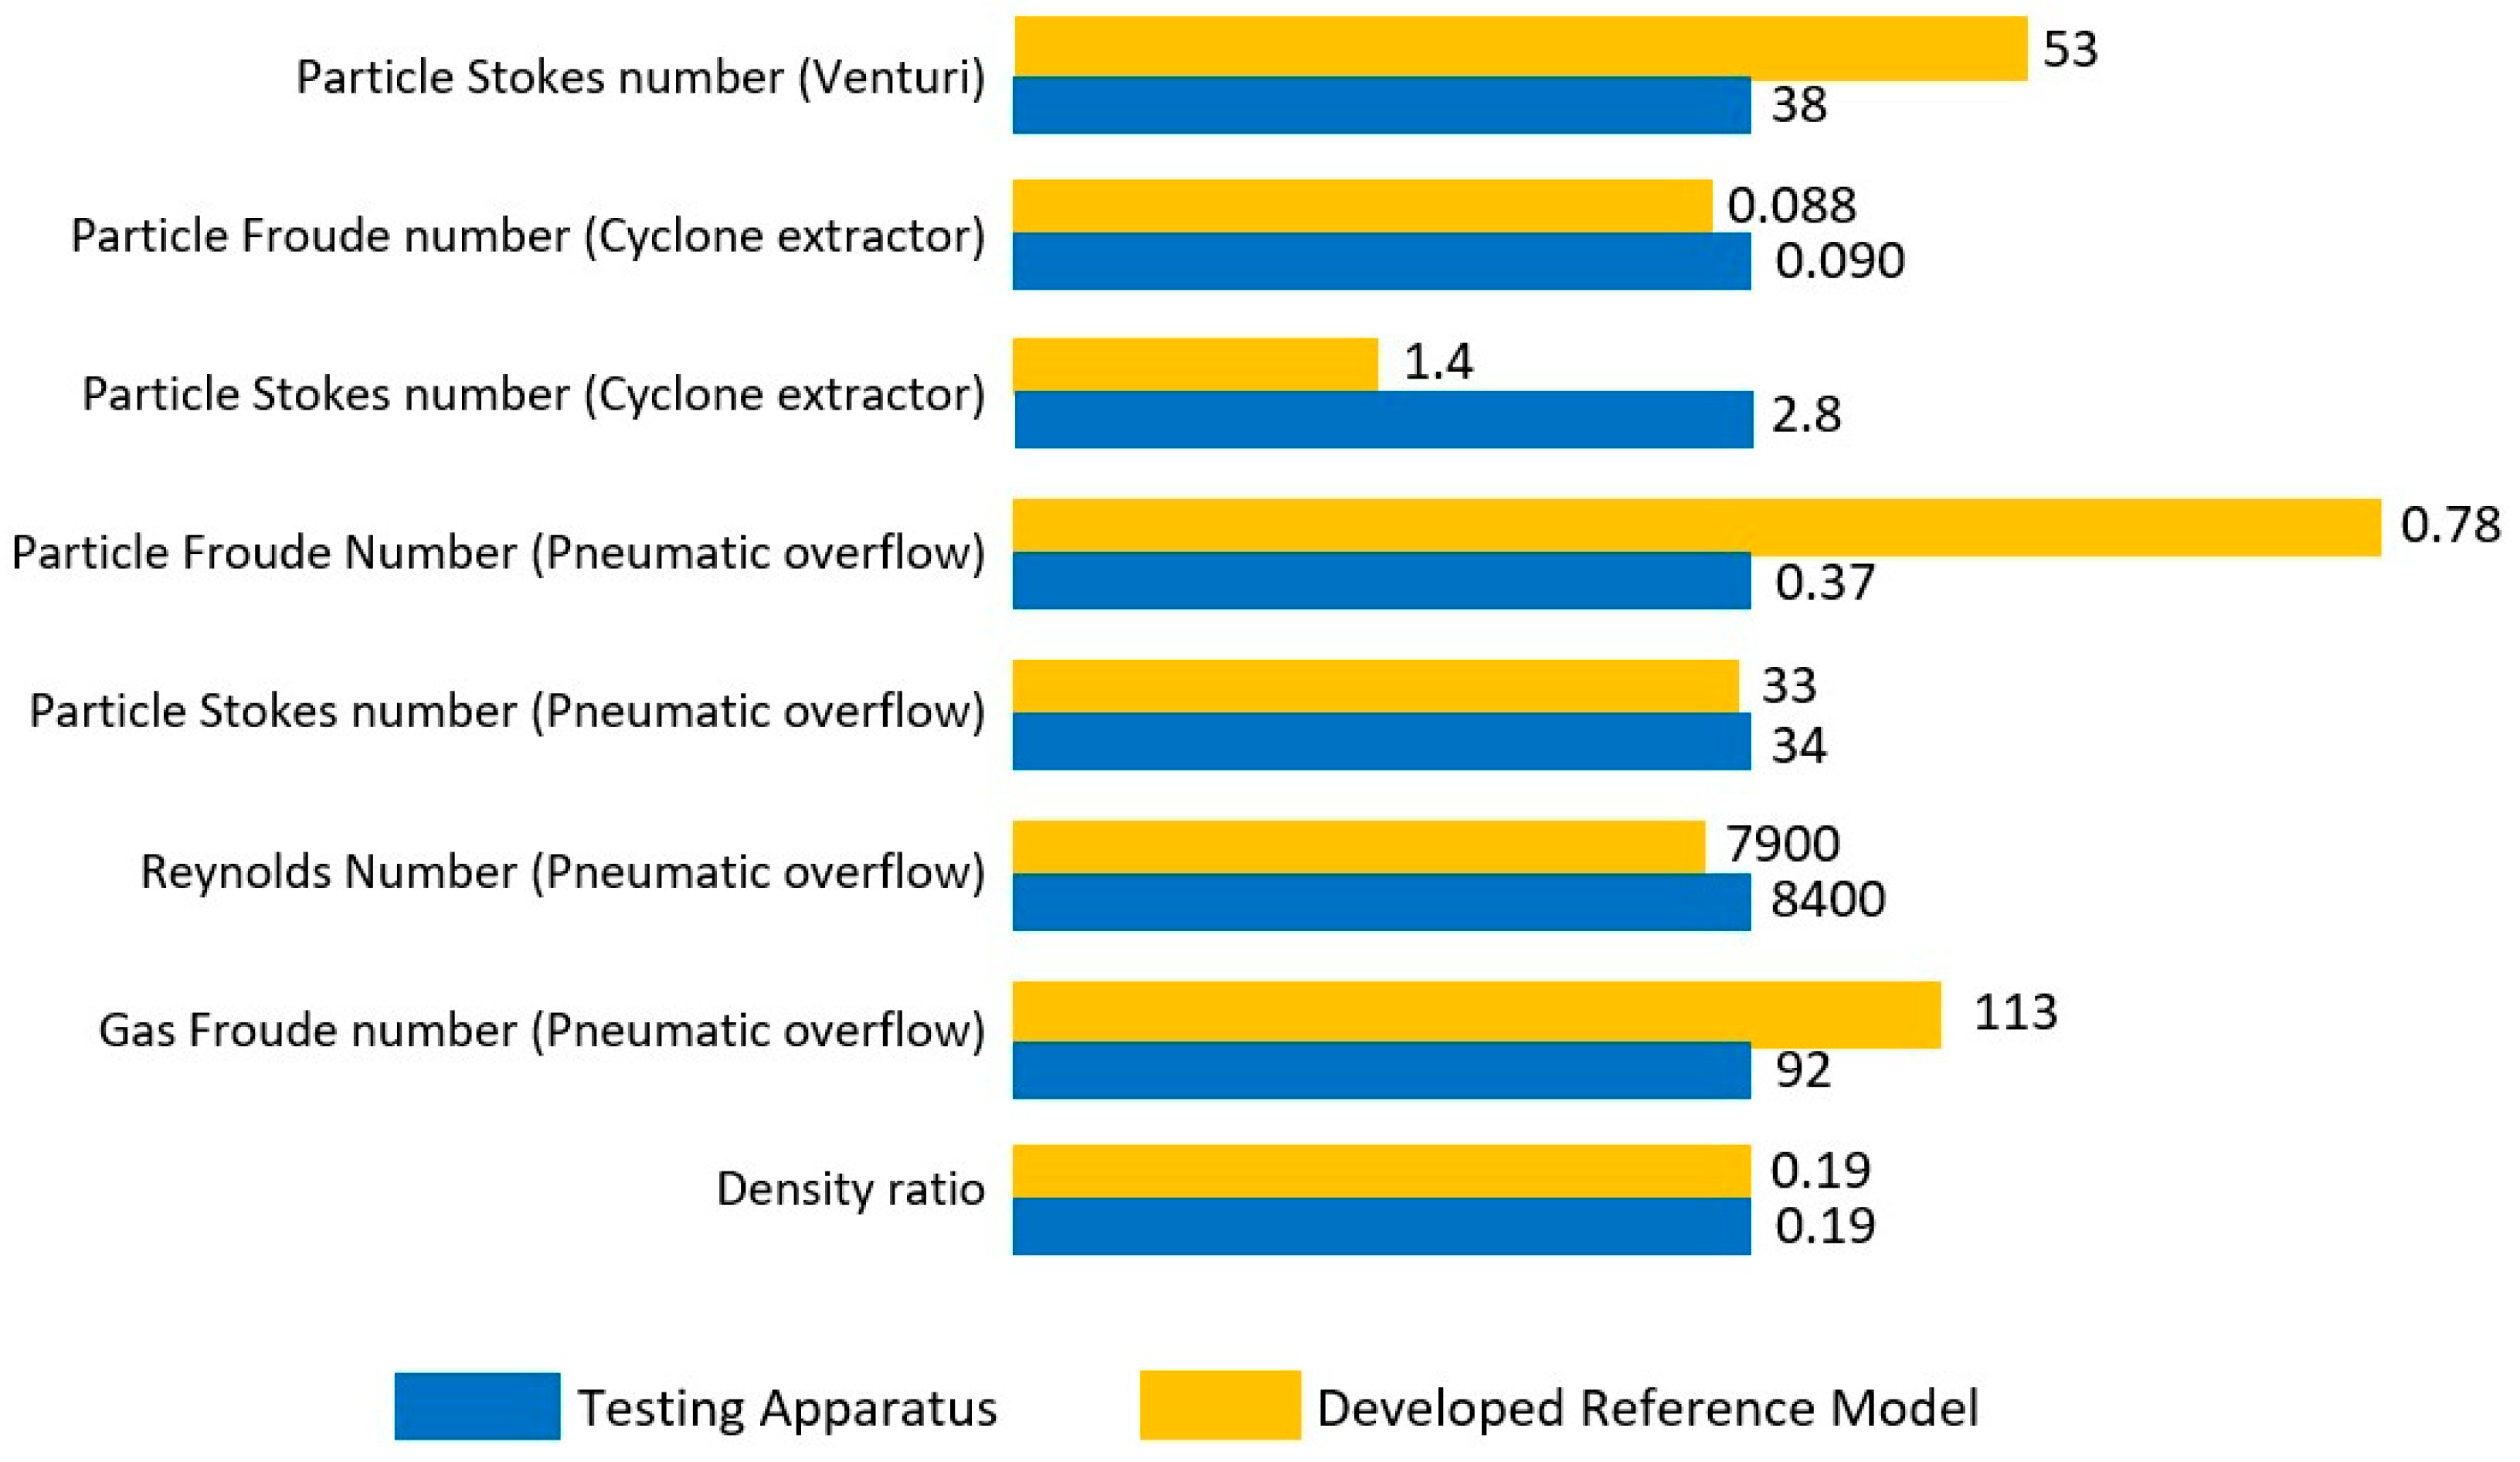
Experimental evaluation of high-temperature molten catalyst methane pyrolysis reactors is both challenging and costly. This is mainly because of the risks associated with the handling of high-temperature molten catalysts in the presence of combustible gases (methane and hydrogen). For this reason, a cold model prototype was developed and used to simulate the behavior of the carbon particles within a high-temperature MCB reactor, at room temperature and with water, using conditions of similarity. The use of similarity and dimensionless analysis is well established in the literature to undertake experimental investigations using alternative fluids with similar dimensionless properties but under ambient conditions and at much lower costs [24]. However, to the best of the author’s knowledge, no previous cold model of a methane pyrolysis bubble column reactor has been reported. It should be noted that whilst it is not possible to match all dimensionless parameters of a molten metal methane pyrolysis bubble column reactor, given that they scale in different ways, it is possible to match the dominant ones. Therefore, the second objective of this work is to develop a cold model of the methane pyrolysis MCB reactor and use it to assess the viability of the abovementioned four identified methods for the removal of the solid carbon particles.

Contribution

This investigation intends to make two contributions to the current state of the art with respect to methane pyrolysis. The first contribution is the development of a cold prototype reactor that simulates the physical interactions and phenomenon of hot molten metal bubble column reactors, but at ambient temperatures and using readily available materials. The process to develop this is elucidated below, as well as the physical effect similarity matching process. The successful development of a physically similar cold prototype reactor lowers the technology development cost [24], while also increasing the development speed by avoiding the need to address the safety and approvals processes of operating at high temperatures [9,10,11] and high pressures [10].
The second contribution is the identification, development and subsequent testing of mechanisms or methods for carbon removal. This work aims to adapt technologies from other industries, namely, an overflow weir [16], pneumatically assisted overflow weir [17,18,19], venturi ejector [21] and cyclone extractor [23], for use in methane pyrolysis reactors. The challenge of carbon removal has limited previous processes to batch operation [13]; thus, the development of a suitable technology for its continuous removal opens the door to continuous hydrogen production [14].

2. Potential Separation Methods

The four identified methods for the removal of carbon particulate from the molten catalyst methane pyrolysis reactor are described in Figure 1. Further explanation on each concept is provided below.

2.1. Overflow Weir

In this concept, the layer of carbon particles that accumulate on top of the molten bath overflow from a weir into an adjacent collector, as shown schematically in Figure 1a. This concept is attractive due to its mechanical simplicity. For example, the height of the weir can be adjusted to minimize the overflow of the molten catalyst bath. Nevertheless, it may provide limited control over the particles’ residence time within the reactor headspace.

2.2. Pneumatic-Assisted Overflow Weir

The pneumatic-assisted overflow weir concept utilizes a high-velocity pneumatic gas jet parallel to the surface of the molten catalyst bath to generate pneumatic conveying of the floated particles away from the liquid surface, as shown schematically in Figure 1b. It should be noted that the conveyed particles may require additional separation later using a filtration system, such as a typical cyclone separator, in the case of molten metal and particulate being extracted together. A heat exchanger would also be needed to recover the enthalpy of the conveying gas, depending on the process configuration. That is because passing an inert gas through the reactor could lead to increasing its temperature, which, in return, would affect the thermal load of the reactor. Nevertheless, detailed assessment of these aspects is beyond the scope of the present investigation.

2.3. Cyclone Extractor

The cyclone extractor, as shown in Figure 1c, employs a swirling flow that is exerted using gas jet nozzles, above the fluid surface of the reactor column, to generate a high-velocity flow field, transporting the particles from the reactor head space once they become entrained in the jet flow. This concept requires the same heat exchanger proposed for the overflow weir, as the injected gas temperature may increase, affecting thermal load.

2.4. Venturi Ejector

The venturi ejector system employs the venturi effect with a high-velocity venturi jet to produce a low static pressure region adjacent the reactor headspace, which is used to suck particles from the reactor into the venturi connecting arm, through the suction port, before they are exhausted from the reactor column. This concept is schematically shown in Figure 1d.

3. Methodology

This section details the development of a reference high-temperature reactor, cold prototype and dimensionless matching to ensure the concept’s physical effects are applicable to the hot MCB methane pyrolysis reactor designs. Subsequently, the experimental arrangement, operating conditions and specific separation devices are detailed and discussed.

3.1. Reference High-Temperature Reactor, Cold Prototype and Dimensionless Matching

To test the effectiveness of the proposed removal concepts, a test reactor was required to be independently developed. This development consisted of several key steps. The first was the synthesis of the available literature pertaining to methane pyrolysis in MCB reactors, with a focus on technologies that could be adapted to pilot- or large scale [24]. This was used to develop a theoretical hot reference model reactor. The details of the hot reference reactor are provided in Table 1. After the hot model was determined, this could then be used to generate a cold prototype reactor with similar physical characteristics, at ambient temperatures. The shared characteristics between the hot reference and cold prototype are of great importance, as they allow for dimensionless matching between the proposed concepts to ensure the physical phenomenon will be seen in a hot reactor.
To develop an accurate hot reference reactor, the composition, geometry and operating conditions must be known from the existing literature. These values are presented in Table 1. The model hot reactor has a 26–73% nickel–bismuth ratio [9] and a density of 9500 kg/m3 [11,25,26]. In addition to the composition of the reactor, its physical geometry must be theorized. It was seen that a diameter of 1.2 m, height of 1.0 m and operating environment of 15 bar at 1000 °C could be developed if available reactors were scaled in size [11]. The modelled hydrogen, methane and carbon production rates were set to 0.01022 kg/(s.m3), 0.08140 kg/(s.m3) and 0.06092 kg/(s.m3), respectively, to correlate to this scaling [26,28]. For the produced carbon byproduct, the modelled density was 1800 kg/m3 with a diameter of 56 microns, based on the existing literature [25]. For the hydrogen produced, it was also assumed to have the properties as detailed in Table 1 [25].
After this analysis had been conducted and the reference hot model developed, dimensionless matching could be undertaken. A dimensionless match is required between the conceptual removal methods, cold test reactor and the hot reference model. To dimensionlessly match the removal methods, their dominating physical relationships were determined. These are presented in Table 2, with further explanation provided in Table 3. For the pneumatically assisted overflow weir, these are the particle Stokes and Froude number and the Reynolds number. This is the same for the cyclone extractor. The venturi ejector needs to have a matched particle Stokes number.
To match the dimensionless groups, as detailed in Table 2, their relationships to the physical properties, environmental conditions and operating parameters must also be known. These relationships are provided in Table 3, which details their specific interactions, physical relevance and associated variables. The particle Froude number ( F r p ) is calculated based on the mean particle velocity ( v p ), the ratio of particle to fluid densities (s), acceleration due to gravity (g) and the diameter of the reactor column (D). For the particle Stokes number ( S t k ) the particle density ( ρ p ) , particle diameter ( d p ) , mean velocity of the gas ( v g ), gas dynamic viscosity ( μ ) and diameter of the reactor column (D) were used. The gas Froude number is determined in a similar manner to the particle Froude number, but using the velocity of the gas ( v g ). The Reynolds number is given by the gas density ( ρ g ) , the gas velocity ( v g ) , reactor diameter (D) and the dynamic viscosity of the gas ( μ ) . The density ratio (s) is given by the density of the particles ( ρ p ) divided by that of the liquid phase ( ρ l ) .
Once the relationships of each concept and the physical interactions were understood, a physically similar cold prototype reactor could be developed. This reactor was scaled proportionally to ensure that it provided a dimensionless match to the hot reference reactor for each concept. To model the molten metal phase of the hot reactor, water was selected, while air was selected for the gas phase. These two fluids were matched to the hot reference reactor using the similarity parameters in Table 3. The carbon particulate product was replaced with 7019-grade Q-Cell hollow glass microspheres. The microspheres and water were selected, as they have similar dimensionless density ratios and diameters to those of the modelled liquid metal and carbon phases. The selected microspheres have an effective density of 0.19 kg/m3. Consequently, they float on the water surface within the column headspace, mimicking the behavior of carbon particulate in MCB methane pyrolysis reactors. Moreover, the particles’ density-to-water density ratio is similar to that of the molten catalyst to the carbon product Table 1.
In a high-temperature methane pyrolysis bubble column reactor, methane dissociates to H2 and carbon as the bubbles rise through the molten bath column. To better simulate this phenomenon, the 7019-grade Q-Cell hollow microspheres were introduced at the bottom of the bubble column. In so doing, the particles were entrained into the inlet airstream prior to being injected into the bottom of the column. The particles had a mean diameter of 80 μm with a maximum size of 150 μm. In addition, the diameter, height, pressure and temperature were scaled to ensure a similar physical domain to the hot prototype. This is detailed in Table 4. The subscript used to denote the phase of the hot reference liquid is L, C for carbon and H for hydrogen. Then, to ensure the selected parameters and subsequent separation concepts are applicable to the hot reference model, their operating conditions are scaled to match Table 1’s hot model, in accordance with the relationships described in Table 3. These experimental conditions and scaled up hot model conditions are provided in Table 5.
Figure 2 provides a visual depiction of how close the dimensionless match is between the cold prototype (blue) and the hot reference model (yellow). For the venturi, the particle Stokes number is higher in the hot model than the cold prototype. For the cyclone extractor, the Froude number provides good similarity, but this is not true of the particle Stokes number, which is lower. For the pneumatically assisted overflow weir, the Stokes, Reynolds and gas Froude number provide good similarity. This is not true of the particle Froude number for the weir however, which is approximately half. The density ratio, between the cold prototype and hot model, is an exact match, which should negate any differences in density effects.

3.2. Experimental Arrangement and Operating Conditions

Figure 3 shows the experimental arrangement of the cold prototype test reactor. To the right of Figure 3, air enters the system, passing a flow valve, before entering a pressurized vessel. In the pressurized vessel, the air mixes with the hollow microsphere particles. This mixture simulates the hydrogen and carbon formation of the hot reference reactor, as outlined in Table 4. Prior to entering the column, this mixture passes a laser particle sensor. This sensor is used to check that the air and particle mixture enters the reactor consistently during testing. After passing this sensor, the mixture enters the base of the reactor column through a nozzle, before bubbling to the top of the column, where it is separated from the fluid interface by the removal concept.
Figure 3 also details the separation concepts connection. In the top right of Figure 3, pressurized air is passed through a rotameter and control value before entering the separation concept. This allows for the airflow rate, into the concepts, to be controlled for testing purposes. Connected to the separation concept is the removal pathway. This pathway, shown to the left of Figure 3, is used to allow for the separated particles to exit the system, where they are filtered, collected and weighed.
Figure 4 shows the experimental apparatus of Figure 3, as used for testing. The red square (Figure 3) indicates where the separation technology is attached to the column. The position of the flow valves, pressurized air, particle sensors and filtration and collection system is also indicated.
Schematic representation of the developed cold prototypes of the overflow weir, pneumatic-assisted overflow weir, cyclone extractor and venturi ejector concepts used in this investigation are shown in Figure 5A, Figure 6A, Figure 7A and Figure 8A, respectively. The cross-sections of these systems together with their main dimensions are also shown in Figure 5B, Figure 6B, Figure 7B and Figure 8B.

4. Experimental Procedure

Each of the particulate removal devices (shown in Figure 5, Figure 6, Figure 7 and Figure 8) were installed on the top of the cold prototype bubble column reactor (indicated in red in Figure 3) for testing purposes. During the experiments, the volumetric flow rates of the inlet air to the column were monitored and each removal mechanism was tested across a range of inlet gas flow rates ( Q c o n c e p t ) to determine its effectiveness in removal of the particles from the reactor. The flow rate of the outlet air ( Q t o t a l ) is equal to the sum of the flow rates of two airstreams ( Q r e a c t o r and Q c o n c e p t ). The first airstream is injected into the column to carry the particles into the system ( Q r e a c t o r ) and simulate the bubbling regime of the reactor, while the second the airstream ( Q c o n c e p t ) is injected to pneumatically remove the particles. The flow rate of the air injected into the reactor column, Q r e a c t o r , was fixed at 14.5 standard liters per minute (SLPM) to ensure the matching of the identified dimensionless groups between the hot and cold prototype reactors (listed in Table 3 and 
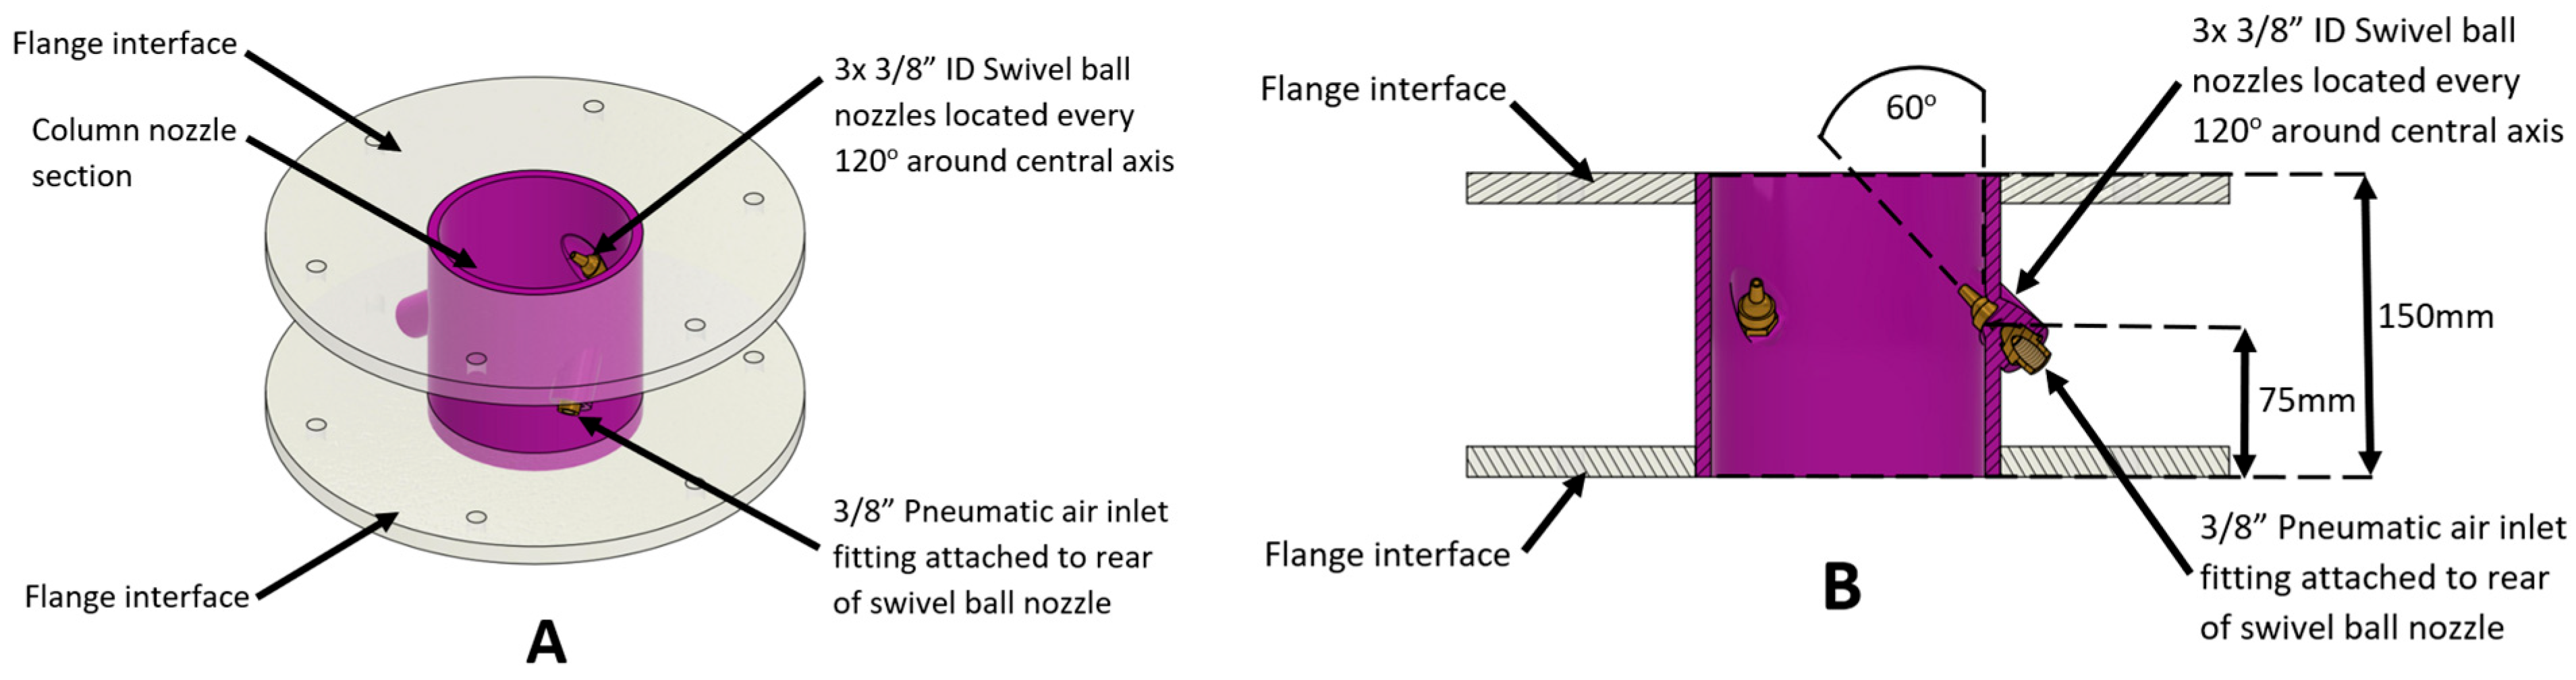
Table 4). However, the flow rate of the injected gas employed to remove the particles pneumatically was changed to assess the performance of each concept. In each experiment, a fixed airflow rate was set for a period of 10 min, while the mass of particles removed from the system was continuously measured and recorded. This was then used to generate the mass removal rate in mass per time, e.g., g/min. The pneumatic airflow speeds into the removal concepts were also area averaged to yield superficial gas velocity. On this basis, the gas fraction (Equation (2)) shows the pneumatic airflow rate through the removal mechanism against that of the bubble column flow rate.
X g = R e m o v a l   d e v i c e   f l o w   r a t e B u b b l e   c o l u m n   f l o w   r a t e = Q c o n c e p t Q r e a c t o r
The particle fraction (Equation (3)) was defined as the mass of particles removed from the system ( m p , o u t ) divided by the mass of particles entering ( m p , i n ) the cold prototype system.
X p = P a r t i c l e s   r e m o v e d   ( m a s s ) P a r t i c l e s   a d d e d   ( m a s s ) = m p , o u t m p , i n
The saltation velocity (Equation (4)) is the velocity that marks the transition point between settling or particles being lifted and conveyed within a system. Hence, it was also used to compare the removal mechanisms against one another. This is of relevance, as many of the concepts are intrinsically reliant upon pneumatic conveyance. The saltation velocity ( v S A L T ) was estimated (Equation (4)) using the Rizk correlation [23], as follows:
M ˙ s ρ g · U s l t · A = 1 10 ( 1440 d p + 1.96 ) v S A L T g · D 1100 d + 2.5
Here, M ˙ s is the particle flow rate, ρ g is the gas density, A is the face area of the particulate bed, d p is particle diamter, g is gravitational acceleration and D is a characteristic length, which is assumed to be the diameter in each developed concept.

5. Error Analysis

Experimental uncertainties exist due to the measured masses of added and removed particles, water contained in the extracted material, measured volumetric flow rates of inlet gas (both bubbled through the column and used in pneumatic methods) and system losses. The particles were seen to clump in the presence of hydrostatic forces, resulting in some water being removed from the cold prototype reactor during testing, the exact amount of which was difficult to accurately measure. In doing so, a sample of removed particles was taken and weighed and then allowed to dry, after which it was weighed again. It was determined that ~22% of the initial weight was water. It was also found that up to 10% of the microspheres remained in the system tubing, as shown in Figure 3 and Figure 4, during experimental testing. This effect is accounted for as detailed in Table 6. The EK-610i precision scales used to weigh the particulate mass have an uncertainty of ±0.01 g. The particle feeder system also had an uncertainty of ±0.1 g when operating at a speed of 1.2 g/min. The experiment duration has an uncertainty of ±1 s, to account for the time delay between the shutoff of the removal system and the final fluctuations in the recorded mass. Table 6 presents the uncertainties calculated for this investigation.
In order to reliably determine the particle removal fraction of each separation method (Equation (3)), several important masses and uncertainties are recorded, as outlined in Table 6. m t o t a l , o u t denotes the total mass removed from the system. The equation for this is given (Equation (5)). This total mass removed consists of the removed particle mass ( m p , o u t ), the removed liquid mass ( m w a t e r ) and the losses of mass, where particulate has remained trapped in the tubing ( m t u b i n g ). This equation can be rearranged to yield (Equation (6)), which denotes the particle mass removed from the system ( m p , o u t ), which is used to calculate the particle removal fraction (Equation (3)). The uncertainty in the total mass ( m t o t a l , o u t ) is also given (Equation (7)).
m t o t a l , o u t = m p , o u t + m w a t e r m t u b i n g ± m t o t a l , o u t
m p , o u t = m t o t a l , o u t m w a t e r + m t u b i n g ± m t o t a l , o u t
m t o t a l , o u t = m p ,   i n 2 + m w a t e r 2 + m t u b i n g 2
There is also uncertainty associated with the measurements taken from the pneumatic air system and its volumetric flow rates. These uncertainties were present in the rotameter and ALICAT flow meters (Figure 4). The rotameter and ALICAT flow meters preformed separate tasks. The rotameter was responsible for determining the airflow rate into the removal system ( Q c o n c e p t ), whereas the ALICAT flow meter was used to measure the flow rate of air into the base of the reactor ( Q r e a c t o r ). The rotameter had an uncertainty of ±8% and the ALICAT flow meter had an uncertainty of 0.1 SLPM when operating at the fixed speed of 14.5 SLPM (approximately ±0.69%). These uncertainties are factored into the volumetric flow rates, for both the removal concept flow rate (Equation (8)) and the reactor column flow rate (Equation (9)).
Q c o n c e p t = Q c o n c e p t ± Q c o n c e p t = Q c o n c e p t ± 8 %
Q r e a c t o r = Q r e a c t o r ± Q r e a c t o r = Q r e a c t o r ± 0.70 %
This evaluation, for both mass fraction and gas fraction, was applied to all tests conducted using the cold prototype reactor and is reported as the error bars shown in the results.

6. Results and Discussion

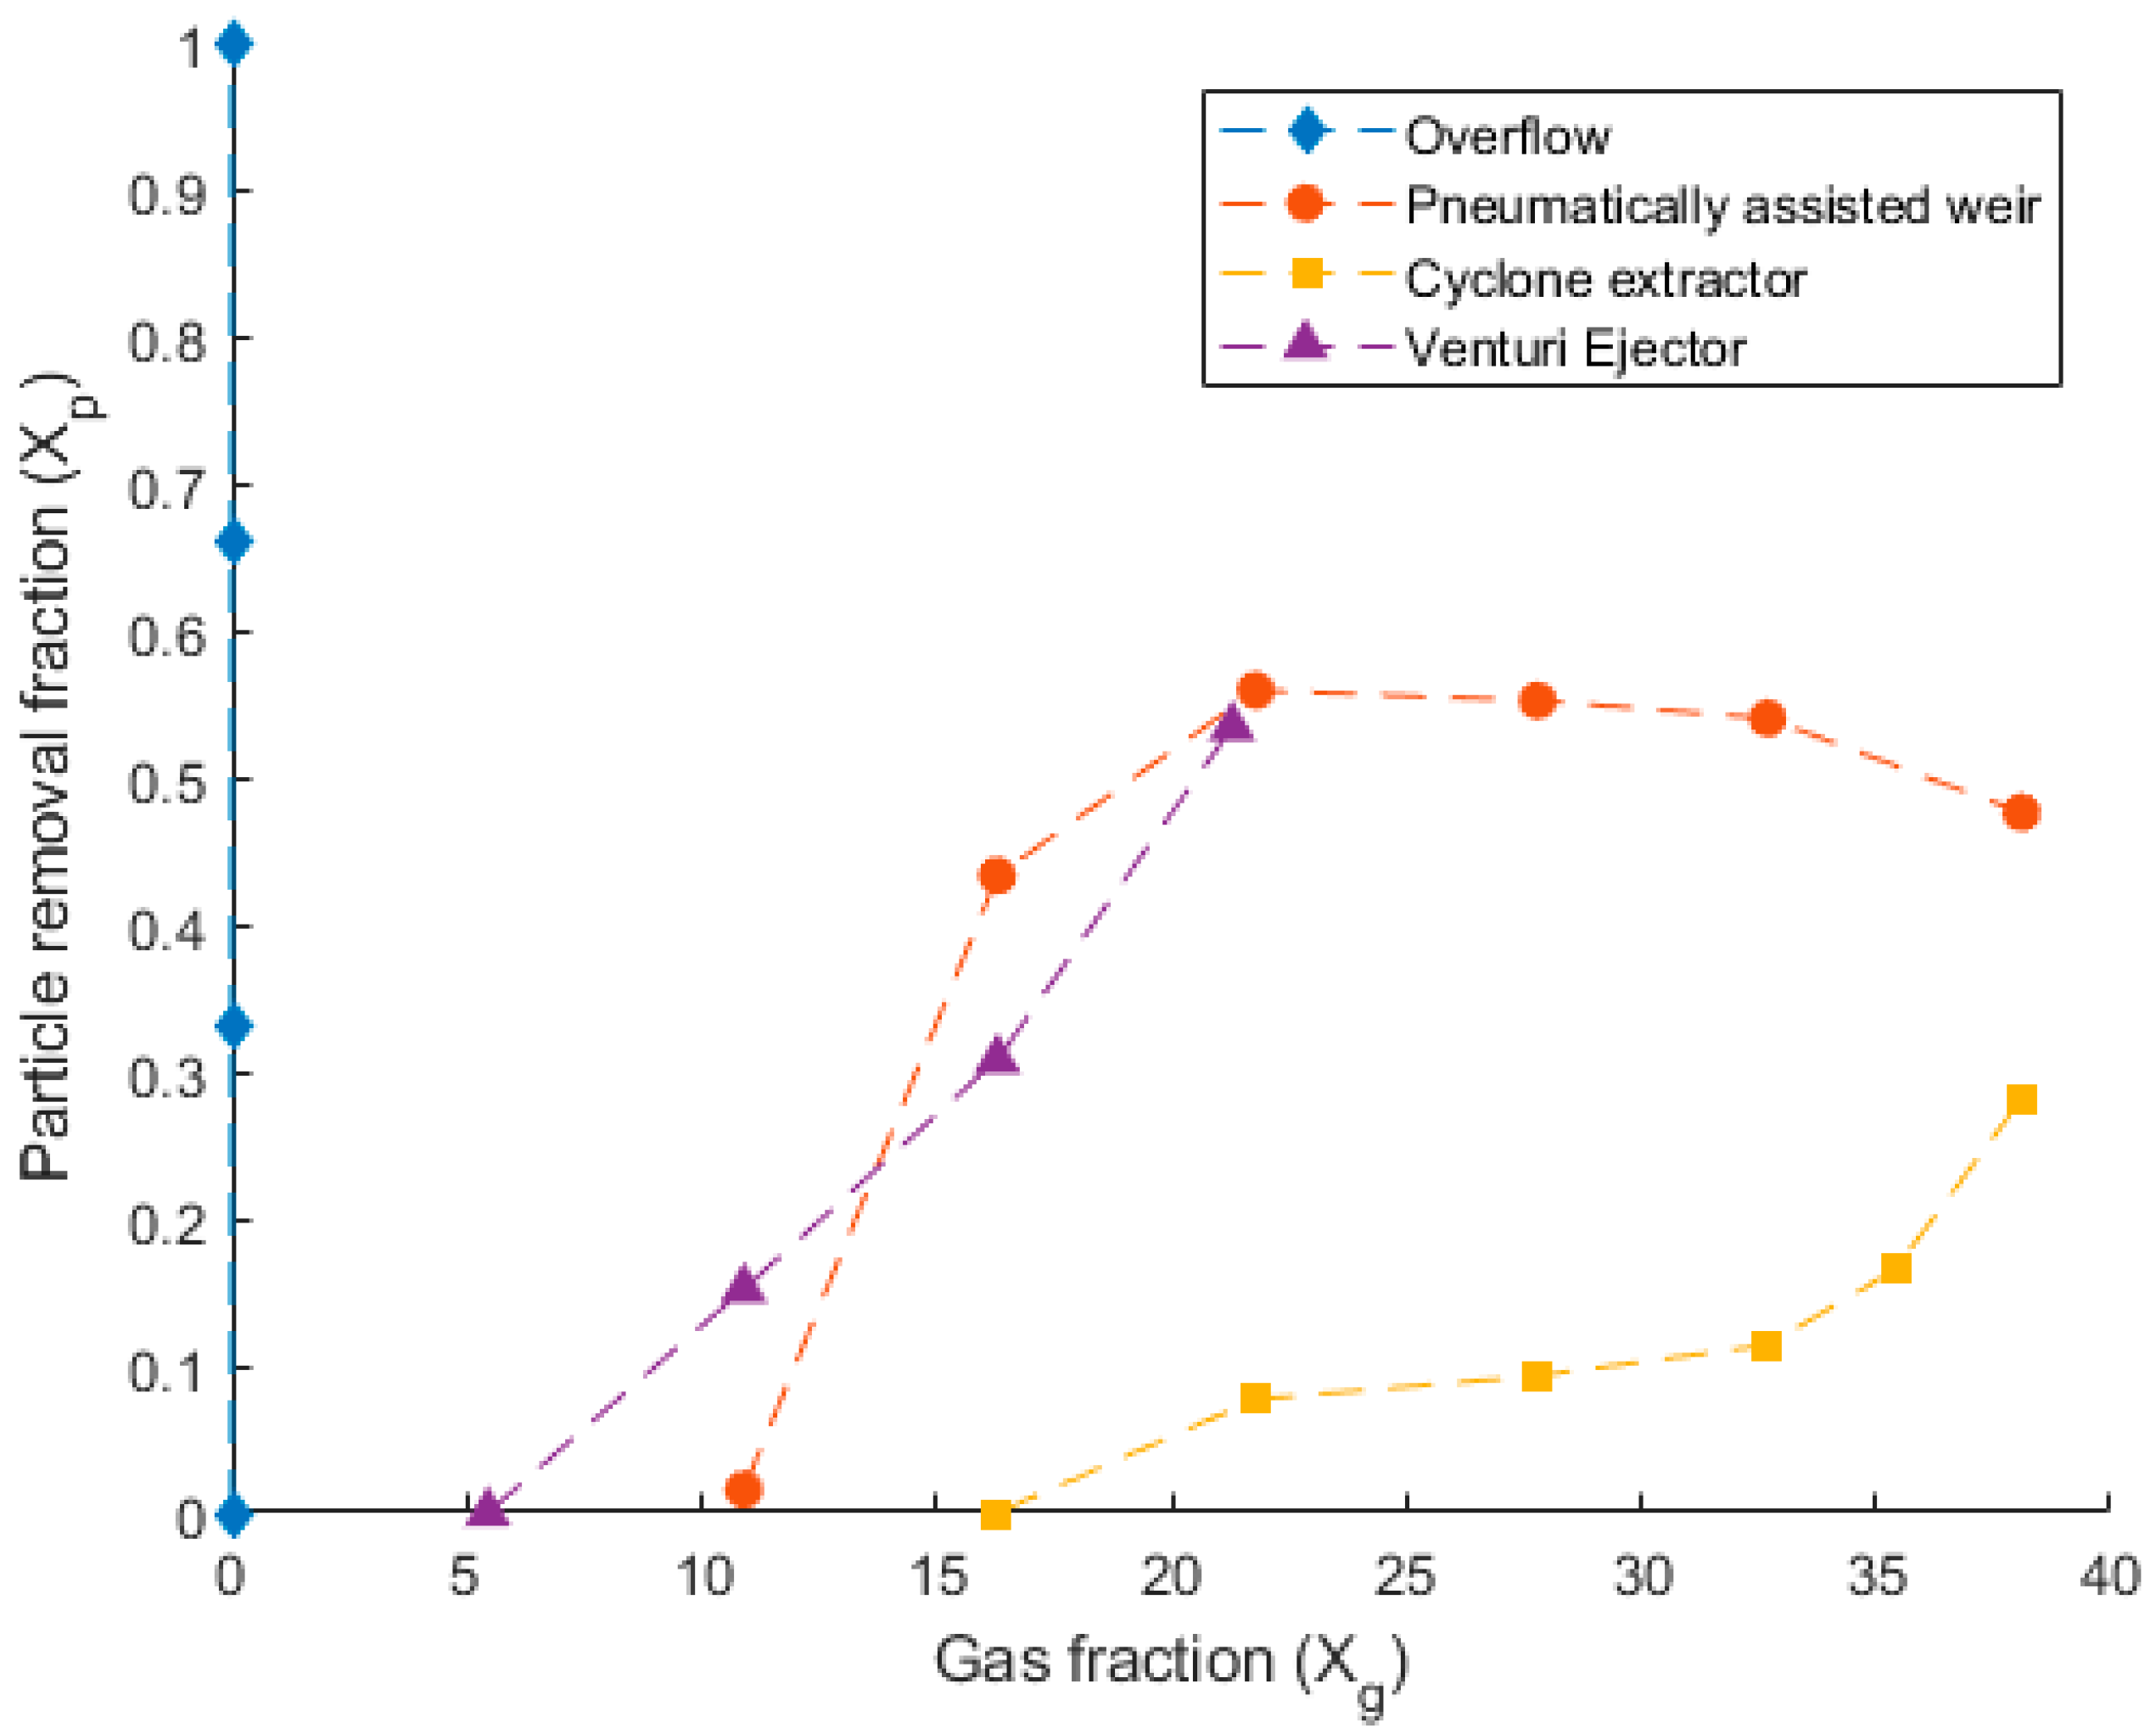
Figure 9 presents the performance of each removal method in the cold prototype test apparatus. Depicted is the particle removal fraction ( X P ) and the gas fraction ( X g ). It can be seen from Figure 9 that the performance of each concept is different and linked to the gas fraction at each instance. The removal performance of the pneumatically assisted weir was seen to increase sharply as the gas fraction increased between 10 and 20. This reached a peak removal rate of 55%, in which the assisted weir was able to remove 55% of all particulates entering the system. After this, the performance of the assisted weir stagnated, declining as the gas fraction was increased beyond 30.
The cyclone extractor, depicted in Figure 9, is seen to only remove particulate when the gas fraction is higher than 17. Beyond a gas fraction of 17, the cyclone extractor begins to remove particulate, becoming exponential between gas fractions of 30 and 38. The maximum removal rate of the cyclone extractor was 28%.
The venturi ejector was seen to begin removing particulate at the lowest gas fraction of 6. The removal performance of the ejector was approximately linear and could be seen to constantly increase to a maximum removal rate of 54% at a gas fraction of 22. The overflow concept is also included in Figure 9 for completeness. This removal system was passive and did not feature a separate airflow rate through the concept itself. It is for this reason that its gas fraction remains at 0, as the numerator of X g is 0, whilst there is still a non-zero denominator due to the gas entering at the base of the reactor column. This concept was seen to remove the particulate mass from the system over the 10 min trial. However, at the later stages of each test, the overflow device contained large amounts of the reactor column fluid, in addition to the particles. Which is extremely undesirable.
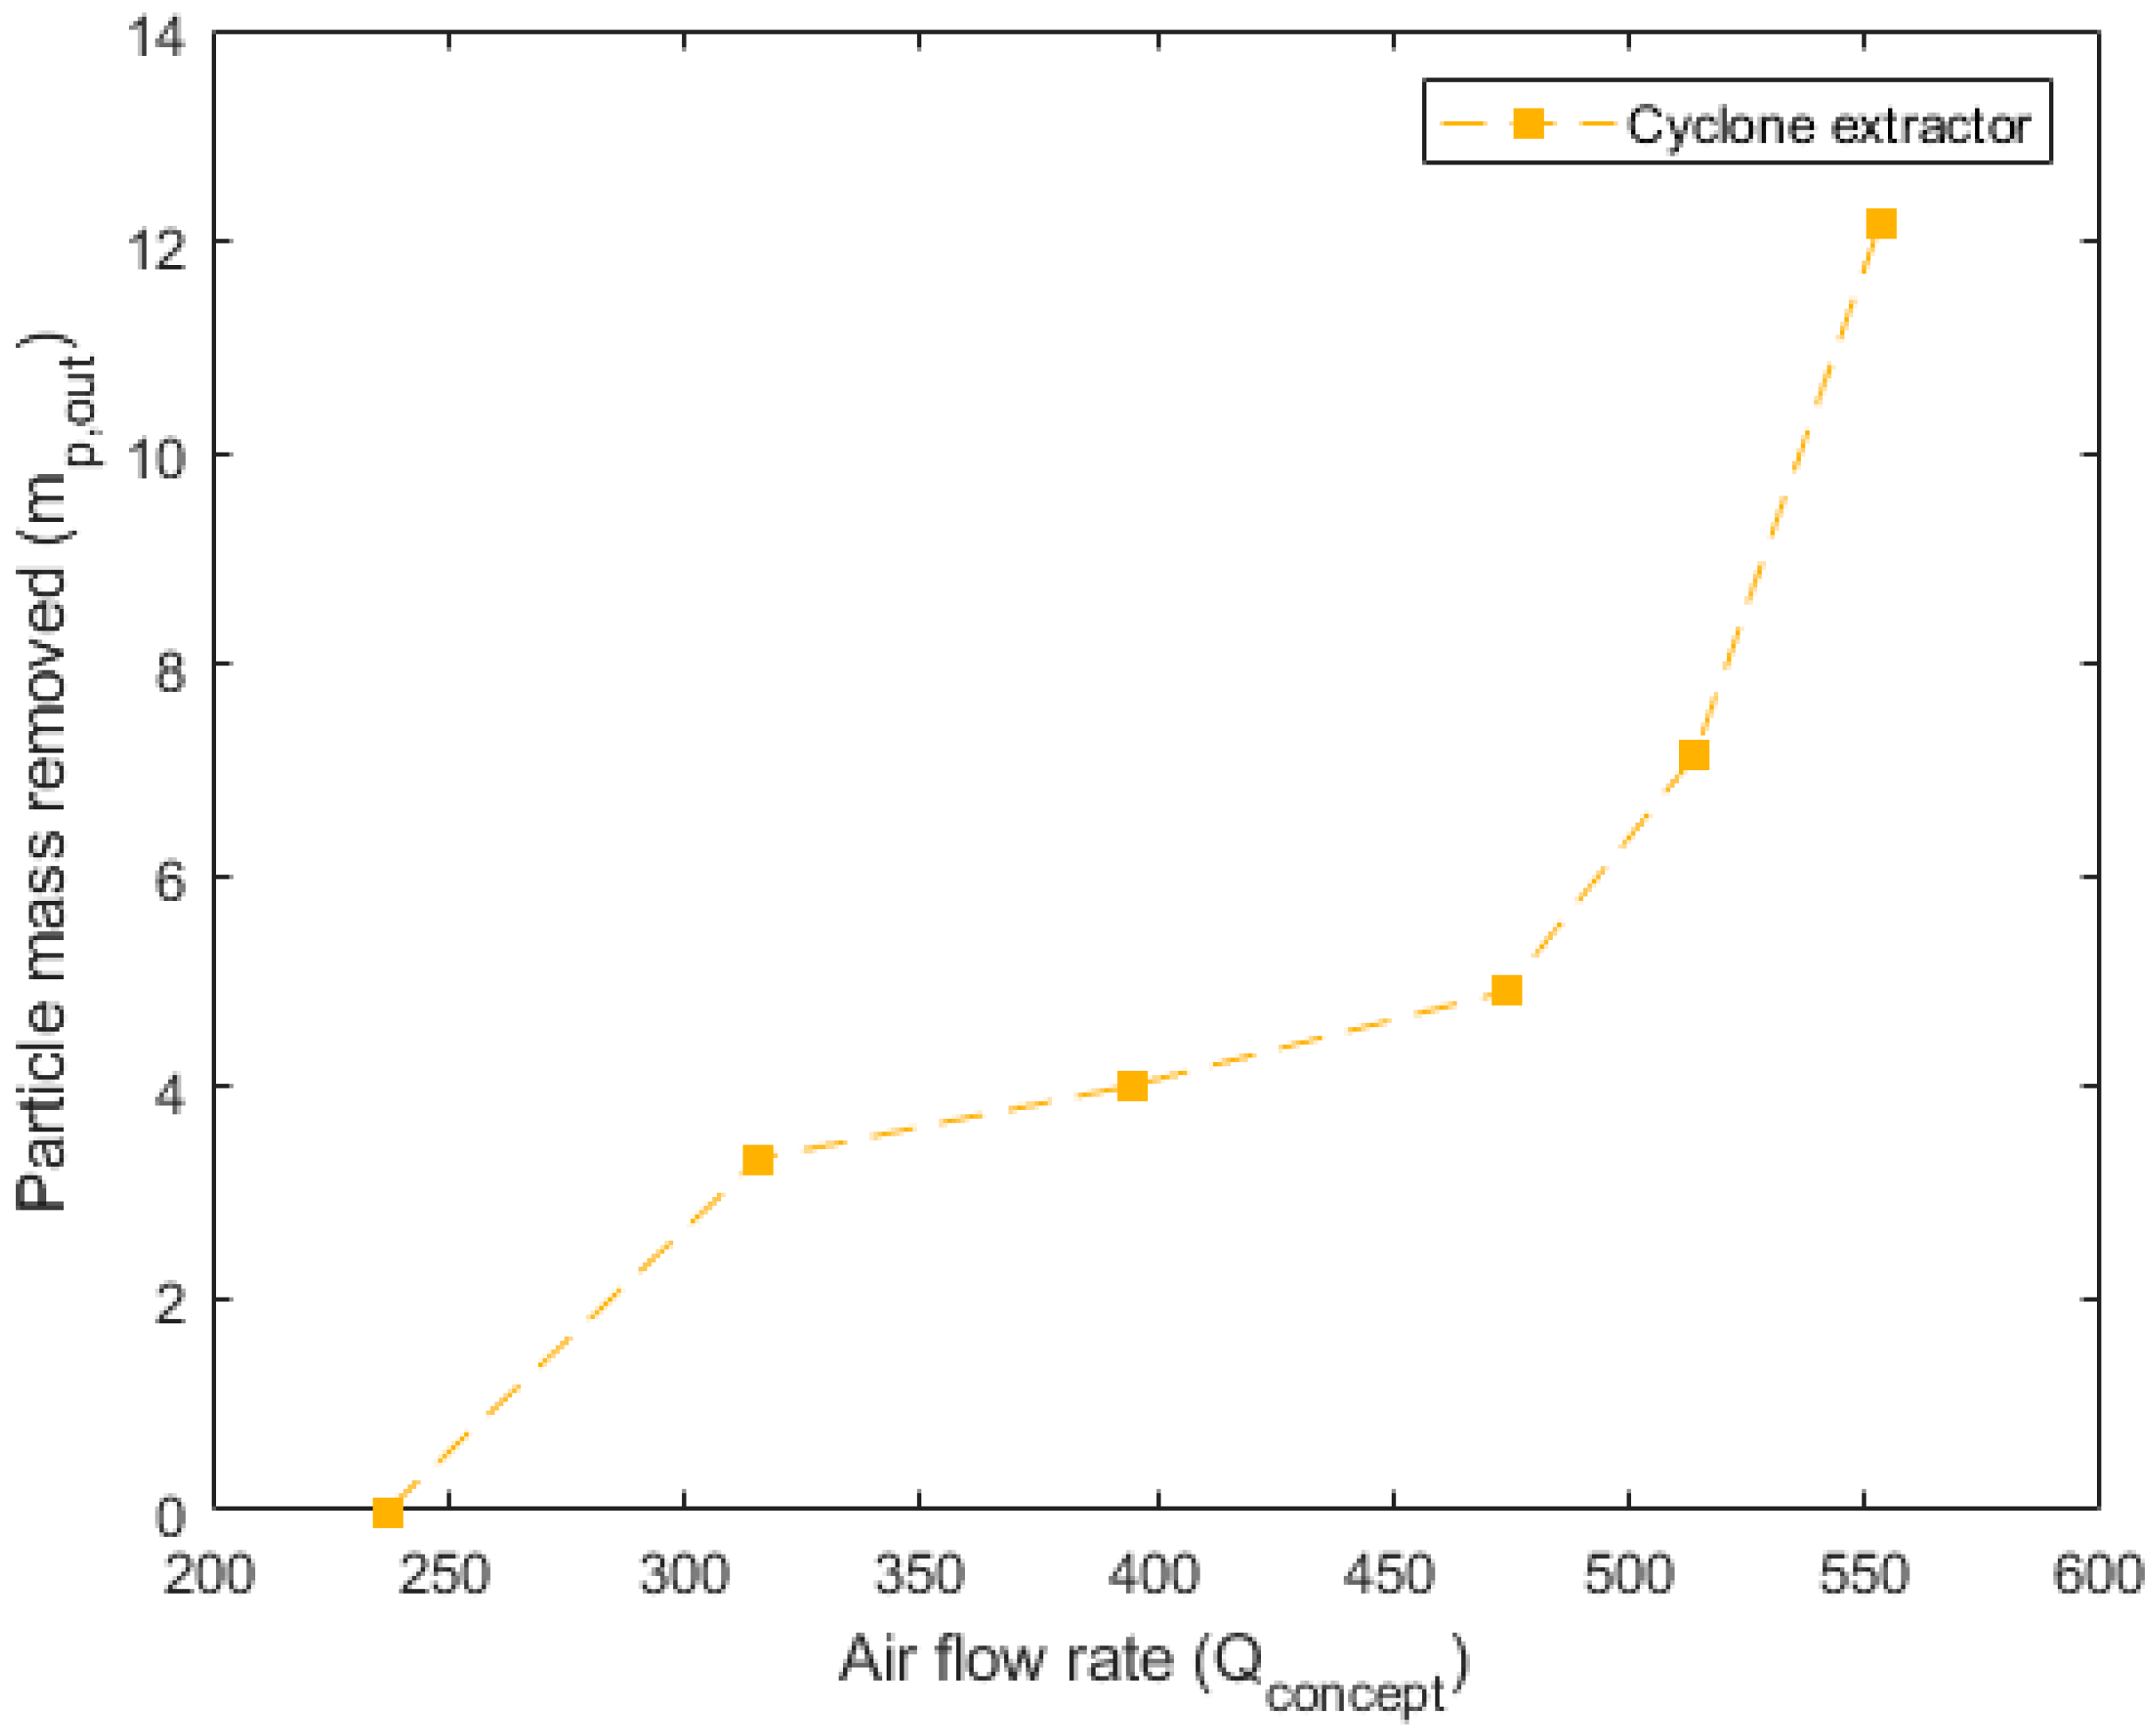
Figure 10, Figure 11 and Figure 12 detail the specific, non-dimensionalized performance of each of the concepts. These plots present the actual mass removed, in grams, on the y-axis and the flow rate into the concept, in standard liters per minute, on the x-axis. These plots offer a comparison of the actual mass of particulate removed from the system in each 10 min trial. For the pneumatically assisted overflow weir, at peak removal, 23.83 g is removed from the system. This is significantly higher than the 12.15 g that are removed from the cyclone extractor, but close to that of the venturi ejector, which was able to remove 23.05 g.
Another important aspect is the airflow rate required to reach the maximum particulate removal. For the pneumatically assisted weir, this occurs at 316 SLPM, 553 SLPM for the cyclone extractor and 308 SLPM for the venturi ejector. The lower relative airflow rates of the pneumatically assisted weir and venturi ejector highlight their suitability for industrial applications. This is because, in an industrial device, the net energy requirement for the removal of a given mass impacts the final production cost, which includes the required flow rate, cooling of the hot gas phase and compression before reinjection to a particle removal device. Relatively low airflow rates, but high extracted mass, such as those seen in the assisted weir and venturi ejector (Figure 10 and Figure 12), incur lower parasitic energy requirements than the cyclone extractor, which requires much higher flow speeds.
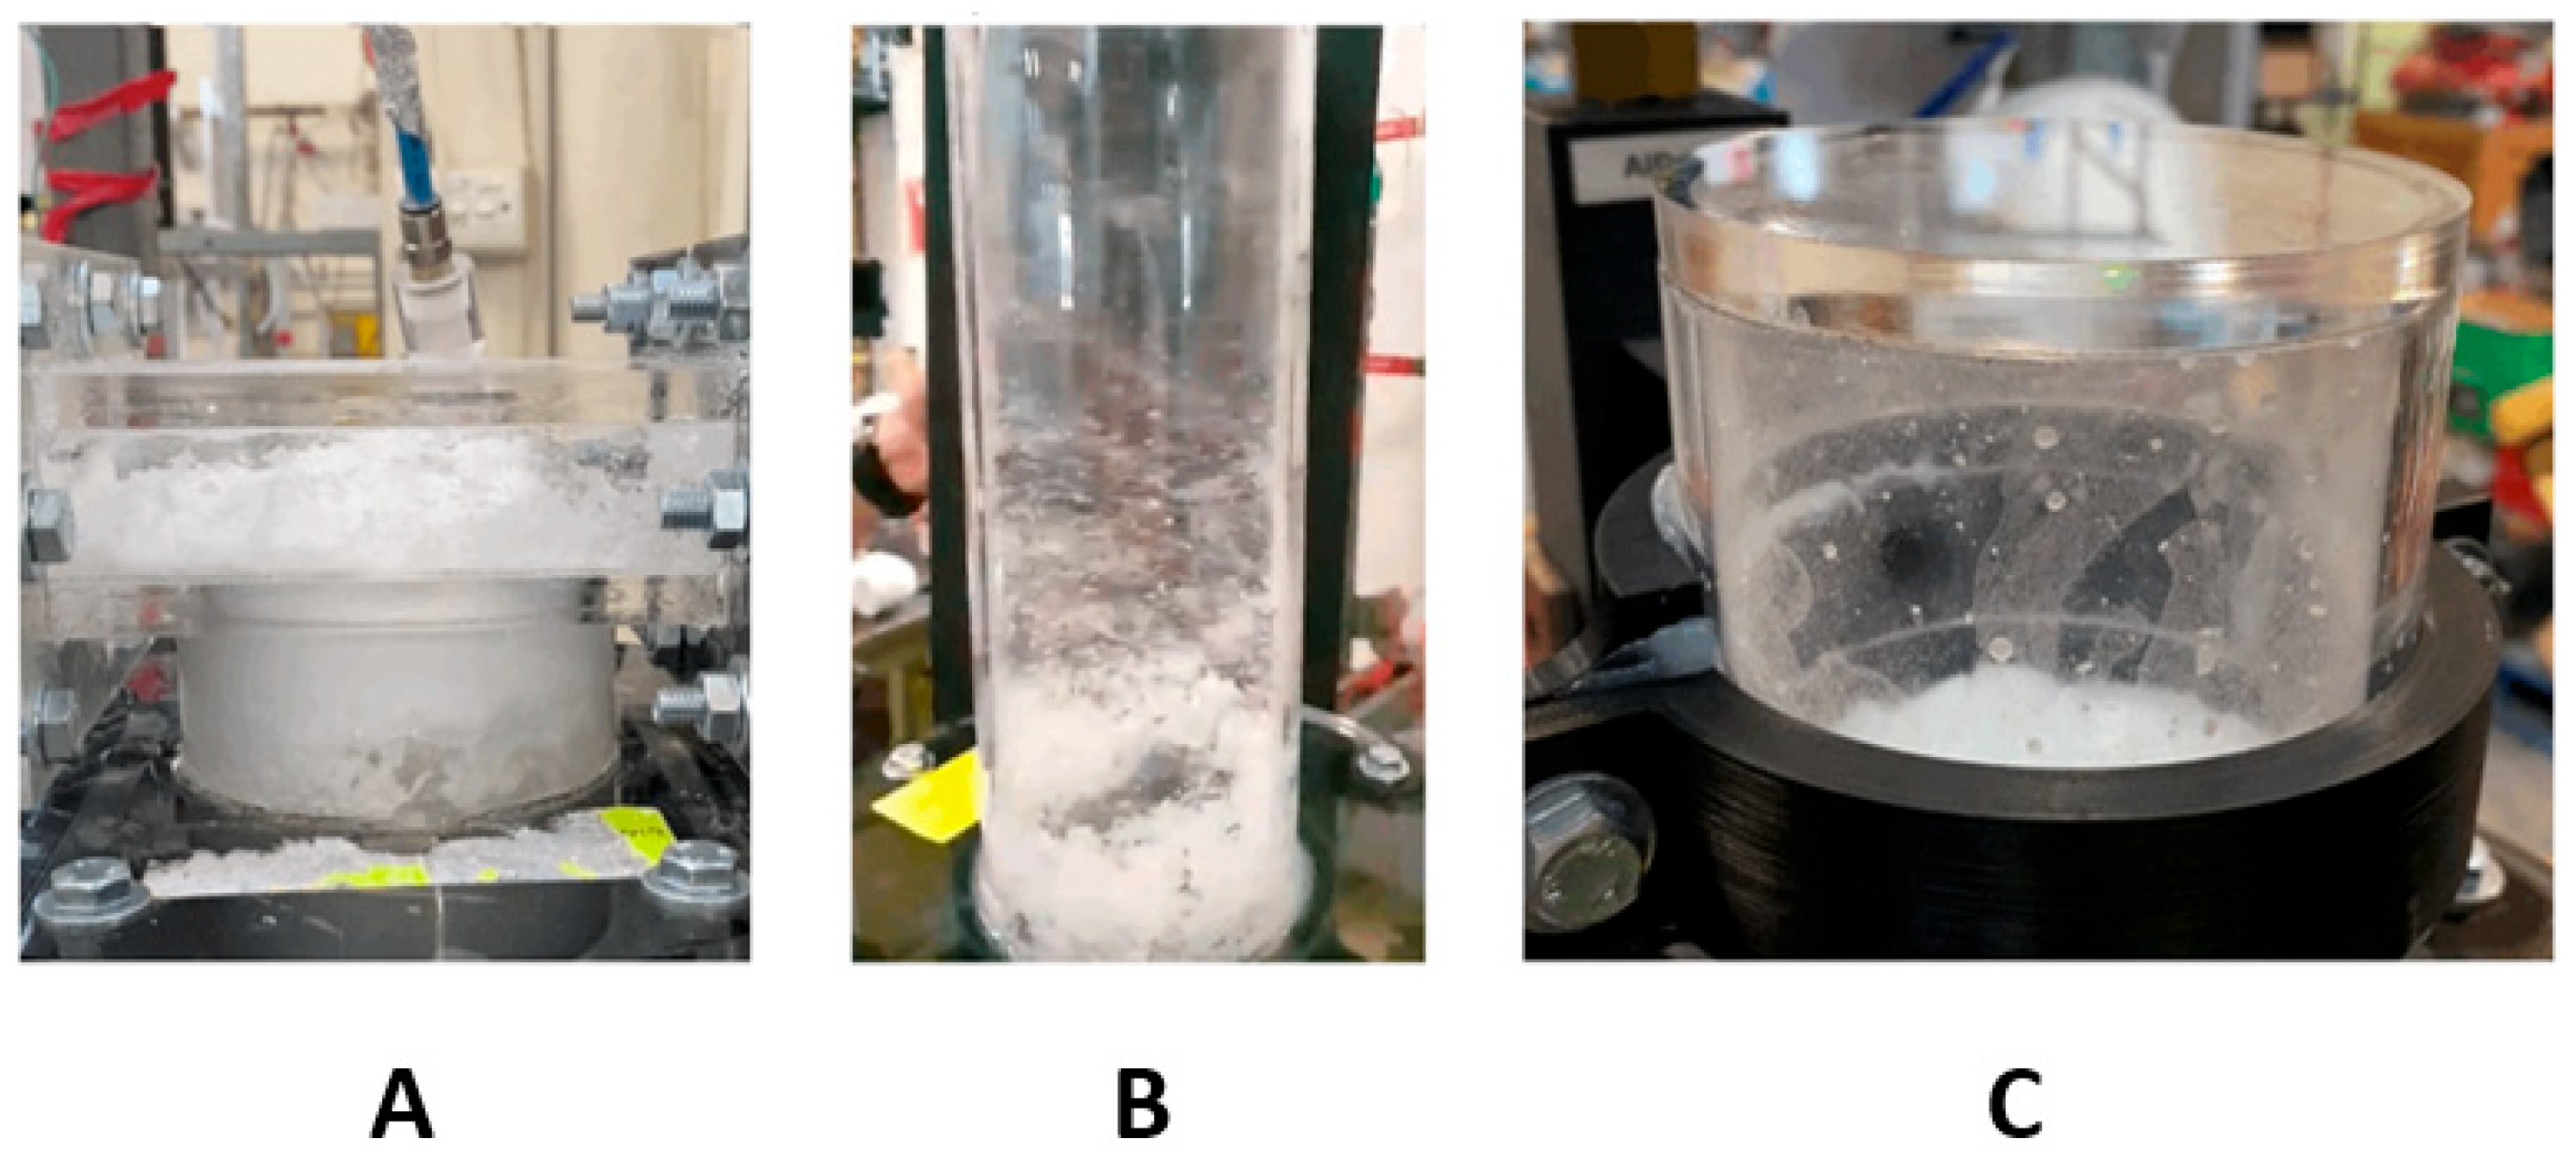
Furthermore, when discussing suitability of each method to the real world, the physical behavior beyond just the extracted mass must be assessed. Figure 13 shows the three pneumatic concepts during testing. Figure 14 shows the overflow concept. For the pneumatic concepts, Figure 13A is the assisted overflow weir, 13B the cyclone extractor and 13C the venturi ejector. The white masses shown in Figure 13 are the microsphere particles used to represent the carbon particulate. This particulate was seen to build up and accumulate in different manners, depending on the separation concept. Further analysis of this is provided in Figure 14, Figure 15 and Figure 16.
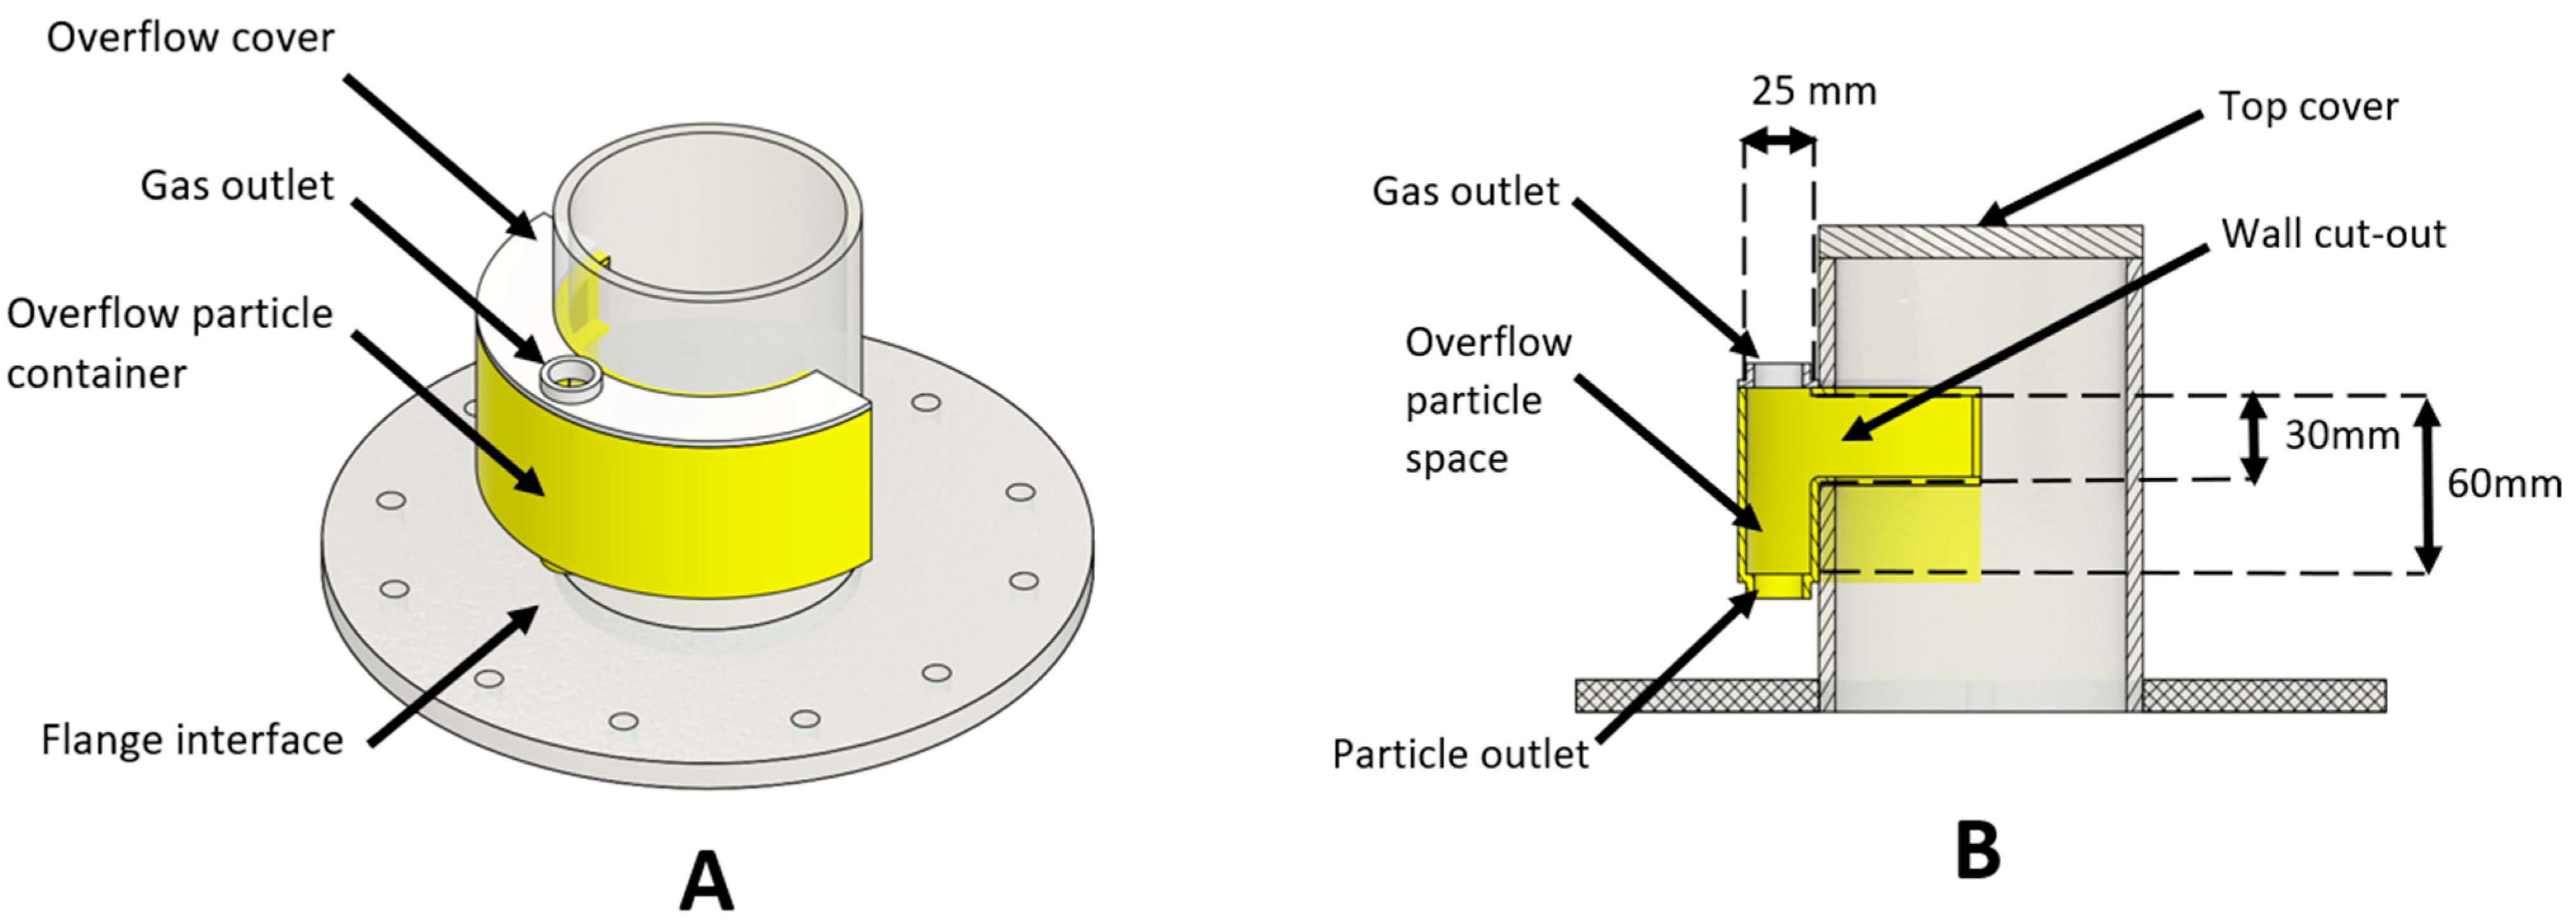
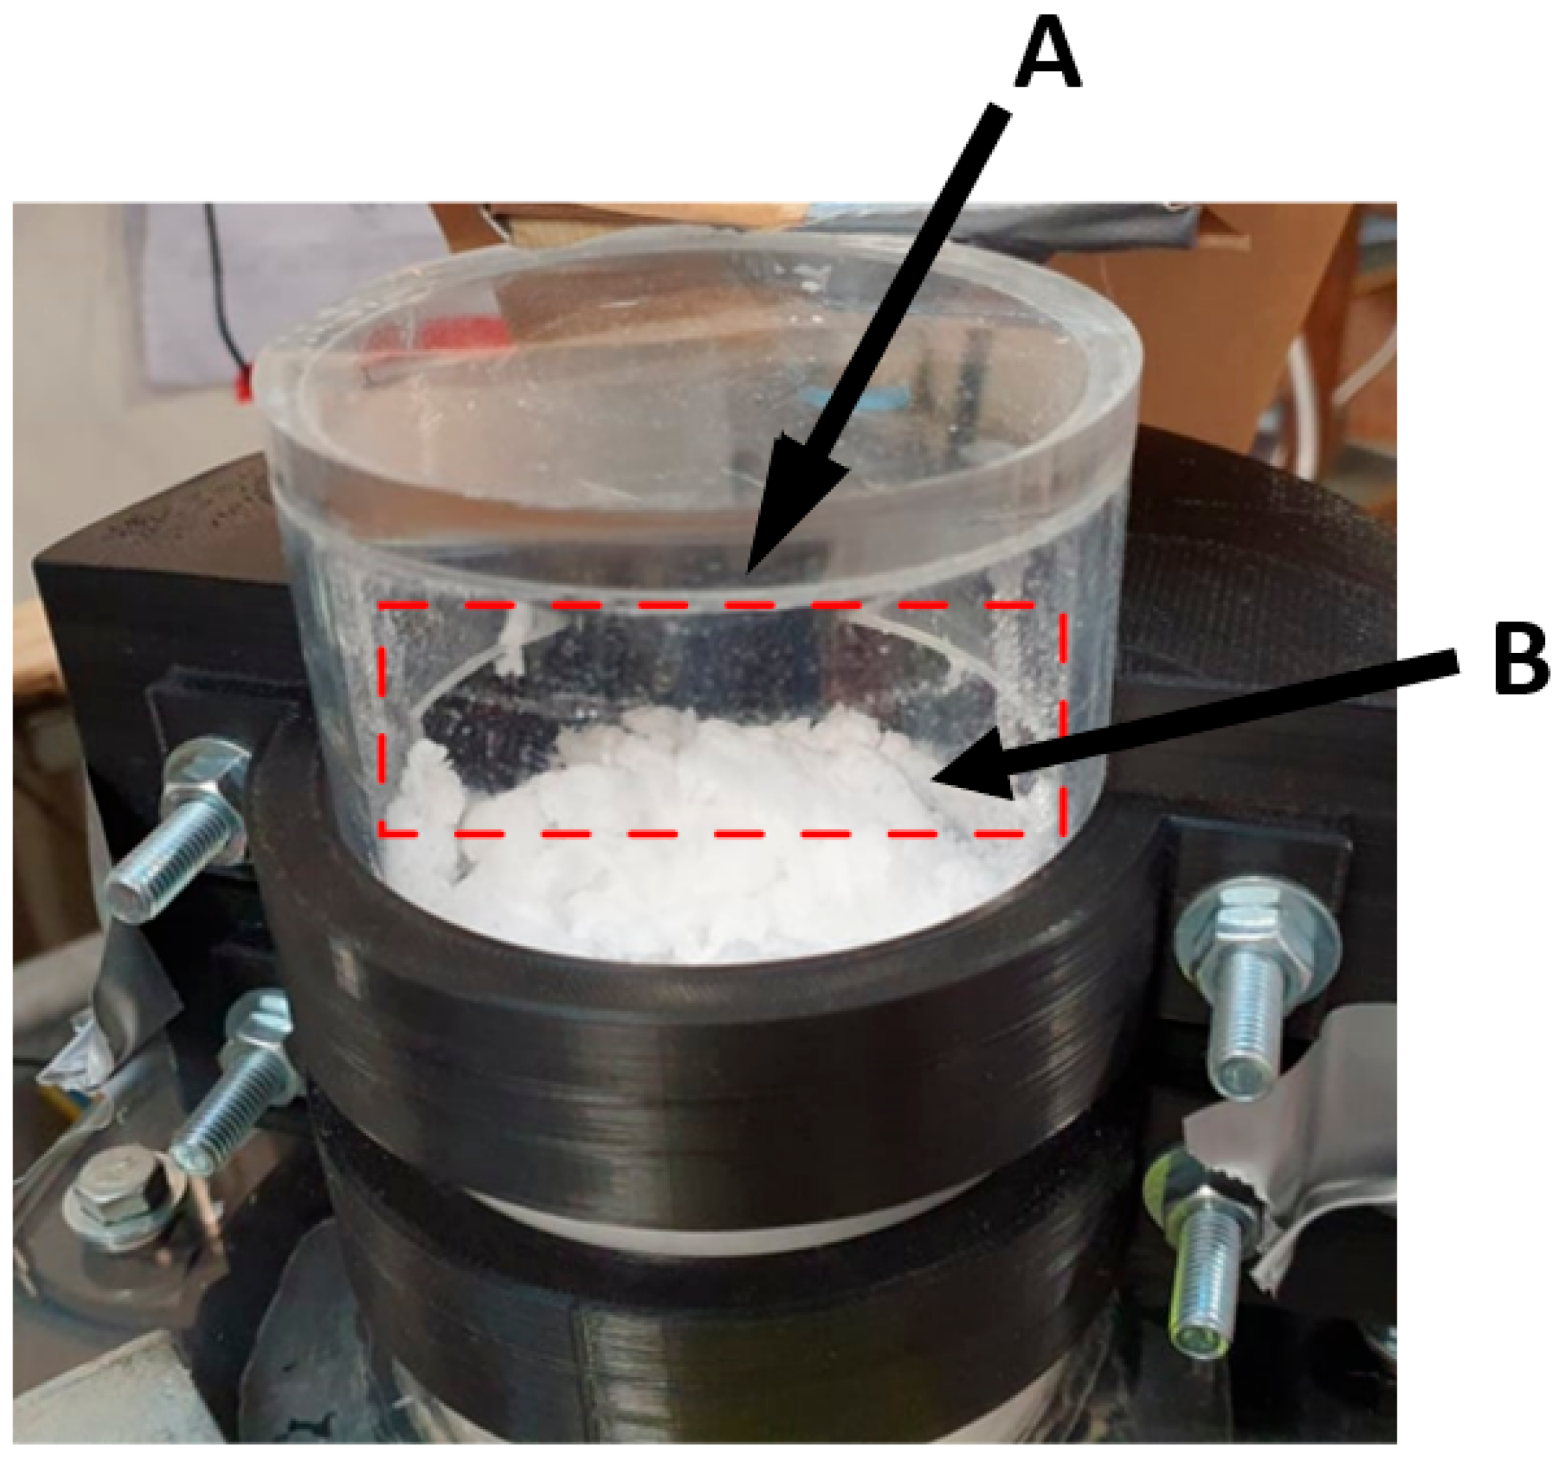
Mechanically, the operation of the overflow concept was the simplest. This can be seen in Figure 14. The particulate level would build over the duration of the 10 min trial. When this level was sufficiently high, the particles would overflow the sides of column and into the extraction system. Whilst this worked well initially, resulting in predominantly particulate separation, the bubbling of the column resulted in water being extracted. The combination of particles and bubbling fluid caused the particles to clump, as can be seen at B in Figure 14. Operationally, this would present significant challenges in a MCB methane pyrolysis reactor, as the liquid metal may be extracted with any carbon particulate, complicating the refinement of the carbon product.
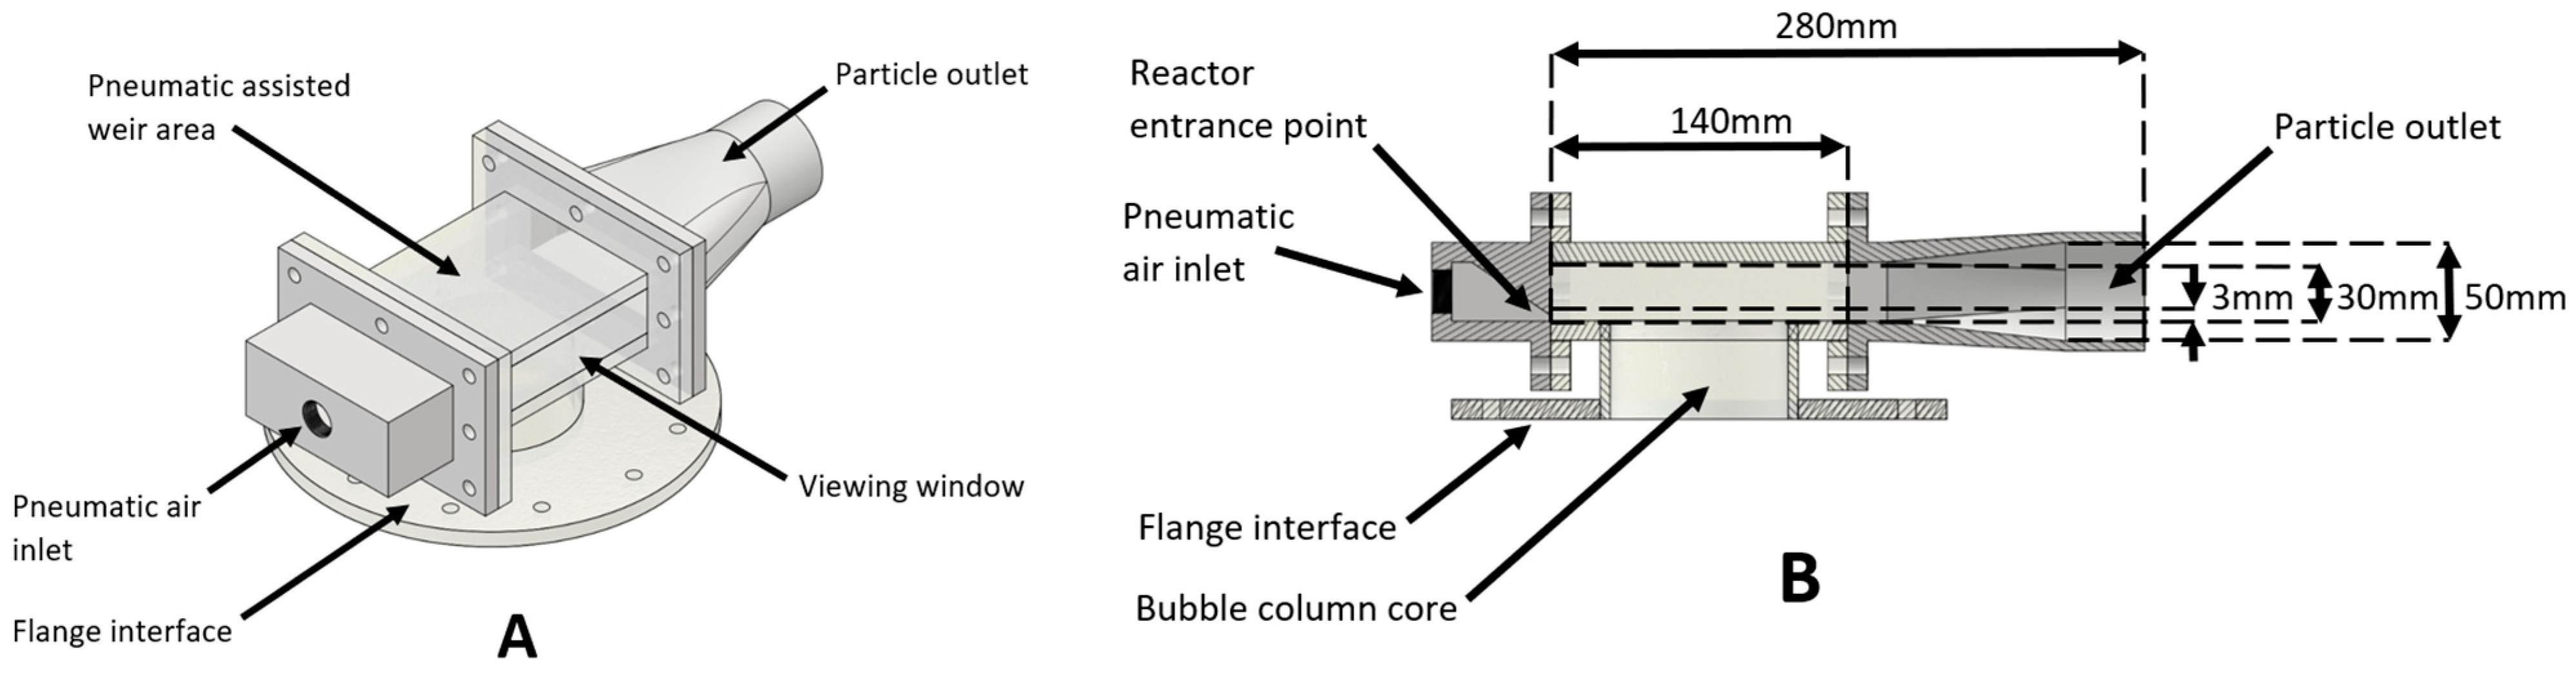
Interesting air and particle dynamics were observed during the operation of the pneumatically assisted overflow weir. Figure 15 displays images of both the overhead view (left) and side view (right) of the weir. Particle formation and clumping were seen to occur on the roof of the weir duct at A and also above the pneumatic air inlet at B. Shown in the righthand side of Figure 15 is the turbulent disturbance to the particle fluid interface. The surface of this was affected by the pneumatic air passing over it. This caused the surface to rise, closest to the inlet, and drop on the opposite side of the reactor particle fluid interface. This phenomenon would be undesirable if the technology was deployed in an upscaled, functioning MCB methane pyrolysis reactor. This could correlate to reduced removal efficiency for larger diameter columns, as the effect will have a large surface to act on.
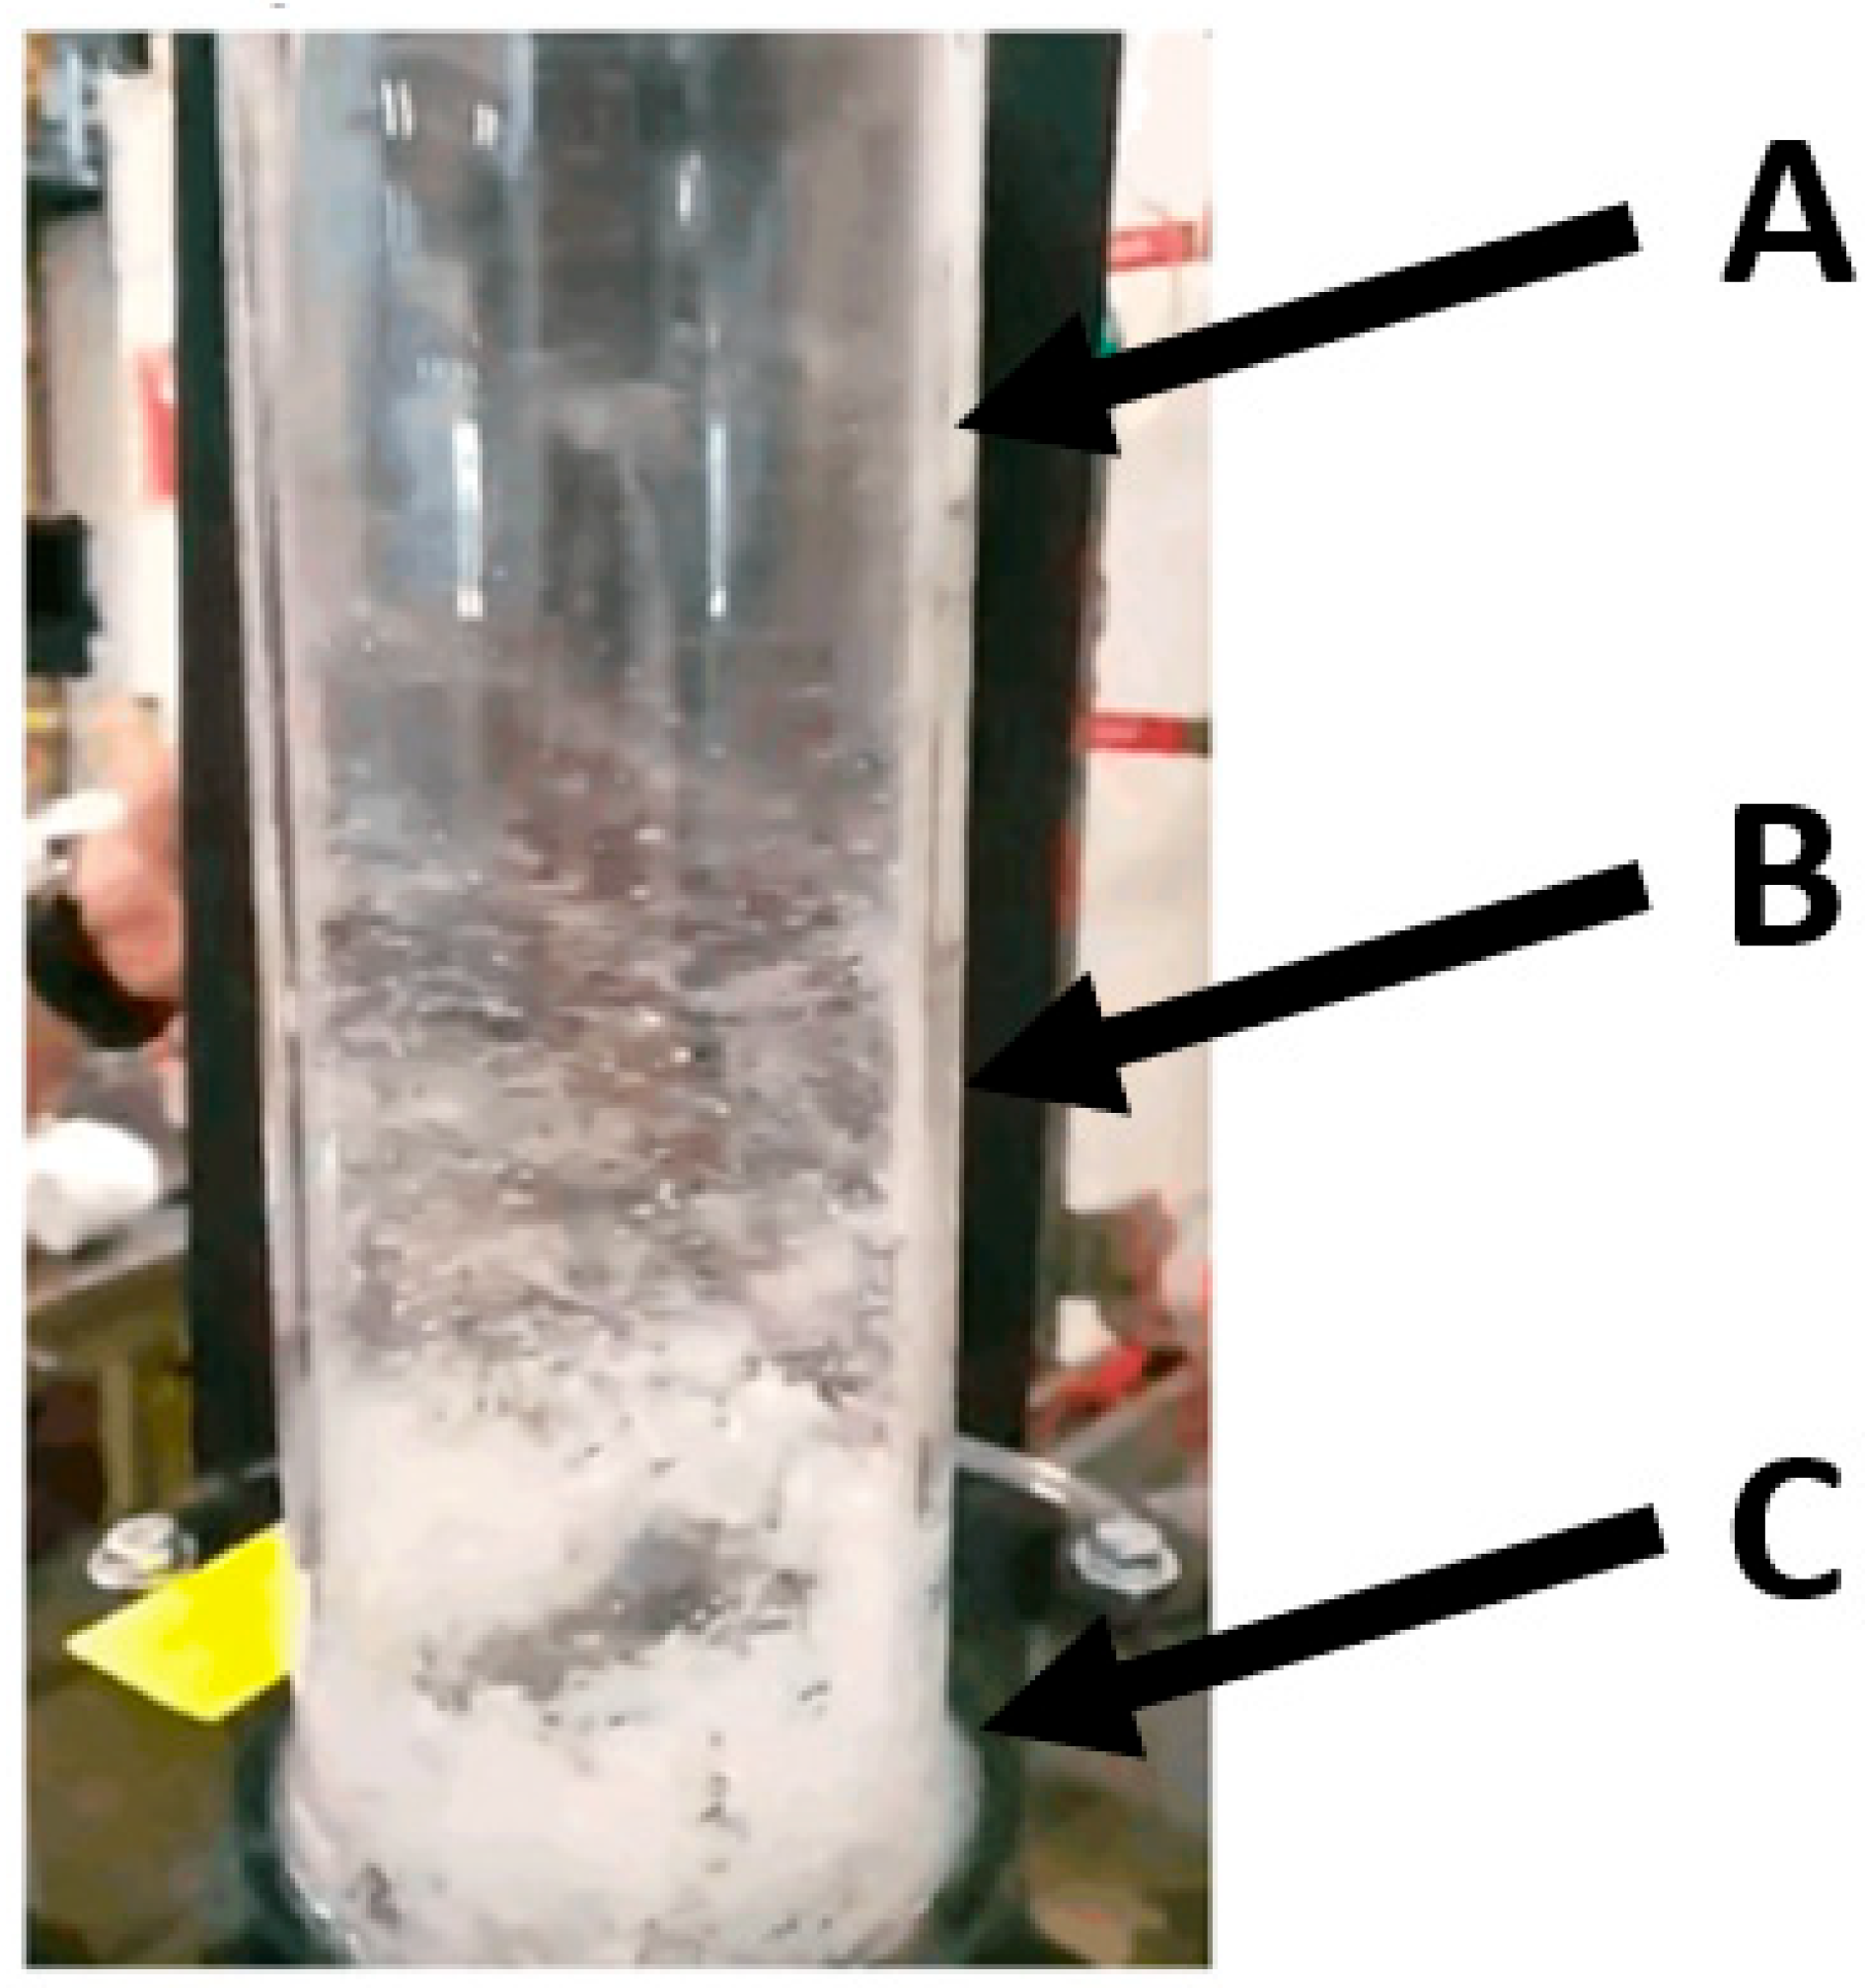
During the operation of the cyclone extractor, depicted in Figure 16, several observations were made. The degree of particle entrainment varies as the vertical height of the column is increased. Furthest from the fluid particle interface, at A, there is less particles than lower down at B and C. This is likely due to two factors: The first is the disbursement of the pneumatic airstream. The nozzles are located at C, which results in a high-speed, strongly swirling flow that separates as it moves vertically up the column. This separation then results in a vertical and swirl speed decrease as it transitions from C to B and then from B to A. The second factor is the entrainment of the particles. Some particles do not remain sufficiently entrained in the flow. This causes them to separate and fall back down to the particle interface. This was seen to occur at B and C, where the flow is chaotic and turbulent. This phenomenon indicates that scaling the separation technology to industrial scale—by increasing the extractor height—may result in a greater degree of difficulty entraining these particles in the flow, decreasing separation efficiency. However, it was noted that as the particle–fluid level increased, as more particulate entered the test reactor, the separation between the nozzles and interface reduced. This reduction corresponded to a greater degree of particles becoming entrained in the airstream.
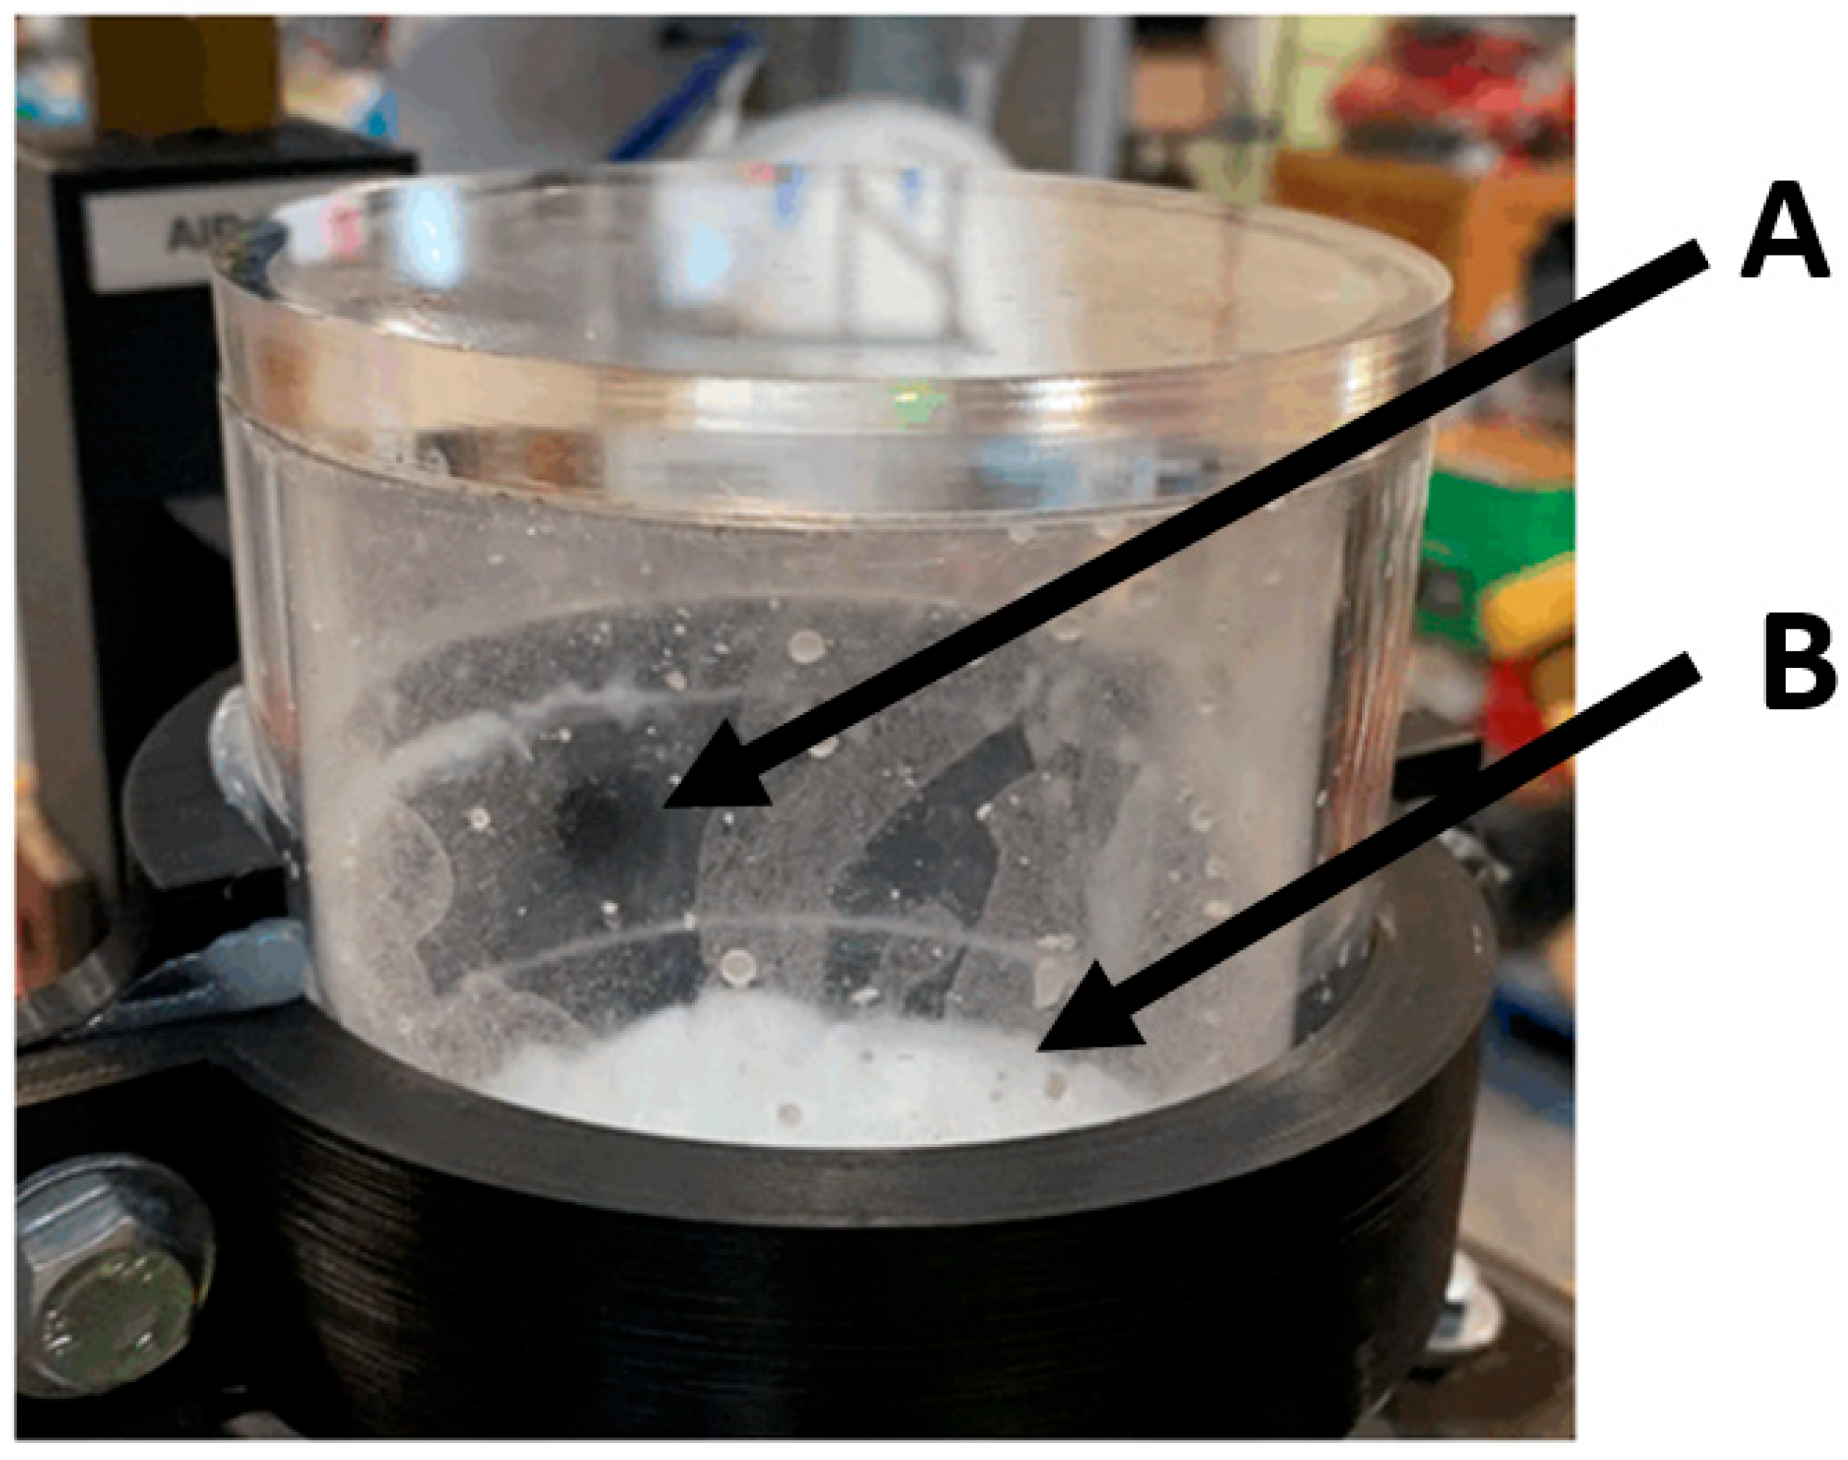
The operation of the venturi ejector, shown in Figure 17, displayed the smallest degree of turbulence and particle disturbance. The ejector or suction port, located at A, was seen to relatively cleanly extract the particles present on the fluid interface at B. Unlike the pneumatically assisted weir and cyclone extractor, there was no turbulent flow regime present in the test reactor. This can be seen by the lack of particulate splatter present in Figure 17. During operation, the particle bed height increased as the microspheres built up in the system. Upon reaching the level of the suction port (Figure 16A), the particles were efficiently removed from the system. It was also seen that at higher flow speed, and subsequent higher venturi pressures, the particle-fluid level height would be drawn up closer to the suction port at A. This effect scaled proportionally with flow speed into the venturi, as detailed in Figure 9 and Figure 12. The relative ease of operation, and limited turbulence indicates that the venturi ejector concept should be investigated further.
The final comparison between the removal methods is specific to those that utilize pneumatic air. As discussed in Section 4, the saltation velocity (Table 7) is the point that marks the transition between particles at rest, and those that are conveyed within a system. This is calculated according to (4), using the density of the pneumatic air (1.20 kg/m3), area of the reactor cross fluid interface (m2), mean diameter of the microsphere particles (80 micron), gravity (9.81 m/s2) and the diameter of the reactor (0.09 m). This can be used to determine the expected speed at which the particles will be conveyed. As can be seen from Table 7, the concepts were unable to begin conveying the particles at the expected speed. These differences can be attributed to the fact that each pneumatic concept did not apply the effect directly at the fluid level, but at a distance above it, due to the transient bubbling of the column. Decreasing the separation distance between the concept’s actuation point (where the air is applied) and the fluid level may decrease the difference between the recorded and expected saltation velocity.

7. Conclusions

Experimental testing was undertaken to assess the performance of the four distinct separation technologies—overflow, pneumatically assisted overflow weir, cyclone separator and venturi ejector—for the removal of solid particles from a MCB methane pyrolysis reactor, using a cold prototype column. A dimensionally similar cold prototype reactor was developed to simulate a functioning hot reactor. The cold prototype was developed based on the existing literature and the important physical effects that would be present at high temperature. To ensure the cold prototype simulated the physical effects accurately, its particle Stokes number, particle Froude number, Reynolds number, gas Froude number and density ratio were matched. The close physical similarity, as depicted in Figure 2, indicates a robust testing model, that should provide similar physical interactions to a hot reactor. Subsequently, this model was then used for experimental testing that was able to determine the removal rate of particulate from the cold prototype reactor, in addition to the flow rates required to do so. All concepts tested were able to remove particulate from the cold prototype reactor to differing degrees. The overflow achieved a maximum particle removal rate of 100%, pneumatically assisted overflow weir 55%, the cyclone extractor 28% and the venturi ejector 54%. For all concepts other than the overflow, some particulate was retained in the reactor, accumulating predominantly in the extraction piping and reactor overhead. The primary findings from these experiments are:
  • While the overflow separation mechanism can achieve full particle removal (100%), the design is limited by the particle fluid interactions and the extracted mass was contaminated with a large volume of water. If this technology were adapted to a functioning MCB methane pyrolysis reactor, it could result in some of the liquid metal being extracted. Further research into mechanical skimming or the use of filtration systems should be conducted. However, it should be noted that the corrosive nature of the molten metal bubble column materials may hinder prolonged use in industrial environments, where such a mechanism may be detrimentally corroded.
  • The pneumatically assisted overflow weird was able to induce separation at lower gas flow speeds up to a removal rate of 55%. At high flow speeds, turbulent effects became present, with the injected air displacing the particle–fluid interface. This may present challenges if the technology is scaled up for MCB reactors, as it is unknown what effect increasing the diameter of the reactor will have.
  • The cyclone extractor can remove particulate, with relatively lower quantities of liquid than the overflow extraction. However, the effectiveness of the particle separation varies with the height of the column and the height of the nozzles from the particle bed. Moreover, the cyclone mechanism is more effective at high gas flow rates, which may hinder its feasibility in industrial operations, due to the impracticality of implementing high flow rates in a sealed MCB methane pyrolysis reactor.
  • The venturi ejector was effective in removing particulate but was seen to draw up the fluid bed height, decreasing suction port separation. When the bed height was increased, some fluid was drawn into the suction port, contaminating the extracted particulate. This mechanism was successful enough to warrant further analysis, displaying a linear trend in particle removal for increases in flow rate. Further testing should be conducted into adaptions with more than one suction port.
It should be noted that the impact of additional constraints, such as surface tension and wettability, were not explored for the cold prototype or the reference hot reactor. This would be a natural extension of the work and would allow for their respective impacts to be accounted for in further iterations of the removal designs. Further refinement of the presented concepts numerically, computationally or experimentally would be extremely beneficial to the wider state of the art.

Author Contributions

Conceptualization, Z.C.-B., T.D.L.P., C.P., M.R., L.R., J.S., G.J.N. and M.J.; methodology, Z.C.-B., T.D.L.P., C.P., M.R., L.R. and J.S.; validation, Z.C.-B., T.D.L.P., C.P., M.R., L.R. and J.S.; formal analysis, Z.C.-B., T.D.L.P., C.P., M.R., L.R. and J.S.; writing—original draft preparation, Z.C.-B., G.J.N. and M.J.; writing—review and editing, Z.C.-B., G.J.N. and M.J.; supervision, G.J.N. and M.J. The first six listed authors had an equal contribution to the planning, setup, execution and analysis of the experiments contained within this article. All authors have read and agreed to the published version of the manuscript.

Funding

This research was supported by the Future Fuels Cooperative Research Center (FFCRC) under Project ID 81125509.

Data Availability Statement

Data are contained within this article.

Conflicts of Interest

The authors declare no conflicts of interest.

Abbreviations

Nomenclature used within the manuscript body. Described below are the symbols used to denote each term and the definition or meaning of each term. Listed in order of appearance.
SymbolDefinition
CO2Carbon dioxide
SMRSteam methane reforming
CGCoal gasification
H2Hydrogen
C H 4 Methane
CComposition
ρ Density
DDiameter
hHeight
PPressure
TTemperature
η Conversion efficiency
r Production rate
SLPMStandard liters per minute
F r p Particle Froude number
S t k Particle Stokes number
F r g Gas Froude number
R e Reynolds number
s Density ratio
X g Gas fraction
X p Particle fraction
M ˙ s Particle flow rate
gGravity
v S A L T Saltation velocity
m Mass
m Mass uncertainty
Q Gas flow rate
Q Gas flow rate uncertainty

References

  1. Mebrabian, N.; Seyafee, A.; Nathan, G.J.; Jafarian, M. A numerical investigation of methane pyrolysis in a molten catalyst bath—A single bubble approach. Int. J. Hydrogen Energy 2023, 48, 19917–19935. [Google Scholar] [CrossRef]
  2. Jafarian, M.; Haseli, P.; Saxena, S.; Dally, B. Emerging technologies for catalytic gasification of petroleum residue derived fuels for sustainable and cleaner fuel production—An overview. Energy Rep. 2023, 9, 3248–3272. [Google Scholar] [CrossRef]
  3. IEA. World Energy Outlook 2020; IEA: Paris, France, 2020; Available online: https://www.iea.org/reports/world-energy-outlook-2020 (accessed on 20 November 2023).
  4. Lee, S.; Kim, H.S.; Park, J.; Kang, B.M.; Cho, C.-H.; Lim, H.; Won, W. Scenario-based techno-economic analysis of steam methane reforming process for hydrogen production. Appl. Sci. 2021, 11, 6021. [Google Scholar] [CrossRef]
  5. Secretary of State for Business, Energy and Industrial Strategy. UK Hydrogen Strategy; CP 475; Secretary of State for Business, Energy and Industrial Strategy: London, UK, 2021; ISBN 978-1-5286-2670-5.
  6. Longden, T.; Jotzo, F.; Prasad, M.; Andrews, R. Green Hydrogen Production Costs in Australia: Implications of Renewable Energy and Electrolyser Costs; CCEP Working Paper 20-07; Australian National University: Canberra, Australia, 2020. [Google Scholar]
  7. Dagle, R.; Dagle, V.; Bearden, M.; Holladay, J.; Krause, T.; Ahmed, S. An overview of national gas conversion technologies for co-production of hydrogen and value-added solid carbon products. Pac. Northwest Natl. Lab. 2017, 1, 1–73. [Google Scholar] [CrossRef]
  8. Parkinson, B.; Tabatabaei, M.; Upham, D.C.; Ballinger, B.; Greig, C.; Smart, S.; McFarland, E. Hydrogen production using methane: Techno-economics of decarbonizing fuels and chemicals. Int. J. Hydrogen Energy 2018, 43, 2540–2555. [Google Scholar] [CrossRef]
  9. Geißler, T.; Plevan, M.; Abanades, A.; Heinzel, A.; Mehravaran, K.; Rathnam, R.K.; Rubbia, C.; Salmieri, D.; Stoppel, L.; Stuckrad, S.; et al. Experimental investigation and thermo-chemical modelling of methane pyrolysis in a liquid metal bubble column reactor with a packed bed. Int. J. Hydrogen Energy 2015, 40, 14134–14146. [Google Scholar] [CrossRef]
  10. Rahimi, N.; Kang, D.; Gelinas, J.; Menon, A.; Gordon, M.J.; Metiu, H.; McFarland, E.W. Solid carbon production and recovery from high temperature methane pyrolysis in bubble columns containing molten metals and molten salts. Carbon 2019, 151, 181–191. [Google Scholar] [CrossRef]
  11. Upham, D.C.; Agarwal, V.; Khechfe, A.; Snodgrass, Z.R.; Gordon, M.J.; Metiu, H.; McFarland, E.W. Catalytic molten metals for the direct conversion of methane to hydrogen and separable carbon. Science 2017, 358, 917–921. [Google Scholar] [CrossRef]
  12. Msheik, M.; Rodat, S.; Abanades, S. Methane cracking for hydrogen production: A review of catalytic and molten metal pyrolysis. Energies 2021, 14, 3107. [Google Scholar] [CrossRef]
  13. Von Wald, G.A.; Masnadi, M.S.; Upham, D.C.; Brandt, A.R. Optimization-based technoeconomic analysis of molten-media methane pyrolysis for reducing industrial sector CO2 emissions. Sust. Energy Fuels 2020, 9, 4598–4613. [Google Scholar] [CrossRef]
  14. Kudinov, I.V.; Pimenov, A.A.; Kryukov, Y.A.; Mikheeva, G.V. A theoretical and experimental study on hydrodynamics, heat exchange and diffusion during methane pyrolysis in a layer of molten tin. Int. J. Hydrogen Energy 2021, 46, 10183–10190. [Google Scholar] [CrossRef]
  15. Environmental Protection Agency. Evaluation of Zinc Fuming Furnace Fugitive Emissions Bunker Hill Lead Smelter; EPA-330/2-77-010; Environmental Protection Agency Office of Enforcement: Kellogg, ID, USA, 1977.
  16. Farmer, T.C.; McFarland, E.W.; Doherty, M.F. Membrane bubble column reactor model for the production of hydrogen by methane pyrolysis. Int. J. Hydrogen Energy 2019, 44, 14721–14731. [Google Scholar] [CrossRef]
  17. Orozovic, O.; Lavrinec, A.; Rajabnia, H.; Williams, K.; Jones, M.G.; Klizing, G.E. Transport boundaries and prediction of the slug velocity and layer fraction in horizontal slug flow pneumatic conveying. Chem. Eng. Sci. 2020, 227, 115916. [Google Scholar] [CrossRef]
  18. Pneumatic Injection: Rotofeed. Available online: https://www.schenckprocess.com/technologies/conveying/pneumatic-conveyors/rotofeed (accessed on 10 May 2023).
  19. Wether, J. Circulating fluidized bed technology VI. In Proceedings of the 6th International Conference on Circulating Fluidized Beds, Wurzburg, Germany, 22–27 August 1999. [Google Scholar]
  20. Atay, I. Fluid Flow and Gas Absorption in an Ejector Venturi Scrubber. Ph.D. Thesis, New Jersey Institute of Technology, Newark, NJ, USA, 1986. [Google Scholar]
  21. ISO/TR 11583; Wet-Gas Measurement. Proceedings of the 30th International North Sea Flow Measurement Workshop, St. Andrews, UK. ISO: Geneva, Switzerland, 2012.
  22. Harris, L.S. Scrubbing characteristics of the ejector venturi scrubber. J. Air Pollut. Control Assoc. 1963, 13, 613–632. [Google Scholar] [CrossRef]
  23. Li-an, Z.; Tieli, W.; Wenqiang, H. Study on velocity distribution of large particle in vertical slurry pipeline. Meas. Control 2019, 52, 1282–1288. [Google Scholar] [CrossRef]
  24. Funke, A.; Henrich, E.; Dahmen, N.; Sauer, J. Dimensional analysis of Auger-type fast pyrolysis reactors. Energy Technol. 2016, 5, 119–129. [Google Scholar] [CrossRef]
  25. Geißler, T.; Abanades, A.; Heinzel, A.; Mehravaran, K.; Muller, G.; Rathnam, R.K.; Rubbia, C.; Salmieri, D.; Stoppel, L.; Stuckrad, S.; et al. Hydrogen production via methane pyrolysis in a liquid metal bubble column reactor with a packed bed. Chem. Eng. J. 2016, 299, 192–200. [Google Scholar] [CrossRef]
  26. Zaghloul, N.; Kodama, S.; Sekiguchi, H. Hydrogen production by methane pyrolysis in a molten-metal bubble column. Chem. Eng. Technol. 2021, 44, 1986–1993. [Google Scholar] [CrossRef]
  27. Perez, B.J.L.; Jimenez, J.A.M.; Bhardwaj, R.; Goetheer, E.; Annaland, M.V.S.; Gallucci, F. Methane pyrolysis in a molten gallium bubble column reactor for sustainable hydrogen production: Proof of concept & techno-economic assessment. Int. J. Hydrogen Energy 2021, 45, 4917–4935. [Google Scholar] [CrossRef]
  28. ALICAT Scientific. Technical Data for M-Series Mass Flow Meters, DOC-SPECS-M-MID; Revision 5; ALICAT Scientific: Tucson, AZ, USA, 2023; Available online: https://www.alicat.com/wp-content/documents/specifications/DOC-SPECS-M-MID.pdf?_gl=1*thysip*_gcl_au*MjY4MTExMzE3LjE3MDI5NDY5ODQ (accessed on 23 November 2023).
Figure 1. Schematic representation of the four concepts proposed for the removal of carbon particulates from the molten catalyst methane pyrolysis reactor, namely, (a) overflow weir, (b) pneumatic-assisted overflow weir, (c) venturi ejector and (d) cyclone extractor.
Energies 17 00290 g001
Figure 2. Comparison of dimensionless numbers for each of the removal mechanisms for the developed hot model reactor (denoted in orange) and the cold prototype reactor (denoted in blue).
Energies 17 00290 g002
Figure 3. Process flow diagram (PFD) of the cold prototype reactor configuration. Pressurized air is passed through a flow meter and used to convey the hollow microsphere particles into the nozzle at the base of the test column, where they are bubbled by the air vertically, through the fluid column, towards the separation technology test area. Pressurized air is fed through a rotameter into the separation technology to remove the microspheres from the separation zone and convey them into the particle collection area, which is placed on a set of scales. Laser particle sensors are employed on the inlet and outlet to ensure particles are entering and exiting the system.
Energies 17 00290 g003
Figure 4. Experimental configuration of the cold prototype reactor configuration (as detailed in Figure 3). Rotameter not shown, as this was located adjacent to the test rig, attached to the test facility’s air lines. The rotameter was used for variable airflow control (Figure 3) and controlled the flow rate of air into the separation technology. Red box is shown to indicate where the separation technology (Figure 3) is placed during testing.
Energies 17 00290 g004
Figure 5. Schematic diagram of (A) three-dimensional and (B) cross-section of the overflow weir configuration. The key dimensions of the system are also shown.
Energies 17 00290 g005
Figure 6. Schematic diagram of (A) three-dimensional and (B) cross-section of the pneumatic-assisted overflow weir configuration. The key dimensions of the system are also shown.
Energies 17 00290 g006
Figure 7. Schematic diagram of (A) three-dimensional and (B) cross-section of the cyclone extractor configuration. The key dimensions of the system are also shown.
Energies 17 00290 g007
Figure 8. Schematic diagram of (A) three-dimensional and (B) cross-section of the venturi ejector configuration. The key dimensions of the system are also shown.
Energies 17 00290 g008
Figure 9. Comparison of particle removal fraction ( X P ) as a function of the gas fraction ( X g ) for the four removal devices tested in the cold prototype reactor. The axes are non-dimensionalized in accordance with the methodology outlined in Section 4.
Energies 17 00290 g009
Figure 10. Performance data for the pneumatically assisted weir. Airflow rate ( Q c o n c e p t ) in SLPM is shown vs. the particle mass removed ( m p , o u t ) in grams for each of the 10 min trials conducted at a fixed speed (circles).
Energies 17 00290 g010
Figure 11. Performance data for the cyclone extractor. Airflow rate ( Q c o n c e p t ) in SLPM is shown vs. the particle mass removed ( m p , o u t ) in grams for each of the 10 min trials conducted at a fixed speed (circles).
Energies 17 00290 g011
Figure 12. Performance data for the venturi ejector. Airflow rate ( Q c o n c e p t ) in SLPM is shown vs. the particle mass removed ( m p , o u t ) in grams for each of the 10 min trials conducted at a fixed speed (circles).
Energies 17 00290 g012
Figure 13. Operational images of the pneumatically assisted overflow weir (A), the cyclone extractor (B) and the venturi ejector (C).
Energies 17 00290 g013
Figure 14. Operational images of the overflow separation concept. The overflow edge indicated (A) and the particle–fluid bed indicated (B).
Energies 17 00290 g014
Figure 15. Operational image of the pneumatically assisted overflow weir. Left image is above the removal concept and the right image is a photo taken through the side wall. (A) shows particle splatter formation on the roof and (B) shows splatter formation on the side walls, above the inlet slit (bottom right).
Energies 17 00290 g015
Figure 16. Operational image of the cyclone extractor geometry. (A) indicates the upper cyclone assembly, (B) the middle and (C) the lower assembly. Particulate buildup is shown to occur at (C).
Energies 17 00290 g016
Figure 17. Operational image of the venturi ejector. (A) indicates the location of the suction port. (B) shows the clumping present in the fluid interface.
Energies 17 00290 g017
Table 1. Key dimensions and operating conditions of the developed reference methane pyrolysis reactor, together with the physical properties of the molten bath, gaseous phases and carbon particle.
Liquid Metal Catalyst Properties (Bubbling Media)
ParameterValueReference
Composition (CL)26–73% nickel–bismuth[11,25,26]
Density ( ρ L ) 9500 kg/m3[11,25,26]
Reactor geometry and operating conditions
   
Diameter (DR)1.2 m[11]
Height (hR)1.0 m[11]
Pressure (PR)15 bar[11]
Temperature (TR)1000 °C[11]
Conversion efficiency ( η R ) 90%[11]
Hydrogen production rate ( r H ) 0.01022 kg/(s.m3)[27]
Methane input rate ( r M )0.08140 kg/(s.m3)[27]
Carbon production rate ( r C )0.06092 kg/(s.m3)[27]
Carbon properties
   
Density ( ρ C )1800 kg/m3[27]
Diameter ( D C ) 56 micron[27]
Hydrogen properties
   
Pressure ( P H ) 15 bar[25]
Density ( ρ H ) 0.4669 kg/m3[25]
Viscosity ( μ H ) 16.9 μPa/s[25]
Table 2. Identified dominating dimensionless group for each removal method.
Removal MethodIdentified Dimensionless Groups
Pneumatic assisted overflow weirParticle Stokes number ( S t k )
Particle Froude number ( F r p )
Reynolds number ( R e )
Cyclone extractorParticle Stokes number ( S t k )
Particle Froude number ( F r p )
Gas Froude number ( F r g )
 Reynolds number ( R e )
Venturi ejectorParticle Stokes number ( S t k )
 Reynolds number ( R e )
Table 3. Summary of dimensionless similarity parameters used to match key phenomena in the cold prototype experiment to the developed reference methane pyrolysis reactor.
Dimensionless Similarity Parameters
VariableFormulaPhysical RelevanceInteraction Represented
Particle Froude number F r p = v p 1 s g D 1 2 Particle inertia to gravitational forceInfluence of gravity on particles
Particle Stokes number S t k = ρ p d p 2 v g 18 μ D Characteristic particle response time to flow timeParticle response to large scale flow
Gas Froude number F r g = v g 1 s g D 1 2 Flow inertia to gravitational forceBuoyancy effects
Reynolds number R e = ρ g v g D μ Ratio of inertial forces to viscous forcesFlow speed and configuration effects
Density ratio (particle to liquid bath) s = ρ p ρ l Particle–liquid buoyance ratioParticle–liquid buoyancy effects
Table 4. Key dimensions and operating conditions of the developed cold prototype methane pyrolysis reactor, together with the physical properties of the pseudo molten bath, gaseous phases and carbon particle.
Bubbling Media
ParameterValueReference
Composition (CL)100% watern/a—selected
Density ( ρ L ) 1000 kg/m3n/a—selected
Reactor geometry and operating conditions
   
Diameter (DR)0.09 mn/a—selected
Height (hR)1.00 mn/a—selected
Pressure (PR)1 bar[10,11,25,26,27]
Temperature (TR)25 °C[10,11,25,26,27]
Modelled conversion efficiency ( η R ) 90%[10,11,25,26,27]
Air bubble flow rate (modelled hydrogen) ( r H )0.01836 kg/(s.m3)[25]
Microsphere flow rate (modelled carbon particle buildup) ( r H )0.06092 kg/(s.m3)[25]
Glass microsphere properties
   
Density ( ρ C ) 190 kg/m3[25]
Diameter (DC)80 micron[25]
Air properties
   
Pressure ( P H ) 1 bar[25]
Table 5. Experimental removal methods for geometric and flow configuration data in addition to assumed geometric constraints for the developed hot model, to be used for dimensionless matching, where additional hot model geometric data are required.
Removal MethodParameterCold Prototype ConditionTheoretical Reference Condition
Pneumatic-assisted overflow weirSlit height0.003 m0.008 m
Gas velocity (at slit)21.9 m/s17.8 m/s
Cyclone extractorCyclone nozzle diameter0.05 m1.10 m
Gas velocity (nozzle)27.7 m/s51.2 m/s
Venturi ejectorVolumetric flow rate308 SLPM1000 SLPM
Gas viscosity1.81 Pa.s16.9 Pa.s
Throat diameter0.0053 m0.005 m
Table 6. Variables and associated uncertainties in the operation and measurement of data from the cold prototype reactor.
SymbolParameterMeasurement ComponentUncertainty
m t o t a l , o u t Total measured mass removedEK-610i precision scales ± 0.01 g
m p , o u t Particle mass removed CalculatedEquation (7)
m p ,   i n Particle mass added Particle feeder ± 0.10 g
m w a t e r Additional mass extracted from the system (liquid)Removal and filter system ± 22%
m t u b i n g Mass not extracted from the reactor (tubing losses)Removal and filter system ± 10%
Q c o n c e p t Volumetric flow rate into removal deviceRotameter ± 8 %
Q r e a c t o r Volumetric flow rate into the bottom of the reactor columnALICAT flow meter ± 0.7 %
Table 7. Pneumatic concept’s recorded and expected saltation velocities.
Removal MethodTheoretical Saltation VelocityObserved Saltation Velocity
Pneumatically assisted overflow weir0.97 m/s3.49 m/s
Cyclone extractor1.94 m/s4.23 m/s
Venturi ejector0.97 m/s3.49 m/s
Disclaimer/Publisher’s Note: The statements, opinions and data contained in all publications are solely those of the individual author(s) and contributor(s) and not of MDPI and/or the editor(s). MDPI and/or the editor(s) disclaim responsibility for any injury to people or property resulting from any ideas, methods, instructions or products referred to in the content.

