Abstract
With the penetration of distributed resources into power distribution networks, power distribution networks are transforming into active distribution networks with a high proportion of distributed generations and power electronic equipment. Efficient modeling and simulation methods are essential to perform dynamic response analysis. In order to satisfy the fast/steady/slow multiple time-scale simulation requirements of active distribution networks, a fast/medium/slow time partition model and a network decoupling method for short line characteristic lines is proposed in this paper. Through the decomposition coordination simulation method, the network is decomposed into multiple regions that can be simulated in parallel. Based on the interconnection of fiber optic network cards, a multi-rate parallel simulation and synchronization strategy is proposed, which significantly improves the simulation speed of active distribution networks while ensuring simulation accuracy. The numerical experiments have been conducted based on a modified IEEE 33-bus and a PG&E 69-bus, and simulation results show the feasibility of the proposed method. The verification results of the example show that using adaptive variable-step-size multi-rate parallel simulation technology can increase the subnet computation-time balance rate and simulation acceleration ratio to 119.90% and 121.31% in the same rate-parallel mode.
1. Introduction
With the integration of large-scale distributed photovoltaics, wind power, energy storage, electric vehicles, etc., the distribution network is changing from the traditional radial distribution network to the active distribution network (ADN) with multi-terminal and multi-source power supply mode [1,2], which will bring huge impacts on the operation, protection, and control of power distribution networks [3,4]. In the ADN, the dynamic transient process will occur under the scenario of DG integration/disconnection, relay protection action, line faults, and loop closing operations [5,6].
The research of power distribution network simulation mainly focus on power flow computation, network reconstruction, fault analysis, etc., while the main focus is steady-state simulation [7,8,9]; for example, power flow computation and simulation mainly involve steady-state computation of active and reactive power distribution. Because the steady-state simulation analysis technology neglects the influence of transient processes, it lacks high precision simulation of process evolution in the short-term time scale of the ADN and cannot describe and analyze the detailed transient characteristics of each component of power distribution systems. With the gradual increase in the proportion of distributed resources integrated into the distribution network, the characteristics of the distribution network with large time scale and wide frequency domain become increasingly prominent, and the transient response characteristics will become more complex [10]. The existing simulation methods cannot meet the requirements of accuracy and rapidity, and the transient simulation of the distribution network needs to be further investigated [11,12].
Transient simulation is an important means to study various dynamic processes and the basis for revealing various transient processes in the short-term time scale in the ADN, which has significant theoretical significance and engineering application value [13]. The ADN has the characteristics of huge volume, complex structure, high-dimensional nonlinear coupling, fast time change, etc., and the complexity of transient simulation computation is high. The time complexity of transient simulation computation, which fully reflects the dynamic process, will show an explosive increase, resulting in serious problems such as low simulation efficiency [14].
At present, there are two main approaches to improve the speed of the ADN transient simulation. The first approach is to simplify the detailed model of the ADN, ignoring the high-frequency part of the model. With the consideration that the simulation scale is affected by the simulation step size and computing resources, the model can be simplified, and the dimension can be reduced. In this approach, the scale of real-time simulation can be increased under certain computing resources. For example, a dynamic averaging modeling method was put forward in the literature [15], while the simulation speed was improved greatly, although a certain degree of simulation accuracy was sacrificed. A dynamic phasor simulation model was proposed in the literature [16], which only retained the low-frequency transient part of the AC and DC power grid, reducing the computation time. The second approach is to decouple the ADN by partitioning and improving the scale and speed of the transient simulation of the ADN through parallel computation by placing the distribution networks of different partitions in different CPU or FPGA cores. For example, the joint simulation of the electromechanical transient simulation region and the electromagnetic transient simulation region was implemented through the zonal interface to improve the simulation efficiency in the literature [17]. It can be seen that the essence of the first approach is to reduce the computation scale and complexity by simplifying the model so as to improve the transient simulation speed of the ADN. Its disadvantage is that the simulation accuracy will be correspondingly reduced [18]. The second approach is to achieve the improvement of simulation scale and speed through model decomposition and parallel simulation computation, and the advantage is that the simulation accuracy is not decreased [19]. However, due to the wide distribution of distribution network nodes, short lines, tight coupling of source network load and storage, and large time-scale span of fast/medium/slow dynamic processes, how to partition and decoupage the network and realize multi-rate parallel simulation are facing great challenges [20].
Aiming at the problem of the ADN fast transient simulation, a fast dynamic simulation method is proposed based on decomposition coordination. The characteristics and models of fast/medium/slow devices in distribution network are analyzed in Section 2. In Section 3, the fast/medium/slow time constant partition model and short-line characteristic line decoupling method are proposed. Compared with traditional distribution network partitioning methods, it considers the difference in the response speed of dynamic processes, providing the foundation for multi-rate parallel simulation. And the short-line decoupling method avoids errors caused by the decoupling of long transmission lines, thereby improving the accuracy of parallel simulation. A multi-rate parallel simulation and synchronization strategy is proposed in Section 4, based on the multi-simulator array connected by a fiber network card, and the simulation speed of the ADN is greatly improved under the premise of ensuring the simulation accuracy. In Section 5, the feasibility and rapidness of the proposed method are verified by the simulation experiments of an IEEE 33-bus and a PG&E 69-bus.
2. Classification and Modeling of the Dynamic Components of the ADN
In the transient simulation of the ADN, the simulation time scale selection has a great difference due to the different dynamic response speeds of different equipment components. In this paper, distribution network equipment models are divided into three categories based on the dynamic characteristics of the simulation model, such as fast/medium/slow simulation models, according to the difference in dynamic response speed, and the transient simulation model of each device is established.
2.1. Classification of Fast/Medium/Slow Dynamic Components of the ADN
The dynamic response characteristics of the ADN equipment components span from microseconds to milliseconds or seconds. The dynamic components division of the fast/medium/slow simulation of the distribution network is shown in Figure 1. As shown in Figure 1, the fast dynamic component has time spans ranging from 10 microseconds to 100 microseconds. The medium dynamic component has a time-scale span of 100 microseconds to 1 millisecond, while the slow dynamic component has a time scale of above 1 millisecond.

Figure 1.
Division of fast/medium/slow dynamic components in the distribution network.
- (1)
- Fast dynamic components. Typical representatives include DGs, such as photovoltaics, flexible power electronic devices, and voltage source converters. In the ADN, the switching frequency of power electronic devices is increasing from several thousand hertz to tens of thousands of hertz or even higher, making the simulation step size that meets the simulation of power electronic devices smaller and smaller. From the perspective of transient simulation, the existence of power electronic devices can cause problems such as time-varying computation matrices, switching actions between step sizes, and numerical oscillations. So, smaller simulation step size is necessary to accurately depict fast time-varying dynamic processes. More importantly, the STT is an important device in future distribution networks, since it has the ability of AC-DC conversion, high precision voltage control, power exchange, etc., which is meaningful for the AC/DC hybrid network with lots of DGs. The STT is a piece of power electronic equipment which consists of kinds of switching tubes and isolating transformers, and the principle of operation of the SST is similar to that of the VSC and PV inverter. Hence, it can be classified as a fast dynamic component, as shown in Figure 1.
- (2)
- Medium dynamic components. Typical representative components include rotating equipment represented by diesel engines and electric motors. Changes in the mechanical torque of rotating equipment have a greater impact on its operating status than sudden changes in voltage/current. The dynamic response speed of rotating equipment such as diesel engines and electric motors is slower than that of power electronics devices. Due to the fact that the transient response process of rotating equipment is mainly electromechanically transient, its electromagnetic transient process can be ignored in the simulation process, and further, its transient model can be solved using a medium time scale.
- (3)
- Slow dynamic components. Typical representative components include capacitors, reactors, transformers, control systems, and other electrical system components that do not include power electronic components. The representative components of the slow time scale do not experience sudden changes in their operating status during the transient response process and have medium- to long-term dynamic processes. They are in a slow time-varying status, and high-frequency transient effects can be neglected. Using a larger simulation step size during simulation solving will not reduce the accuracy of the simulation.
2.2. Simulation Modeling of Typical ADN Fast/Medium/Slow Equipment
2.2.1. Fast Dynamic Modeling of DGs
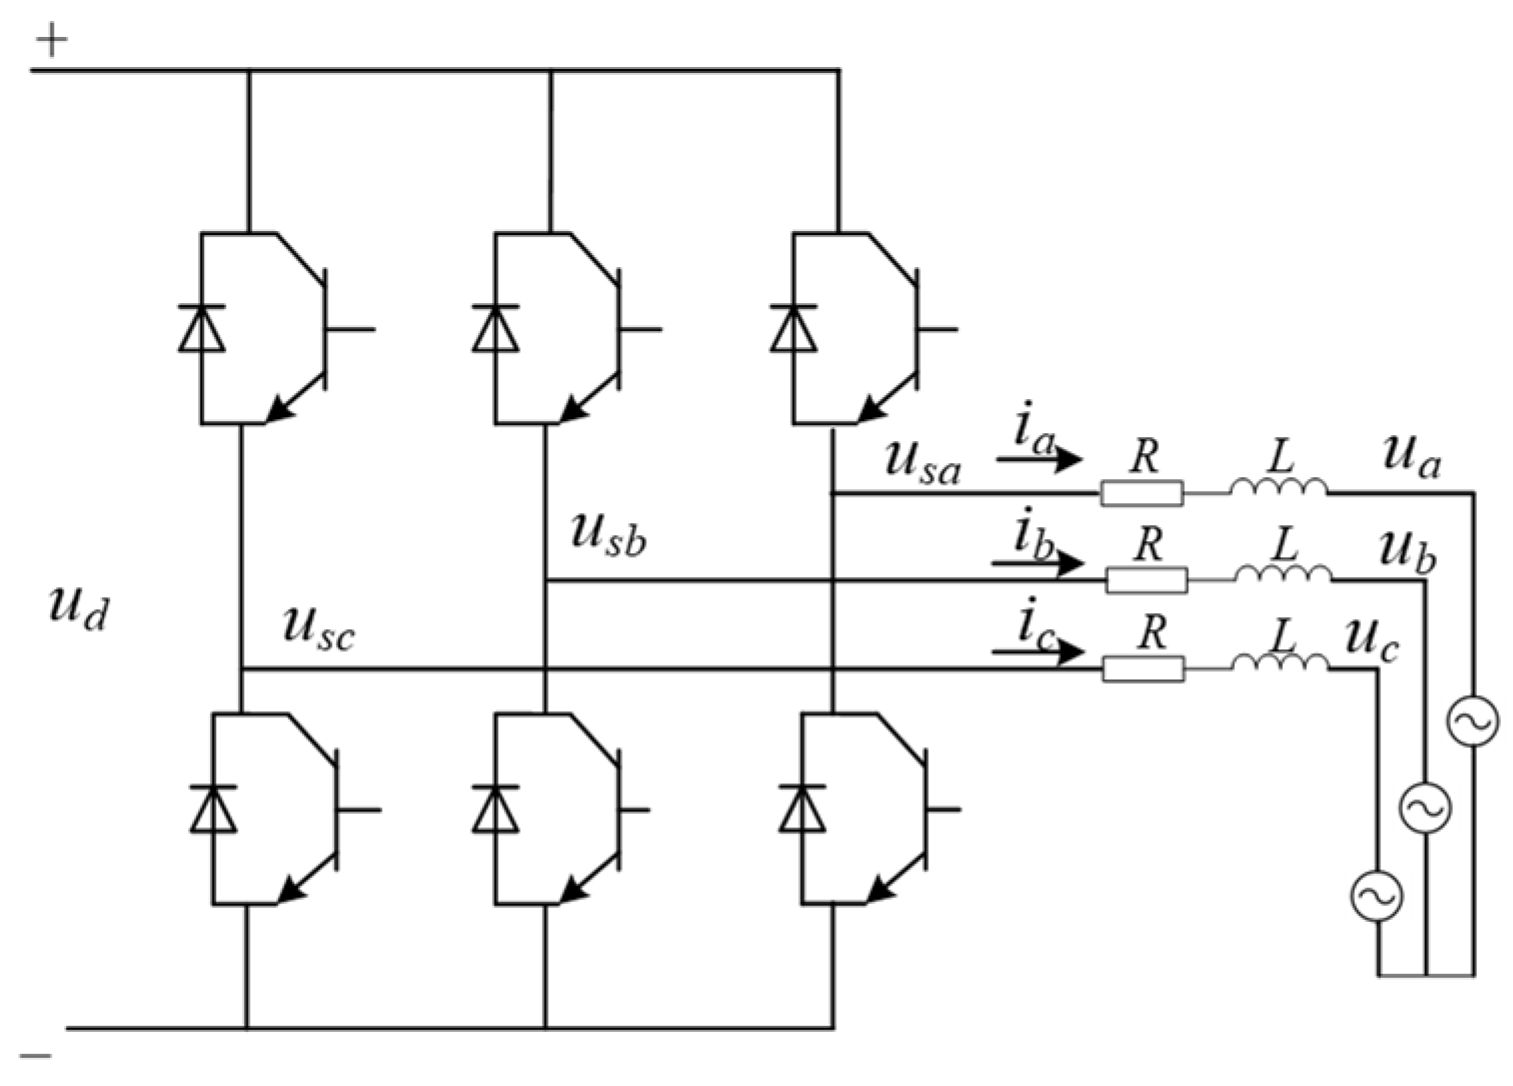
DGs are typical fast dynamic devices due to their inclusion of power electronic inverter interfaces and high switching frequencies. The grid connection structure of DGs is shown in Figure 2, where the DC voltage source is connected to the grid after being inverted and filtered.
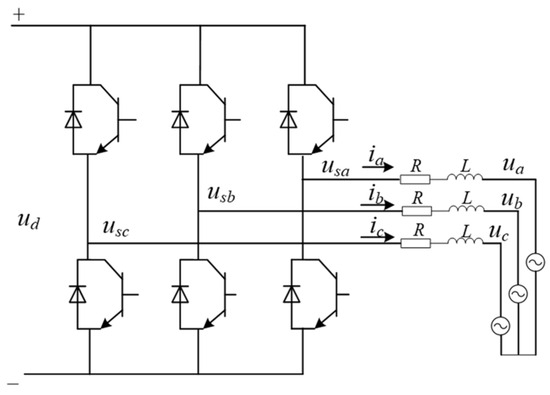
Figure 2.
Distributed power grid connection structure diagram.
The voltage drop model from the outlet of the distributed power inverter to the grid connection point is expressed as Equation (1).
In the formula, usa, usb, and usc are the three-phase voltage at the inverter outlet; ua, ub, uc, ia, ib, and ic, respectively, represent the three-phase voltage and current at the grid connection point. R and L are the total equivalent resistance and inductance of the grid connected line, respectively.
After Park transformation, Equation (1) can be simplified as Equation (2).
In the formula, usd and usq are the direct axis and quadrature axis voltages at the inverter outlet, respectively; ud, uq, id, and iq represent the voltage and current of the direct axis and quadrature axis of the grid connection point; ω is the operating angular frequency of the power grid.
The output power of DGs can be expressed as Equation (3).
In the formula, PDG and QDG are the active power and reactive power of the distributed power grid connection, respectively.
The inverter control strategy adopted by DGs is determined by their roles in the distribution network. This paper selects a distributed power supply with constant power control mode, which usually adopts a dual-loop control structure. The two-layer PI control can ensure the dynamic response speed of the distributed power supply. The PI controller model for the power’s outer loop of distributed power sources is shown in Equation (4).
In the Equation, ΔP and ΔQ represent the active power deviation and reactive power deviation of DGs; Pref and Qref are the active power reference values and reactive power reference values of the distributed power source, respectively; idref and iqref are the current reference values for the direct and quadrature axes, respectively; Kpd, Kpq, Kid, and Kiq are the direct axis and quadrature axis proportional coefficients and integral coefficients of the power’s outer ring, respectively.
The PI controller model of the current inner loop is shown in Equation (5).
In the Equation, Δid and Δiq represent the current deviation of the direct axis and the quadrature axis, respectively; id and iq are the actual current values of the direct axis and the quadrature axis, respectively.
2.2.2. Medium Dynamic Modeling of Diesel Generators
The diesel generator adopts a small synchronous generator, including the stator and rotor, which is a typical example of mesoscale dynamic equipment. This paper establishes a diesel generator model, with the model form shown in Equation (6).
In the formula, P1 is the rate of change of the armature, P2 is the air gap transmission power, P3 is the armature resistance power, id, iq, and i0 are the currents in the rotating coordinate system, ψd, ψq, and ψ0 are the magnetic flux in a rotating coordinate system, ω is the angular velocity of the rotor, ra is the single-phase impedance of the feeder, and p is the Park transformation coefficient, which can be expressed as shown in Equation (7):
In the formula, is phase angle.
2.2.3. Slow Dynamic Modeling of Lines
The lines in the ADN are typical slow dynamic equipment components. This paper takes a circuit model as an example to illustrate the modeling process of slow dynamic equipment components.
In general, due to the small power supply radius and short-circuit of a single distribution network feeder, ignoring the ground capacitance in the π-shaped equivalent circuit can still meet the accuracy requirements. A series impedance model represented by lumped parameters can be used, and its electrical parameters can be calculated from geometric parameters.
As shown in Figure 3, this article adopts a fixed-parameter model represented by series impedance, assuming that the line parameters are constant within the frequency range of distribution network operation. Among them, the line model is represented by lossless distributed parameters L and C, and a lumped component resistance is inserted in the middle and end of the line to simulate losses. For example, the total resistance, R, of the line will be allocated to the middle R/2 and each R/4 at the beginning and end of the line.

Figure 3.
Fixed-parameter model of the line.
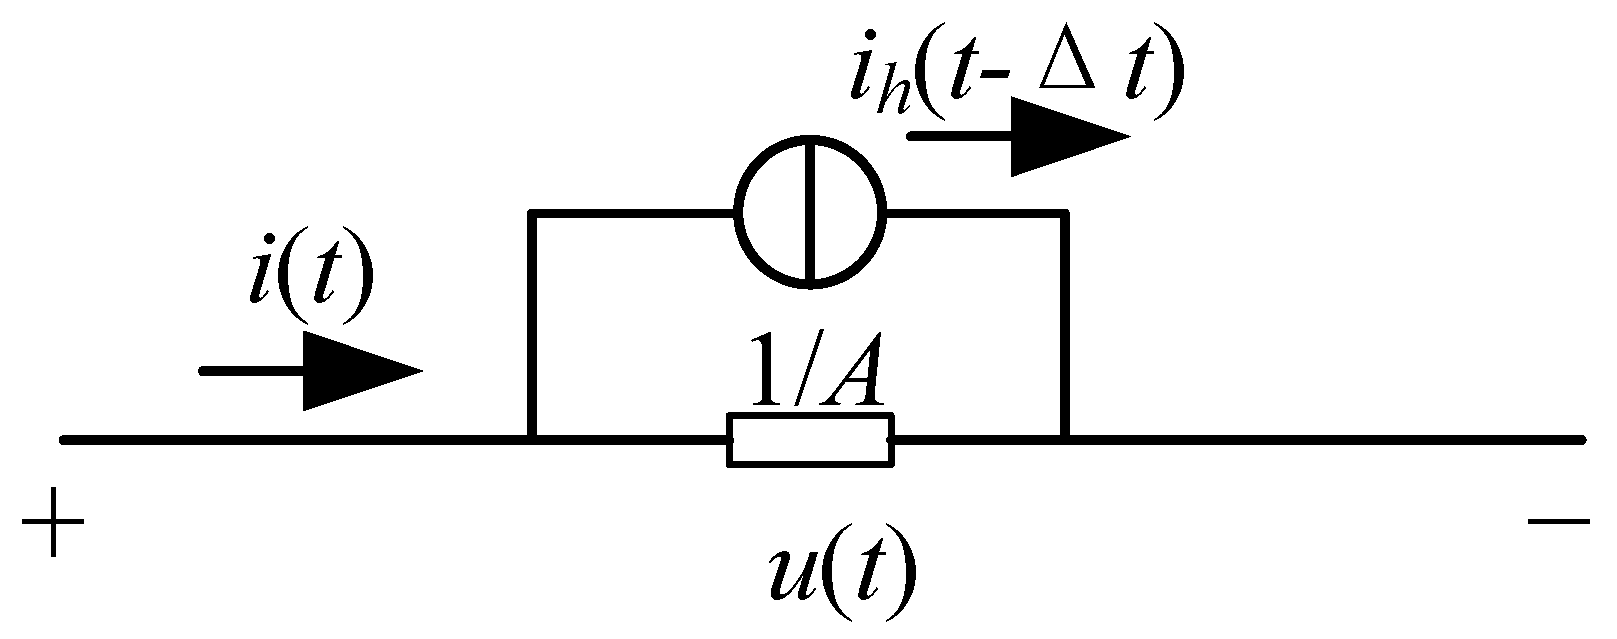
By using numerical integration method to perform differential processing on dynamic components, a Norton-equivalent circuit with equivalent calculated conductivity in parallel with the historical term current source is obtained, as shown in Figure 4. The difference equation can be expressed as Equation (8).
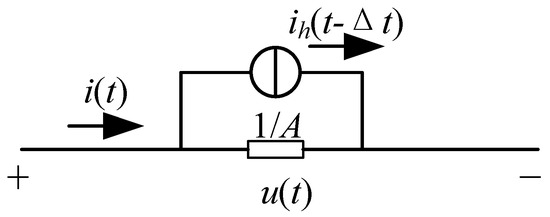
Figure 4.
Equivalent circuit of line dynamic element.
In the formula, u(t) and i(t), respectively, represent the current voltage and current at the current time step; u(t − Δt) and i(t − Δt) represent the voltage and current of the previous step, respectively; ih(t − Δt) is the output current of the historical term current source; A is the equivalent calculated conductivity; and B is the equivalent current ratio.
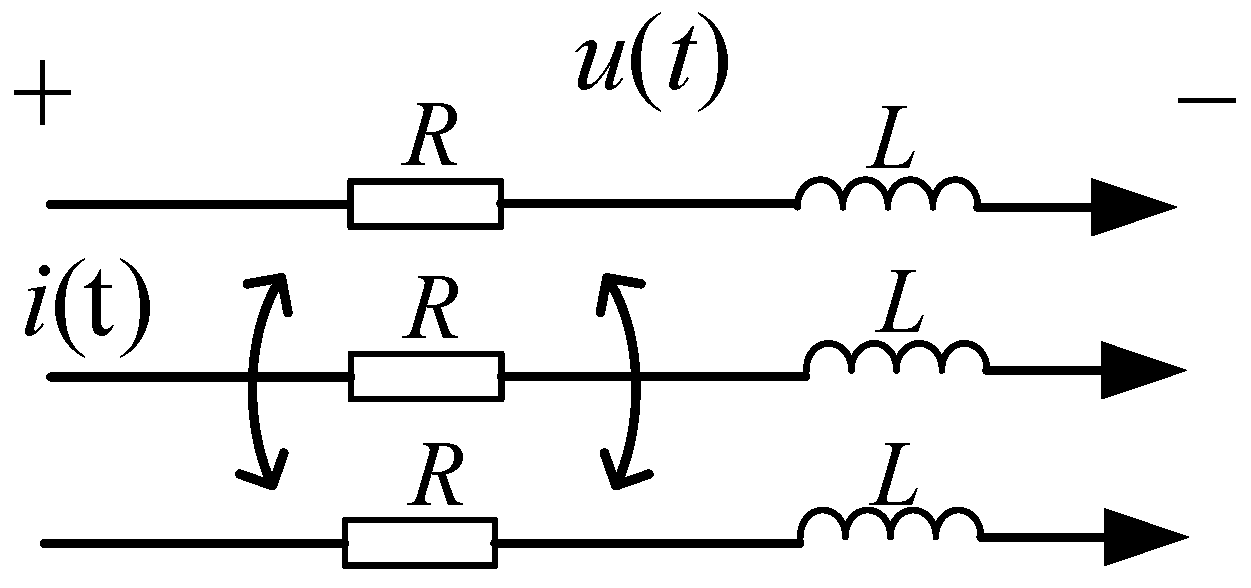
As shown in Figure 5, the three-phase line can adopt an RL series branch model with lumped parameters and mutual inductance coupling, as shown in Equation (9):
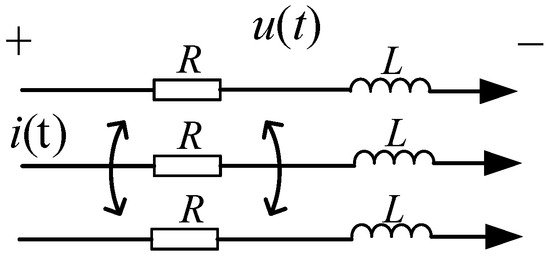
Figure 5.
Model of three-phase RL series line.
In the formula, u1(t), u2(t), u3(t), i1(t), i2(t), and i3(t) are the three-phase voltage and current of the current time step, respectively. u1(t − Δt), u2(t − Δt), u3(t − Δt), i1(t − Δt), i2(t − Δt), and i3(t − Δt) represent the three-phase voltage and current of the previous step; ih1(t − Δt), ih2(t − Δt), and ih3(t − Δt) are the output current of the historical item current source; A is the equivalent calculated conductivity matrix considering the mutual inductance between three phases; and B is the equivalent current ratio matrix.
3. Decoupling Method of the ADN for Dynamic Simulation
In order to achieve parallel simulation of the ADN, it is necessary to decompose the transient simulation model. Traditional segmentation methods are mainly divided based on the region they are located in and perform network equivalence at the segmentation point to achieve parallel simulation purposes. Based on the fast/medium/slow model of the ADN, this article further analyzes the time constants corresponding to the fast/medium/slow regions from a system-level perspective. Based on the clustering effect of the time constants, the partition range is reasonably divided. For the decoupling problem between partitions, a short-line characteristic line decoupling method is adopted to lay the foundation for parallel simulation computations.
3.1. Distribution Network Partitioning Based on Fast/Medium/Slow Time Constant Clustering
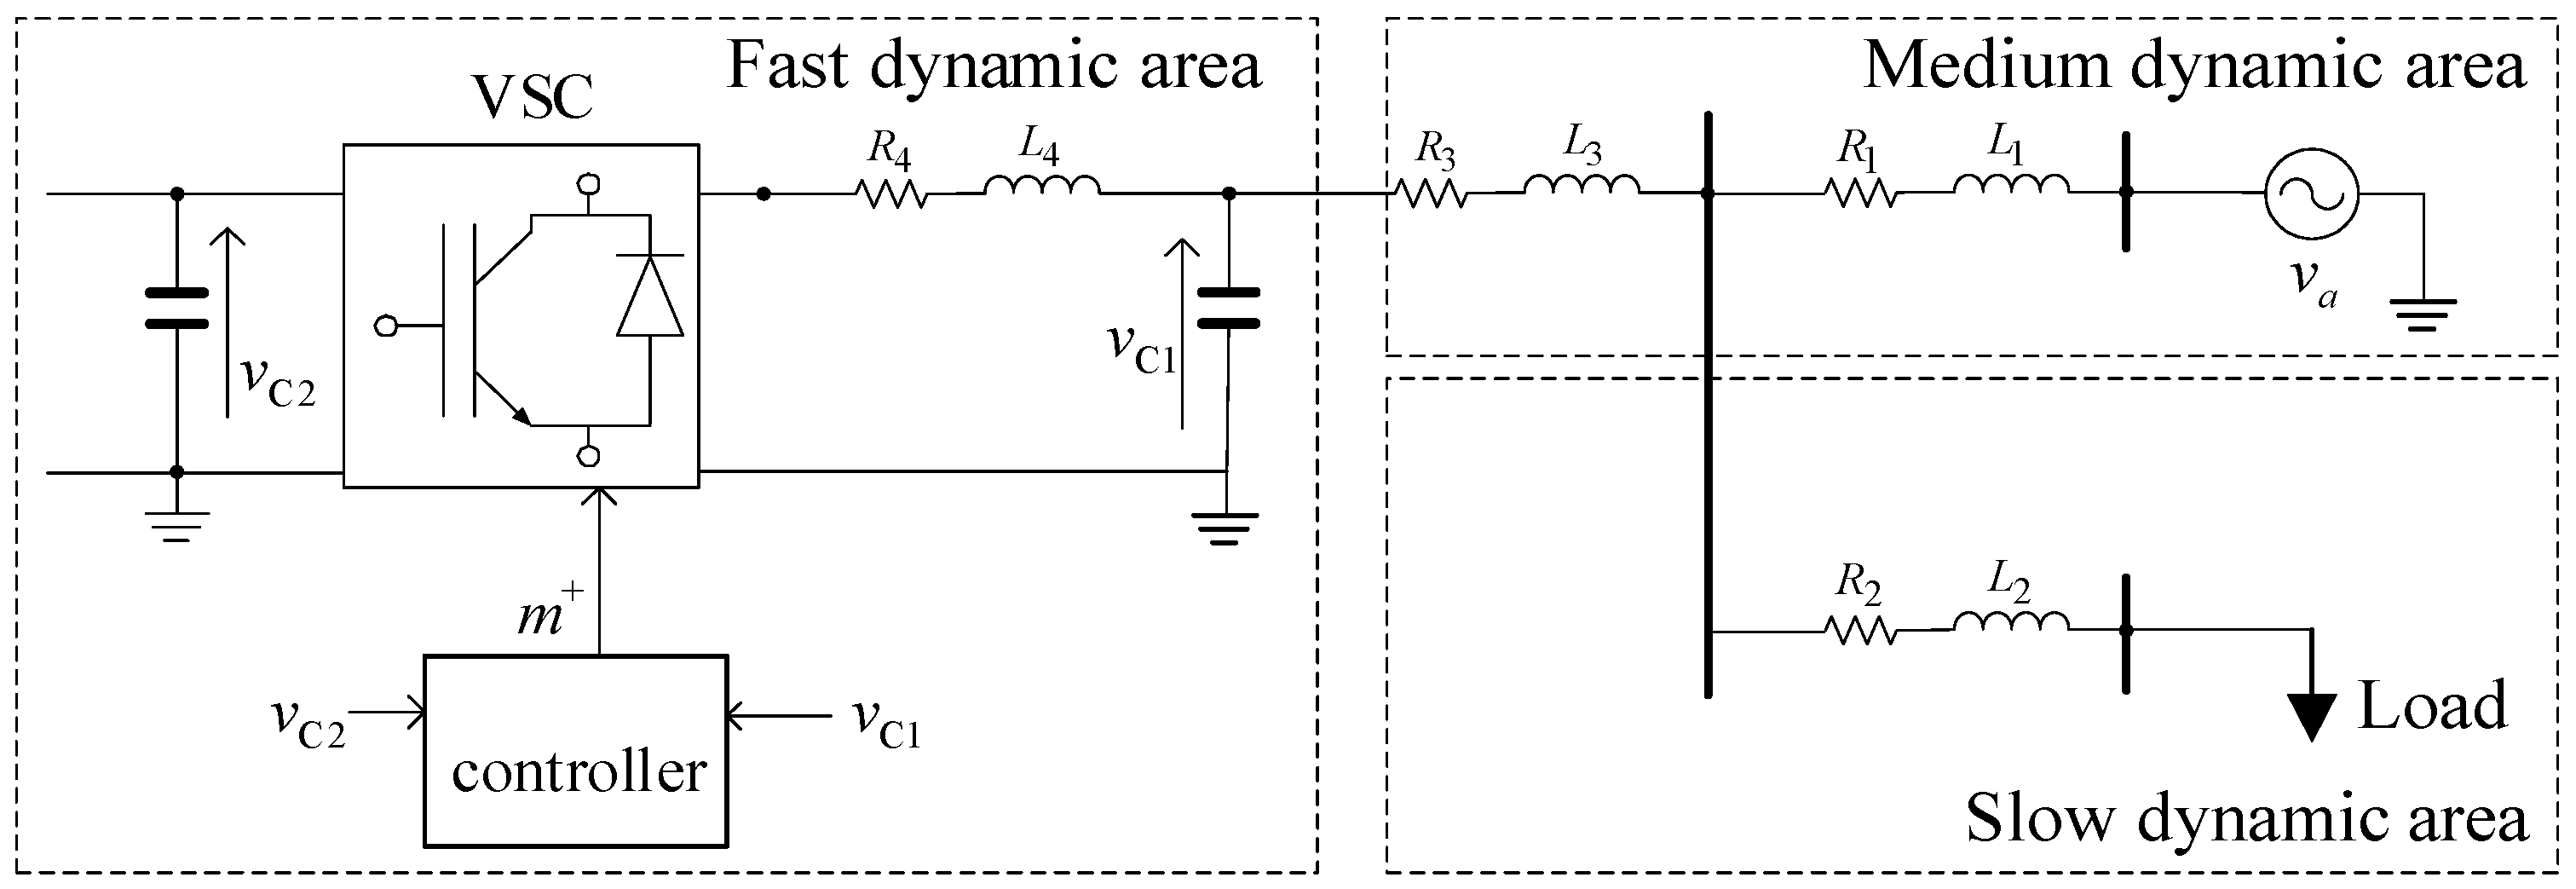
Taking the distribution network in Figure 6 as an example, the current flowing through inductors L2, L3, and L4 and the voltage at both ends of capacitors C1 and C2 are selected as state variables. Based on Kirchhoff’s law of current and voltage, a continuous state space equation for the system in Figure 6 is established as Equation (10).
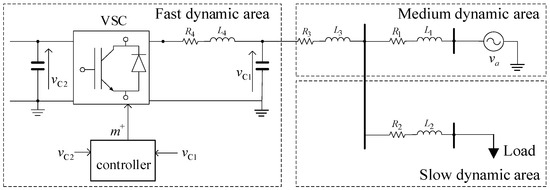
Figure 6.
Schematic diagram of ADN partition.
In the equation, , .
As is the state space matrix, and Bs is the input matrix; they are shown in Equation (11).
Eigenvalue analysis is performed on the state space matrix in Equation (11), and the calculated eigenvalues are shown in Table 1.

Table 1.
Eigenvalues of system-level models for ADN.
According to , , , it can be seen that the larger the angular frequency in the eigenvalues, the smaller the corresponding time constant T, that is, the faster the dynamic process. When the angular frequency in the eigenvalues is smaller, the corresponding time constant T is larger, which means the dynamic process is slower. Based on this, the ADN can be divided into different regions based on the clustering effect of the dynamic response time constants in different regions, laying the foundation for selecting simulation rates in different regions.
3.2. A Short-Line Characteristic Line Decoupling Method for ADNs
After partitioning the ADN, the crucial issue is how to decouple. Due to the lack of long transmission lines in the distribution network, the commonly used step-delay decoupling method for long transmission lines in the transmission network cannot be used. This article proposes a short-line characteristic line decoupling method for ADNs.
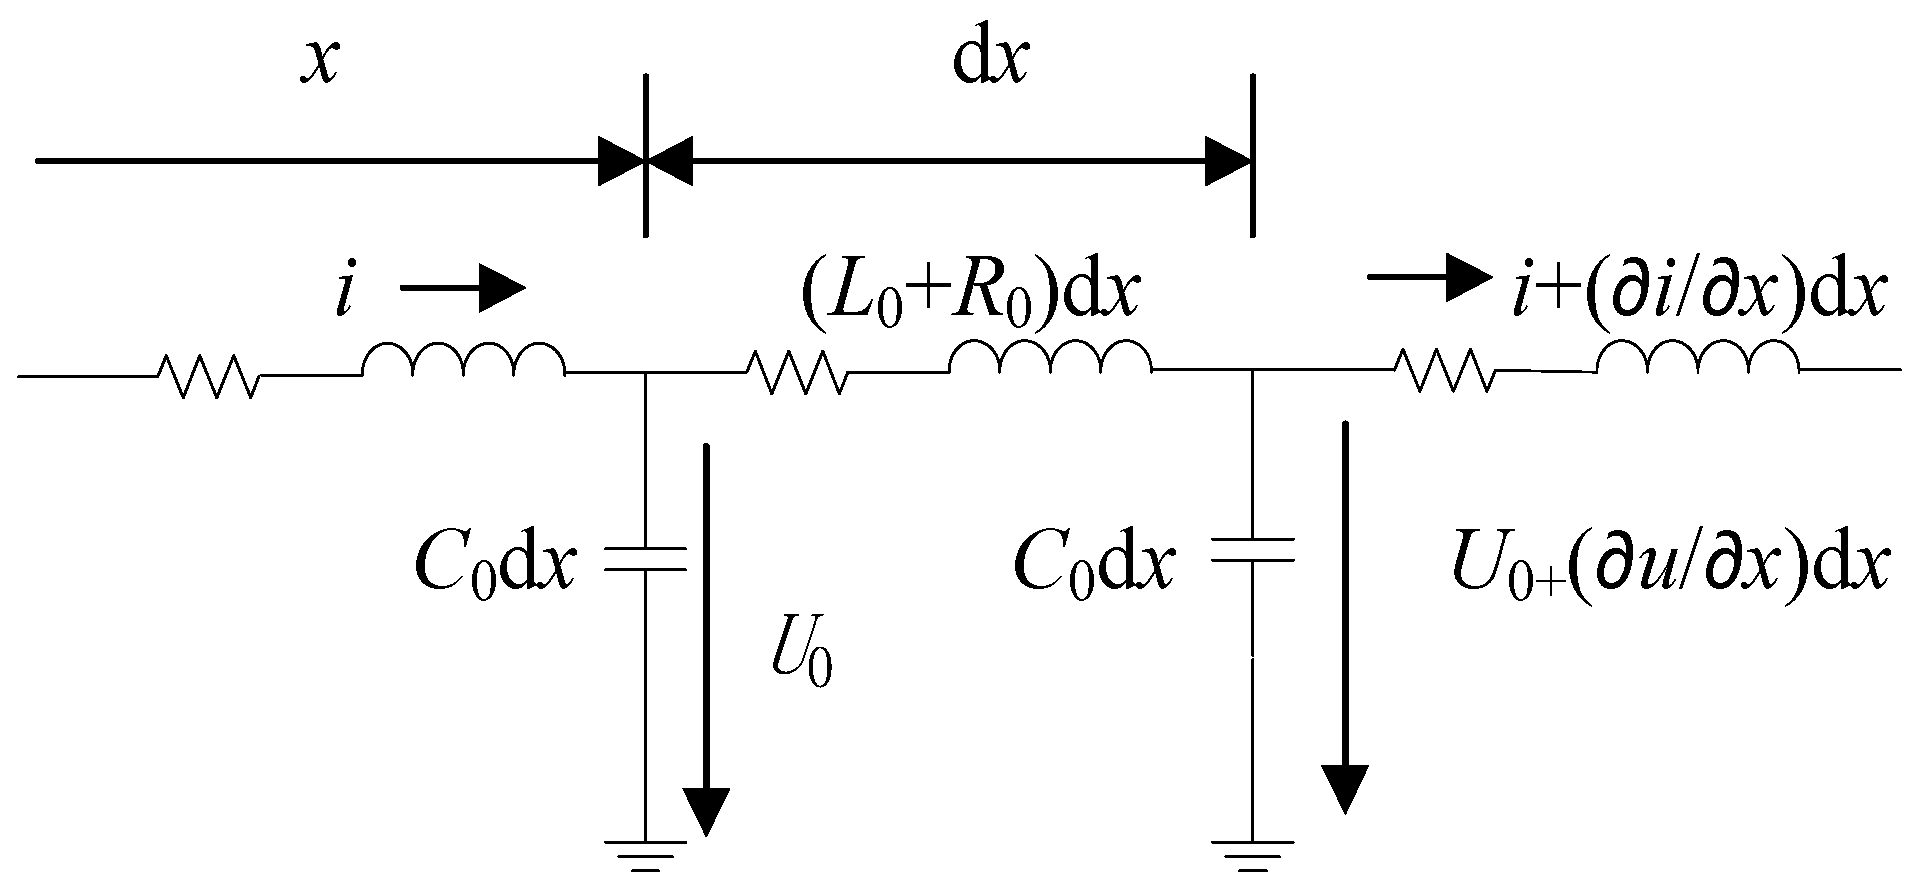
In the distribution network, due to the low voltage level and the fact that the resistance and inductance are on the same order of magnitude, the presence of resistance cannot be ignored. Moreover, due to the fact that the transmission lines in the distribution network are not as long as those in the main network, the parallel simulation method of decoupling the distributed parameter lines in the main network may have non-convergence in the distribution network simulation. Assuming that the propagation speed of electromagnetic waves on the line is v and the transmission line length is x, the simplified analysis of the decoupling principle of distributed parameter lines is shown in Figure 7.
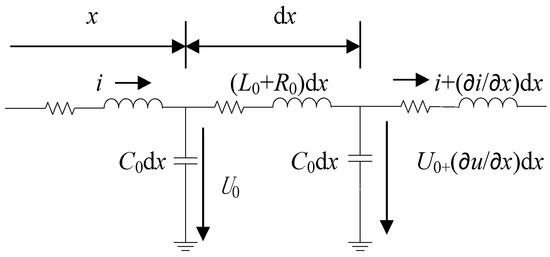
Figure 7.
Equivalent computation model for short-circuits considering distributed capacitance.
The wave equation in the above figure is as Equation (12).
In the equation, L0 represents the line inductance, R0 represents the line resistance, C0 represents the inductance, and G0 represents the conductivity.
Assuming that the propagation speed of the traveling wave is v and the characteristic impedance during the transmission process of the traveling wave is Zc, according to the principle of traveling wave propagation, Equation (13) can be obtained.
According to the principle of fixed-step parallel simulation, there may be a step delay between cores in multi-core parallel. The following is an analysis of the wave equation with two cores as the object. Assuming that the traveling wave propagates forward at velocity v, is the minimum time for the forward propagation of the traveling wave equation, which is the solution of one-step propagation time. Similarly, is the minimum time for the backward propagation of the traveling wave equation, which is the solution of one-step propagation time. The solution is described by the voltage equation (x, t) and current equation u(x, t) as Equation (14).
From the perspective of the backward propagation of traveling waves, Equation (14) is obtained by multiplying both sides of the current equation by Zc and subtracting from the voltage equation.
From the forward propagation of the traveling wave, Equation (16) is obtained by multiplying both sides of the current equation by Zc and adding them to the voltage equation.
If the distance of the distributed parameter line is set to l, regardless of whether the traveling wave propagates in the forward or backward direction, it can be seen that the propagation time is fixed, i.e., x + vΔt, x − vΔt are constant, and the transmission time from the beginning to the end is:
In multi-core parallel simulation, there is step delay Δt between multi-core CPUs. Assuming the transmission time in the distributed parameter line is t, the voltage at both ends of the distributed parameter line can be obtained:
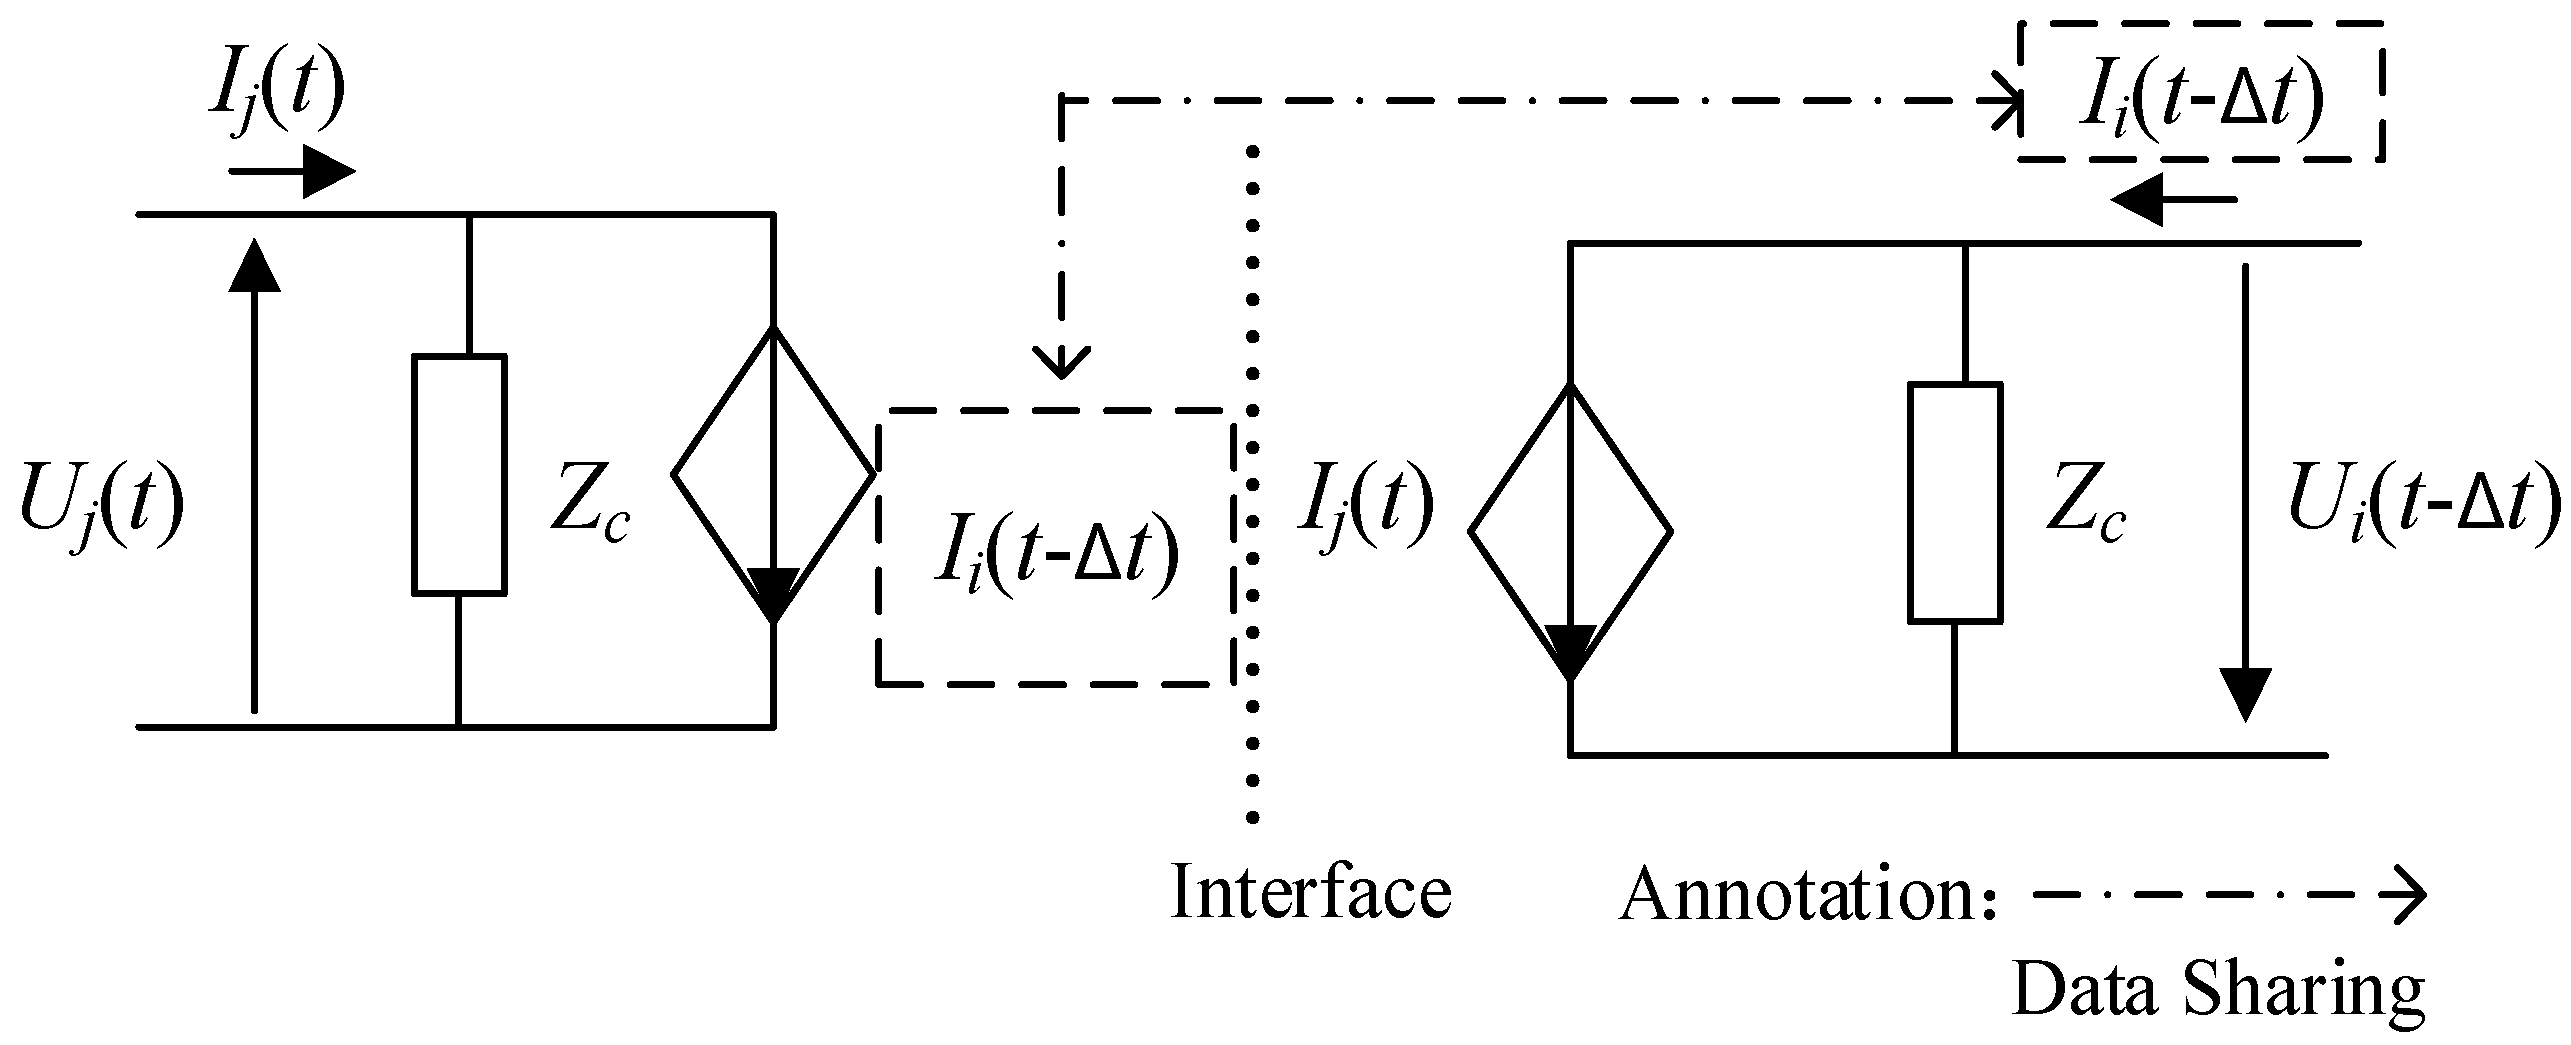
The negative sign on the right side of the equation represents the forward propagation of the traveling wave, t − Δt represents that the CPU operation time lags by one step; that is, within this step operation time, the data of the cutting point are the data of the previous step of the core connected to it. By organizing Equation (18), it can be concluded as in Equation (19):
Figure 8 shows the equivalent model of the distributed parameter line at both ends, with no direct connection between the two ends. The electrical quantities at both ends are exchanged through current data sharing.
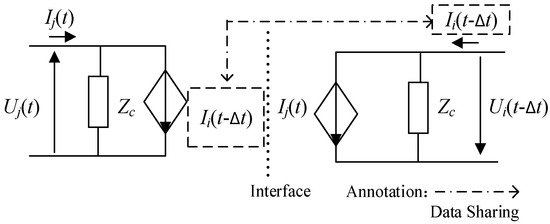
Figure 8.
Equivalent model of short lines at both ends considering distributed capacitance.
4. Multi-Rate Parallel Simulation Method of the ADN Based on Interconnected Simulator Array
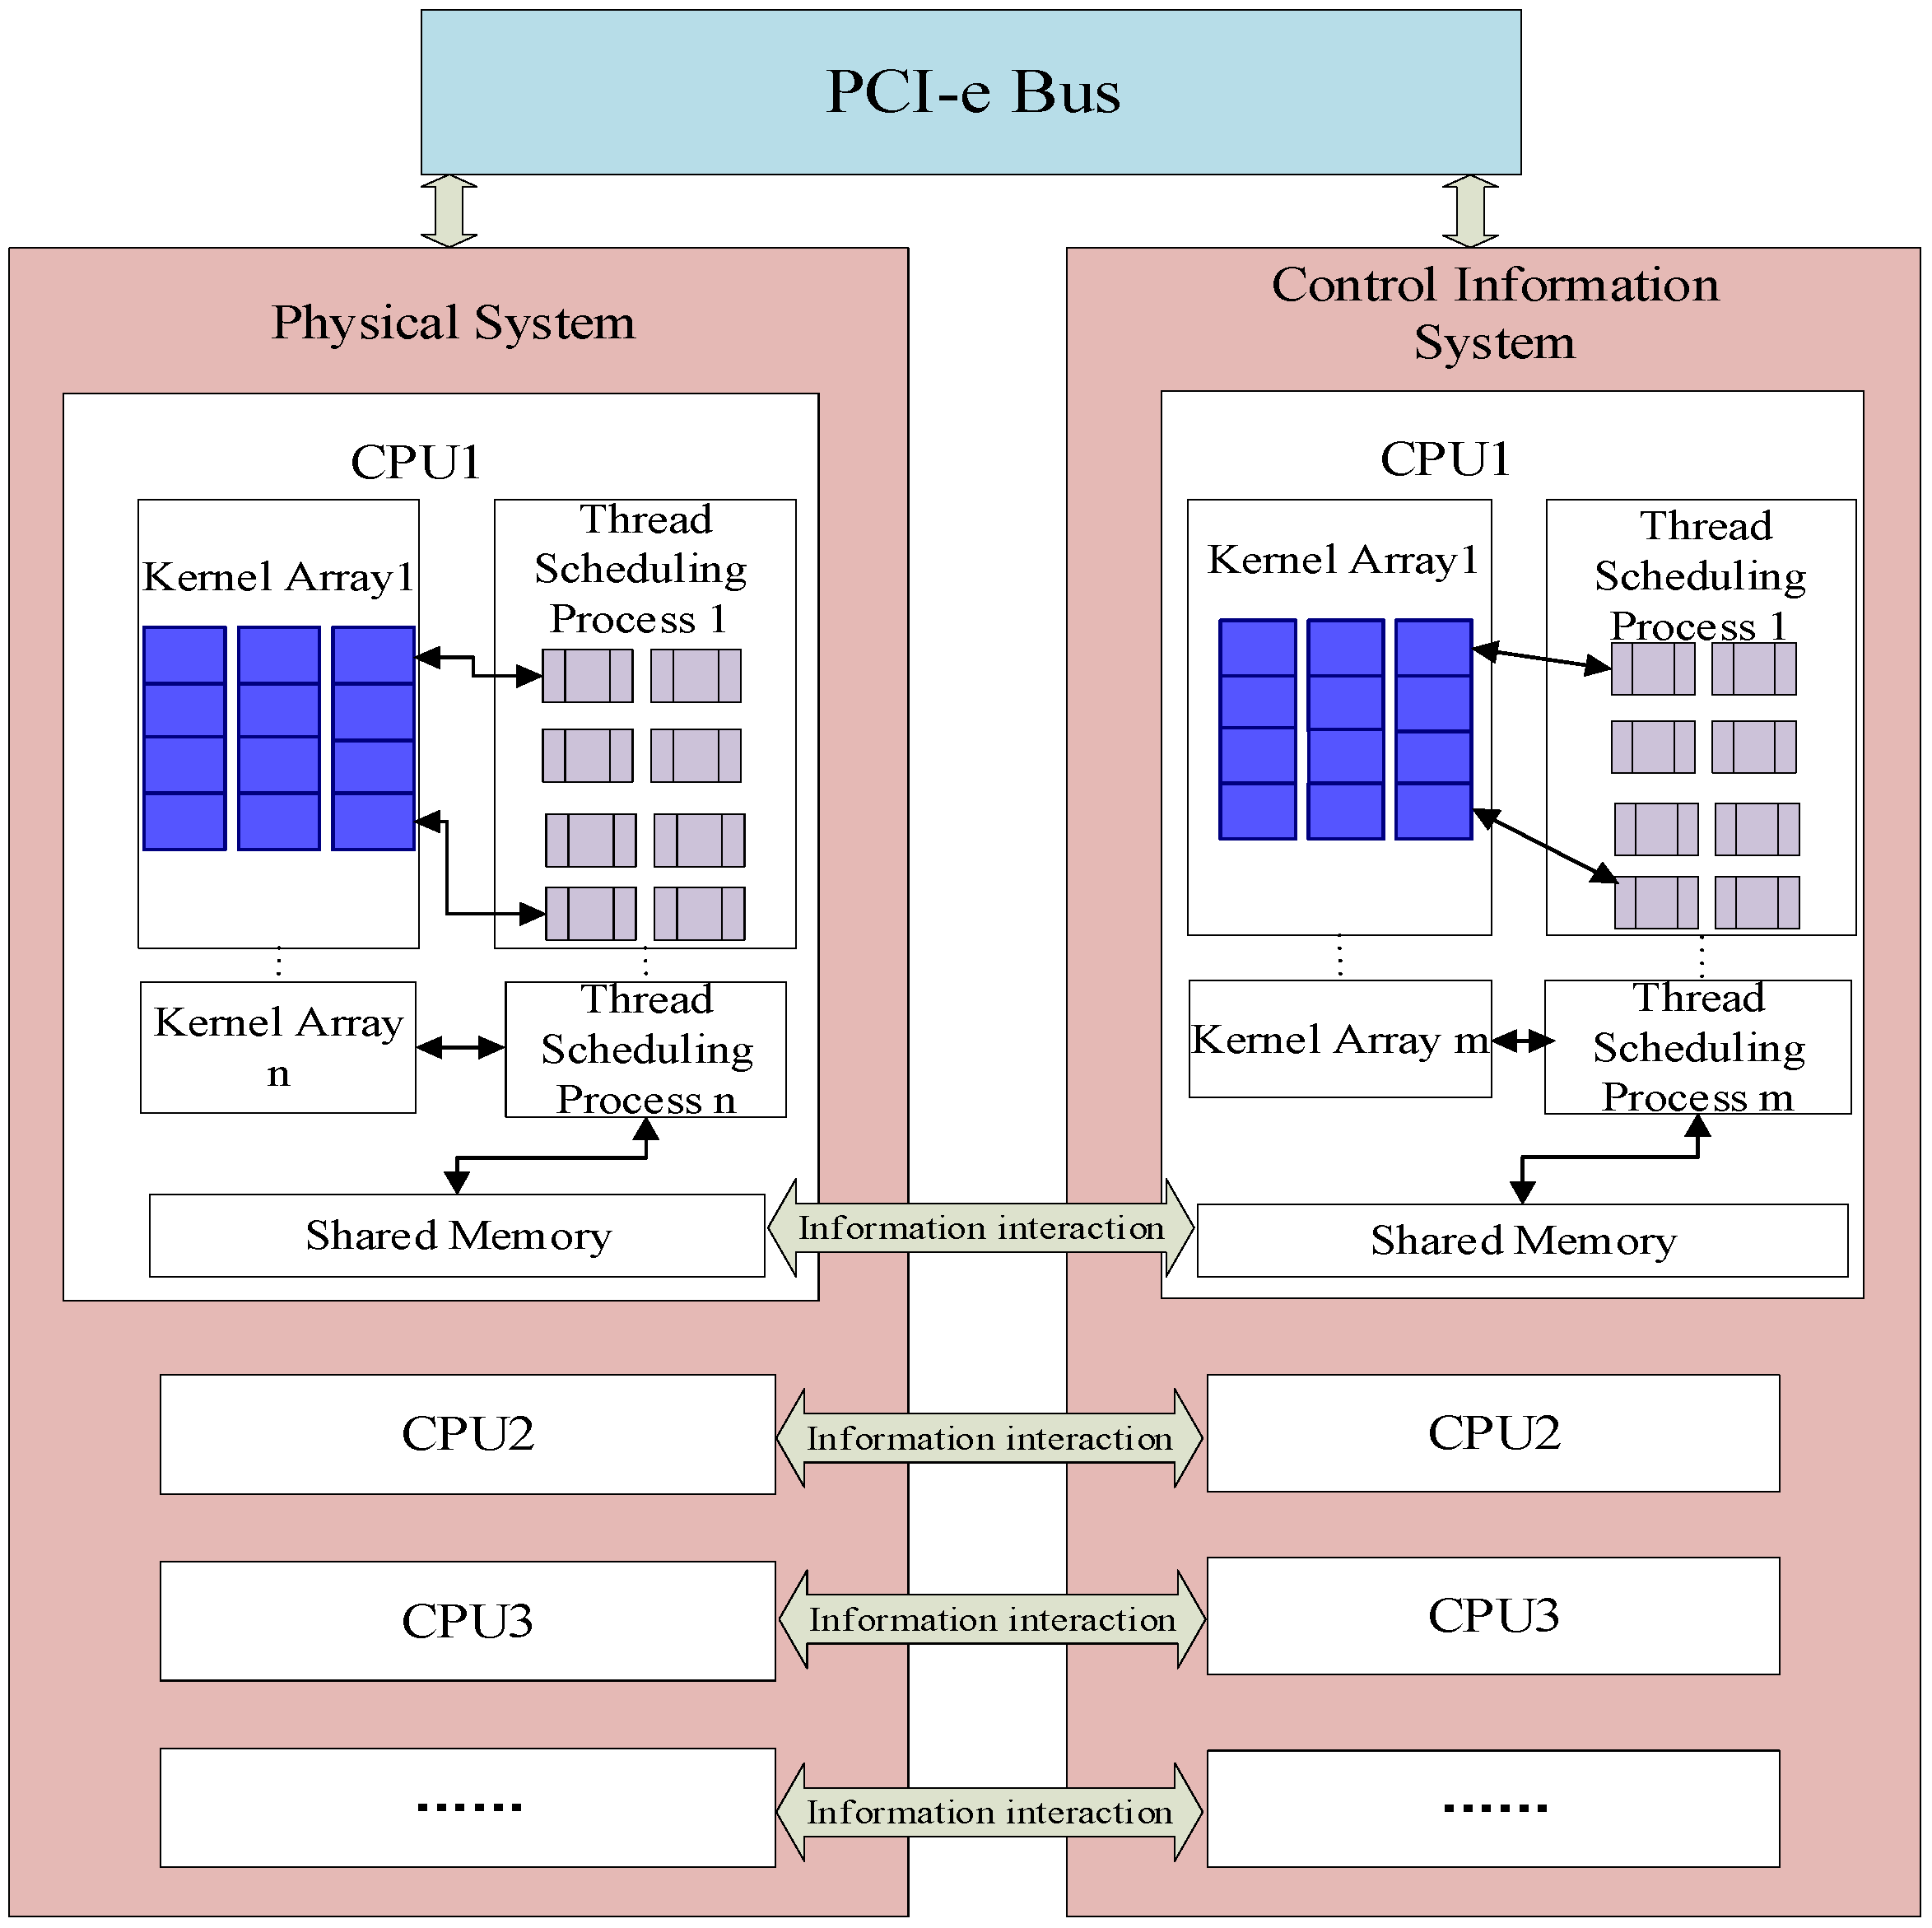
In order to realize the parallel simulation on the simulator, the model in the different regions should be distributed to the corresponding computing resources according to the theory about the ADN partition decoupling. Meanwhile, a series of different simulation steps can be used for the corresponding process according to the response rate, which is the effective way to realize the multi-rate hybrid simulation. According to the theory mentioned above, the simulation framework based on the interconnected simulator array was proposed in this paper, shown in Figure 9.
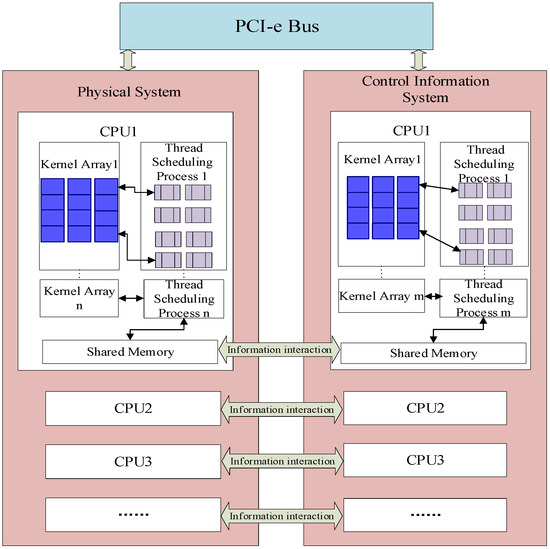
Figure 9.
Frame of real-time simulator for ADN.
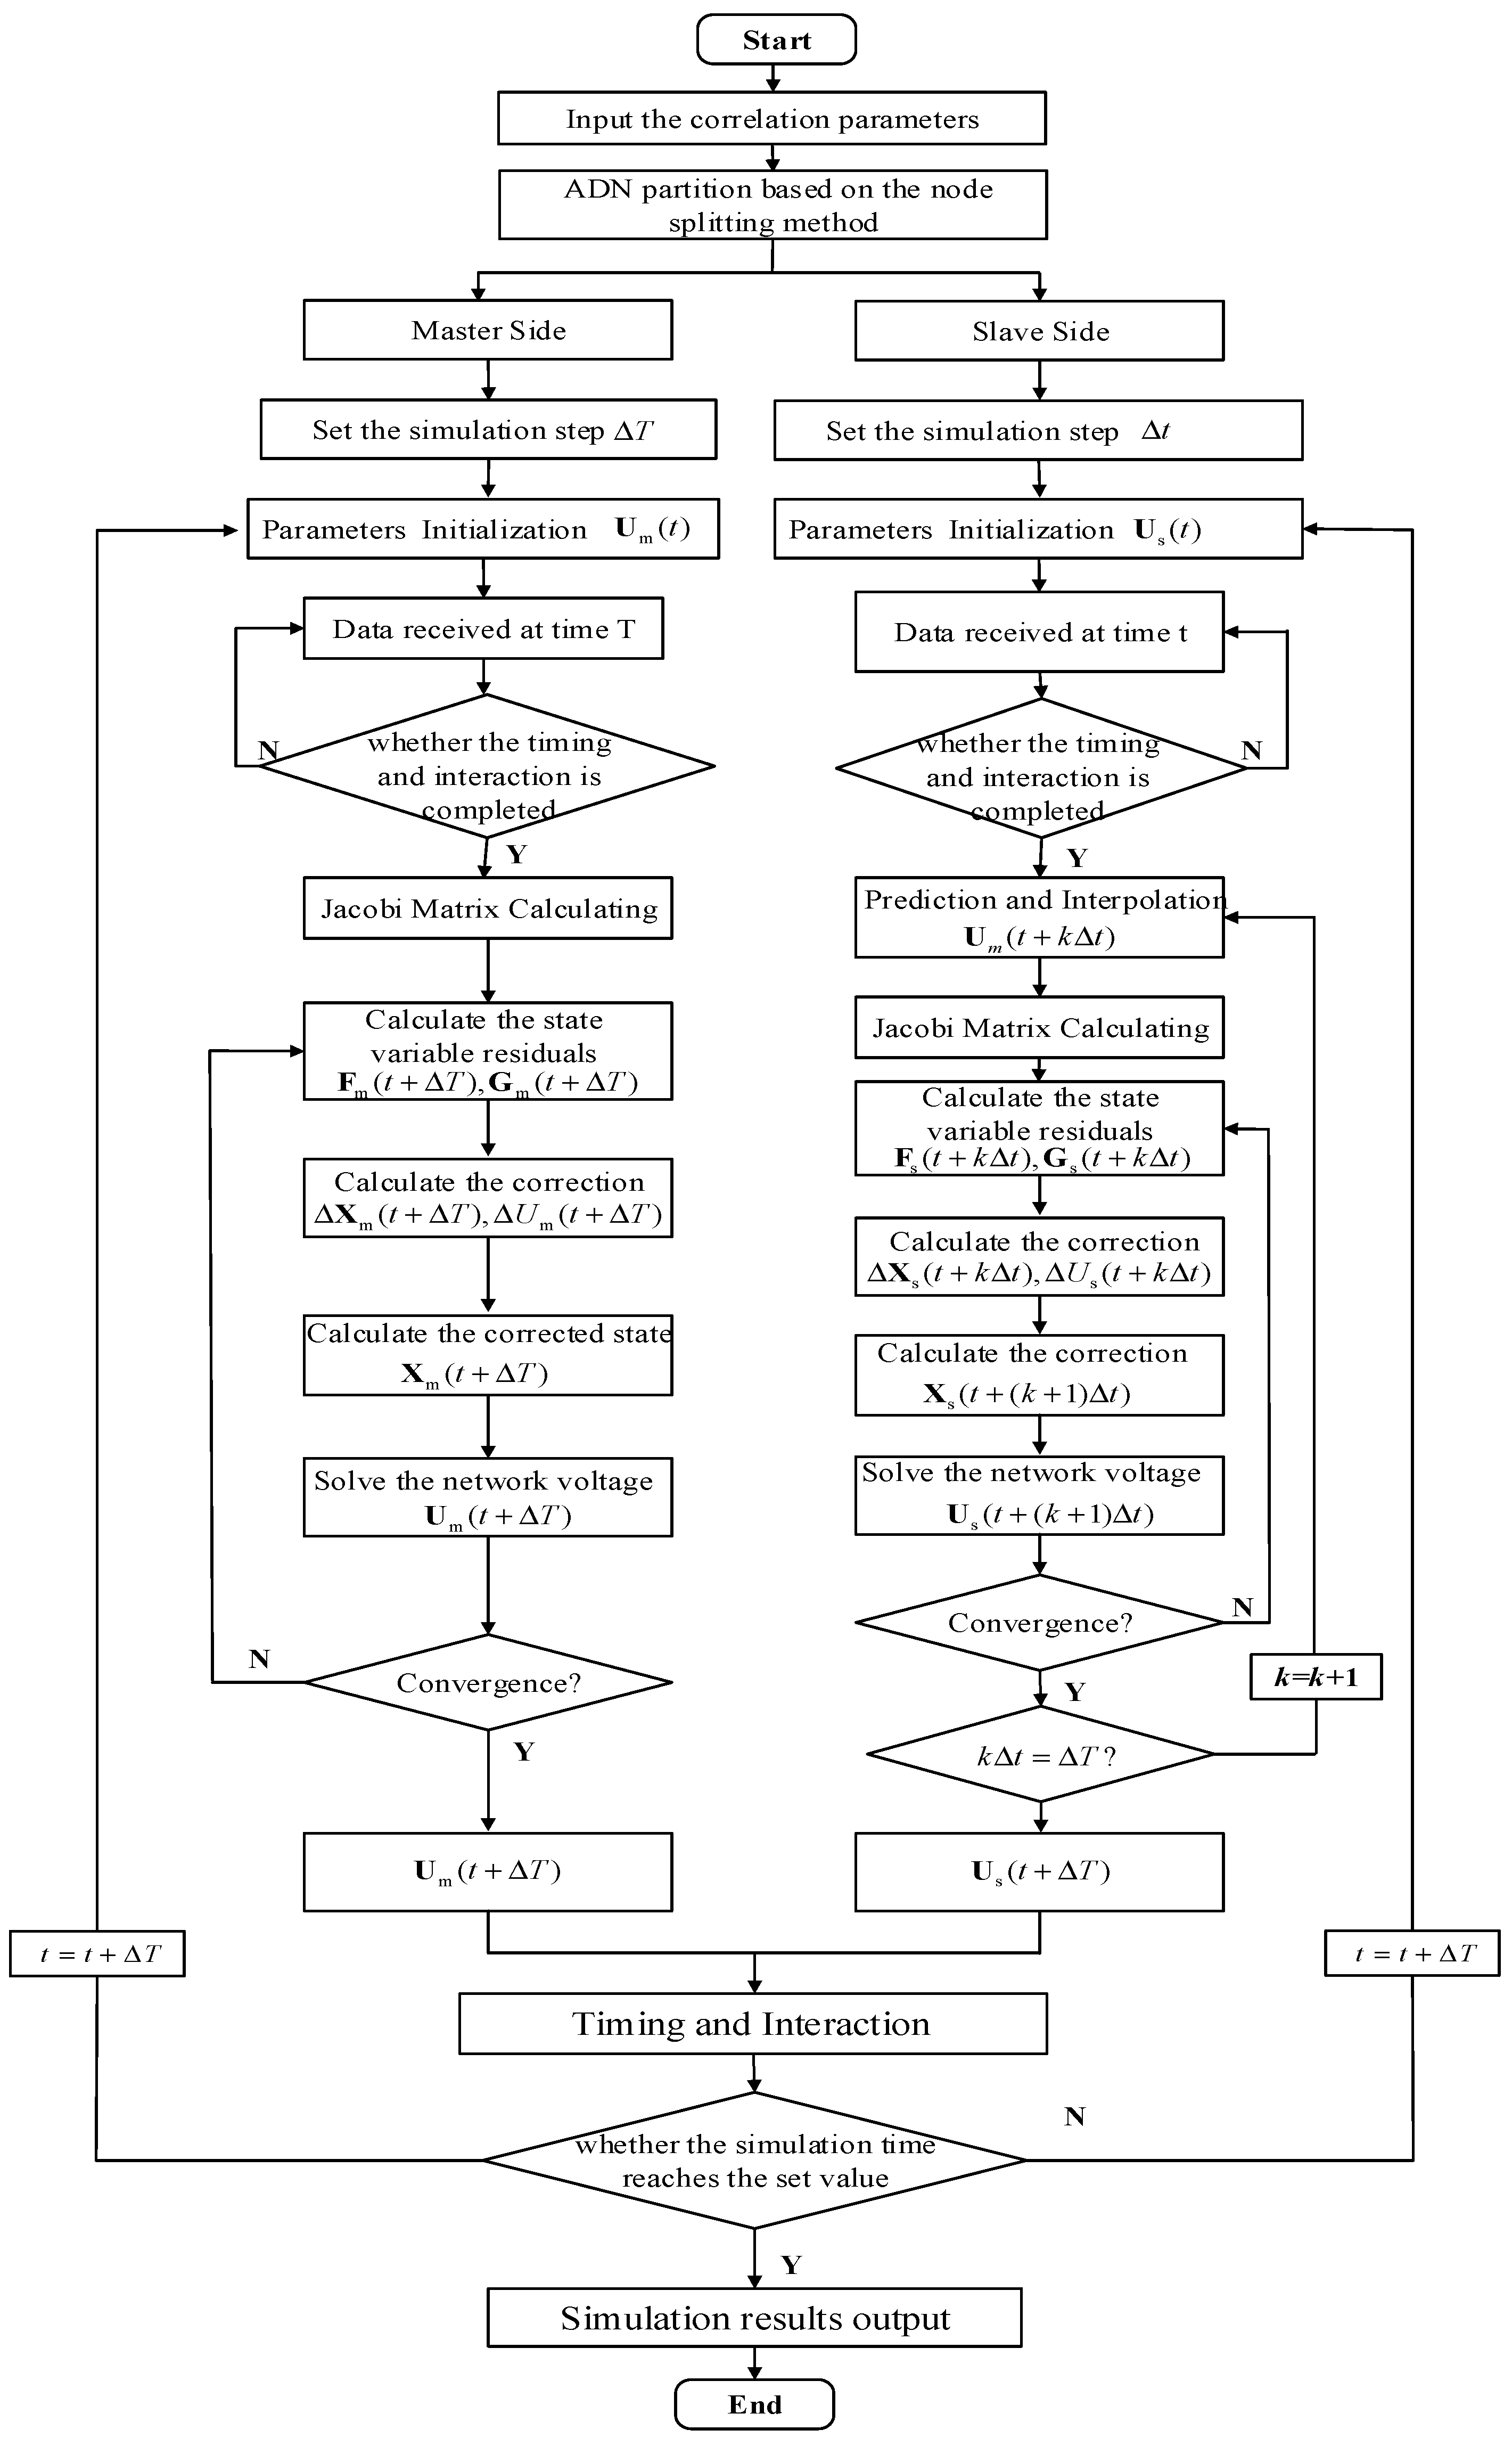
In this frame, the simulation method with multi-rate hybrid computation and parallel computation can be obtained, as shown in Figure 10.
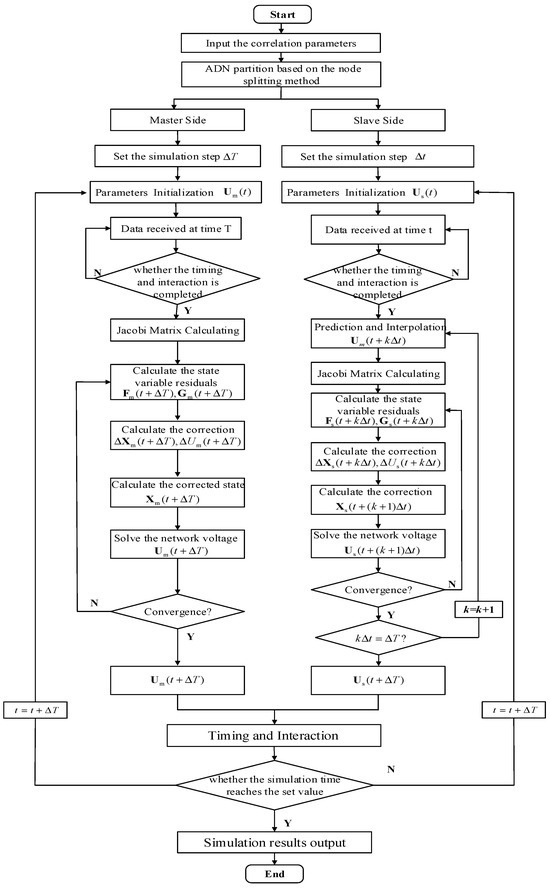
Figure 10.
Multi-rate parallel simulation process of ADN.
Step 1: Start.
Step 2: Input the correlation parameters, including the distribution network topology and parameters and the static parameters of the DGs, transformers, lines, the switch status, dynamic load parameters, etc.
Step 3: Realize the ADN partition based on the node splitting method according to the scale. Firstly, the ADN is divided into two parts (i.e., the subnets on the primary simulator and principal agent). Furthermore, a virtual line is used to build the virtual electrical connection between two sides, and meanwhile, the current in this virtual wire is used as the injection current of the subnets on both sides at the split node. On the primary simulator, the principal-agent subnet is equivalent to a controlled current source using Norton-equivalent model. Meanwhile, the primary-simulator subnet is equivalent to a controlled voltage source on the principal agent.
The equivalent model of the primary simulator, which uses the injection current as the coordinated variable, is shown in Equation (20), where is the equivalent injection current of the external network at the split node.
The equivalent model of the principal agent, which uses the node voltage as the coordinated variable, is shown in Equation (21), where us is the equivalent node voltage of the external network at the split node.
Step 4: Enter the primary-simulator simulation program.
Step 5: Set the simulation step size of the primary-simulator simulation model as ∆T, where ∆T = k∆t. ∆t is the simulation step of the principal-agent simulation model, and k should be an integer.
Step 6: Initialize the simulation parameters of the primary-simulator subnet at time t as Um(t).
Step 7: Complete the time synchronizing between master and principal agent. Receive the simulation data at time t from the principal agent according to the procedure mentioned in Step 2.
Step 8: Determine whether the timing and interaction between the master and the principal agent is completed. If not, repeat Step 7; otherwise, go to Step 9.
Step 9: Calculate the Jacobi matrix.
Step 10: Compute the state variable residuals Fm(t + ∆T) and Gm(t + ∆T).
Step 11: Compute the correction ∆Xm(t + ∆T) and ∆Um(t + ∆T), shown in Equation (23).
where A, B, C, Y + YD demonstrate the block Jacobi matrix, respectively. YD is the nonlinear elements in the system, which are incorporated into the admittance matrix part of the system.
Step 12: Compute the correction ∆Xm(t + ∆T), shown in Equation (24).
Step 13: Solve the network voltage ∆Um(t + ∆T), shown in Equation (25).
Step 14: Determine whether the correction and network voltage converge. If not, go to Step 10; otherwise go to Step 15.
Step 15: Obtain the simulation results ∆Um(t + ∆T) from the primary simulator.
Step 16: Enter the principal-agent simulation program.
Step 17: Set the simulation step size of the principal-agent simulation model as ∆t.
Step 18: Initialize the simulation parameters of the principal-agent subnet at time t as Us(t).
Step 19: Receive the simulation data at time t from the primary simulator.
Step 20: Determine whether the timing and interaction between the master and the principal agent is completed. If not, repeat Step 19; otherwise, go to Step 21.
Step 21: Prediction and interpolation. Since ∆T = k∆t, there should be interpolation to the data of the primary-simulator simulation at ∆t, 2∆t, 3∆t, 4∆t, etc. Hence, an innovative interpolation method is proposed in this paper as follows:
Firstly, the simulation results from the primary simulator at time t + ∆T, Um(t + ∆T) is predicted using the interpolation method mentioned above based on the results at time t − ∆T and t. The prediction method is shown in Equation (26).
Then, predict the simulation results from the primary simulator at each ∆t based on the prediction ∆Um(t + ∆T), shown in Equation (27).
Step 22: Compute the Jacobi matrix.
Step 23: Compute the state variable residuals FS(t + k∆t) and GS(t + k∆t).
Step 24: Compute the correction ∆Xs(t + k∆t) and ∆Us(t + k∆t).
Step 25: Compute the corrected state ∆Xm(t + (k + 1) ∆T).
Step 26: Solve the network voltage ∆Us(t + (k + 1) ∆t).
Step 27: Determine whether the correction and network voltage converge. If not, go to Step 23; otherwise, go to Step 28.
Step 28: Determine whether ∆T equals k∆t. If not, k = k + 1, and go to Step 21; otherwise, go to Step 29.
Step 29: Obtain the results from the primary simulator, Um(t + ∆T).
Step 30: In the simulation monitoring module, the primary-simulator simulation results and principal-agent simulation results at the time of t + ΔT are both received at the same time.
Step 31: Determine whether the simulation time reaches the set value. If not, the simulation on the primary simulator and the principal agent should go to Step 6 and Step 18, respectively; otherwise, go to Step 32.
Step 32: Simulation result output.
Step 33: End.
Special tips: The procedure of the primary simulator (i.e., Step 3~Step 15) and the procedure of the principal agent (i.e., Step 16~Step 30) are parallel procedures.
5. Simulation Verification
5.1. Introduction to the Example and Scenario Used in the Simulation
In order to verify the correctness and rationality of the fast/medium/slow dynamic decoupling method and the simulation with decomposition and coordination of the ADN, this paper conducts a unified verification of these two methods. By comparing the serial simulation which has the highest simulation accuracy, the improvement in the simulation speed can be verified under the premise of ensuring simulation accuracy.
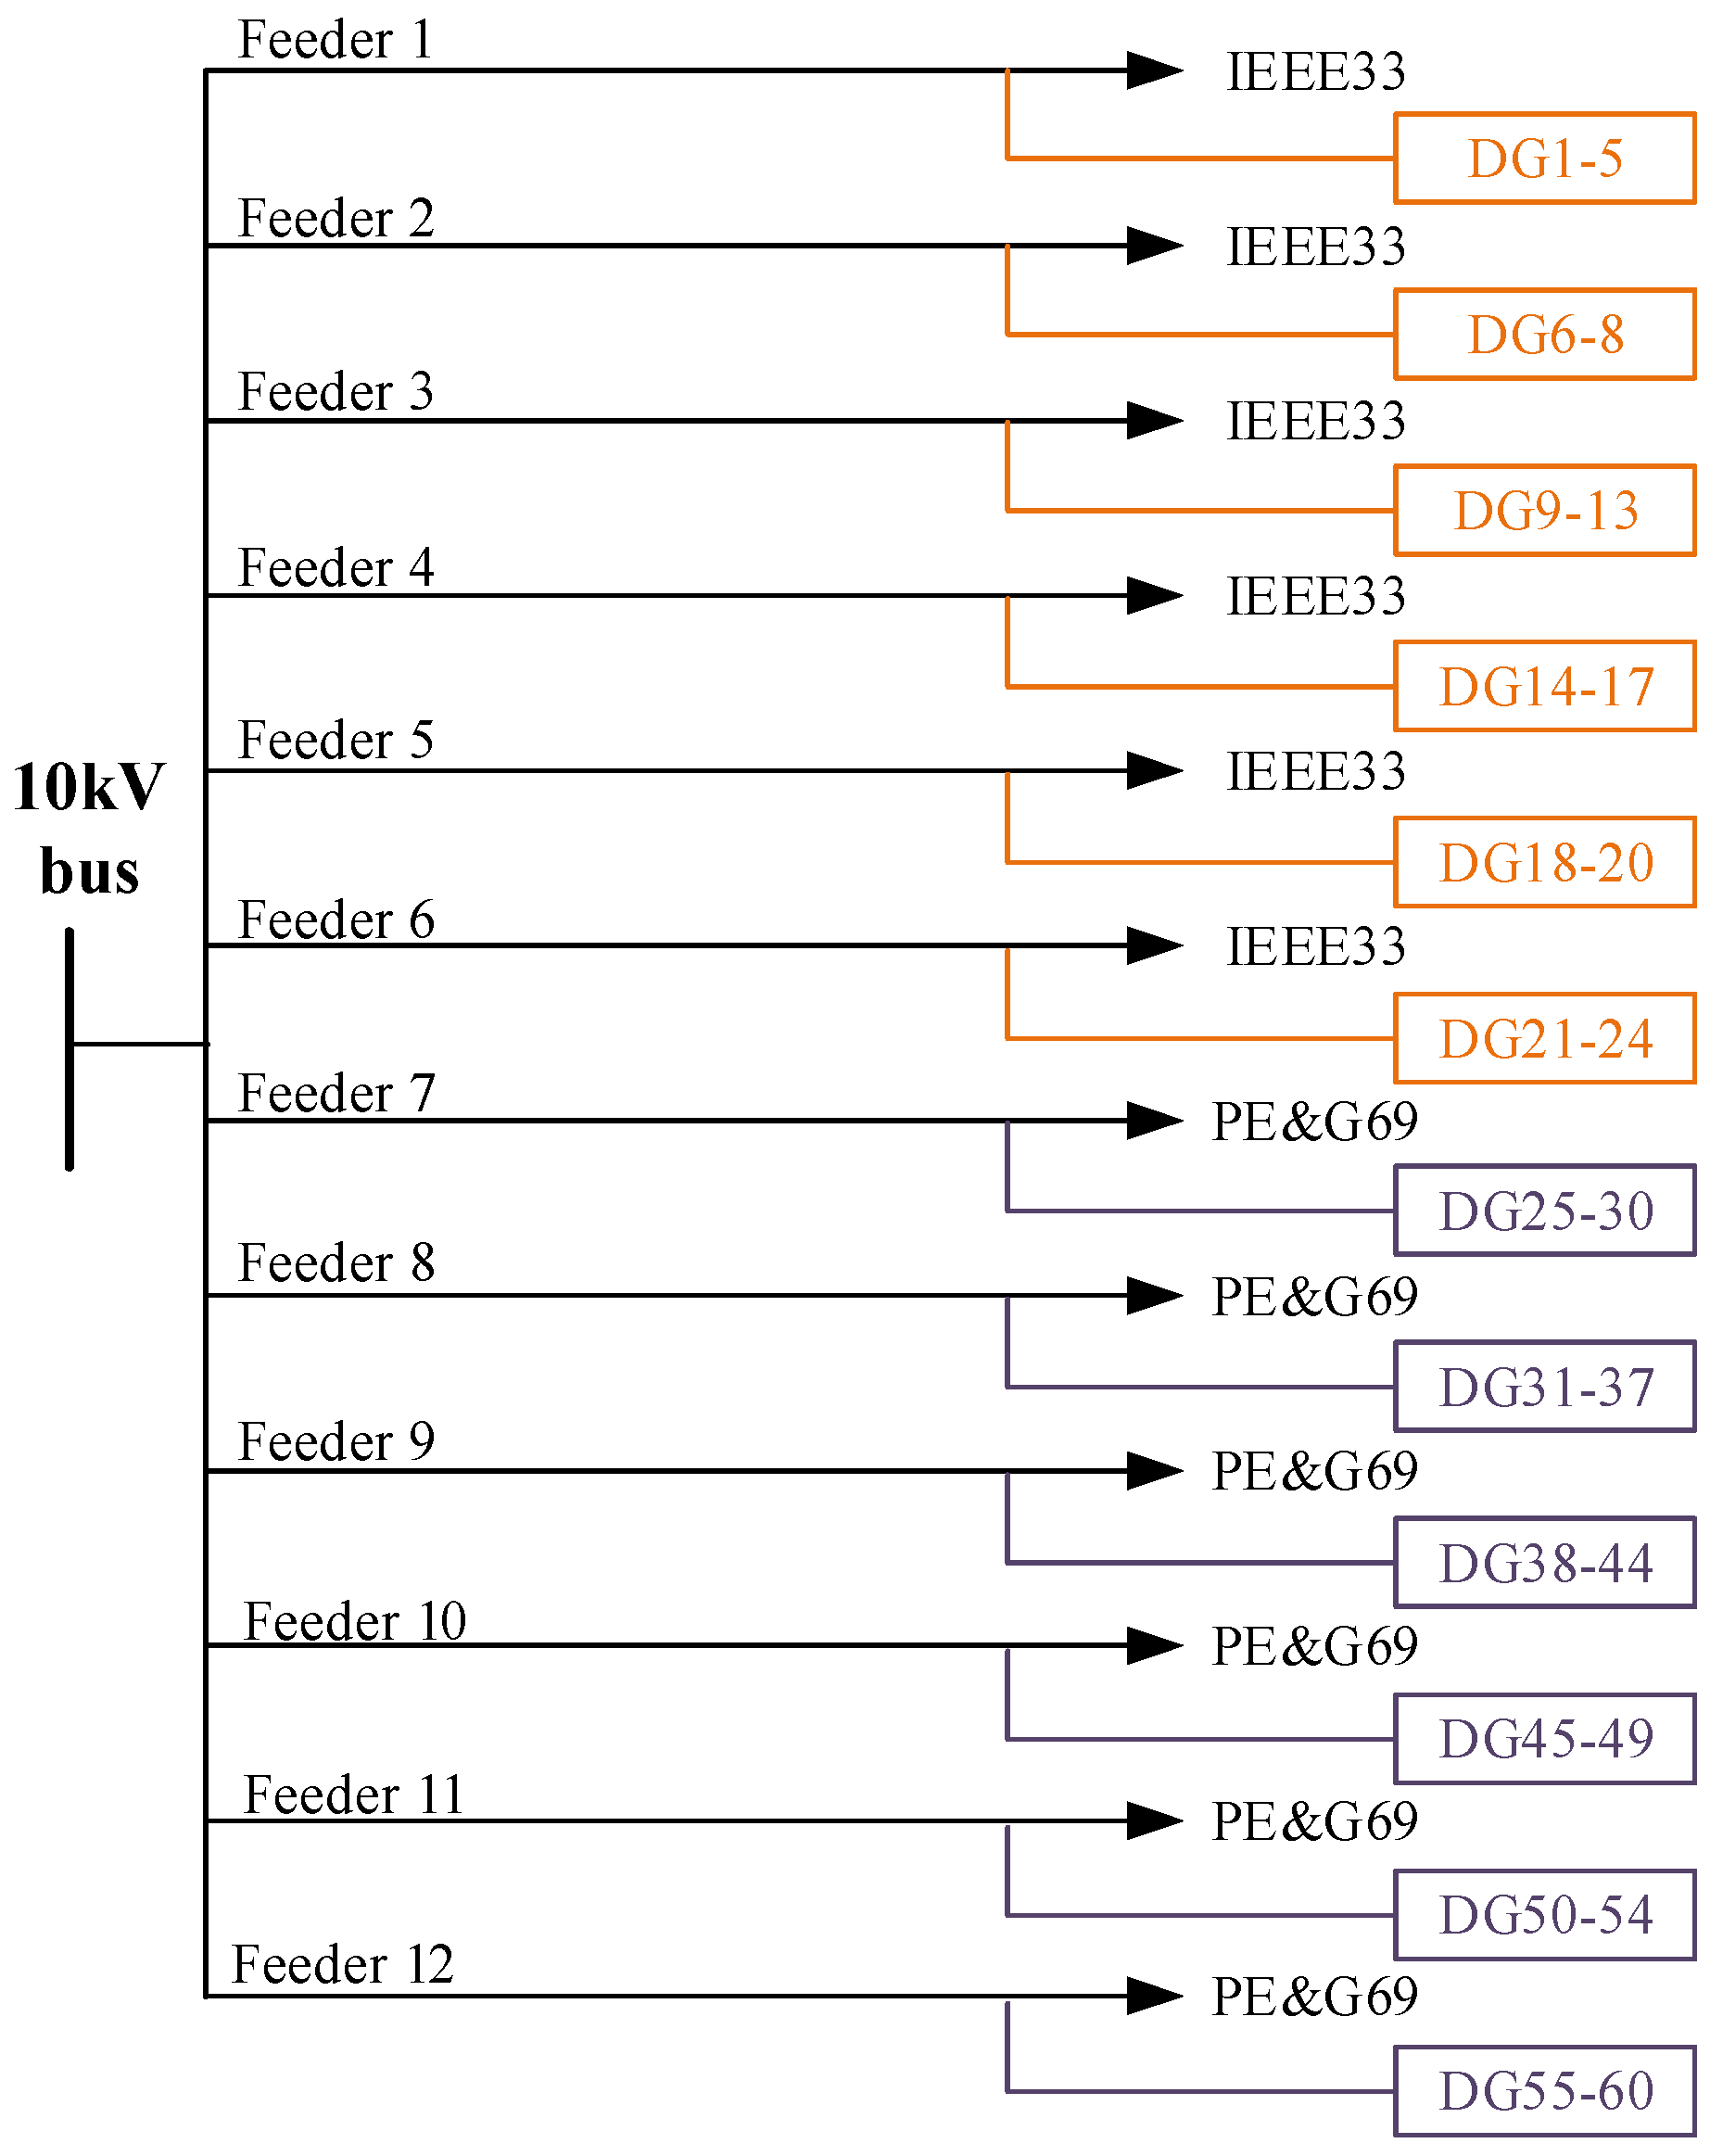
In order to verify the effectiveness and rationality of the partitioned coordinated multi-rate parallel simulation technology in improving the simulation speed and ensuring the calculation accuracy, the model of distribution network and DGs were constructed using Matlab 2017a; the memory of the computer is 8 GB; and the main frequency of the CPU is 2 GHz. Meanwhile, the simulation analysis is carried out in different scenarios. The ADN used in the simulation is composed of 12 feeders of the same 110 kV transformer station, and DGs with a maximum power output range of 30 kW to 100 kW are randomly connected to the fixed nodes of each feeder. The ADN’s memory is 64 GB, it has 10 CPU cores, and the main frequency of the CPU cores is 2 GHz. The number of the feeders is determined by the electrical connection; more importantly, the feeder numbers with the load transfer relationship are adjacent. Each feeder is improved on the basis of the IEEE-33 case (shown in Figure 11) and PG & E-69 case (shown in Figure 12). By connecting DGs with different capacities at different nodes, the scenarios used in the simulation can be enriched effectively, as shown in the Table 2 and Table 3. The figure of the ADN is shown in Figure 13.

Figure 11.
IEEE-33 test case.

Figure 12.
PG&E 69 test case.

Table 2.
Feeder topology information.

Table 3.
DG integration location and capacity.
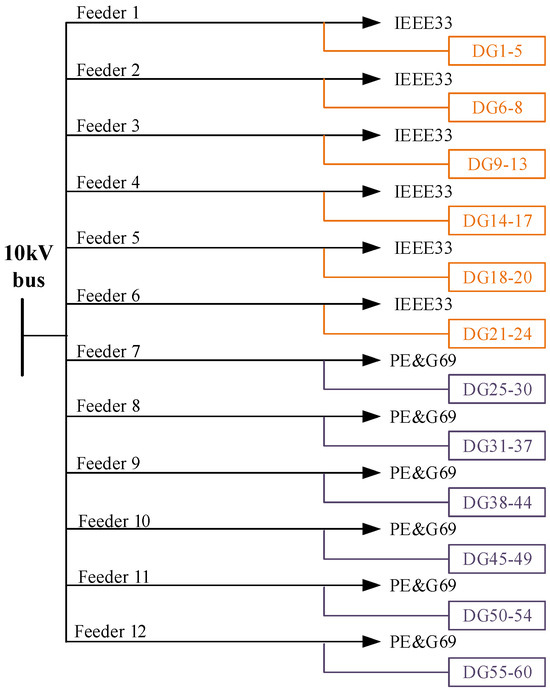
Figure 13.
The ADN composed by the 12 feeders.
In this paper, the network mentioned above is simulated and analyzed at 0–2 s. The simulation step size is set as T = 50 μs, and all of the DGs are connected to the grid at 0s. In addition, a fault occurred at node 1 of No.8 feeder at 0.5 s. In order to reflect the influence of the fault at the head of the feeder on other feeders of the same transformer station, the inlet of the 110 kV transformer station is used as the balance node. In addition, only the fault starting time and removal time are monitored. Moreover, the fault recovery strategies, such as reclosing the breaker and load transfer, are not considered in these simulation to ensure that the network topology would not change before and after the fault removal. At the same time, the inverters of the DGs adopt the constant power control strategy to ensure continuous operation with constant output power during the transient process.
5.2. Simulation Speed Analysis of Partition and Coordinated Multi-Rate Parallel Simulation
In order to verify the superiority of the adaptive variable-step-size multi-rate parallel transient simulation technology for the ADN based on the optimized grid strategy in improving the simulation speed, a single-phase ground fault is set at the fault location mentioned above. Furthermore, a series of the schemes are set to evaluate the effectiveness of the partition and parallel technology proposed in this paper, including serial simulation, parallel simulation, traditional partition strategy, optimized partition strategy, adaptive variable-step-size multi-rate parallel simulation, and fixed step-size parallel simulation.
Scheme 1 adopts the serial simulation mode, and one CPU core takes all 612 traditional load nodes and 60 DG simulations. As shown in Table 4, Scheme 2 adopts parallel simulation mode, eight CPU cores take all traditional load nodes and DG simulations. According to the method, there would be two cores for simulating traditional load nodes, while there would be six cores for simulating DGs. Among them, Schemes 2 and 3 are the results of the partition obtained by artificially balancing the capacity of each CPU core; Scheme 4 uses the optimized partition strategy described in this paper to obtain the CPU core allocation result.

Table 4.
CPU multi-core parallel simulation network results.
The serial simulation step size of Scheme 1 is 5 × 10⁻⁵. The parallel simulation step size of each subnet in Scheme 4 is shown in Table 5. Among them, all subnets of Scheme 5 adopt the same simulation step size. The simulation step size of each subnet in Scheme 5 consists of fast, medium, and slow according to the type of component. Scheme 6 adopts adaptive variable-step-size technology for small-step and medium-step subnets and adjusts its simulation step size in real time during the simulation process.

Table 5.
Allocation of CPU multi-core parallel simulation step.
In order to analyze and compare the simulation rate of each scheme, this paper proposes the evaluation index system shown in Equation (28):
where y1 is the time balance rate of the subnet calculation, and it is optimal when it is 100%; y2 is the simulation acceleration ratio, y2 ∈ [1,+∞], and the larger the value is, the better the parallel simulation effect is. T1, T2,……, TnCPU are the simulation times for each CPU core, while T∞ is the simulation time for serial simulation. Tt indicates that the communication time between the CPU cores can be ignored.
Table 6 shows the simulation results of the evaluation indexes such as the simulation-time balance rate and the simulation acceleration ratio of each case, where Min and Max demonstrate min(T1, T2, K, TnCPU) and max(T1, T2, K, TnCPU), respectively.

Table 6.
CPU multi-core simulation rate evaluation index.
Comparing the calculation results of Scheme 1 and Scheme 4, it can be seen that parallel simulation using CPU multi-core technology can significantly improve the simulation rate and shorten the simulation time to 1.02% of the serial simulation. Comparing the calculation results of Scheme 2, Scheme 3, and Scheme 4, it can be seen that the optimized sub-network strategy described in this paper can increase the sub-network calculation time balance rate and simulation acceleration ratio to 134.00% and 123.61% on average in the traditional sub-network mode. On the basis of adopting the optimized subnetting strategy, compared with the calculation results for Scheme 4, it can be seen that the multi-rate parallel simulation technology can increase the subnet calculation-time balance rate and simulation acceleration ratio to 116.24% and 101.80% under the same rate-parallel mode. The multi-rate parallel simulation technology with adaptive variable step size can increase the time balance rate and simulation acceleration ratio of the subnet calculation to 119.90% and 121.31% in the same rate-parallel mode.
5.3. Accuracy Analysis of Partition-Coordinated Multi-Rate Parallel Simulation
In order to verify the superiority of the adaptive variable-step-size multi-rate parallel transient simulation technology of ADN based on the optimized branch network strategy in ensuring the simulation accuracy, multiple types of faults are set at the fault location, and the simulation waveforms and errors of serial simulation, parallel simulation at the same rate and multi-rate parallel simulation with adaptive variable step size are compared.
In order to reflect the influence of faults on multiple feeders in the same substation, this paper selects the following three measurement points: fault location, DG next to the fault location, and the head of the feeder next to the feeder with the fault. At the time of the fault starting and removal, the voltage and current of the fault location change abruptly, and the transient simulation has a large error. Therefore, the fault location is selected as the measurement point I; at the same time, in order to analyze the influence of the fault on the DG grid connection point on the feeder, the adjacent DG of the fault location is selected as the measuring point II; further, the head-end of the adjacent feeder where the fault location is located is selected as the measurement point III.
- (1)
- Parallel simulation results for single-phase ground faults
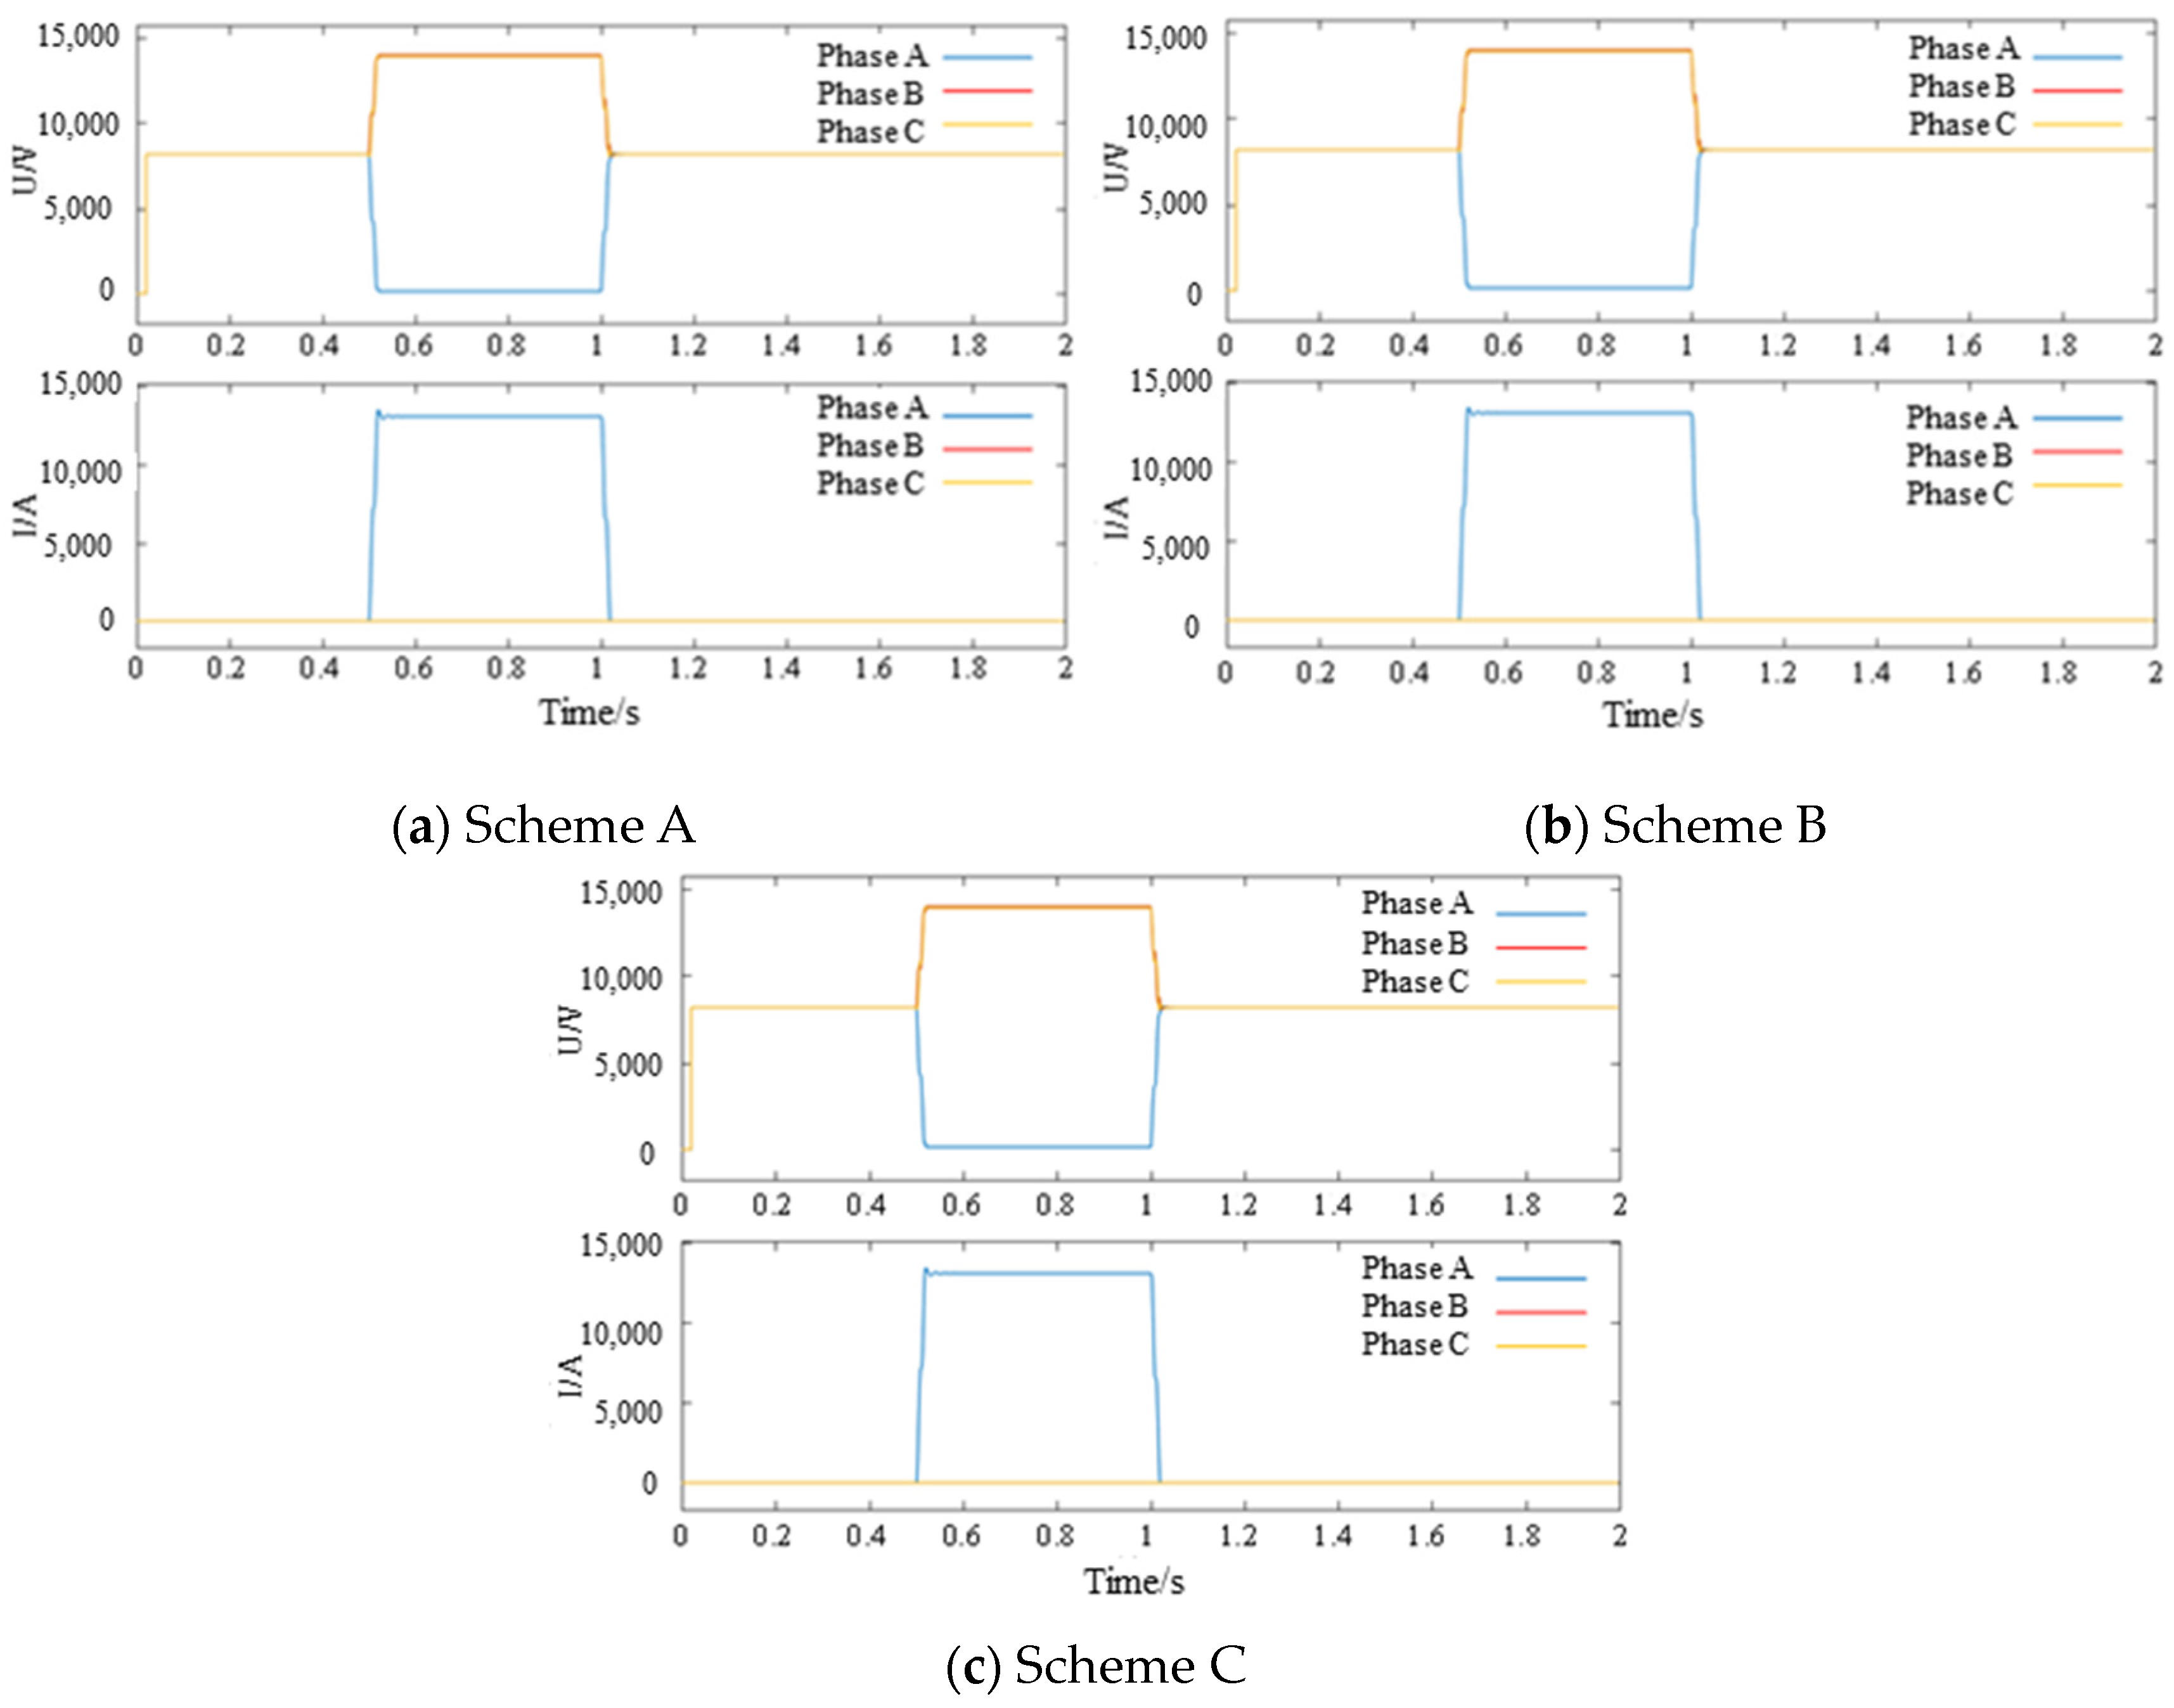
As the most common fault type in the distribution network, it is of great value to simulate the single-phase ground fault. As shown in Figure 14, the normal operating voltage of the fault location is 8.21 kV and the normal operating current is 0. At the starting moment of the single-phase grounding fault, the grounding phase voltage drops to 0, and the current suddenly changes to 13.49 kA. The other two-phase voltage suddenly changes to 1.70 times the phase voltage during normal operation, and the current remains unchanged. After the grounding fault, the point experienced a short transient process and returned to normal operation.
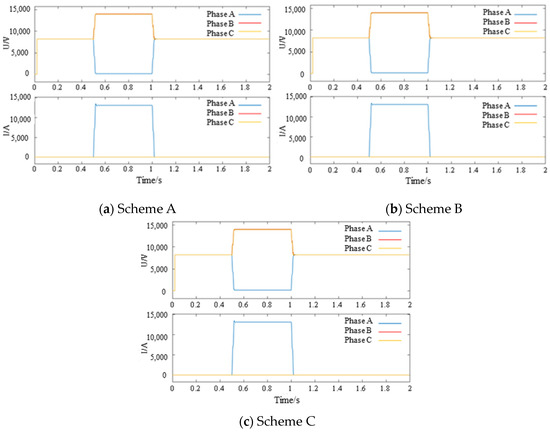
Figure 14.
The three-phase voltage and current peaks of the fault location in the single-phase grounding simulation scenario.
Since Scheme A uses a small-step simulation for all simulation nodes, the calculation accuracy is the highest, so the actual value of the calculation result is approximated as the theoretical value of the system operation. Comparing Scheme B with Scheme A and Scheme C with Scheme A, the simulation error percentages for Schemes B and C are obtained, as shown in Table 7. It can be seen that the multi-rate parallel simulation technology can improve the simulation rate on the basis of ensuring the simulation accuracy, and the simulation error can be controlled within 0.5%.

Table 7.
Simulation error of single-phase ground fault.
- (2)
- Parallel simulation results for two-phase short-circuit faults
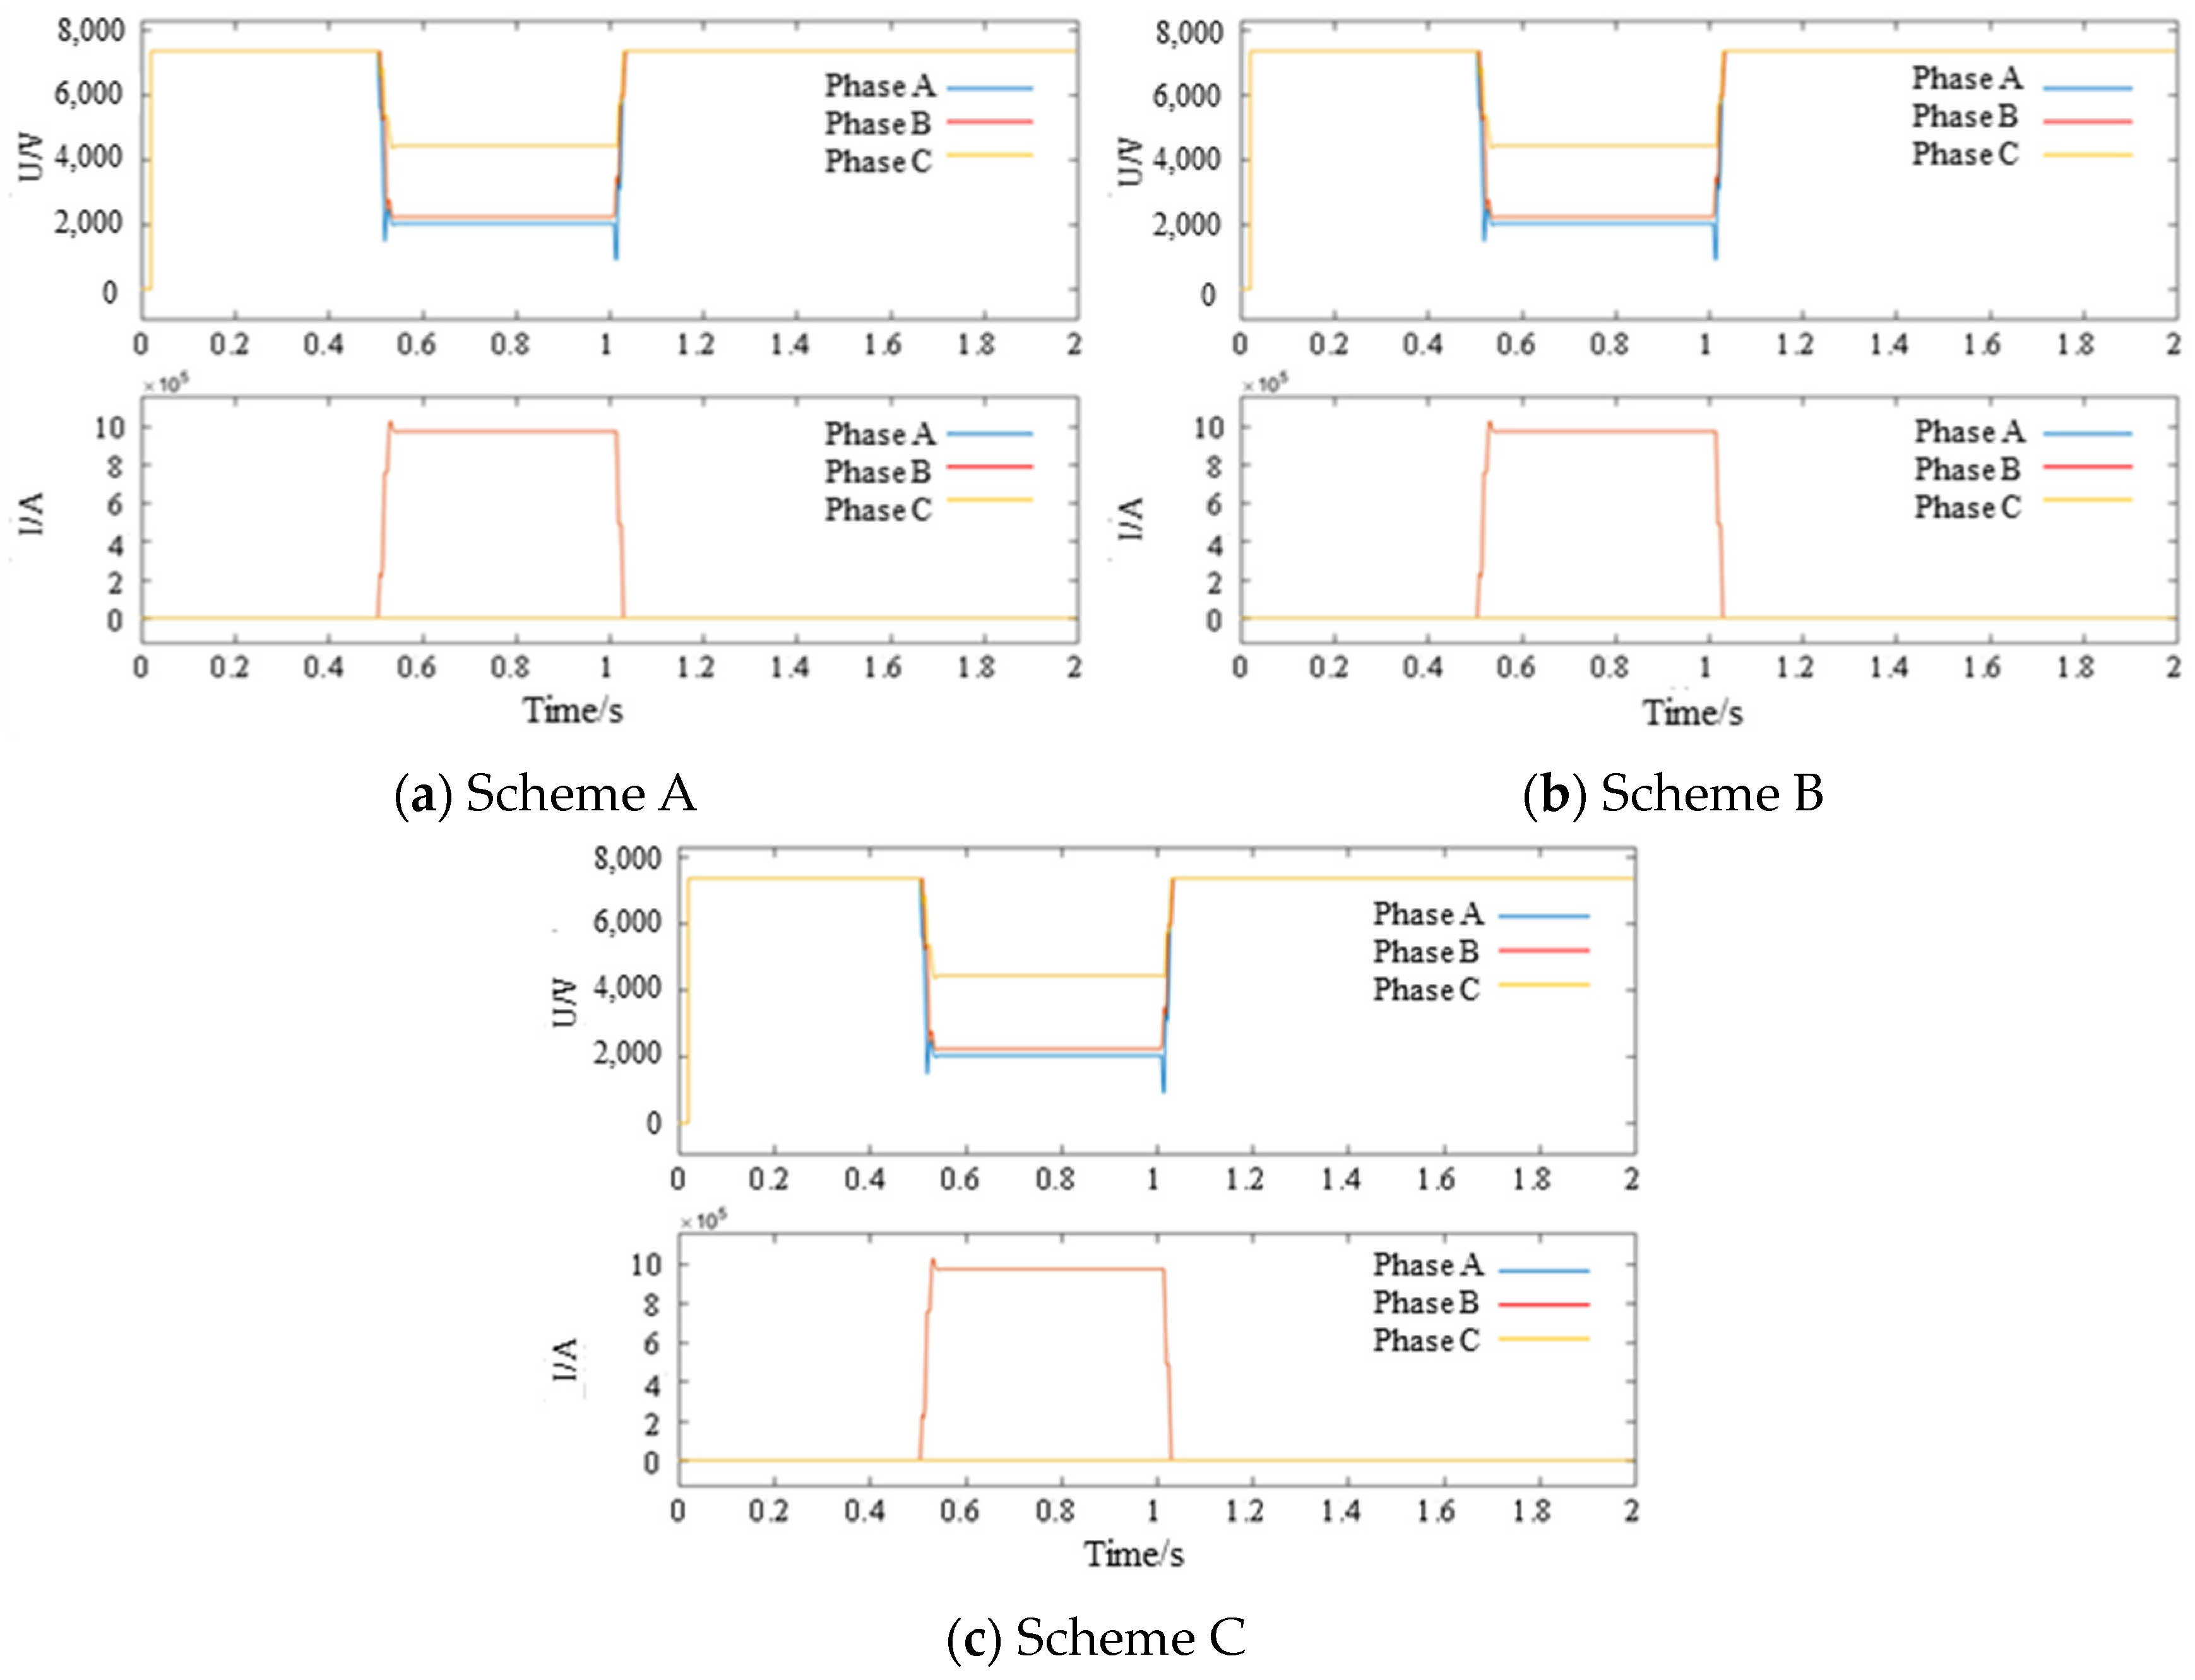
Since Scheme 1 adopts a small-step simulation for all nodes, the calculation accuracy is the highest, and the actual value of the calculation results is approximated as the theoretical value of the system operation. As shown in Figure 14, the normal operating voltage of the fault location is 8.21 kV and the normal operating current is 0. At the beginning of the two-phase short-circuit fault, the short-circuit phase voltage drops to 2.24 kV and the current suddenly changes to 0.97 MA, while the remaining phase voltage drops to 4.41 kV and the current remains unchanged. After the end of the short-circuit fault, the point undergoes a short transient process and returns to normal operation, as shown in Figure 15.
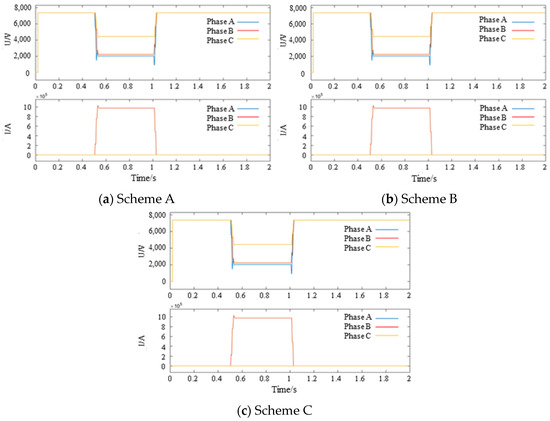
Figure 15.
The three-phase voltage and current peaks of the fault point in the two-phase short-circuit simulation scenario.
Comparing Scheme B with Scheme A and Scheme C with Scheme A, the simulation error percentages of Schemes 4 and 6 are obtained, as shown in Table 8. It can be seen that the multi-rate parallel simulation technology can improve the simulation rate on the basis of ensuring simulation accuracy, and the simulation error can be controlled within 0.5%.

Table 8.
Simulation error of two-phase short-circuit fault.
- (3)
- Parallel simulation results for two-phase short-circuit ground faults
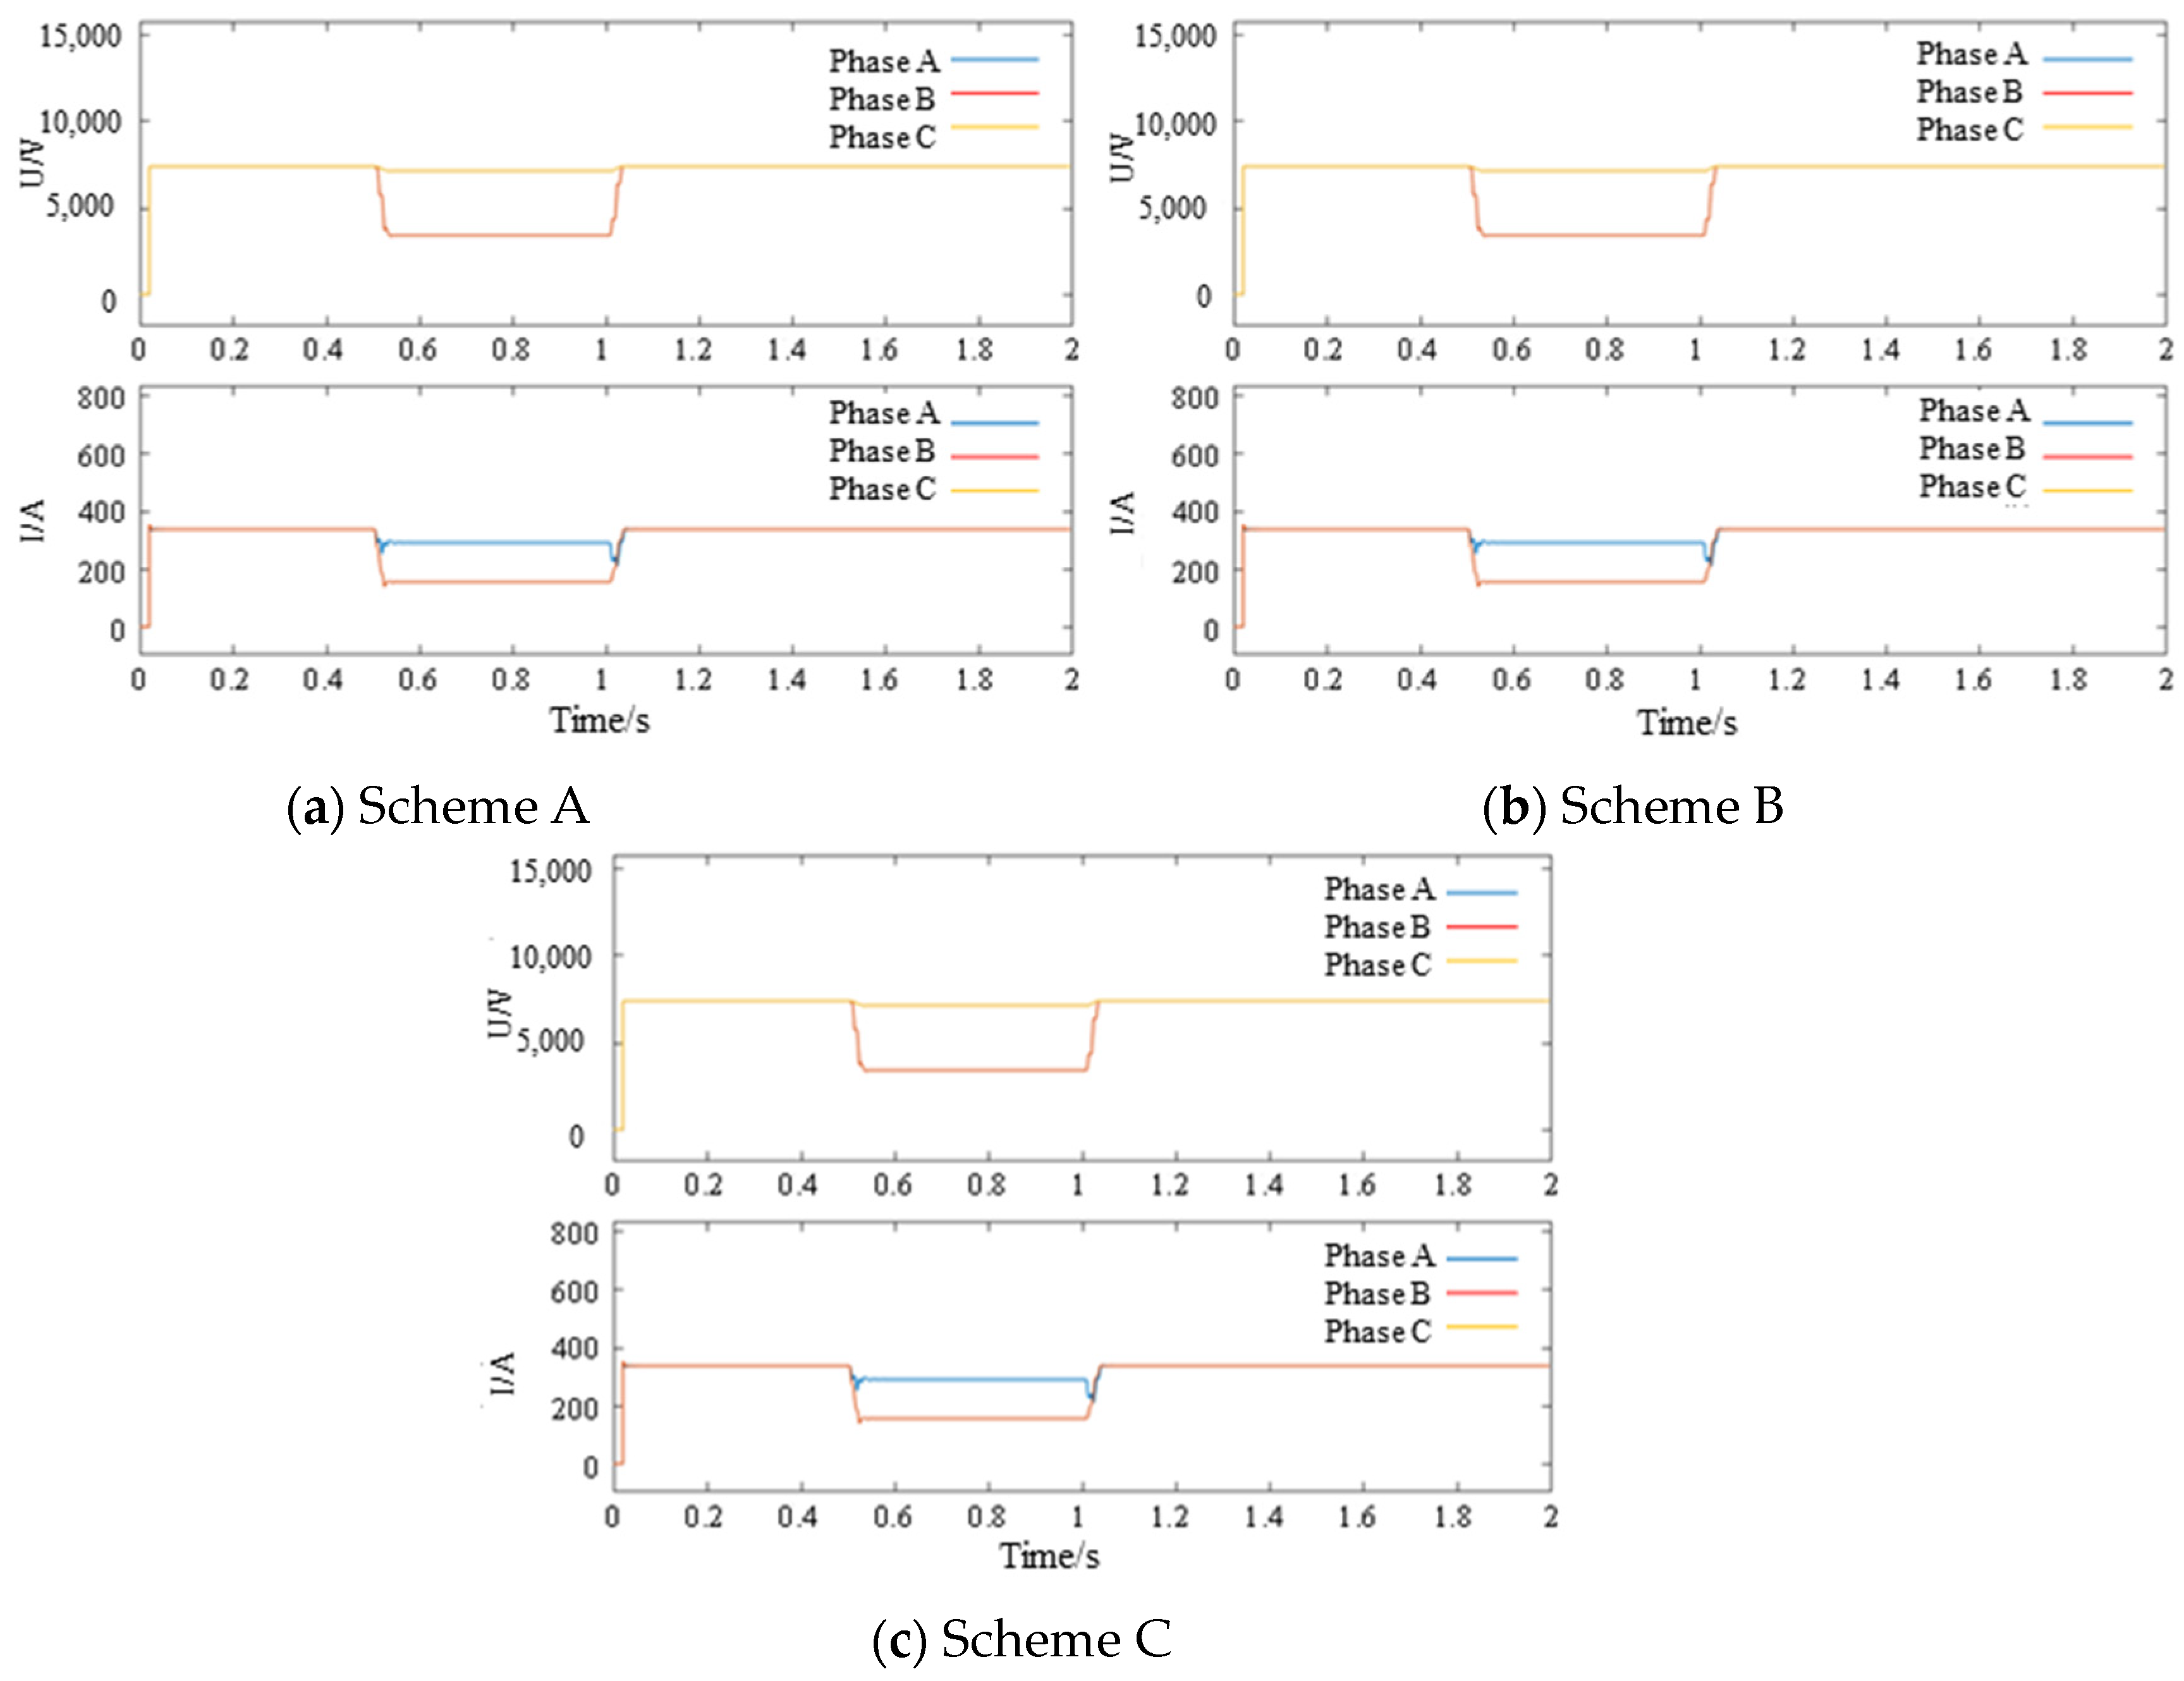
Since Scheme A adopts a small-step simulation for all simulation nodes, the calculation accuracy is the highest, so the actual value of the calculation results is approximated as the theoretical value of the system operation. As shown in Figure 16, the normal operating voltage of the fault location is 8.21 kV and the normal operating current is 0; at the beginning of the two-phase short-circuit ground fault, the short-circuit phase voltage drops to 1.03 kV and the current suddenly changes to 0.73 MA, while the remaining phase voltage suddenly changes to 10.71 kV and the current remains unchanged. After the end of the short-circuit fault, the point undergoes a short transient process and returns to normal operation, as shown in Figure 16.
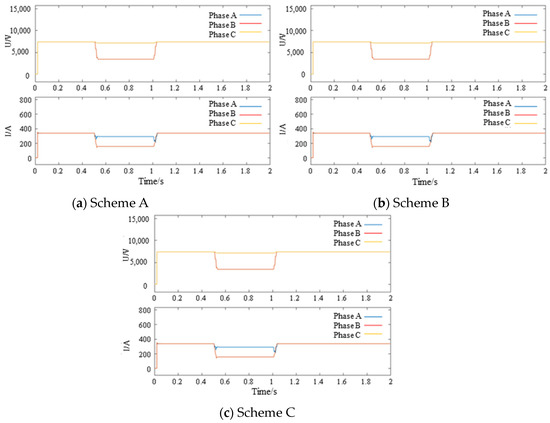
Figure 16.
The three-phase voltage and current peaks of the fault point in the two-phase short-circuit grounding simulation scenario.
Comparing Scheme B with Scheme A and Scheme C with Scheme A, the simulation error values of Schemes B and C are obtained, as shown in Table 9. It can be seen that the multi-rate parallel simulation technology can improve the simulation speed on the basis of ensuring simulation accuracy, and the simulation error can be controlled within 1%.

Table 9.
Simulation error of two-phase short-circuit ground fault.
- (4)
- Parallel simulation results for three-phase short-circuit faults
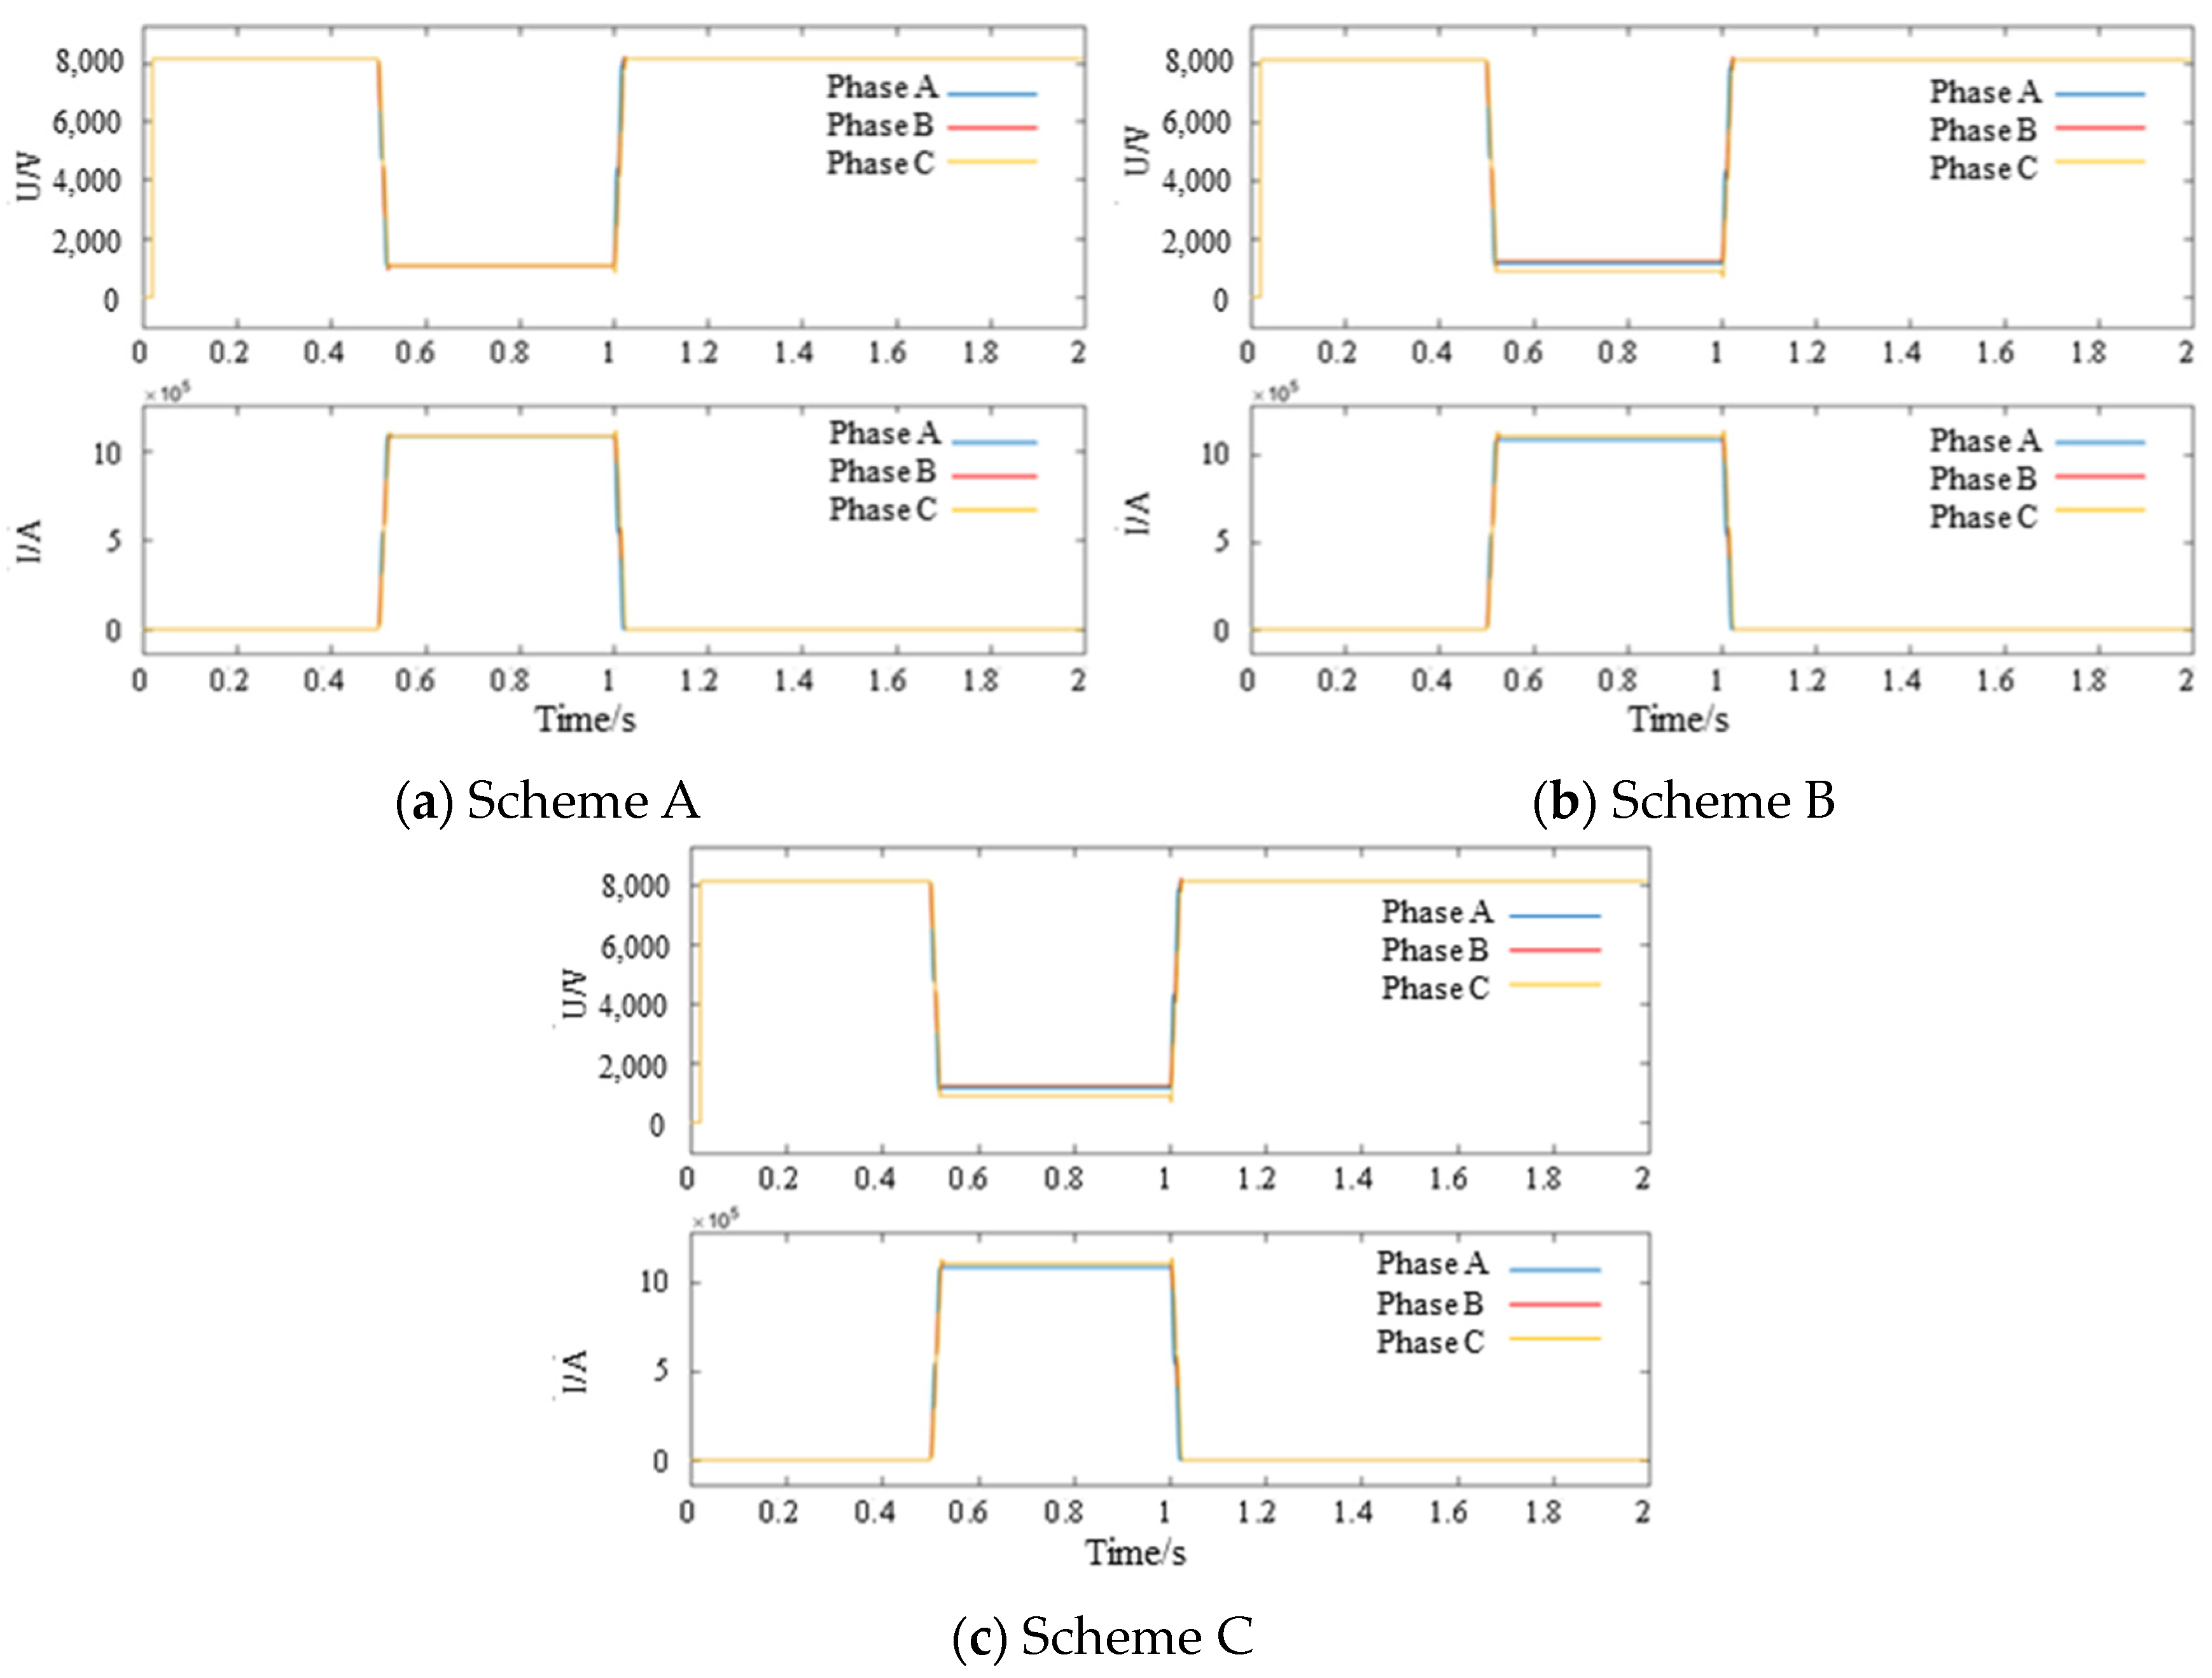
As the most serious fault type in the distribution network, it is of great value to simulate the three-phase short-circuit fault. As shown in Figure 17, the normal operating voltage of the fault location is 8.15 kV and the normal operating current is 0. At the beginning of the three-phase short-circuit fault, the three-phase voltage drops to 1.08 kV and the three-phase current suddenly changes to 1.08 MA. After the end of the short-circuit fault, the point undergoes a short transient process and returns to normal operation.
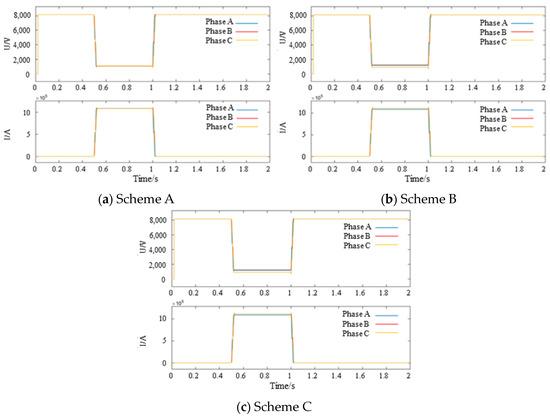
Figure 17.
Three-phase voltage and current peaks at the fault location in the three-phase short-circuit simulation scenario.
Since Scheme A uses a small-step simulation for all nodes, the simulation accuracy is the highest; hence, the actual value of the simulation result is approximated as the theoretical value of the system operation. Comparing Scheme B with Scheme A and Scheme C with Scheme A, the simulation error percentages of Schemes B and C are obtained, as shown in Table 10. It can be seen that the multi-rate parallel simulation technology can improve the simulation speed on the basis of ensuring simulation accuracy, and the simulation error can be controlled within 1%.

Table 10.
Three-phase short-circuit fault simulation error.
6. Conclusions
Aiming at the efficiency improvement of the transient simulation of the large-scale ADN, a multi-rate parallel simulation method based on partition decoupling is proposed and verified with some examples. The main conclusions are as follows:
- (1)
- The transient response characteristics of fast, medium, and slow dynamic equipment components in the ADN are very different. Through multi-time-scale modeling and time constant grouping, the regions with different transient variation characteristics in the distribution network can be partitioned.
- (2)
- The ADN has a wide range of nodes and the source–grid–load–storage is tightly coupled. Through the short-line decoupling method based on the characteristic line, the decomposition and coordination between multiple regions of the distribution network can be realized so as to carry out parallel simulation.
- (3)
- The multi-rate parallel simulation of the ADN can not only effectively use the redundancy of simulation computing resources, realize parallel simulation calculation, and improve the simulation speed but also select small-step simulations in fast dynamic regions and large-step simulations in slow dynamic regions according to the fast, medium, and slow response characteristics between different partitions. A multi-rate hybrid coordinated simulation is carried out to further accelerate the simulation. The verification results of the example show that using adaptive variable-step-size multi-rate parallel simulation technology can increase the subnet computation-time balance rate and simulation acceleration ratio to 119.90% and 121.31% in the same rate-parallel mode.
- (4)
- The transient simulation is an effective means to describe the dynamic characteristics of the ADN. However, the transient simulation is greatly affected by the scale of the distribution network and the complexity of the model. The fast simulation method based on decomposition and coordination is the key to solving the problems of the slow speed and low efficiency of the transient simulation.
- (5)
- The simulation duration of the one-core simulation (i.e., the serial simulation) is 14,949.79 s, while the simulation duration of the multi-core simulation (i.e., the parallel simulation) is from 149.75 s to 155.83, which means that the parallel simulation can save about 90% of the simulation duration.
Author Contributions
Conceptualization, K.L.; methodology, K.L.; supervision, X.Y.; writing—original draft, K.L.; formal analysis, Z.L. and D.J.; validation, K.L. and X.Y.; investigation, Z.L.; writing—review and editing, T.K.; data curation, X.Y. and T.K.; software, X.Y.; experiments, K.L., X.Y. and D.J. All authors have read and agreed to the published version of the manuscript.
Funding
This research was funded by the Beijing Municipal Natural Science Foundation (“Fusion Simulation Technology Research towards Urban Energy Internet”, grant number 3212038).
Data Availability Statement
The data presented in this study are available on request from the corresponding author. The data are not publicly available due to the data being confidential.
Conflicts of Interest
We declare that we have no known competing financial interests or personal relationships that could have appeared to influence the work reported in this paper.
References
- Alboaouh, K.A.; Mohagheghi, S. Impact of rooftop photovoltaics on the distribution system. J. Renew. Energy 2020, 2020, 4831434. [Google Scholar] [CrossRef]
- Sheng, W.; Liu, K.Y.; Cheng, S.; Meng, X.; Dai, W. A Trust Region SQP Method for Coordinated Voltage Control in Smart Distribution Grid. IEEE Trans. Smart Grid 2016, 7, 381–391. [Google Scholar] [CrossRef]
- Azmi, K.H.M.; Radzi, N.A.M.; Azhar, N.A.; Samidi, F.S.; Zulkifli, I.T.; Zainal, A.M. Active Electric Distribution Network: Applications, Challenges, and Opportunities. IEEE Access 2022, 10, 134655–134689. [Google Scholar] [CrossRef]
- Eissa, M.M. New protection principle for smart grid with renewable energy sources integration using WiMAX centralized scheduling technology. Electr. Power Energy Syst. 2018, 97, 372–384. [Google Scholar] [CrossRef]
- Dutta, R.; Chakrabarti, S.; Sharma, A. Topology Tracking for Active Distribution Networks. IEEE Trans. Power Syst. 2021, 36, 2855–2865. [Google Scholar] [CrossRef]
- Sheng, W.; Liu, K.; Li, Z.; Ye, X. Collaborative Fault Recovery and Network Reconstruction Method for Cyber-physical-systems Based on Double Layer Optimization. CSEE J. Power Energy Syst. 2023, 9, 380–392. [Google Scholar]
- Cavraro, G.; Kekatos, V.; Veeramachaneni, S. Voltage analytics for power distribution network topology verification. IEEE Trans. Smart Grid 2019, 10, 1058–1067. [Google Scholar] [CrossRef]
- Yuan, H.; Li, F.; Wei, Y.; Zhu, J. Novel Linearized Power Flow and Linearized OPF Models for Active Distribution Networks with Application in Distribution LMP. IEEE Trans. Smart Grid 2018, 9, 438–448. [Google Scholar] [CrossRef]
- Verma, R.; Padhy, N.P. Optimal Power Flow Based DR in Active Distribution Network with Reactive Power Control. IEEE Syst. J. 2022, 16, 3522–3530. [Google Scholar] [CrossRef]
- Mitrentsis, G.; Lens, H. A Dynamic Active Distribution Network Equivalent for Enhancing the Generalization Capability of the Exponential Recovery Model in Stability Studies. IEEE Trans. Power Syst. 2021, 36, 2709–2712. [Google Scholar] [CrossRef]
- Sekhavatmanesh, H.; Rodrigues, J.; Moreira, C.L.; Lopes, J.A.P.; Cherkaoui, R. Optimal Load Restoration in Active Distribution Networks Complying with Starting Transients of Induction Motors. IEEE Trans. Smart Grid 2020, 11, 3957–3969. [Google Scholar] [CrossRef]
- Chaspierre, G.; Denis, G.; Panciatici, P.; Van Cutsem, T. An active distribution network equivalent derived from large-disturbance simulations with uncertainty. IEEE Trans. Smart Grid 2020, 11, 4749–4759. [Google Scholar] [CrossRef]
- Kontis, E.O.; Papadopoulos, T.A.; Chrysochos, A.I. On the Applicability of Exponential Recovery Models for the Simulation of Active Distribution Networks. IEEE Trans. Power Del. 2018, 33, 3220–3222. [Google Scholar] [CrossRef]
- Huang, Q.; Vittal, V. Advanced EMT and Phasor-Domain Hybrid Simulation with Simulation Mode Switching Capability for Transmission and Distribution Systems. IEEE Trans. Power Syst. 2018, 33, 6298–6308. [Google Scholar] [CrossRef]
- Chiniforoosh, S.; Jatskevich, J.; Yazdani, A.; Sood, V.; Dinavahi, V.; Martinez, J.A.; Ramirez, A. Definitions and Applications of Dynamic Average Models for Analysis of Power Systems. IEEE Trans. Power Del. 2010, 25, 2655–2669. [Google Scholar] [CrossRef]
- Daryabak, M.; Filizadeh, S.; Jatskevich, J.; Davoudi, A.; Saeedifard, M.; Sood, V.K.; Martinez, J.A.; Aliprantis, D.; Cano, J.; Mehrizi-Sani, A. Modeling of LCC-HVDC Systems Using Dynamic Phasors. IEEE Trans. Power Del. 2014, 29, 1989–1998. [Google Scholar] [CrossRef]
- Rimorov, D.; Huang, J.; Mugombozi, C.F.; Roudier, T.; Kamwa, I. Power Coupling for Transient Stability and Electromagnetic Transient Collaborative Simulation of Power Grids. IEEE Trans. Power Syst. 2021, 36, 5175–5184. [Google Scholar] [CrossRef]
- Li, C.; Wu, Y.; Zhang, H.; Ye, H.; Liu, Y.; Liu, Y. STEPS: A Portable Dynamic Simulation Toolkit for Electrical Power System Studies. IEEE Trans. Power Syst. 2021, 36, 3216–3226. [Google Scholar] [CrossRef]
- De Carne, G.; Lauss, G.; Syed, M.H.; Monti, A.; Benigni, A.; Karrari, S.; Kotsampopoulos, P.; Faruque, M.O. On Modeling Depths of Power Electronic Circuits for Real-Time Simulation—A Comparative Analysis for Power Systems. IEEE Open Access J. Power Energy 2022, 9, 76–87. [Google Scholar] [CrossRef]
- Lauss, G.; Strunz, K. Accurate and Stable Hardware-in-the-Loop (HIL) Real-Time Simulation of Integrated Power Electronics and Power Systems. IEEE Trans. Power Electron. 2021, 36, 10920–10932. [Google Scholar] [CrossRef]
Disclaimer/Publisher’s Note: The statements, opinions and data contained in all publications are solely those of the individual author(s) and contributor(s) and not of MDPI and/or the editor(s). MDPI and/or the editor(s) disclaim responsibility for any injury to people or property resulting from any ideas, methods, instructions or products referred to in the content. |
© 2024 by the authors. Licensee MDPI, Basel, Switzerland. This article is an open access article distributed under the terms and conditions of the Creative Commons Attribution (CC BY) license (https://creativecommons.org/licenses/by/4.0/).


