Abstract
The integration of renewable energy sources and distributed energy storage systems increasingly complicates the operation of distribution networks, while stringent carbon reduction targets demand low-carbon operational strategies. To address these complexities, this paper introduces a two-stage model for reconfiguring distribution networks and ensuring low-carbon dispatch. Initially, second-order cone programming is employed to minimize losses in the network. Subsequently, the outputs of renewable energy and energy storage systems are optimized using the mantis search algorithm (MSA) to achieve low-carbon dispatch, with the network’s carbon potential as the evaluation metric. The proposed model demonstrates a significant reduction in average active power loss by 34.85%, a decrease in daily carbon emissions by 509.97 kg, and a reduction in carbon emission costs by 17.24%, thereby markedly enhancing the economic and social benefits of grid operations.
1. Introduction
Distribution network reconfiguration (DNR) is essential for optimizing the topology of distribution systems, enhancing operational reliability, and improving economic efficiency [1]. With the increasing penetration of renewable energy sources [2,3] and the integration of electric vehicles and energy storage systems (ESS) in China’s distribution networks [4], the operational environment has become more complex. Advanced DNR strategies are imperative to leverage the dynamic regulation capabilities of ESS, thereby mitigating the impact of renewable energy fluctuations and enhancing the system’s efficiency, reliability, and economic performance [5]. In the pursuit of low-carbon operations, it is crucial to coordinate and optimize the production, distribution, and storage of electric energy within the distribution network, a significant carbon emitter. This approach facilitates the integration of renewable energy and maximizes the carbon reduction potential across all segments of the power system—generation, grid, load, and storage—yielding substantial economic and social benefits through low-carbon operations [6].
DNR is a non-convex optimization challenge that seeks to identify the optimal line topology to enhance system performance under distribution network constraints [7]. Commonly employed solution methods include heuristic and mathematical optimization algorithms. The study in [8] demonstrated that representing continuous parent–child relationship variables in spanning tree constraints as disjunctive variables can effectively form the disjunctive convex hull of DistFlow equations, providing tighter relaxation bounds compared to traditional techniques like Big-M and McCormick linearization. This improved relaxation enhances the computational efficiency of DNR models. In [9], a scenario-based stochastic mixed-integer second-order cone programming model incorporating short-circuit constraints was proposed to optimally reconfigure distribution systems with renewable energy sources while managing grid fault current levels. In the scheme in [10], a loop-based encoding and decoding algorithm, integrated with a two-stage genetic algorithm, was developed to strategically select switches that meet radial structure requirements, thereby reducing the DNR search space. To address the computational complexities arising from stochastic fluctuations in load and distributed generation [11], nodal sensitivity models and stochastic power flow methods were employed to manage power variations effectively [12]. An iterative bi-level scheduling method for stochastic distribution networks was also introduced [13], utilizing prediction errors and coupled information to establish a joint probability distribution that quantifies the uncertainty risks of active and reactive power from distributed renewable energy, thereby reducing operational losses and improving peak shaving and valley-filling performance.
To address the low carbon emissions, previous studies have proposed several innovative methods. One study introduced a distribution system planning approach that incorporates specific emission reduction targets into the objective function using the outer point method. This approach also includes a spatiotemporal carbon response model based on adjustable loads and mobile energy storage systems to further reduce emissions without altering the existing system framework [14]. Another study considered the spatiotemporal characteristics of carbon emission intensity and photovoltaic integration capacity, utilizing time-of-use pricing as a decision variable to optimize the dispatch of the distribution network, thereby minimizing costs and carbon emissions [15]. Additionally, a balanced configuration strategy for electric vehicle (EV) charging stations based on vehicle-to-grid (V2G) technology was proposed [16] to enhance grid resilience and promote decarbonization, determining the optimal number and locations of EV charging stations within investment constraints. In [17], a low-carbon economic dispatch model for active distribution networks was developed, addressing the low reliability caused by dual uncertainties on the source and load sides. This model incorporates a tiered carbon emission trading mechanism and considers uncertainties, achieving a synergy between economic and environmental benefits. The experimental results demonstrate the effectiveness of these approaches in reducing dispatch costs and emissions while enhancing system reliability and resilience.
The aforementioned studies have made significant advancements in both distribution network reconfiguration and low-carbon operation. However, research combining these two aspects is relatively scarce. Due to the time lag between the formulation of reconfiguration strategies and real-time grid operations, reconfiguration strategies based on power forecasts may not fully adapt to actual grid conditions [18]. Real-time dispatch optimization can partially mitigate this issue. Moreover, many studies on low-carbon operation of distribution networks treat carbon reduction as an auxiliary objective in optimal dispatch. Further research is needed to address the carbon reduction in distribution networks more comprehensively and to achieve more efficient and sustainable low-carbon grid operations.
To tackle these challenges, we introduce a two-stage optimization model for DNR and low-carbon dispatch, with a focus on carbon flows, under high penetration of renewable energy. The model aims to optimize the topology to reduce operational losses. By focusing on carbon flows as the optimization target, the model further achieves loss reduction and low-carbon operation in the distribution network. The main works and innovations of this study are as follows:
- (a)
- The low-carbon operation and dispatch of active distribution networks were analyzed from a novel perspective, focusing on distribution network carbon potential and carbon flow.
- (b)
- A two-stage model for DNR and low-carbon dispatch was proposed. The paper analyzed the changes in energy storage strategies, system operational losses, and grid carbon potential under different dispatch strategies.
2. Materials and Methods
2.1. Second-Order Cone Optimization Model for DNR
- (a)
- Objective function
Distribution network reconfiguration is performed based on the forecasted output of renewable energy units. Due to the inherent uncertainties in the predictions [19,20], this stage does not impose limits on the output power of distributed energy resources, nor does it consider the regulation effects of energy storage systems. The evaluation metrics are limited to the total losses of the system and the operational costs of the circuit breakers. The objective function could be defined as [21,22]:
where represent the line current; represent the line resistance; and represent the costs associated with network losses and switch operations, respectively [23]; denotes the set of lines; and indicates the status of the line (0 for open and 1 for closed).
- (b)
- Condition binding
The Distflow power flow model [24] is used in this study, and the power flow equations are relaxed through within this model:
where denotes the node voltage; indicates the active power transmitted by the line; and , , and represent the output power of the wind turbine, photovoltaic system, and load connected to node , respectively. denotes the set of parent nodes of node , and denotes the set of child nodes of node j.
The aforementioned equations cannot be directly utilized in the optimizer and require the introduction of new variables and inequality constraints (Equation (6)) to further relax the Distflow power flow equations.
Ultimately, the power flow equations suitable for second-order cone optimization are obtained as follows:
where M means a sufficiently large positive number and denotes the 2-norm.
The radial constraints are implemented using virtual power flow:
where F represents the virtual power of the branches and A denotes the set of power sources.
Thus, the complete mathematical formulation of the DNR can be derived. It consists of Equations (1), (7) and (8).
2.2. Low-Carbon Scheduling Optimization Model
- (a)
- Objective function
The objective of this stage is to lower carbon emissions within the distribution network, minimize the curtailment rates of wind and solar power, and reduce the system’s active power losses to the greatest extent possible. Typically, a factor can be set during the optimization process to control the (). To ensure minimal curtailment of wind and solar power, the following equation can be used:
where represents the curtailment rate of wind and solar power and denotes the peak power of the wind turbine and photovoltaic system at time t.
However, when calculating the grid’s carbon potential, the is already considered. There is a positive correlation between the output of these units and carbon reduction. Specifically, higher output from renewable energy units results in lower carbon potential at their connection nodes. Therefore, the objective function for this stage can be defined accordingly:
where N represents the number of nodes, T denotes the time, and E represents the carbon potential of the nodes.
- (b)
- Condition binding
Similarly to power flow calculations, the core of carbon emission flow calculations in power systems lies in quantitatively determining the flow state of carbon emissions through the distribution of power flows to identify the sources and paths of carbon emissions. The connection and distinction between the two are that carbon emission flows depend on the existence of power flows, and factors that influence the distribution of power flows also impact the distribution of carbon emission flows. However, carbon emission flows are also related to the emission characteristics of generation units, exhibiting unique flow characteristics. Therefore, carbon emission flows are constrained not only by power flow distribution, but also by other parameters and boundary conditions beyond power flow calculations.
In [25], a detailed calculation process is provided, but some modifications are needed to apply it to distribution networks with energy storage and distributed generation [26]. For example, in a 33-node distribution network, the branch power flow distribution matrix is defined and can serve as the boundary condition for carbon flow distribution:
The matrix is defined as the generation injection distribution matrix. However, in the distribution network, the power delivered by energy storage systems should also be considered as generation. Assuming node 1 is connected to the main grid, node 2 represents photovoltaic generation, and node 3 represents energy storage, the matrix could be defined as:
Using Equations (11) and (12), the active power flow matrix for the nodes can be calculated.
The carbon emission intensity of the generators in the system can be expressed as:
It should be noted that, for renewable energy units, the carbon potential can be defined as 0. For ESS, it can be defined as:
where represents the charging power, represents the stored energy, and denotes the carbon potential at the location where the ESS is accessed.
At this point, the system’s carbon potential can be calculated:
In addition to carbon flow constraints, the dispatch model should also include constraints such as renewable energy output [27] and energy storage. The renewable energy output constraint can be controlled by the factor in Equation (9), where . The ESS constraints are more complex [28], comprising charging and discharging states, storage capacity, and charging/discharging power. Specifically, the charging and discharging states can only be maintained in one mode at any given period, as shown here:
At time , the power of the ESS can be expressed as:
Meanwhile, the stored energy of the ESS can be expressed by the following equation:
In Equations (18)–(20), and are binary variables, represents the peak power of the ESS, denotes the charging efficiency, and denotes the discharging efficiency.
2.3. The Mantis Search Algorithm
MSA is an innovative bio-inspired optimization technique modeled after the unique predatory behavior and sexual cannibalism of mantises, where females often consume males during mating [29]. The algorithm consists of three primary stages: exploration, exploitation, and sexual cannibalism. In the exploration stage, MSA mimics the mantis’s prey-searching behavior by employing camouflage and ambush strategies to thoroughly scan and explore the search space. This process can be modeled as:
where represents the position of the ith mantis at the tth iteration, denotes the Hadamard product of two vectors, is a numerical vector generated according to the Lévy flight strategy, is a random number generated from a normal distribution, and r denotes a random number. , , and are solutions randomly selected from the current population, and all three are distinct from each other.
In the exploitation stage, the algorithm simulates the behavior of mantises capturing prey, using strike velocity and gravitational acceleration to precisely capture the optimal solution. This includes both successful and unsuccessful predation scenarios, and can be mathematically expressed as follows:
where j is the dimension of the solution vector , is the strike velocity, and is the strike distance.
The sexual cannibalism stage simulates the process where female mantises attract males for mating and subsequently consume them. This stage enhances the algorithm’s search capability and its performance in solving complex optimization problems. The calculation formula can be expressed as:
The MSA algorithm is easy to implement and can maintain population diversity during the optimization process. It has a strong ability to escape local optima and performs excellently in balancing exploration and exploitation.
3. The Framework of the Proposed Two-Stage Mode
Based on these principles, this paper introduces a two-stage model for DNR and low-carbon dispatch, taking carbon flows into account. As illustrated in Figure 1, the model begins with reconfiguring the distribution network using the predicted output of renewable energy units to establish the network topology for the following day. The network topology is then updated according to this reconfiguration plan. Subsequently, the operation state of ESS and the output power of renewable energy units are utilized as control measures. The MSA is employed to achieve optimal low-carbon dispatch, determining the optimal hourly operational states of the control measures.
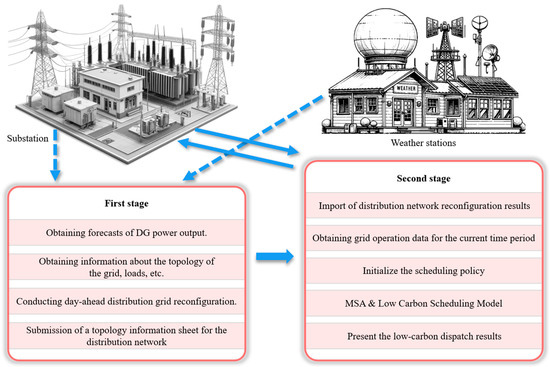
Figure 1.
The framework of the proposed two-stage mode.
4. Parameter Settings
The effectiveness of the proposed algorithm was validated using the IEEE 33-bus distribution network system, as shown in Figure 2. The system operates at a base voltage of 12.66 kV, with node 1 serving as the slack node. The load data are based on the original load configuration of the standard IEEE 33-bus model. To incorporate renewable energy sources, photovoltaic (PV) systems are integrated at nodes 18 and 22, while wind turbines (WT) are installed at nodes 12 and 25. All renewable units are grid-connected and operate at a constant power factor. Additionally, an energy storage system (ESS) is placed at node 20 to further enhance the system’s flexibility and stability.
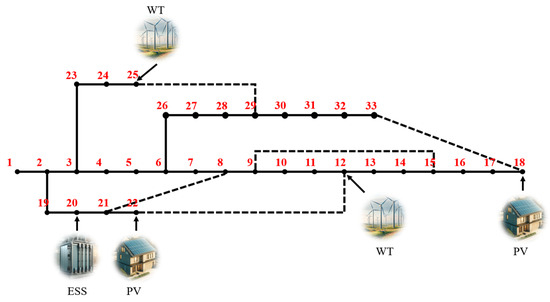
Figure 2.
An improved IEEE 33-bus distribution system.
The installation capacities of the PV systems and WT are determined by the set proportion of renewable energy output (peak power of the distribution network × renewable energy penetration rate), and the capacity of the ESS is 1.8 MW. Meanwhile, the system load is shown in Figure 3.
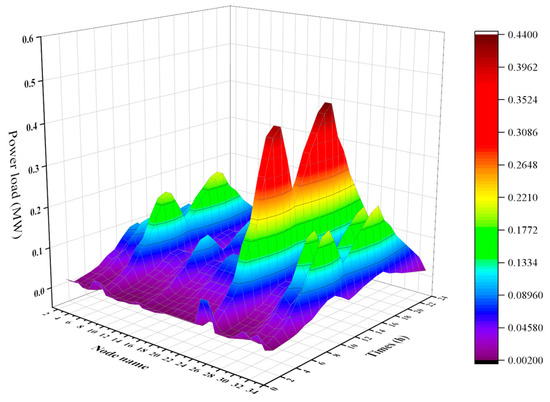
Figure 3.
Distribution network load curve.
5. Results and Discussion
5.1. DNR Results
In this section, we set the penetration rate at 30%. Referring to relevant literature on the forecasted output of photovoltaic and wind power [30,31], the output data of PV (or WT) in the system were obtained, as shown in Figure 4.
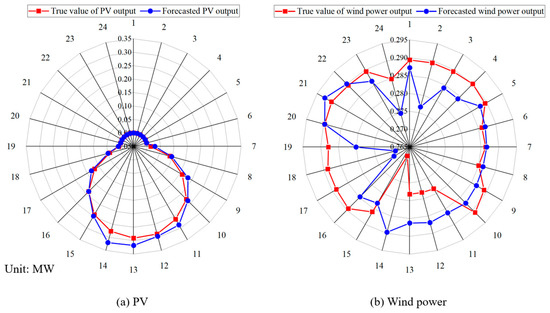
Figure 4.
Photovoltaic and wind turbine power data.
Then, the DNR was performed based on the load data and the forecasted renewable energy output powers presented in Figure 4. In this stage, our goal was to determine the optimal combination of circuit breaker operations at different time periods. Using the objective function provided in Equation (1) and employing YALMIP and CPLEX to solve the first-stage model, the optimal line combinations over a 24 h period were obtained, as shown in Figure 5, which presents the statistical results of line status changes in the system, with all other lines remaining closed by default (except tie lines).
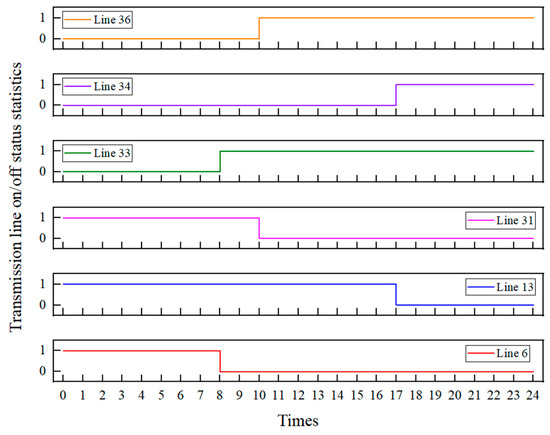
Figure 5.
Collection of changes in the operation status of the line.
We analyzed the losses of the system under both the original and reconfigured topologies, as shown in Figure 6. As shown in Figure 6, reconfiguration significantly reduced the losses during the operation of the system. The average loss of the system decreased from 0.0478 MW to 0.0311 MW, a reduction of 34.85%. In terms of absolute reduction, the effect of reconfiguration was particularly evident during periods of high renewable energy output. During the time intervals from 8 to 20 h, the reduction in active power loss exceeded 0.01 MW for each interval, with the maximum reduction of 0.0522 MW occurring at the 17th hour.
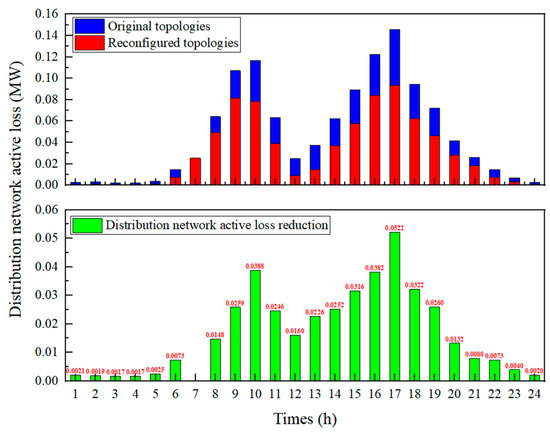
Figure 6.
Active Loss Statistics in Original and Reconfigured Topologies of Distribution Networks.
Additionally, the operating costs of the distribution network, derived from Equation (1), are shown in Table 1. It can be seen that, despite considering the operational costs of the circuit breakers, the overall operating costs of the distribution network decreased by 32.26% due to the significant reduction in active power losses. This indicates that reconfiguring the distribution network can significantly enhance the economic efficiency of the system, validating the effectiveness of the first-stage model.

Table 1.
Distribution network operating costs statistics.
5.2. Low-Carbon Dispatch Operation Results for Distribution Networks
In the second stage, the study employed the MSA for optimization-based scheduling of the output from ESS and renewable energy units to achieve the goal of low-carbon operation of the distribution network. Additionally, the study used a loss reduction objective as a comparative algorithm. Based on these two optimization objectives, the operational states of the ESS and the active power loss results were obtained, as shown in Figure 7 and Figure 8.
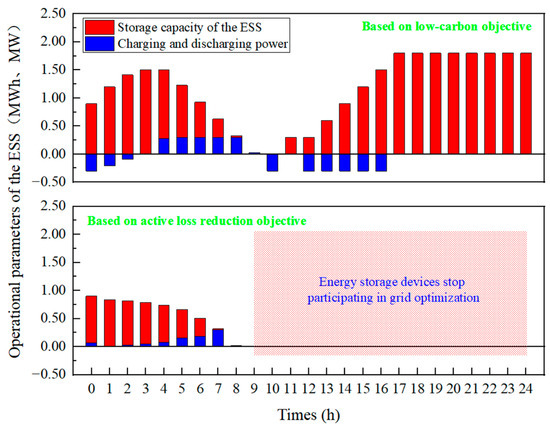
Figure 7.
Collection of changes in the operation status of the line.
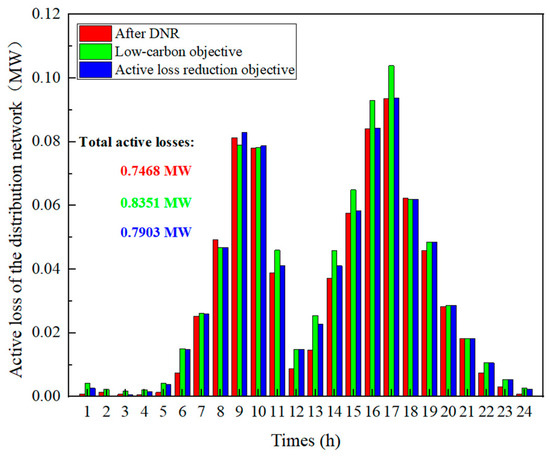
Figure 8.
The loss of the system under three strategies.
As shown in Figure 7, the operational strategy of the energy storage system varied depending on the optimization objective. Under the low-carbon dispatch, the energy storage units were engaged in system regulation throughout almost the entire period to reduce the grid’s carbon potential. However, under the loss reduction dispatch, the operation of energy storage was similar to the low-carbon dispatch from 0 to 8 h, but from 9 h onwards, the energy storage no longer participated in power flow adjustment.
The results shown in Figure 8 indicate that, due to the discrepancies between the forecasted and actual outputs of the renewable energy units, the total active power loss in the second stage was slightly higher than the reconfigured active power loss (an increase of 11.82%). Compared to the low-carbon model, the active power loss under the loss reduction model was lower (a decrease of 5.36%).
The distribution network’s carbon potential under the two optimization schemes is shown in Figure 9.
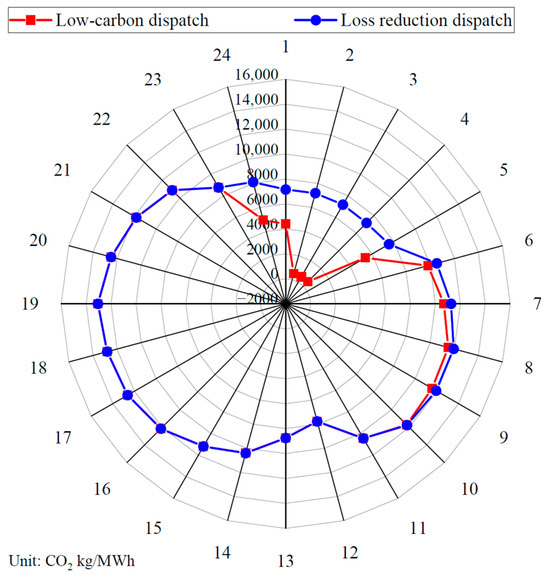
Figure 9.
Distribution grid carbon potential statistics.
As shown in Figure 9, adopting low-carbon dispatch can effectively reduce the carbon potential at system nodes (especially during nighttime), thereby decreasing the system’s carbon emissions. Meanwhile, the carbon emissions and the associated costs of the distribution network can be calculated, as illustrated in Figure 10.
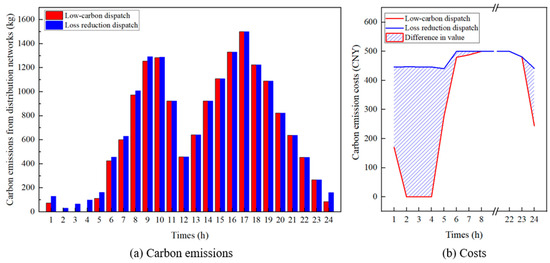
Figure 10.
Calculation results of carbon emissions reduction.
As shown in Figure 10, reducing the carbon potential at distribution network nodes can effectively decrease carbon emissions. Under the two different dispatch modes, the low-carbon dispatch method can reduce carbon emissions by 509.97 kg/day. The cost of carbon emissions is reduced from 11,600 CNY/day under the loss reduction dispatch mode by 17.24% to 9600 CNY/day, demonstrating significant economic and social benefits.
Additionally, the curtailed wind and solar power under the two optimization dispatch strategies are shown in Figure 11. It can be observed that the grid exhibits different curtailment results between 0:00–4:00 and at 24:00 under the two different strategies. Under the low-carbon dispatch mode, the total curtailed PV and WT power is 0.10 MWh, whereas, under the loss reduction dispatch mode, the total curtailed wind and solar power reaches 0.92 MWh. This indicates that the introduced optimization model can reduce the waste of renewable energy effectively. These calculation results demonstrate the effectiveness and practicality of the proposed optimization model and further verify its ability to enhance the low-carbon operation of the grid.
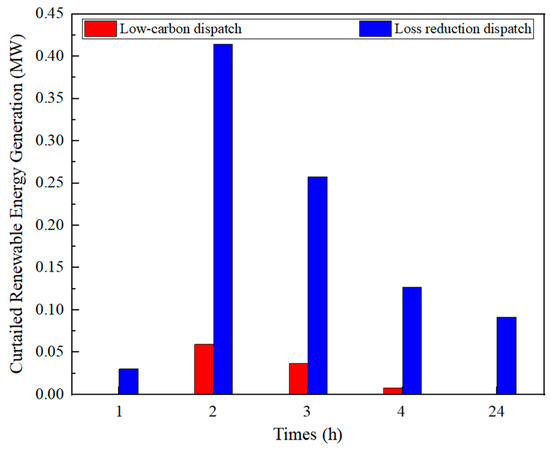
Figure 11.
Statistical results of renewable energy generation abatement.
5.3. Impact of New Energy Penetration on Modeling Strategies
To further analyze the impact of different renewable energy penetration rates on the operation of the distribution network, the proposed two-stage model was calculated and analyzed at penetration rates of 10%, 30% (Section 5.1 and Section 5.2), 50%, and 70%.
The changes in active power loss under these four penetration rates are shown in Figure 12. It can be observed that as the penetration rate increases, the total active power loss of the system initially decreases and then increases under the original operating conditions. Although Section 5.2 indicates that the active power loss in the second stage is greater than the reconfigured active power loss, there is a significant decreasing trend in the system’s active power loss compared to the original network operating state. Among these, the loss reduction effect is most pronounced at a 70% penetration rate, achieving a reduction of 49.81%.
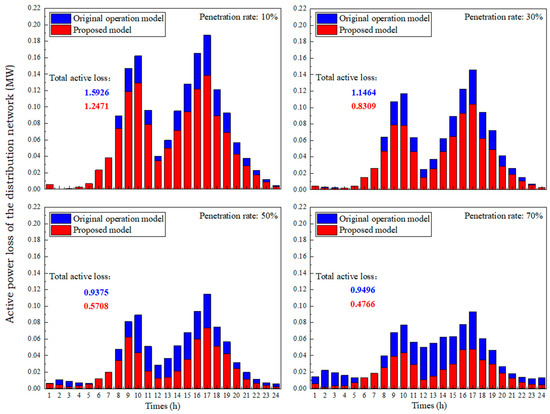
Figure 12.
Comparison results of active losses in distribution networks with different renewable energy penetration rates.
The trends in the energy storage device’s charge under the four penetration rates are shown in Figure 13. It can be observed that, under different penetration rates, the charging and discharging patterns of the ESS are generally consistent (charge → discharge → charge). However, as the penetration rate increases, the frequency of ESS participation in grid regulation increases under the proposed low-carbon dispatch scheme. Specifically, at a 10% penetration rate, the energy storage device is fully charged by 13:00 and stops participating in regulation, whereas at a 70% penetration rate, the energy storage device is not fully charged even by 24:00. This result also indicates that, under this dispatch scheme, the optimal strategy for grid operation is to maximize the use of the output power from renewable energy units rather than storing clean energy.
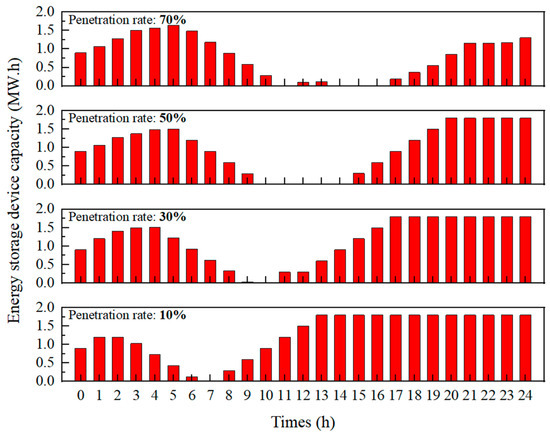
Figure 13.
Operational status of energy storage units at different penetration rates.
The total carbon emissions of the system under the four penetration rates are shown in Figure 14. It can be observed that, as the penetration rate of renewable energy increases, the total carbon emissions of the distribution network show a decreasing trend.
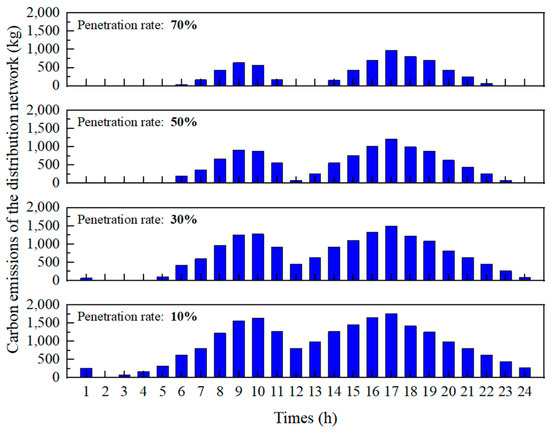
Figure 14.
Carbon emissions of distribution networks under different penetration rates.
5.4. Comparison Results of Optimized Models
To validate the computational performance of the proposed optimization model, the paper uses genetic algorithm (GA) and particle swarm optimization (PSO) for comparison [32,33]. The population size for all three optimization algorithms is set to 50, with a maximum of 100 iterations. Using the optimization dispatch calculation at time 0 as an example, the convergence curves of the fitness values for the three algorithms are shown in Figure 15.
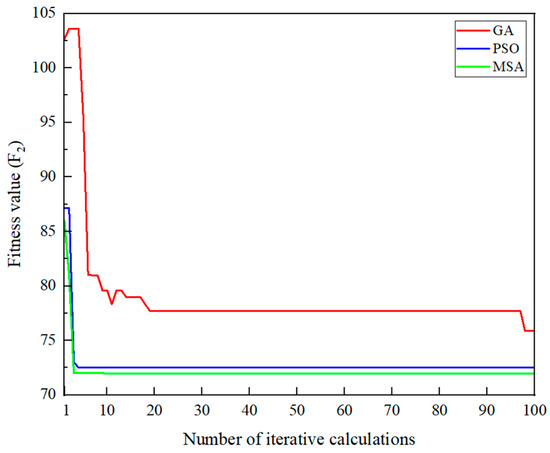
Figure 15.
Fitness value convergence curves.
As shown in Figure 15, the MSA optimization algorithm exhibits faster convergence and achieves the lowest fitness value among the three algorithms. This indicates its superior optimization capability and validates the effectiveness of using this algorithm for low-carbon dispatch in the study. The daily total carbon emissions, average carbon potential of the system, and operating costs of the distribution network for the three optimization algorithms are summarized in Table 2.

Table 2.
Comparison of the results of the three optimization algorithms.
It can be seen that using the MSA algorithm for the second stage of grid dispatch optimization results in better carbon reduction effects, lower carbon potential of the grid, and more economical operating costs. This demonstrates the rationality and effectiveness of the MSA optimization algorithm selected in this study.
5.5. Model Checking in Multiple Scenarios
To further validate the broad applicability of the two-stage scheduling model proposed in this paper, we employed the Monte Carlo simulation method to generate load-side scenarios. From the 1000 scenarios generated, we reduced them to 4 representative scenarios, as illustrated in Figure 16.
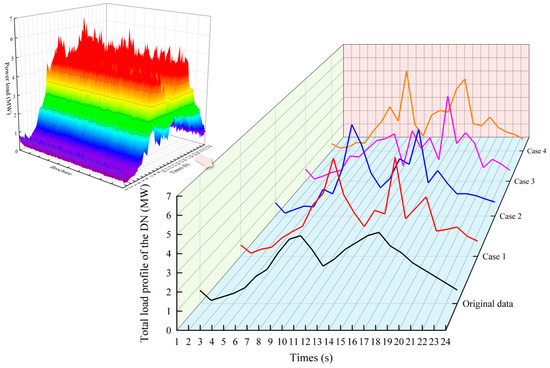
Figure 16.
Trends in total distribution network load generated by the Monte Carlo method.
Based on the load-side scenario generation results shown in Figure 16, we performed optimal scheduling under four representative scenarios in the distribution network, assuming a renewable energy penetration rate of 30%. The corresponding results are illustrated in Figure 17, which highlights the impacts of different dispatch strategies—namely, low-carbon dispatch and loss reduction dispatch—on the carbon emissions of the distribution network under varying load conditions. Across all four scenarios (Case 1 to Case 4), the carbon emissions achieved by the low-carbon dispatch strategy were consistently lower or comparable to those of the loss reduction strategy during most time intervals. This demonstrates the effectiveness of the low-carbon dispatch strategy in minimizing carbon emissions under diverse load variations, thereby emphasizing its advantage in promoting low-carbon grid operations while maintaining system stability.
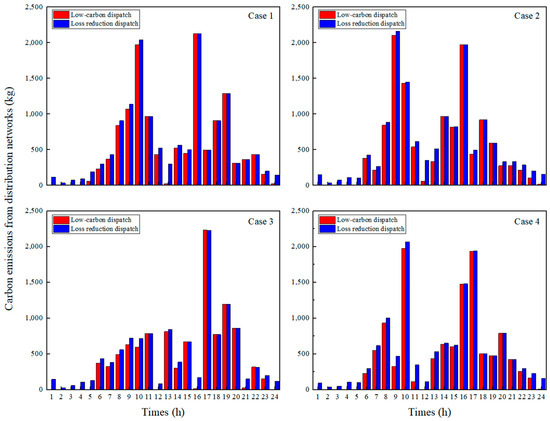
Figure 17.
24 h carbon emission statistics of the distribution network under four scenarios.
The quantitative analysis in Table 3 demonstrates that the proposed low-carbon dispatch strategy achieves significant carbon emission reductions across four representative load scenarios compared to the conventional loss reduction dispatch strategy. Specifically, in Case 1, the low-carbon dispatch reduced carbon emissions by 1426.50 kg, representing a decrease of approximately 9.85%. For Case 2, the reduction was 1707.14 kg (12.00%), while in Case 3 and Case 4, the emissions were lowered by 1506.00 kg (12.47%) and 1580.48 kg (11.78%), respectively. These results highlight the superior effectiveness of the low-carbon dispatch strategy in minimizing emissions across diverse load conditions while maintaining overall system stability.

Table 3.
Analysis of total carbon emissions from distribution networks under four scenarios (kg).
This analysis further underscores the broad applicability and robustness of the proposed model. The low-carbon dispatch strategy consistently achieves substantial emission reductions, even under complex and highly variable load conditions, demonstrating its adaptability to dynamic grid environments. Moreover, it effectively suppresses peak carbon emissions during high-demand periods, thereby avoiding the emission spikes typically caused by the frequent cycling of conventional generation units. Although the primary focus of this study is on reducing carbon emissions, the proposed model also supports optimal scheduling of renewable energy and energy storage systems, enhancing both economic and environmental performance of the power grid. Thus, the proposed strategy provides a comprehensive solution for achieving more efficient, low-carbon, and sustainable distribution network operations.
6. Conclusions
The paper examines the negative effects of fluctuations in distributed power output on the operation of distribution networks and aims to enhance the low-carbon operational capability of distribution networks. From the perspective of carbon flow distribution in the network, a two-stage model for active distribution network reconfiguration and low-carbon dispatch is proposed and analyzed through simulations. The main conclusions are as follows:
- (a)
- Considering the output of renewable energy units, performing reasonable day-ahead reconfiguration of the distribution network can significantly reduce active power losses during operation (by 34.85%).
- (b)
- Prediction errors in the output of distributed power can affect the optimization results of the reconfiguration. Real-time control of power flows in the grid is needed to enhance the economic efficiency and flexibility of grid operations.
- (c)
- As the penetration rate increases, the participation of energy storage units in grid regulation becomes more frequent under the proposed low-carbon dispatch scheme. The optimal strategy for grid operation is to maximize the use of renewable energy unit output.
- (d)
- The proposed model has a positive effect on reducing active power losses in the distribution network. Moreover, by optimizing carbon emissions (carbon flow) in the distribution network as the dispatch objective, the model significantly enhances the low-carbon operational capability of the grid. Compared to targeting only active power loss reduction, it can reduce carbon emissions by 509.97 kg/day and improve the absorption capacity of renewable energy generation in the distribution network.
Author Contributions
T.J.: conceptualization, methodology, software. G.Y.: writing—review and editing. L.Y.: resources, investigation. All authors have read and agreed to the published version of the manuscript.
Funding
This work is supported by a grant from National Science Fund for Distinguished Young Scholars [No. 51507134].
Data Availability Statement
The raw data supporting the conclusions of this article will be made available by the authors on request.
Conflicts of Interest
The authors declare that they have no known competing financial interests or personal relationships that could have appeared to influence the work reported in this paper.
References
- Behbahani, M.R.; Jalilian, A.; Bahmanyar, A.; Ernst, D. Comprehensive Review on Static and Dynamic Distribution Network Reconfiguration Methodologies. IEEE Access 2024, 12, 9510–9525. [Google Scholar] [CrossRef]
- Feng, H.; Ji, J.; Yang, C.; Li, F.; Li, Y.; Lyu, L. Analysis of Carbon Emission Reduction with Using Low-Carbon Demand Response: Case Study of North China Power Grid. Processes 2024, 12, 1324. [Google Scholar] [CrossRef]
- Shen, W.; Qiu, J.; Meng, K.; Chen, X.; Dong, Z.Y. Low-Carbon Electricity Network Transition Considering Retirement of Aging Coal Generators. IEEE Trans. Power Syst. 2020, 35, 4193–4205. [Google Scholar] [CrossRef]
- Gao, H.; Jin, T.; Wang, G.; Chen, Q.; Kang, C.; Zhu, J. Low-carbon Dispatching for Virtual Power Plant with Aggregated Distributed Energy Storage Considering Spatiotemporal Distribution of Cleanness Value. J. Mod. Power Syst. Clean Energy 2024, 12, 346–358. [Google Scholar] [CrossRef]
- Wu, R.; Liu, S. Multi-Objective Optimization for Distribution Network Reconfiguration with Reactive Power Optimization of New Energy and EVs. IEEE Access 2023, 11, 1. [Google Scholar] [CrossRef]
- Sengor, I.; Mehigan, L.; Zehir, M.A.; Cuenca, J.J.; Geaney, C.; Hayes, B.P. Voltage constraint-oriented management of low carbon technologies in a large-scale distribution network. J. Clean. Prod. 2023, 408, 137160. [Google Scholar] [CrossRef]
- Li, Q.; Huang, S.; Zhang, X.; Li, W.; Wang, R.; Zhang, T. Multifactorial evolutionary algorithm for optimal reconfiguration capability of distribution networks. Swarm Evol. Comput. 2024, 88, 101592. [Google Scholar] [CrossRef]
- Lei, C.; Bu, S.; Zhong, J.; Chen, Q.; Wang, Q. Distribution Network Reconfiguration: A Disjunctive Convex Hull Approach. IEEE Trans. Power Syst. 2023, 38, 5926–5929. [Google Scholar] [CrossRef]
- Macedo, L.H.; Home-Ortiz, J.M.; Vargas, R.; Mantovani, J.R.S.; Romero, R.; Catalão, J.P.S. Short-circuit constrained distribution network reconfiguration considering closed-loop operation. Sustain. Energy Grids Netw. 2022, 32, 100937. [Google Scholar] [CrossRef]
- Kim, H.; Ahn, S.; Yun, S.; Choi, J. Loop-Based Encoding and Decoding Algorithms for Distribution Network Reconfiguration. IEEE Trans. Power Deliv. 2023, 38, 2573–2584. [Google Scholar] [CrossRef]
- Chen, S.; Hu, W.; Chen, Z. Comprehensive Cost Minimization in Distribution Networks Using Segmented-Time Feeder Reconfiguration and Reactive Power Control of Distributed Generators. IEEE Trans. Power Syst. 2016, 31, 983–993. [Google Scholar] [CrossRef]
- Liu, Q.; Zhang, L.; Ji, X.; Shi, H. Dynamic reconfiguration of distribution network considering the uncertainty of distributed generation and loads. Front. Energy Res. 2023, 11, 1279579. [Google Scholar] [CrossRef]
- Li, J.Y.; Chen, J.J.; Wang, Y.X.; Chen, W.G. Combining multi-step reconfiguration with many-objective reduction as iterative bi-level scheduling for stochastic distribution network. Energy 2024, 290, 130198. [Google Scholar] [CrossRef]
- Yang, Y.; Qiu, J.; Zhang, C. Distribution Network Planning Towards a Low-Carbon Transition: A Spatial-Temporal Carbon Response Method. IEEE Trans. Sustain. Energy 2024, 15, 429–442. [Google Scholar] [CrossRef]
- Ren, X.; Gao, H.; Zhang, X.; Gu, J.; Hong, L. Multivariate low-carbon scheduling of distribution network based on improved dynamic carbon emission factor. Front. Energy Res. 2024, 12, 1380260. [Google Scholar] [CrossRef]
- Wang, Z.; Zhang, L.; Tang, W.; Ma, Z.; Huang, J. Equilibrium configuration strategy of vehicle-to-grid-based electric vehicle charging stations in low-carbon resilient distribution networks. Appl. Energy 2024, 361, 122931. [Google Scholar] [CrossRef]
- Yang, X.; Meng, L.; Gao, X.; Ma, W.; Fan, L.; Yang, Y. Low-carbon economic scheduling strategy for active distribution network considering carbon emissions trading and source-load side uncertainty. Electr. Pow. Syst. Res. 2023, 223, 109672. [Google Scholar] [CrossRef]
- Wang, J.; Wang, W.; Wang, H.; Zuo, H. Dynamic Reconfiguration of Multiobjective Distribution Networks Considering DG and EVs Based on a Novel LDBAS Algorithm. IEEE Access 2020, 8, 216873–216893. [Google Scholar] [CrossRef]
- Polasek, T.; Čadík, M. Predicting photovoltaic power production using high-uncertainty weather forecasts. Appl. Energy 2023, 339, 120989. [Google Scholar] [CrossRef]
- Ouyang, T.; Zha, X.; Qin, L. A combined multivariate model for wind power prediction. Energy Convers. Manag. 2017, 144, 361–373. [Google Scholar] [CrossRef]
- Gholizadeh, N.; Musilek, P. Explainable reinforcement learning for distribution network reconfiguration. Energy Rep. 2024, 11, 5703–5715. [Google Scholar] [CrossRef]
- Luo, F.; Bu, Q.; Ye, Z.; Yuan, Y.; Gao, L.; Lv, P. Dynamic Reconstruction Strategy of Distribution Network Based on Uncertainty Modeling and Impact Analysis of Wind and Photovoltaic Power. IEEE Access 2024, 12, 64069–64078. [Google Scholar] [CrossRef]
- Bo, Z.; Shengyuan, L.; Zhenzhi, L.; Li, Y.; Qiang, G.; Hua, X.U. Distribution Network Reconfiguration with High Penetration of Renewable Energy Considering Demand Response and Soft Open Point. Autom. Electr. Power Syst. 2021, 45, 86–94. [Google Scholar] [CrossRef]
- Rigo-Mariani, R.; Vai, V. An iterative linear DistFLow for dynamic optimization in distributed generation planning studies. Int. J. Electr. Power 2022, 138, 107936. [Google Scholar] [CrossRef]
- Yin, Y.; Ye, P.; Zhang, C.; Li, Z.; Feng, Y.; Chen, Y. Carbon Flow Analysis Method of Distribution Network Considering High Proportion of New Energy. J. Physics Conf. Ser. 2023, 2592, 12012. [Google Scholar] [CrossRef]
- Wang, W.; Huo, Q.; Deng, H.; Yin, J.; Wei, T. Carbon responsibility allocation method based on complex structure carbon emission flow theory. Sci. Rep. 2023, 13, 1521. [Google Scholar] [CrossRef] [PubMed]
- Chen, L.; Deng, Z.; Xu, X. Two-Stage Dynamic Reactive Power Dispatch Strategy in Distribution Network Considering the Reactive Power Regulation of Distributed Generations. IEEE Trans. Power Syst. 2019, 34, 1021–1032. [Google Scholar] [CrossRef]
- Sun, W.; Qiao, Y.; Liu, W. Economic scheduling of mobile energy storage in distribution networks based on equivalent reconfiguration method. Sustain. Energy Grids Netw. 2022, 32, 100879. [Google Scholar] [CrossRef]
- Abdel-Basset, M.; Mohamed, R.; Zidan, M.; Jameel, M.; Abouhawwash, M. Mantis Search Algorithm: A novel bio-inspired algorithm for global optimization and engineering design problems. Comput. Methods Appl. Mech. Eng. 2023, 415, 116200. [Google Scholar] [CrossRef]
- Changxin, M.; Xia, W.; Hao, L.I.; Li, H.; Chao, W. Day-ahead Prediction of Wind Power Based on NWP Wind Speed Error Correction. Power Syst. Technol. 2022, 46, 3455–3462. [Google Scholar] [CrossRef]
- Zhang, S.; Liu, M.; Liu, M.; Lei, Z.; Zeng, G.; Chen, Z. Day-ahead wind power prediction using an ensemble model considering multiple indicators combined with error correction. Appl. Soft Comput. 2023, 148, 110873. [Google Scholar] [CrossRef]
- Xu, Y.; Liu, J.; Cui, Z.; Liu, Z.; Dai, C.; Zang, X.; Ji, Z. Economic Scheduling Model of an Active Distribution Network Based on Chaotic Particle Swarm Optimization. Information 2024, 15, 225. [Google Scholar] [CrossRef]
- Zhao, F.; Si, J.; Wang, J. Research on optimal schedule strategy for active distribution network using particle swarm optimization combined with bacterial foraging algorithm. Int. J. Electr. Power 2016, 78, 637–646. [Google Scholar] [CrossRef]
Disclaimer/Publisher’s Note: The statements, opinions and data contained in all publications are solely those of the individual author(s) and contributor(s) and not of MDPI and/or the editor(s). MDPI and/or the editor(s) disclaim responsibility for any injury to people or property resulting from any ideas, methods, instructions or products referred to in the content. |
© 2024 by the authors. Licensee MDPI, Basel, Switzerland. This article is an open access article distributed under the terms and conditions of the Creative Commons Attribution (CC BY) license (https://creativecommons.org/licenses/by/4.0/).