Article

Control System for the Performance Analysis of Turbines at Laboratory Scale

by
Felipe Obando Vega
1,
Ainhoa Rubio-Clemente
1,2,* and
Edwin Chica
1,*
1
Grupo de Energía Alternativa, Facultad de Ingeniería, Universidad de Antioquia, Calle 70 No. 52-21, Medellín 050010, Colombia
2
Escuela Ambiental, Facultad de Ingeniería, Universidad de Antioquia, Calle 70 No. 52-21, Medellín 050010, Colombia
*
Authors to whom correspondence should be addressed.
Energies 2024, 17(19), 4950; https://doi.org/10.3390/en17194950
Submission received: 12 August 2024 / Revised: 16 September 2024 / Accepted: 29 September 2024 / Published: 3 October 2024
(This article belongs to the Section A3: Wind, Wave and Tidal Energy)

Abstract

:
The generation of sustainable energy through wind and hydrokinetic turbines, which convert the kinetic energy from fluid flows into mechanical energy, presents an attractive solution for diversifying the country energy matrix in response to climate change. Consequently, numerous studies have investigated the aerodynamic and hydrodynamic behaviors of various wind and hydrokinetic turbines using numerical simulations to understand their interaction with the surrounding fluid flows and enhance their performance. However, to validate these studies and aiming at improving the turbine design, experimental studies on a laboratory scale employing wind tunnels and hydraulic channels are essential. This work addresses the development and implementation of a reliable control system for experimentally evaluating the power coefficient (Cp) versus the tip speed ratio (TSR) curve of wind and hydrokinetic turbines. The control system, based on a DC motor acting as a generator and aligned with a commercial torque sensor, enables a precise control over the experimental setup. By obtaining and comparing the experimental performance curves of Cp versus TSR for both wind and hydrokinetic turbines with numerical results, the effectiveness and accuracy of the developed control system are demonstrated. A satisfactory fit between numerical and experimental results was achieved, underscoring the utility and reliability of the control system for assessing the turbine performance.

1. Introduction

The escalating challenges posed by global warming, environmental pollution, and the growing demand for energy are driving countries to explore and adopt renewable energy sources. These sources not only help to meet the rising demand for electricity but also minimize adverse environmental impacts, thereby supporting efforts toward sustainable development [1,2,3,4]. The transition to sustainable energy systems is increasingly driven by the adoption of technologies that harness clean and renewable sources to produce electricity. Among the most prominent of these technologies are large and small hydropower plants, hydrokinetic and wind turbines, solar thermal and photovoltaic systems, biomass power systems, geothermal power plants, wave energy converters, and green hydrogen production coupled to fuel cells. Green hydrogen, in particular, can be generated through the electrolysis of water using the excess of energy from renewable sources such as hydropower, solar, and wind energy. This makes it a versatile and a sustainable energy carrier with the potential to decarbonize various sectors, including transportation and heavy industry, through its use in fuel cells. These technologies play a critical role in reducing greenhouse gas emissions, enhancing energy security, and promoting sustainable development. As global demand for clean energy continues to rise, the optimization and advancement of these systems become imperative for meeting energy needs while minimizing the environmental impact [5,6,7,8,9]. Wind and hydrokinetic turbines have gained significant attention due to the abundant and widely distributed kinetic energy available in wind and water sources globally. These turbines efficiently convert renewable energy into electricity and are particularly attractive due to their versatility in various geographic locations. Their ability to be installed in remote and isolated communities allows for the creation of local energy networks, enhancing energy independence and security. By reducing reliance on fossil fuels and supporting the development of self-sufficient, resilient communities, these technologies play a crucial role in the global transition toward sustainable energy systems. Several wind and hydrokinetic turbines are being designed, manufactured and characterized around the world, demonstrating a continuous technological progress. However, the wind energy industry and the promising and incipient hydrokinetic industry demand efficient turbines with the aim of achieving a better use of the resources, along with a reduction in energy transformation costs. In this regard, researchers have primarily directed their studies towards enhancing the efficiency of these turbines through advancements in the turbine blade design [10,11]. The performance of turbines can be characterized by the relationship between the direct measurements of mechanical or electrical power with the tip speed ratio (TSR), being the mechanical power computed as the product of angular velocity ( ω ) and the rotor mechanical torque (T). With the prediction of the mechanical power, it is possible to know the turbine efficiency to capture the contained energy within the fluid. Therefore, the accurate determination of T and ω is of great importance in order to adequately characterize hydro and wind turbines [12,13,14,15]. Direct and indirect methods can be named as approaches to be used for the torque determination. Direct approaches consist of measuring the torque through direct measurements in the drive train using high-quality rotary torque transducers coupled to the turbine and the electric generator or the mechanical brake. Torque measurements can be obtained based on the tension or the twist angle. Regarding the tension measurements, surface acoustic wave, strain gauges, magneto-elastic, and piezoelectric reaction torque sensors can be used. On the other hand, based on the twist measurement, optical and inductive torque meters are found. The commercial rotary torque transducer commonly used typically measures the induced strain in the shaft due to the applied torque. For this purpose, some strain gauges are bonding on the rotating shaft of the sensor, arranged in a Wheatstone bridge circuit. The voltage that outputs from the bridge circuit can be defined as a function of the shaft strain, and subsequently, a function of the torque that is applied. The deformation that results from the torque is converted by the strain gauges into a change in the electrical resistance [16,17,18]. In addition to sending the signal out of the rotating shaft, another technical challenge of these methods is supplying power to the strain gauge through the rotating shaft. Therefore, for making the electrical connections to the strain gauges, a system of slip rings and brushes is used. Torque transducers with encoders are the best equipment suited to research and development due to their accuracy. The advantages ascribed to direct methods include a higher measurement accuracy; nevertheless, the torque transducer is relatively expensive [16,17,18]. The torque can be indirectly calculated through measurements of certain auxiliary quantities in the drive train. For example, ω and the electric power generated can be measured in order to determine the turbine torque. The characterization of the turbine often involves a complete power take-off (e.g., electrical load, generator, gearbox) to quantify the overall system performance. Uncertainty measurements in the indirect method are greater compared to the direct method. The reaction force measurement is another indirect method. A force transducer is utilized to measure the force applied to the end on a lever arm. For this purpose, complicated mechanics are required. The measurement of the indirect torque could be easier, faster, and precisely enough in industrial conditions in comparison with direct methods. In the literature, there are many experimental investigations using both direct and indirect methods for determining the torque. As a matter of fact, Yavuz et al. [19] investigated numerical and experimentally the performance of hydro and wind turbines considering airfoil-slat arrangements for the design of the blades. These researchers measured the torque, the rotational speed and the velocity of carriage during experimentation. The torque and rotational speed were measured using a torque transducer with encoder that was coupled to the turbine and the electric generator. The velocity of the rotor was regulated through the alteration of the system load by some rheostats connected to the generator. For the current reduction and control sensitivity improvement, up to three 1.5 Ω /25 A, rheostats were wired in parallel. In turn, Tian et al. [20] analyzed the performance of a small-scale horizontal-axis hydrokinetic turbine by employing numerical and experimental studies. Instead of using a torque transducer, the referred authors measured the torque using a hub, 3-bladed rotor, a magnetic coupling and an electric generator. During the tests, a load resistor was connected to the electric generator to control the turbine rotation velocity by adjusting the load resistance value, ranging from 6 to 25 Ω . For each resistance, the voltage was measured and then averaged when the values were maintained stable in order to determine the voltage of the final load. When the electrical load of the electric generator changed, the TSR and mechanical power of the turbine varied, therefore, the curve of Cp vs. TSR could be plotted. The turbine mechanical power was calculated by the relationship between the square of the voltage across the resistance and the load resistor. Similarly, Cavagnaro and Polagye [21] presented the turbine performance analysis of a cross-flow hydrokinetic turbine using a power take-off system. A resistive bank was used to dissipate the electrical power generated by the generator. The loads ranged from 0.3 to 1000 Ω , allowing a discrete turbine torque control. A rotary torque sensor was used for measuring the mechanical torque produced by the turbine. In these previous works, the electrical power generated by the turbine was largely affected by the generator internal friction, electric and magnetic losses. Therefore, if this electrical power is used to determine Cp, it is expected to be lower compared to the direct determination of this variable when the turbine mechanical power is used. Consequently, there is a need to measure directly the mechanical power generated for the turbines. Patel et al. [22] investigated the aspect ratio and overlap ratio on the performance of a Savonius turbine for hydrodynamic applications using the torque measurements based on the reaction forces. The researchers employed a rope brake dynamometer arrangement for the measurement of the turbine torque and, subsequently, the mechanical power developed. During the measurement, the rotor was gradually loaded by adding known weights through a break dynamometer rope until the turbine was stopped. Then, the spring balance reading and ω of the rotor measured using a tachometer were recorded in each test. This method of measurement of the turbine dynamic torque was also used by other authors such as [23,24,25]. In general, the indirect methods used for measuring the shaft torque and, subsequently, the mechanical power of a model turbine, tend to lack robustness and accuracy during the measurement. One of the main limitations of the technologies for measuring the torque that are currently used is the prohibitive cost of the torque testing benches, which rely on expensive, specialized equipment such as high-precision sensors and complex braking systems. These setups, while offering accurate data, do not always facilitate the direct measurement of the torque, further complicating experimental procedures and inflating costs. The financial burden restricts access to such systems for many research labs with limited budgets, particularly those working on hydrokinetic and wind turbines. Without affordable solutions for measuring the torque directly and computing the mechanical power, researchers and engineers face significant challenges in optimizing the turbine performance. This delay in the development of more efficient turbine designs slows advancements in renewable energy technologies, ultimately impeding the broader transition to sustainable energy systems. In this regard, selecting an appropriate method for measuring the turbine shaft torque under transient hydro or wind conditions is crucial for the competitive development of these devices. Reliable condition monitoring techniques remain a significant focus of scientific research, as they ensure accurate performance assessments. This work aims to develop and implement a robust control system for the experimental evaluation of the curve between Cp and TSR of wind and hydrokinetic turbines. Developing a reliable control system is essential not only to stabilize operating conditions during tests but also to minimize the impact of external disturbances, ensuring that the data collected accurately reflect the turbine current behavior. Determining the Cp vs. TSR curve and the corresponding uncertainty estimation are critical steps during the turbine development, serving as a foundation for advancing control strategies and optimizing the turbine design. In this context, a direct torque measurement method using a direct current (DC) electric motor as a braking device is proposed. In various equipment and vehicles where DC motors are employed as the primary motion transfer mechanism, it is common to implement additional electronic systems that convert the motor operation into an effective braking device, capable of reducing or halting movement. There are three principal methods of DC motor braking: the dynamic braking, the regenerative braking, and the plugging or reverse current technique. Among these, the plugging technique stands out for its simplicity and effectiveness, making it an optimal choice for the precise torque control in experimental setups. This study employes the developed control system to characterize the performance of a vertical-axis wind turbine (VAWT) and a horizontal-axis hydrokinetic turbine (HAHT), by using a wind tunnel and a hydraulic channel, respectively. The integration of the control system with these testing environments is expected to yield highly accurate torque measurements, facilitating a comprehensive evaluation of the turbine behavior under several operating conditions [26,27].

2. Materials and Methods

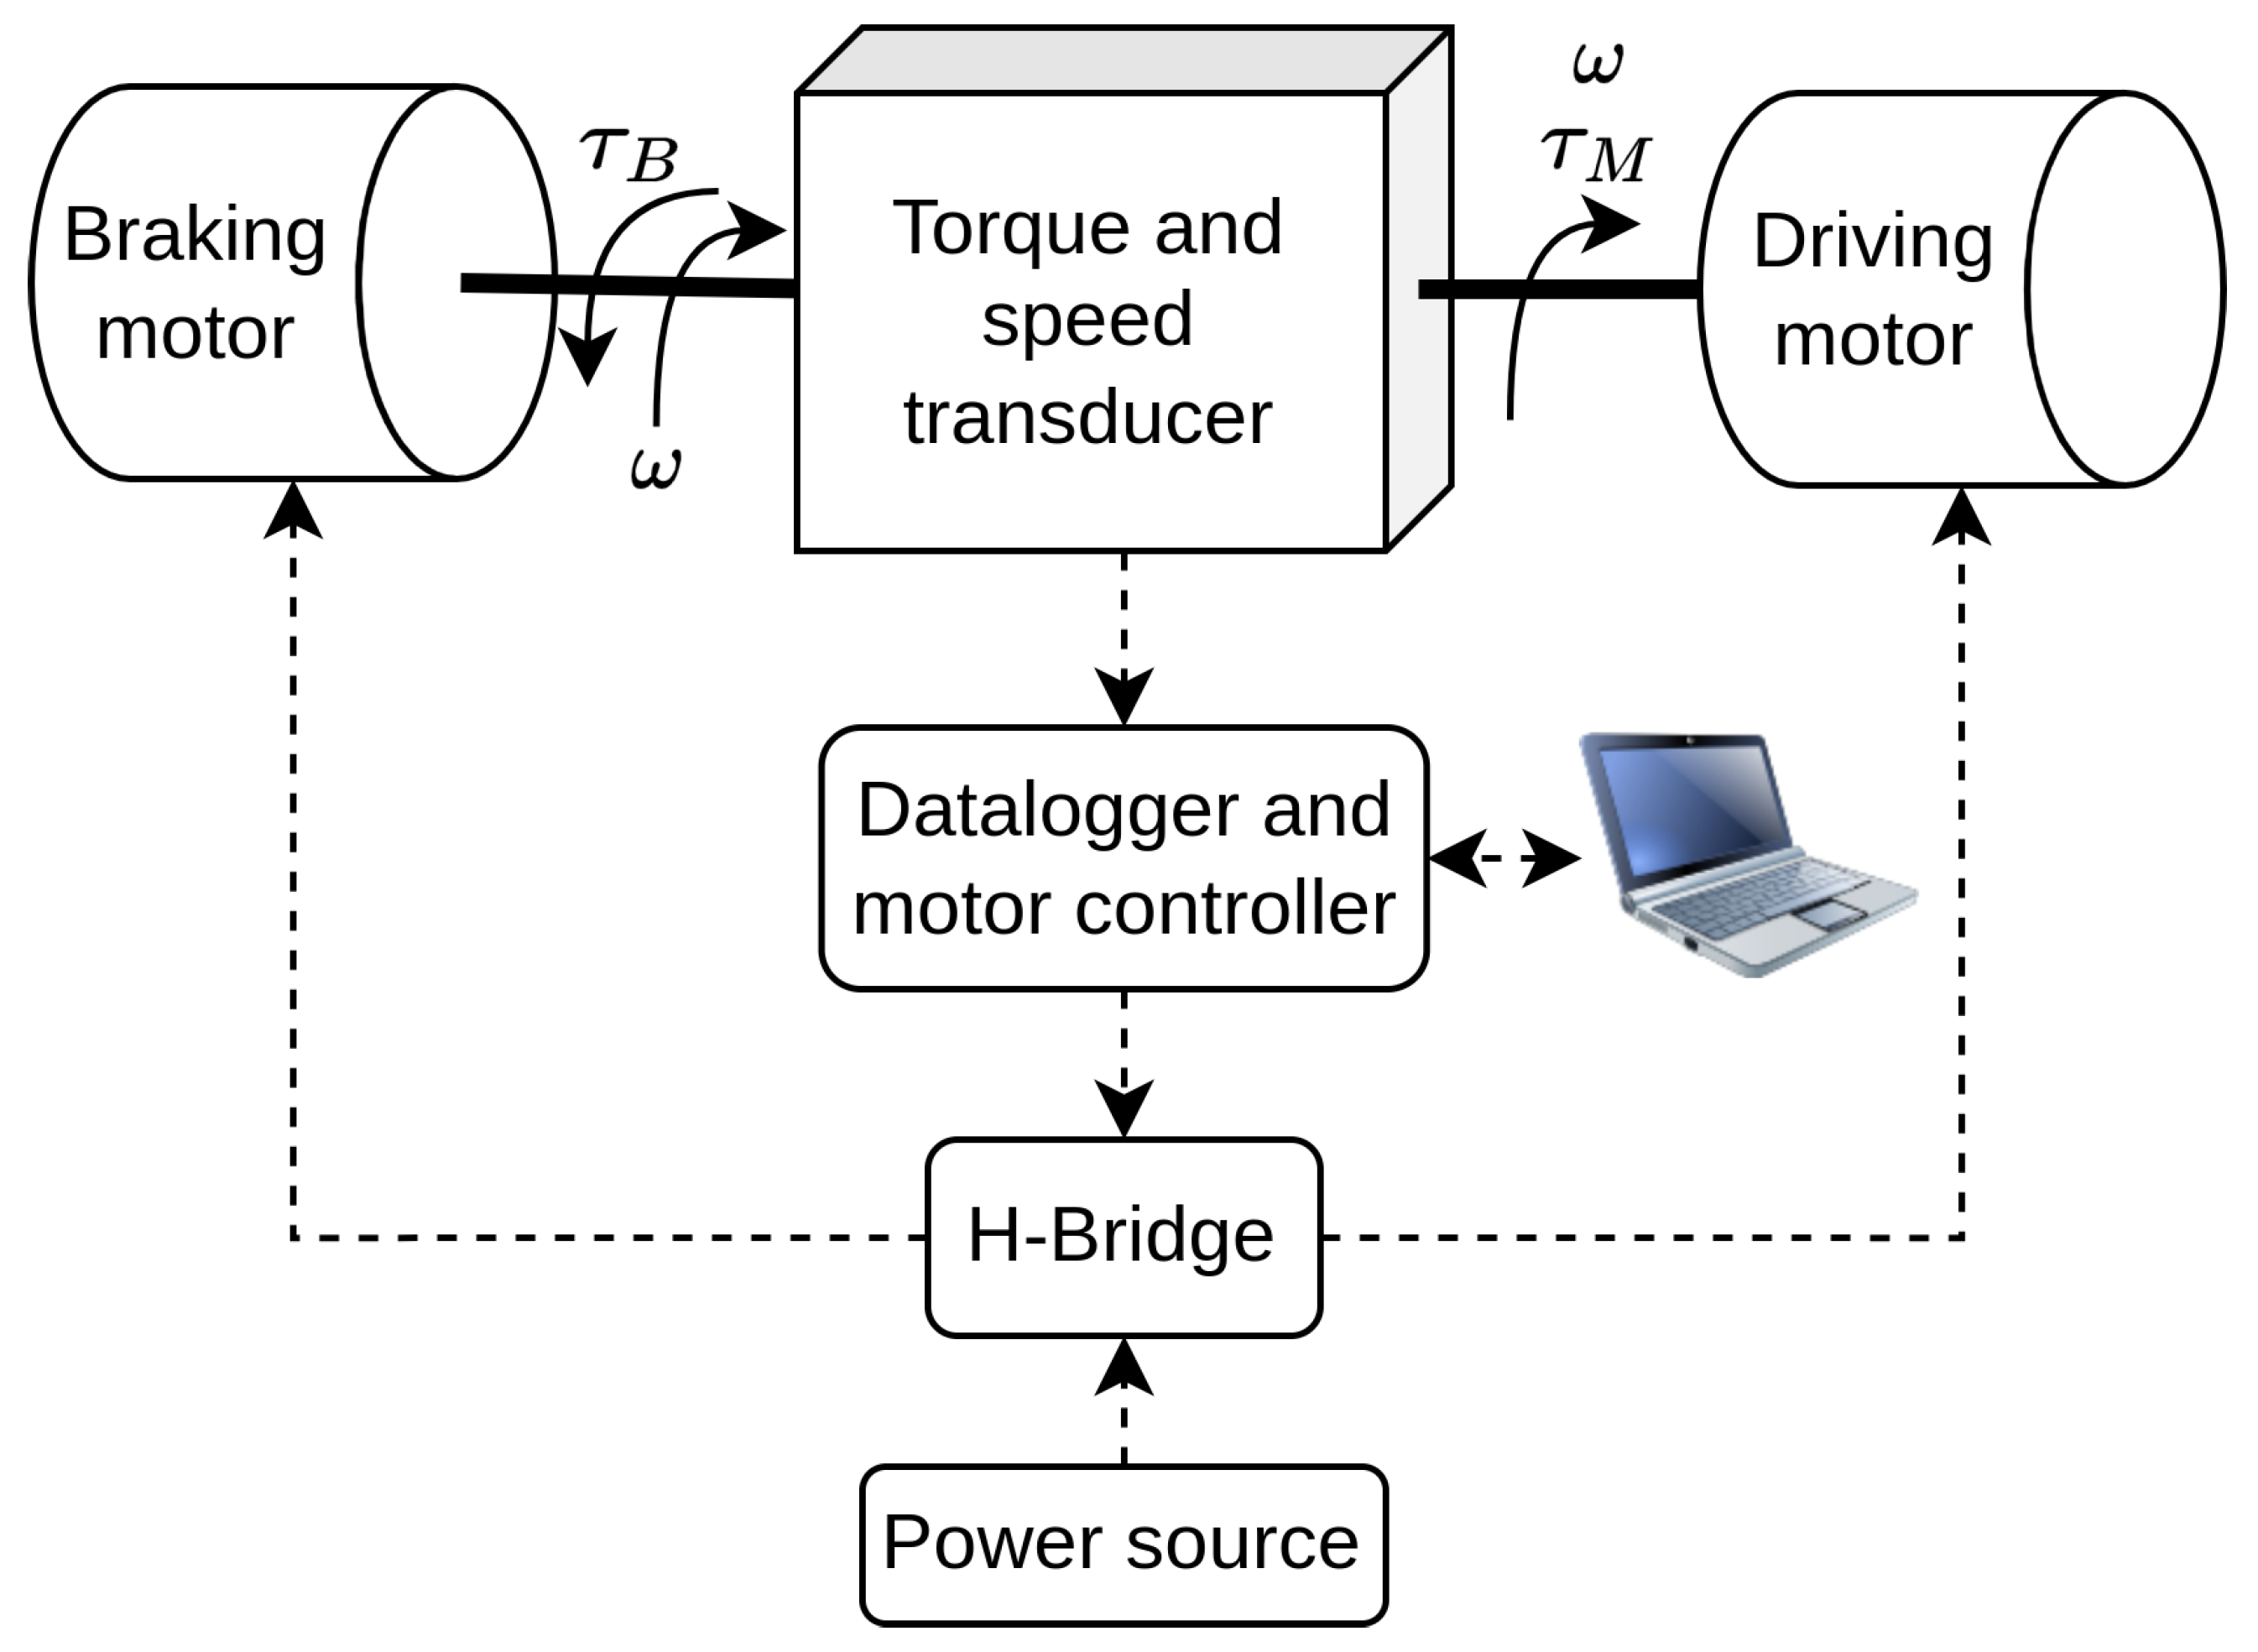
A direct torque measurement system was utilized for the precise characterization of hydrokinetic and wind turbines. This system was selected over indirect methods that infer torque from related measurements such as tensions and forces, due to their ability to provide accurate, real-time torque data. The direct measurement approach mitigates errors that can arise from the complexities of indirect calculations and modeling assumptions. Although the direct method incurs in higher costs due to specialized sensors and transducers are required and it necessitates the development of control and data acquisition systems, the benefits outweigh these challenges. The direct measurement ensures a high level of accuracy and detail in the performance evaluation, which is critical for thorough the turbine assessment and optimization. This methodological choice supports a more reliable analysis of the turbine efficiency, which is essential for refining the design and operational parameters. Two microgear metal DC motors (220 RPM, 6 VDC, Pololu, Las Vegas, NV, USA) were connected at each end of a rotary torque transducer (TRS601, −50 to 50 Nm for the input range, −5 to 5 V for the output range, FUTEK, Irvine, CA, USA) using a 3D printed ABS spyder mechanical coupler, as shown in Figure 1, in order to prove the concept of using a DC motor as a braking device for a torque transducer to characterize wind and hydrokinetic turbines. As shown in Figure 1 and Figure 2, one motor acts as a driving motor simulating a turbine, applying a torque τ M to the sensor shaft and rotating at a ω . The second motor serves as a braking mechanism, applying a braking torque τ B to the transducer shaft. This is accomplished by supplying a voltage that causes the braking motor to rotate the counter to its current direction of motion. This braking technique is known as the plugging or inverse current. The net torque measurement by the transducer is equal to the difference of both torques, τ N = τ M τ B . The driving motor ω and the braking torque were controlled using an H-bridge circuit module with Pulse Width Modulation (PWM) techniques. It adjusts the width of the voltage pulses applied to the motor terminal at a constant frequency in order to change the average voltage received by the motors. The width of the voltage pulse is generally known as duty a cycle and varied from 0% (0 volts) to 100% (5 volts in this case). A ESP32 microcontroller (ESP32E, Expressif Systems, Shangai, China) was used to manipulate the average voltage applied to both motors generating a PWM signal with an 8-bit resolution. The voltage generated by the torque transducer that is proportional to the torque applied was measured using a 16-bit resolution analog-digital converter (ADS1115, Texas Instruments, Dallas, TX, USA) that was connected to the ESP32 microcontroller through I2C communication protocol. Meanwhile, the rotation speed of the transducer’s shaft was computed measuring the frequency of the pulse output generated by the quadrature encoder of the torque transducer (360 pulses per revolution) using the interrupt inputs of the ESP32 microcontroller. By employing serial communication, the ESP32 was also connected to a notebook where the measurements were recorded, and the duty cycles applied to both motors were changed. The braking motor technique used to generate a reverse torque to the one generated by the turbine in the torque transducer shaft was evaluated along with three different experimental tests. Initially, a test defining a duty cycle of 47% (equal to 120 PWM output value) for the driving motor with 5 V of supplied voltage was performed, which rotated at 190 RPM. The duty cycle applied to the braking motor was initially increased from 0 to 98.04% (equal to 250 PWM output value) and then decreased again to 0. For this, increments/decrements of 3.92% (equal to 10 PWM output value) in the duty cycle were conducted every 5 s. Afterwards, a PID control library [28] was implemented in the ESP32 microcontroller, with the intention of controlling ω of the turbine, which was simulated with the motor driving. For this purpose, the driving motor was turned on to constantly operating at 5 V. Several close-loop tests were performed defining a set-point of 100 RPM for the desired ω . The duty cycle applied to the braking motor corresponded to the output of the PID control algorithm. The PID control parameters K d , K i , and K p , referring to the derivatives, integral and proportional gains, respectively, were tunning at trial and error. The best control performance was selected from one that minimize the integral of time-weighted absolute error (ITAE) criterion, which was defined as ITAE = 0 t | e ( t ) | d t [29], where t is the time and e ( t ) is the error. This error was defined as the difference between the set-point and the measured ω . Before testing the control system, an open loop test was performed turning on the driving motor at 5 V, and applying a braking torque corresponding to a duty cycle of 35% (equal to a PWM output value of 78) to observe ω oscillation due to misaligned problems in the coupling of the motors. The control system developed was used to plot Cp curve against TSR for both a Savonius-type wind turbine with multi-element blades and a propeller-type hydrokinetic turbine. For both turbines, Cp could be computed by Equation (1). TSR was determined as described in Equation (2).
C P = P 0.5 A ρ V 3
T S R = λ = ω R V
where P denotes the turbine’s power output, which can be determined by using Equation (3). Additionally, ρ represents the density of the flow, A denotes the swept area of the turbine, V indicates the velocity of the incoming free flow, ω represents the rotor’s angular velocity, and R is the radius of the turbine outer section. T represents the total torsional force generated by the turbine. For the hydrokinetic turbine, the swept area was calculated as π D 2 / 4 , where D is the turbine diameter. Meanwhile, for the Savonius turbine, this variable was calculated as the product of the turbine diameter (D) and the height (H).
P = T ω
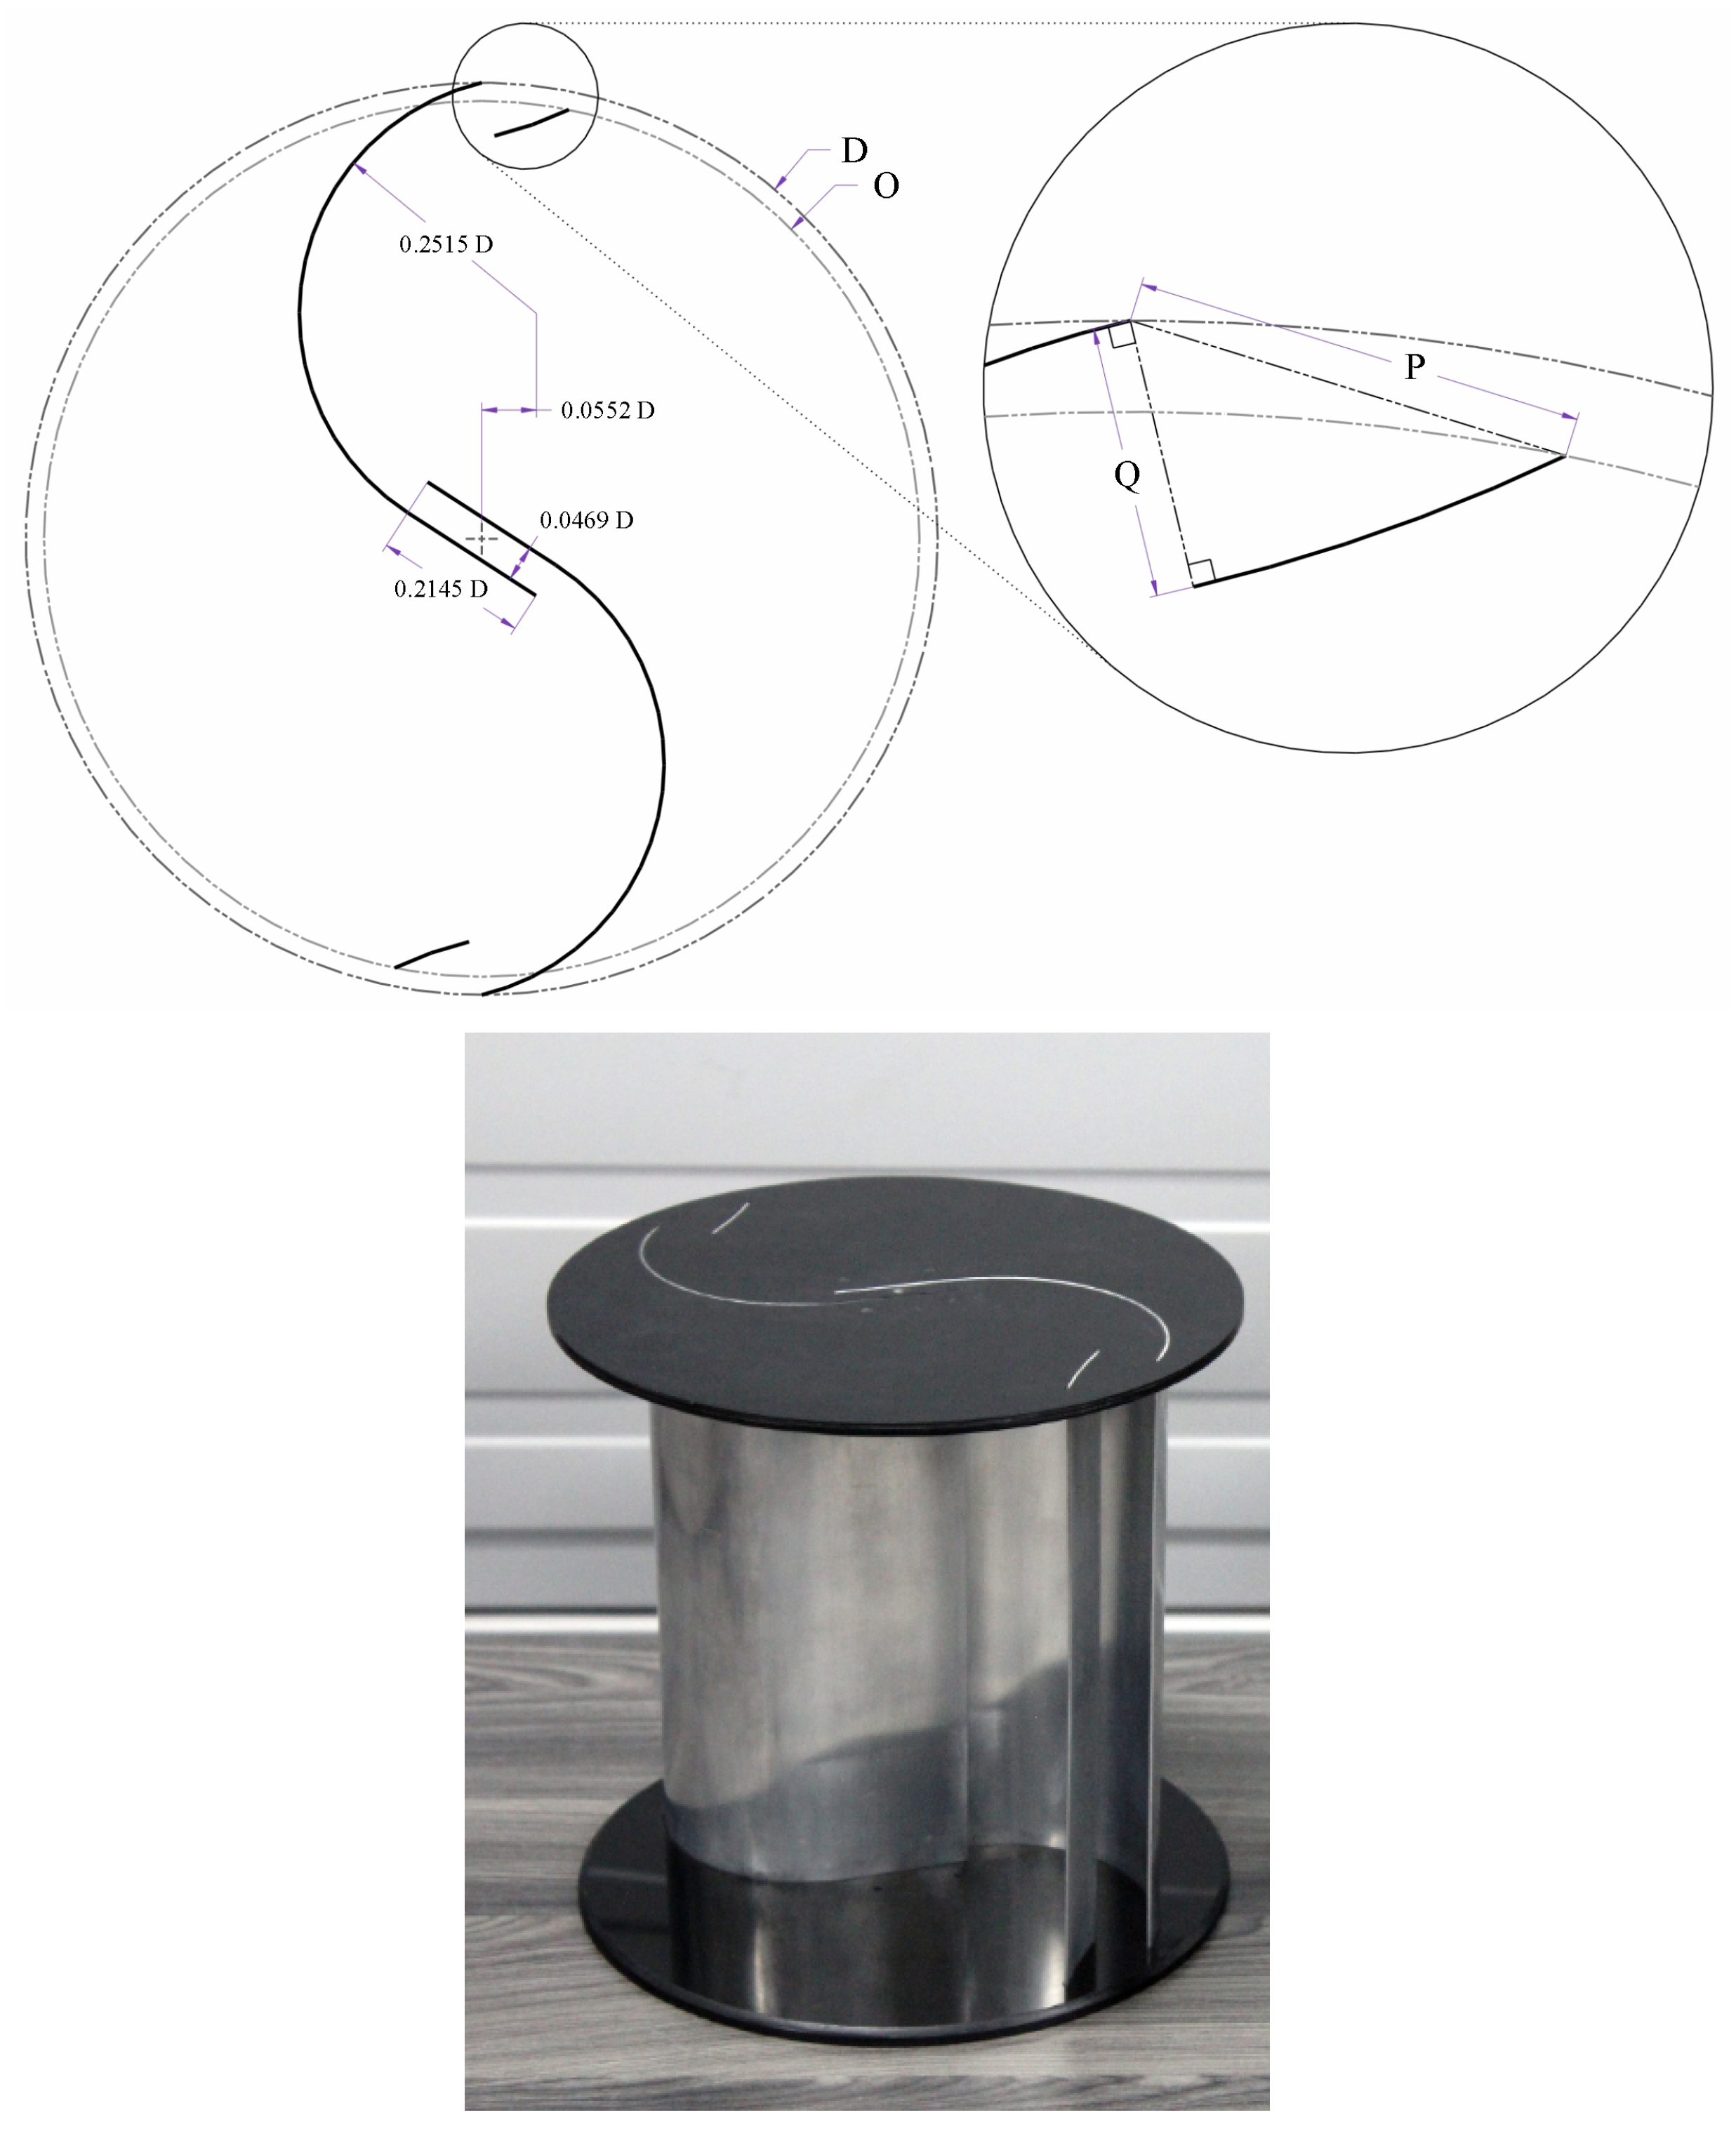
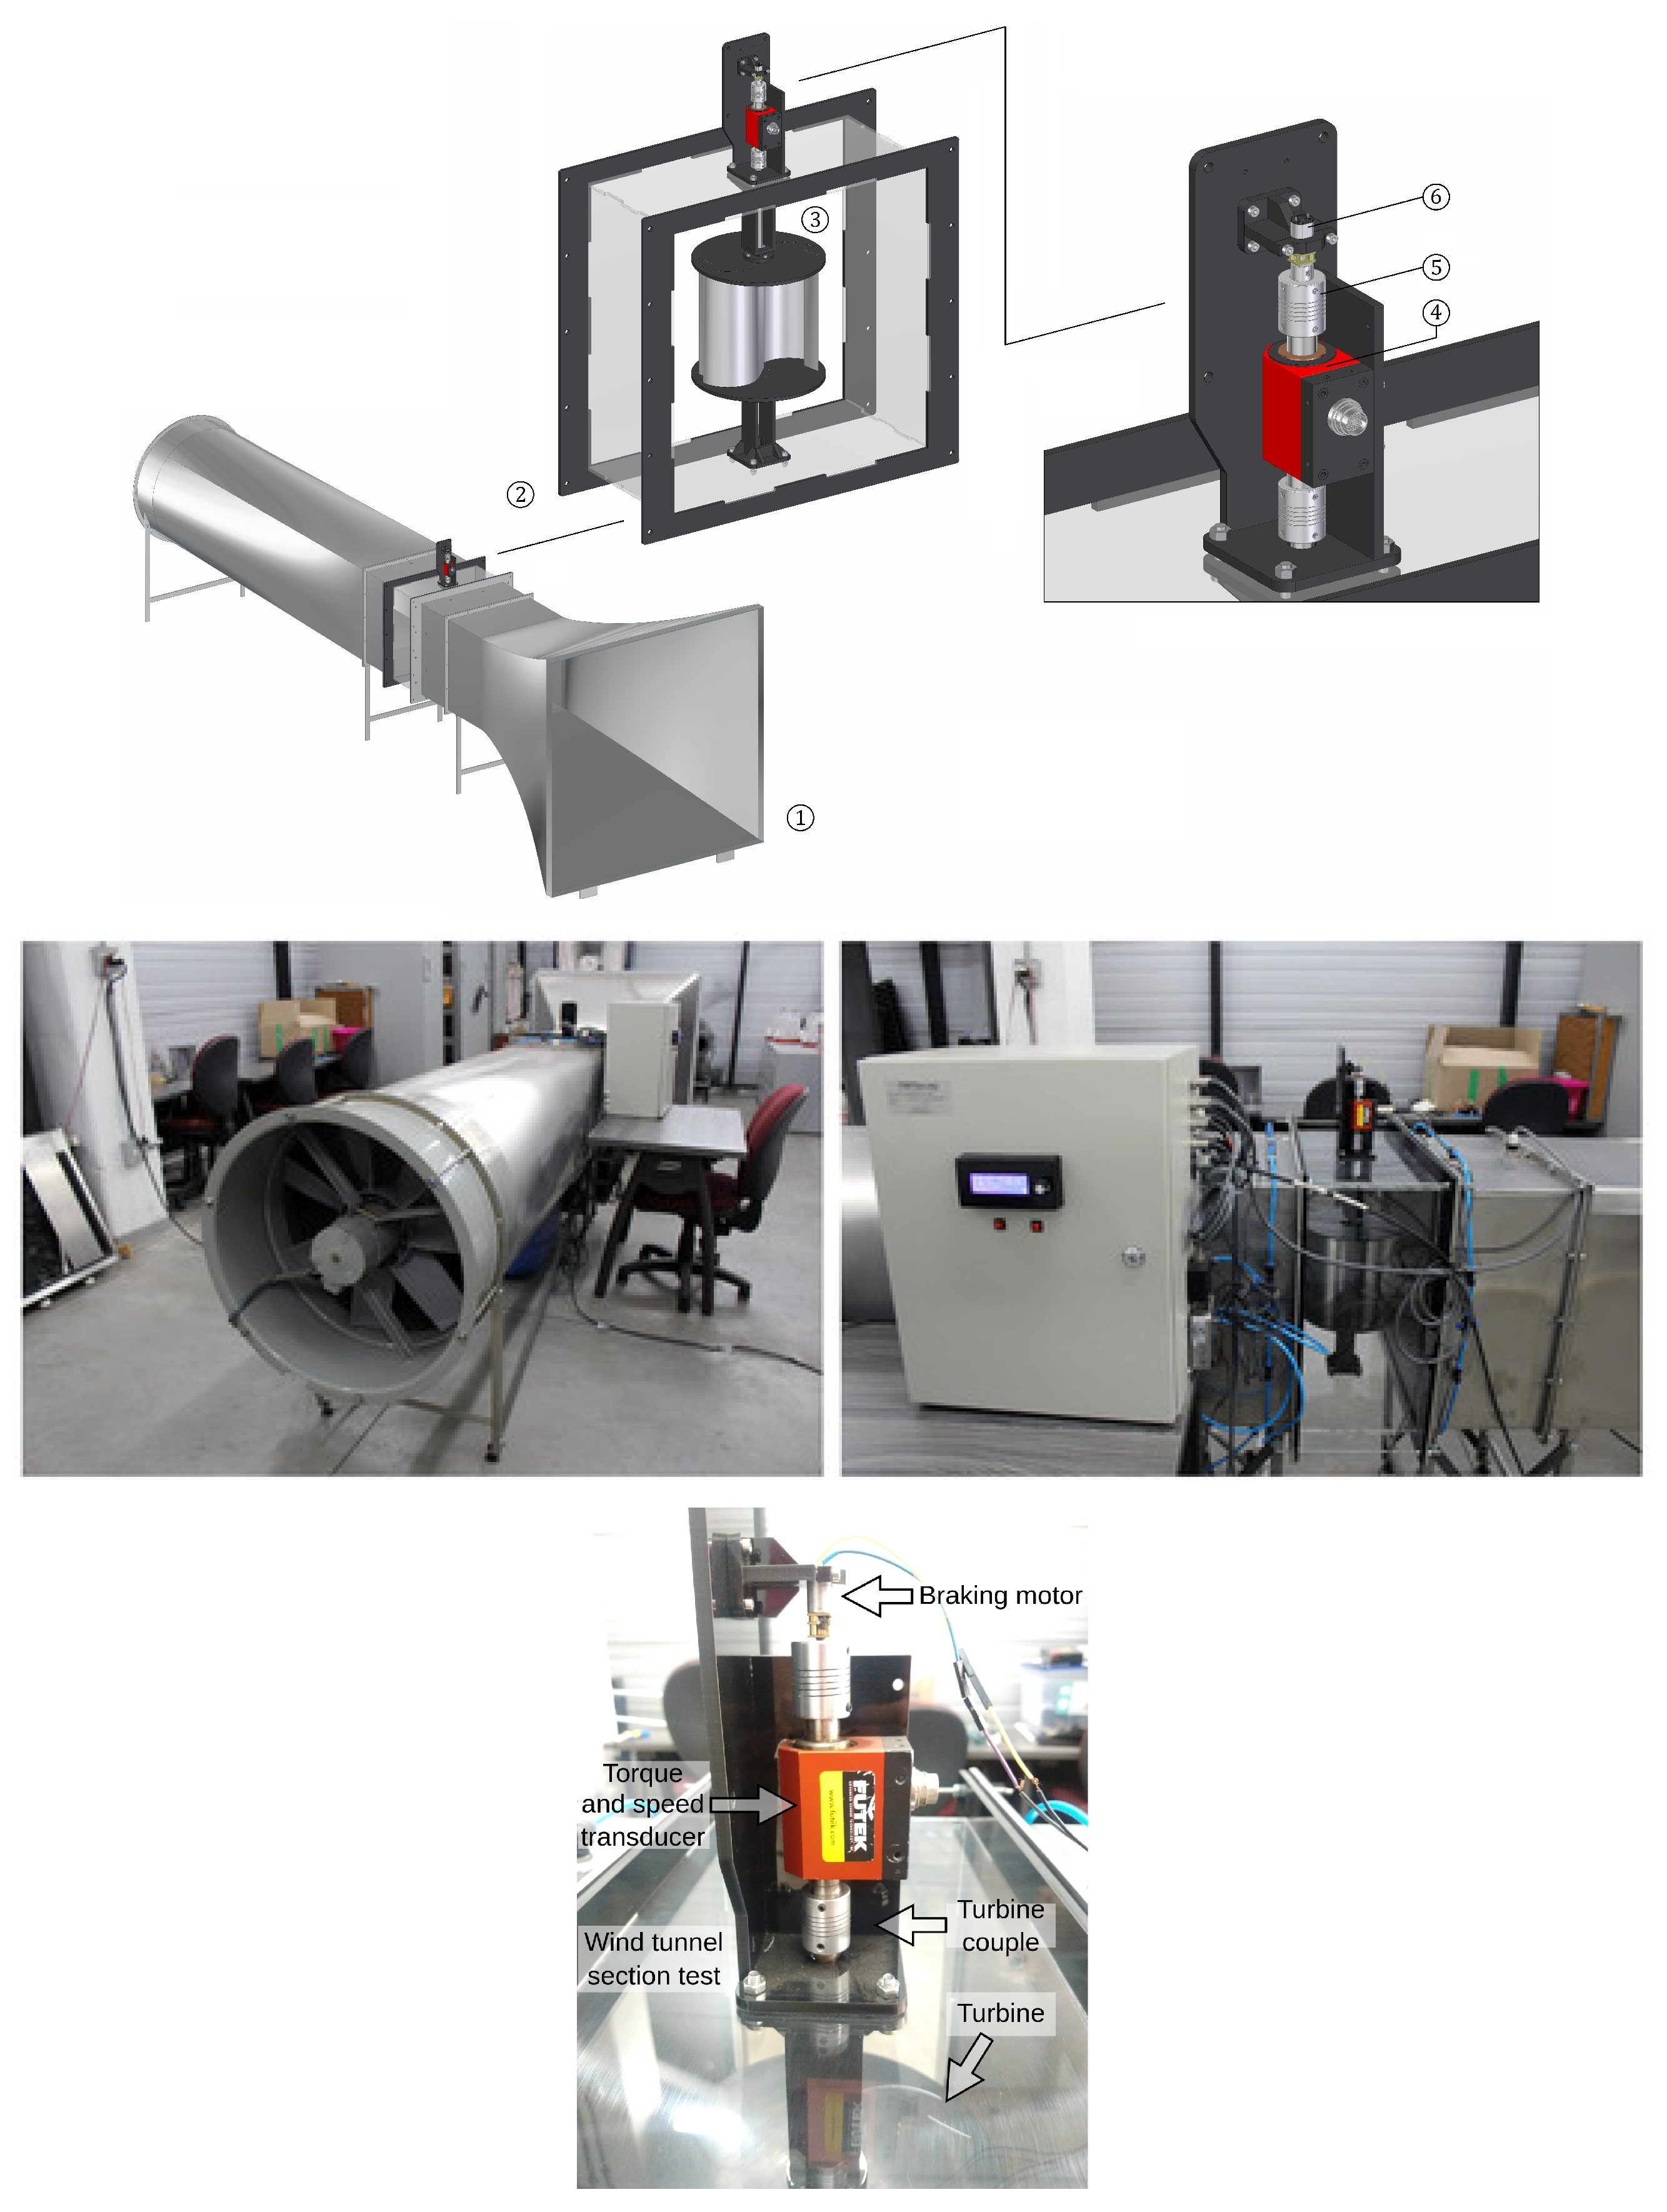
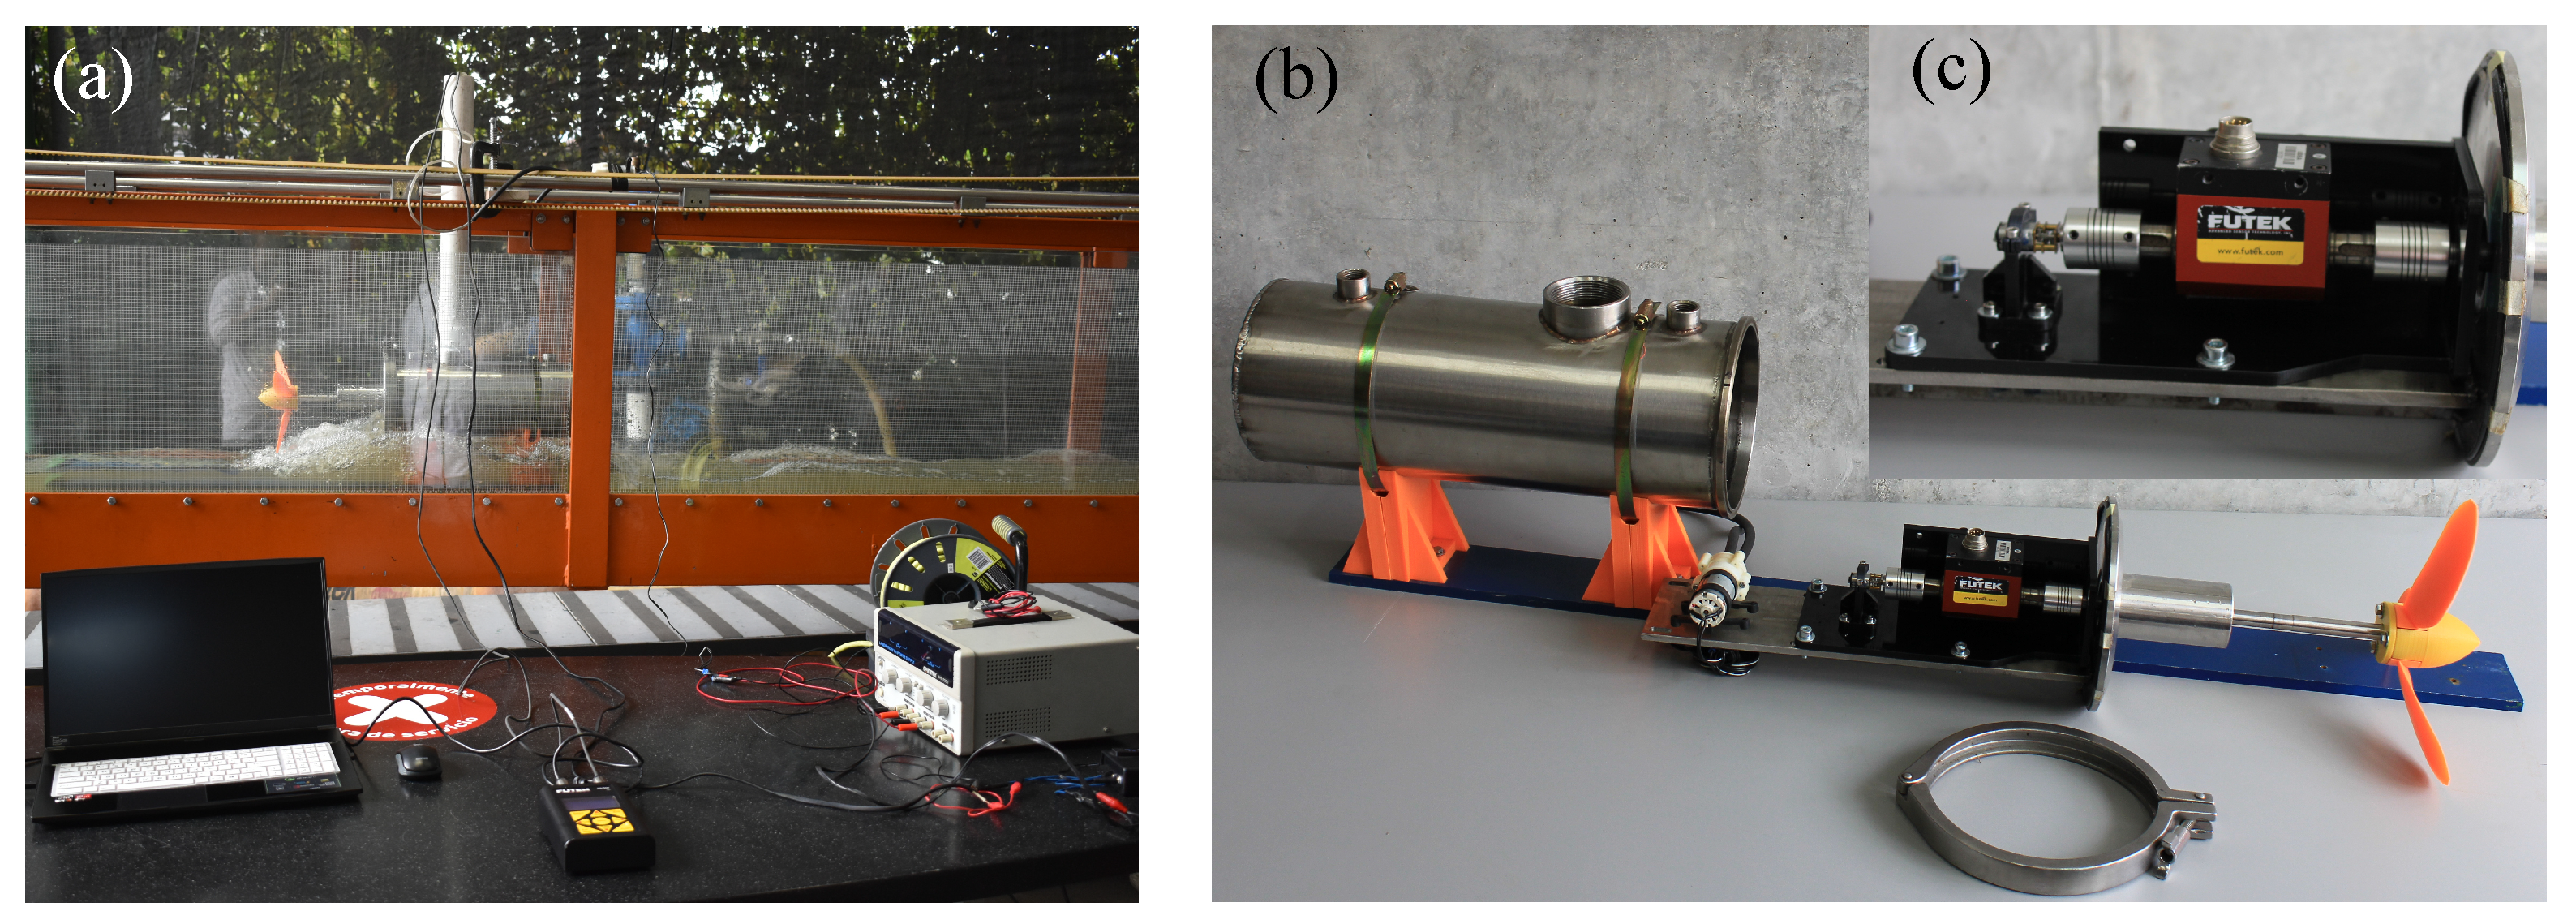
Figure 3 provides a cross-sectional view of the turbine. In the figure, the geometric parameters utilized in the design process of a Savonius-type wind turbine are illustrated. The turbine diameter (D) employed was 200 mm, with the values assigned to O, P, and Q being 96.81% D, 17.43% D, and 9.4% D, respectively. The experimentation took place within the open wind tunnel with a test section that measured 50 cm × 50 cm, as shown in Figure 4. The rotor model adopted dimensions of 200 mm × 200 mm in height and diameter, respectively, resulting in a blockage ratio of 16%. At each end of the rotor, plates with a diameter of 220 mm were affixed, crafted from 6 mm thick acrylic material. The turbine blades were fabricated using a 20-gauge aluminum sheet. The experimental setup was situated in Medellín, Colombia, where the air density was approximately 1.058 kg/m3, corresponding to an elevation of 1500 m.a.m.s.l (ISO 2533 standard) [30]. During testing, a predetermined airflow velocity of 4 m/s was established within the wind tunnel. Prior to each test run, an ultrasound anemometer was used to adjust the velocity. This equipment was located 0.5 m upstream of the rotor. Once adjustments were made, the anemometer was retracted to prevent interference with the incident airflow on the rotor. Inside the tunnel, the airflow accelerated the rotor from zero velocity to its maximum speed under no-load conditions. Subsequently, when the rotational regime stabilized, a power signal was transmitted to an electric motor, with its intensity incrementally increased. The load applied by the motor acted as a brake on the test rotor until it came to a complete stop. Measurements were conducted using a rotary torque transducer (TRS601, −50 to 50 Nm for input range, −5 to 5 V output range, FUTEK, Irvine, CA, USA) that was equipped with an encoder coupled to a control system capable of adjusting the load exerted by the electric motor via pulse width modulation (PWM). The performance evaluation of a scaled model of a horizontal-axis propeller hydrokinetic turbine (HPHT) also was conducted. A depiction of the turbine’s scaled model, featuring a rotor of 0.24 m diameter (D), −18.06° rake ( γ ) angle, and 13.30° skew ( ϕ ) angle, is presented in Figure 5. This model comprised a hub, a shaft and three blades. The blades and hub were cost-effective and precision-crafted through 3D printing, utilizing the fused filament fabrication (FFF) technology for processing polylactic acid (PLA). On the other hand, the shaft was fabricated in AISI 304 stainless steel by using traditional machining methods [31]. The experiments involving the scaled model of the HPHT were conducted within an open hydraulic channel measuring 0.31 m in width, 0.5 m in height, and 8 m in length. To gauge the water velocity within the channel, a flow-meter (FW450, 0.08 to 41.67 m/s input range, ±0.01 m/s accuracy, General Tools & instruments, Secaucus, NJ, USA) was employed. An axial flow pump propelled the water that circulated through the channel at velocities of up to 1 m/s. This velocity value was used to average measurements of water speed at three distinct positions upstream of the rotor within the channel. A 14.9 kW electric motor was used for controlling the operation of the pump. An overview of the testing facility is illustrated in Figure 6. T and ω were measured using a rotary torque transducer (TRS601, −50 to 50 Nm for input range, −5 to 5 V output range, FUTEK, Irvine, CA, USA) with encoder, which boasted 0.000110 Nm of accuracy and >10,000 C p r , respectively. The monitoring of the sensor activity was facilitated by an IHH500 pro intelligent digital display, and data collected were saved in real-time. For T and ω measurement, immersion of the torque sensor and data acquisition system in the water current within a submerged, water-resistant vessel was required. Accordingly, a water-resistant vessel was constructed to shield the sensor from the water flow. The turbine torque produced at different TSR values was measured by the developed system.

3. Results and Discussion

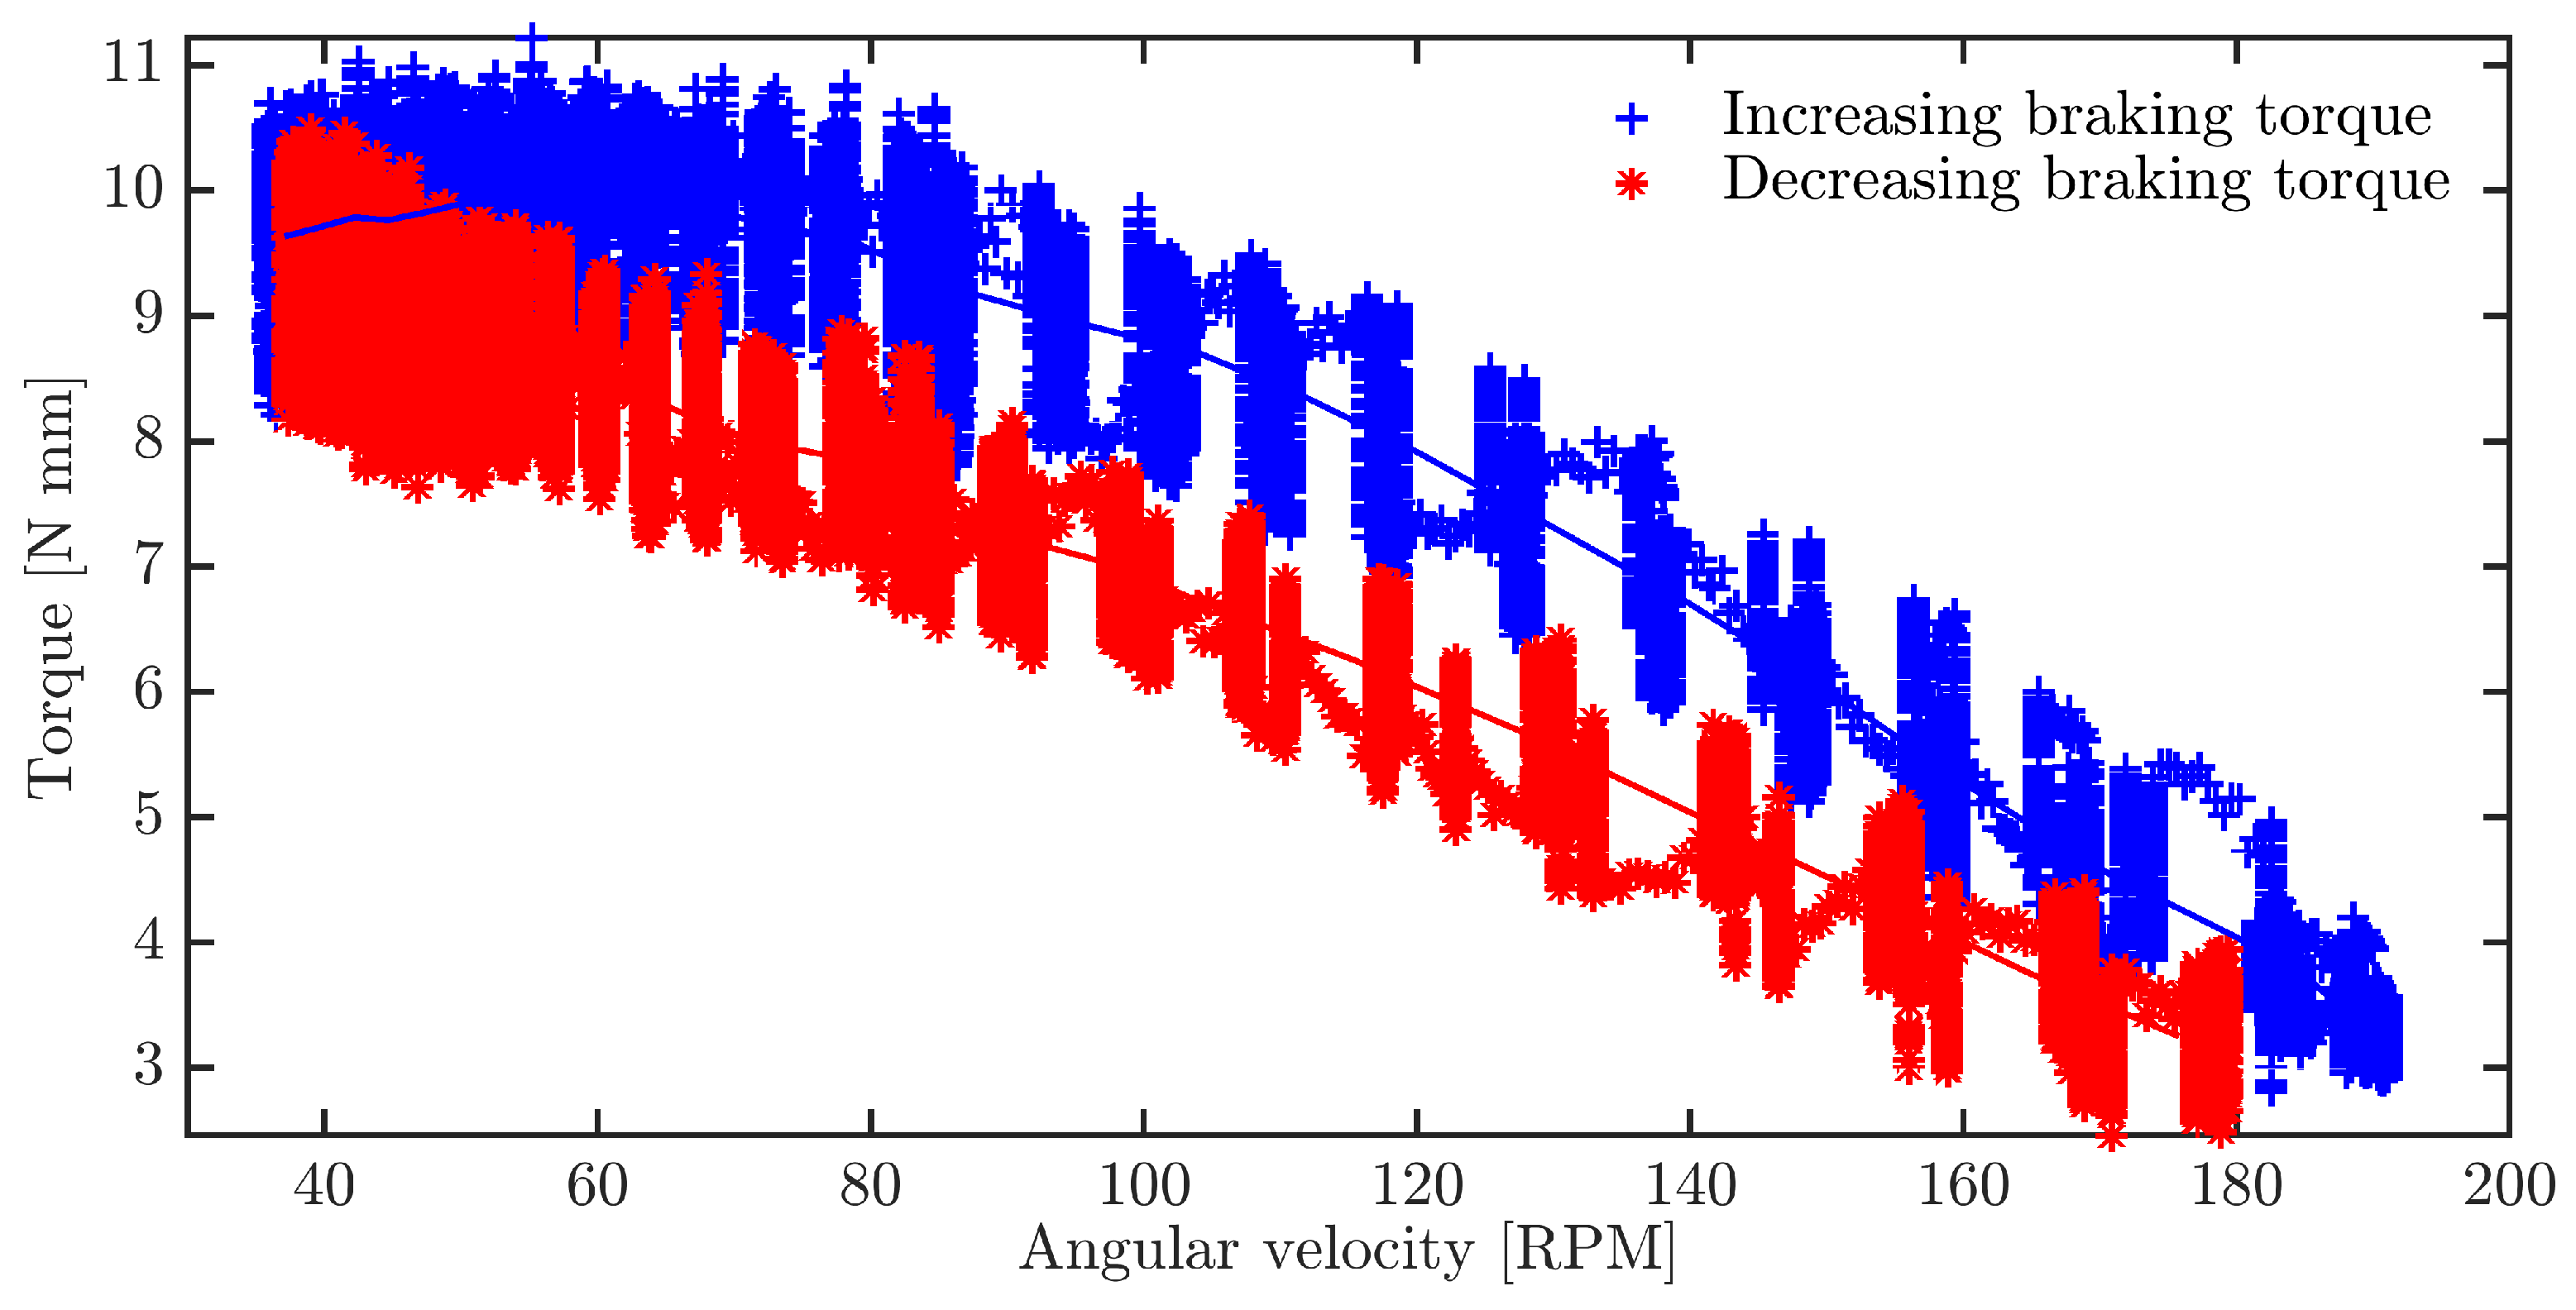
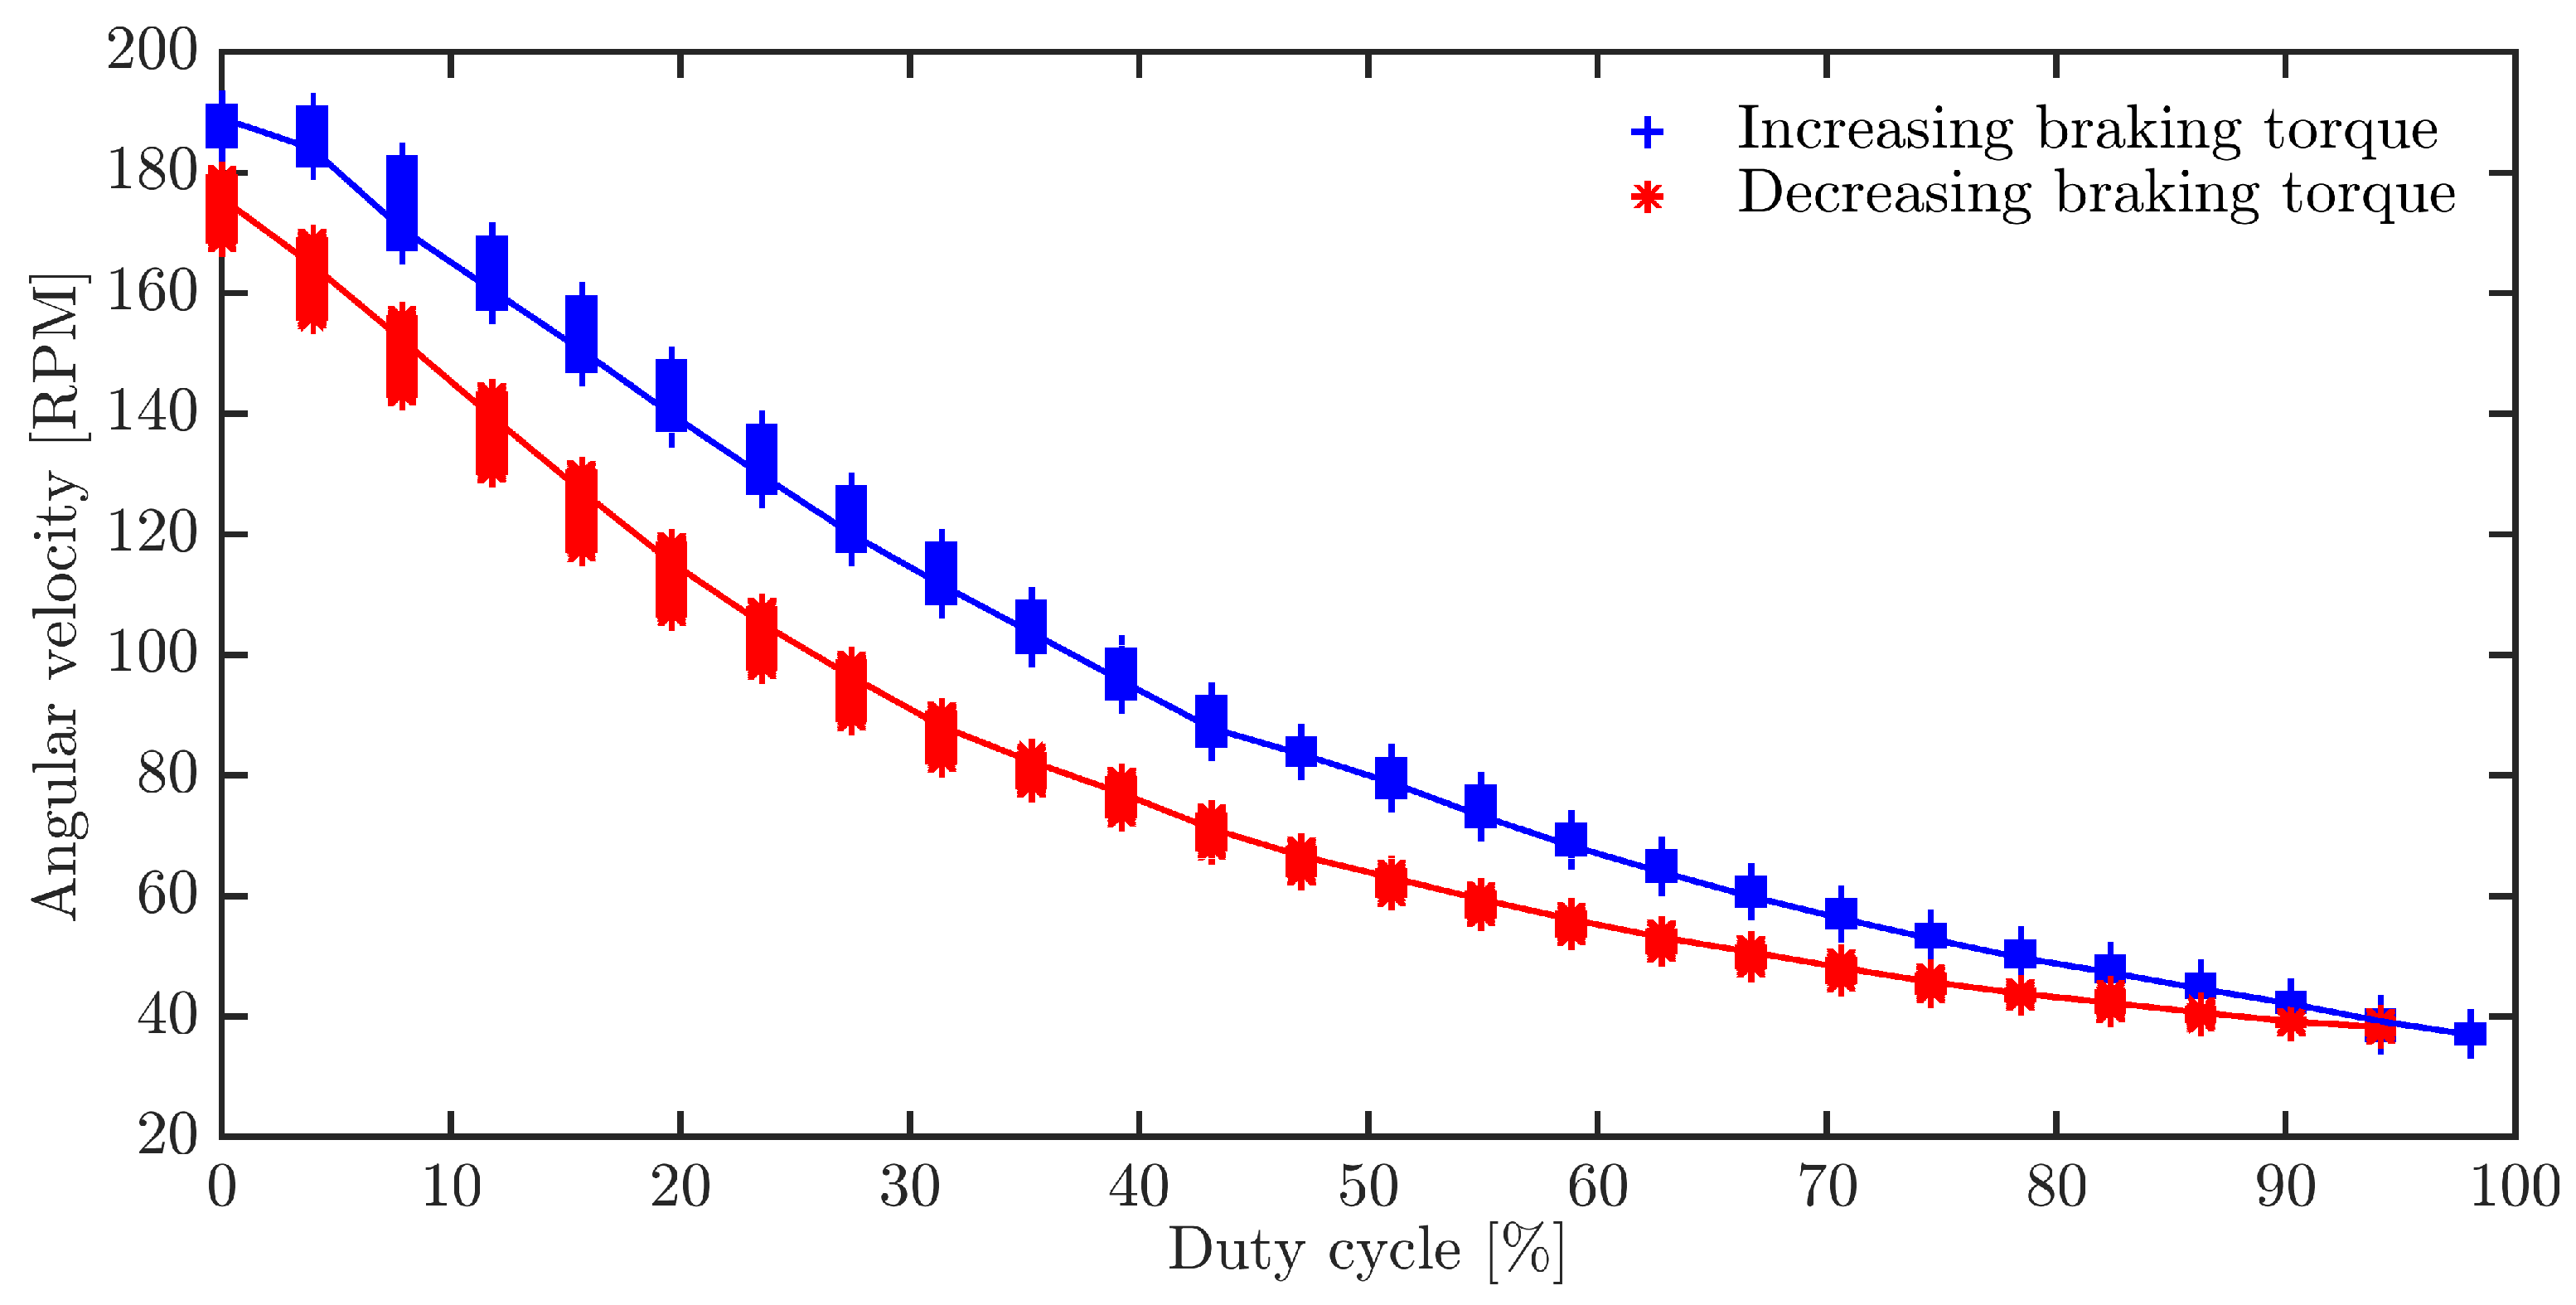
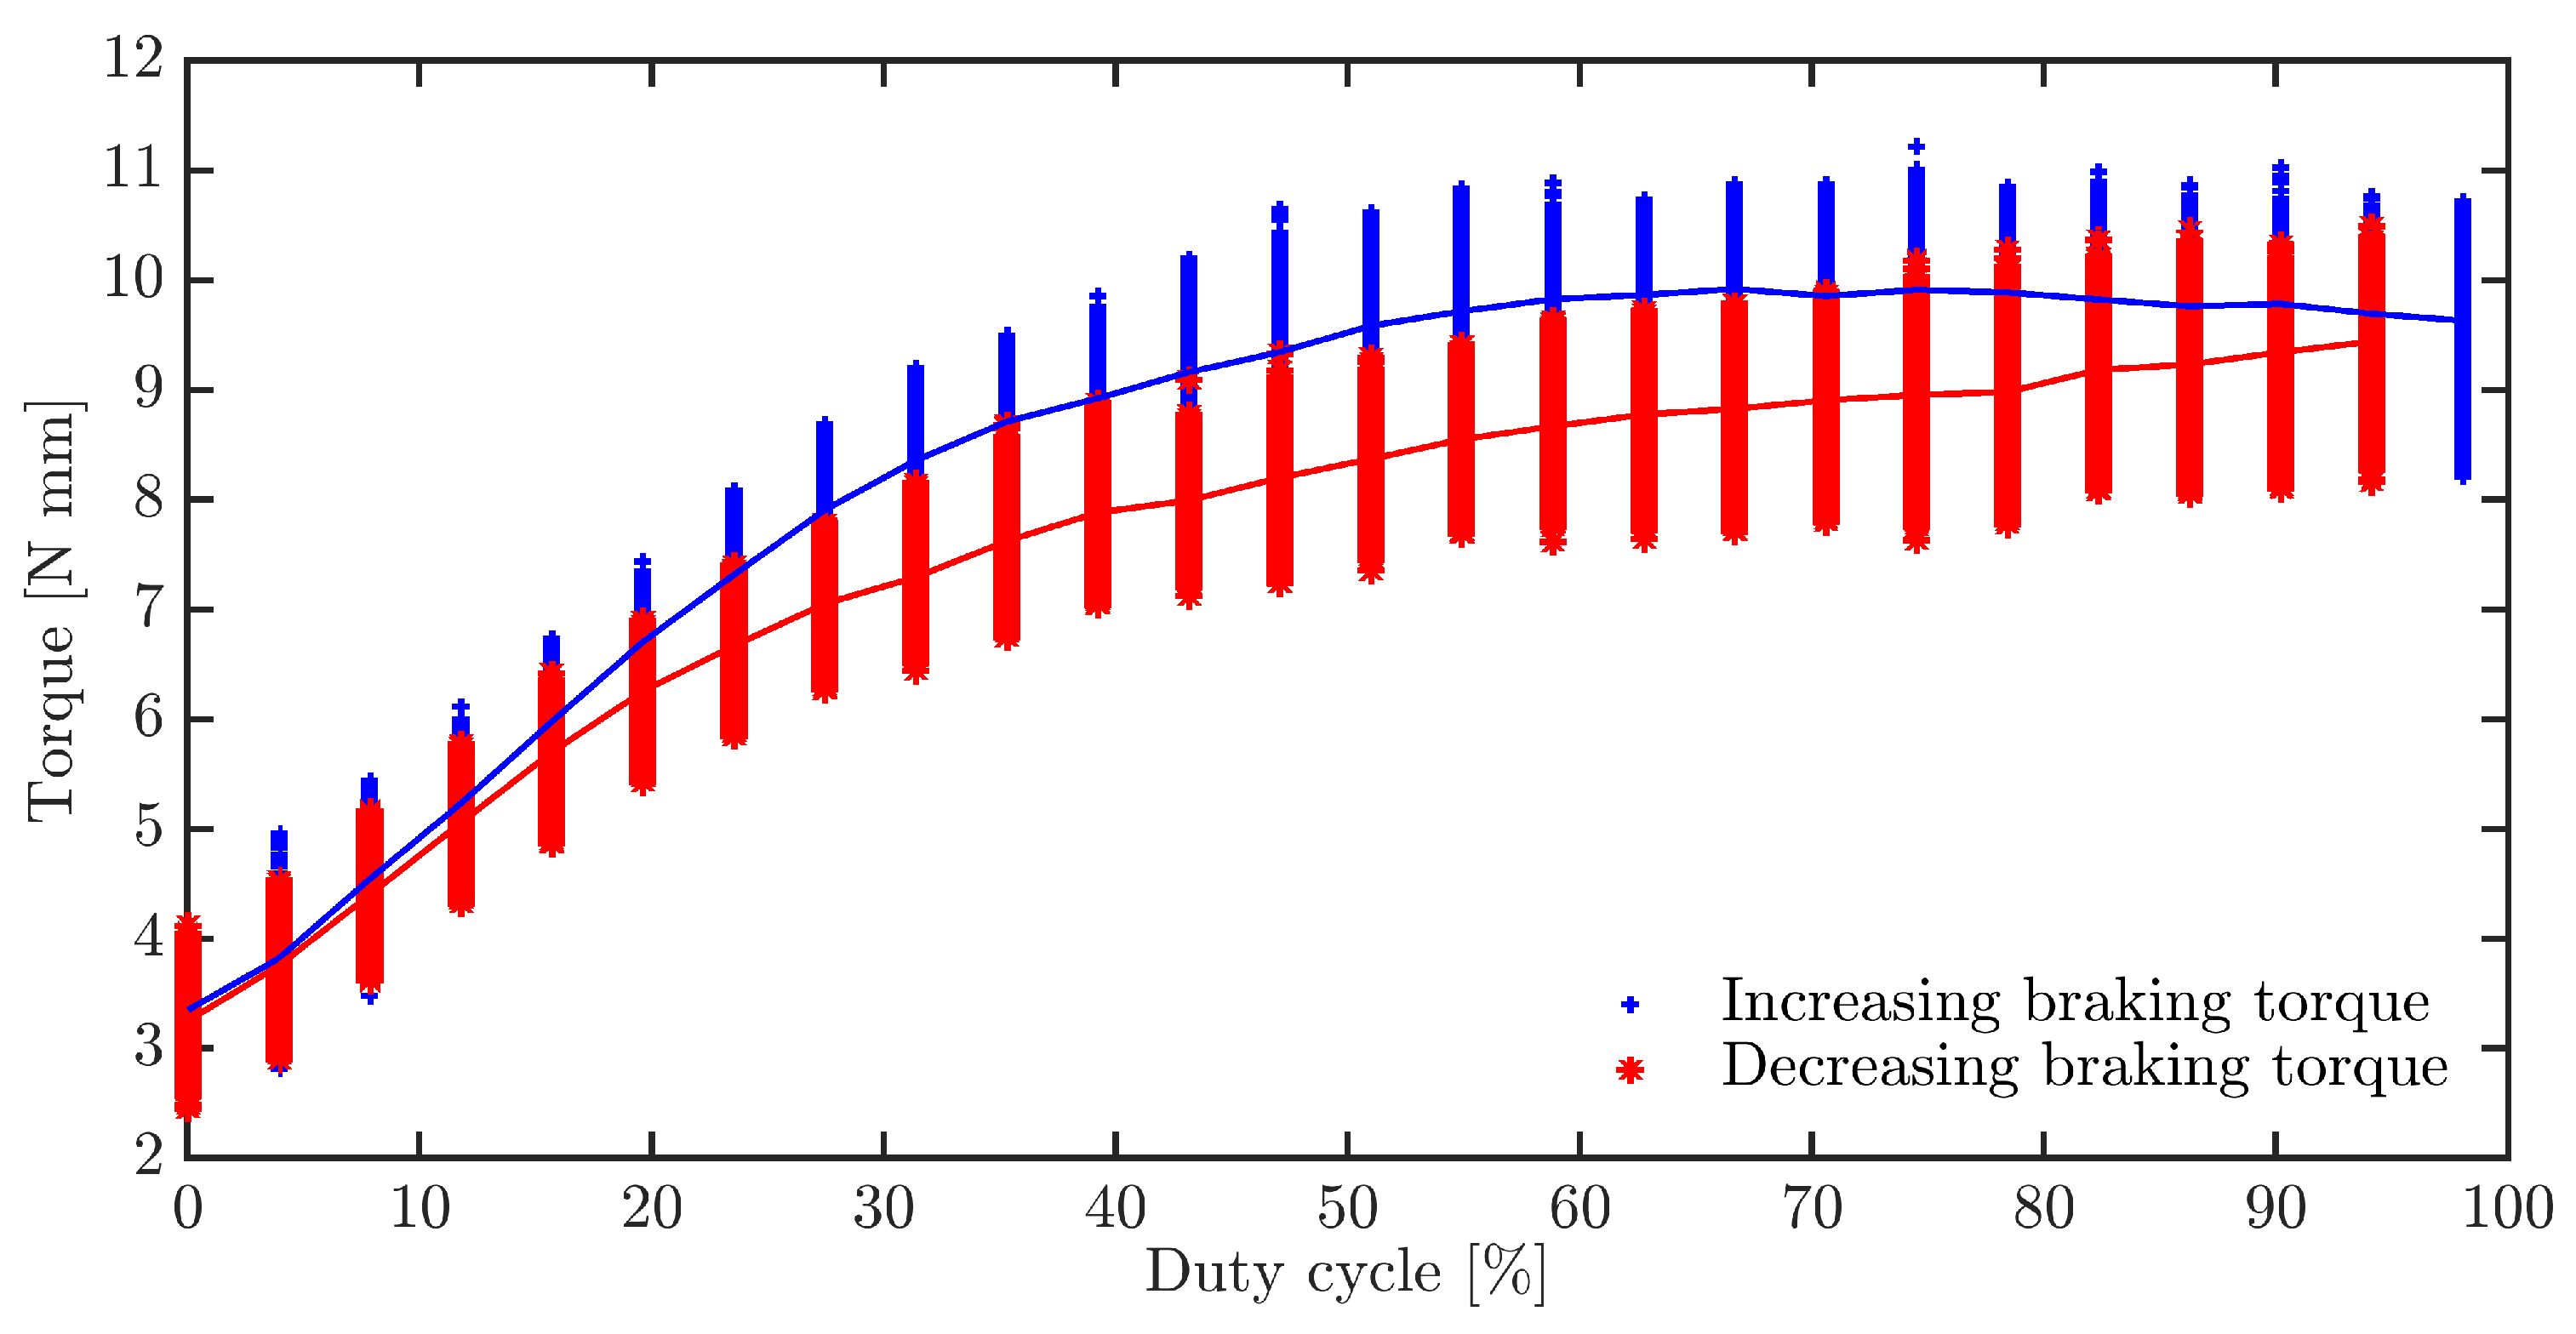
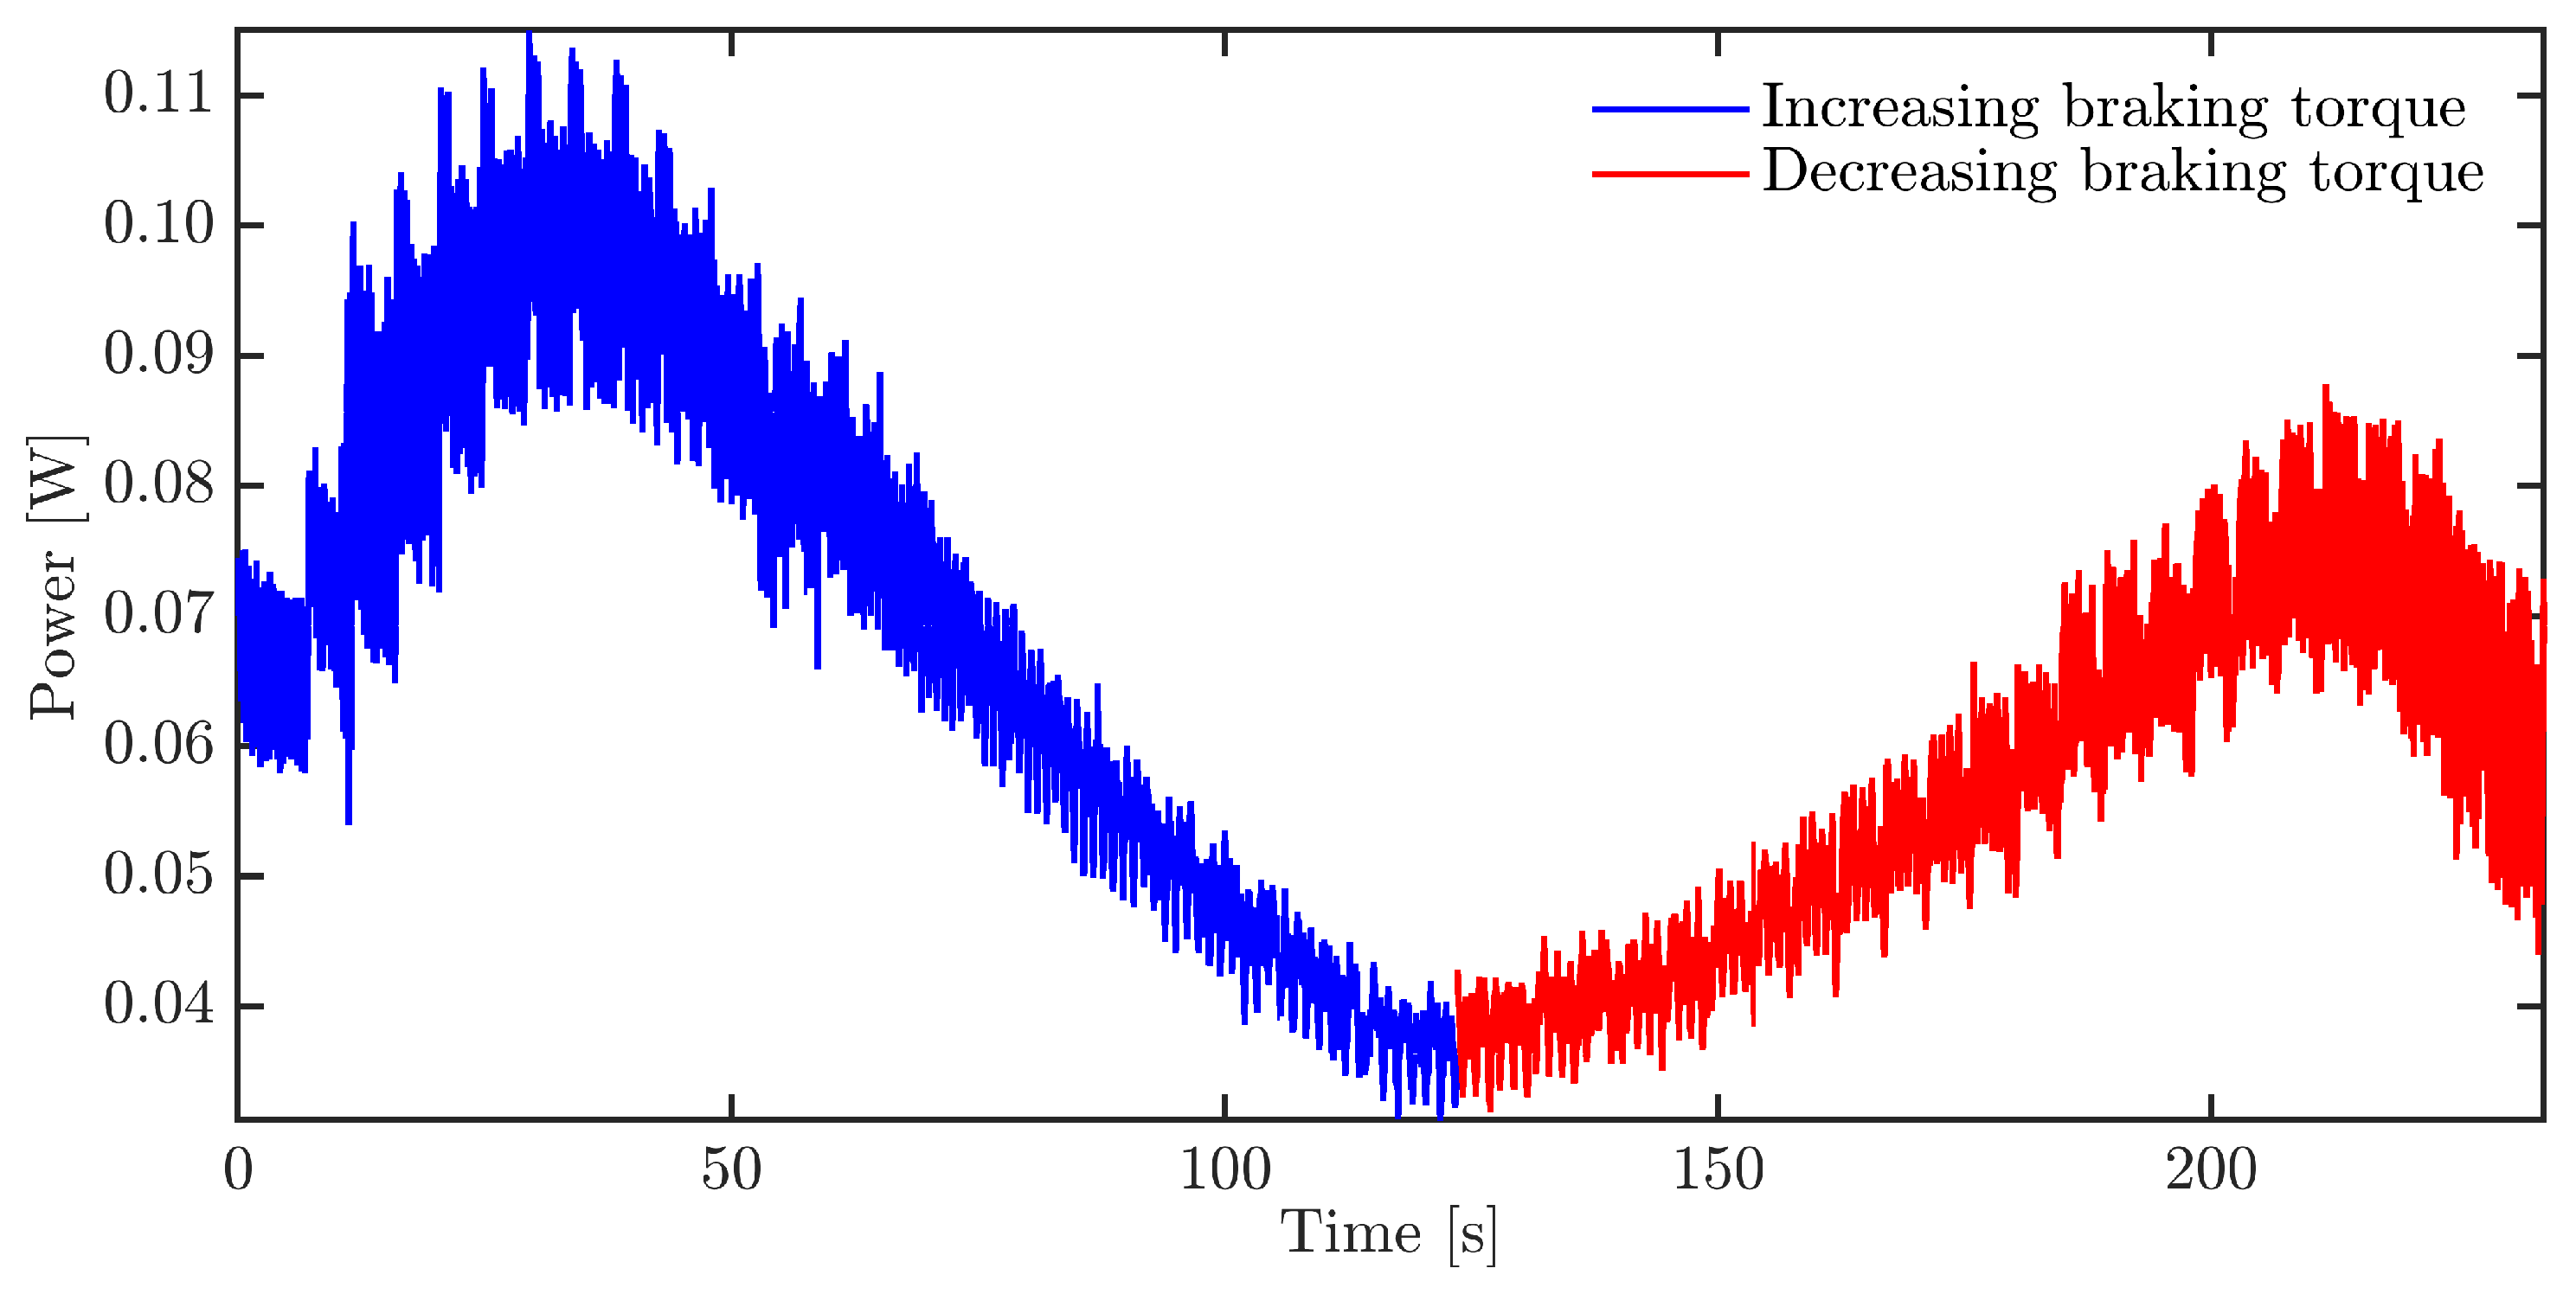
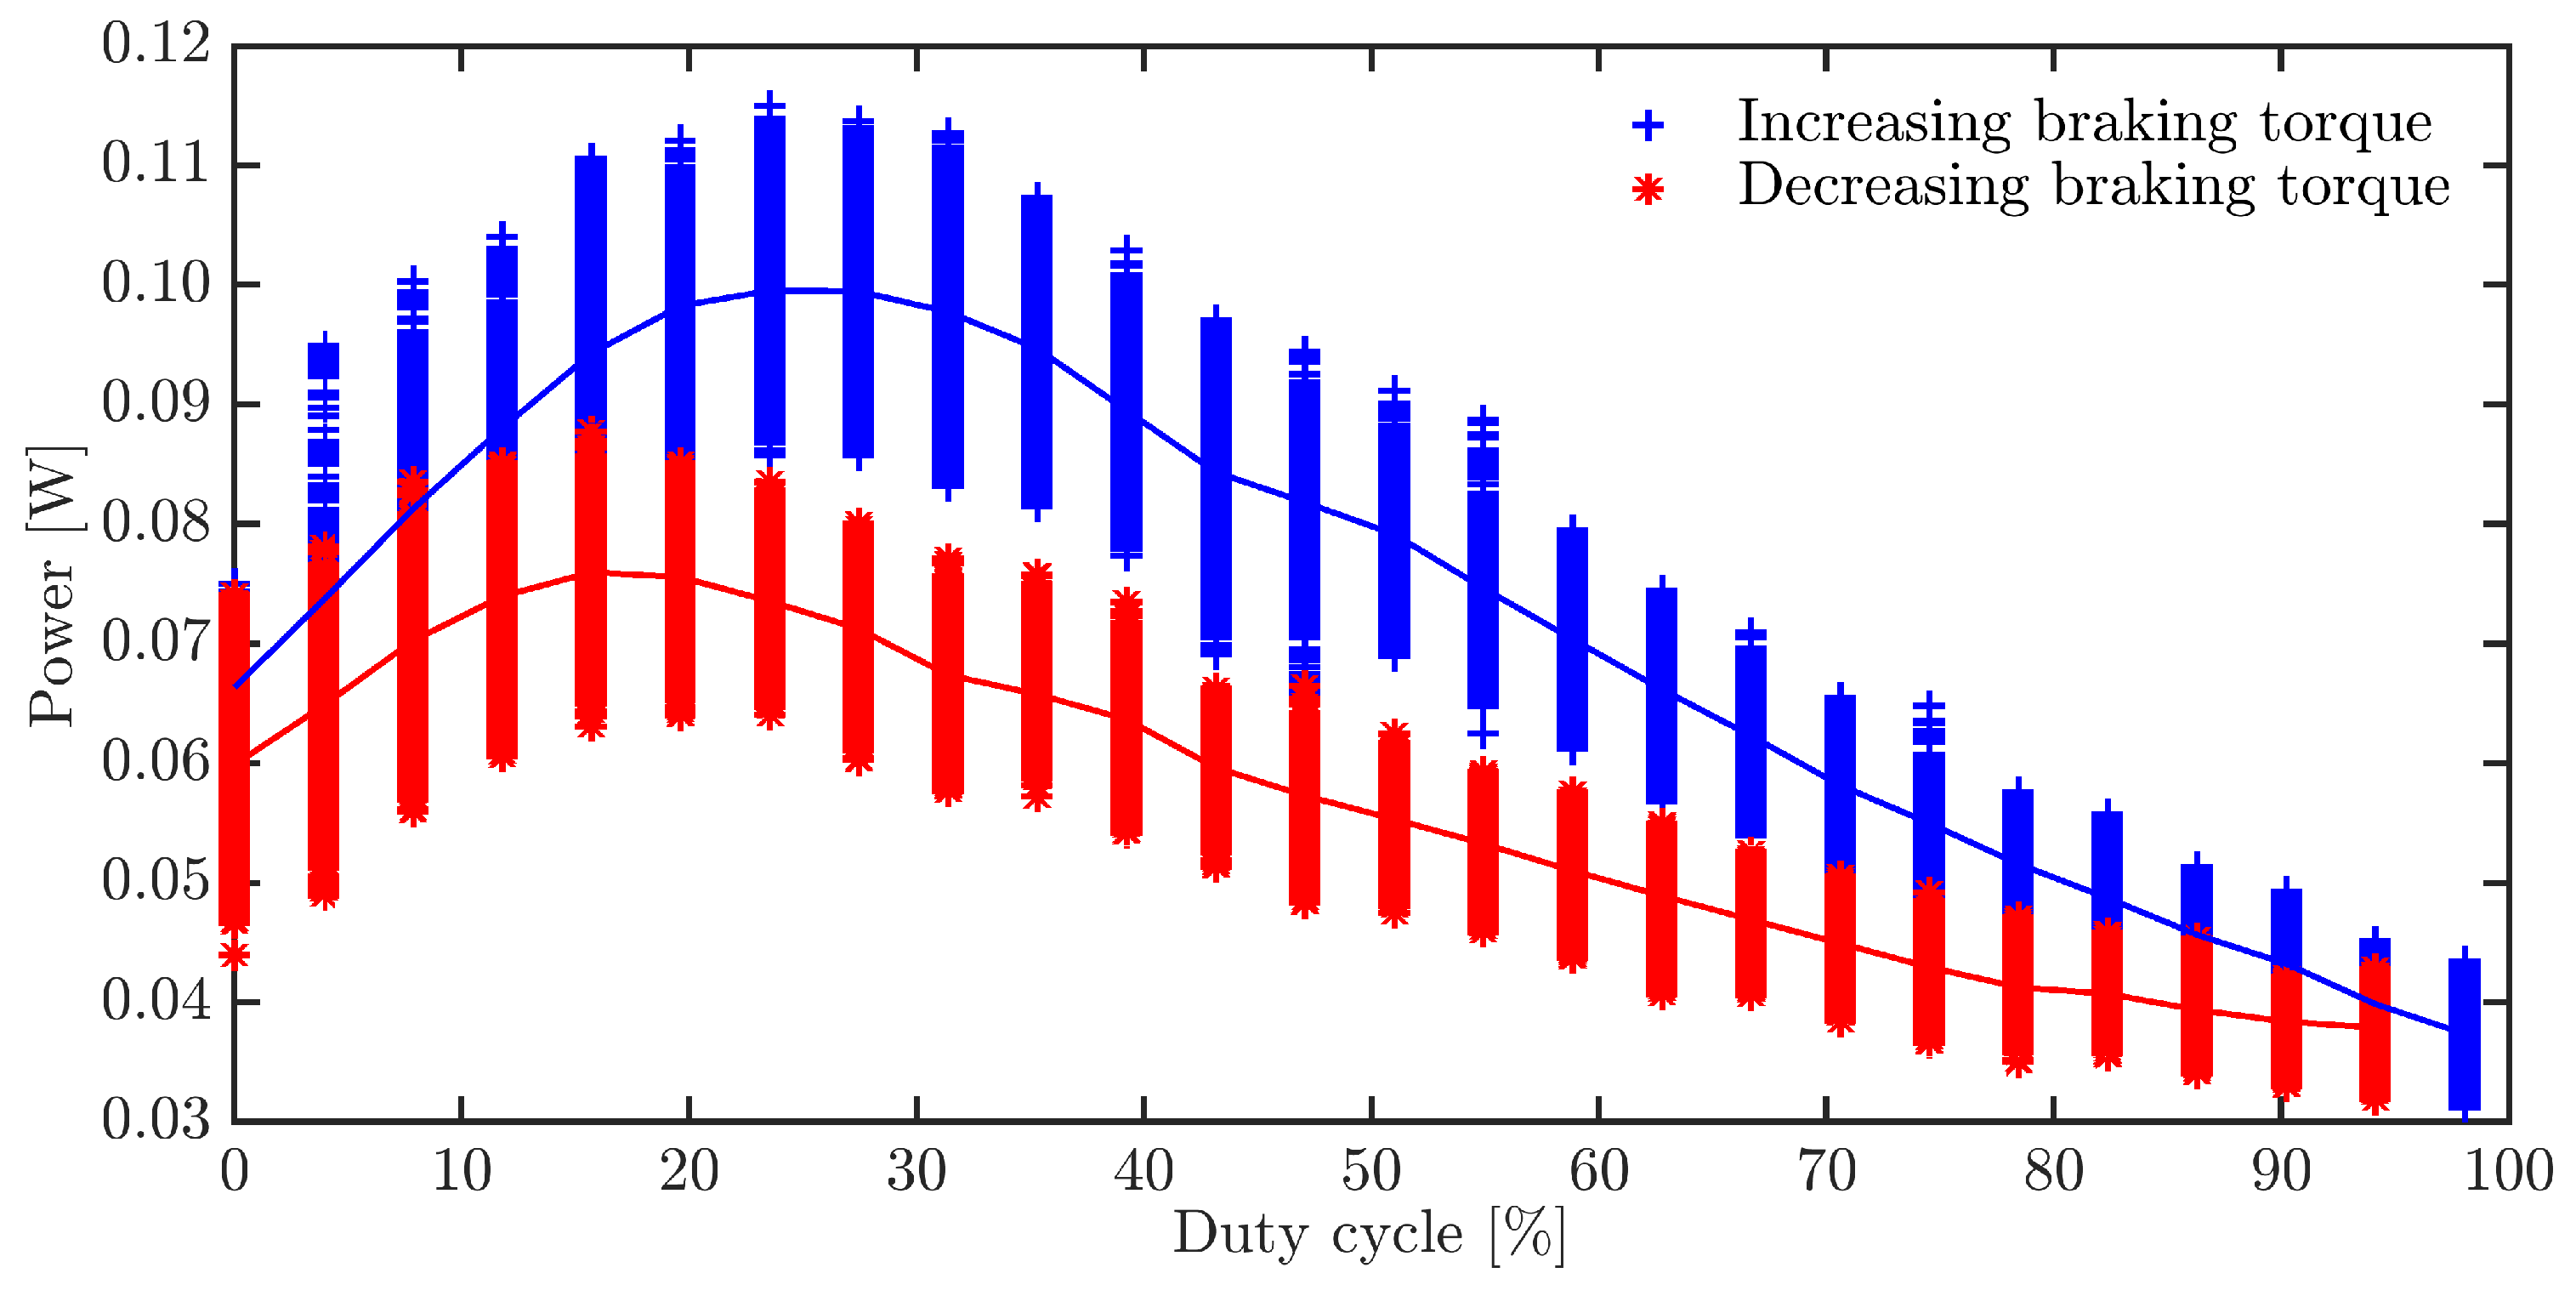
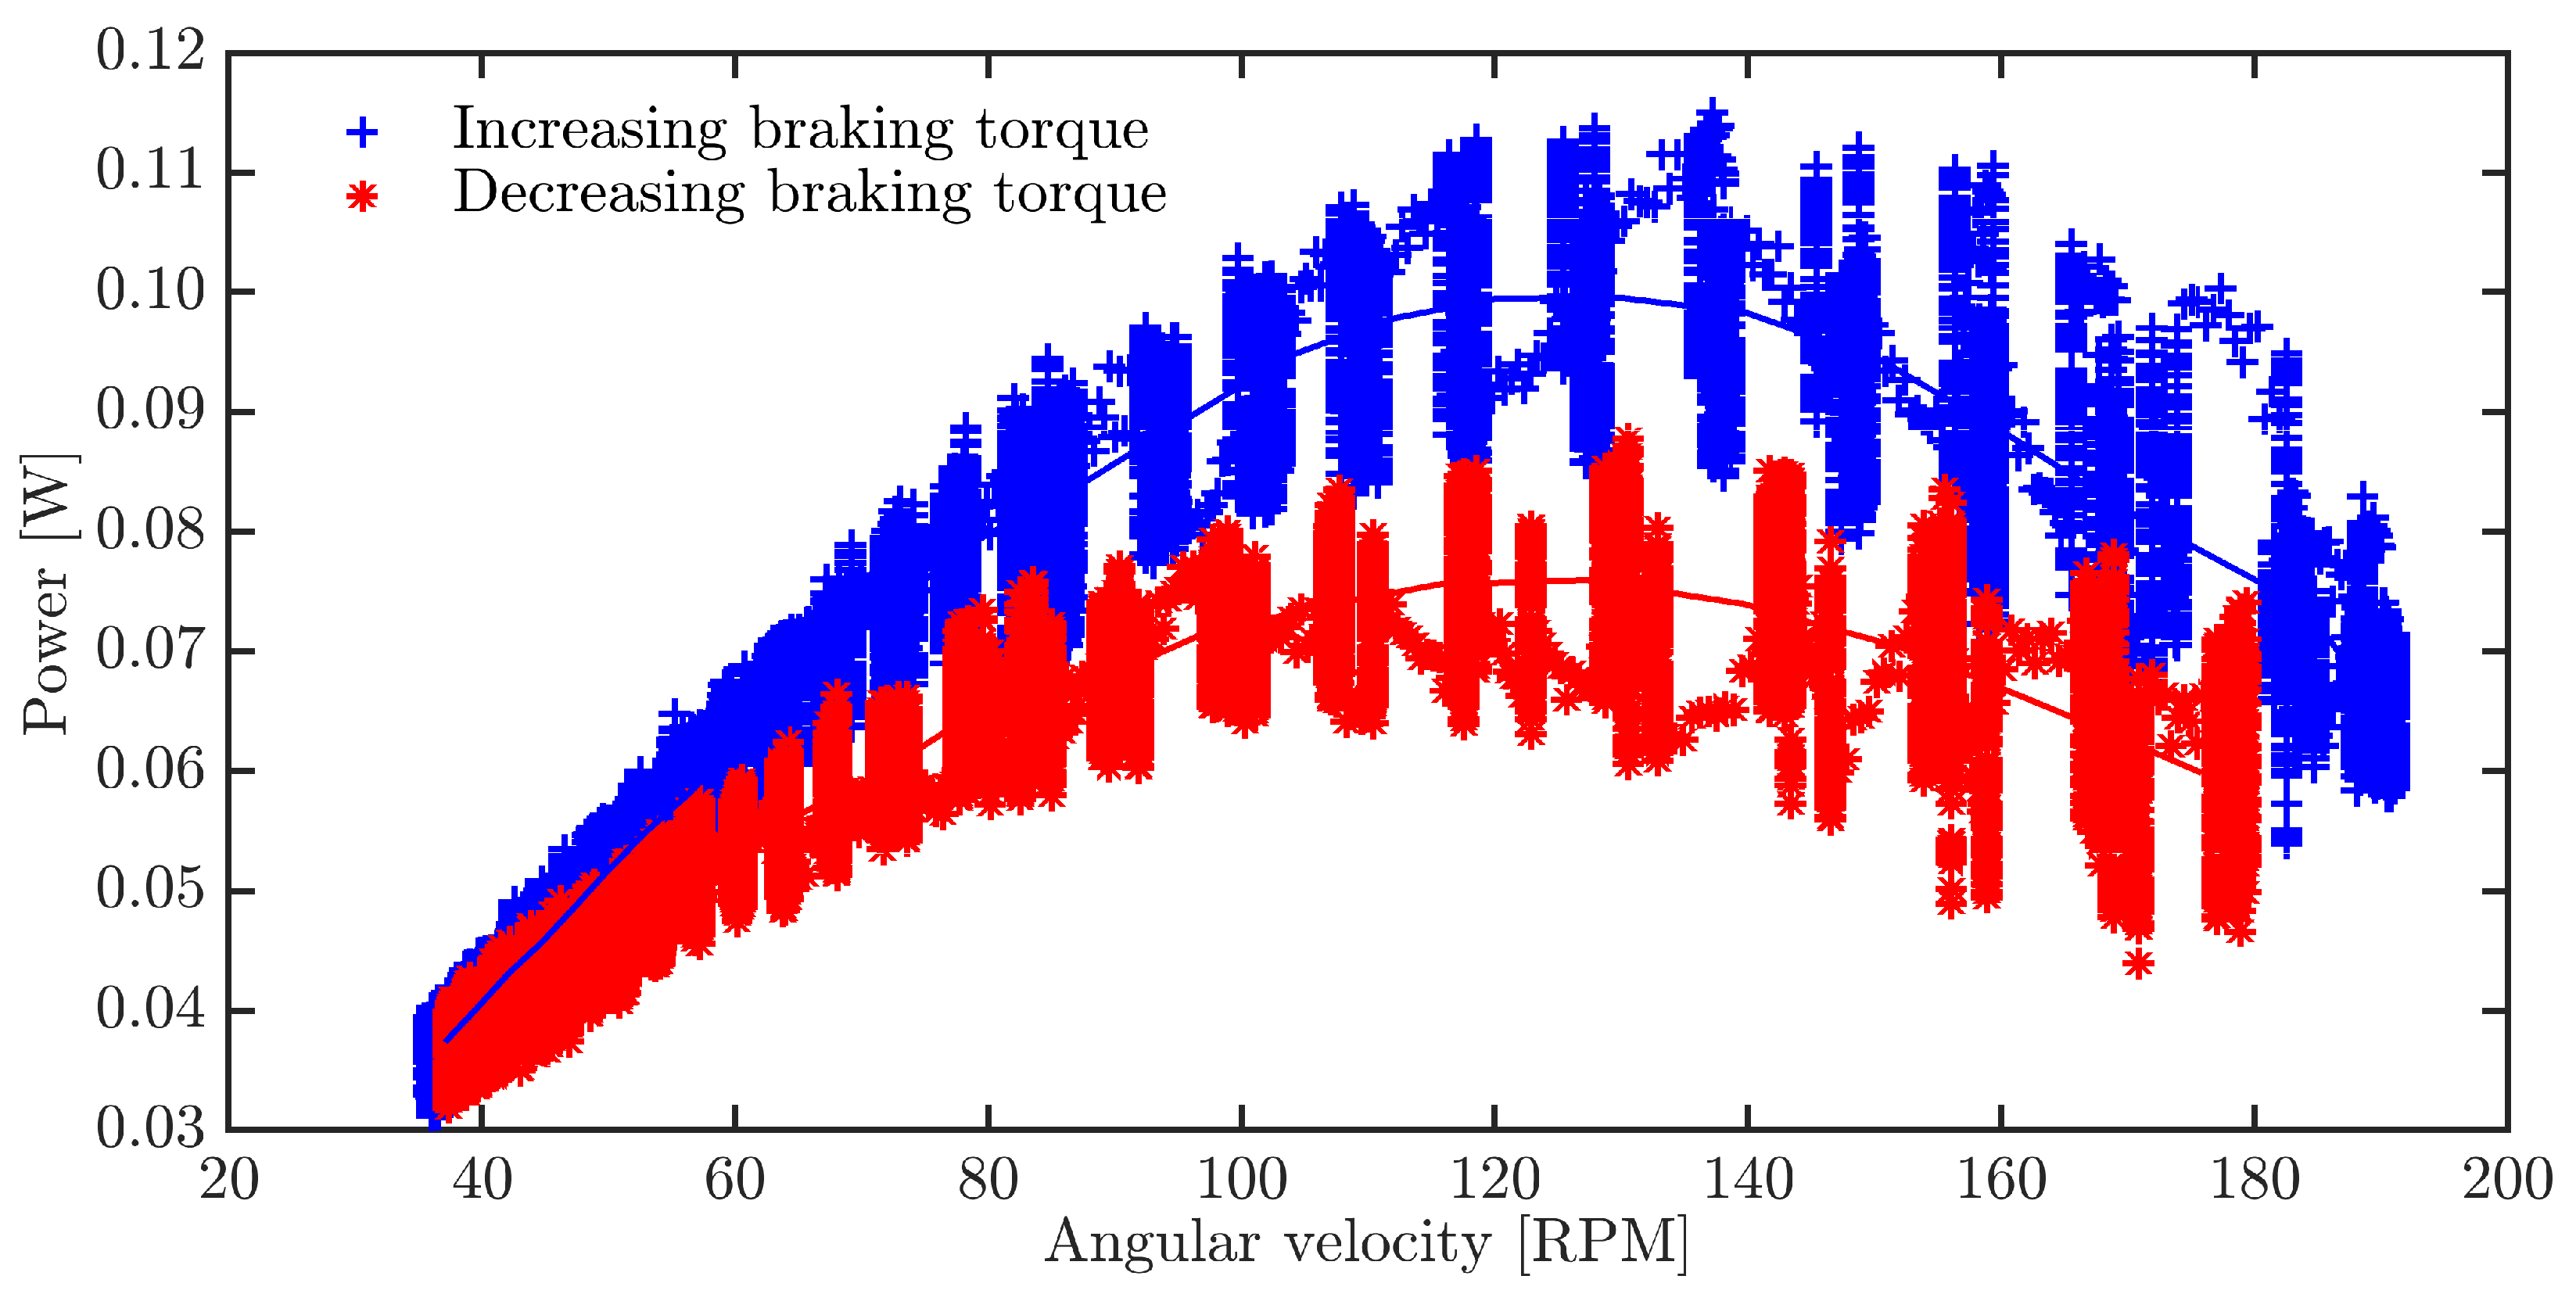
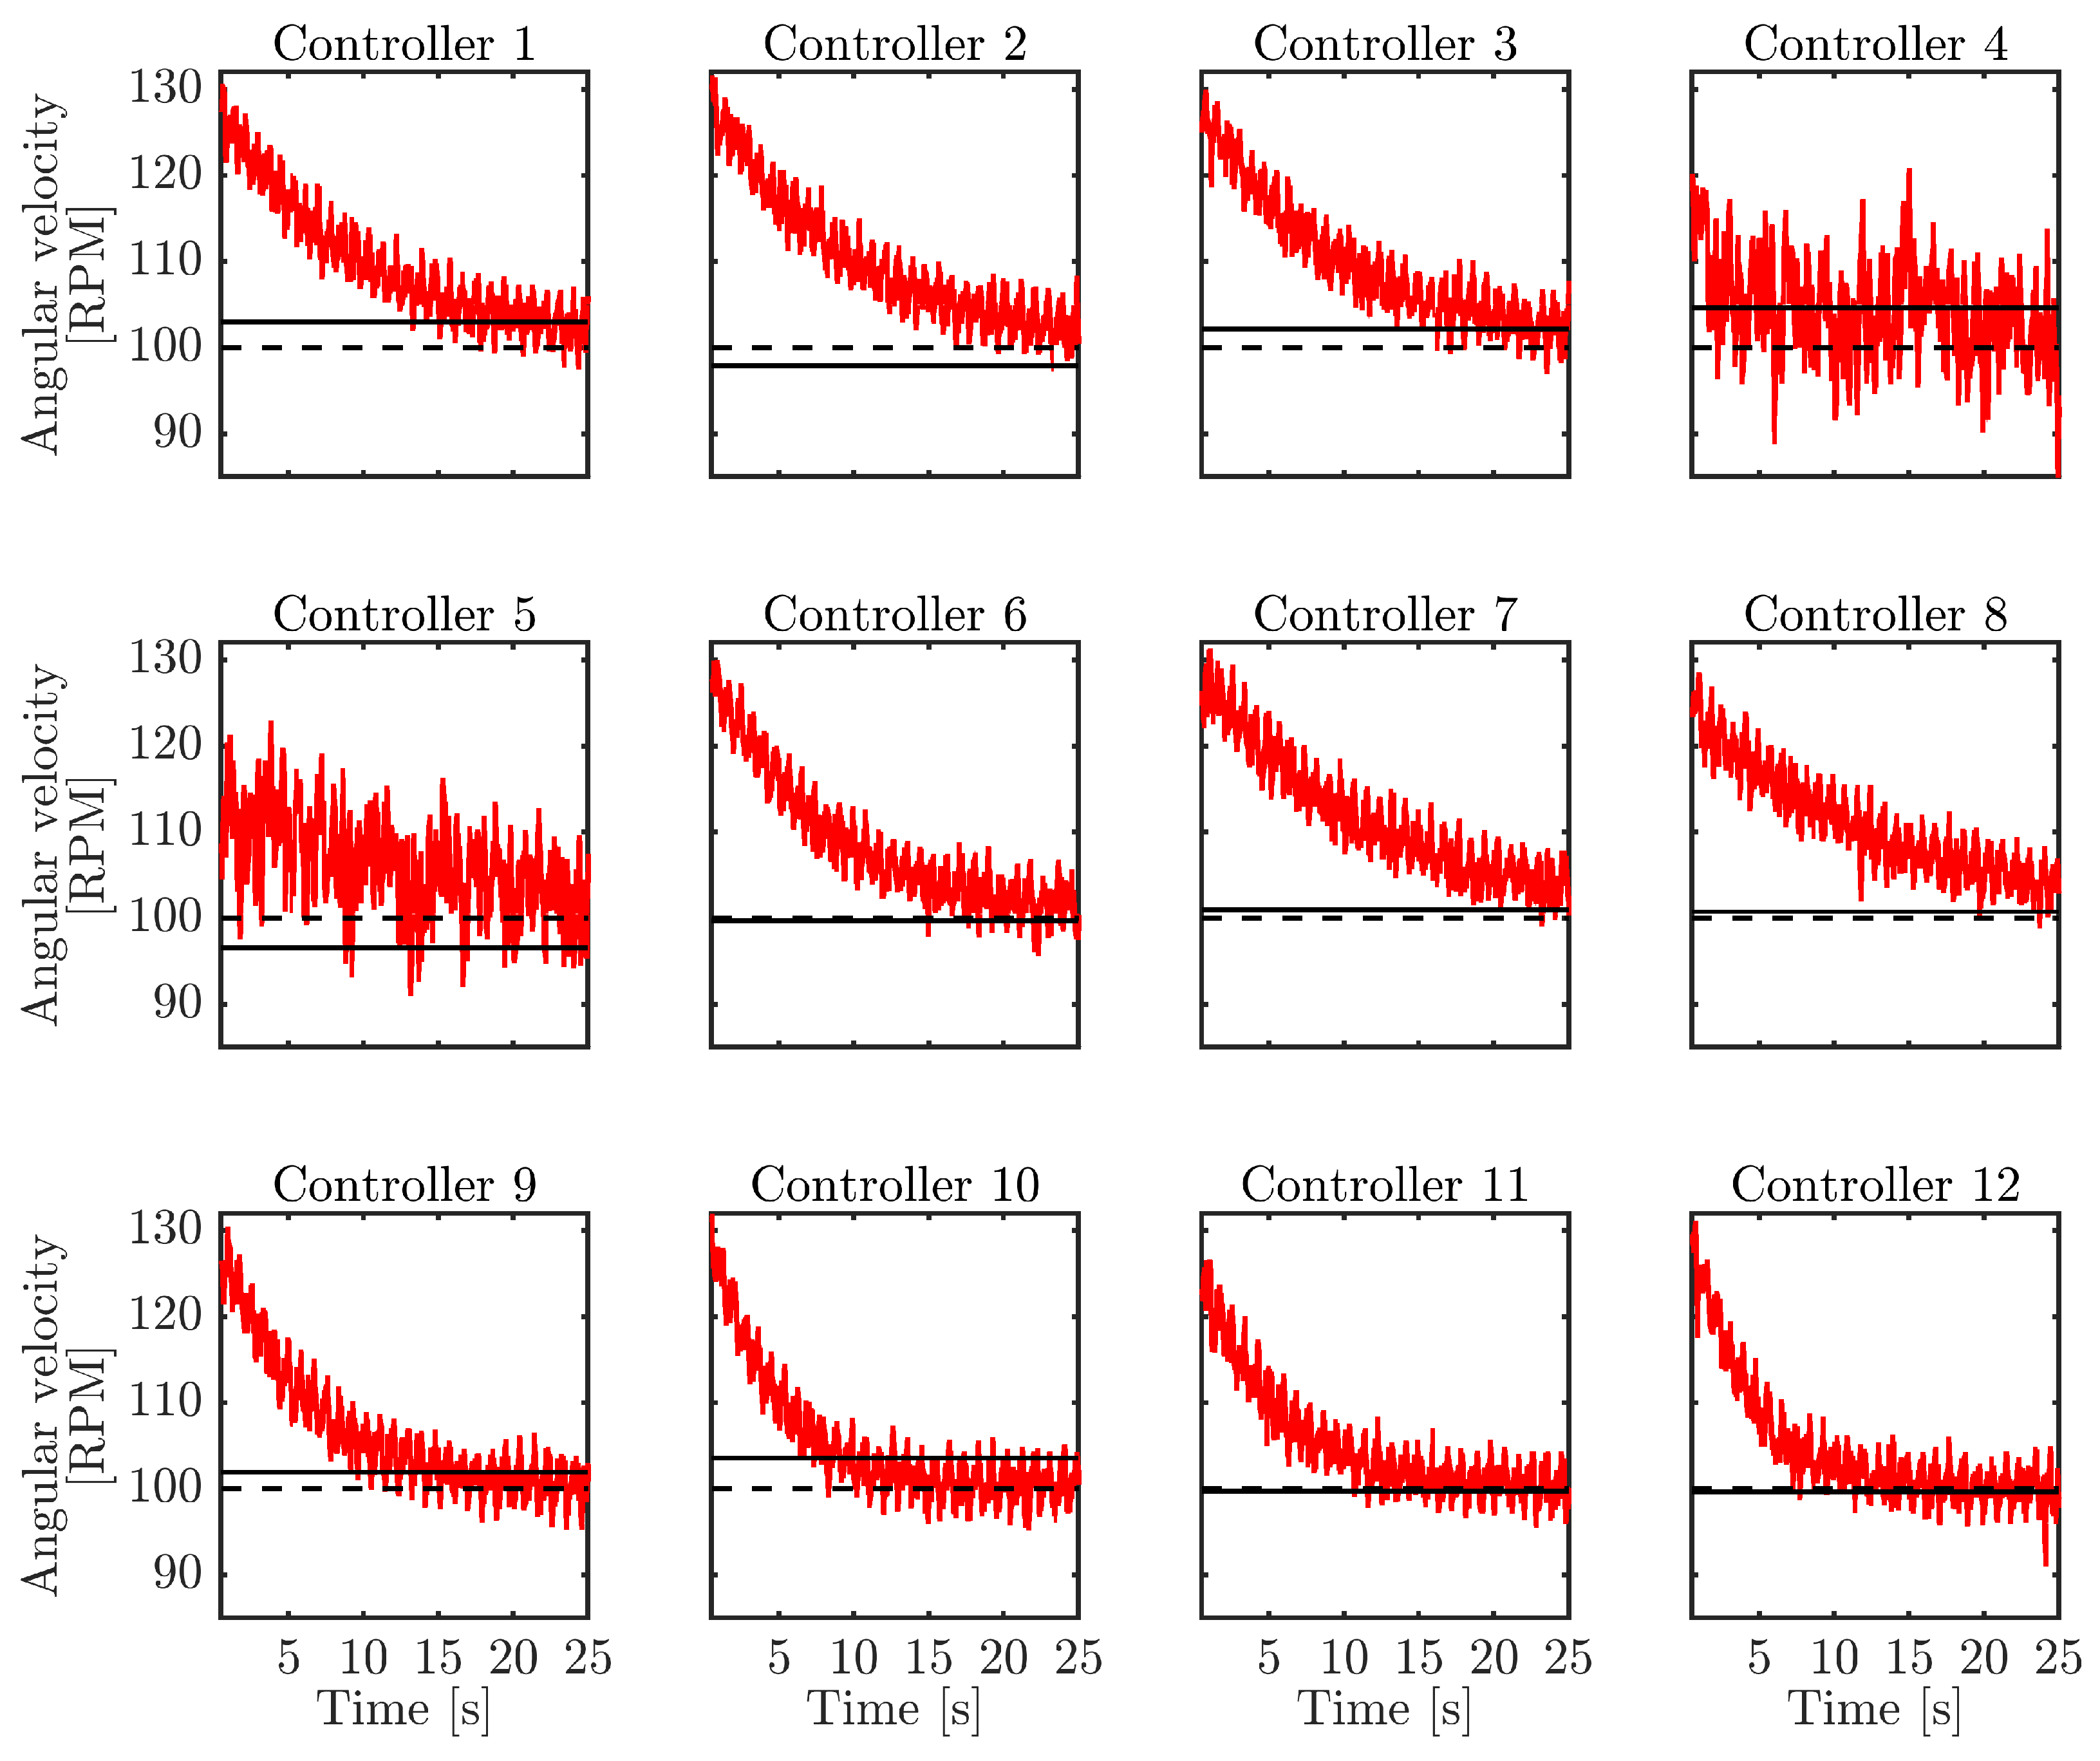
The relation between the measured T and ω values is shown in Figure 7 for the simulated turbine tests. As the braking torque increased/decreased, ω was decreased/increased and the torque was increased/decreased, respectively. Higher torques were achieved at lower speed when the braking torque was higher. Hysteresis was also evidenced in the dynamic of the braking system; the measured torque was higher when the braking motor initially increased in comparison with the second part of the test when the braking torque decreased. This behavior is commonly found in electrical motors due to the ferromagnetic materials used for its construction and its reactions when magnetized with the magnetic field. The braking motor was left with a remaining magnetic field that increased the braking torque for the same duty cycle value when it was decreased. The maximum measured torque of 9.9 Nmm was reached at 60 RPM and a minimum value of 3.4 Nmm was reached at 190 RPM. The variation of the angular velocity of the driving motor due to increasing and decreasing of the braking torque is shown in Figure 8. The angular velocity decreased/increased when the braking torque was increased/decreased, as it was expected. A non-linear relationship was presented between the angular velocity and the duty cycle applied to the braking motor. The hysteresis was observed to be more pronounced for lower values of the duty cycle when the braking torque was reduced. In this case, the remanent magnetic field generated a stronger braking torque that did not allow the driving motor to reach the initial velocity around 190 RPM. A similar behavior was observed in the relationship between the measured torque and the duty cycle applied to the braking motor, as observed in Figure 9. A non-linear relationship was observed between those variables. Initially, the measured torque increased with the braking torque, reaching an average peak value of 9.9 Nmm at a duty cycle of approximately 67%. Subsequently, the measured torque slightly decreased to 9.6 Nmm. As the braking torque was reduced, the measured torque also declined, falling below the values observed during the torque increase, and eventually returning to the initial level. This indicates hysteresis, as the measured torque did not follow the same path when decreasing the braking torque. The mechanical power generated by the driving motor on the shaft of the torque transducer was calculated by multiplying the measured torque by the angular velocity. The behavior of the mechanical power during the test is depicted in Figure 10. Initially, the power fluctuated in tandem with the braking torque, and a peak value of approximately 0.1 W was reached. Beyond this point, the power decreased steadily as the braking torque increased, and a minimum of around 0.03 W was found. As the braking torque was reduced, the power rose again, reaching a maximum of about 0.075 W before starting to decrease once. The difference between the maximum values obtained during the increase and decrease of the braking torque is attributed to the hysteresis effect observed in the measured torque and angular velocity, as explained previously. A maximum mechanical power was registered for duty cycle values between 23.5% and 27.4% and angular velocities between 120 and 129 RPM, when the braking torque increased, as depicted in Figure 11 and Figure 12. As the braking torque decreased, the maximum power value was reached for a duty cycle around 15.7% and 127 RPM. After the maximum power values were reached, it decreased almost in a linear relationship with the duty cycle when the braking torque was increased. Furthermore, it increased in the same way as the braking torque was decreased. To determine the PID controller that would provide an optimal response for the braking system in terms of the time stabilization and the steady-state error reduction, various sets of PID control gains were tested. The values of the PID control gains used are listed in Table 1. The closed-loop responses of the angular velocity behavior from 0.5 to 25 s for the different controllers tested are shown in Figure 13. The closed-loop responses for controllers 4 and 5 exhibited a greater variability due to the high derivative gain values used. Therefore, these values were excluded from further analysis. Most of the closed-loop responses showed an overshoot of around 30% and a settling time exceeding 10 s. From these results, controller 12 demonstrated the shortest settling time and minimized the ITAE criterion, as compiled in Table 2.
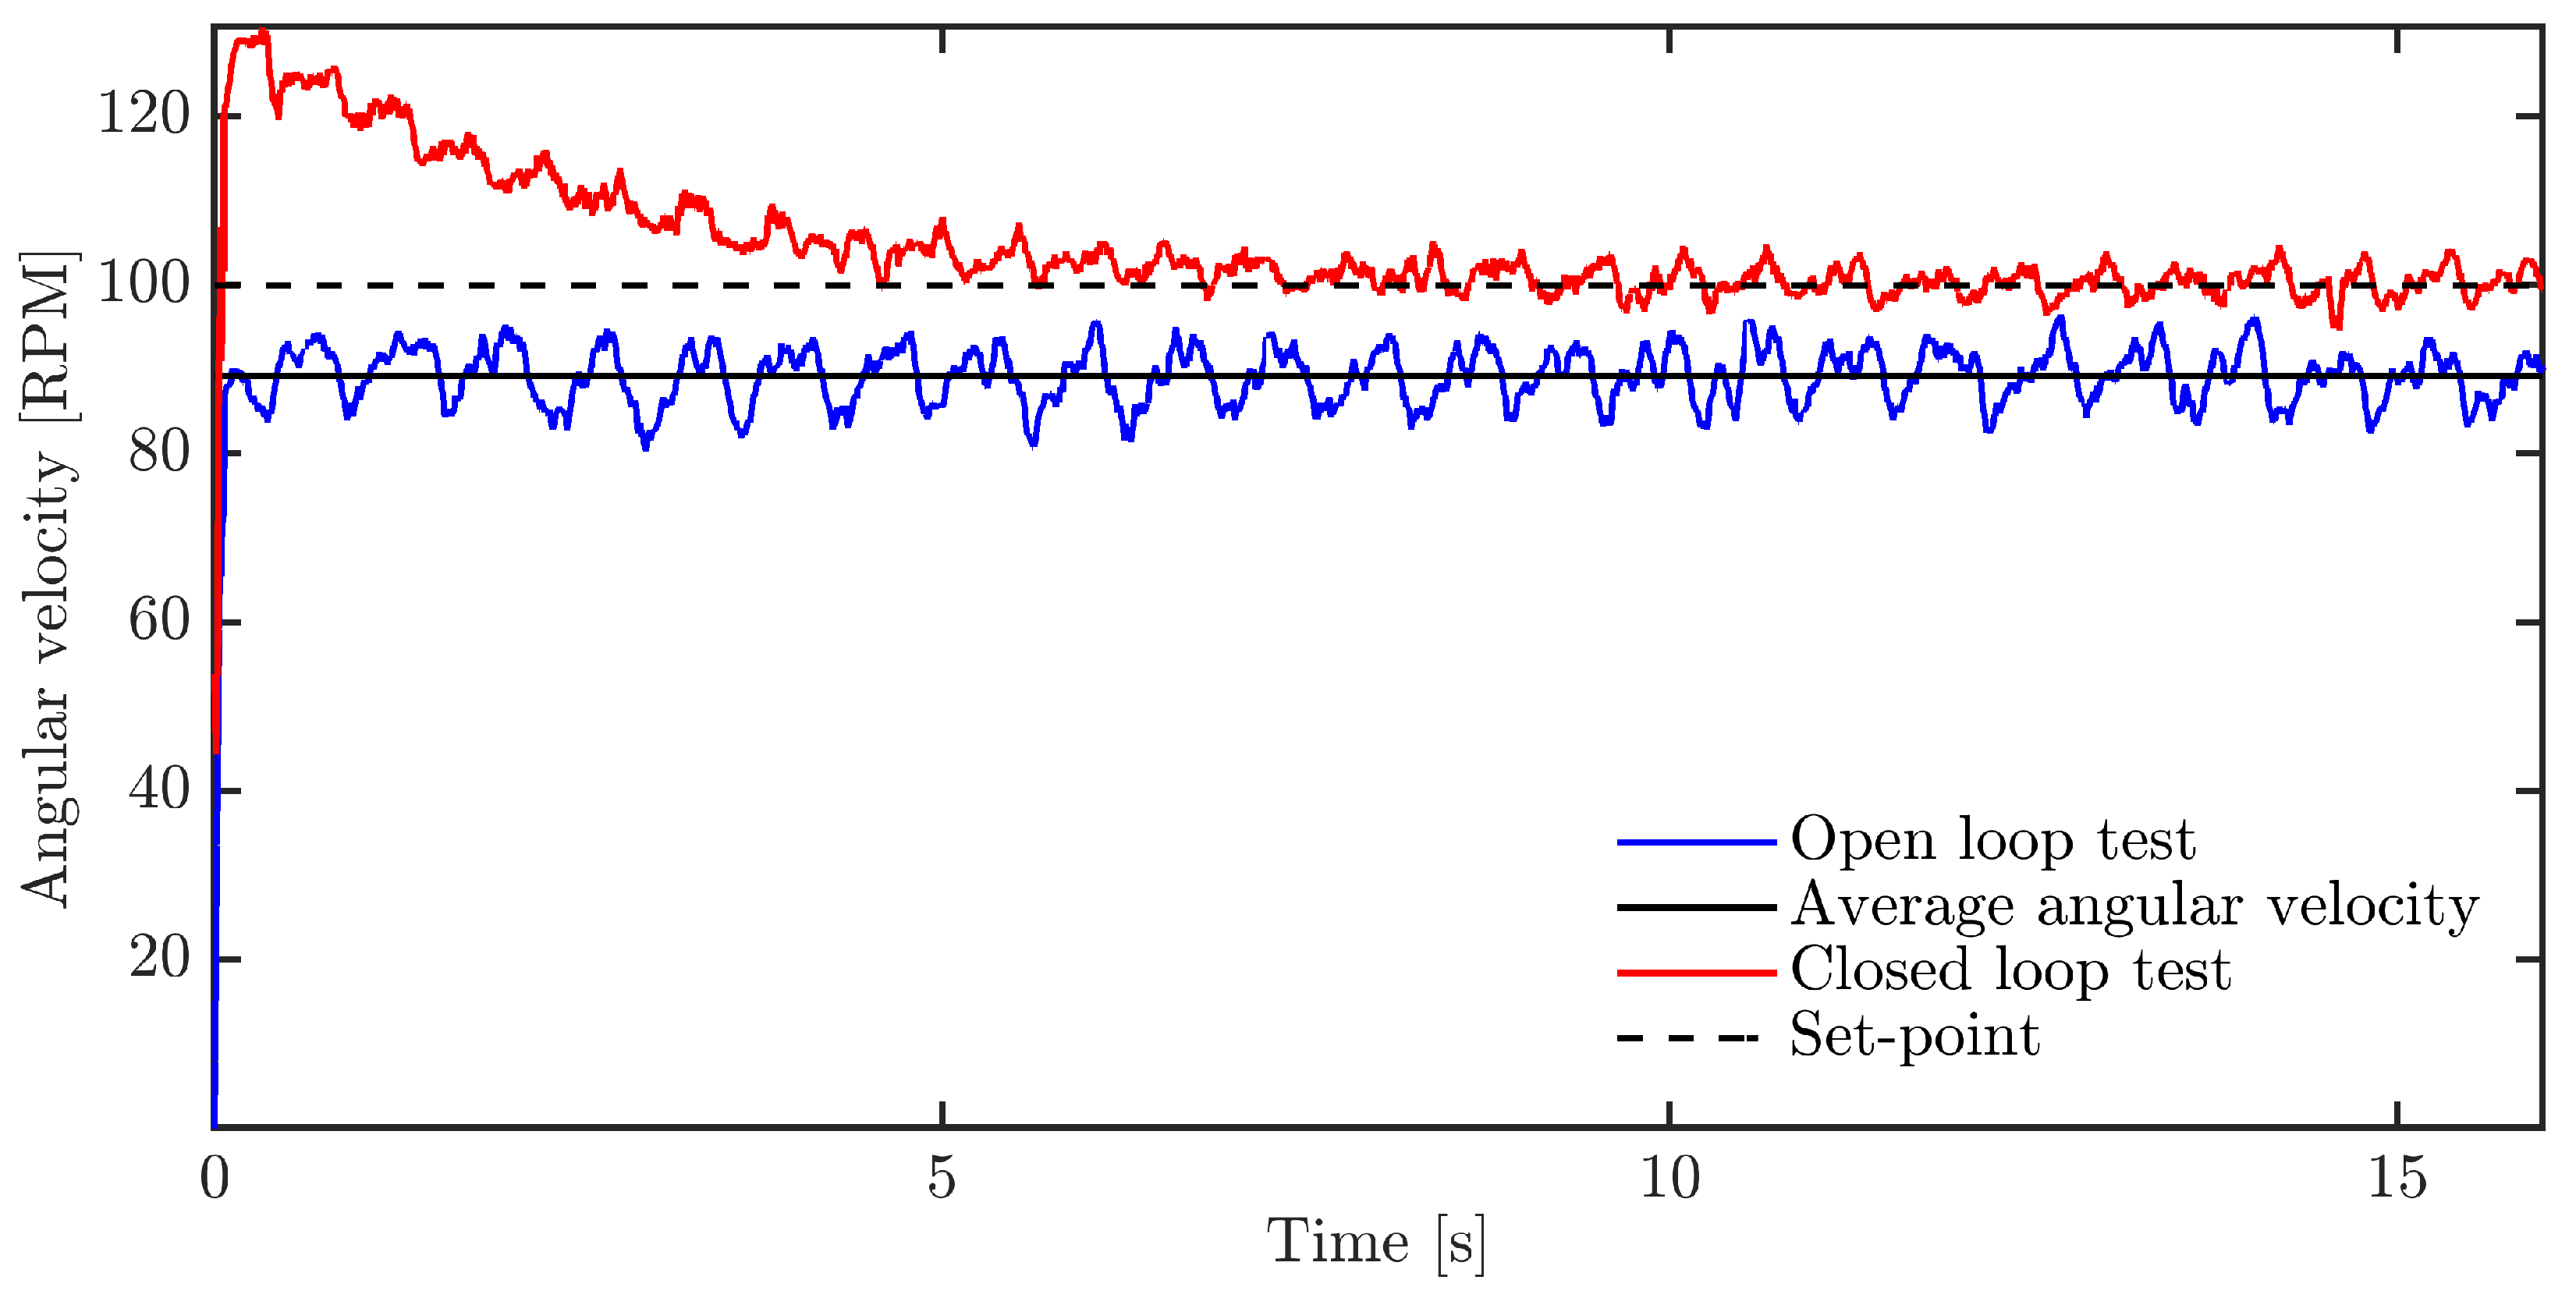
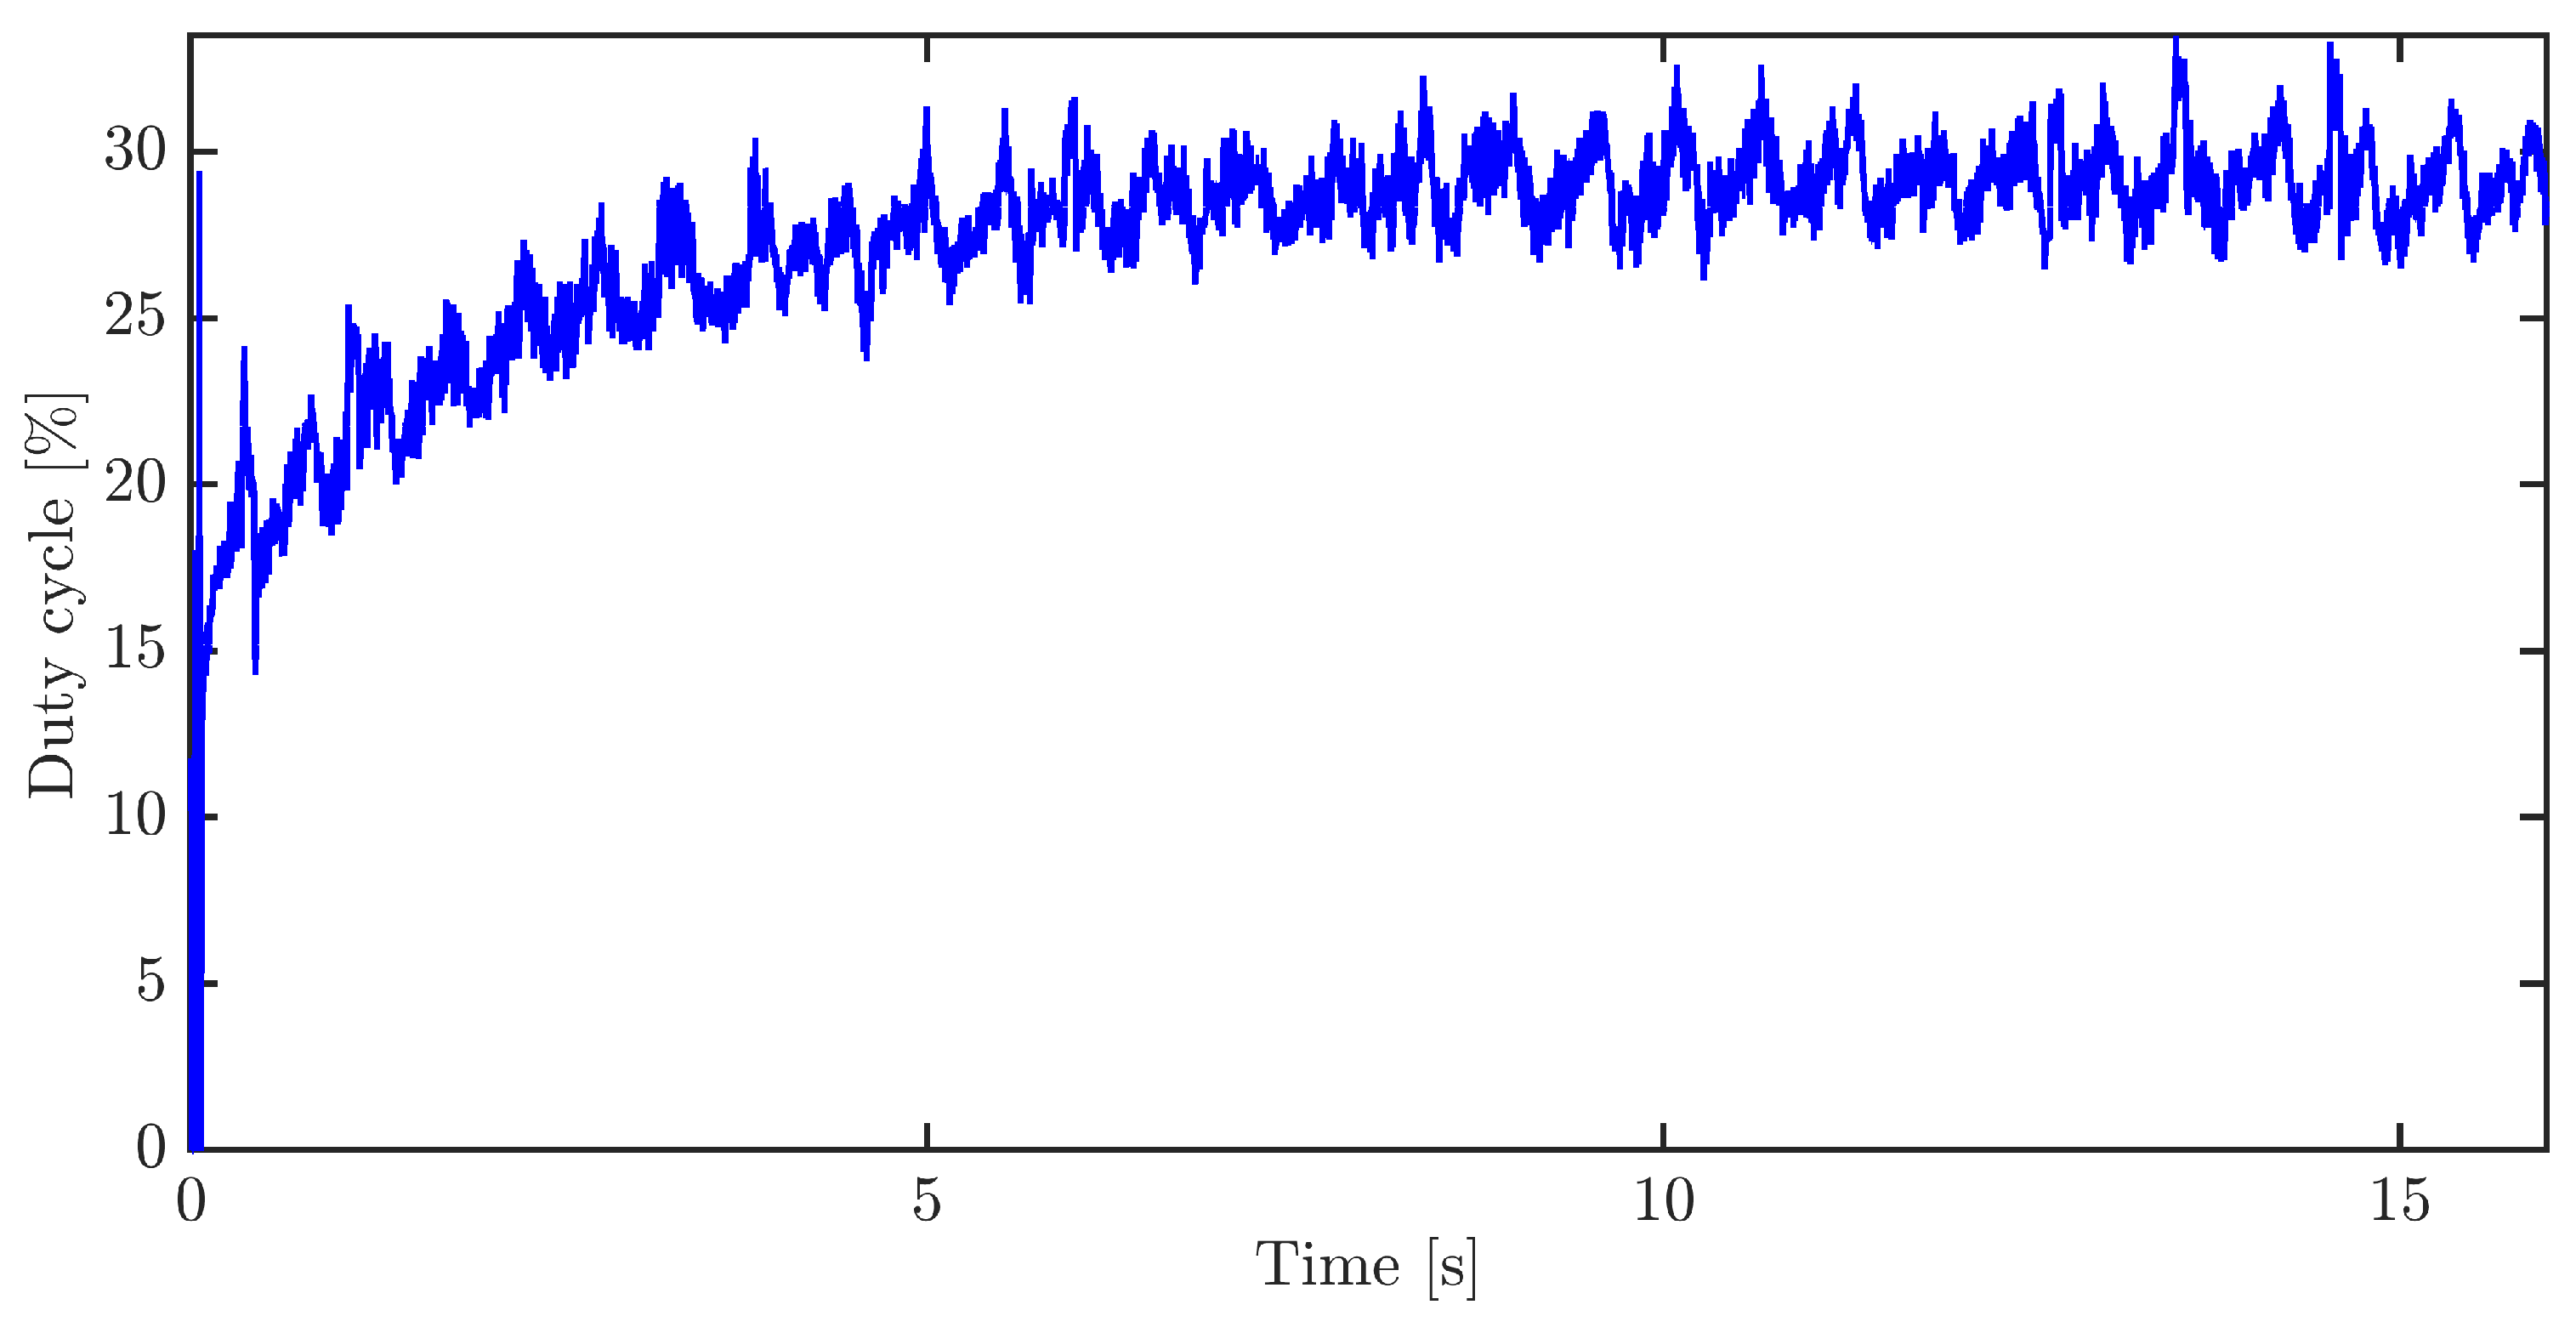
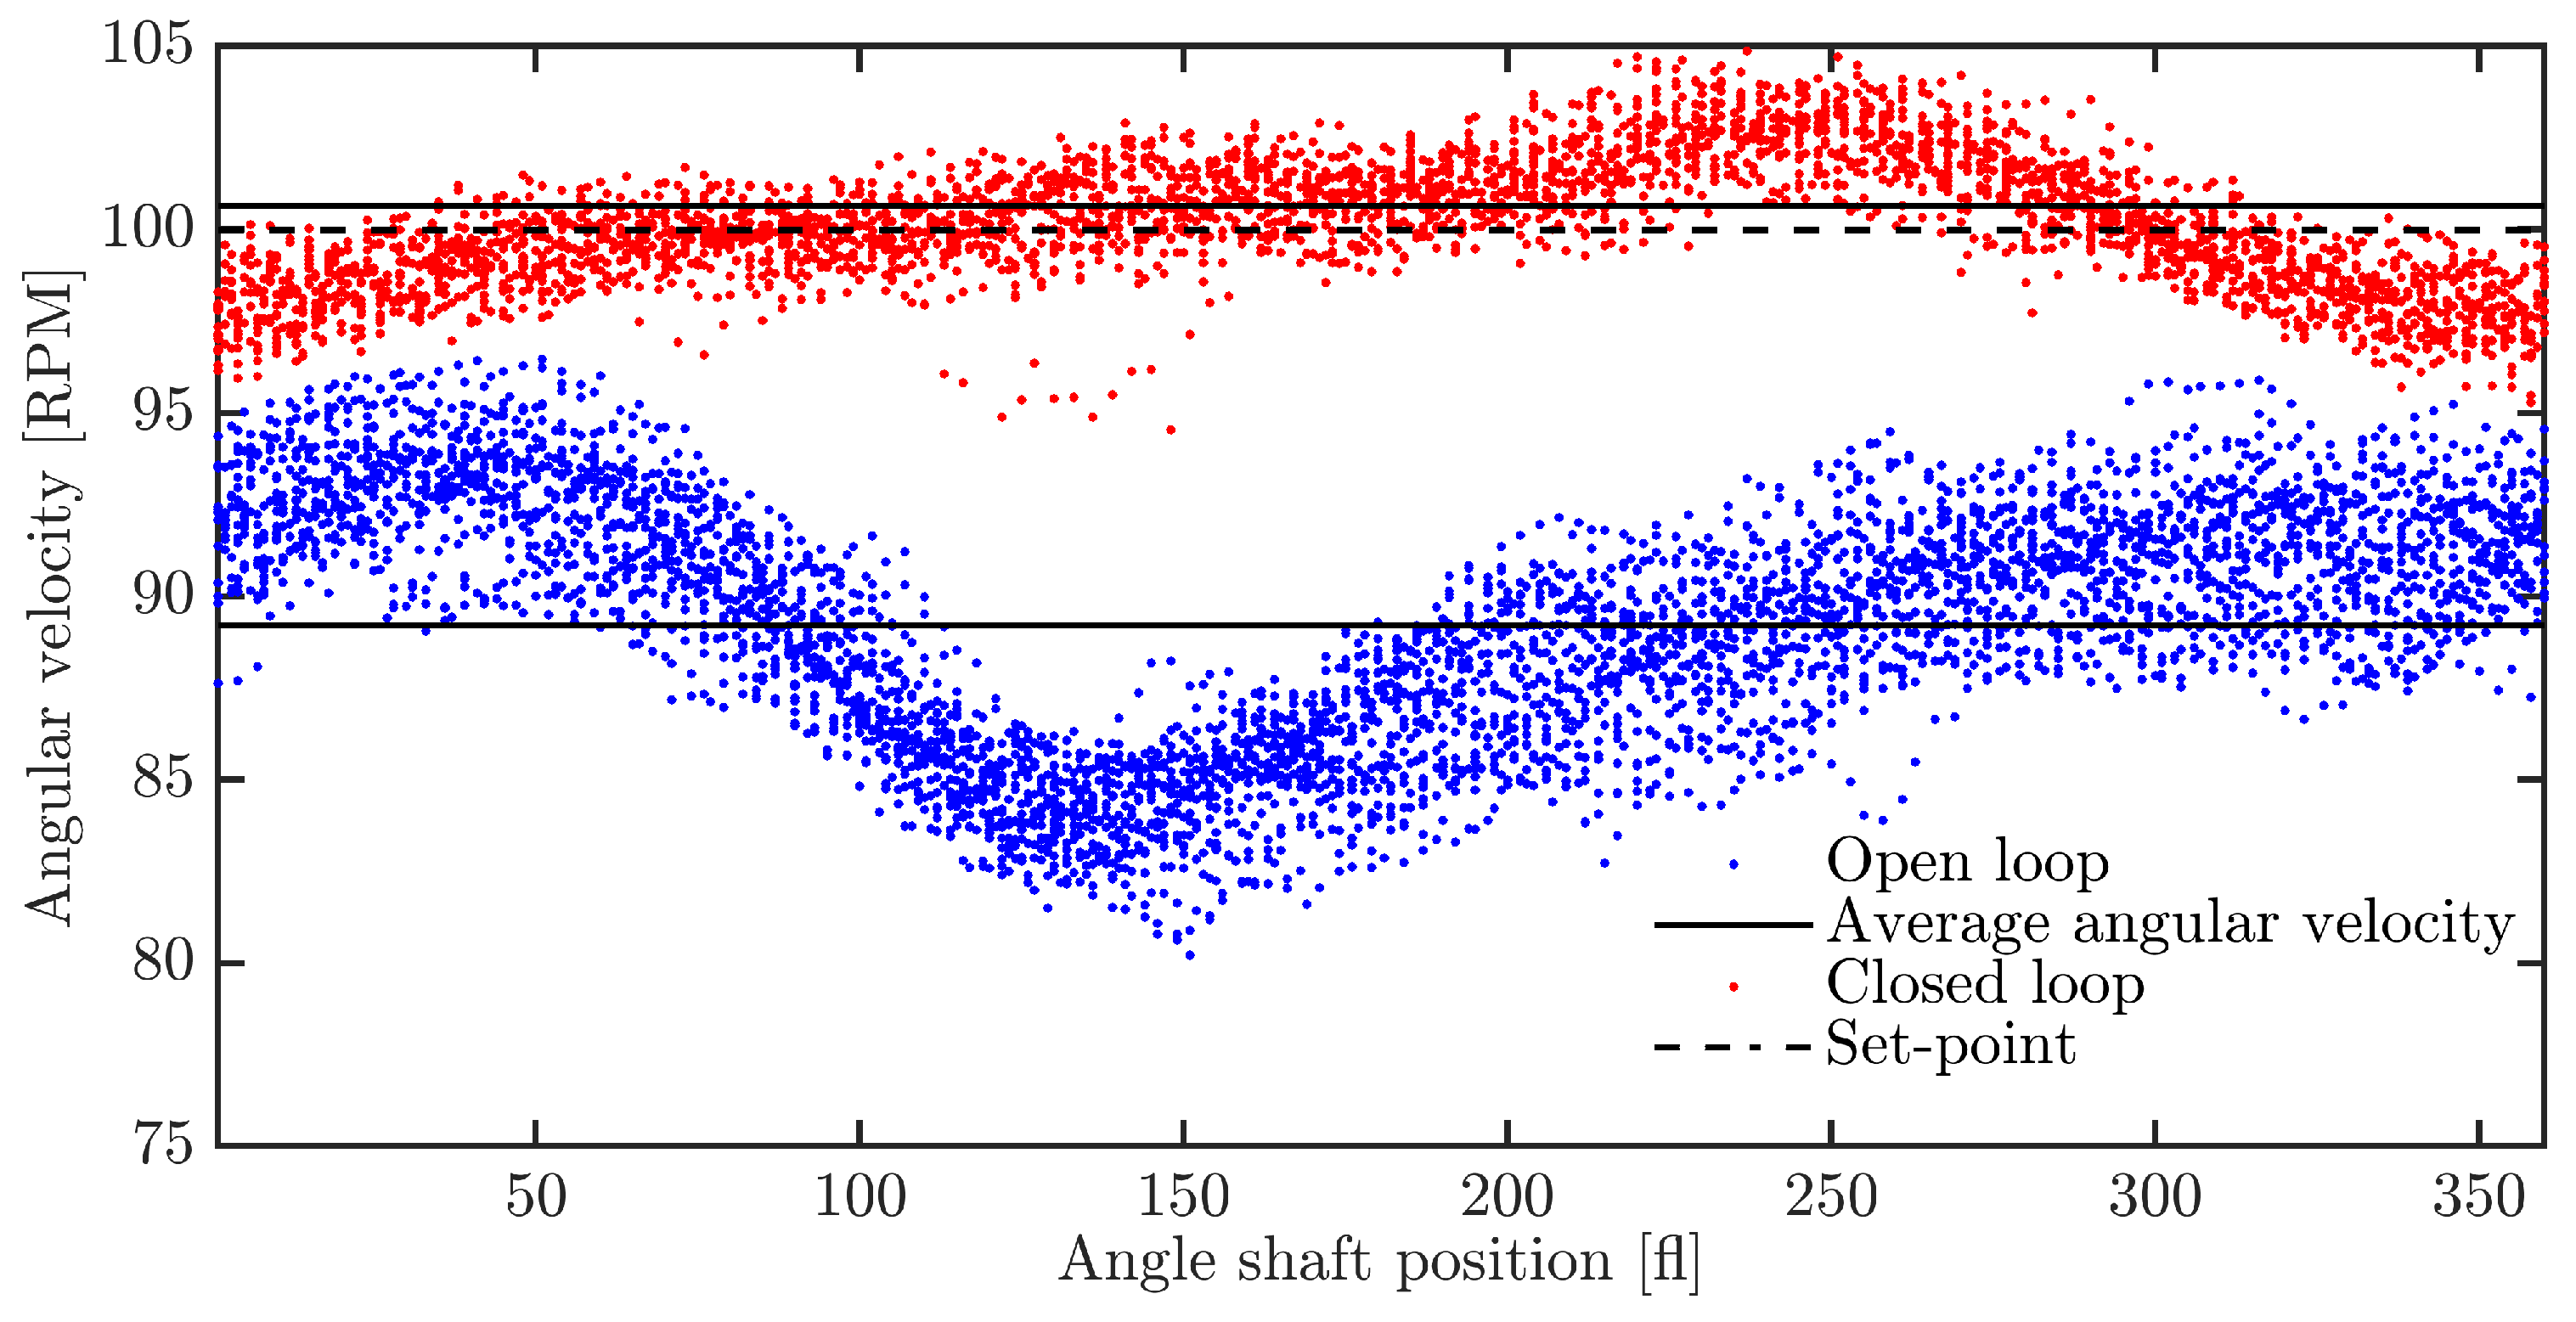
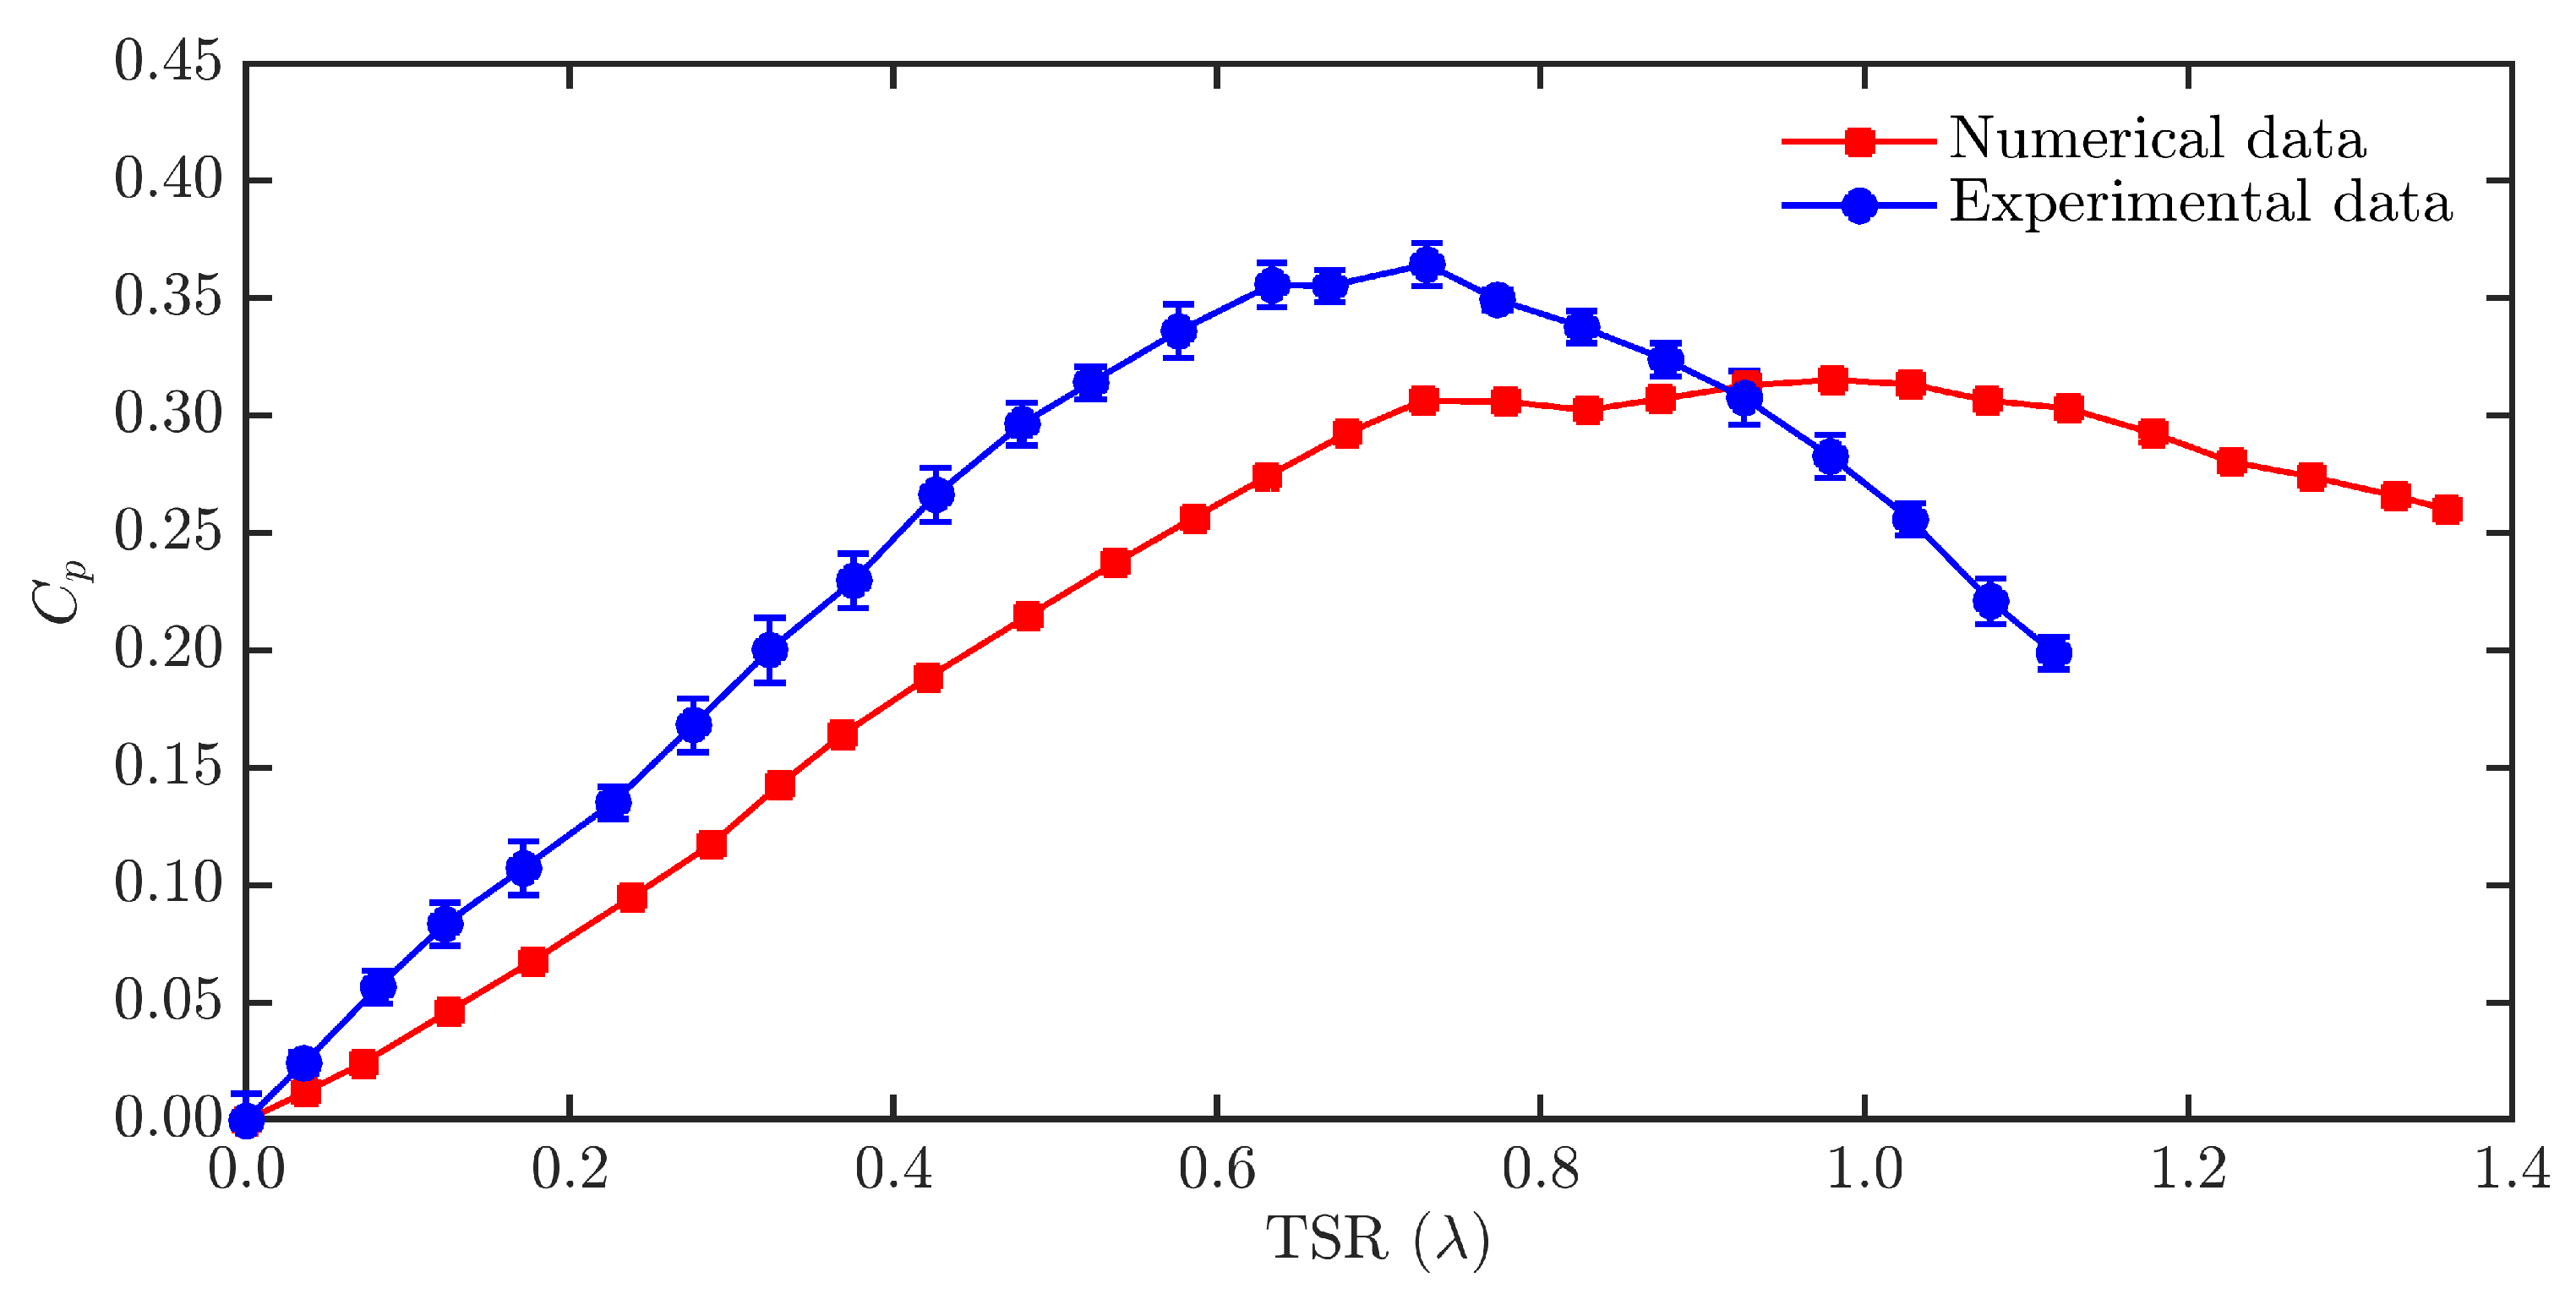
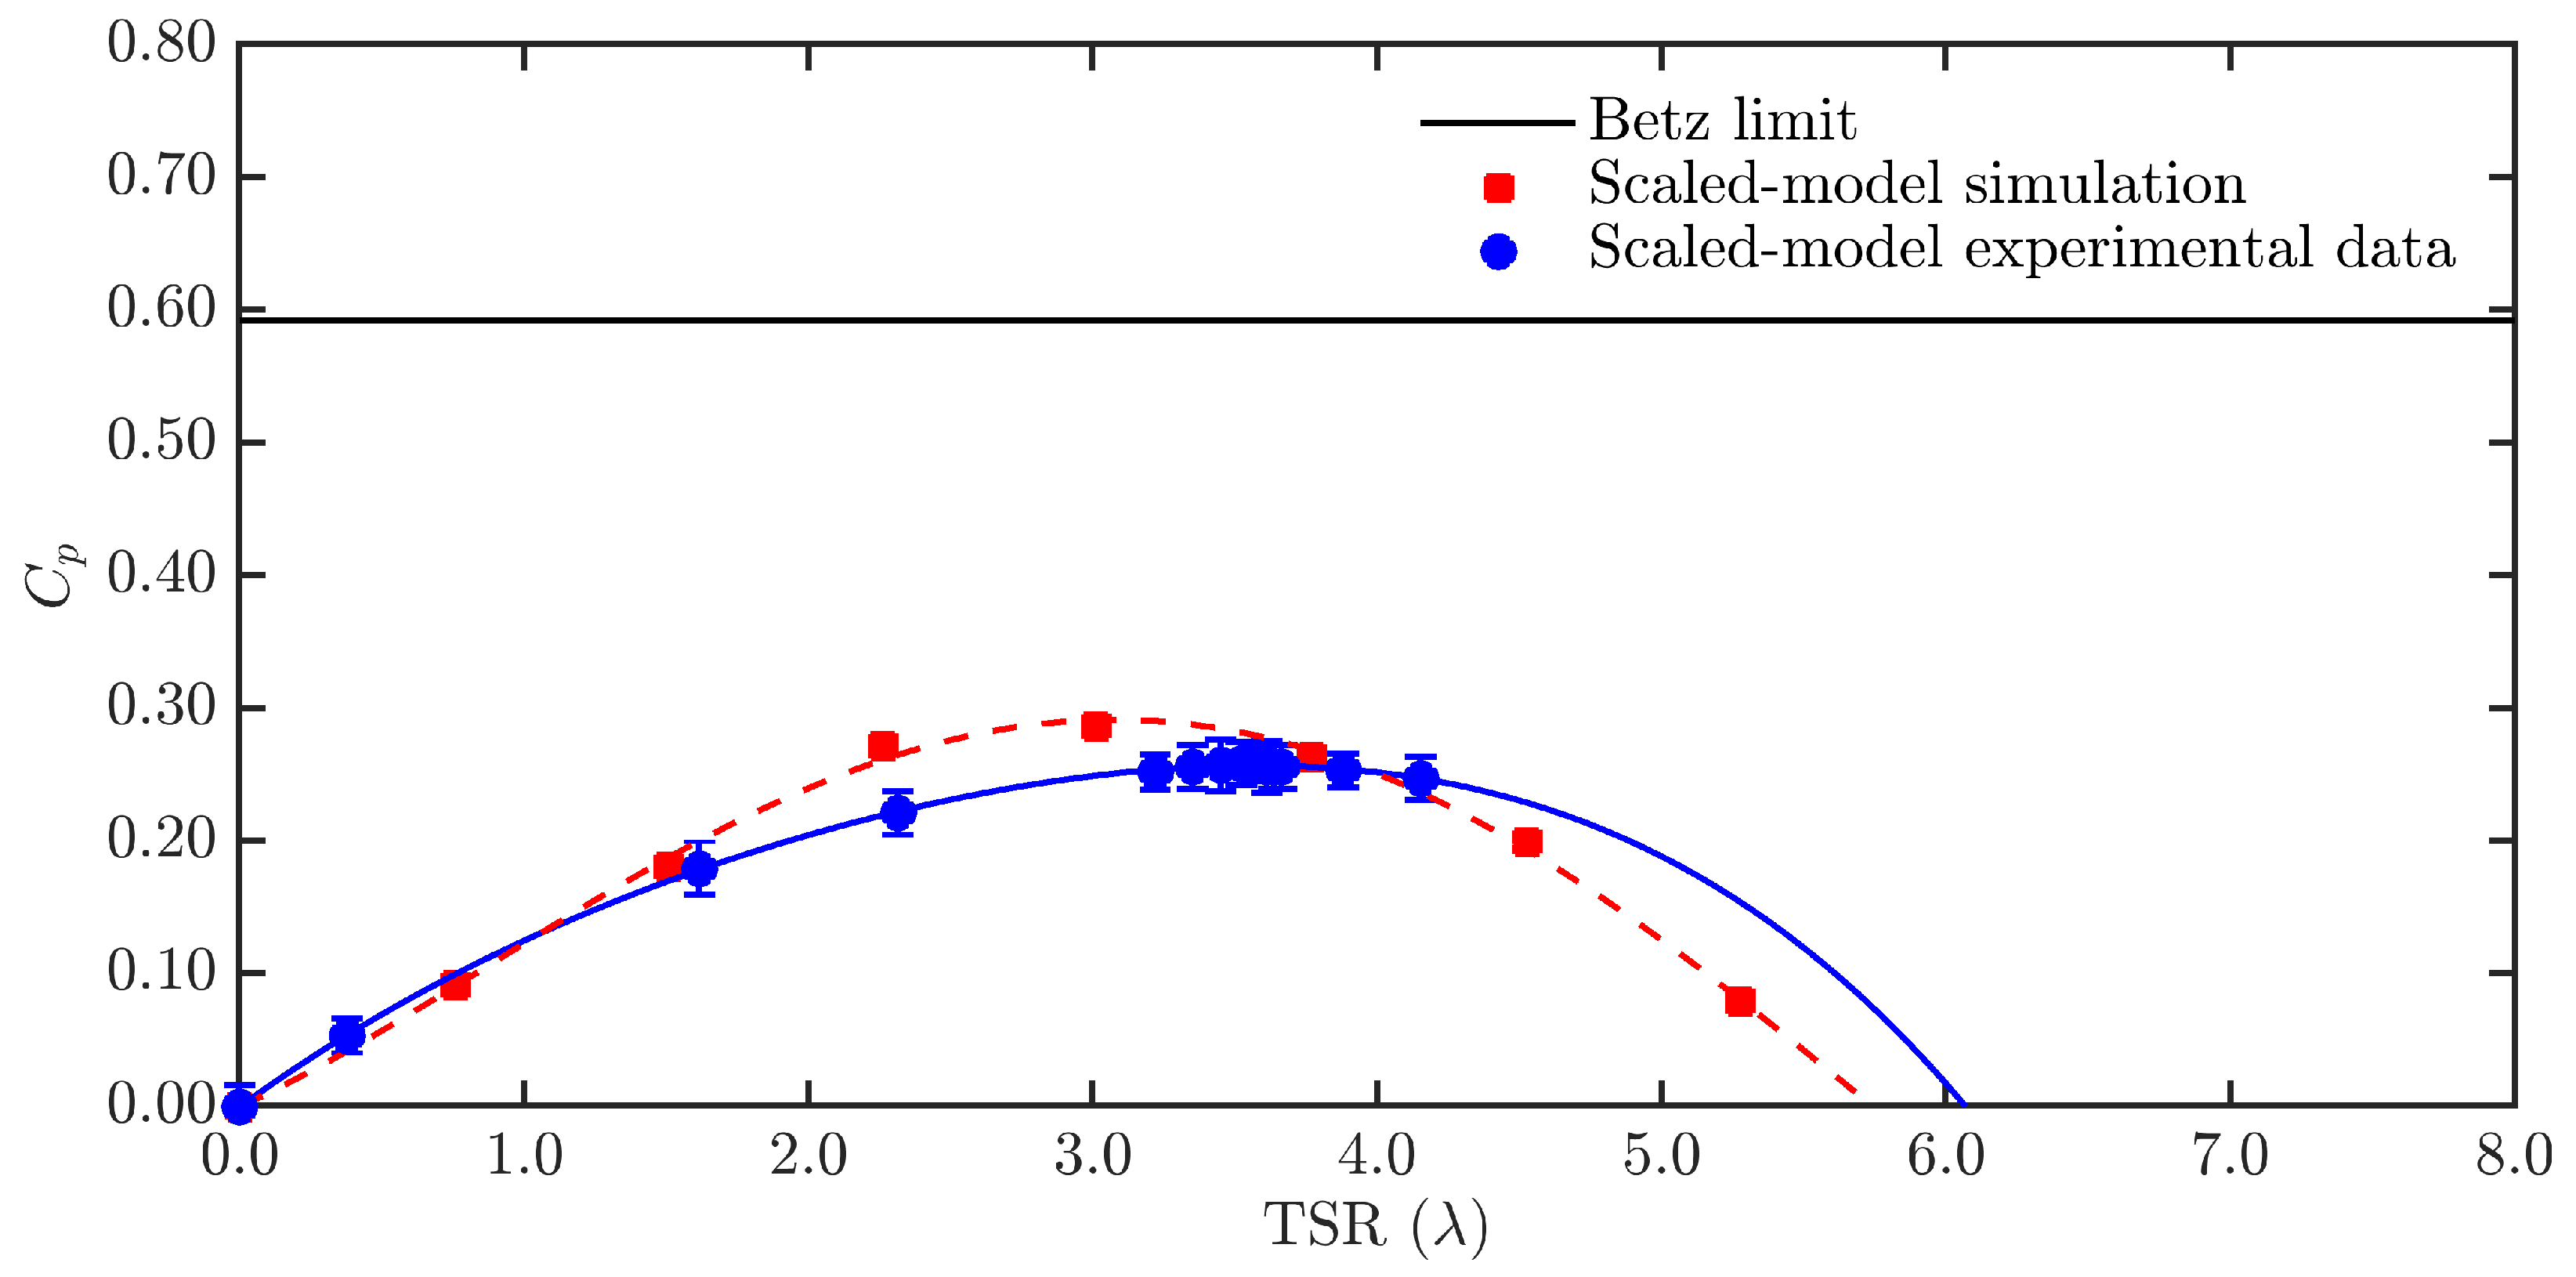
Figure 14 illustrates the dynamic behavior of the measured angular velocity during both the open-loop and closed-loop tests of the implemented controller number 12. Initially, the braking system setup was activated with both motors off. In the open-loop test, the measured angular velocity displayed periodic oscillations around 90 RPM. Since the braking motor received a constant duty cycle and the voltage applied to the driving motor remained constant, each oscillation corresponded to one revolution of the driving motor. This periodic behavior was attributed to alignment issues between the motors and the torque transducer. The closed-loop response of the angular velocity shows how it increased to a maximum value around 129 RPM and then decreased to a value around 100 RPM, which corresponds to an established set-point. The transient response took about 7 s to reach a steady state response. The measured closed-loop angular velocity oscillations presented lower amplitude values in comparison with the open-loop response. In both cases the frequency of the oscillations was the same. The output of the implemented PID controller given in terms of the duty cycle applied to the braking motor is shown in Figure 15. As soon as the driving motor started to rotate, the PID control rapidly increased its output up to 29% and then gradually for 7 s it was incremented around 28%. The control action showed an oscillation pattern with the same frequency as the open and close-loop responses of the measured angular velocity. It was due to the compensation that the PID control made to the oscillations of the measured angular velocity. The effect of this compensation is illustrated in Figure 16, which shows the relationship between the angular velocity and the shaft angle position in steady state for both open and closed-loop tests. Misalignment issues between the motors and the torque transducer resulted in variations in the angular velocity based on the shaft angle. These variations were more pronounced in the open-loop test where oscillation amplitudes were higher. Although the relationship between these variables is presented for both tests, the closed-loop test exhibits a shift in the shaft angle position where maximum and minimum angular velocities occurred. This shift is due to the control action, which aims to reduce oscillations and their amplitude. The close alignment of the average angular velocity with the PID control set-point in the closed-loop response demonstrates the effectiveness of the braking control system in maintaining the desired angular velocity. In Figure 17, the plot of CP against TSR for the experimental tests of the scaled model of the Savonius-type wind turbine are presented. Generated data from computational fluid dynamics (CFD) simulations were also depicted for comparison purposes. The maximum CP values for the scaled model based on experimental tests, and the scaled model from numerical analysis were found to be 0.3578, and 0.2948 at TSR values of 0.7, and 1.0, respectively. Figure 18 displays the CP versus TSR values derived from the HPHT scaled-model experimental tests. Simulation data from CFD analysis were also included. Regarding the comparison of CP values obtained from experimental analysis for the scaled model, a deviation in TSR was evident; the maximum CP value was reached. This deviation stemmed from two primary factors. Firstly, there was a loss associated with the retainer seal that was implemented to prevent water leakage within the data acquisition system. Secondly, the influence of the blade surface roughness played a significant role. Despite achieving a smooth surface finish during the manufacturing process, the impact of the roughness on the turbine performance became more significant as the blade size decreased, resulting in a higher relative roughness. In simulations, blades are configured as smooth walls without roughness, facilitating fluid flow and achieving the CP values recorded for the prescribed rotational velocity. Nevertheless, in experimental scenarios, roughness peaks act as resistance to fluid flow on the blade surfaces due to fluid viscosity. Consequently, to attain identical relative velocity values at blade cross-sections, equivalent forces causing movement must be reached for the rotor to rotate at higher velocities. The maximum CP values for the scaled model based on the numerical analysis and the experimental tests were 0.2871 and 0.2578 for TSR values of 3.0159 and 3.5297, respectively. In general, when comparing numerical and experimental results for hydrokinetic and wind turbines, several differences become evident. One significant discrepancy arises from the frictional effects in bearings and couplings, which are often not fully accounted for in numerical simulations. These frictional forces can lead to additional energy losses and alter the performance characteristics of the turbines, affecting the accuracy of the simulated results. For hydrokinetic turbines, the interaction with water introduces complex factors such as drag and turbulence, which may not be perfectly modeled in CFD simulations. In contrast, wind turbines, which operate in air, face different aerodynamic challenges, and the effects of turbulence and wind shear can also impact the accuracy of numerical predictions. Additionally, numerical models may simplify or overlook the effects of wear and tear over time, which can lead to discrepancies between predicted and actual performance. These factors collectively contribute to the variations observed between numerical simulations and experimental data. This highlights the need for continuous refinement of simulation models to improve their predictive accuracy [30,32,33,34]. The cost of the control system for the direct torque measurement was approximately USD 200, excluding the torque sensor. The price of the torque sensor varies depending on the brand and the measurement range required for the turbine characterization. Selecting an appropriate sensor is crucial, as it directly impacts the accuracy and reliability of the torque measurements needed to optimize the turbine performance.

4. Conclusions

Using a direct torque measurement system is crucial for the precise characterization of hydrokinetic and wind turbines, as it provides specific and accurate data on the torque generated. Unlike indirect methods, which calculate the torque from derived variables such as tensions and forces, direct measurement systems avoid errors associated with complex calculations and imperfect models. However, direct measurement systems also have their drawbacks. The implementation cost can be significantly higher due to the price of specialized sensors and transducers that are required. Additionally, developing control systems and data acquisition setups to integrate and calibrate these sensors can be technically challenging and require additional investment in time and resources. Despite these challenges, the accuracy and reliability offered by direct measurement methods in evaluating the real performance of the turbine justify their use, especially when detailed characterization and effective optimization of the design and control system are sought. The selection of direct and indirect methods will depend on the balance between the desired precision and the available resources for the project. The use of a DC motor coupled to one end of the rotary torque transducer shaft has demonstrated a practical and effective approach for generating differential torque. By applying the plugging or inverse current braking technique, the opposing torque via an H-bridge controlled was precisely adjusted by a microcontroller with pulse-width modulation (PWM). The control system accurately regulated the angular velocity of both wind and hydrokinetic turbines at various desired speeds. The experimental data showed a good fit with the numerical results, confirming the control system reliability and accuracy in evaluating the turbine performance. This capability allowed for the precise determination of the performance curves (Cp vs. TSR) for different turbine types, underscoring the system effectiveness in capturing critical performance metrics. Practically, the developed control system offers significant benefits, including its accessibility, reliability, precision, and cost-effectiveness. It provides a valuable tool for experimental setups, complementing commercially available rotary torque transducers, and facilitating a detailed performance analysis of various turbines. Looking ahead, this system opens several avenues for future research. Potential improvements could include the optimization of the control algorithms to enhance the performance further or adapting the system for different types of renewable energy technologies. Additionally, exploring integrations with advanced data analytics or machine learning could provide deeper insights into the turbine performance and operational efficiency.

Author Contributions

Conceptualization, F.O.V., A.R.-C. and E.C.; Methodology, F.O.V., A.R.-C. and E.C.; Software, F.O.V.; Validation, F.O.V.; Formal analysis, F.O.V., A.R.-C. and E.C.; Writing—original draft, F.O.V., A.R.-C. and E.C.; Writing—review & editing, A.R.-C. and E.C.; Supervision, E.C.; Project administration, A.R.-C. and E.C.; Funding acquisition, E.C. All authors have read and agreed to the published version of the manuscript.

Funding

The authors gratefully acknowledge the financial support provided by the Colombian Ministry of Science, Technology, and Innovation “MinCiencias” through “Patrimonio Autónomo Fondo Nacional de Financiamiento para la Ciencia, la Tecnología y la Innovación, Francisco José de Caldas” (Perseo Alliance, Contract No. 112721-392-2023).

Data Availability Statement

The original contributions presented in the study are included in the article, further inquiries can be directed to the corresponding author.

Conflicts of Interest

The authors declare that they have no conflict of interest that could potentially influence the findings presented in this work.

References

  1. Raihan, A. A review of the global climate change impacts, adaptation strategies, and mitigation options in the socio-economic and environmental sectors. J. Environ. Sci. Econ. 2023, 2, 36–58. [Google Scholar] [CrossRef]
  2. Arshad, K.; Hussain, N.; Ashraf, M.H.; Saleem, M.Z. Air pollution and climate change as grand challenges to sustainability. Sci. Total Environ. 2024, 10, 172370. [Google Scholar]
  3. Gayen, D.; Chatterjee, R.; Roy, S. A review on environmental impacts of renewable energy for sustainable development. Int. J. Environ. Sci. Technol. 2024, 21, 5285–5310. [Google Scholar] [CrossRef]
  4. Aneja, R.; Yadav, M.; Gupta, S. The dynamic impact assessment of clean energy and green innovation in realizing environmental sustainability of G-20. Sustain. Dev. 2024, 32, 2454–2473. [Google Scholar] [CrossRef]
  5. Mayor, B.; Rodríguez-Muñoz, I.; Villarroya, F.; Montero, E.; López-Gunn, E. The role of large and small scale hydropower for energy and water security in the Spanish Duero basin. Sustainability 2017, 9, 1807. [Google Scholar] [CrossRef]
  6. Amjith, L.R.; Bavanish, B. A review on biomass and wind as renewable energy for sustainable environment. Chemosphere 2022, 293, 133579. [Google Scholar] [CrossRef]
  7. Henao, F.; Viteri, J.P.; Rodríguez, Y.; Gómez, J.; Dyner, I. Annual and interannual complementarities of renewable energy sources in Colombia. Renew. Sustain. Energy Rev. 2020, 134, 110318. [Google Scholar] [CrossRef]
  8. Rueda-Bayona, J.G.; Guzmán, A.; Eras, J.J.C.; Silva-Casarín, R.; Bastidas-Arteaga, E.; Horrillo-Caraballo, J. Renewables energies in Colombia and the opportunity for the offshore wind technology. J. Clean. Prod. 2019, 220, 529–543. [Google Scholar] [CrossRef]
  9. Acaroğlu, H.; Güllü, M. Climate change caused by renewable and non-renewable energy consumption and economic growth: A time series ARDL analysis for Turkey. Renew. Energy 2022, 193, 434–447. [Google Scholar] [CrossRef]
  10. Barbarić, M.; Guzović, Z. Investigation of the possibilities to improve hydrodynamic performances of micro-hydrokinetic turbines. Energies 2020, 13, 4560. [Google Scholar] [CrossRef]
  11. Mat Yazik, M.H.; Wei Shyang, C.; Ishak, M.H.H.; Ismail, F. An overview of blade materials and technologies for hydrokinetic turbine application. Int. J. Green Energy 2024, 21, 476–499. [Google Scholar] [CrossRef]
  12. Ibrahim, W.I.; Mohamed, M.R.; Ismail, R.M.; Leung, P.K.; Xing, W.W.; Shah, A.A. Hydrokinetic energy harnessing technologies: A review. Energy Rep. 2021, 7, 2021–2042. [Google Scholar] [CrossRef]
  13. He, R.; Sun, H.; Gao, X.; Yang, H. Wind tunnel tests for wind turbines: A state-of-the-art review. Renew. Sustain. Energy Rev. 2022, 166, 112675. [Google Scholar] [CrossRef]
  14. Niebuhr, C.M.; van Dijk, M.; Neary, V.S.; Bhagwan, J.N. A review of hydrokinetic turbines and enhancement techniques for canal installations: Technology, applicability and potential. Renew. Sustain. Energy Rev. 2019, 113, 109240. [Google Scholar] [CrossRef]
  15. Maldar, N.R.; Ng, C.Y.; Patel, M.S.; Oguz, E. Potential and prospects of hydrokinetic energy in Malaysia: A review. Sustain. Energy Technol. Assessments 2022, 52, 102265. [Google Scholar] [CrossRef]
  16. Mosbahi, M.; Lajnef, M.; Derbel, M.; Mosbahi, B.; Aricò, C.; Sinagra, M.; Driss, Z. Performance improvement of a drag hydrokinetic turbine. Water 2021, 13, 273. [Google Scholar] [CrossRef]
  17. Mendes, R.C.; Macias, M.M.; Oliveira, T.F.; Brasil, A.C., Jr. A computational fluid dynamics investigation on the axial induction factor of a small horizontal axis wind turbine. J. Energy Resour. Technol. 2021, 143, 041301. [Google Scholar] [CrossRef]
  18. Bastankhah, M.; Porté-Agel, F. A new miniature wind turbine for wind tunnel experiments. Part I: Design and performance. Energies 2017, 10, 908. [Google Scholar] [CrossRef]
  19. Yavuz, T.; Koç, E.; Kilkiş, B.; Erol, T.; Balas, C.; Aydemir, T. Performance analysis of the airfoil-slat arrangements for hydro and wind turbine applications. Renew. Energy 2015, 74, 414–421. [Google Scholar] [CrossRef]
  20. Tian, W.; Mao, Z.; Ding, H. Design, test and numerical simulation of a low-speed horizontal axis hydrokinetic turbine. Int. J. Nav. Archit. Ocean Eng. 2018, 10, 782–793. [Google Scholar] [CrossRef]
  21. Cavagnaro, R.J.; Polagye, B. Field performance assessment of a hydrokinetic turbine. Int. J. Mar. Energy 2016, 14, 125–142. [Google Scholar] [CrossRef]
  22. Patel, V.; Bhat, G.; Eldho, T.I.; Prabhu, S.V. Influence of overlap ratio and aspect ratio on the performance of Savonius hydrokinetic turbine. Int. J. Energy Res. 2017, 41, 829–844. [Google Scholar] [CrossRef]
  23. Yuwono, T.; Sakti, G.; Aulia, F.N.; Wijaya, A.C. Improving the performance of Savonius wind turbine by installation of a circular cylinder upstream of returning turbine blade: Improving the Performance of Savonius Wind Turbine. Alex. Eng. J. 2020, 59, 4923–4932. [Google Scholar] [CrossRef]
  24. Roy, S.; Saha, U.K. Wind tunnel experiments of a newly developed two-bladed Savonius-style wind turbine. Appl. Energy 2015, 137, 117–125. [Google Scholar] [CrossRef]
  25. Talukdar, P.K.; Sardar, A.; Kulkarni, V.; Saha, U.K. Parametric analysis of model Savonius hydrokinetic turbines through experimental and computational investigations. Energy Convers. Manag. 2018, 158, 36–49. [Google Scholar] [CrossRef]
  26. Hughes, A. Electric Motors and Drives, 3rd ed.; Elsevier: Amsterdam, The Netherlands, 2006. [Google Scholar]
  27. Asyraf, S.M.; Heerwan, P.; Zulhilmi, I.M.; Izhar, I.M. Plugging Brake System as a Hill Descend Control for Electric Powered Wheelchair: Experimental Analysis. In Proceedings of the 2019 IEEE 4th International Conference on Advanced Robotics and Mechatronics (ICARM), Toyonaka, Japan, 3–5 July 2019; pp. 319–324. [Google Scholar]
  28. Beauregard, B. Improving the Beginner’s PID—Introduction, 2011. Available online: http://brettbeauregard.com/blog/2011/04/improving-the-beginners-pid-introduction/ (accessed on 15 September 2024).
  29. Martins, F.G. Tuning PID Controllers using the ITAE Criterion. Int. J. Eng. Educ. 2005, 21, 867–873. [Google Scholar]
  30. Gallo, L.A.; Chica, E.L.; Flórez, E.G.; Obando, F.A. Numerical and experimental study of the blade profile of a Savonius type rotor implementing a multi-blade geometry. Appl. Sci. 2021, 11, 10580. [Google Scholar] [CrossRef]
  31. Romero-Menco, F.; Betancour, J.; Velásquez, L.; Rubio-Clemente, A.; Chica, E. Horizontal-axis propeller hydrokinetic turbine optimization by using the response surface methodology: Performance effect of rake and skew angles. Ain Shams Eng. J. 2023, 15, 102596. [Google Scholar] [CrossRef]
  32. Wu, K.T.; Lo, K.H.; Kao, R.C.; Hwang, S.J. Numerical and experimental investigation of the effect of design parameters on Savonius-type hydrokinetic turbine performance. Energies 2022, 15, 1856. [Google Scholar] [CrossRef]
  33. Aguilar, J.; Velásquez, L.; Romero, F.; Betancour, J.; Rubio-Clemente, A.; Chica, E. Numerical and experimental study of hydrofoil-flap arrangements for hydrokinetic turbine applications. J. King Saud-Univ.-Eng. Sci. 2021, 35, 577–588. [Google Scholar] [CrossRef]
  34. Zhu, L.; Hou, E.; Zhou, Q.; Wu, H. Numerical Experiments on Hydrodynamic Performance and the Wake of a Self-Starting Vertical Axis Tidal Turbine Array. J. Mar. Sci. Eng. 2022, 10, 1361. [Google Scholar] [CrossRef]
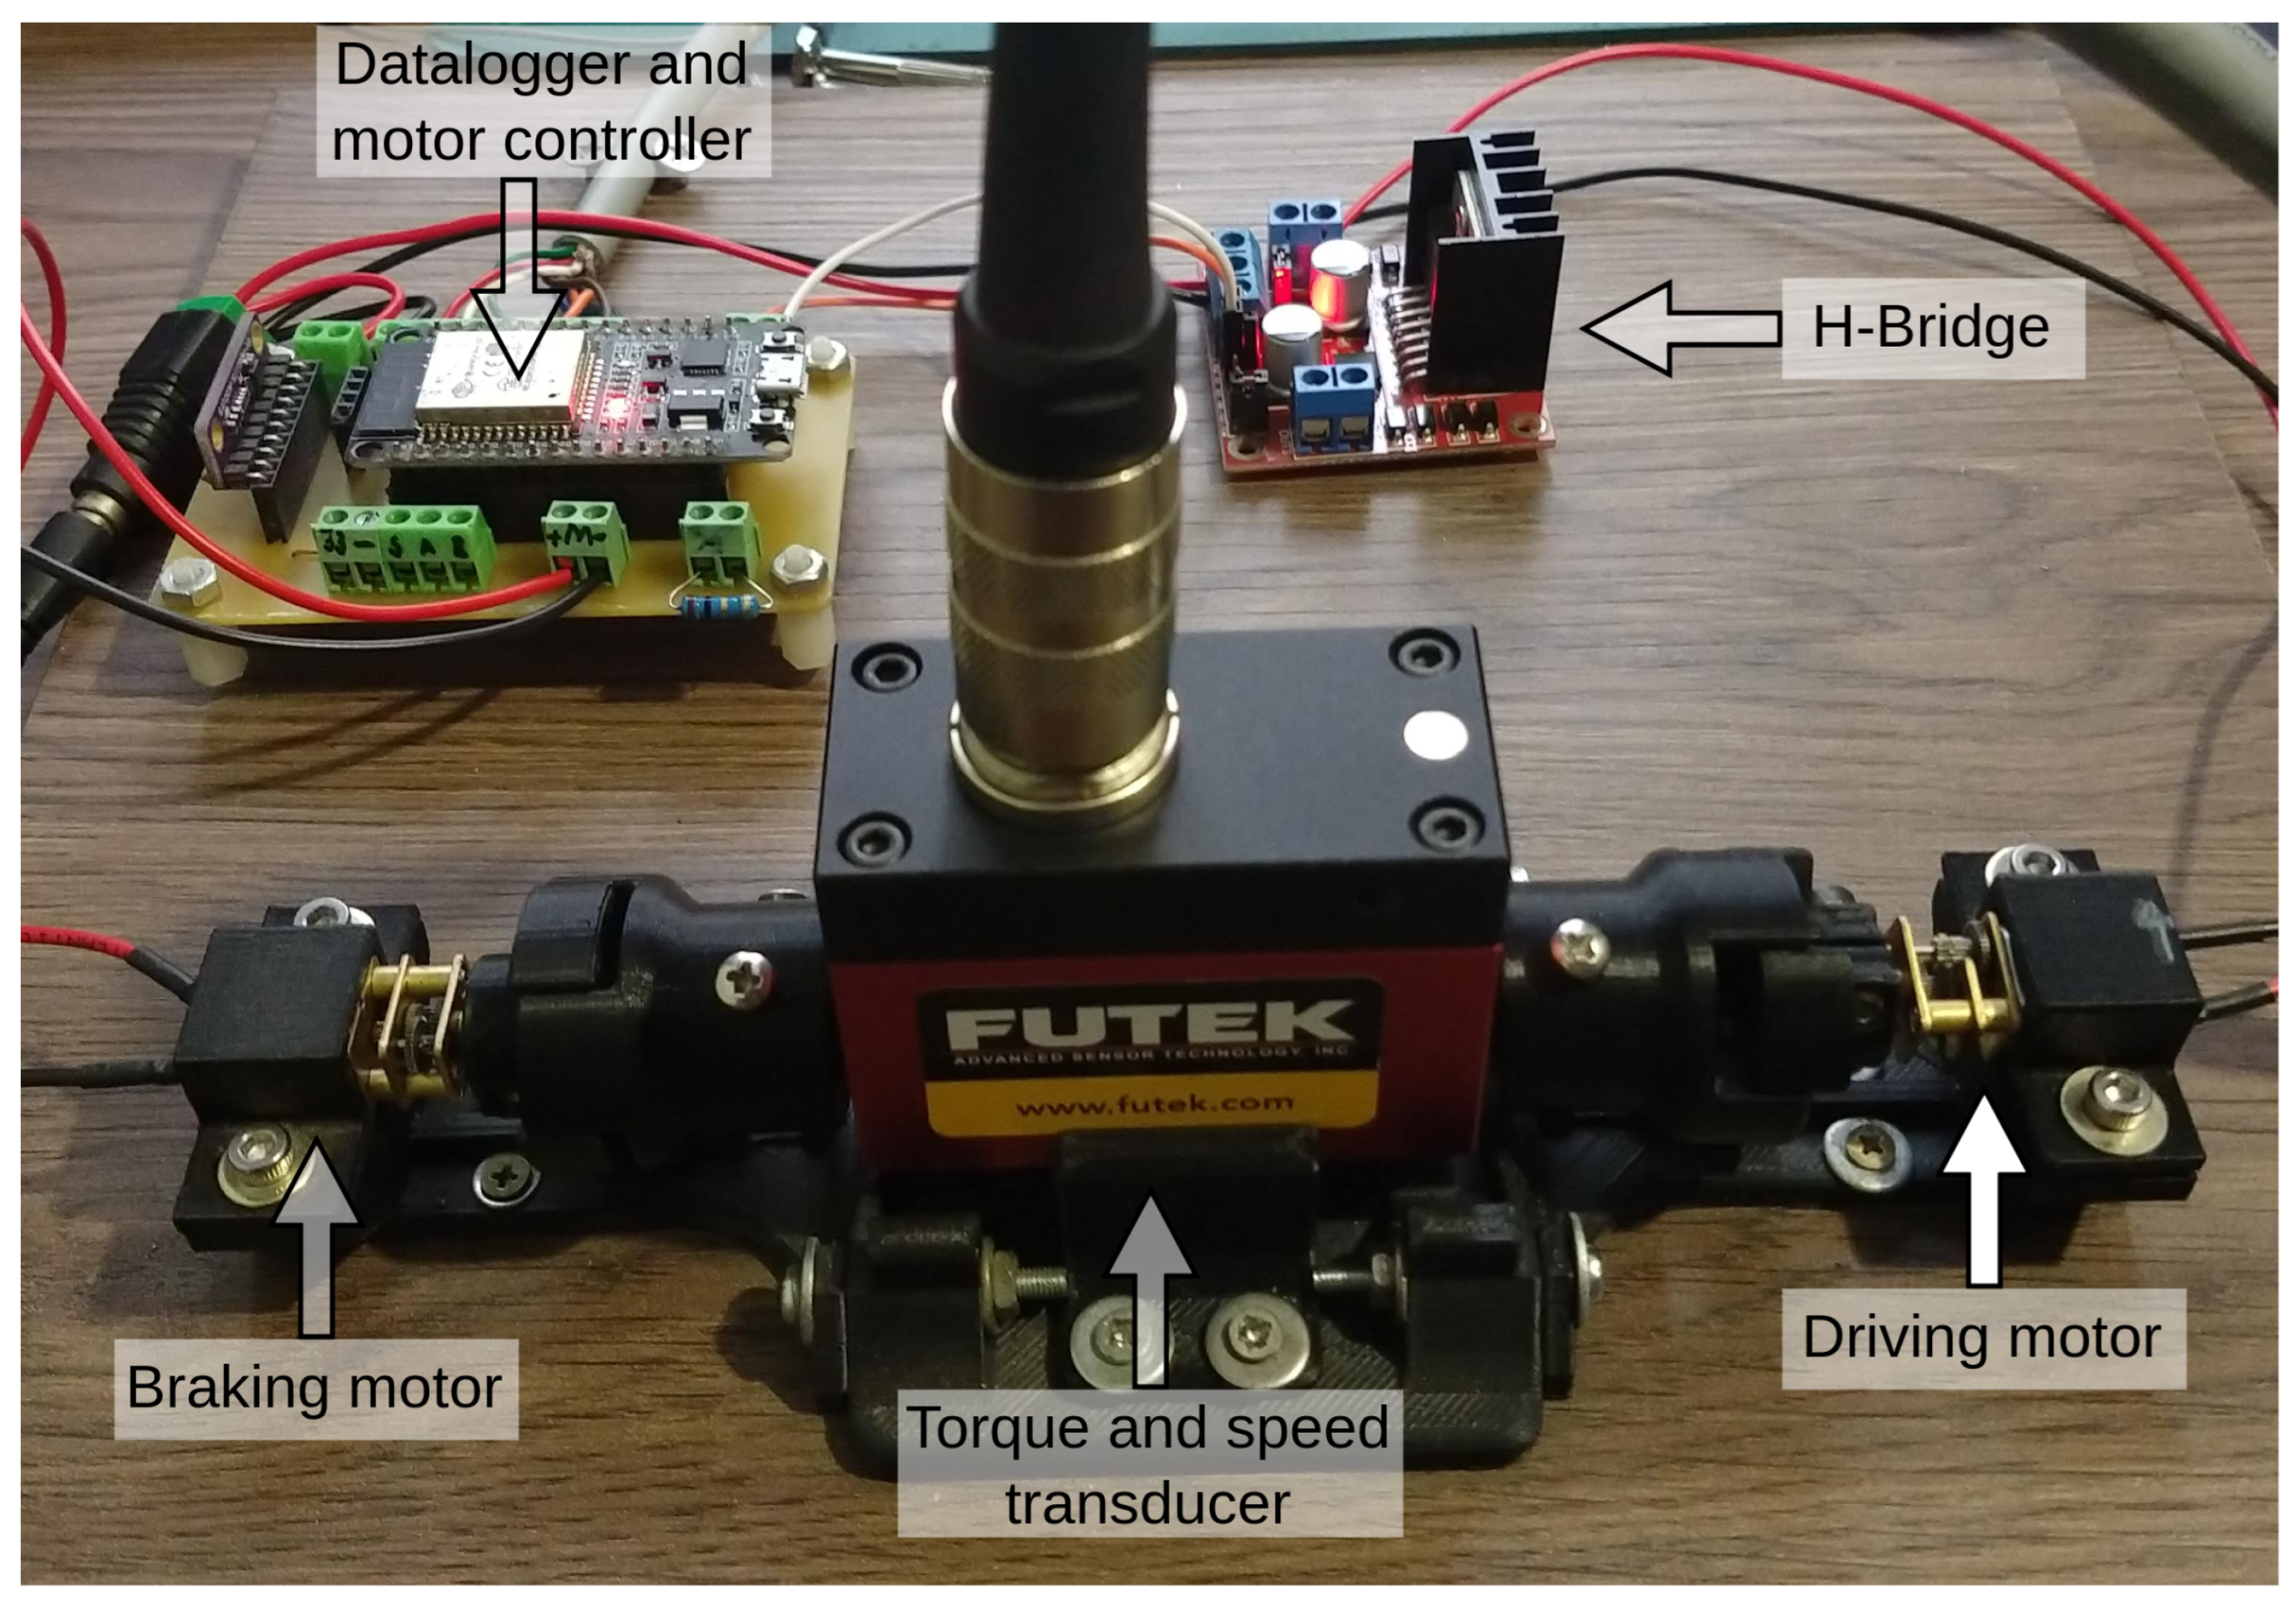
Figure 1. Bench test for the torque transducer with a DC motor as a braking device.
Energies 17 04950 g001
Figure 2. Schematic of the devices involved in the braking system of the torque transducer.
Energies 17 04950 g002
Figure 3. Savonius-type wind turbine with multi-element blades.
Energies 17 04950 g003
Figure 4. Setup for the braking system of the torque transducer testing a wind turbine in a wind tunnel. (1) wind tunnel, (2) test section, (3) test model, (4) torque sensor, (5) couplings, and (6) braking electric motor.
Energies 17 04950 g004
Figure 5. Scaled propeller hydrokinetic turbine. (a) Front view of the printed scaled model turbine. (b) Perspective view of the printed scaled model turbine. (c) Data acquisition setup utilized in experimental tests.
Energies 17 04950 g005
Figure 6. Experimental configuration of the water recirculation system. (a) Overview of the experimental setup employed during testing. (b) Arrangement of the experimental vessel and data acquisition system. (c) Integration of the torque sensor, DC motor, and mechanical couplings.
Energies 17 04950 g006
Figure 7. Relationship between the measured torque and angular velocity of the driving motor. Blue dots: increasing braking torque test; red dots: decreasing braking torque test; blue line: average measured torque for increasing braking torque test; red line: average measured torque for decreasing braking torque test.
Energies 17 04950 g007
Figure 8. Relationship between the measured angular velocity and duty cycle applied to the braking motor. Blue dots: increasing braking torque test; red dots: decreasing braking torque test; blue line: average measured angular velocity for increasing braking torque test; red line: average measured angular velocity for decreasing braking torque test.
Energies 17 04950 g008
Figure 9. Relationship between the measured torque and duty cycle applied to the braking motor. Blue dots: increasing braking torque test; red dots: decreasing braking torque test; blue line: average measured torque for increasing braking torque test; red line: average measured torque for decreasing braking torque test.
Energies 17 04950 g009
Figure 10. Evolution of the computed mechanical power throughout the test. Blue line: increasing braking torque test; red line: decreasing braking torque test.
Energies 17 04950 g010
Figure 11. Relationship between the measured mechanical power and duty cycle applied to the braking motor. Blue dots: increasing braking torque test; red dots: decreasing braking torque test; blue line: average measured mechanical power for increasing braking torque test; red line: average measured mechanical power for decreasing braking torque test.
Energies 17 04950 g011
Figure 12. Relationship between the measured mechanical power and angular valocity of the driving motor. Blue dots: increasing braking torque test; red dots: decreasing braking torque test; blue line: average measured mechanical power for increasing braking torque test; red line: average measured mechanical power for decreasing braking torque test.
Energies 17 04950 g012
Figure 13. Closed-loop responses of the braking system using different PID control gains to regulate the measured angular velocity of the driving motor. Black line: average angular velocity for the steady state response; black segment line: PID control set-point.
Energies 17 04950 g013
Figure 14. Open and closed-loop response of the braking system with a PID control algorithm to regulate the measured angular velocity of the driving motor. Blue line: open-loop test; red line: close-loop test; black line: average angular velocity for open-loop test; black segment line: PID control set-point.
Energies 17 04950 g014
Figure 15. Close-loop action control in terms of the duty cycle applied to the braking motor.
Energies 17 04950 g015
Figure 16. Relationship between the angular velocity and the angle shaft position of the motor driving. Blue dots: open-loop test; red dots: closed–loop test; black line: average angular velocity for open and closed-loop test; black segment line: PID control set-point.
Energies 17 04950 g016
Figure 17. Comparison between numerical and experimental CP versus TSR curves for the scaled model of a Savonius-type wind turbine.
Energies 17 04950 g017
Figure 18. Comparison between numerical and experimental CP versus TSR curves for the scaled model.
Energies 17 04950 g018
Table 1. Tunned gains parameters used for each PID controller tested.
Controller K p K i K d Controller K p K i K d
10.81.20.000570.81.00.0010
20.81.20.000181.01.00.0010
30.81.20.001090.82.00.0005
40.81.50.0050100.82.50.0001
50.81.20.0050111.02.50.0010
60.81.50.0010120.83.00.0010
Table 2. ITAE values computed for each PID controller tested.
ControllerITAEControllerITAEControllerITAE
123915266891463
2239461951101235
3235073146111218
4245883158121123
Disclaimer/Publisher’s Note: The statements, opinions and data contained in all publications are solely those of the individual author(s) and contributor(s) and not of MDPI and/or the editor(s). MDPI and/or the editor(s) disclaim responsibility for any injury to people or property resulting from any ideas, methods, instructions or products referred to in the content.