Abstract
The study examined the potential changing roles of ports in terms of diversifying their revenue through the expansion of new markets in the Port of Ngqura. This is by means of the production and sales of renewable hydrogen as marine fuel produced from a wavefarm in Nelson Mandela Bay. A key objective of the study was to conduct a comprehensive techno-economic analysis of the feasible hydrogen production technologies based on the analysis performed, including alkaline electrolysis of seawater and renewable-powered electrolysis of seawater. The produced hydrogen aligns with global decarbonisation of ships and ports and will be used to supply the port with electricity, serve to refuel tugboats, and provide green hydrogen bunkering fuel for commercial shipping vessels. The Port of Ngqura is geographically well positioned to lead the production of zero carbon shipping fuel. This work considers the CAPEX and OPEX of a hydrogen plant using electrolysers and evaluates the current cost of production and selling price of hydrogen. The primary aim of this study was to examine the feasibility of hydrogen production through electrolysis of seawater at the Port of Ngqura. Through assessing resource and technological options, determining advantageous economic assumptions, and identifying existing limitations and potential opportunities, a feasibility study was conducted with special consideration of the site characteristics of Ngqura. The output of this study is a model that simulates the production, storage, and transportation of hydrogen gas from the Port of Ngqura, which was further used to analyse different case study scenarios. This approach directly addresses the main goal of the study. The results found showed that with wave energy convertors in a row of three next to each other, the energy produced by the wave farm was 2.973 TJ per month, which is equivalent to 18.58 tons of produced hydrogen when considering the lower heating value of hydrogen and assuming that hydrogen production efficiency is 75%. The anticipated hydrogen fuel will be able to refuel a tugboat with green hydrogen from the energy produced by the wave farm each month. It is predicted that the price of hydrogen is expected to drop, and the price of fossil fuel will gradually increase in the coming years. The fact that coal electricity can be produced on demand and wind and solar energy are weather dependent as a result lacks the ability to achieve a constant supply. There is currently an urgent need for energy storage and the efforts to study the production of hydrogen and ammonia. Hydrogen is still predicted to be more expensive than coal electricity; however, from this, maybe a critical cost for a kg of CO2 could be calculated, which could make hydrogen competitive. The cost of green hydrogen production from wave energy in the Port of Ngqura was calculated as R96.07/kg (4.88 EUR/kg) of produced hydrogen, which is equivalent to 2.1 times the cost of the same energy supplied as Marine Diesel Oil (MDO) at current prices. Hydrogen from wave energy would thus become competitive with MDO; if a price is set for the emission of CO2, this may also offset the difference in cost between MDO and hydrogen from wave energy. The carbon price necessary to make green hydrogen competitive would be approximately R6257/tonne CO2, or 318 EUR/tonne CO2, which is around 4.5 times the current trading price of carbon in the EU Emissions Trading Scheme.
1. Introduction
Since the dawn of the industrial revolution, there has been an increase in the demand for seaborne trade and transportation, including a significant increase in greenhouse gas emissions. As the world is moving away from fossil fuels and encouraging renewable energy projects to reduce carbon footprints, various forms of renewable energy are being explored to replace the existing energy generation facilities. The Paris Agreement is aiming to limit global warming to 1.5 degrees Celsius in comparison to preindustrial levels (UNEP, 2020) [1]. In a generation that depends highly on energy and power supply for production and sustainability, energy is a crucial component to sustain human life, economic growth, and activities. South Africa has shown its commitment to the IMO emission reduction strategy through finding new and innovative ways to supply reliable and environmentally friendly energy.
South Africa is currently the seventh largest coal producer in the world, and around 77% of the country’s electricity is generated from coal, which has caused high levels of environmental degradation (Jain and Jain, 2017) [2]. South Africa is the world’s 11th biggest greenhouse gas emitter and has one of the world’s highest per capita emissions (Mukherjee, 2023) [3]. The country’s dependency on fossil fuels and its current inability to meet its energy demands have promoted renewable energy projects such as wind power, solar energy, and hydropower plants to address energy poverty while promoting sustainable development and energy security. Renewable energy promises to be one of the most viable and most accepted technologies when it comes to green energy generation. South Africa currently has an ageing coal power fleet of thermal power stations; plans are in place to decommission in the next 30 years (Rae and Erfort, 2020) [4]. The country is highly dependent on fossil fuels, mainly coal, for economic growth and electricity generation. The coal industry contributed R37 billion to the country’s economy in 1993 and R115 billion in value added at a constant in 2010 (Statistics South Africa, 2015) [5]. In 2023, the mining industry in South Africa contributed R202.05 billion to the country’s Gross Domestic Product (GDP) (Cowling, 2024) [6]. South Africa has introduced a new energy mix to its energy power supply from renewable sources such as wind, solar, and hydrogen. The Department of Minerals and Resources and Energy in South Africa selected 25 bidders for 2.6 GW of renewable energy capacity in the fifth bid window period under the Renewable Energy Independent Power Procurement Programme (REIPPP). The bidders will be allocated 1.6 GW of onshore wind and 1 GW of solar capacity (Ellichipuram, 2021) [7].
To facilitate a shift to a hydrogen economy, the development of a hydrogen production and distribution infrastructure is a necessity. This requires the development of large-scale hydrogen production facilities and networks over a range of production technologies involving diverse renewable energy resources. Large-scale hydrogen facilities could be developed at coastal sites with access to renewable energy resources (wind, solar, and wave) and water resources for electrolysis. Port cities with renewable energy resources adjacent to coastlines would thus be well-situated to become hydrogen production and distribution hubs (Baral and Šebo, 2024) [8]. Foteinis (2022) [9] reports that wave energy convertors (WECs) could be integrated into ports and potentially be used as a means of protecting ports from waves; however, they are capital intensive. Bekçi et al. (2024) [10] analysed the potential for near-shore wave energy use for hydrogen production in the Black Sea. The analysis was performed using an Oscillatory Wave Surge Converter (OWSC), and the results pointed out seasonal variations in wave energy availability as well as the need for high electrolyser efficiencies to limit hydrogen production costs. Satymov et al. (2024) [11] analysed the potential for various wave energy converters, including point absorbers, to generate electricity. Their approach combined real wave data on an hourly basis with power matrices for the various WEC devices to estimate electricity costs in a number of locations. South Africa has a great potential of generating electricity from offshore wave power due to its coastline and geographic location. Offshore renewable energy is expected to play a crucial role in the transition towards a more sustainable electricity generation in the future (Saenz-Aguirre et al., 2021) [12]. South Africa is geographically well positioned in Southern Africa with a coastline stretching from 2800 km from the borders of Namibia to Mozambique and has a high potential to unlock its offshore renewable energy sector. The country has a potential market to offer bunkering fuel services to many vessels, including huge commercial vessels that pass through the Cape point during trading routes. As the world is looking at sustainable fuels, green hydrogen, produced via water electrolysis using renewable sources such as wind and solar, has emerged as a key enabler for decarbonisation. Its versatility allows it to be used as a clean feedstock across industries, making it a necessary component of the future sustainable economy. At present, green hydrogen production is at a nascent stage, hindered largely by high energy and equipment capex costs, translating into an uncompetitive energy carrier. However, these limitations are placed against low carbon projections for renewable dispatchable energy that equips green hydrogen technologies to scale with increased cost parity with hydrocarbons. This study investigates the potential of wave energy as an alternative energy source being introduced in the current energy mix. Several studies have investigated the use of wave power for generating hydrogen; there are discussions of these works that must be investigated to close the remaining and existing research gap. There are a limited number of qualitative studies that are reported in the literature highlighting applications of hydrogen for energy storage in large-scale and long-term energy scenarios with multiple and various renewable energy inputs. However, quantitative analyses on real cases are required to confirm the findings suggested by these studies (Kharel and Shabani, 2018) [13].
The techno-economic evaluation of viable and financially sound green hydrogen production systems integrated with hydropower, while accommodating diverse fluctuating load demands, represents a pioneering contribution to the current literature of Nepal (Baral and Šebo, 2024) [8]. The transition toward clean energy systems worldwide is accelerating with rising greenhouse emissions output associated with fossil fuels. In this context, the involvement of green hydrogen (GH2), characterised by high energy density, zero CO2 emissions, and multiple use potentials, lies at the centre of most future energy scenarios. The electrolysis of water using renewable energy sources such as photovoltaic (PV), wind, geothermal, hydropower, and biomass is recognised as a promising option for GH2 production. In consequence, countries rich in potential renewables, such as South Africa, are conducting analysis of localised green hydrogen resources and projecting energy carry capabilities to central economies. Considering this motivation, a techno-economic analysis of green hydrogen and renewable ammonia production at the Port of Ngqura is investigated with the aim of economic viability under South Africa’s energy projections. The development of green hydrogen technologies is being pursued by countries worldwide. Green hydrogen technologies are explored and analysed under three different perspectives, namely technical development, economic feasibility, and assessment of energy suitability to meet industrial demand. Technical developments include research to determine the design specifications of novel hydrogen production pilot demonstrations. Economic feasibility studies include techno-economic analysis of the latest designs and production pathways to determine implications of capital intensity, energy pricing, and low utilisation costs levelling out with competitive pathways. The later then subsequently shapes industries demand, and the economic analysis informs the suitability to scale with cost parity. However, there are notable gaps in the analysis of green hydrogen technologies, particularly with respect to the very nascent South African economy (Melamu, 2008) [14].
This study will also investigate the installation of a wave farm with three-point convertors in the Eastern Cape in Nelson Mandela Bay (NMB) and the construction of a hydrogen plant, which will be located at the Port of Ngqura to offer bunkering services to international commercial vessels. It also investigates the economic assessment of a wave farm, including evaluating a wave farm project. The hydrogen plant will make use of electrolysers to produce green hydrogen. We will look at the current market costs of electricity for businesses and the current cost of hydrogen per kg in South African Rand (ZAR). Throughout the study, we need to consider the price of electricity as a determining factor towards the price of green hydrogen.
2. Methodology
The research used a mixed methodology research design; according to (Creswell, 2012) [15], it is a procedure for collecting, analysing, and “mixing” both quantitative and qualitative research methods in a single study to understand a research problem. The paradigm derived from mixed-method research (qualitative and quantitative approaches) is post-positivism. The purpose of this paradigm is to attempt to address the weaknesses of the positivist paradigm (Brown and Dueñas, 2019) [16]. Furthermore, the post-positivist paradigm is a combination of positivist and interpretivist paradigms and is a form of justification for an alternative paradigm after the failings of a positivist paradigm (Panhwar et al., 2017) [17]. Bonache and Festing (2020) [18] add that the positivist paradigm provides different answers to numerous essential questions and issues in a study. Therefore, this paradigm approach fits well with the study, as it contained both quantitative and qualitative elements. The research design analysed the potential changing role of ports in terms of diversifying revenue through offering bunkering service for the production and sales of renewable hydrogen marine fuel. Furthermore, green hydrogen has the potential to play an important role in decarbonising energy systems globally, yet its deployment remains low. To achieve greater roll-out of green hydrogen projects, their value should be determined and used to advise industry and policymakers. The study adopted Real Options (ROs) analysis, which is an increasingly popular method for assessing the value of projects, particularly under uncertain conditions, since it allows for flexible decision-making (Biggins et al., 2022) [19]. Since hydrogen has been identified as a crucial part of the clean energy future, with this in mind, the paper aims to adopt the evolution of electrolysers, CAPEX and OPEX, and energy consumption by using predicted values in the literature and simulating pessimistic and optimistic trajectories (Biggins et al., 2022) [19].
The study involved data collection and analysis to assess the feasibility and cost-effectiveness of producing hydrogen from a wave farm in Nelson Mandela Bay for the Port of Ngqura. The hydrogen production was calculated in terms of energy generating potential from wave-power using a dynamic model of a wave energy converter in conjunction with satellite wave-height data from the EU Copernicus Marine Service database (Ardhuin et al., 2010 [20], and Janssen et al., 2014 [21]). The capital and operational costs for electricity generation from wave energy and the hydrogen production costs were consolidated to yield an estimate of the potential cost of hydrogen production from wave power at the chosen location.
2.1. Data Collection Tools
2.1.1. Satellite-Based Data from Open Database
The E.U. Copernicus Marine Service (wave height database) Global analysis forecast provides time-resolved significant wave-height data based on satellite measurements. The dataset used for this research is the Global analysis forecast phy 001-024 hourly merged uv (SMOC) Surface and Merged Ocean Currents that contains one dataset. The global high-resolution wave model (CMES GLOBAL_ANALYSIS_FORECAST_WAV_001_027) was used (Ardhuin et al., 2010) [20]. This data has a geographical resolution of 1/12° latitude and longitude. In the study, the data extracted from E.U. Copernicus used a time resolution of 3 h. E.U. Copernicus was used to acquire significant wave height data at the location zoned for the wave farm.
2.1.2. Simulation of Wave Energy Convertors (WECs) and Wave-Field
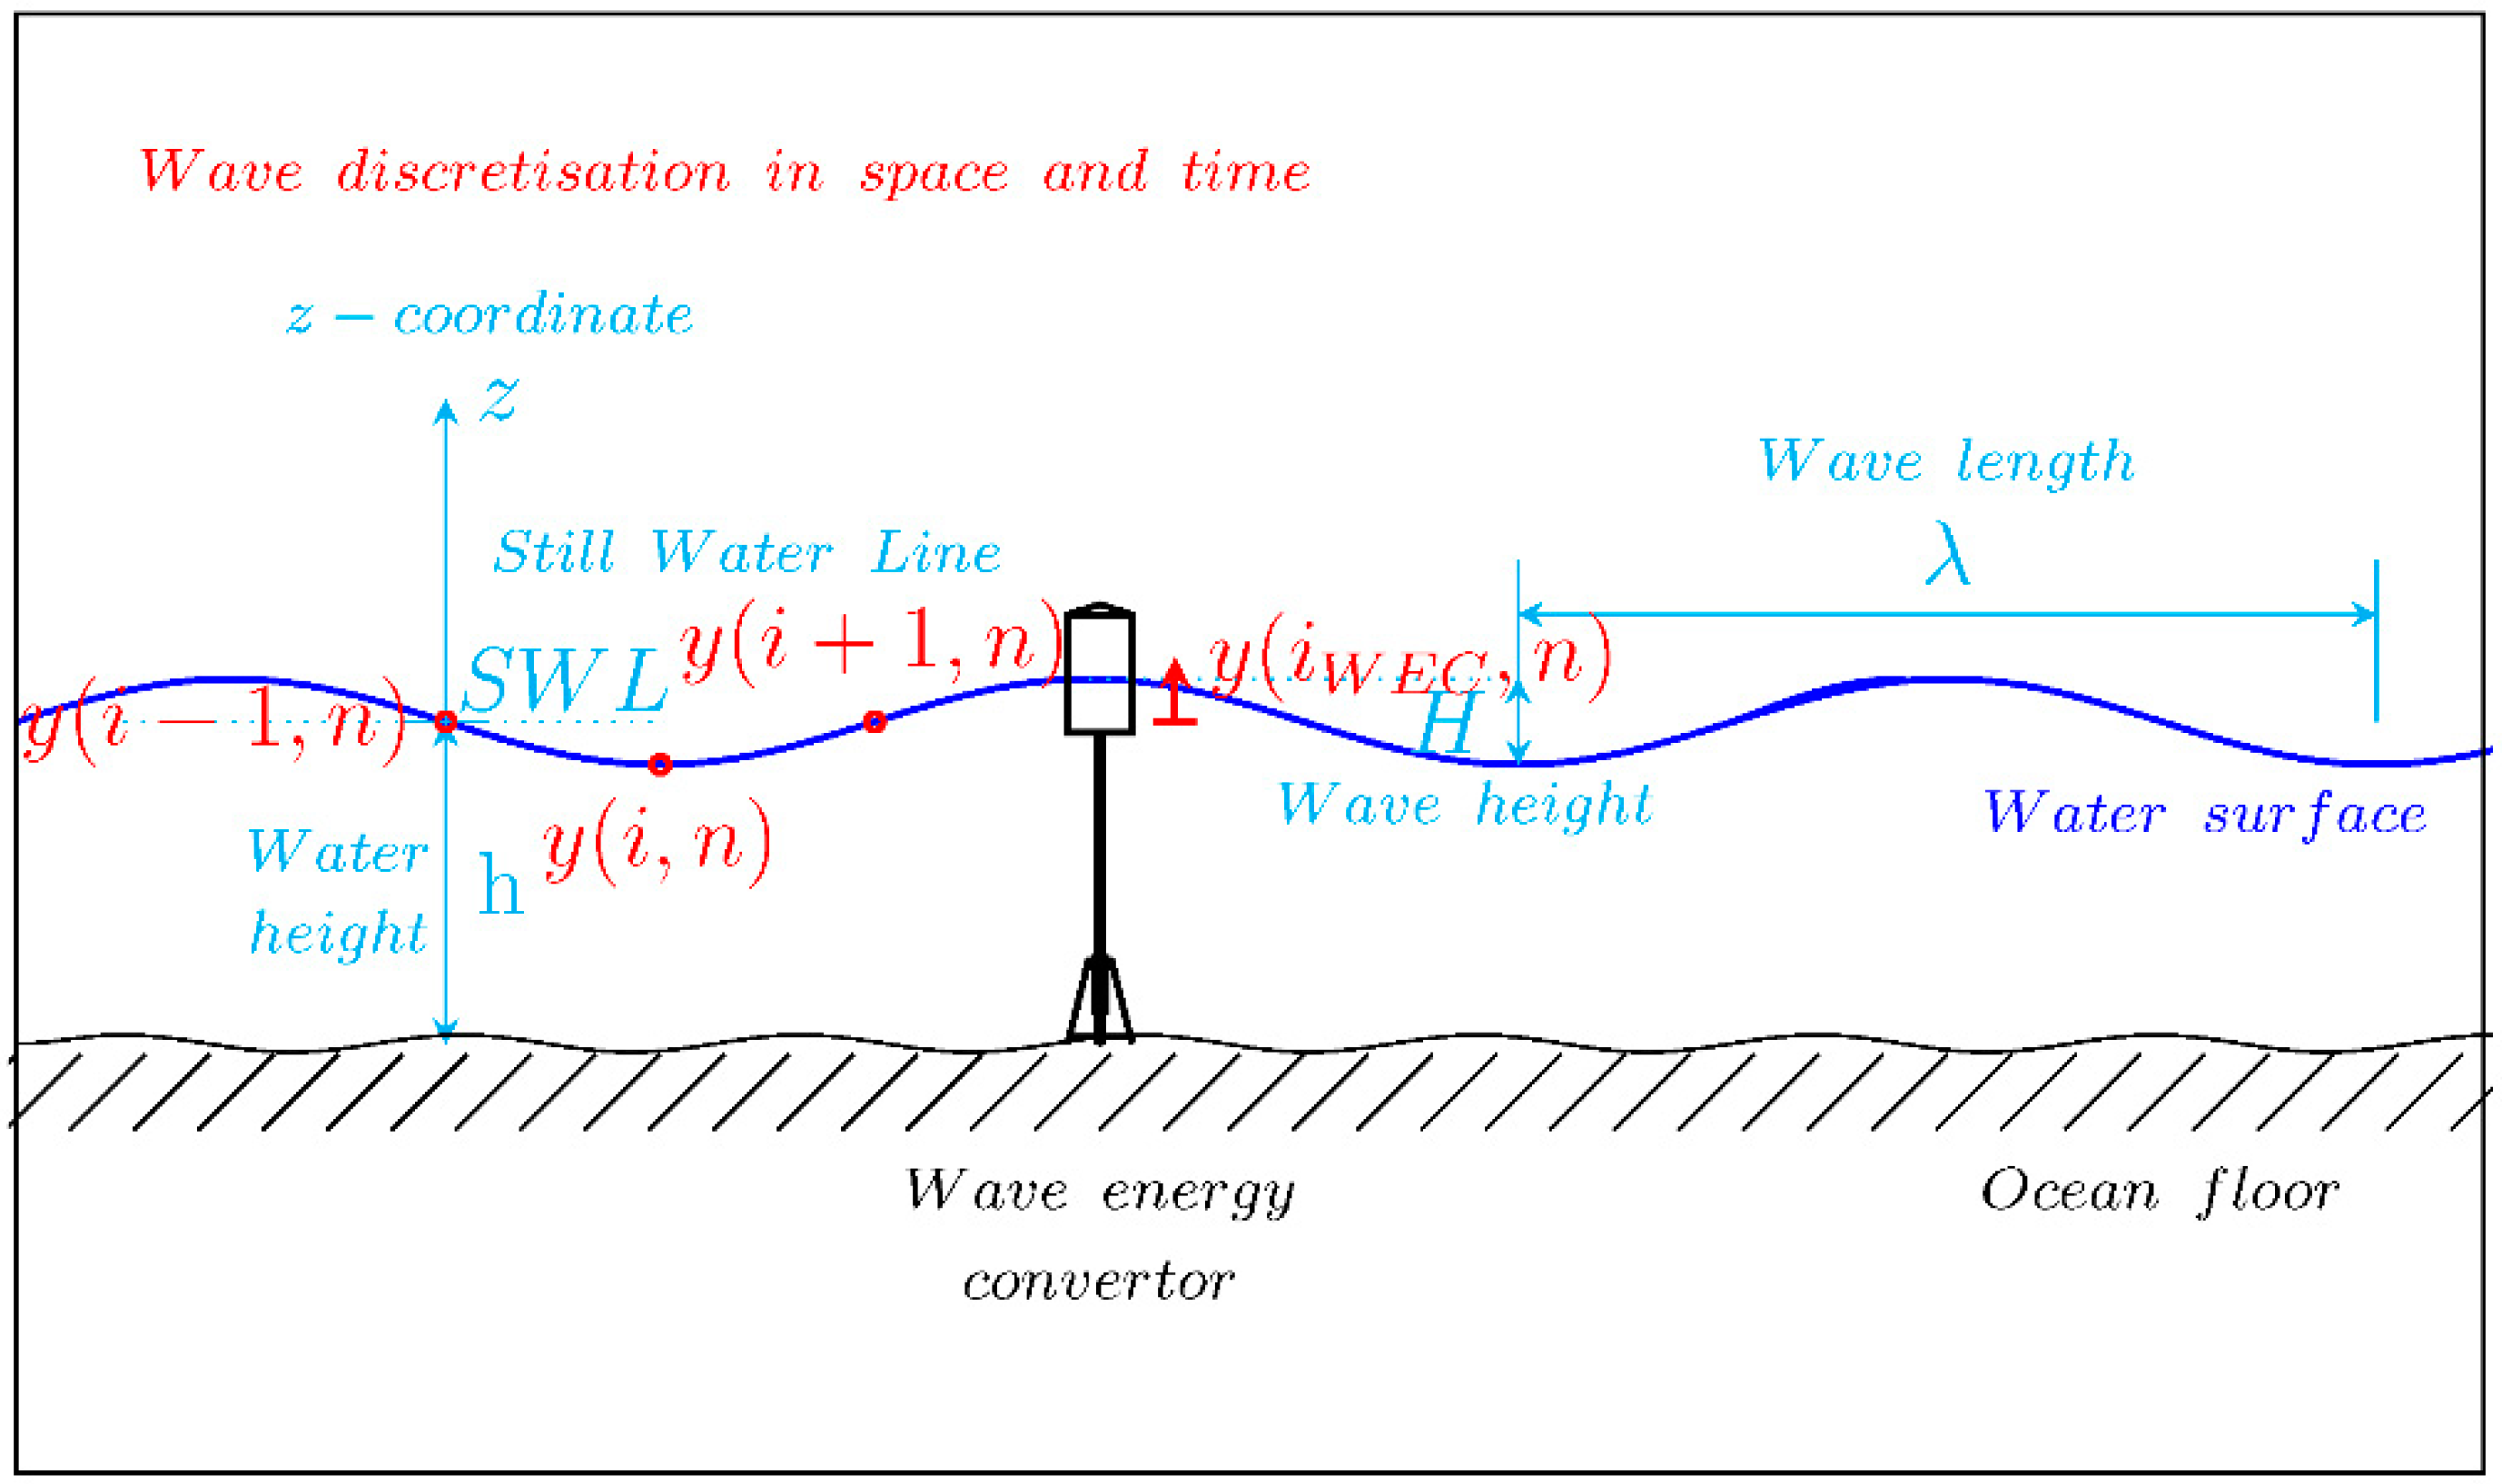
The dynamic response and power capture ability of a varying number of wave energy converters (WECs) located in series were simulated in the time domain using the Euler method. The ocean wave was discretised in one-dimensional space in order to represent the varying water heights of the wave, while the time domain was discretised in order to represent the progression of the wave and the resulting motion of the wave energy convertors (point absorbers). The simulation was coded in the Python programming language (Python 3.9.2) [22] to yield information about the dynamic response in terms of forces, accelerations, velocities, and wave energy converter position over time. The simulation was used to evaluate the potential energy that could be extracted from the motion, yielding an estimate of the capture with ratio (CWR) of the wave energy converter. Figure 1 shows a schematic illustrating the computational domain used for the simulations.
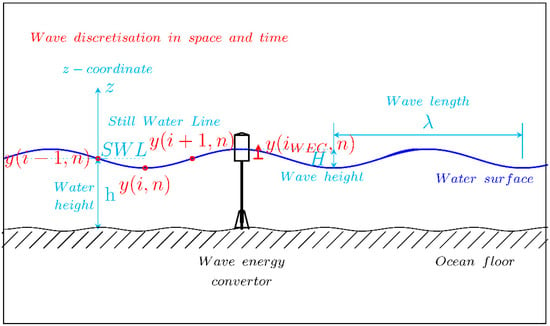
Figure 1.
Definitions in the computational domain of the wave energy converter.
The acceleration of the point absorber was calculated using the force exerted by the water level on the point absorber body and by the power take-off system using Equation (1).
where H is the wave height in meters, ω is the angular frequency in radians, t is the time in seconds, ρw is the density of seawater in kg/m3, ρa is the density of air in kg/m3, A is the top area of the WEC in m2, g is the earth’s gravitational acceleration in m/s2, m is the mass of the WEC in kg, and c is the damping constant of the power-take-off in kg/s. Equation (1) allowed calculating the instantaneous acceleration of the WEC at any moment in time. The acceleration was then numerically integrated over one time step to yield the instantaneous velocity and position of a point absorber, as shown in Equations (2) and (3).
The wave field was applied to the point absorber using the wave equation shown in Equation (4) below to represent the water surface:
The wave equation was solved numerically by discretising space and time domains and can be approximated by Equation (5) below (Giordano and Nakanishi, 2006) [23]. Here, the instantaneous wave height y in meters was calculated for any discrete location i in space and moment n in time:
This allows calculating the wave height of each element in space i and time n using Equation (6).
where r is the propagation speed of the wave in m/s divided by the distance between the discrete spatial locations in m. In order to provide a numerical solution for the wave energy converter motion associated with the ocean wave, a wave data analysis program was written (Python programming language) to simulate three wave energy converters operating at a distance of 157 nodes (6.32 WECs diameters) apart. The interaction between the point absorber and the wave-height was simulated using an attenuation factor, by which the wave height was reduced upon passing each wave energy converter. This attenuation factor was adjusted to match the wave-height reduction recorded in previous experimental studies (Stratigaki et al., 2014) [24]. An example of the Simulation of Wave Energy Convertors (WECs) and Wave-Field program is included as Supplementary Material to this article. The wave height data was extracted from the wave height database (E.U. Copernicus Marine Service, 2021) [25].
2.2. Method Used to Estimate the Hydrogen Production
Hydrogen has been identified as a potential shipping fuel of the future due to its potential abundance and clean nature, as it emits mainly water vapour upon use. Green hydrogen seems to be a promising solution towards a decarbonised energy system, as it can be used for long-term energy storage from various renewable sources. At present, there are limited studies available in the literature on the application of hydrogen as a large-scale energy storage solution in renewable energy input scenarios (Kharel and Shabani, 2018) [13]. The literature available focusses on either small-scale or medium-sized systems. In 2007, a techno-economic analysis was carried out on a hydrogen-based energy storage system to replace batteries and the diesel generator of an existing PV/diesel generator stand-alone system. The investigation was performed to provide electricity to a remote community comprising ten households (Kharel and Shabani, 2018) [13].
The drive towards zero carbon emissions has led to an increase in technology and investments, which are contributing immensely to making hydrogen power more attractive. According to (Paddison, 2021) [26], electrification is the most effective way to decarbonise many sectors, and green hydrogen has the potential to fill the gaps. Currently, the global supply of hydrogen is a vital economic activity worldwide; the demand for hydrogen has grown substantially more than threefold since 1975 (Janke et al., 2020) [27]. Hydrogen is still rising and is mostly produced from fossil fuel, which is grey hydrogen; 2% of coal and 6% of natural gas go into the production of hydrogen (Janke et al., 2020) [27]. As countries are building up renewable energy power capacity and green hydrogen is becoming lower in costs per unit (Lawlor, 2021) [28], renewable plants produce more than what the grid requires; the excess energy can be used to produce green hydrogen.
It is evident the major hurdle that green hydrogen has been faced with is production, storage, and transportation costs and the energy that is required to produce hydrogen. The price of hydrogen highly depends on the location of the customer; this determines how the green hydrogen will be delivered. The storage, transport, and distribution of green hydrogen is important during large-scale production and a dedicated central production plant for deliveries, ensuring remote users also have access to hydrogen (Jovan and Dolanc, 2020) [29]. The storage time of hydrogen can be up to several weeks. Hydrogen can be transported over long distances and across regions in different storage forms, such as ammonia; this solves the problem of time and space mismatch for electricity consumption. However, not all hydrogen storage technologies are viable for long-term storage. Long-term and efficient storage of hydrogen energy is also one of the key issues in the development of hydrogen energy on a large scale and one of the constraints that limit the high price of hydrogen energy (Yan et al., 2023) [30].
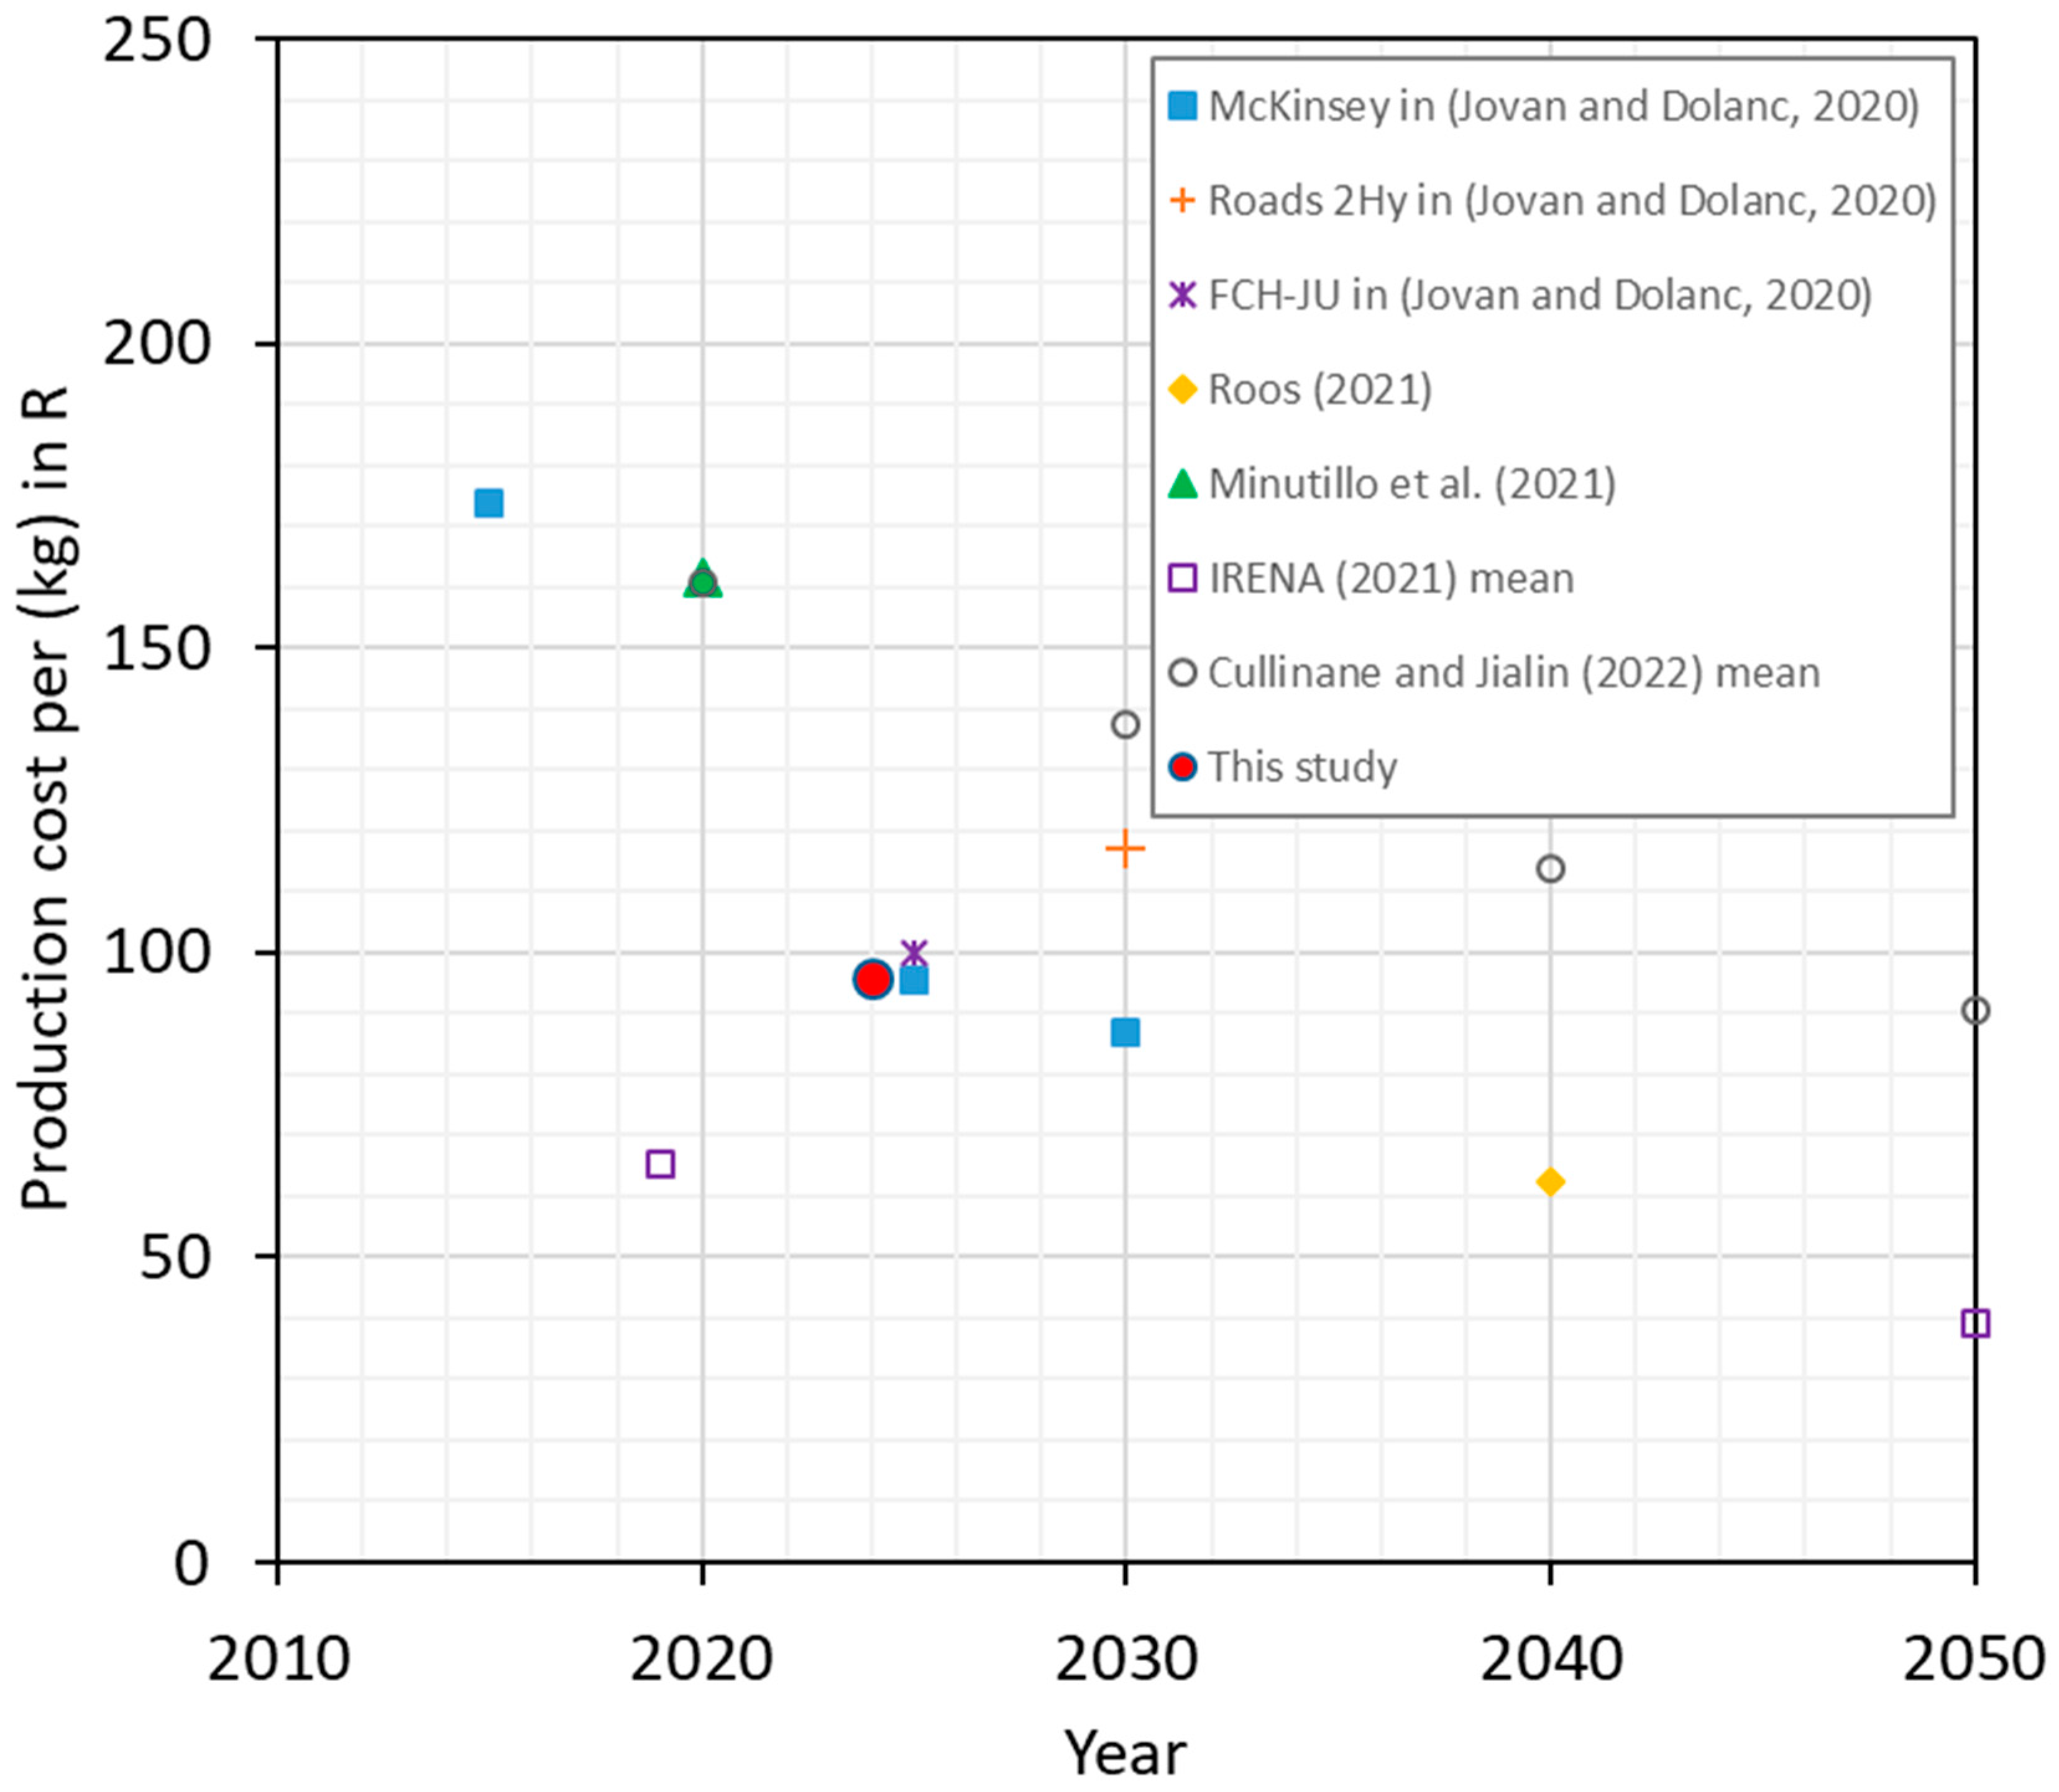
The price of hydrogen can vary from 10 to 60 €/kg, which is roughly R197 to R1182 South African Rands (ZAR). The price of hydrogen with high purity levels is R1182. This type of hydrogen is used for semiconductors and speciality applications (Jovan and Dolanc, 2020) [29]. It is evident that the price of hydrogen will be highly influenced by production and distribution costs. With electrolysers and renewables predicted to decrease in costs and fossil fuel prices rising, capital costs can be expected to fall by 64% by 2030 (Paddison, 2021) [26]. Figure 2 shows how the production cost for hydrogen is expected to reduce over the coming decades. Some studies have analysed and predicted the future of retail hydrogen prices. The retail price of hydrogen will gradually decrease and will potentially drop down to around R86.85 from R121.59 per kg of hydrogen by 2030 (Jovan and Dolanc, 2020) [29].
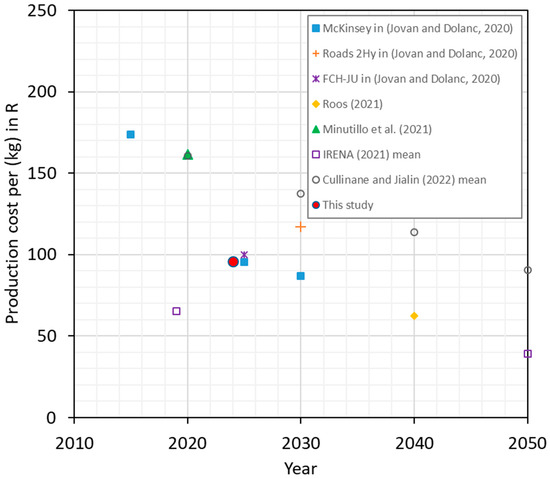
Figure 2.
Predicted price of hydrogen between 2010 and 2050 (R19.70 = 1 EUR, 22 May 2024) [29,31,32,33,34].
Electrolyser manufacturers are reducing investment costs mainly through economies of scales (Paddison, 2021) [26]. There are devices that can produce hydrogen for R116.28/kg; before 2030, manufacturers want to bring down the cost to R24.48/kg (Lichner, 2020) [35]. In 2018, an estimated cost of an electrolyser produced a standard cubic meter of hydrogen in an hour at R116 280; currently, prices have fallen between R91 800 and R74 970 (Linchner, 2020) [35]. The water quality is a great influencer on the service life of an electrolyser, as impurities accumulate in the pores of the membrane and block them. Another factor that tends to destroy electrolysis cells is the temperature; excess load tends to lead to high temperatures, and unevenly coated electrodes have the potential to create hot spots (Linchner, 2020) [35]. NMB is one of the Municipalities in South Africa that is regarded as a water-stress municipality; in 2014, freshwater consumption per capita was just over 1200 kilolitres per person per year (Yeneva, 2016) [36]. It is important to note the state of water resources in NMB to identify future needs and water availability; hence, for the purpose of this study, it would be feasible to make use of seawater instead of freshwater due to water challenges the municipality faces. Electrolysis from seawater is one of the promising ways in which we can potentially alleviate the use of high demand for fresh water (Mohammed-Ibrahim and Moussab, 2020) [37]. According to a study by (Hausamann et al., 2021) [38] the energy requirements of capital and operating costs of seawater desalination are marginal compared to those of water splitting.
Through the use of seawater, there will be an impact on the life span of an electrolyser. However, there is a need for efficient and robust electrocatalysts to sustain corrosion from chloride. Seawater contains a high quantity of aggressive chloride anions; electrolysis in seawater needs an efficient electrocatalyst to withstand against the chloride erosion, mainly for the anode (Mohammed-Ibrahim and Moussab, 2020) [37]. The stability for corrosion is a small portion for the long-term stability of the electrode; the fabrication of a dual-layer anode and activation can play a role against chloride corrosion, which could mean long-term stability for the electrolyte in the seawater (Mohammed-Ibrahim and Moussab, 2020) [37]. The lifetime of an electrolyser is vulnerable to unavoidable impurities, changing feed as seawater changes seasonally and topologically, corrosive oxidation species, blocking of ion exchange membranes, and biofouling. Furthermore, the current technology and direct seawater electrolyser must be operated at a high flow velocity with a design that facilitates washing deposited species away and regular acid cleaning (Hausmann et al., 2021) [38]. This may potentially lead to high maintenance and operational costs; however, prolong the lifespan of the eletrolyser. Electrolysis in seawater is a promising approach to generating clean hydrogen energy; it could serve as an alternative for grid-scale freshwater electrolysis, which could eliminate heavy strain on the high demand of freshwater (Mohammed-Ibrahim and Moussab, 2020) [37].
2.3. Selection of a Suitable Location for the Wind Farm
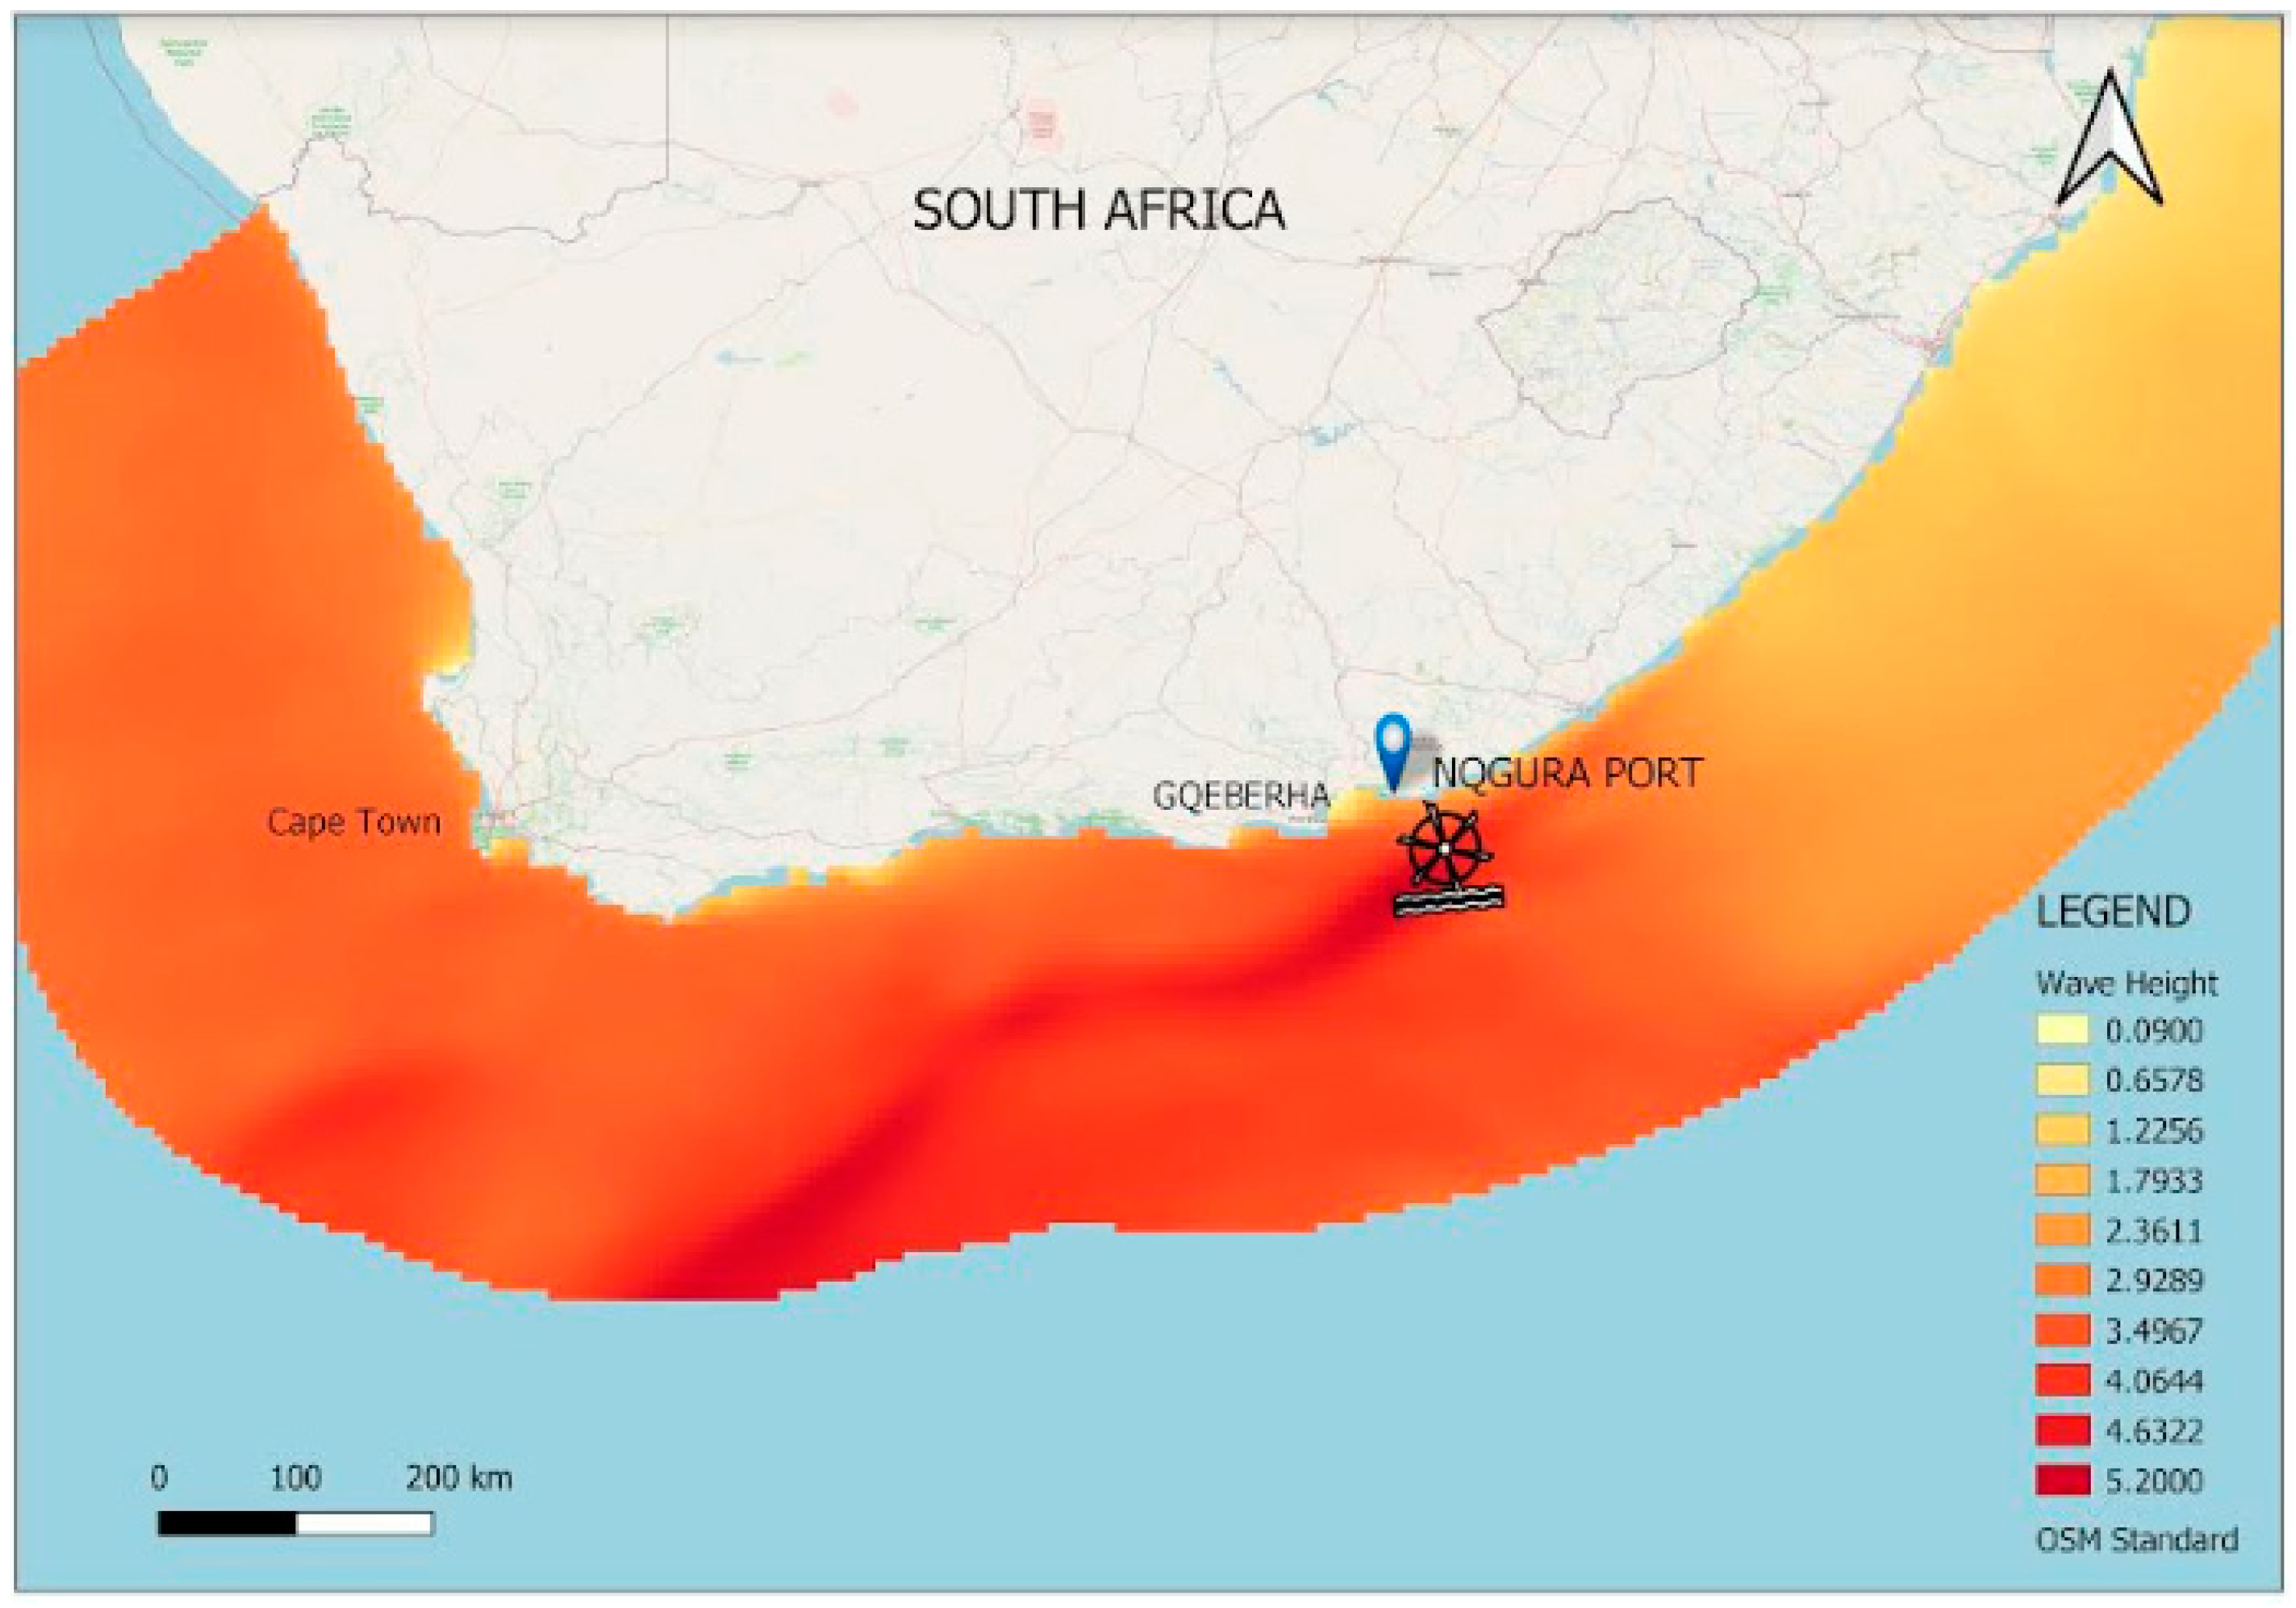
In the study, a suitable location was identified for the wave farm, which consists of three-point converters working simultaneously to generate energy from wave power. Selecting a suitable location for a wave farm, various factors need to be considered, including identifying the Exclusive Economic Zone (EEZ), shipping lanes leading to the port, water depth, Marine Spatial Planning (MSP), fisheries, and breakwater where the Wave Energy Convertors (WEC) will be installed. The installation of the wave farm is located in an industrial area more than 2 km from the coastline where there are little or no environmental impacts (Cascajo et al., 2019) [39]. There are various commercial activities occurring in the South African Maritime Zones, which are not limited to tourism, mining, agriculture, fishing, coastal geoengineering, shipping, and renewable energy (Ramulifho, 2014) [40]. The exploitation and exploration of natural resources and coastal developments undermines and disrupts the ability of natural cycles to sustain their natural form, hence the need for MSP planners and environmental specialists to conduct the necessary studies to prevent disruption of marine natural habitat. Further studies should be conducted by MSP and environmental specialists regarding the suitable location of the wave farm. We are aware of the need for zoning the area before any projects or work can take place. Relevant stakeholders and community members to be consulted and engaged regarding the development of a wave farm in their municipality to get their views and opinions regarding the development. The Port of Ngqura was identified as the port choice to lead the hydrogen plant. The Port of Ngqura is a deep sea transshipment port and is the youngest commercial port in South Africa. It started its operations in 2012. Figure 3 below outlines the coordinates of the wave farm, which are 34.16° S and 25.83° E, where the wave farm will be in (NMB). The wave data is extracted from E.U. Copernicus Marine Service, Global Analysis Forecast WAV_001_027.
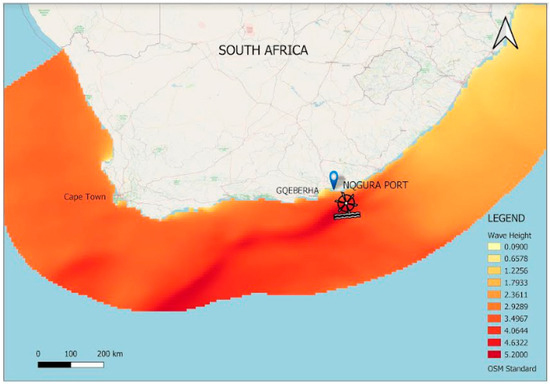
Figure 3.
Location of the Wave Farm in Nelson Mandela Bay Municipality with the average wave height in (m).
3. Results
3.1. Wave Power Validation
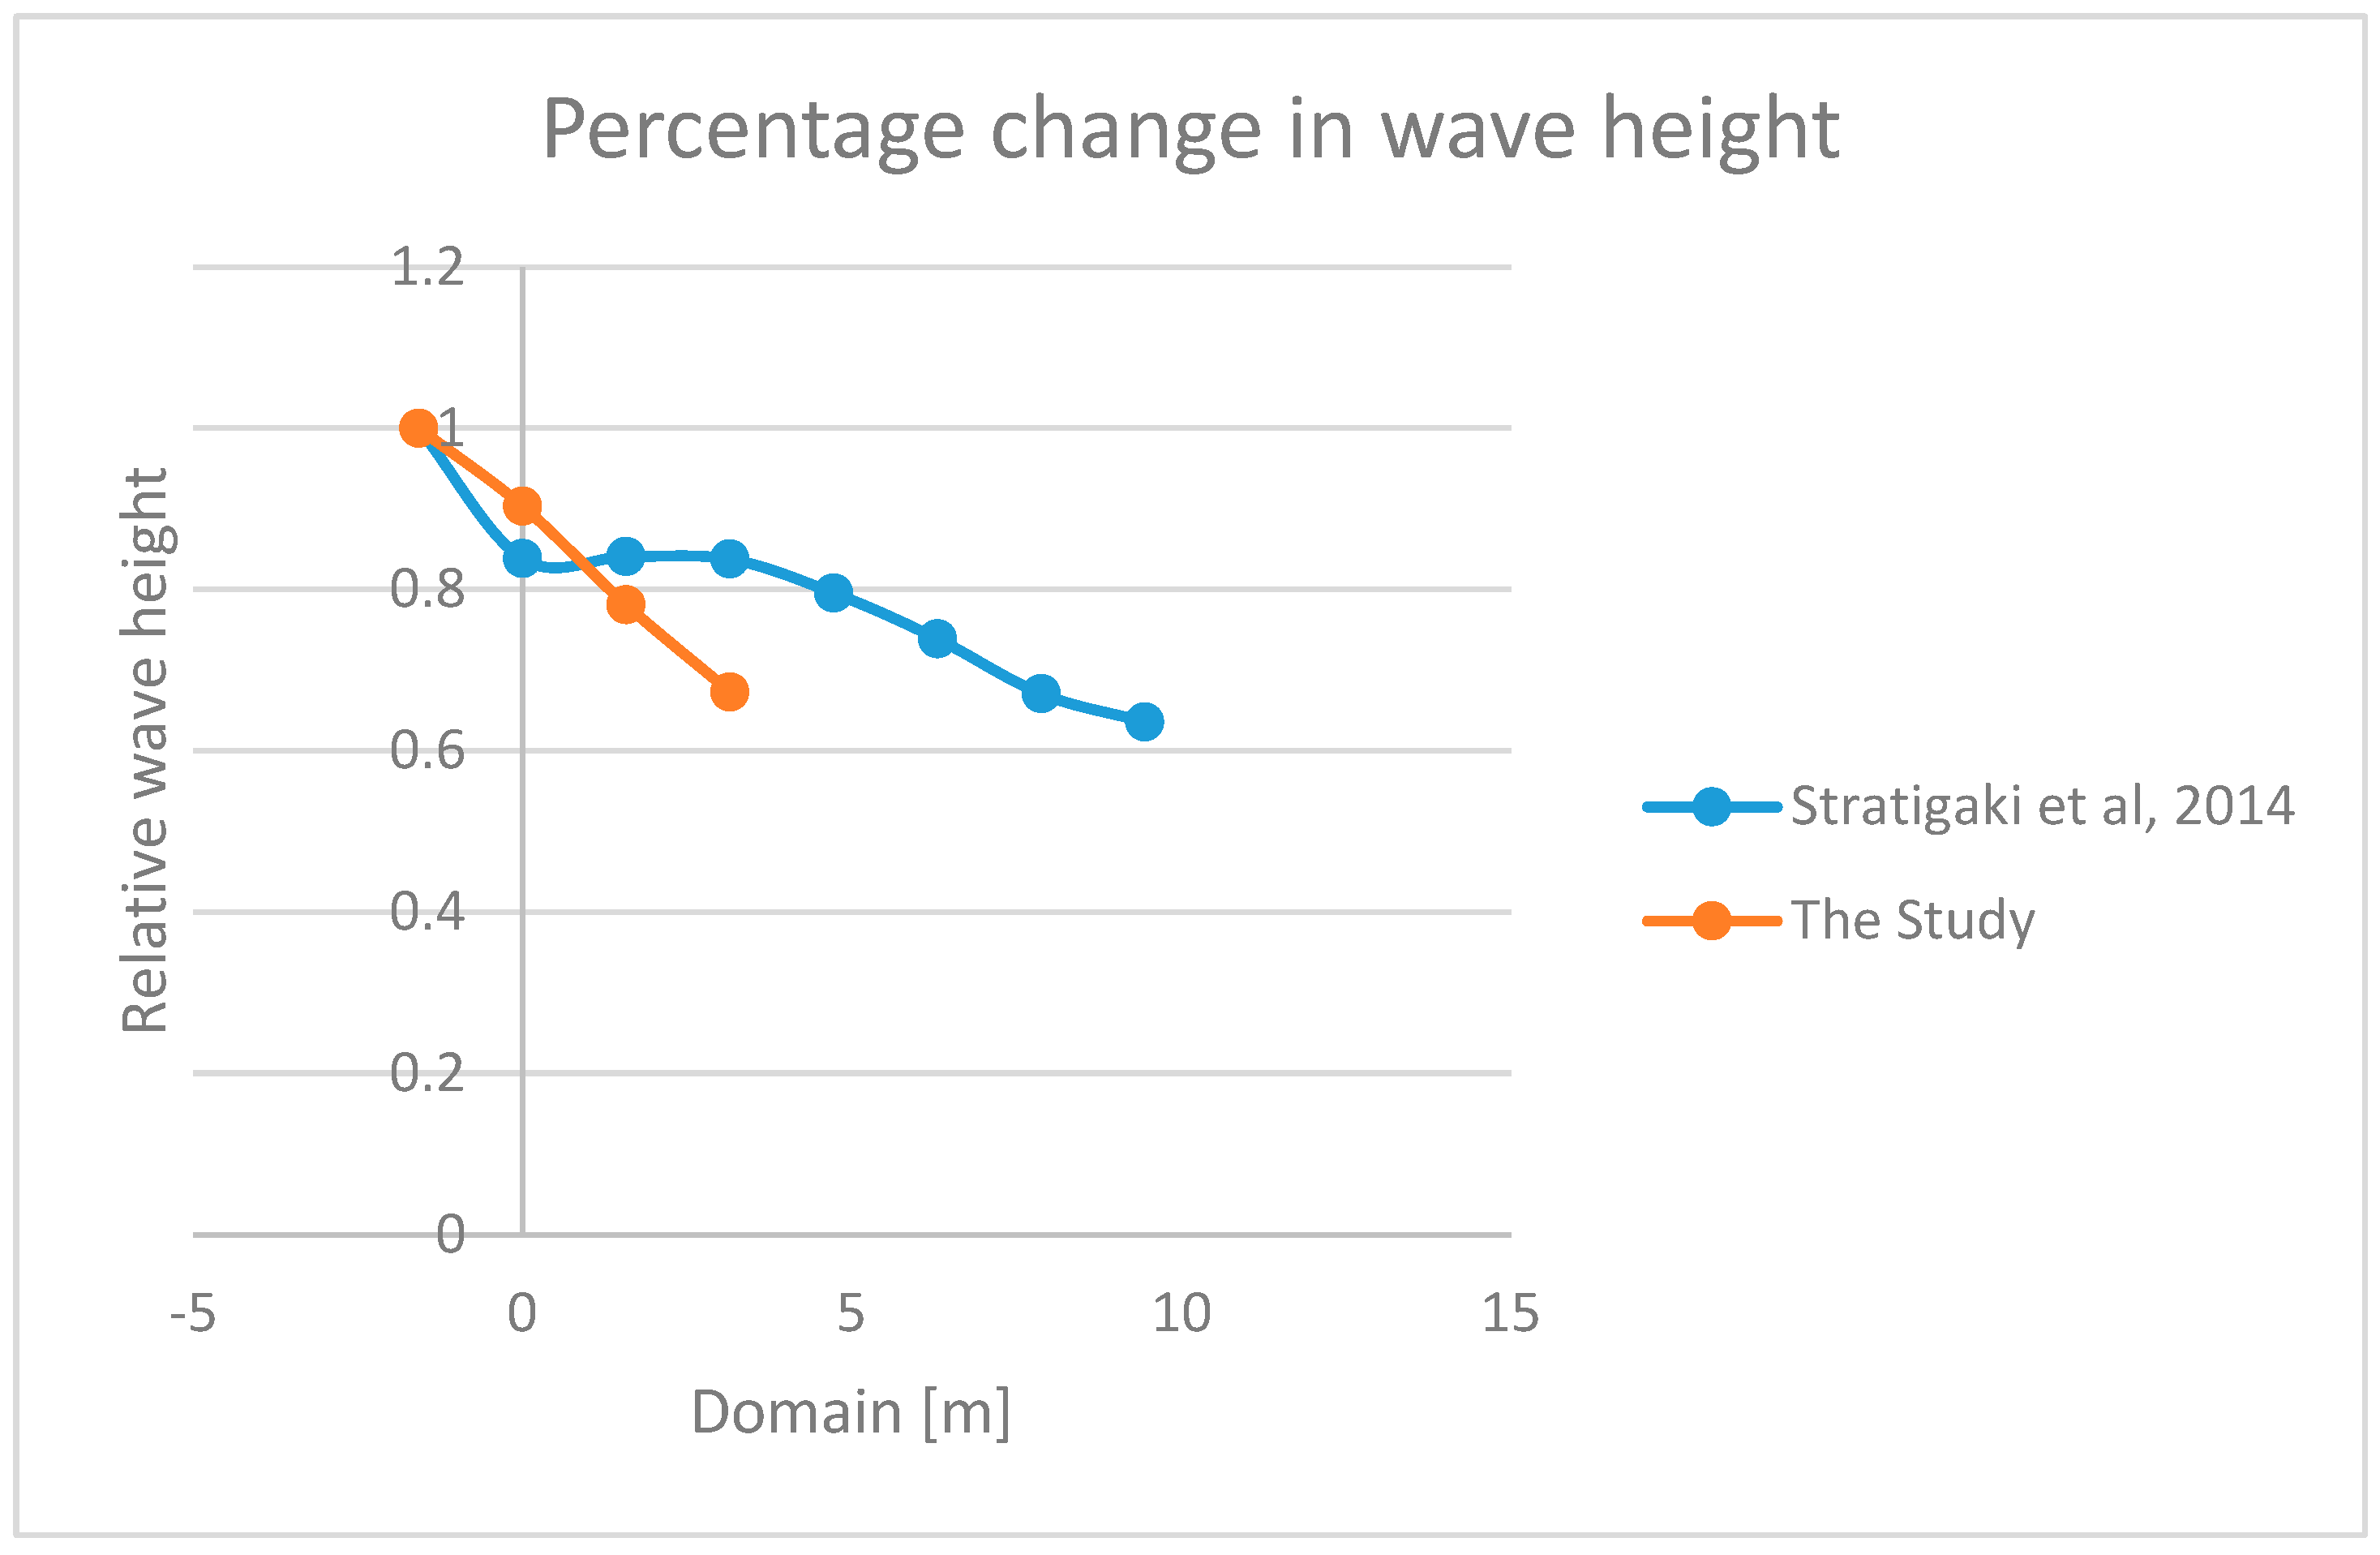
The wave energy convertor simulation model described in Section 2.1. was used to model the change in relative wave height throughout the wave domain and was compared to the experimental study of Stratigaki et al., 2014 [24], as shown in Figure 4. The wave simulations performed using the Euler model wave energy converter array in this study were adapted to the same physical dimensions as the Stratigaki et al., 2014 [24] experiments.
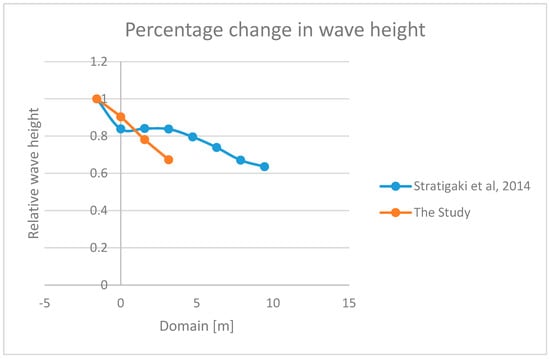
Figure 4.
The percentage change in wave weight for Stratigaki et al., 2014 [24], and this study.
The reasons for wave basin experiments, which use large WECs arrays to study the interactions between converters and the efforts of various users at sea and in coastal areas (Zhang et al., 2021) [41]. In Figure 4, the wave attenuation was 0.016 of the total wave height per wave energy converter passed. The Capture Width Ratio (CWR), according to (Zhang et al., 2021) [41] was around 1% and similar to the 1.75% modelled by this work.
3.2. Wave Energy Potential in the Port of Ngqura
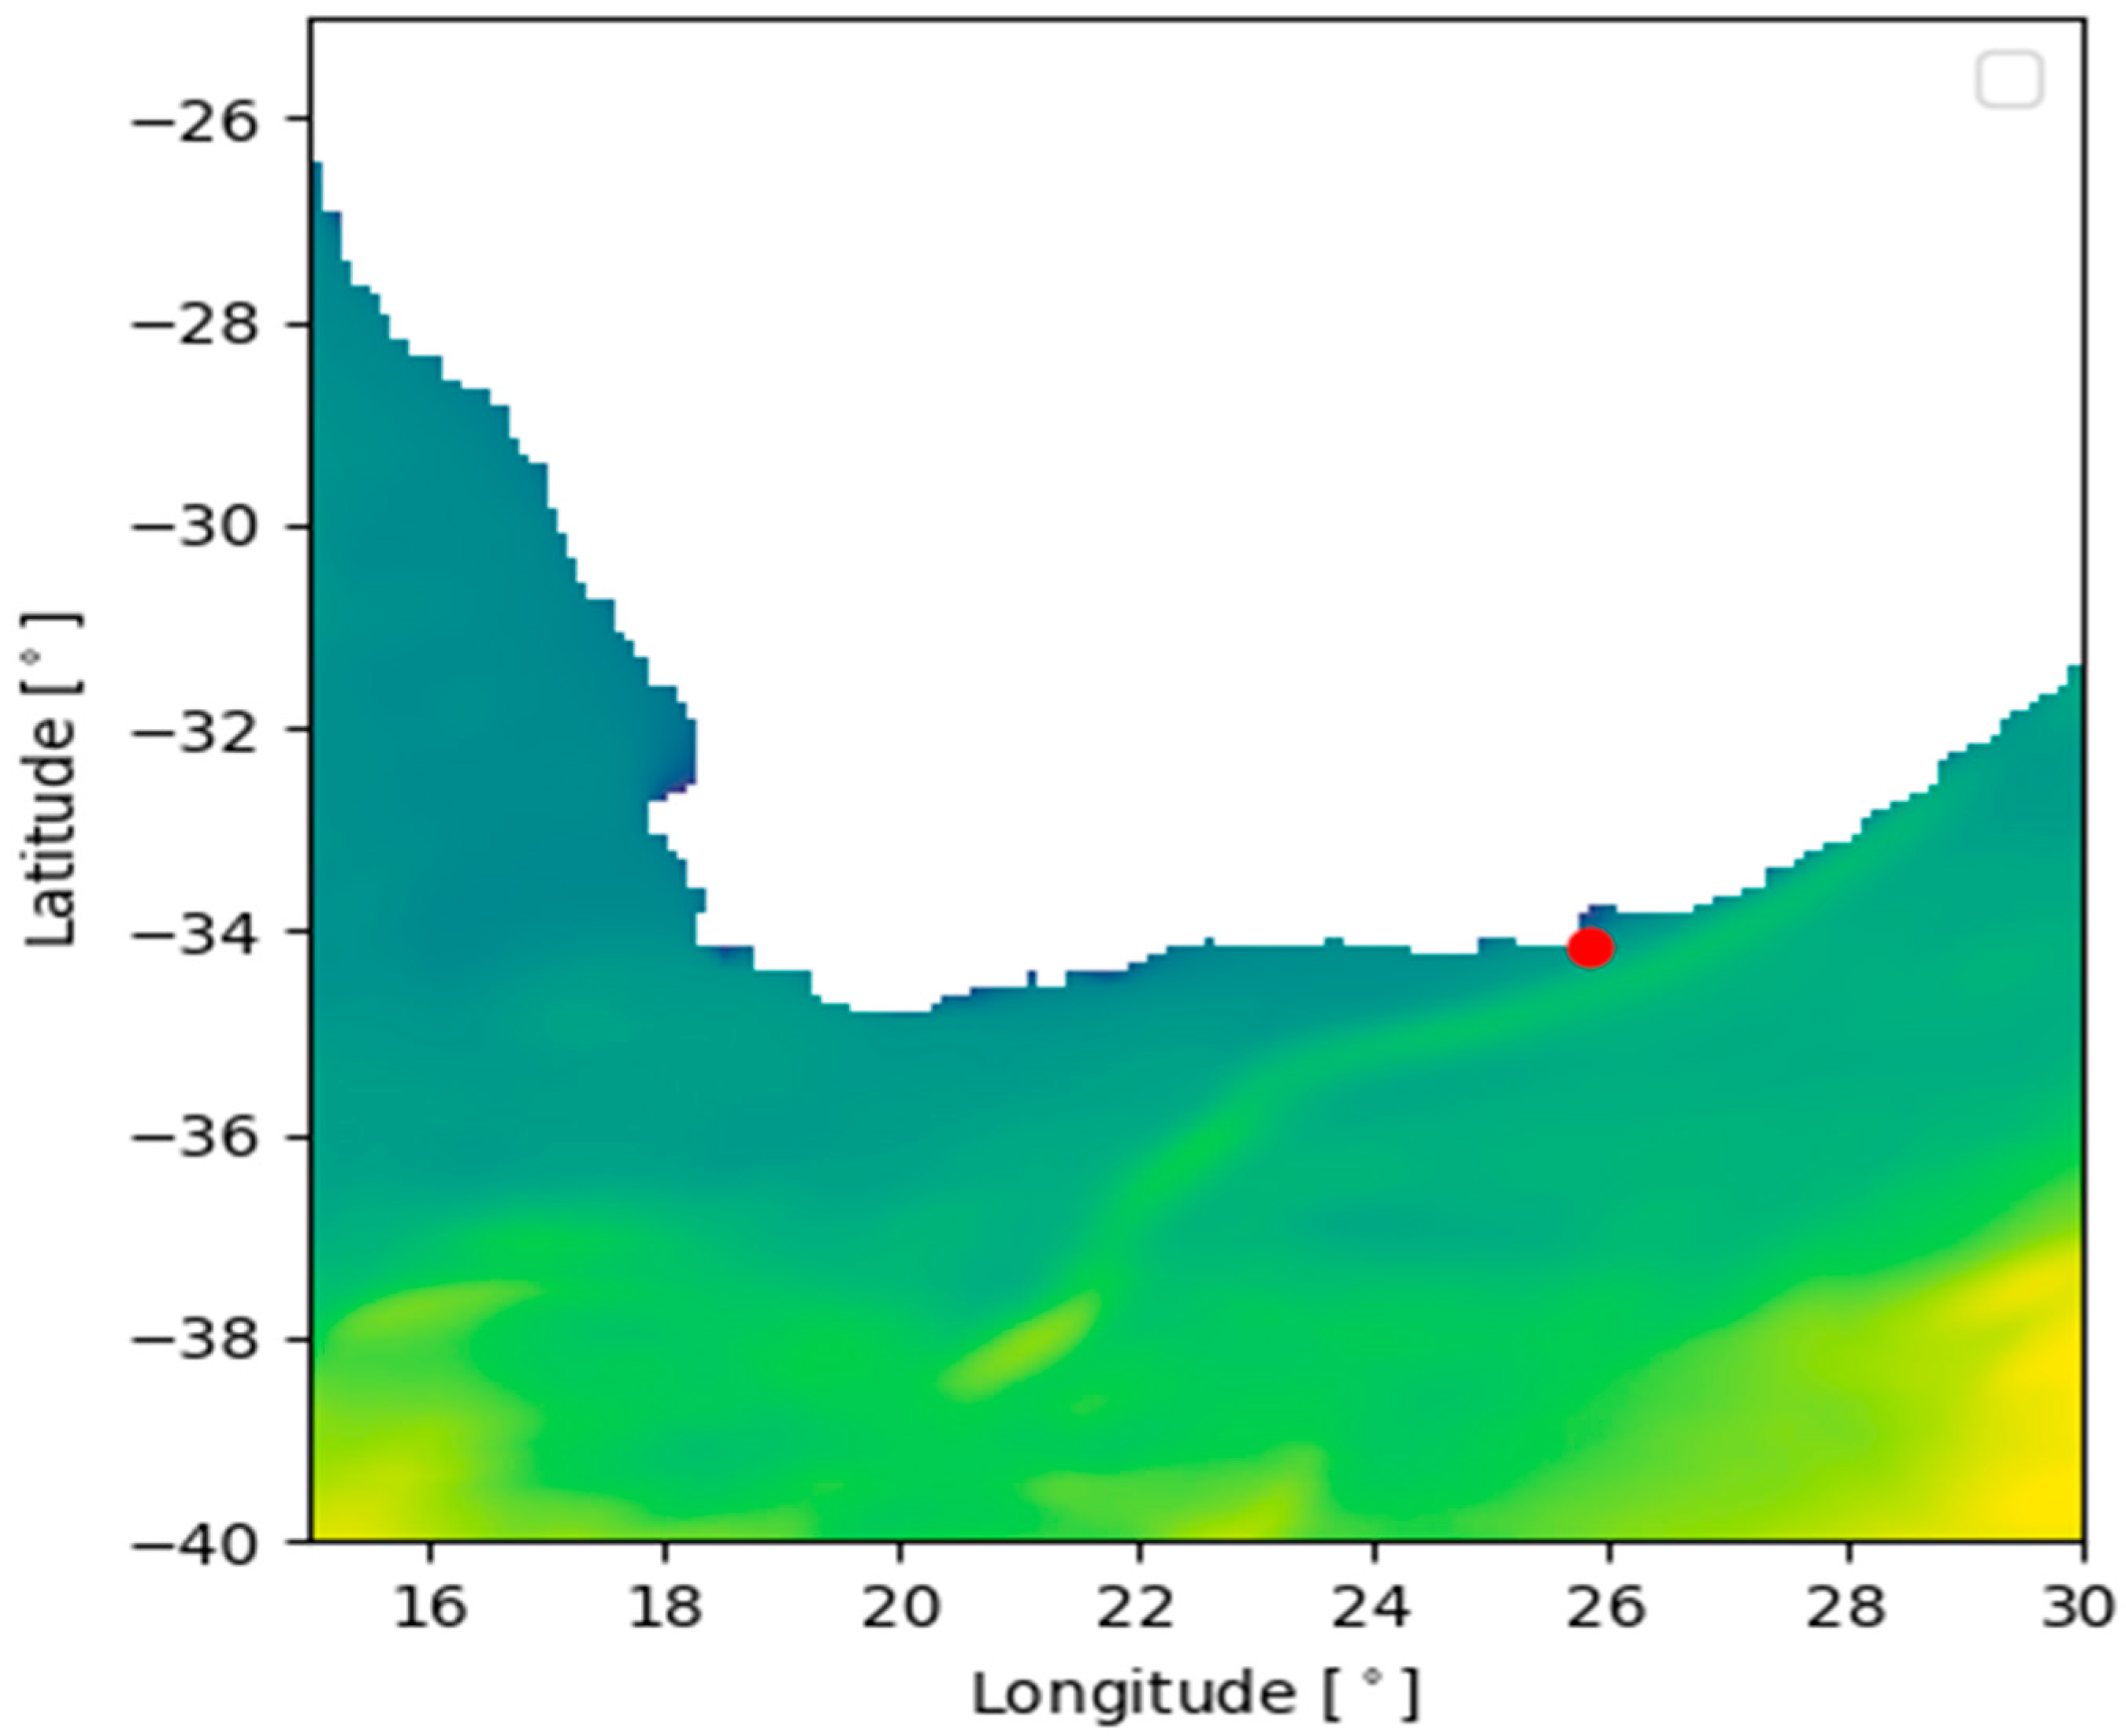
Gqeberha is a medium-sized city on the South Coast of South Africa; it is well known for its high wind conditions. It boasts of two sister ports, the Port of Port Elizabeth and the transshipment Port of Ngqura, which are roughly 20 km apart and are known as the Ports of Nelson Mandela Bay. For the basis of the study, the port of choice is the transshipment Port of Ngqura, and the wave farm will be installed on these coordinates: 34.16° S and 25.83° E. The below Figure 5 represents the location of the wave farm through data extracted from E.U. Copernicus Marine Environment Monitoring Service 2021 (Ardhuin et al., 2010 [20], and Janssen et al., 2014 [21]). The instantaneous visualisation of the relative wave height patterns shows that larger wave heights are attained further offshore. The visualisation of the wave height patterns can be an important tool for predicting the potential for wave energy extraction and in deciding on a suitable location using Marine Spatial Planning (MSP).
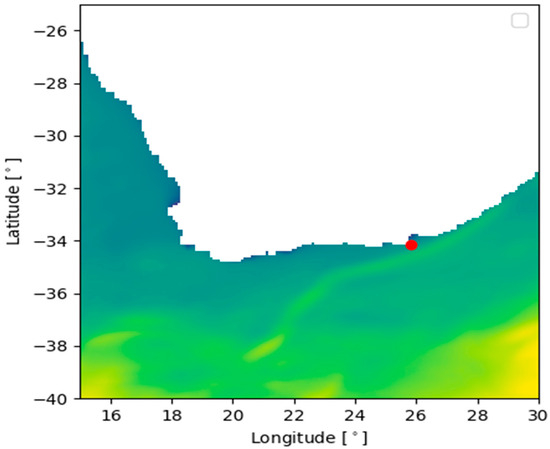
Figure 5.
Location of the wave farm and wave height in Nelson Mandela Bay in August 2020 at the Port of Ngqurha (indicated as red dot).
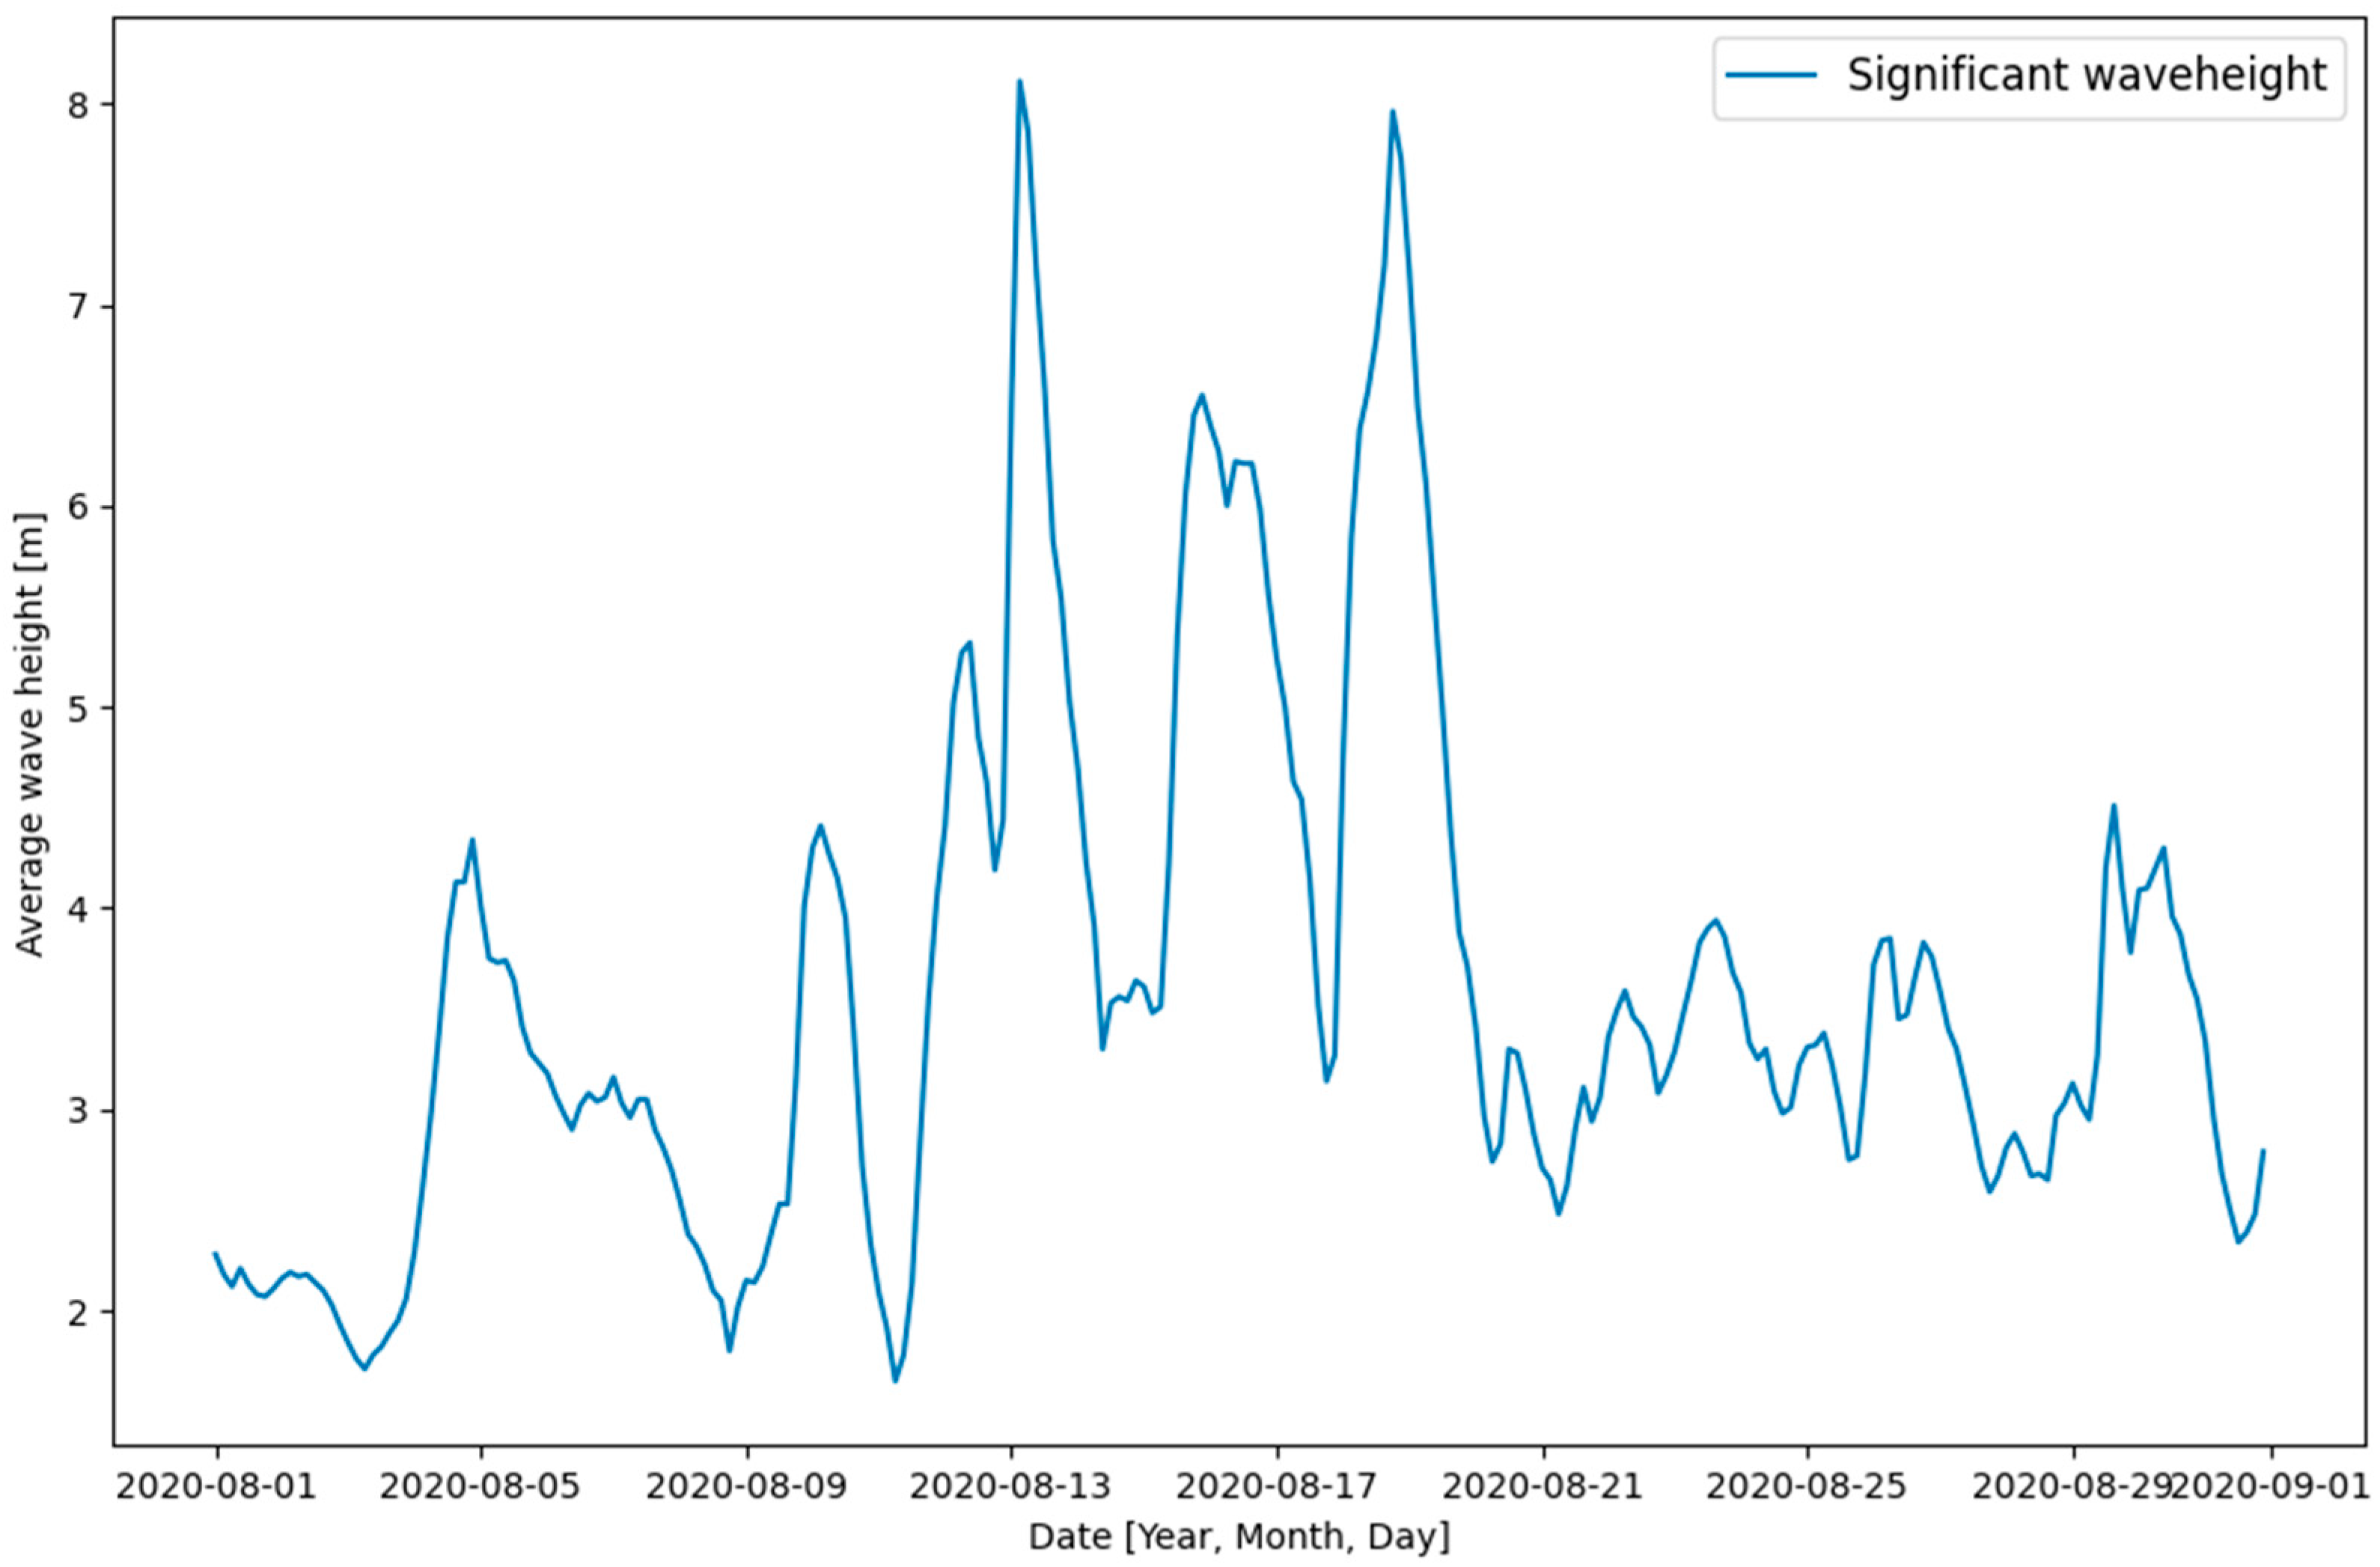
Figure 6 represents an average wave height for August 2020, through data obtained from E.U. Copernicus Marine Service Information (wave height data).
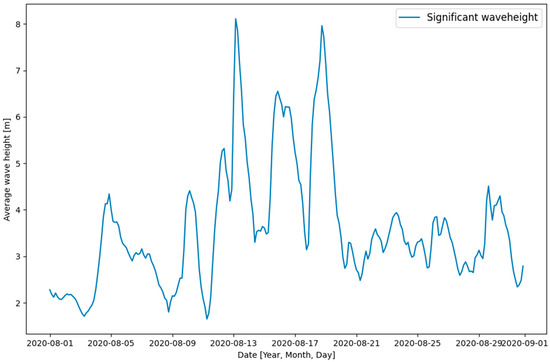
Figure 6.
Average wave height sample over one month (August 2020).
The data allowed studying detailed time-resolved patterns for energy production. In the period of June 2020 to July 2021, we managed to calculate the amount of power produced in the zoned location for the wave farm, highlighting strong variations in the average wave height linked to the weather patterns. Detailed studies of the maximum wave heights are necessary to ensure that the wave energy converters can be designed to ensure their survivability and to ensure accurate assumptions regarding their construction and mooring design. The average wave heights of 8 m shown in Figure 6 highlight the need for designs ensuring strong survivability in this wave-energy-rich location.
3.3. Wave Energy Convertors—Point Absorbers
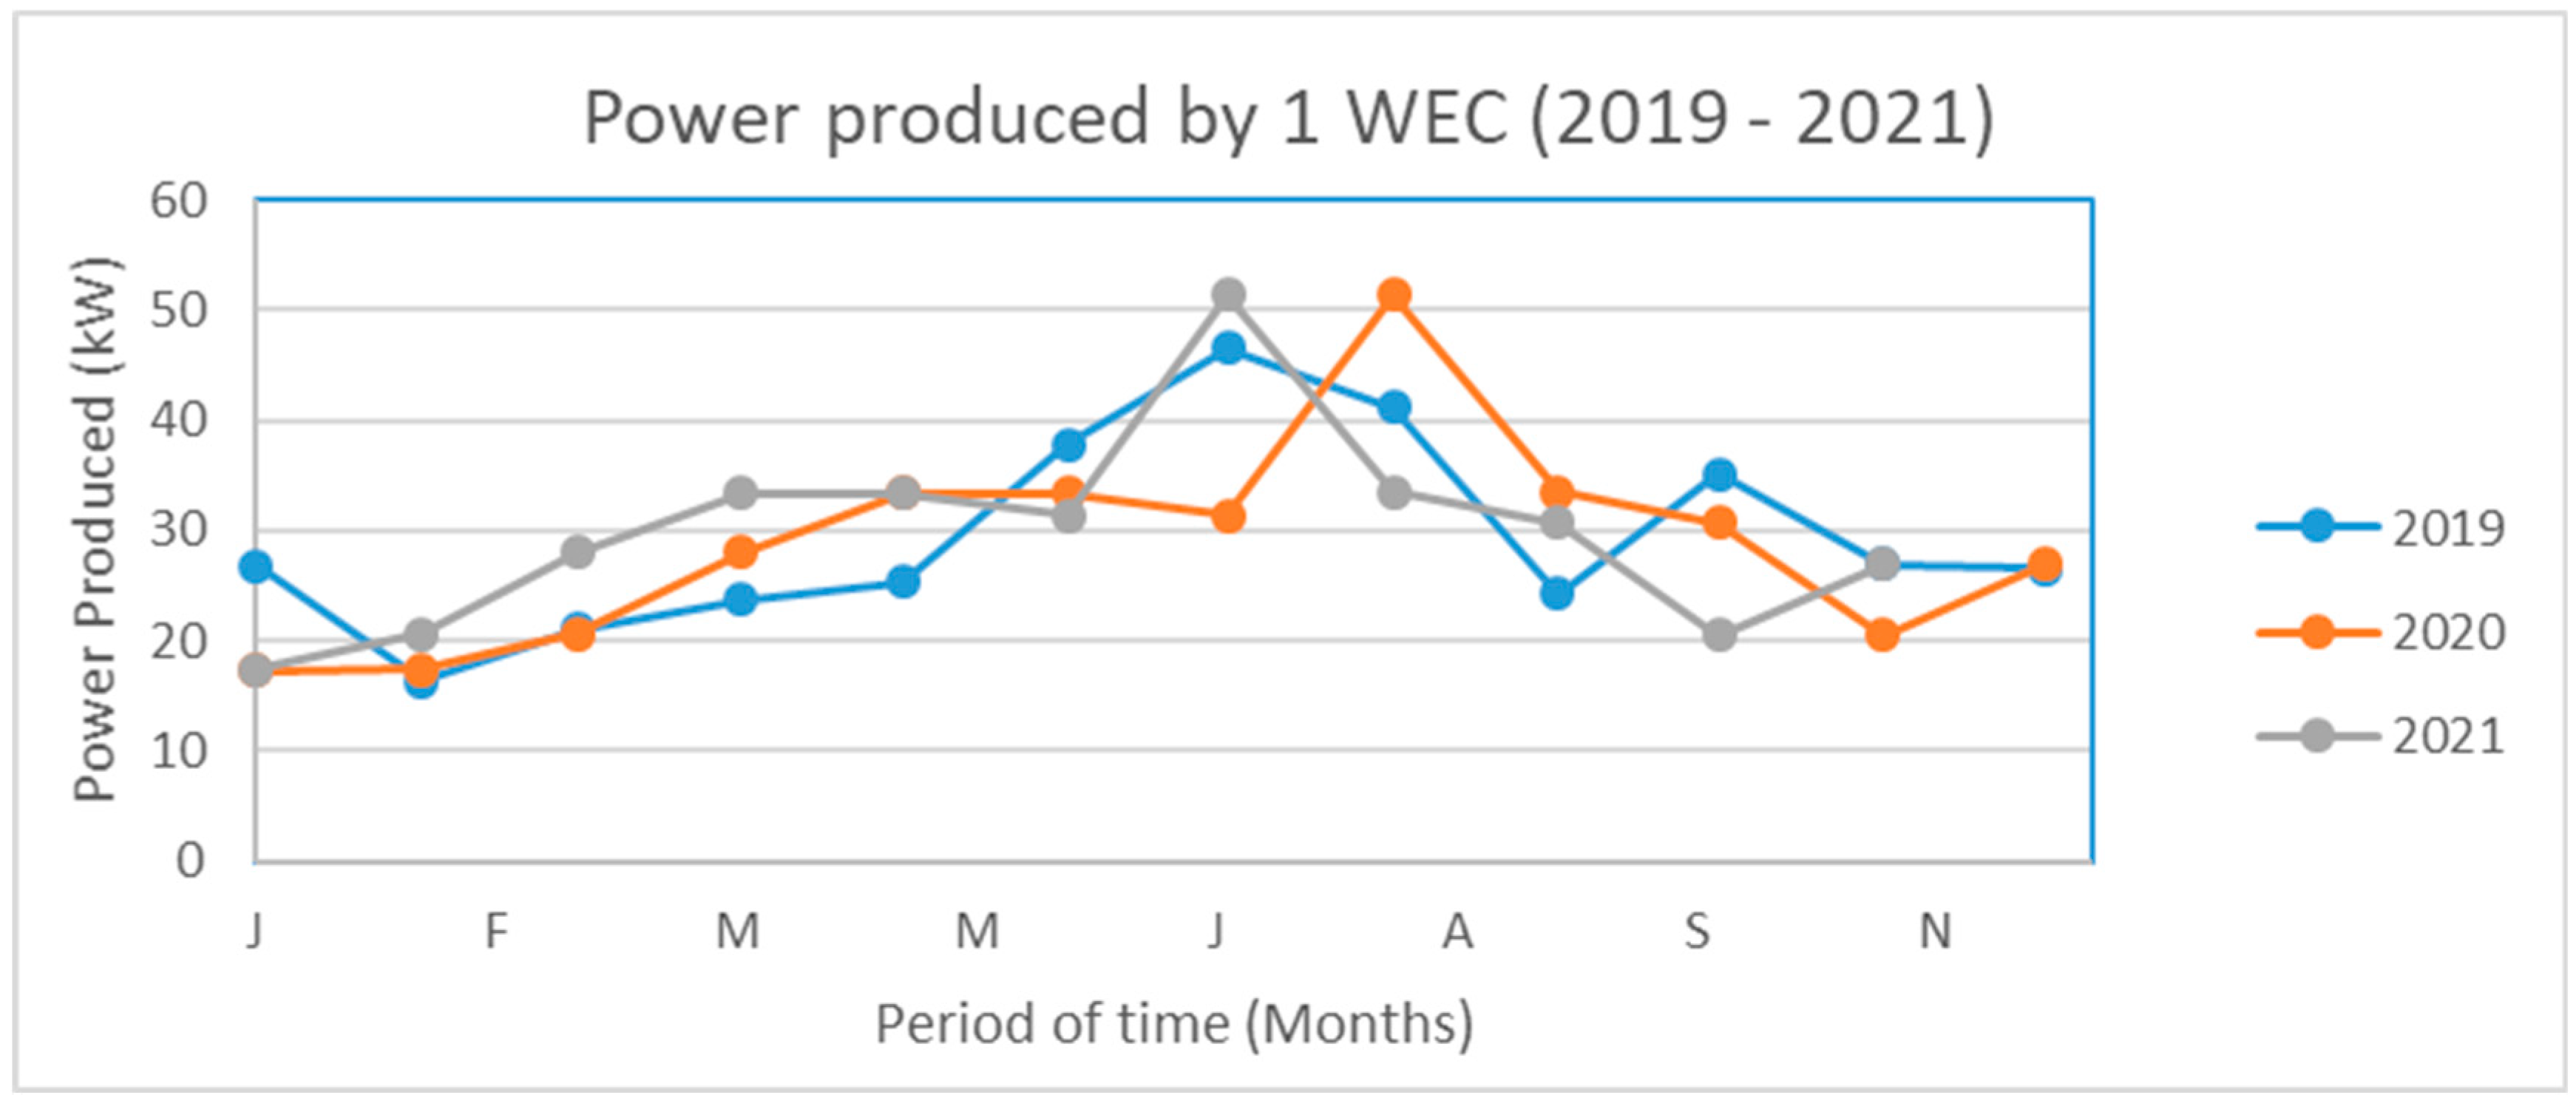
Ocean wave energy as a renewable source has a greater power density compared to wind and solar energy. Point absorbers move up and down by the force of the waves and generators and convert wave energy into electrical energy. Wave Energy Convertors (WECs) point absorbers were simulated using a Euler-method dynamic simulation in combination with the two-dimensional (2D) wave field to illustrate the dynamic response and power capture obtained. Point absorbers consist of relatively low-cost constructions with simpler structures and can effectively capture wave energy in offshore areas. Wave energy can easily be obtained through point absorbers in all directions; in essence, point absorbers have drawn and attracted more attention. For the best and most accurate results of the estimates of power production, it became apparent that it was necessary to evaluate recurrent weather and wave patterns for a prolonged period. Figure 7 shows a comparison of the simulated power produced from January 2019 to August 2021. The figure shows that it was possible to establish patterns in recurring seasonal variations of the power production. The monthly variation in average power was quantified as a standard deviation of 30% of the mean value.
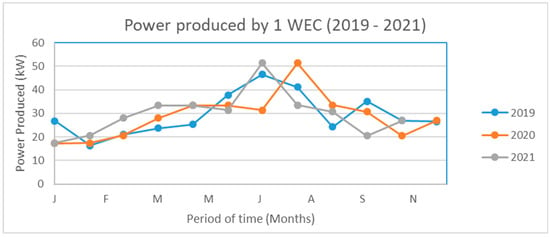
Figure 7.
The monthly power produced from Jan 2019–August 2021 using one energy wave convertor.
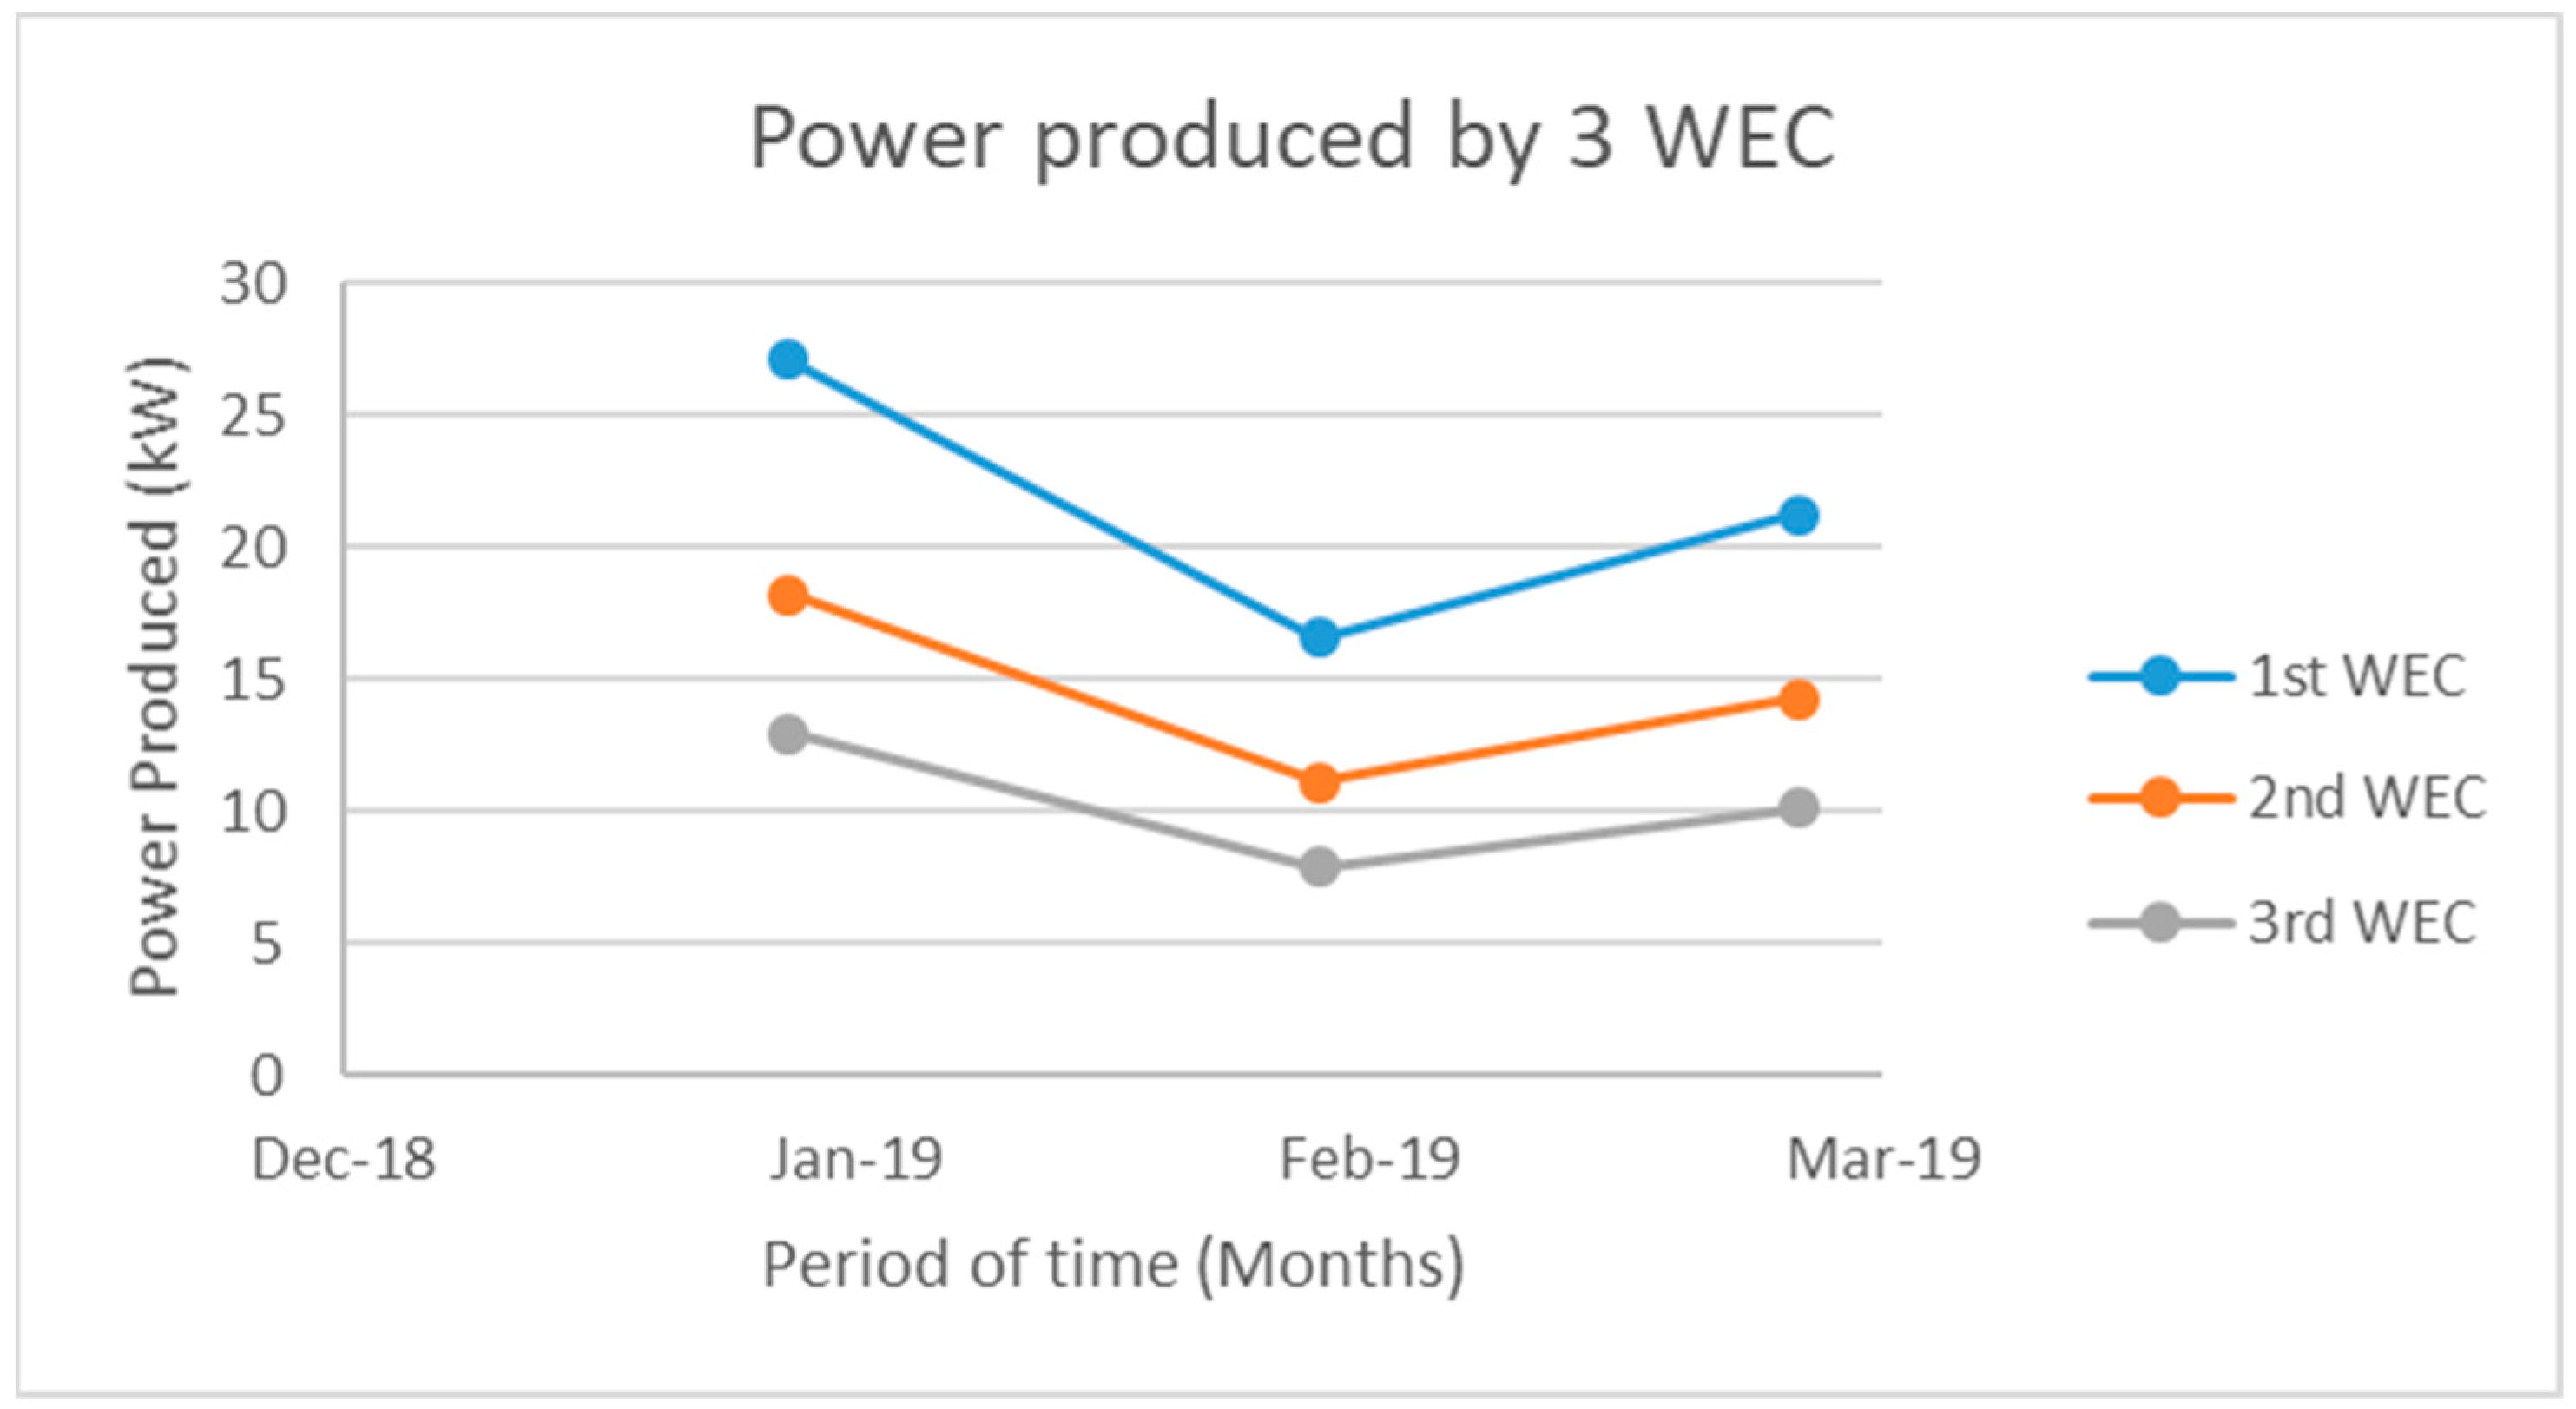
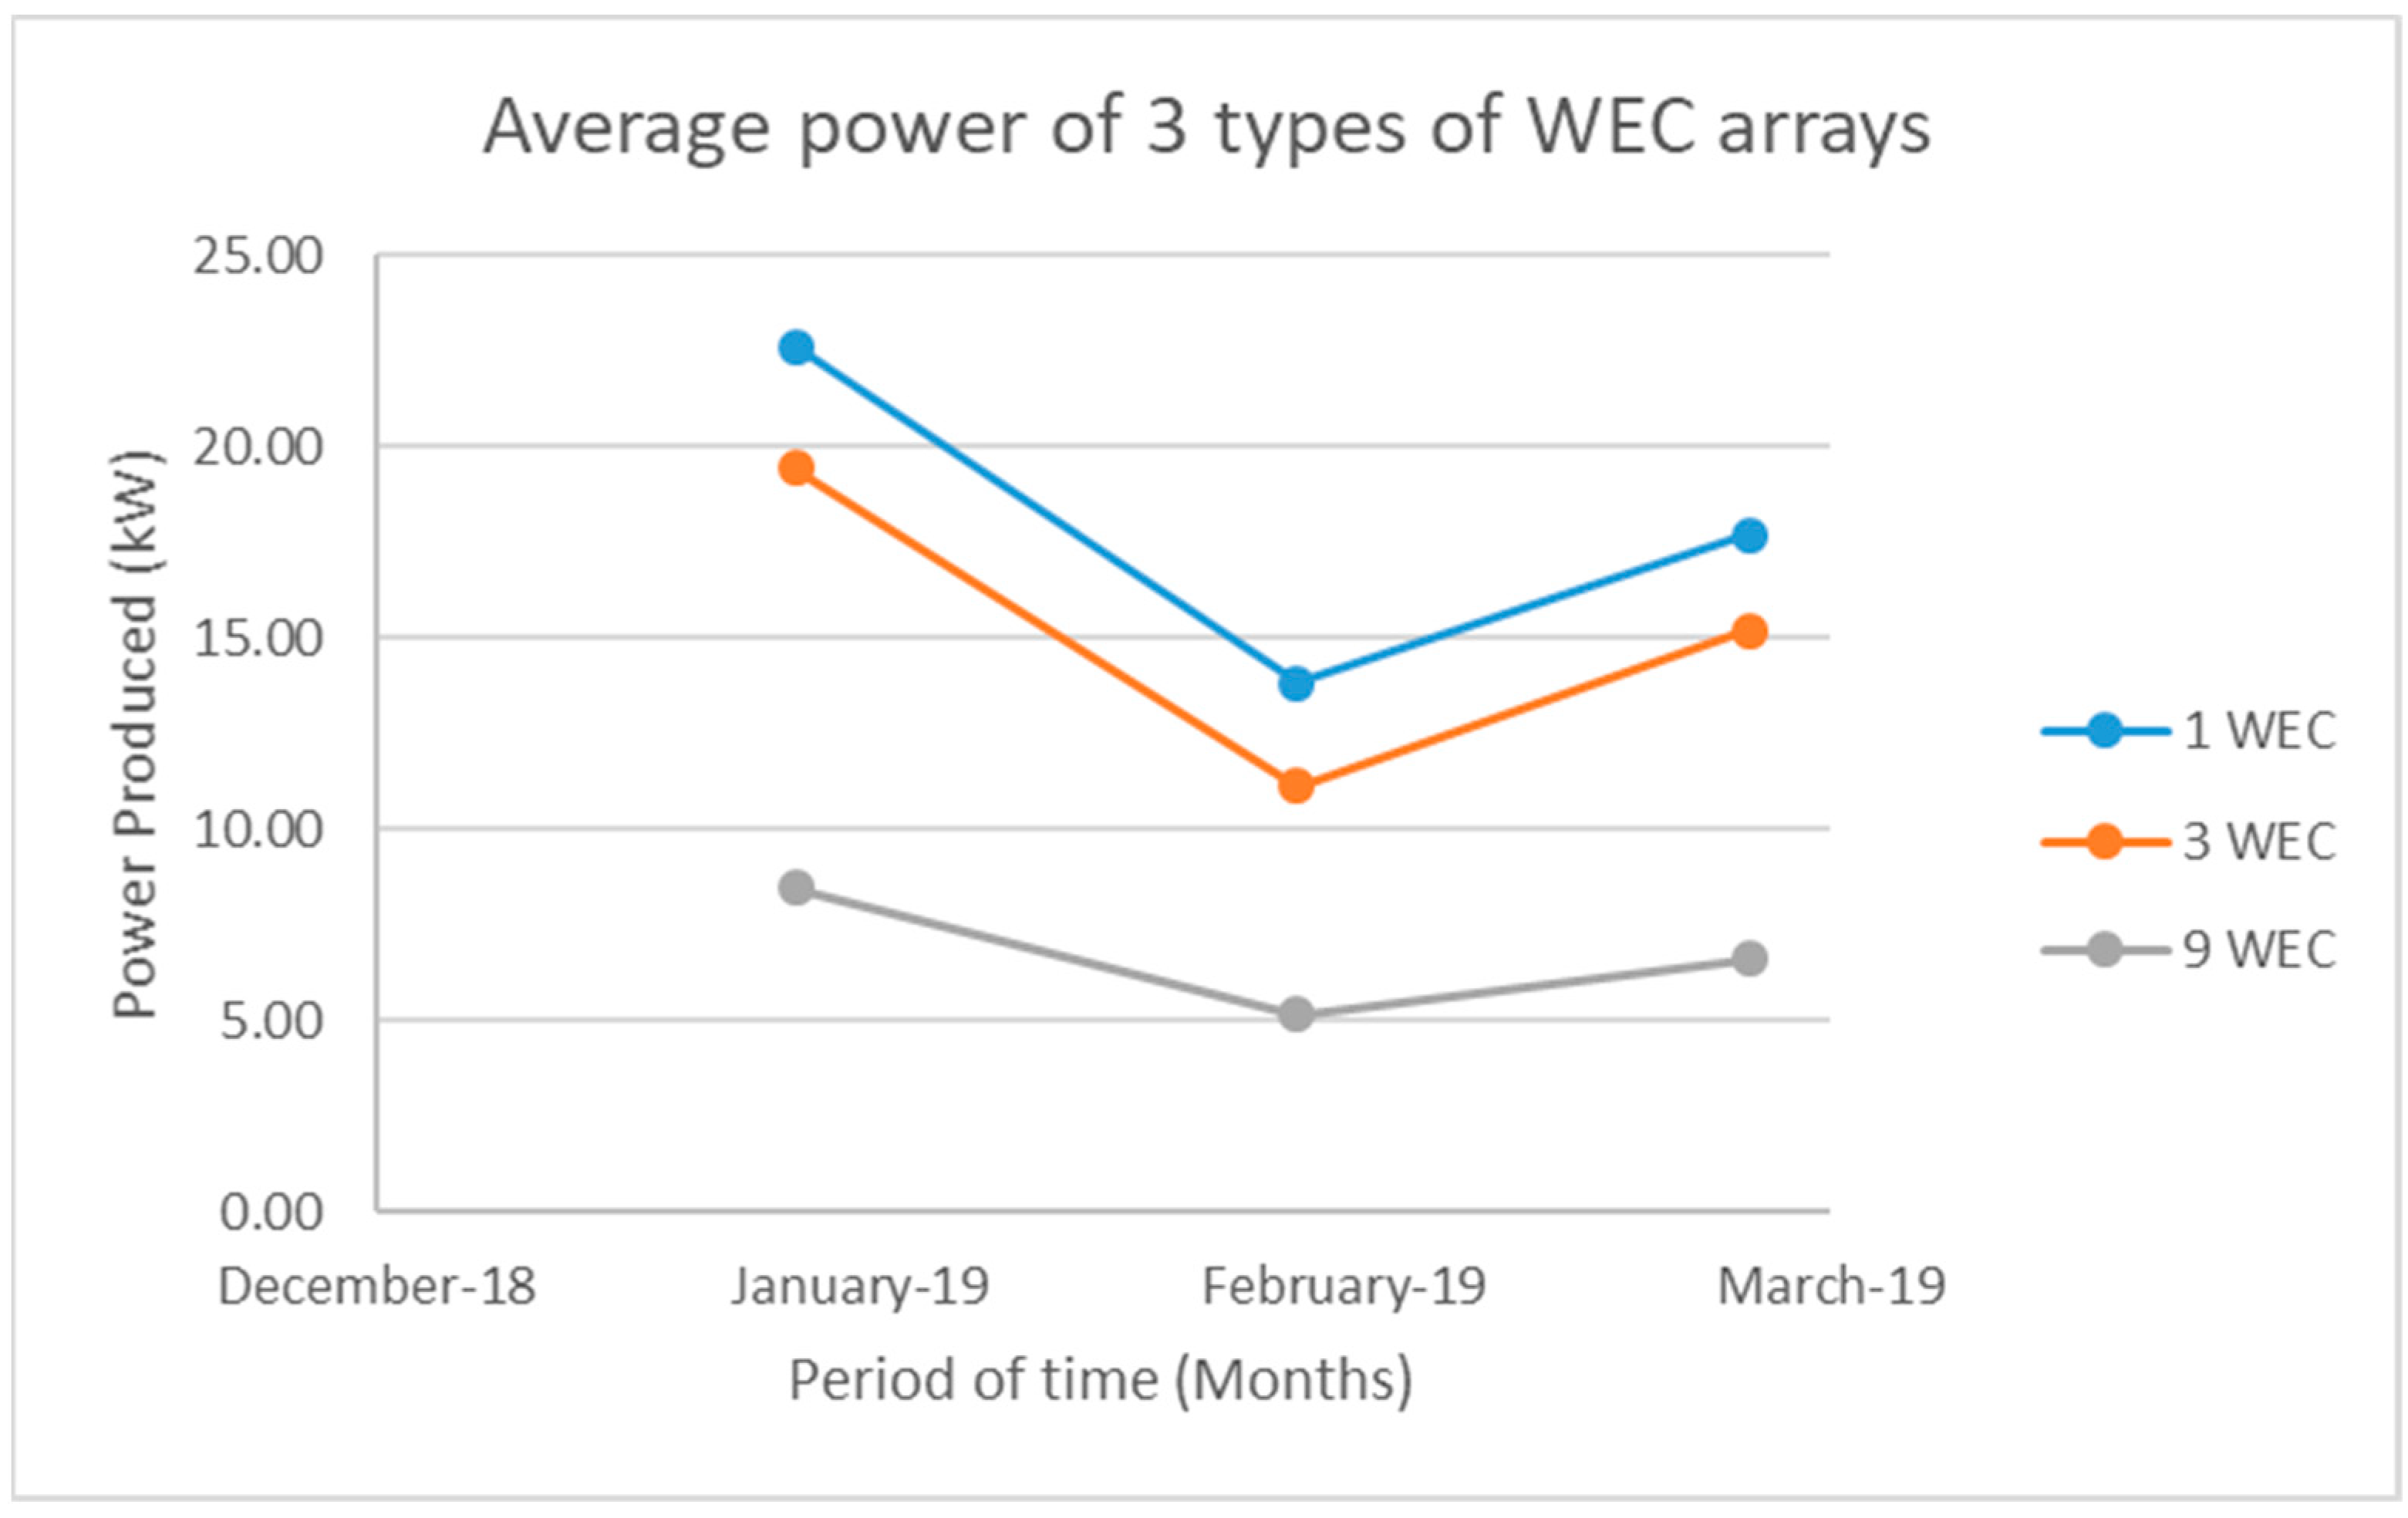
Figure 7 shows that a recurring weather pattern was visible, in that the average power produced by the wave energy convertors peaked during the winter months of July or August, with average power values of around 50 kW per WECs. During the summer months of January or February, the lowest average wave energy production of 17–20 kW per WECs was simulated. Despite these seasonal variations, wave energy was available throughout all months of the year. This wave energy production pattern suggests that the combination of wave energy electricity production in combination with hydrogen electrolysis may be a useful combination in overcoming seasonal variations in energy production since the hydrogen can be used as a long-term energy storage medium. Using the simulation program, the power produced for rows of 1, 3, and 9 WECs was calculated for a period of 3 months from January 2019 to March 2019, and the model was validated against the measurements from published wave tank results, as shown in Figure 8.
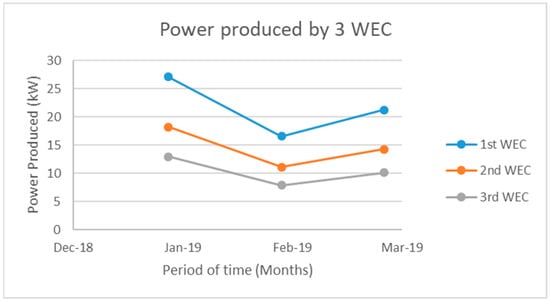
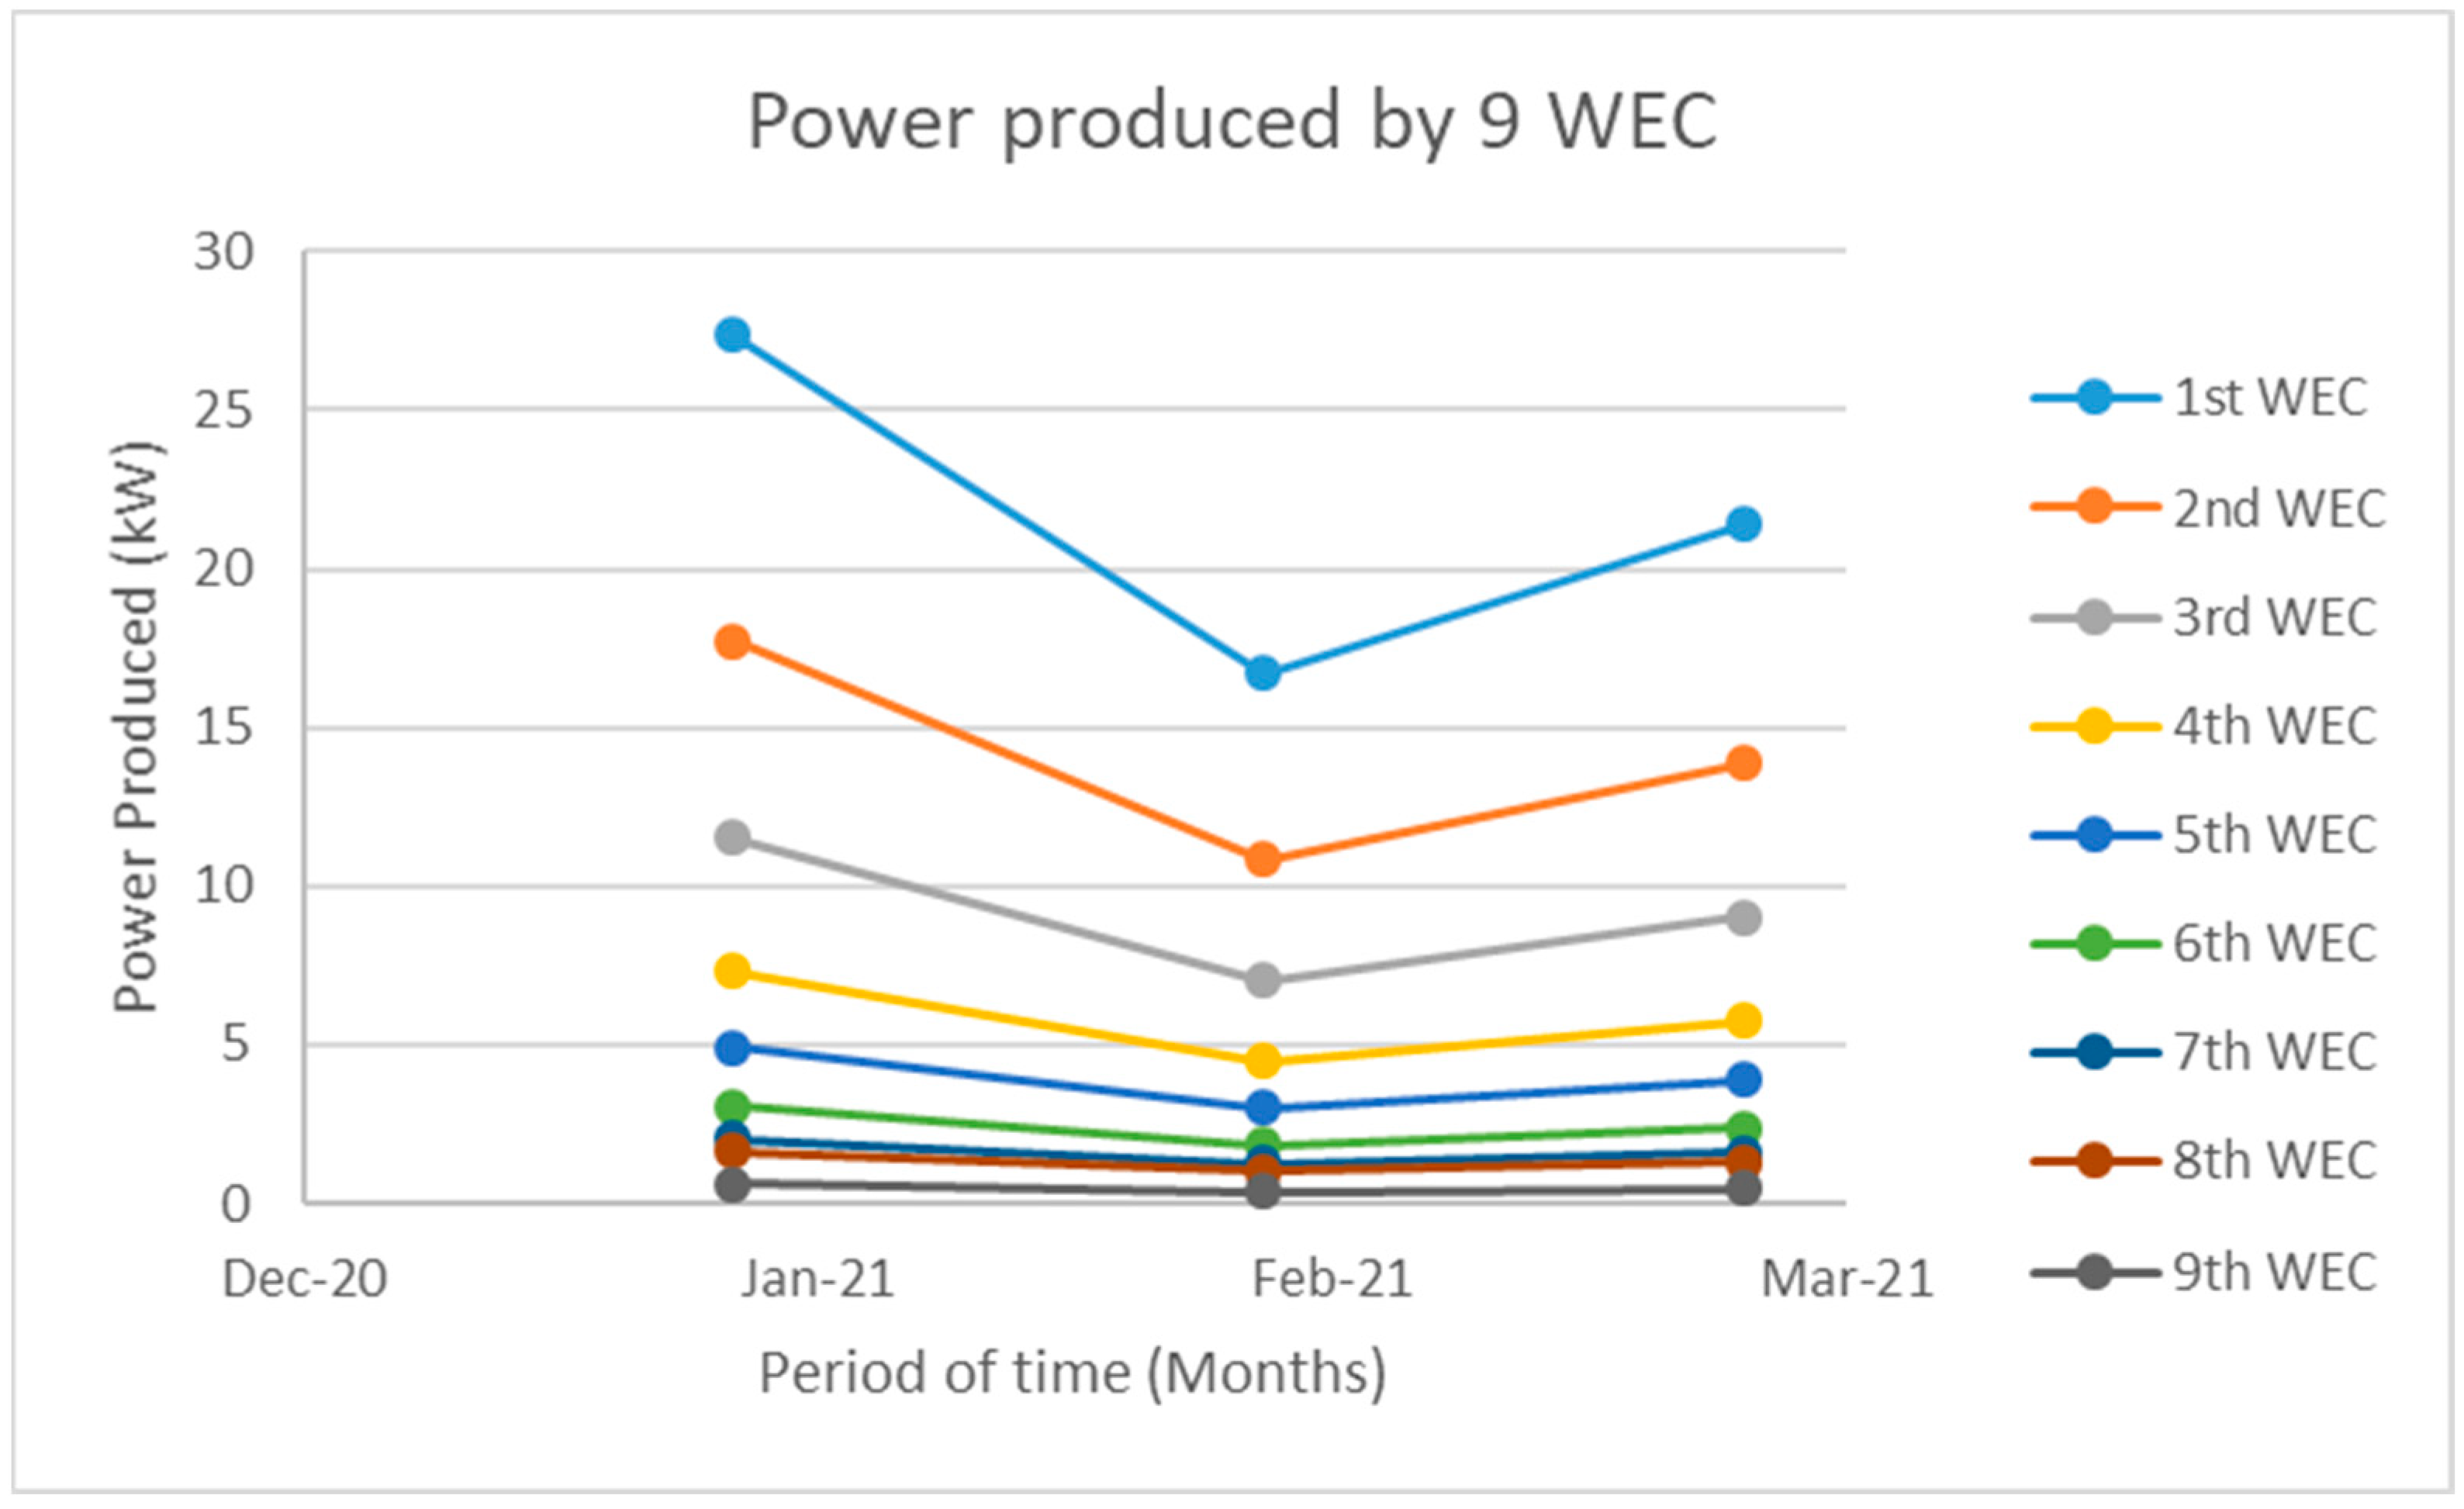
Figure 8.
The electric power produced by individual WECs in a row of 3 WECs.
3.3.1. Simulation Program
In Figure 8 and all the other figures of the program going forward used wave energy converted with a diameter of 2.5 m and a height (L) of 4 m, whereas Figure 6 made use of a diameter of 5 m and with a height of 3 m. The 1 WECs, 2 WECs and 3 WECs do not refer to the total number of WECs used in the array; however, this refers to the position of the WECs within the same row of 3 WECs. Through the simulation program, the results of 3 types of WECs were compared, i.e., for the first WECs, the second WECs, and the third WECs. The average of each converter for a period of 3 months was used to compare the power produced by each converter; Figure 8 indicates the results.
The simulations showed that the average power produced by each row of WECs reduced progressively from the first WECs to the third WECs. This was to be expected and can reasonably be explained by the attenuation of the wave height from each row of WECs. The results allowed estimating the performance of the WECs for larger arrays of point absorbers, as shown for an array of 9 rows of WECs in Figure 8. Here a WECs array containing 9 rows of WECs was simulated, showing how the wave attenuation from one row to the next progressively reduced the specific wave power production for each row.
3.3.2. Wave Energy Available for Hydrogen Production
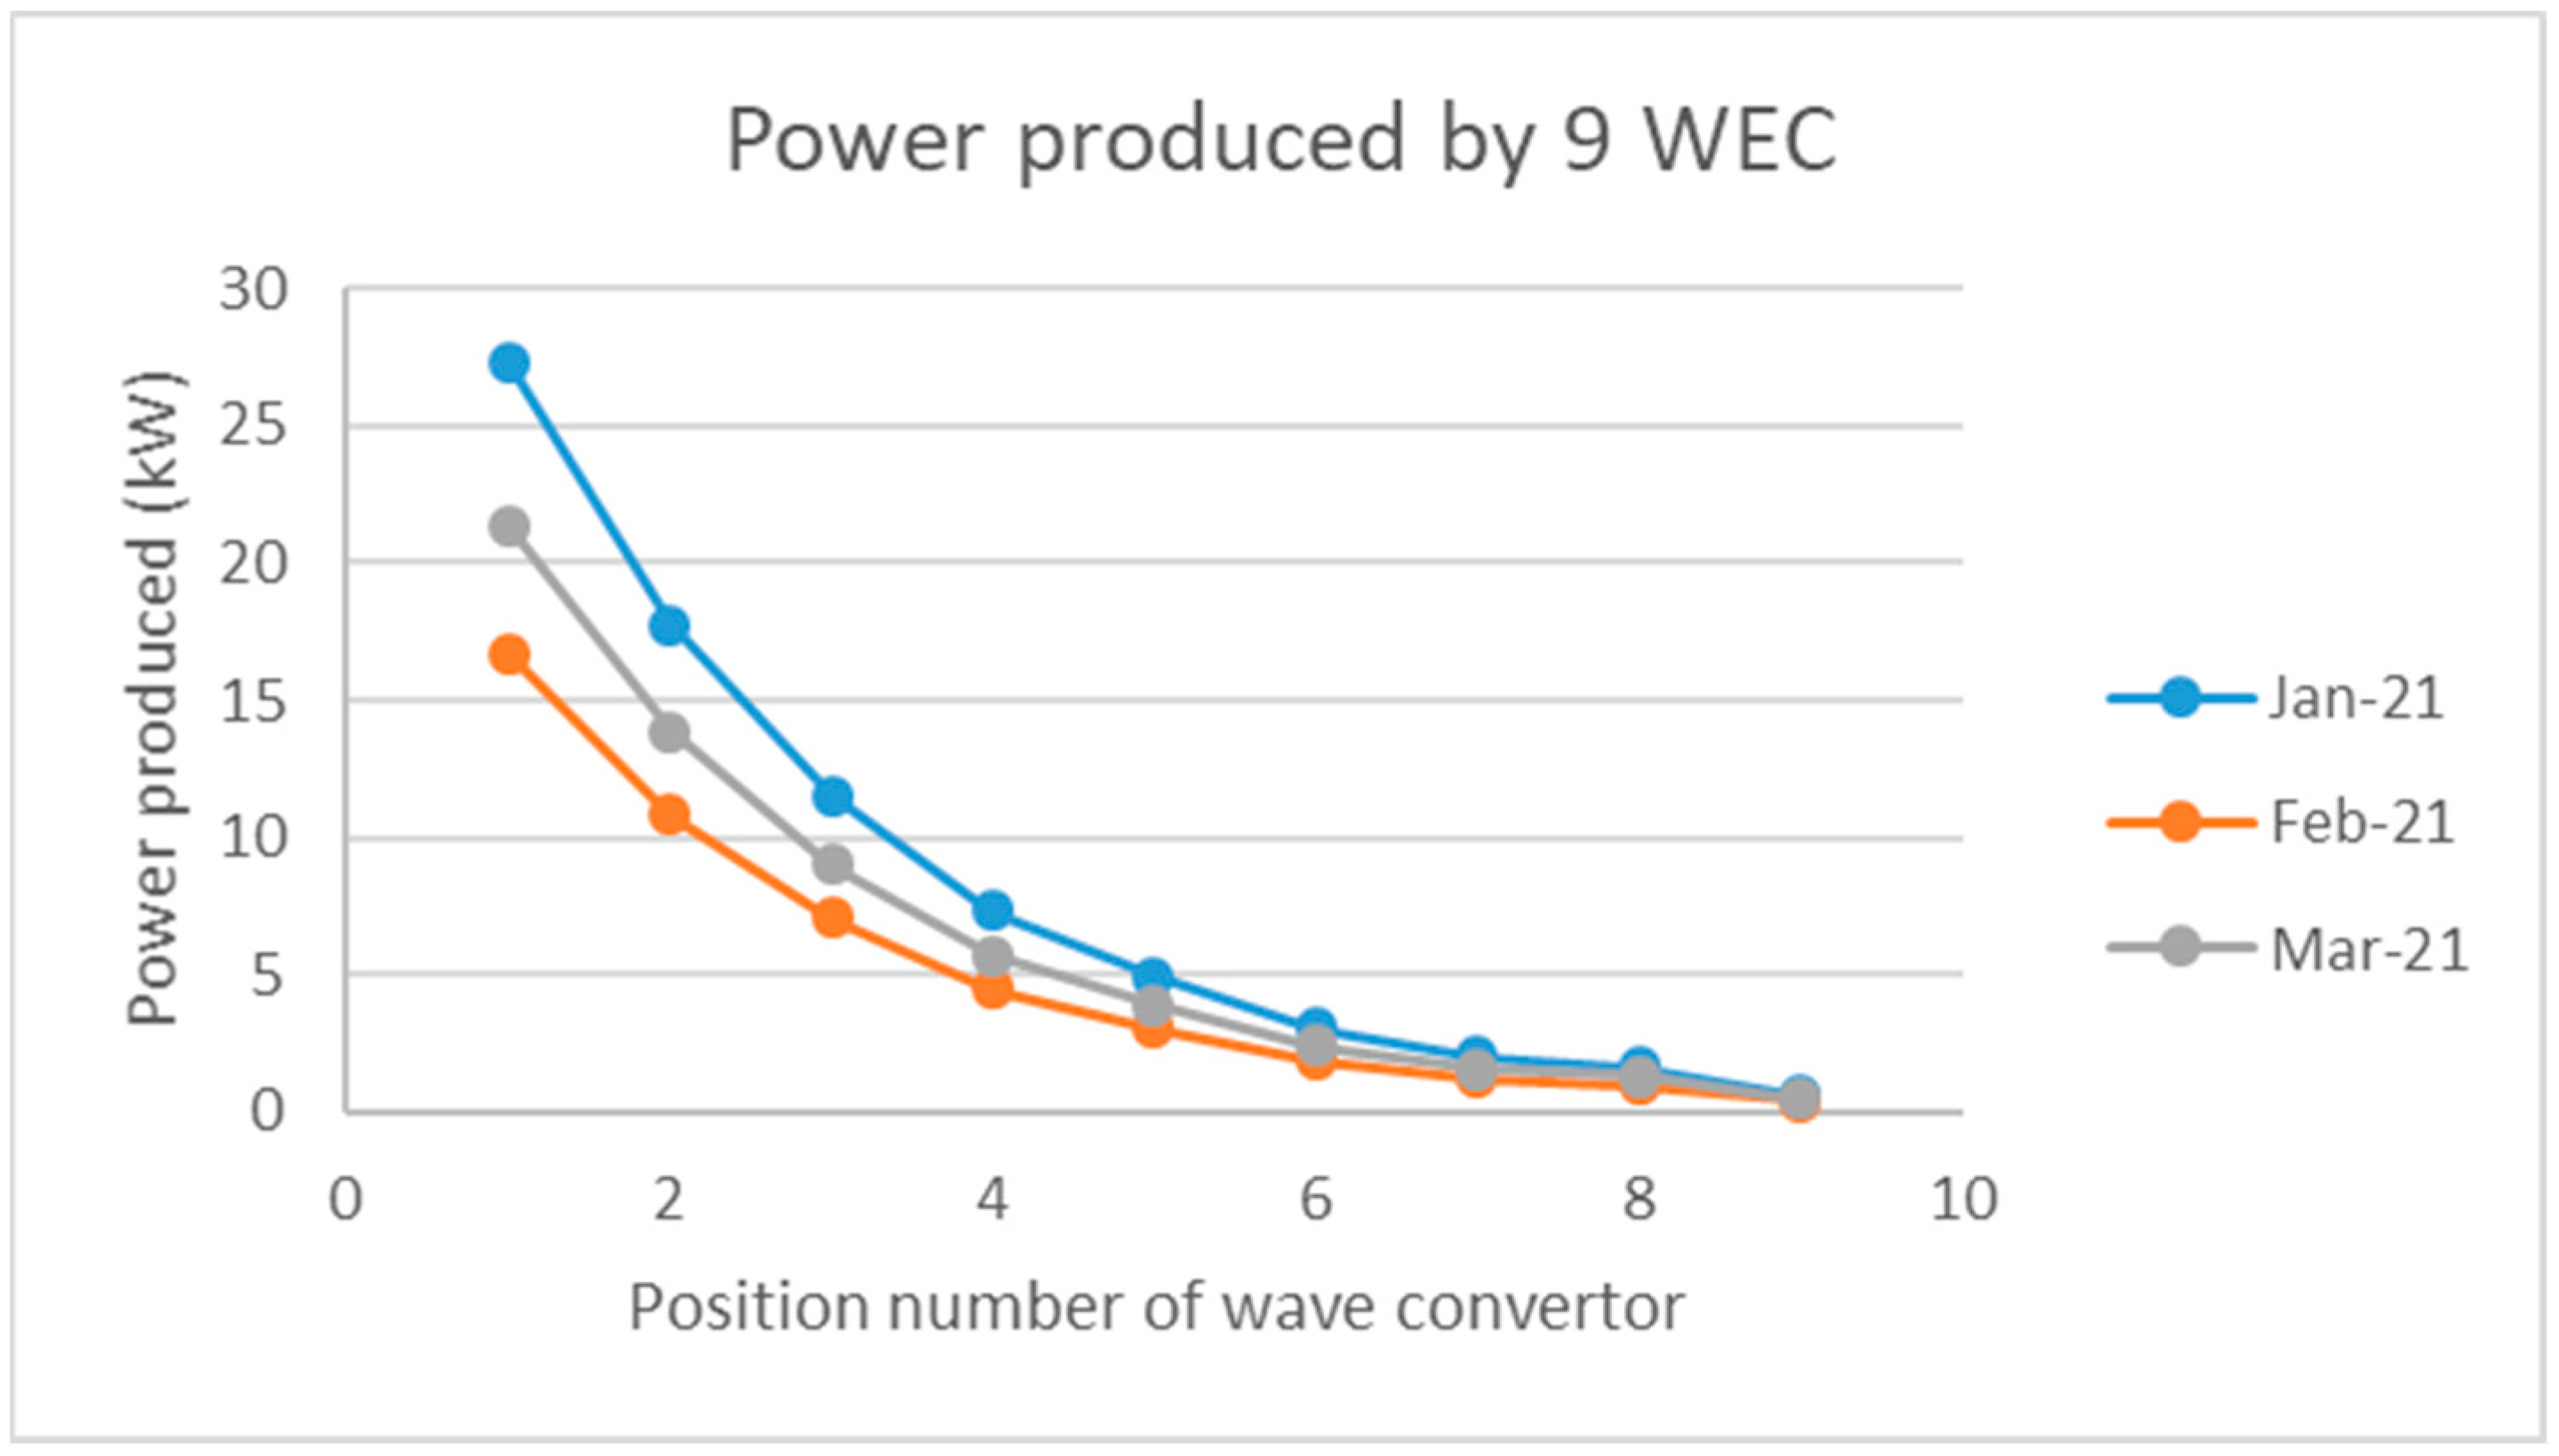
When developing the business case for a wave energy array with hydrogen production, this is an important aspect to take into consideration since the levelized cost of electricity, and thereby that of hydrogen production, will be sensitive to the number of WECs used. Figure 9 illustrated that in chain of WECs situated one after another in a larger array, the waves are attenuated and the WECs closer to the shore will yield a lower average level of power produced, than those closer to the source of the waves. The higher the power production per WECs will be, the lower the levelized cost of hydrogen production will be. The more rows of WECs were used, the lower the average level of power produced by one individual WECs, despite the point absorbers being assumed to be of the same construction and cost. This gradual reduction in the average power production per WECs has been visualised in Figure 10. The results showed that the average power produced by one WEC varied from 23 kW for a single WECs row down to 8 kW in an array of 9 WECs rows.
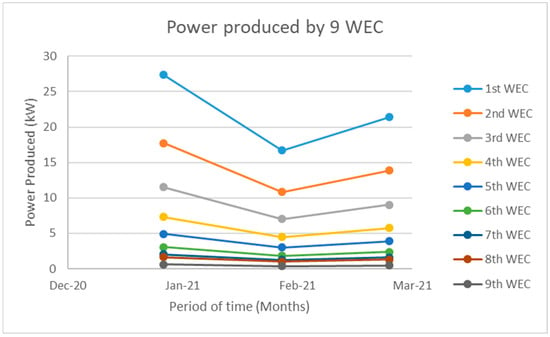
Figure 9.
The power produced by individual WECs in a row of 9 WECs.
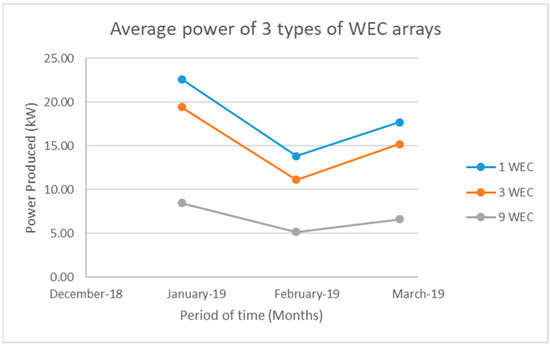
Figure 10.
The average power of the 3 types of WECs rows.
Figure 11 shows the power production of individual WECs contained within a large wave energy converter array, consisting of 9 individual rows of wave energy convertors. The simulation allowed to study interactions between the converters and potentially also effects on other users in the sea and the coastal area. The results showed that the first lines of wave energy convertors captured a higher amount of wave energy and that this quantity is progressively reduced as the ocean wave is attenuated by the earlier lines of wave energy convertors. The range of average power for an individual wave energy converter was between 1 and 28 kW for the same incoming wave condition, causing very different levelized costs of electricity for each device. Depending on the height of the waves encountered during the various months, the amount of wave energy captured by the WECs in their various rows also varied. The results suggest that a large number of WECs arrays would be most economically feasible in the most wave-energy-rich locations, while a lower number of WECs rows should be chosen for less wave-energy-rich locations.
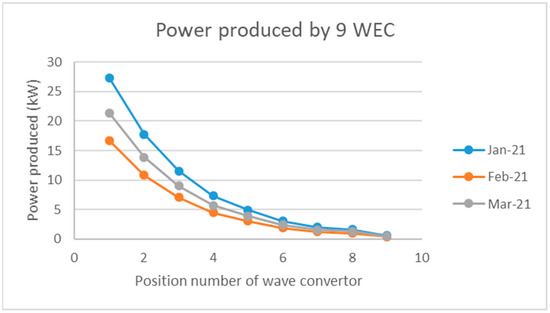
Figure 11.
The average power produced by the wave energy convertors, depending on their position in the wave-farm array.
3.3.3. Wave Power Used to Produce Maritime Fuel
Based on the long-term annual data visualised in Figure 7, for this study it was assumed that the wave farm consisted of 30 independent wave convertors with an average power of 37 kW. According to our calculation from the point-absorber wave farm simulation program, the average power for the wave farm was 1110 kW. The energy produced by the wave farm during one month was 2,973,024 MJ, with a lower heating value of hydrogen at 120 MJ per kg of the total mass of hydrogen, and assuming that the efficiency of hydrogen production was 75% (Baxter, 2020 [42]), then 18,581 kg of hydrogen was modelled to be produced per month, which is 18.581 tons of hydrogen produced a month. With the amount of hydrogen produced from the wave farm, it was assumed that the study will be able to supply the port and provide tugboats with hydrogen fuel from the port’s hydrogen fuelling station. According to (Walsh, 2008) [43], modern tugboats have a power rating of 3000 to 5000 hp and tend to burn a large amount of fuel when operating at full rpm; this can be anywhere between 100 and 200 gallons of diesel fuel per hour for a tug pushing against a ship or between 3000 and 5000 gallons per day when under constant operation. Assuming that a tug may operate 10% of the time, we may assume a consumption of 400 gallons of diesel fuel per day will be used. Assuming that 1 ton of hydrogen is equivalent to the ratio of gravimetric lower heating values of hydrogen to diesel fuel, i.e., 120/42.7 = 2.81 tonnes of diesel fuel in terms of energy content. Assuming that 1 tonne of fuel has a volume of 313 gallons, then 2.81 tonnes of diesel fuel is equivalent to 880 gallons of diesel fuel. If we take the amount of hydrogen produced a month, which is 18.58 tons, and we multiply it by the gallon of diesel fuel per ton of hydrogen, which is 880 × 18.58, we get a value of 16,350 gallons a month. If a tugboat uses 400 gallons of diesel fuel per day, we will, therefore, be able to fuel 1.3 tugboats with hydrogen fuel, which is produced by the wave farm each month (31 days).
According to the study for vessels, we will need more power, meaning a wave farm at a greater scale will be required, for example, a wave farm with 400 rows and a 10-m distance of 3-point absorbers (400 × 10 m) = 4000 m. Since we assumed there would be 3 WECs point absorbers in a line, the wave farm consists of a 3 × 400 matrix, i.e., 1200 WECs at a shore length estimated at 4000 m. A total of 1200 WECs having an average power of 37 kW each would deliver 119 TJ (33 GWh) of electrical energy per month, which at a 75% conversion efficiency (Baxter, 2020) [42] would allow producing 743 tonnes of H2 per month. The large shoreline required highlights the importance of Marine Spatial Planning (MSP) and the engagement of relevant stakeholders. Before any work can be performed on the zones, they must first be signed off by MSP and Environmental Specialists. In the case we include another renewable energy mix in our study, such as wind, as the city is embedded with abundant wind, we will be able to downscale on the size of our wave farm while having sufficient energy to meet our initial hydrogen demand and targets for powering one tugboat in the port. If we decided to add wind energy or solar energy, we would be able to reduce the size of the wave powerplant and still produce the required amounts of energy. The aim of the study is to be able to provide commercial vessels with bunker fuel. In the coming years, we will need to upscale the refuelling station in order to accommodate commercial vessels. If we change locations of the wave farm, however, still within close proximity to the Port of Ngqura and upscale in energy convertors, we can expect a fairly high amount of energy production from the wave farm, which will go a long way in providing commercial vessels with bunkering fuel.
In order to explore the possibility of supplying shipping vessels with alternative fuels, even beyond the ambition of powering a tugboat in the port, it was evaluated how much hydrogen fuel would be needed for a large ship. It was necessary to identify a case study vessel type, and for this study, a large Shuttle Tanker Built in 1997, IMO Number 91311357, was chosen as an example for a large energy carrier. With a Gross Tonnage of 71,850, an engine speed of 14.60 kts at 65.00 tonnes per day, intermediate fuel oil very low sulphur, a horsepower of 27,160, and a power type of diesel 2-stroke (Clarksons Research, 2021) [44]. According to the calculations from the simulation program from the row-of-three-point convertors, the wave farm can produce 743 tons of hydrogen per month, which would be equivalent to 2.81 times as much mass of diesel fuel, i.e., 2088 tonnes of diesel fuel. This would be more than the required fuel for the Orion shuttle tanker needs for continuous operation at maximum load, and this can ensure its continuous operation. In order to provide more varied examples of the possibilities for fuelling large ships, it would be necessary to estimate the business case for offering hydrogen fuel bunkering to the fleet of domestic ships or to international shipping passing through South African waters. The business case will depend on the number of ships that will be able to bunker hydrogen in the future, their frequency of refuelling in this location, and the retail price for hydrogen that can be achieved. Given the need for establishing a reliable market for hydrogen sales, the safest and most predictable approach may be to initially target local ships with predictable short-seas shipping patterns. This would ensure continuous sales of the locally produced hydrogen, allowing targeted investments in hydrogen propulsion systems to be made for those vessels.
4. Cost of Wave Power Electricity and Hydrogen Production
The cost of setting a hydrogen plant is relatively high today. However, it is projected that capital and operating costs will steadily drop as hydrogen becomes more competitive, while the price of fossil fuel will increase and the prices of renewable energy will steadily decrease. The below Table 1 is an assumption of the main estimated costs of implementing a hydrogen plant of about 1 MW, with a conservative electricity-to-hydrogen conversion efficiency of 56%. The CAPEX and OPEX costs for installing and operating a hydrogen plant were estimated. The respective value of CAPEX is assumed to be R38,214,000. This model will assume the CAPEX and OPEX production costs while focussing on the economic impact of renewable energy trends. The costs in Table 1 were estimated costs according to the cost of the components of a P2G system in the study by (Jovan and Dolanc, 2020 [28]).

Table 1.
The cost of the components for a hydrogen plant.
In the below Table 1, these are the capital costs for the initial setup of a 1 MW hydrogen production plant.
According to Investec, the current cost of hydrogen is estimated at R300 per kg in South Africa. For the study, we assumed the price of electricity is R1.40 for a 20-year life cycle, as used in (Castro-Santos et al., 2015) [45] as the LCOE of wave energy. In the long term, it is estimated that the price of hydrogen production in South Africa will drop to R26.50 per kg. The price of hydrogen production is mainly dependent on the price of electricity. The value of the South African Rand versus the Euro on 22 May 2024 was R19.70, which is the value the researcher used in the calculations. In Table 2, it is assumed that through the use of an electrolyser of 1 MW power multiplied by the electricity cost of R1.40/kWh for industries, the electricity cost to produce a kilogram of hydrogen will be R83.30. The amount of hydrogen produced would be 150 tons of hydrogen per year. If we assume a 20-year life-span of the plant, at a cost of R 38,214,000, we can produce 3 Mtons of hydrogen over 20 years, at a levelized cost of R96/kg (4.88 EUR/kg).

Table 2.
The income of hydrogen per kg sold in South African Rand (R).
We further calculated income or profits by subtracting the selling price with the cost of hydrogen production to estimate profits through selling green hydrogen, as R30,589,177 per year. The assumed selling price of R300/kg of hydrogen is equivalent to 15 EUR/kg of hydrogen. Given that 1 kg of hydrogen contains 120 MJ of energy, this price is equivalent to R2.5/MJ energy (0.127 EUR/MJ). If the hydrogen was sold at a price of R100/kg, which would allow the hydrogen produced to break even, this would translate to a hydrogen price of (0.042 EUR/MJ). This would be competitive with current prices reported for e-methanol, ammonia, e-LNG, and e-diesel (Cullinane and Yang, 2022) [34].
4.1. Economic Model Overview
This model illustrates the costs related to capital costs to set up a hydrogen production plant. The initial costs to produce hydrogen are still relatively high, and while trends indicate the price of fossil fuel is gradually increasing and the price of hydrogen is steadily decreasing, hydrogen has the potential to become a competitive clean energy source. Furthermore, investment in hydrogen technology in the Port of Ngqurha can position the port in becoming a leader in transitioning towards sustainable shipping fuels.
4.1.1. Market Competitiveness
We compare Marine Diesel Oil (MDO) with hydrogen. If MDO is R19.40/kg and hydrogen is R24.34/kg, hydrogen is still relevantly higher than MDO. However, it is projected that the price of hydrogen will decrease while the price of fossil fuels will increase.
4.1.2. Sensitivity Market Changes
With improvements and development of lead technology, we could see a reduction beyond 20% in CAPEX and OPEX in the next few years, as the price per kg will potentially decrease significantly. The monitoring of fossil fuel prices and trends coupled with the introduction of renewable energy sources could impact the economic feasibility of hydrogen production. The monthly variation in average electricity production from data collected over three years had a standard deviation of 30% of the mean value. This allows for quantify the variability in income from hydrogen production.
4.2. Costs Associated with Supplying a Tanker
The cost of supplying the Orion shuttle tanker (used as an example in Section 3.3.3) with 2089 metric tonnes of MDO diesel fuel per month would be 29.47 MR, assuming a diesel fuel cost of R14,111/tonne for MDO. Providing the same amount of energy in terms of hydrogen produced from wave energy may be brought down to R96.07/kg × 743,000 kg = 71.4 MR, which is more than double the price for the equivalent amount of MDO. The use of 2089 metric tonnes of MDO would be associated with the emission of around 6697 metric tonnes of CO2. Hydrogen from wave energy would thus become competitive with MDO; if a price is set for the emission of CO2, this may also offset the difference in cost between MDO and hydrogen from wave energy. The mass of CO2 produced per kg of carbon burnt is 3.206 times the amount of carbon burnt. The price for CO2 necessary to make the hydrogen from wave energy competitive would be R6257/tonne CO2, or 318 EUR/tonne CO2. This is around 4.5 times the current trading price of CO2 (70 EUR/tonne CO2) in the EU Emissions Trading Scheme.
5. Summary and Conclusions
South Africa, a coal-producing country, is set to decommission its coal-powered plants in the coming years, necessitating a new energy mix to meet the country’s energy demand and ensure energy security. The country’s high renewable energy potential, including offshore wind and wave energy, makes it well-positioned to tap into the hydrogen industry and provide bunkering shipping fuel to large commercial vessels. Hydrogen has been identified as a potential shipping fuel of the future due to its abundance and clean nature. However, green hydrogen faces challenges such as the cost of production, storage, and transportation. The current price for hydrogen is between 10 and 60 €/kg, which is roughly R190 to R1182 per kg. South Africa is a water-stressed country when it comes to producing hydrogen through electrolysis, but seawater electrolysis is a potential solution for carbon neutral hydrogen energy without relying on freshwater. The current price of hydrogen in South Africa is relatively high, but it is expected to drop, and the price of fossil fuel will gradually increase in the coming years. Electrolyser manufacturers aim to bring down the cost of hydrogen to R24.48 per kg by 2030. The LCOE of wind and solar PV is currently R0.62 per kWh, while the price of coal IPP is R1.03. The Port of Ngqura was identified to lead the production of green hydrogen to supply port tugs and bunkering vessels with hydrogen fuel. The wave farm considered in a case study in this work can produce 743 tonnes of hydrogen per month, enough for a bulk tanker vessel to perform at a maximum load its operations. The cost of green hydrogen production from wave energy in the Port of Ngqura was calculated as R96.07/kg (4.88 EUR/kg). of hydrogen produced, which is equivalent to 2.1 times the cost of the same energy supplied as MDO at current prices. However, hydrogen is still predicted to be more expensive than coal electricity, so a critical cost for a kg of CO2 could be calculated to make hydrogen competitive. The mass of CO2 produced per kg of carbon burnt is 44/12 = 3.66 times the amount of carbon burned. If the CO2 price were to rise to R6257/tonne CO2, or 318 EUR/tonne CO2, hydrogen from wave energy would become competitive with MDO.
This study was conducted as a case study and has a number of limitations. The simulations of wave energy, though repeated for three years for that location, were based on a simplified model and did not consider optimisations in terms of spatial location or wave-energy array arrangement. The amount of energy harnessed per wave energy converter would be sensitive to this, so this study does not provide a comprehensive assessment of wave energy yields in South African waters. The economic analysis also had the character of a case study, and while the variations and expected evolution of hydrogen production costs were examined over the years, no exhaustive quantitative analyses as to cost and price variations were conducted. The energy-yields and economic costs are therefore of an indicative nature.
The study illustrates that the production of green hydrogen using wave energy at the Port of Ngqura may become a technically viable solution for minimising and reducing shipping and port emissions, as long as the economic framework conditions are warranted. Wave energy is still expensive compared with wind and solar energy, but these costs may be expected to drop as the technology matures. The results emphasise the potential greenhouse gas emissions savings from the use of wave power and green hydrogen and highlight the importance of transitioning to more sustainable, environmentally friendly, and greener shipping fuels.
Future studies of this type would benefit from further experimental validation of wave energy yields as well as from the study aimed at optimising the geographic deployment of the wave energy farm by optimising installation, operational, and decommissioning costs and energy yields. Further validation of costs for hydrogen production from real-life projects will be welcome to validate the results or improve the accuracy of future economic assessments.
Supplementary Materials
The following supporting information can be downloaded at: https://www.mdpi.com/article/10.3390/en17184683/s1, Wave Energy Program 2021.
Author Contributions
Methodology, Z.M.; Formal analysis, Z.M.; Investigation, Z.M.; Data curation, Z.M.; Writing—original draft, Z.M.; Writing—review & editing, Z.M. and A.S.; Supervision, A.S.; Project administration, Z.M. All authors have read and agreed to the published version of the manuscript.
Funding
This research received no external funding.
Data Availability Statement
The original contributions presented in the study are included in the article, further inquiries can be directed to the corresponding author.
Acknowledgments
This study has been conducted using E.U. Copernicus Marine Service Information. https://doi.org/10.48670/moi-00017.
Conflicts of Interest
The authors declare no conflict of interest.
Abbreviations
| Capex | Capital Expenditure |
| CO2 | Carbon dioxide |
| CSIR | Council for Scientic and Industrial Research |
| CWR | Capture Width Ratio |
| EU | European Union |
| GH2 | Green hydrogen |
| GJ | Giga Joule |
| GW | Giga Watts |
| IMO | International Maritime Organisation |
| IPP | Independent Power Producers |
| kg | Kiligram |
| KW | kilowatt |
| LCOE | Localised Cost of Energy |
| MDO | Marine Diesel Oil |
| MSP | Marine Spatial Planning |
| MW | Mega Watt |
| NMB | Nelson Mandela Bay |
| Opex | Operational Expenditure |
| PV | Photovoltaic |
| REIPPP | Renewable Energy Independent Power Procurement Programme |
| SMOC | Surface and Merged Ocean Currents |
| WECs | Wave Energy Convertors |
| ZAR | South African Rand (currency) |
References
- UNEP. Emissions Gap Report 2020. 2020. Available online: https://www.unep.org/emissions-gap-report-2020 (accessed on 12 September 2024).
- Jain, S.; Jain, P. The rise of Renewable Energy implementation in South Africa. Energy Procedia 2017, 143, 721–726. [Google Scholar] [CrossRef]
- Mukherjee, P. Exclusive: South Africa to Miss 2030 Emission Goal as It Keeps Coal Power Plants Burning. Reuters. 2023. Available online: https://www.reuters.com/sustainability/south-africa-miss-2030-emissions-goal-it-keeps-coal-plants-burning-2023-11-09/ (accessed on 12 September 2024).
- Rae, G.; Erfort, G. Offshore wind energy—South Africa’s untapped resource. J. Energy S. Afr. 2020, 31, 26–42. [Google Scholar] [CrossRef]
- Statistics South Africa. The Importance of Coal. 2015. Available online: http://www.statssa.gov.za/?p=4820 (accessed on 12 September 2024).
- Cowling, N. Mining Sector’s Value Added to the GDP in South Africa 2016–2023. 2024. Available online: https://www.statista.com/statistics/1121214/mining-sectors-value-added-to-gdp-in-south-africa/ (accessed on 12 September 2024).
- Ellichipuram, U. South Africa Selects 25 Bidders for Renewable Energy Projects. Through These Allocations, the Government Aims to Reduce Its Dependency on Coal-Generated Electricity. 2021. Available online: https://www.power-technology.com/news/south-africa-renewable-energy/ (accessed on 12 September 2024).
- Baral, S.; Šebo, J. Techno-economic assessment of green hydrogen production integrated with hybrid and organic Rankine cycle (ORC) systems. Heliyon 2024, 10, e25742. [Google Scholar] [CrossRef] [PubMed]
- Foteinis, S. Wave energy converters in low energy seas: Current state and opportunities. Renew. Sustain. Energy Rev. 2022, 162, 112448. [Google Scholar] [CrossRef]
- Bekçi, E.; Koca, K.; Bashir, M.F. Design analysis of a wave energy converter for hydrogen generation near shoreline of Black Sea. Process. Saf. Environ. Prot. 2024, 186, 1–9. [Google Scholar] [CrossRef]
- Satymov, R.; Bogdanov, D.; Dadashi, M.; Lavidas, G.; Breyer, C. Techno-economic assessment of global and regional wave energy resource potentials and profiles in hourly resolution. Appl. Energy 2024, 364, 123119. [Google Scholar] [CrossRef]
- Saenz-Aguirre, A.; Saenz, J.; Ulazia, A.; Ibarra-Berastegui, G. Optimal strategies of deployment of far offshore co-located wind-wave energy farms. Energy Convers. Manag. 2021, 251, 114914. [Google Scholar] [CrossRef]
- Kharel, S.; Shabani, B. Hydrogen as a Long-Term Large-Scale Energy Storage Solution to Support Renewables. Energies 2018, 11, 2825. [Google Scholar] [CrossRef]
- Melamu, R. Hydrogen as an Energy Product from Agriculturally Produced Sugars and Starches in South Africa. Master’s Thesis, University of Cape Town, Cape Town, South Africa, 2008. [Google Scholar]
- Creswell, J. Educational Research: Planning, Conducting, and Evaluating Quantitative and Qualitative Research, 4th ed.; Upper Pearson Education: Saddle River, NJ, USA, 2012. [Google Scholar]
- Brown, M.E.; Dueñas, A.N. A Medical Science Educator’s Guide to Selecting a Research Paradigm: Building a Basis for Better Research. Med. Sci. Educ. 2019, 30, 545–553. [Google Scholar] [CrossRef]
- Panhwar, A.H.; Ansari, S.; Shah, A.A. Post-positivism: An effective paradigm for social and educational. Int. Res. J. Arts Humanit. 2017, 45, 253–260. [Google Scholar]
- Bonache, J.; Festing, M. Research paradigms in international human resource management: An epistemological systematisation of the field. Ger. J. Hum. Resour. Manag. Fur Pers. 2020, 34, 99–123. [Google Scholar] [CrossRef]
- Biggins, F.; Kataria, M.; Roberts, D.; Brown, S. Green hydrogen investments: Investigating the option to wait. Energy 2022, 241, 122842. [Google Scholar] [CrossRef]
- Ardhuin, F.; Magne, R.; Filipot, F.; Van der Westhyusen, A.; Roland, A.; Quefeulou, P.; Lefèvre, J.; Aouf, L.; Babanin, A.; Collard, F. Semi empirical dissipation source functions for wind-wave models: Part I, definition and calibration and validation at global scales. J. Phys. Oceanogr. 2010. [Google Scholar] [CrossRef]
- Janssen, P.; Aouf, L.; Behrens, A.; Korres, G.; Cavalieri, L.; Christiensen, K.; Breivik, O. Final Report of Work-Package I in My Wave Project. December 2014. Available online: http://repositorio.aemet.es/bitstream/20.500.11765/7249/3/MyWave_Report_D64.pdf (accessed on 12 September 2024).
- Python Software Foundation. Python Language Reference, Version 3.9.2. Available online: http://www.python.org (accessed on 19 February 2021).
- Giordano, N.; Nakanishi, H. Computational Physics, 2nd ed.; Pearson/Prentice Hall: Old Bridge, NJ, USA, 2006. [Google Scholar]
- Stratigaki, V.; Troch, P.; Stallard, T.; Forehand, D.; Kofoed, J.P.; Folley, M.; Benoit, M.; Babarit, A.; Kirkegaard, J. Wave Basin Experiments with Large Wave Energy Converter Arrays to Study Interactions between the Converters and Effects on Other Users in the Sea and the Coastal Area. Energies 2014, 7, 701–734. [Google Scholar] [CrossRef]
- Global Ocean Waves Analysis and Forecast. Available online: https://data.marine.copernicus.eu/product/GLOBAL_ANALYSISFORECAST_WAV_001_027/description (accessed on 12 September 2024). [CrossRef]
- Paddison, L. Oman Plans to Build World’s Largest Green Hydrogen Plant. The Guardian for 200 Years. 2021. Available online: https://www.theguardian.com/world/2021/may/27/oman-plans-to-build-worlds-largest-green-hydrogen-plant (accessed on 12 September 2024).
- Janke, L.; McDonagh, S.; Weinrich, S.; Nilsson, D.; Hansson, P.-A.; Nordberg, Å. Techno-Economic Assessment of Demand-Driven Small-Scale Green Hydrogen Production for Low Carbon Agriculture in Sweden. Front. Energy Res. 2020, 8, 595224. [Google Scholar] [CrossRef]
- Lawlor, P. Hydrogen the Fuel of South Africa’s Green Future. 2021. Available online: https://www.investec.com/en_za/focus/beyond-wealth/hydrogen-the-fuel-of-south-africas-green-future.html#:~:text=South%20Africa’s%20energy%20stakeholders%20are,a%20global%2C%20green%20hydrogen%20economy.&text=Hydrogen%20has%20long%20been%20called,it%20emits%20only%20water%20vapour (accessed on 12 September 2024).
- Jovan, D.J.; Dolanc, G. Can Green Hydrogen Production Be Economically Viable under Current Market Conditions. Energies 2020, 13, 6599. [Google Scholar] [CrossRef]
- Yan, H.; Zhang, W.; Kang, J.; Yuan, T. The Necessity and Feasibility of Hydrogen Storage for Large-Scale, Long-Term Energy Storage in the New Power System in China. Energies 2023, 16, 4837. [Google Scholar] [CrossRef]
- Roos, T.H. The cost of production and storage of renewable hydrogen in South Africa and transport to Japan and EU up to 2050 under different scenarios. Int. J. Hydrogen Energy 2021, 46, 35814–35830. [Google Scholar] [CrossRef]
- Minutillo, M.; Perna, A.; Forcina, A.; Di Micco, S.; Jannelli, E. Analyzing the levelized cost of hydrogen in refueling stations with on-site hydrogen production via water electrolysis in the Italian scenario. Int. J. Hydrogen Energy 2021, 46, 13667–13677. [Google Scholar] [CrossRef]
- IRENA. A Pathway to Decarbonise the Shipping Sector by 2050; International Renewable Energy Agency: Masdar City, Abu Dhabi, 2021; ISBN 978-92-9260-330-4. [Google Scholar]
- Cullinane, K.; Yang, J. Evaluating the Costs of Decarbonizing the Shipping Industry: A Review of the Literature. J. Mar. Sci. Eng. 2022, 10, 946. [Google Scholar] [CrossRef]
- Lichner, C. Electrolyser Overview: Lowering the Cost of Hydrogen and Distributing its Production. 2020. Available online: https://pv-magazine-usa.com/2020/03/26/electrolyzer-overview-lowering-the-cost-of-hydrogen-and-distributing-its-productionhydrogen-industry-overview-lowering-the-cost-and-distributing-production/ (accessed on 12 September 2024).
- Yeneva, M. Solar, Wind Power Are 40% Cheaper Than Coal in South Africa—CSIR. 2016. Available online: https://renewablesnow.com/news/solar-wind-power-are-40-cheaper-than-coal-in-south-africa-csir-543589/ (accessed on 12 September 2024).
- Mohammed-Ibrahim, J.; Moussab, H. Recent advances on hydrogen production through seawater electrolysis. Mater. Sci. Energy Technol. 2020, 3, 780–807. [Google Scholar] [CrossRef]
- Hausmann, J.N.; Schlögl, R.; Menezes, P.W.; Driess, M. Is direct seawater splitting economically meaningful? Energy Environ. Sci. 2021, 14, 3679–3685. [Google Scholar] [CrossRef]
- Cascajo, R.; Garcia, E.; Quiles, E.; Correcher, A.; Morant, F. Integration of Marine Wave Energy Convertors into Seaports: A case study in the Portof Valencia. Energies 2019, 12, 787. [Google Scholar] [CrossRef]
- Ramulifho, A.E. Maritime Spatial Planning in South Africa: A Nexus Between Legal, Economic, Social and Environmental Agendas. World Maritime University Dissertations. 454. 2014. Available online: http://commons.wmu.se/all_dissertations/454 (accessed on 12 September 2024).
- Zhang, N.; Zhang, X.; Xiao, L.; Wei, H.; Chen, W. Evaluation of long-term power capture performance of a bistable point absorber wave energy converter in south china sea. Ocean. Eng. 2021, 237, 109338. [Google Scholar] [CrossRef]
- Baxter, T. Energy Conversion for Hydrogen Cars Is Only Half That for BEVs. 2020. Available online: https://energypost.eu/energy-conversion-for-hydrogen-cars-is-only-half-that-for-bevs/ (accessed on 11 June 2020).
- Walsh, M. Fuel Management for Tugs Are Becoming an Increasing Challenge. 2008. Available online: https://professionalmariner.com/fuel-management-for-tugs-becoming-an-increasing-challenge/ (accessed on 12 September 2024).
- Clarksons Research. Shipping Intelligence Network Database; Clarksons Research: London, UK, 2021. [Google Scholar]
- Castro-Santos, L.; Garcia, G.P.; Estanqueiro, A.; Justino, P.A. The Levelized Cost of Energy (LCOE) of wave energy using GIS based analysis: The case study of Portugal. Int. J. Electr. Power Energy Syst. 2015, 65, 21–25. [Google Scholar] [CrossRef]
Disclaimer/Publisher’s Note: The statements, opinions and data contained in all publications are solely those of the individual author(s) and contributor(s) and not of MDPI and/or the editor(s). MDPI and/or the editor(s) disclaim responsibility for any injury to people or property resulting from any ideas, methods, instructions or products referred to in the content. |
© 2024 by the authors. Licensee MDPI, Basel, Switzerland. This article is an open access article distributed under the terms and conditions of the Creative Commons Attribution (CC BY) license (https://creativecommons.org/licenses/by/4.0/).

