1. Introduction
The current draft of the Energy Performance of Buildings Directive (EPBD) [
1] provides for more buildings to be equipped with building automation systems from 2025 onwards, enabling more comprehensive monitoring of new or extensively renovated buildings, as in many cases buildings do not achieve the specific consumption levels that would be expected based on their building envelope and building technology. This is particularly important because buildings, and especially heating energy consumption, account for a significant proportion of energy consumption. In Germany, for example, this currently amounts to around 28% [
2]. Overall, the EU-wide legislation aims to decarbonise the building stock and thus the associated energy supply by 2050. A mix of different measures will be necessary to achieve this ambitious goal. These include the integration of renewable energies, both in the electricity and heating sectors and the flexible and intelligent management of energy generation and consumption. Energy storage also plays a key role in decoupling the timing and can ensure an optimised balance between the supply and consumption of energy flows.
Studies on real buildings show that there is an interaction between user behaviour and the operational management of the building technology and the associated energy consumption [
3,
4]. Users not only have a direct influence on consumption, e.g., through inappropriate room temperature settings or incorrect ventilation behaviour. In commercially operated buildings, complaints from users about a real or perceived undersupply of heat also lead to adjustments to the system technology by the facility management, which lead to additional consumption and encourage energy wastage through user behaviour. For example, a ventilation heat loss caused by permanent tilt ventilation can be compensated with correspondingly high inlet temperatures at the radiator if sufficient heat is provided. The comfort gain (room temperature and fresh air supply) maintained by the user in this way leads to disproportionately high heat energy consumption.
The plant automation (e.g., control of the heat generator, speed specification of circulation pumps, etc.) and the room automation (e.g., control of the lighting, control of electronic thermostatic valves) are organised as two trades in terms of structure and planning [
5]. Although information can be exchanged via interfaces, this is only done in a few cases and mostly in informative form (for example, as the integration of warning messages from room automation in the building management system) and not to optimise operational management (for example, to adapt setpoint specifications for the system technology from the room automation data determined). Energy management is traditionally another system to which information is also transferred via corresponding interfaces and used for evaluation. A central challenge in the operation and optimisation of the operational management of the system technology is therefore the great uncertainty about the real perception of the employees and the situation in the offices on the one hand and the decentralised information situation in the various systems on the other. In traditional building automation systems and platforms, there is no structured way of obtaining and processing feedback apart from unrepresentative individual opinions and problems. This applies not only to settings during working hours, but also to information about the effect and the utilised and still existing potential of setback operations outside working hours. In practice, this often leads to a generalised oversupply of heating energy, especially when individual complaints reach facility management.
This is where the ComfortLab platform presented in this paper comes in. The associated solution is to obtain standardised feedback on the temperature perception of the largest possible number of employees with as little individual effort as possible and to take this into account as a specification for the operational management of the system technology. The platform was developed in a BBSR-funded (Federal Institute for Research on Building, Urban Affairs and Spatial Development) research project by the EBZ Business School and the Wuppertal Institute with the involvement of the design studio ‘inbestergesellschaft’ on the basis of the Living Lab approach [
6,
7]. The project was carried out in the heating periods 2021/2022 (pre-test) and 2022/2023 (field test) with over 200 participants in the BMUV properties (Federal Ministry for the Environment, Nature Conservation, Nuclear Safety and Consumer Protection) in Berlin and Bonn, which cover a total gross floor area of around 100,000 m
2. In the predecessor project (details can be found in the corresponding publication [
8]) the main focus was on the user’s individual interaction with the building in terms of heating and ventilation behaviour. To this end, the effect of feedback systems and surveys was analysed and successfully evaluated. In the follow-up project, this approach was continued, but with the focus on reaching a significantly larger number of employees to provide better findings for the operational management of the system technology as a whole and as support for instructions for facility management.
The current status of other research and publication activities was analysed on the basis of a literature search. Several sources were found that take partial aspects of the ComfortLab approach into account. The integral overall approach between querying the temperature perception, analysing the building technology and providing feedback to the facility management, considering an appealing user interface that is understandable for non-technical users, has not yet been tested and represents a novelty with regard to the available publications. The following is a brief description of current research activities and results and how they relate to this publication and the ComfortLab approach.
In [
9], a literature search of studies was carried out in which user-centred operational management is described. Various aspects and technologies were considered and summarised here. An existing challenge is seen in the necessary amount of user-related data; the number of studies that take building operators and facility management into account is also summarised as very low and requires further investigation. Di Giuda et al. [
10] have developed a system to support adjustments to the system technology, in which data from IoT sensors (e.g., cameras for presence detection) and post-occupancy evaluations were used to support facility management in optimising operations and building use based on defined KPIs. This did not include any kind of direct feedback from employees. The authors in [
11] summarise the structure of IoT systems in the context of building management systems and propose an ‘adaptation level’ at the management level that will, for example, incorporate user activities into operational management in the future. In [
12], an interface was developed that visualises information on energy consumption for students. Surveys conducted at the same time in the co-design process were met with broad interest; 48 students were surveyed, and the feedback was used to revise the visualisation. Feedback into the operational management or the derivation of recommendations for action for facility management was not investigated. Garg et al. [
13] have developed a survey-based interface for households, which is intended to encourage energy savings through feedback. Here too, optimisation or adaptation of the system technology was not investigated.
In [
14], the authors examined building automation systems in a review paper with regard to the possibilities of adapting building operation while taking real-time feedback into account. Only a few studies were found that show mathematical relationships between physical factors of the indoor climate and productivity, most of which are still based on static models (e.g., the PMV), and there is potential for an individual approach. Jayathissa et al. [
15] have developed an app that can be installed on Fitbit watches. In a four-week test phase, almost 1500 votes were collected from 15 people. Hierarchical K-Means Clustering was used to form four clusters for comfort perception. The use requires configuration and availability of the smart watches and does not offer any direct recommendations for actions for the facility management regarding system technology settings. In [
16], a system was developed that provides building users with recommendations for reducing their energy consumption on the basis of operating data; the premise here was a high degree of scalability to other buildings and systems. Feedback from the user or the derivation of system settings was not considered.
In [
17], Jin et al. simulatively tested the possibility of reducing the consumption of ventilation systems, plug-in loads and lighting by means of presence detection through WLAN activity; on a daily average, this could lead to energy savings of 10% in the study. There was no transfer to real buildings or a field test. In [
18], the acceptance of a building automation system by facility managers was evaluated, with the system providing machine-learning-based information about faults in the system technology. Compliance with the user’s comfort requirements was defined as a goal alongside energy- and cost-efficient operational management but was not specifically taken into account during development. Desogus et al. [
19] are actively developing a platform that enables facility management to optimise building operation based on measured comfort indicators. The evaluation of comfort is based on measured parameters and not on feedback. Based on a partial dataset from the ASHRAE Global Thermal Comfort Database II [
20], the authors of [
21] investigated how the load control of HVAC systems can be realised under the predicted thermal satisfaction based on the dataset. No original data samples were collected, and no tests were carried out on real systems.
The summary of the current research situation shows that individual aspects, such as recommended actions for system settings and feedback from users via end devices (e.g., smart watches), already exist and have been implemented in the research landscape. The ComfortLab platform, on the other hand, offers a device- and user-independent way of intuitively assessing the temperature well-being of the largest possible number of people, combining these data with technical parameters from building automation and making them available to facility management. The platform is both flexible in terms of building technology and cost- and resource-efficient in terms of the necessary data collection for the largest possible group of people. The following research questions were defined as guiding principles and were to be answered:
What are the requirements in terms of thermal comfort in the object under investigation and what parameters need to be collected for the envisaged solution?
What is the status quo of conventional operational management, considering different operating periods?
Is it possible to develop a simple and intuitive, web-based solution that addresses as many participants as possible and obtains their temperature perception over a sufficiently long period of time on one site and considers the requirements of the facility management on the other site?
What reduction in the flow temperature in heating circuits as a central control variable is possible, and what effects does this have on heat energy consumption?
The rest of the paper is structured as follows:
Section 2 presents the background to the measurements and platform development as well as the functionality and technical parameters.
Section 3 presents and interprets the results of the comfort measurements and the use and acceptance of the platform. The resulting energy consumption and room temperatures as well as the results from the final survey, which was carried out with the participants after the test period, are included.
Section 4 concludes the article with a summary and critical evaluation of the results, as well as open research questions and planned future developments.
3. Results
Following the presentation of the infrastructure and the use of the ComfortLab platform, this section presents the key results from the comfort and indoor climate measurements (
Section 3.1) and the use of the ComfortLab platform as well as the temperature perception (
Section 3.2).
Section 3.3 explains and classifies the effects on system operation and the resulting energy consumption. The results are then compared with the findings from the final survey, in which the ComfortLab participants were asked about their experiences following the test period (
Section 3.4).
3.1. Results of Comfort and Room Climate Measurements
As the parameters for the ComfortLab platform should be recorded with as little effort as possible in order to enable as many employees as possible to participate, comfort measurements were initially taken in a representative selection of offices, as described in
Section 2.1. Should fundamental problems arise, for example with draughts, this would have to be considered in the research design and voting behaviour. Otherwise, the indoor air temperature in the offices should form the basis for the survey as the dominant and relatively easy-to-determine measured value in a large number of offices. As the offices were largely unoccupied in 2021 and partly also in 2022 due to the ongoing COVID-19 pandemic and the resulting predominant home office work of most employees, the measurements represent the indoor climate situation without the effect of the presence of people (settings on thermostats, ventilation processes, etc.) and the necessary temperature control of the offices. In principle, a general lowering of the temperature level would have been possible here, but definitely during non-working hours. The corresponding time periods are defined as follows for all evaluations:
- -
Working days’ daytime operation: Monday to Friday from 7 a.m. to 6 p.m.
- -
Working days’ night setback: Monday to Friday from 6 p.m. to 7 a.m.
- -
Weekend operation: Saturday and Sunday all day.
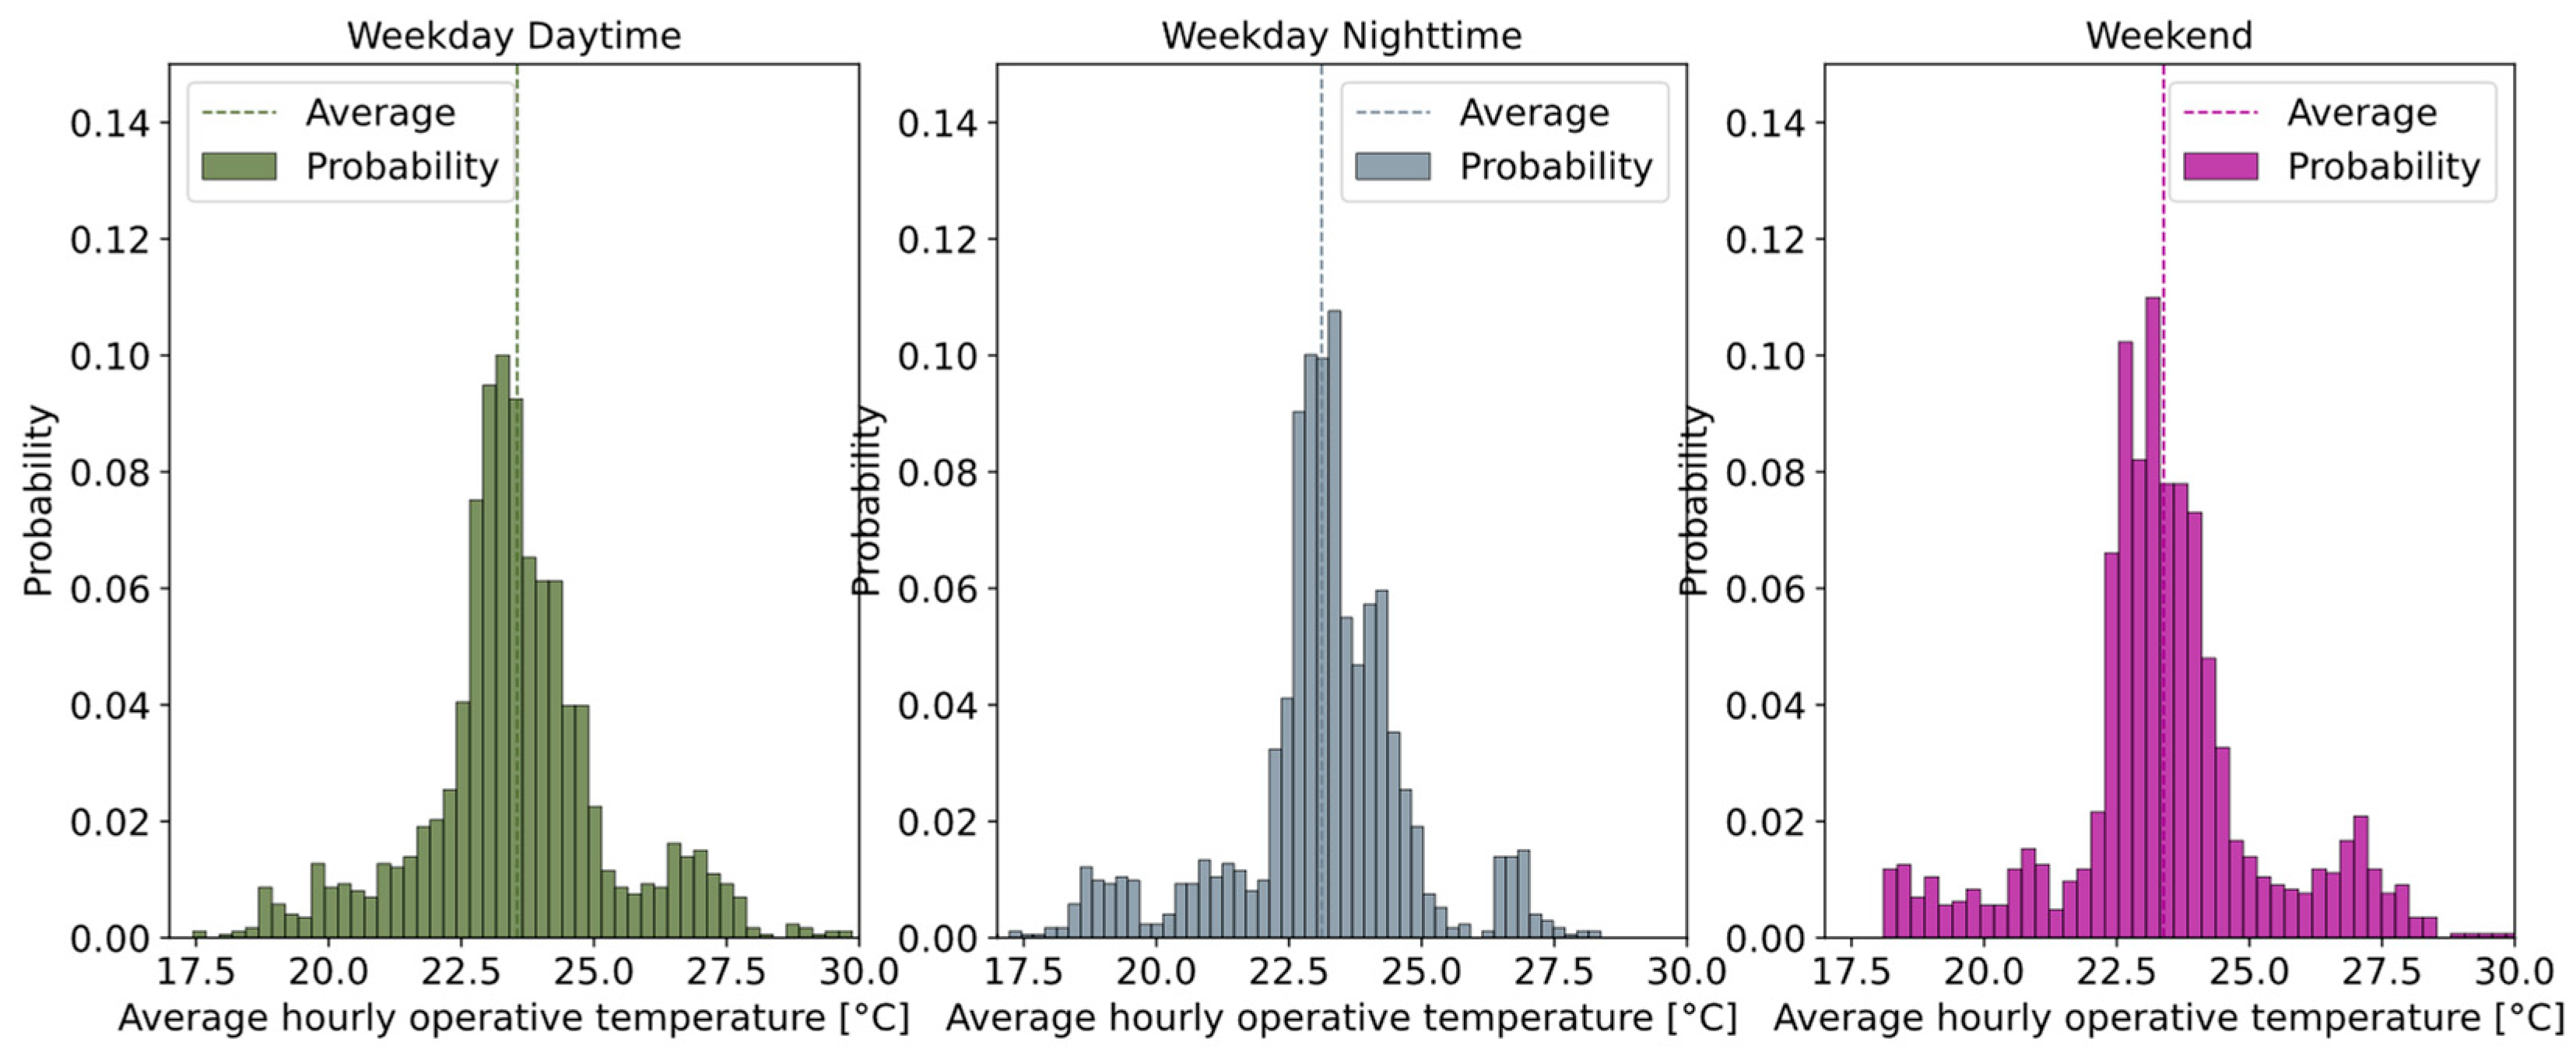
Figure 4 shows the frequency distribution of the calculated operative temperature as the mean value of the measured room temperature and the mean radiation temperature from the comfort measurements of all rooms as hourly average values for the three time periods. Statistical parameters from the operative temperature distribution are listed in
Table 1. Only values from days with average outdoor temperatures below 15 °C corresponding to the heating limit of the building are considered. It can be seen that in daytime operation (left diagram, olive green bars), in night-time operation (middle diagram, slate grey bars) and on weekends (right diagram, dark magenta bars), the average operating temperature on heating days is above 23 °C and also rises to up to 27 °C at times during the night and on weekends.
Accordingly, there should be no problems with the possible heating power provided by the heating system. Even without real presence, the PMV value calculated from the measured values and parameters (metabolic rate: 1.3 MET, clothing insulation: 0.9) allows conclusions to be drawn about the comfort situation for different periods of time. Above all, during the assumed non-working hours and the associated non-occupancy of the building, the temperatures can be lowered considering a minimum building physics temperature.
Figure 5 visualises the PMV calculated from the measured values as well as the metabolic rate and the clothing index for the three time periods, analogous to
Figure 4. Statistical parameters from the PMV distribution are listed in
Table 2.
The red lines (−0.5 to 0.5) represent the range in which the PMV should be when people are present. The comfort index changes only slightly within the different time periods but is also in the rather high range at night and on weekends, sometimes even in the “too warm” range. The few low PMV values are associated with individual cold radiation temperatures but are the exception. Other comfort problems, such as draughts, were not recorded by the measurements and should not have a significant negative impact on comfort. To keep the survey for the ComfortLab test feasible in terms of cost and effort, the room air temperature was therefore chosen as the decisive factor. As the office users were already provided with desktop thermometers to record the room temperature and sensitise them to heating and ventilation behaviour due to the 19-degree strategy specified by the EnSikuMaV [
26], these values could also be used pragmatically for the platform.
In addition to the short-term comfort measurements, the PIAF assistance system was installed in almost 30 selected offices in Bonn and Berlin for the entire duration of the test to record the long-term development of room temperatures and indoor air quality, at least on a random basis, and to be able to assess the occupancy of the offices with a high temporal resolution. PIAF records relevant room air parameters and uses acoustic and visual signals to provide users with recommendations on correct ventilation behaviour. The background and details are described in the publication on the previous project [
8]. The recorded data on room air temperature and CO
2 content were used to gain further insights into the occupancy density and room temperatures, as well as to estimate reduction and savings potential.
Figure 6 shows the average hourly indoor air temperature above the hourly maximum value of the carbon dioxide concentration for all offices in Bonn, divided into the pre-test period (heating period 2021/2022: circle) and the ComfortLab field test (heating period 2022/2023: cross). In the status before the ComfortLab platform was used, relatively high room temperatures dominated during the entire heating period, even when the building was not occupied. The evaluation of the comfort measurements, which could only be collected for short periods of time due to the complex and cost-intensive measurement setup, can thus be further validated with the PIAF measurements accompanying the heating period.
The evaluation of the measurements for selected periods and rooms shows that no fundamental comfort problems are to be expected in the rooms. It should be possible to reduce the temperatures to a significant extent, especially a much greater reduction during non-occupancy periods. The possibility of reducing energy consumption by lowering the heating system in residential and non-residential buildings and the practical application have been examined in detail in other studies. In principle, the application in commercial buildings is easier to realise due to the more regular use (often no occupancy on weekends and regular occupancy during the day) compared to residential buildings [
27,
28].
3.2. ComfortLab Platform Results
The following section summarises the results of the use of the ComfortLab platform in the pre-test in the 2021/2022 heating period and in the field test in the 2022/2023 heating period. The acceptance of the participants and the evaluation of the activity, the individual adjustments to temperature perception and the effects on room temperatures and energy consumption are explained.
The basic idea of the ComfortLab platform and the possible technical realisation was tested in the pre-test in the 2021/2022 heating period with a small number of selected participants (15 in Bonn and 11 in Berlin). An initial version of the platform was presented to them and made available for use. The findings were discussed in a workshop with the participants, and the feedback was used to adapt the platform and design for the field test in winter 2022/2023. This field test took place from 22 November 2022, to 31 March 2023, in the two BMUV buildings in Bonn and Berlin.
A total of 193 participants (111 in Bonn, 82 in Berlin) tested the platform and submitted at least one vote and the corresponding room temperature measurement, with a total of 6509 votes cast (2823 in Berlin, 3686 in Bonn). As the offices in both properties were rather sparsely occupied in both winters, the number of participants as a group of people present can be considered very high. Of the total number of participants, 44 cast at least 50 votes, 70 cast at least 30 votes and 152 cast at least 10 votes during the survey period; a minimum number of votes was considered in the respective evaluations.
To enable a comparison of the two heating periods, the tunings from the pre-test of the first heating period (winter 2021/2022), in which there were no special regulatory requirements for room heating, were compared with the tunings from the field test in the second heating period.
Figure 7 shows the change in the tuning in the two test winters. In winter 2021/22, the vote in Berlin (86%) and Bonn (70%) was predominantly neutral, with the room temperatures measured by the participants at around 22 °C (the room temperatures measured using existing sensors in new buildings in Berlin are more in the region of 23 °C). The distribution of votes in the field test tended to shift slightly to the left towards the cold range, although the fine vote still represents the most frequent vote in both properties.
However, it should be noted that in the status quo, the available heating capacity was sufficient to dissipate heat even at cold outside temperatures, for example, by tilting the windows, thus maintaining comfort in terms of temperature and air quality. The average room temperature associated with the respective vote shows an expected correlation between room temperature and perception but is below the temperatures in the pre-test for the individual voting options in the winter field test and is more pronounced in Berlin than in Bonn. The “warmer” votes in the second winter in Berlin came from one participant who felt it was too warm even at just under 19 °C. This effect was not investigated further as an individual opinion.
The evaluation of the feel-good temperature (corresponding to the measured temperature with a vote of “fine”) for all participants in
Figure 8 shows that there are large individual differences, with the average measured temperatures ranging between 18 °C and 23 °C. The higher temperatures come from the winter in the pre-test or offices in which, for example, the solar radiation also allowed temperatures above 19 °C in the second winter, corresponding to the limit set by the EnSikuMaV. Only offices in which at least 10 “fine” votes were submitted are listed. While some participants (e.g., office 23, 56, 60) only cast a “fine” vote for one temperature, for other participants (office 15, 86), up to a 3 °C difference in room temperature is acceptable.
The comparison of the votes of the participants who took part in both the pre-test in winter 2021/2022 and the pilot test in 2022/2023 and who cast at least five “fine” votes in
Figure 9 shows that low temperatures were acceptable for most participants in the second winter and the associated measured room temperature in the test winter was just under 1 °C lower than in the previous winter. There seems to be a corresponding willingness to adapt to lower room temperatures by wearing warmer clothing, for example.
With reference to the time of day or the day of the week and the temperature perceived as fine, no significant differences can be identified. If the fine temperature is considered for mornings or afternoons or for individual days of the week, there is only a very small difference across locations. Within the heating periods, the difference between mornings and afternoons is a maximum of around 0.2 °C at the two locations, and a comparison of Monday mornings, for example (return to the office after the weekend), with other working days also shows no significant differences. Therefore, the temperature perception in this context does not appear to show any noticeable dependence on the time or day of the week. A slight dependency on the outside temperature can be seen; at outside temperatures above 10 °C, the fine temperature is on average around 21 °C, whereas at outside temperatures below 5 °C, it is closer to 20 °C.
3.3. Effects on System Operation and Energy Consumption
The winter of 2022/2023, during which the ComfortLab platform was field-tested, was overshadowed by the Russian invasion of Ukraine. Due to the resulting tense situation in the energy markets, the German government issued the EnSikuMaV to secure the energy supply. This ordinance limited the heating of public buildings to 19 °C, although higher room temperatures may also have occurred on heating days due to solar radiation, for example. In the properties investigated, the inlet temperature in the heating circuits was noticeably reduced to implement the regulation. The effects and changes in consumption in the field test winter can therefore not be directly transferred to the settings made by the ComfortLab platform. Nevertheless, the recorded data provide a revealing insight into what temperature level is appropriate in the long term and what effects this has on energy consumption. The passive house sector in Berlin is used as a reference for the development of room temperatures, as networked room temperature sensors integrated into the building automation system are installed in around 50 rooms there and high-resolution temperatures from recent years are available.
Figure 10 shows that there were no or only very slight setback times and temperature adjustments in the previous heating periods, regardless of the day of the week, as was already seen from the comfort and PIAF measurements in Bonn. For example, the evaluation of the average temperatures on weekends shows that even in the heating periods (orange-coloured areas) on weekends, hardly any temperature reductions are recognisable, and most room temperatures are above 22 °C, which were achieved by the necessary heating.
In the 2022/2023 heating period with the implementation of the 19-degree strategy, a significant reduction in the temperature level can be seen, as shown in
Figure 10. This also applies analogously to night-time operation on weekdays and regular daytime operation.
This also results in a significant reduction in heating energy consumption. If the weather-adjusted consumption is considered (Bonn: exclusive heat supply by district heating, Berlin: supply of the property by district heating and additionally by means of heat pumps for the passive house sector), this has fallen by 15% (Bonn) and 30% (Berlin) compared to the weather-adjusted consumption of recent years. The weather-adjusted consumption in previous years was relatively constant with fluctuations in the low single-digit percentage range, so the reduction can be attributed to the reduction strategy implemented with the EnSikuMaV.
To assess how the settings have affected the inlet temperatures,
Figure 11 shows an example of the development of the measured inlet temperatures from the heating curve setting of a heating circuit (old building front house) in Berlin.
If the design temperature is set at −10 °C and the heating limit at 15 °C, the following settings result (
Table 3) in the previous heating periods and in winter 2022/2023 (field test).
The values determined result in a gradient in daytime operation of around 1.8 (before) or 1.4 (field test); i.e., the inlet temperature of the heating circuit increases by around 1.8 °C or 1.4 °C for every degree Celsius decrease in the outdoor temperature. At the assumed heating limit of 15 °C average daily outdoor temperature, a reduction in the inlet temperature of around 10 °C can be seen in daytime and setback mode. Overall, therefore, both a reduction in the level and the steepness of the heating curve can be seen. In addition to the reduction in useful energy consumption on the heat transfer side, this also has the advantage of a better coefficient of performance and an associated reduction in electricity demand resulting from lower inlet temperatures in the area supplied by heat pumps. Reducing the inlet temperature in heating systems when using heat pumps is therefore particularly advantageous from an energy point of view [
29].
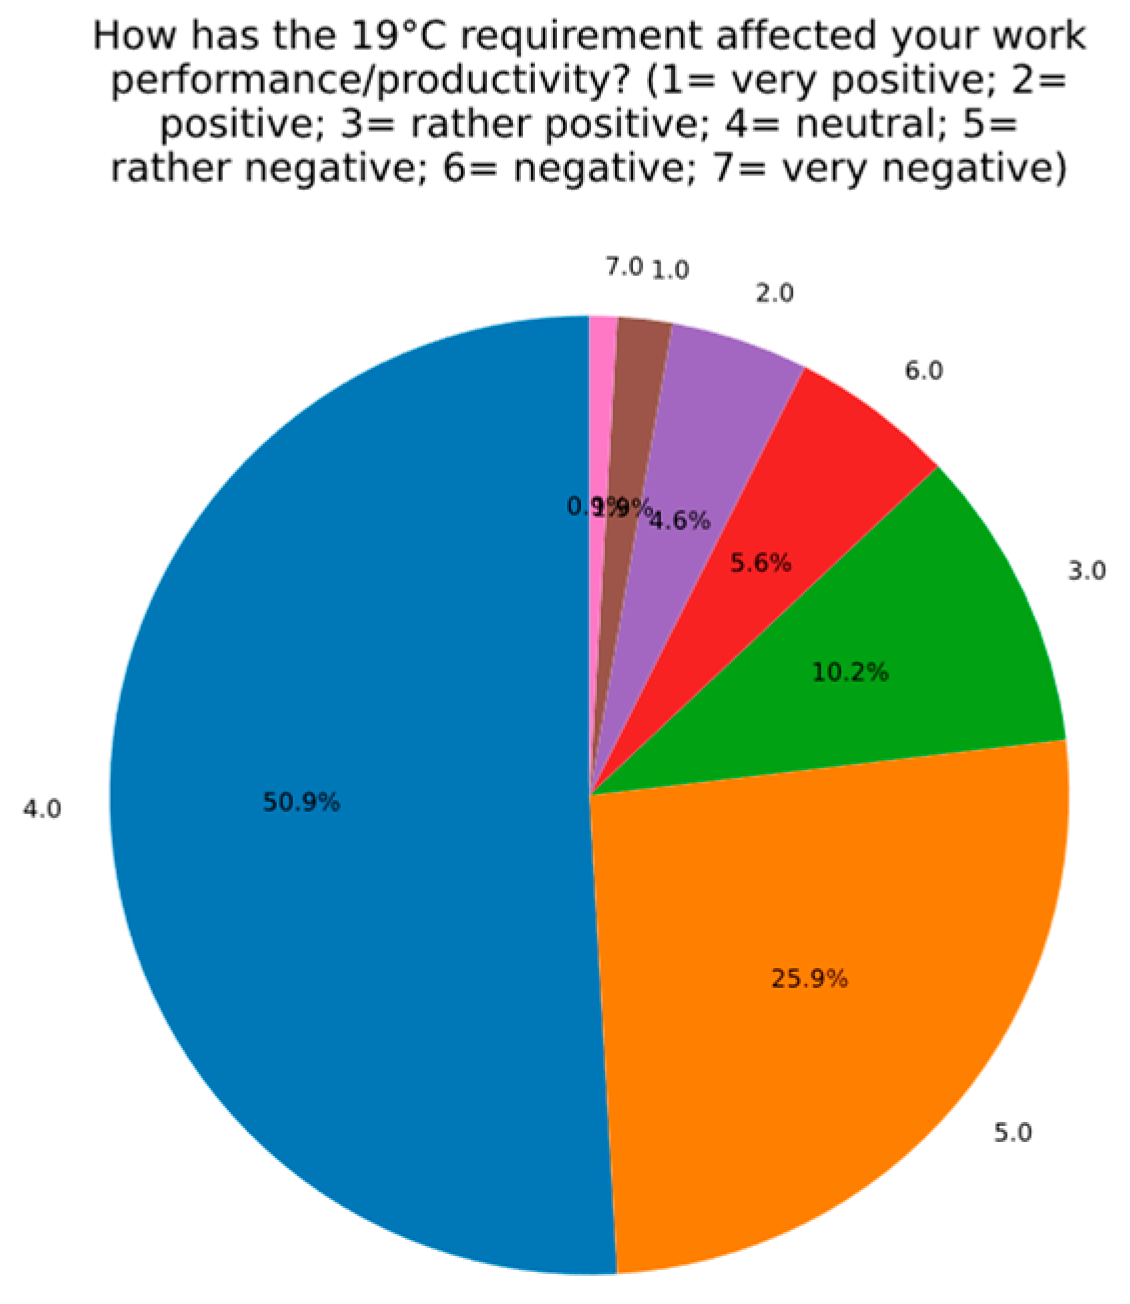
Due to the overlap between the implementation of the 19-degree strategy and the ComfortLab field test, the reductions in consumption due to the two possible effects cannot be directly separated. However, the evaluation of the data shows that a slight increase, which would lead to average room temperatures of just under 20 °C, would already bring about a significant improvement in the perception of temperature. Although this would eliminate a small part of the reductions in consumption achieved, it could, on the other hand, support acceptance of long-term temperature reductions to the necessary minimum and achieve further significant reductions in heat consumption. Studies in which room temperature reductions have been investigated estimate possible reductions in consumption in the range of around 6% per degree reduction in room temperature during the reduction period, although this depends on various parameters such as the building physics, the heating system and the type of building use [
30,
31,
32]. Based on this reference value, a permanent reduction in daytime temperatures in the passive house sector in Berlin from 23 °C to 20 °C would result in potential energy savings of 18% for the period; a further reduction in temperatures on weekends and at night would also be of a similar magnitude in relation to the room temperature values. Due to the parallel 19-degree strategy and the ComfortLab field test, no explicit savings from the use of the platform are shown in this paper. This will be made up for in future applications without the influence of side effects. As the results of the final survey in the following section show, employees are willing to participate in the ComfortLab and adaptation on a permanent basis.
3.4. Results from the Final Survey
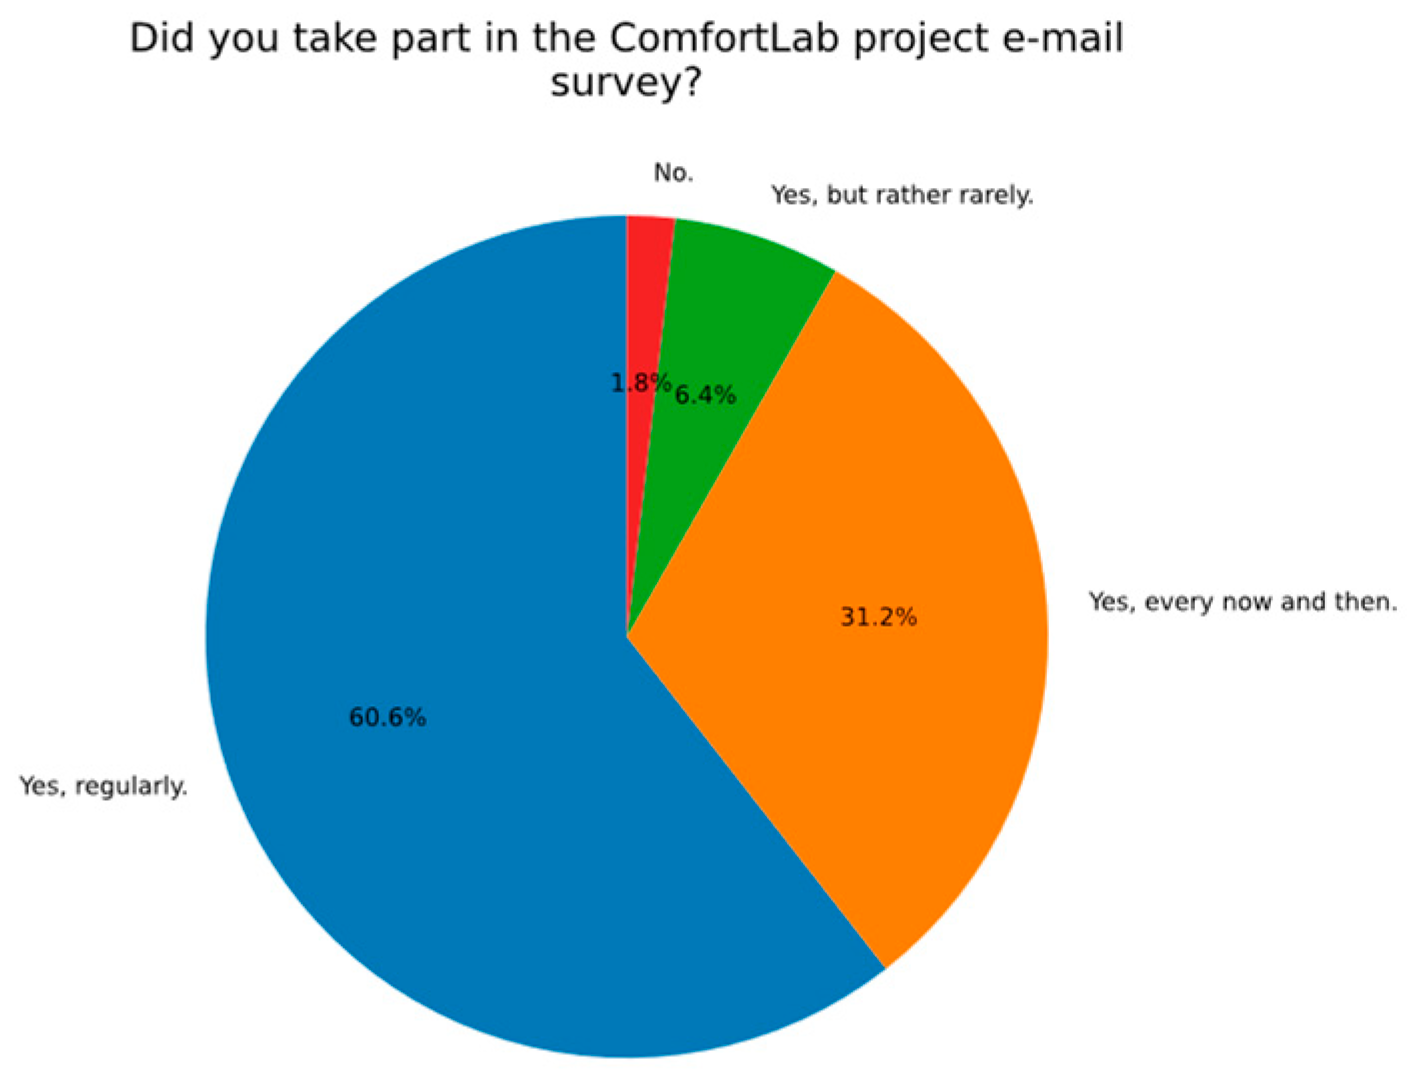
Following the test phase of the field trial, participants were invited by email to take part in a 10-min online survey to share their experiences and challenges with using the ComfortLab platform. The survey was active from 5 to 17 May 2023, and 110 people (60% Bonn; 40% Berlin) took part and completed the survey. The retrospective survey was intended to re-evaluate the results of the field test and provide the opportunity to find out about open issues that were not or not sufficiently addressed during the trial period.
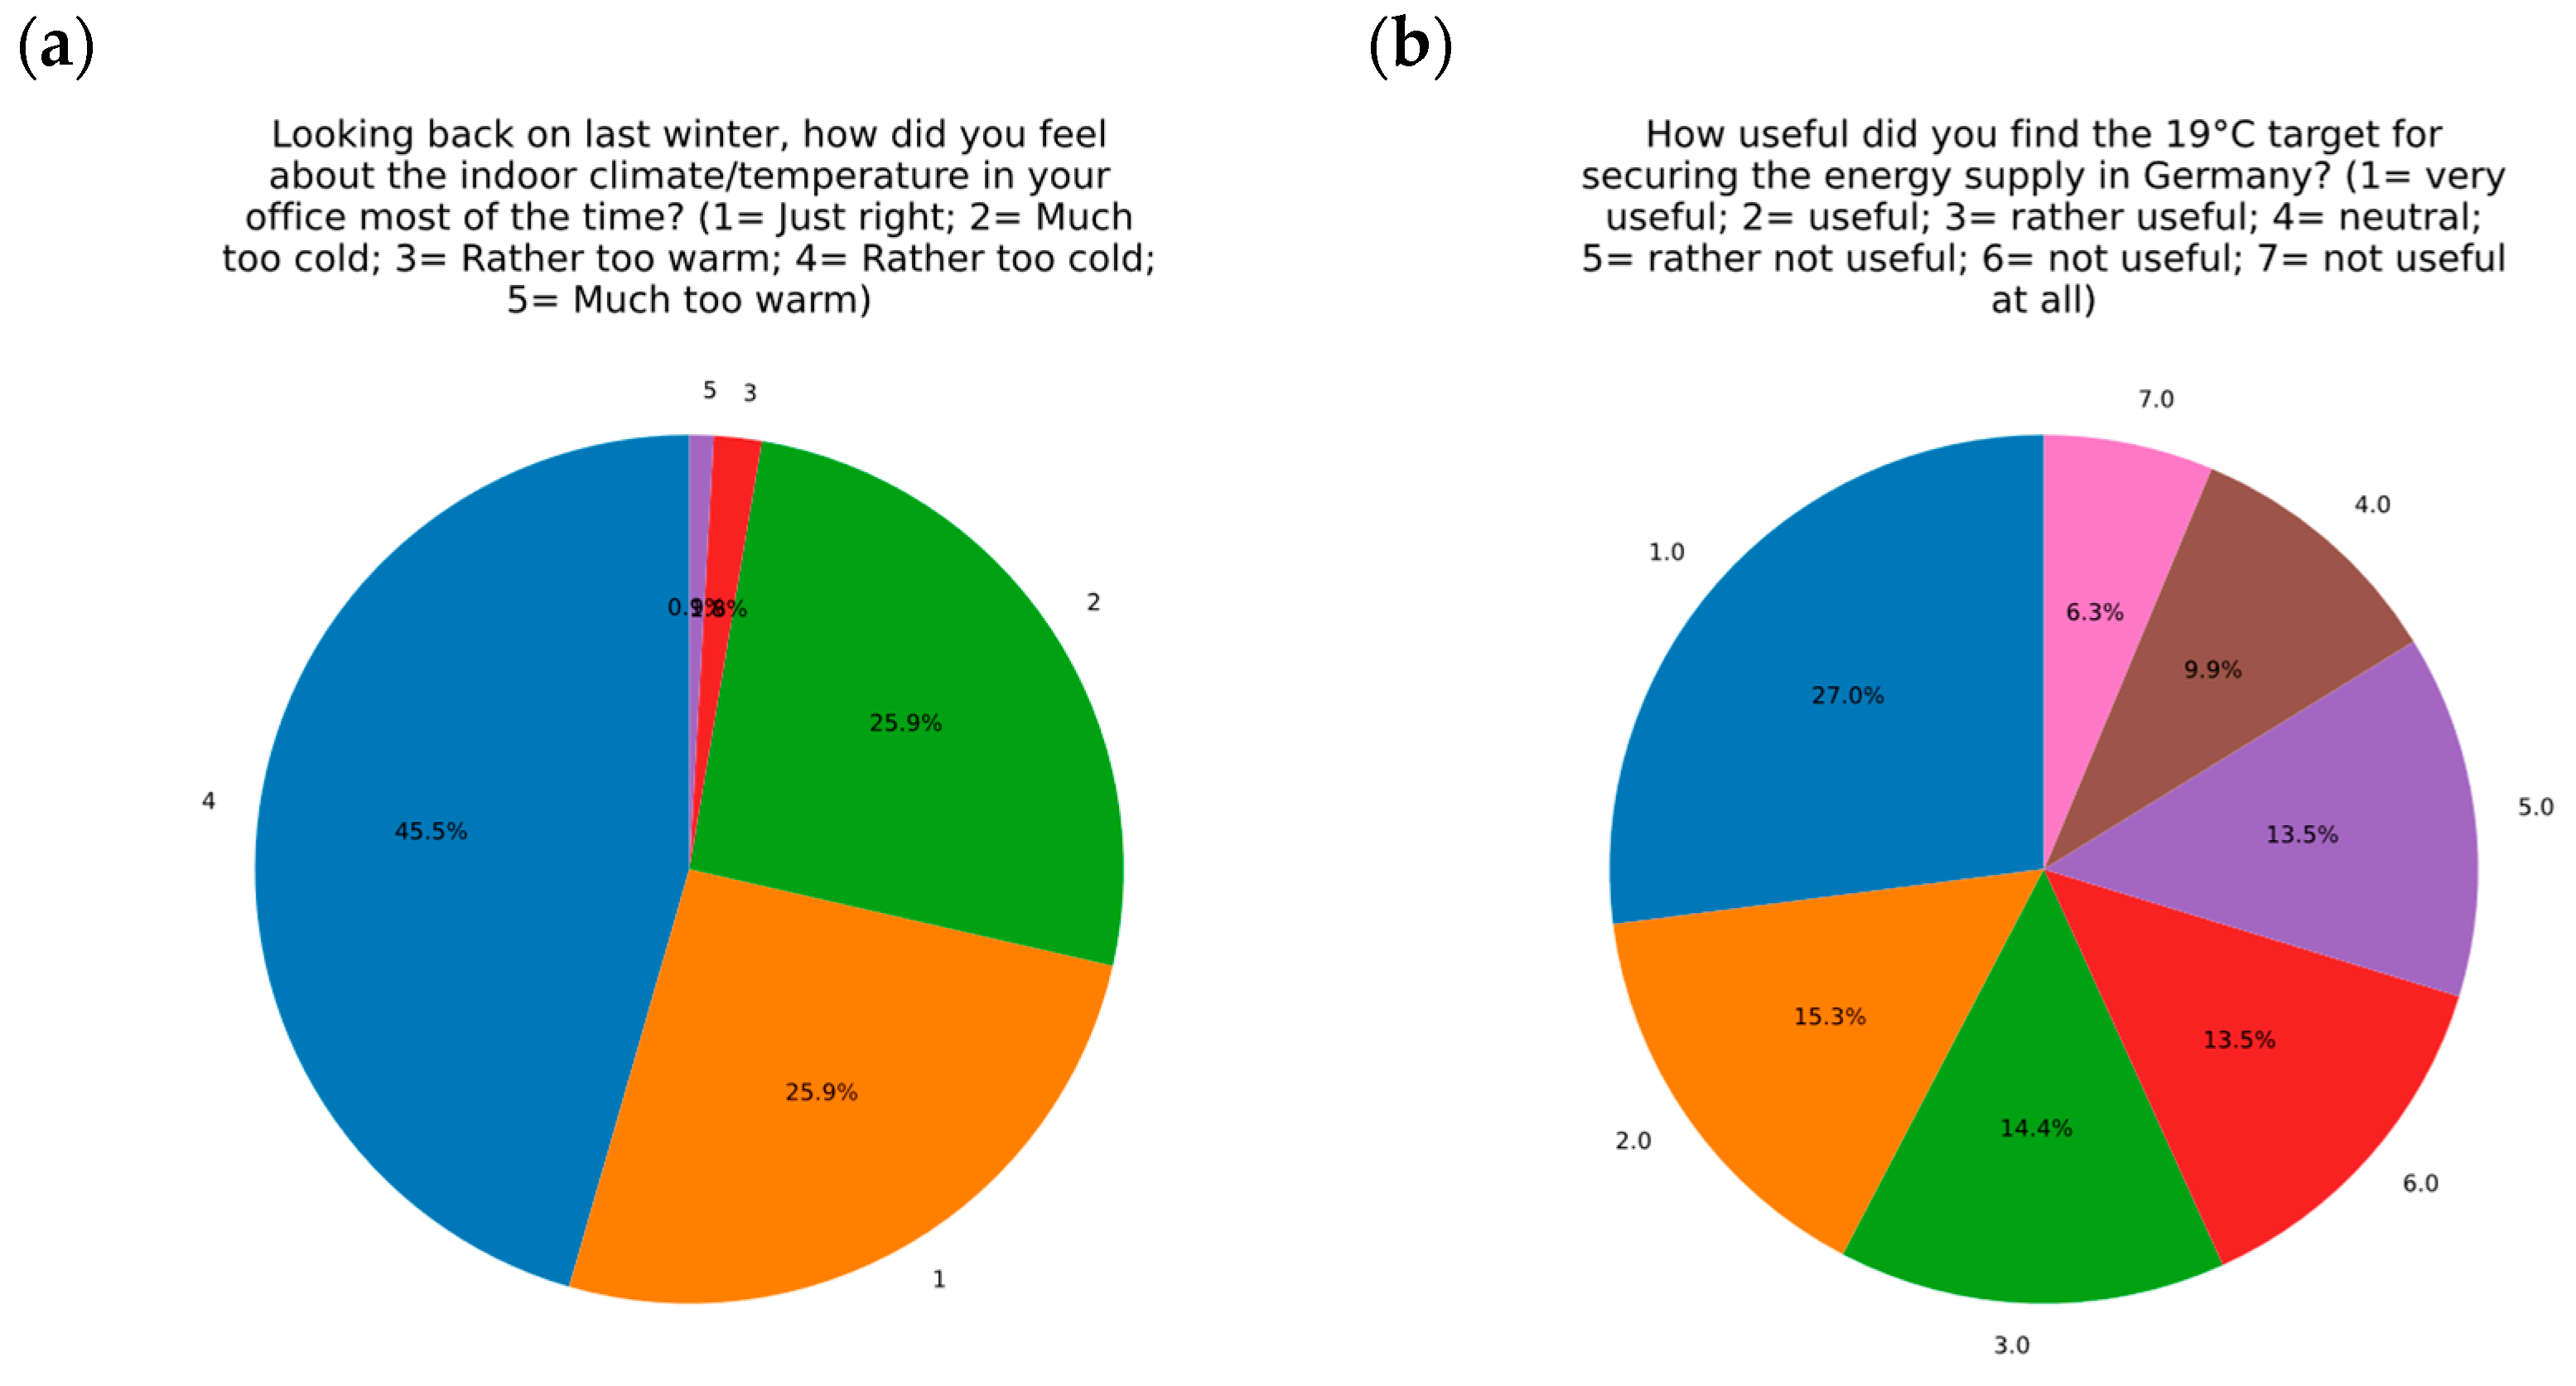
Interestingly, in retrospect, almost 72% of respondents stated that the room temperature was (much) too cold overall during the winter; see the left plot in
Figure 12. This is a significantly higher proportion than the detailed evaluation of the individual votes; see
Figure 7. Reasons for this may include the increased participation of non-satisfied respondents in the survey. In retrospect, the overall situation may also have been perceived more negatively than the everyday situation, also in view of the fact that the room temperatures did not change. Nevertheless, almost 57% of participants felt that the 19-degree strategy was a fundamentally sensible measure to secure the energy supply, at least as a short-term and limited measure; see the right plot in
Figure 12. Many participants would have liked a slight adjustment of the room temperature to 20 °C, for example, as can be seen from the evaluations of the votes. This was not possible due to the fixed specification of the 19-degree strategy. Around 45% of respondents were still able to adapt to the lower temperatures by taking measures such as wearing warmer clothing.
An important point when using the platform is the willingness of participants to take part for a sufficiently long period of time. Almost 64% of participants stated that they did not find participation disruptive in any way, and only just under 14% found participation disruptive to their workflow in any form, as shown in the left plot in
Figure 13. Over 72% could imagine participating for a long period of time in general, as shown in the right plot in
Figure 13. This underlines the participants’ willingness to play an active role in optimising both the temperature settings in their own offices and the associated optimisation of operational management and reduction in energy consumption.
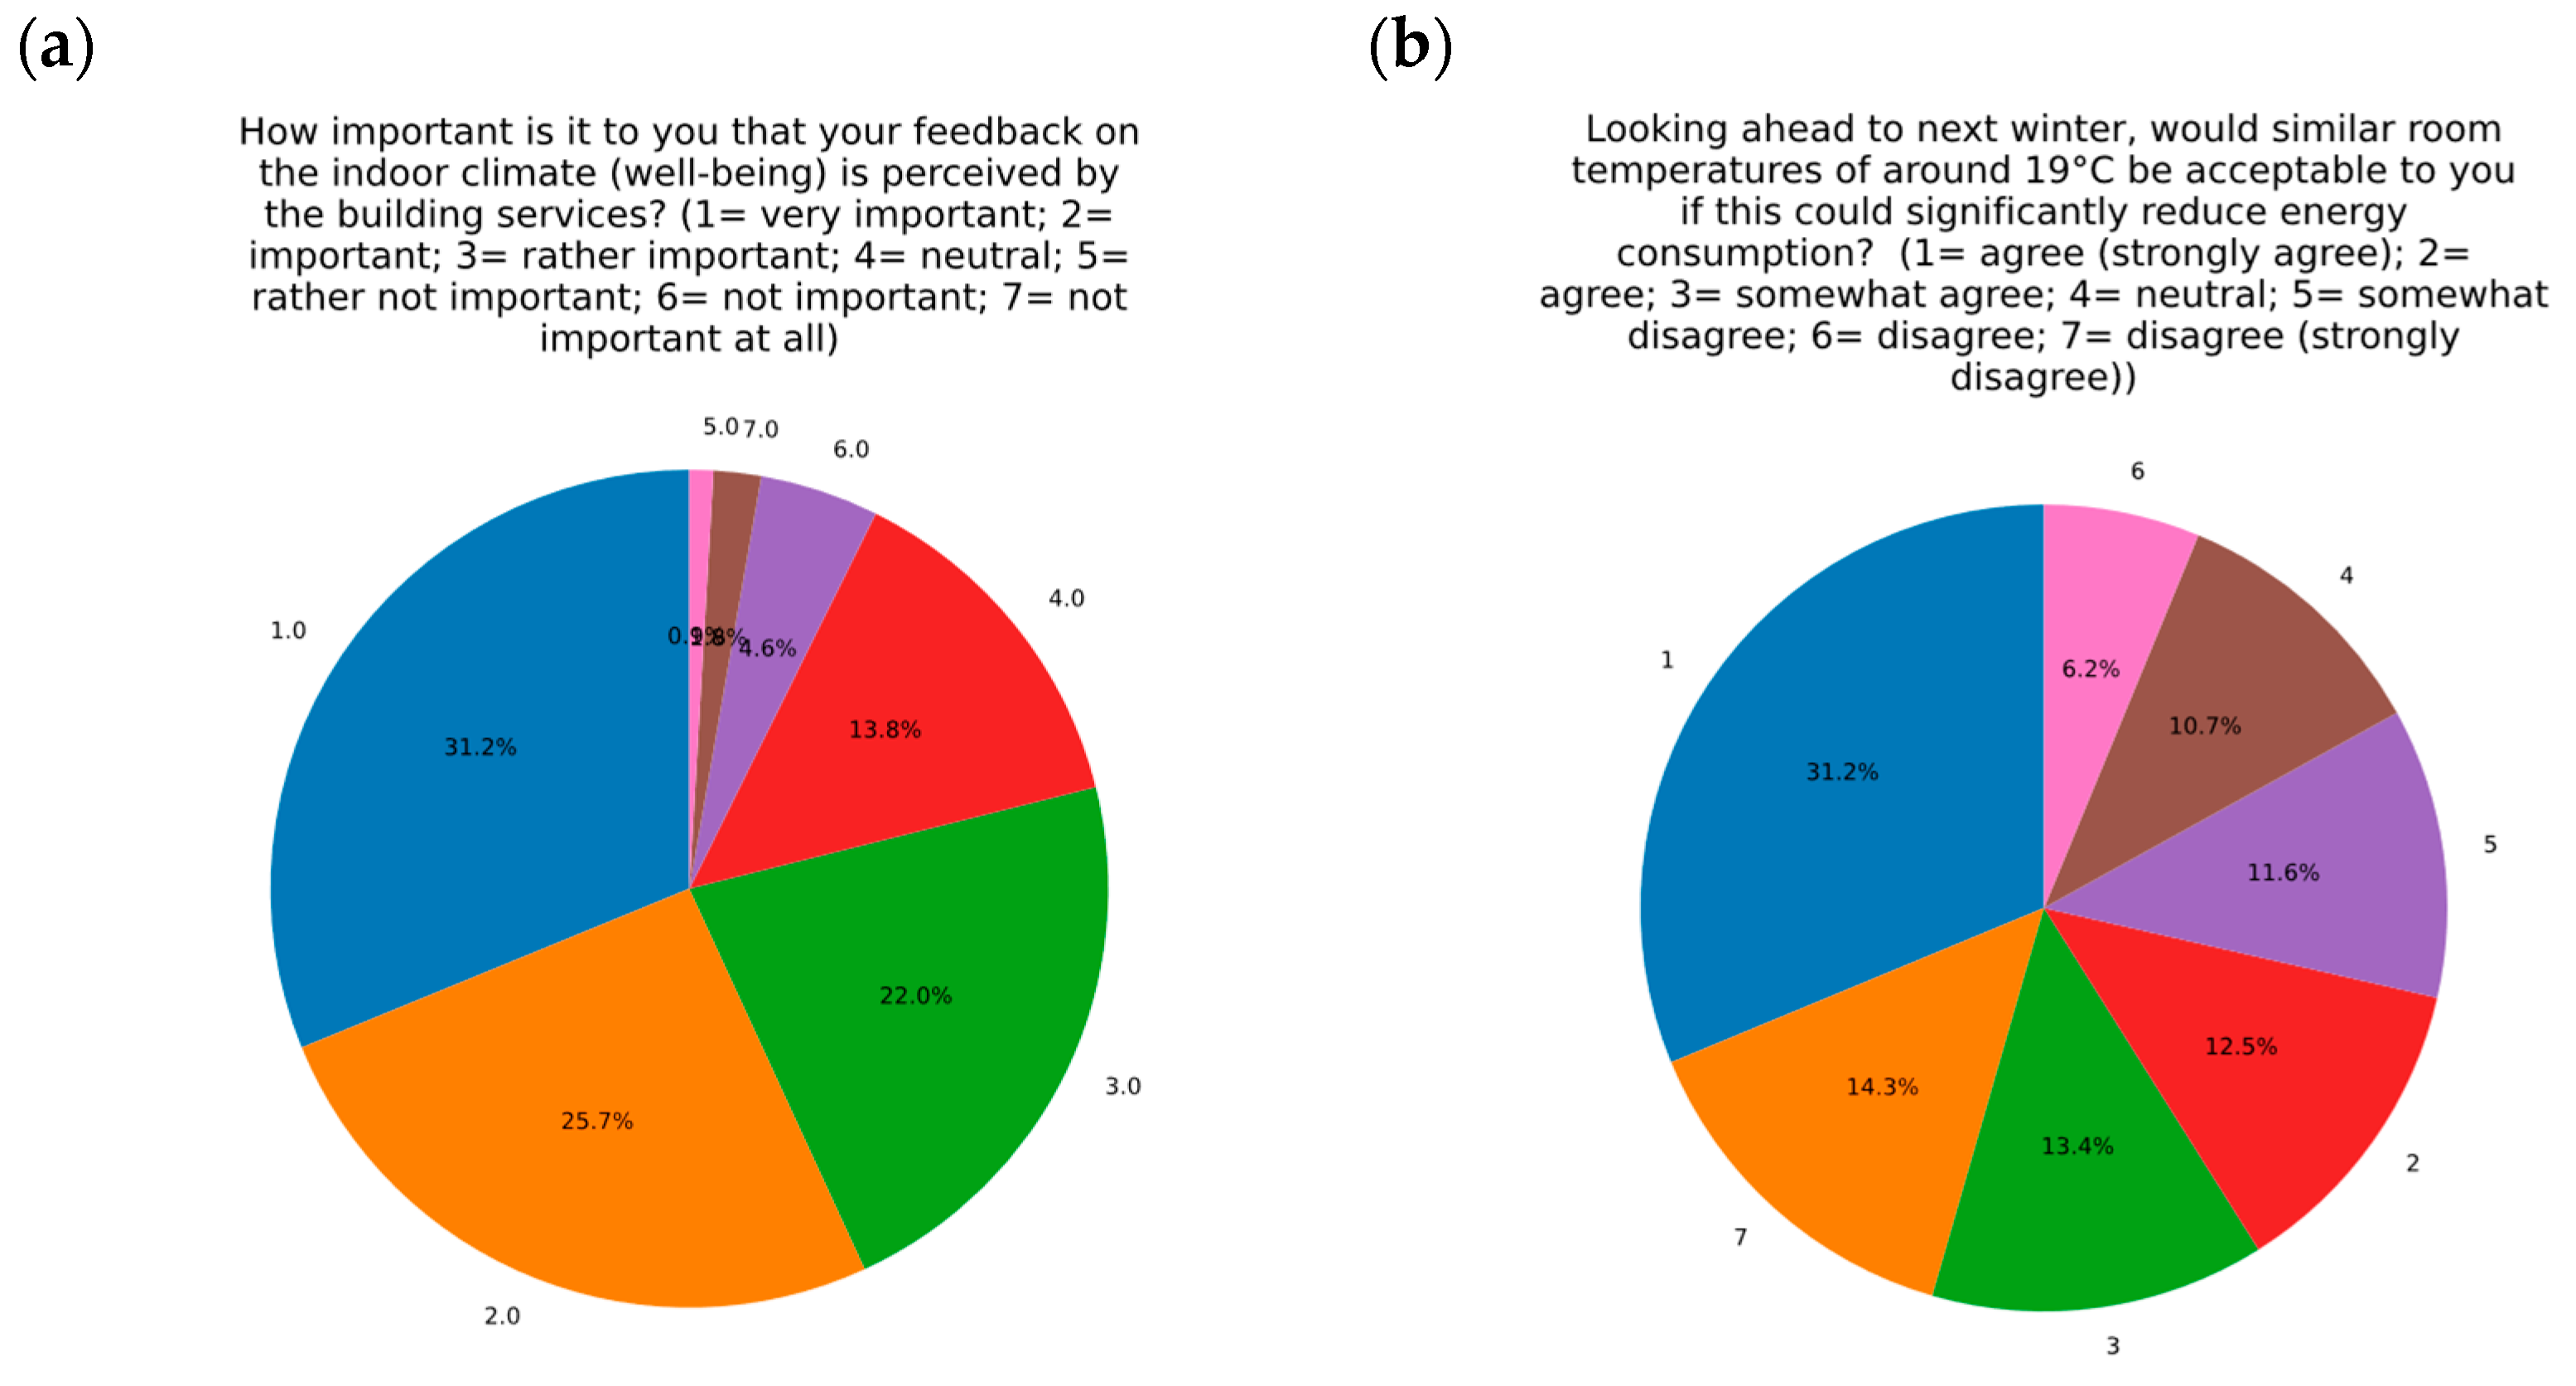
The acceptance of the users is underlined by the fact that almost 80% of those surveyed stated that it is any kind important to them that their feedback on the indoor climate and well-being is considered by the building services and incorporated into the operational management, see the left plot in
Figure 14. This goes hand in hand with the assessment of the overwhelming number of participants (57%) that similar temperatures would also be acceptable in the future; see the right plot in
Figure 14. Many participants therefore require at least a slight increase in temperatures instead of an inflexible, blanket requirement as specified in the EnSikuMaV.
Overall, it can be concluded from the survey that although the across-the-board reduction has enabled significant savings to be made, this has come at the expense of the satisfaction of a large proportion of the workforce. At the same time, employees are willing to participate, even in the long term. As the 19 °C room temperature had to be implemented as a blanket requirement during the field test winter, acceptance should be even higher if the temperatures are adjusted in a targeted manner. All remaining survey questions and the results are listed in
Appendix A.
4. Discussion
In this paper, a platform was presented that combines an integration of the temperature perception of office employees, technical parameters from the building automation system and recommendations for settings on the heating system for the operating personnel. This is intended to close the existing gap between the situation in offices (temperatures and individual perceptions) and technical parameters (inlet and return temperatures of heating circuits, energy consumption). The aim is to capture as broad a picture of the employees’ opinions as possible so that individual opinions are not processed and the technical operating staff can use the information for the iterative optimisation of operational management.
Fundamental comfort problems (e.g., draughts) were not identified in the reference building after exemplary sampling of the indoor air parameters and calculation of the PMV. Based on this, the room temperature was determined as a representative and comprehensive measured value for the ComfortLab platform. This was the first key question that we were able to answer for the property as an example.
With reference to the indoor climate values recorded from various available sources (PIAF measurements, comfort measurements, historical building management system data from the passive house sector in Berlin), it became apparent that the system operation in the status quo was not operated from an energy efficiency perspective, but that maximum comfort with high room temperatures was the requirement. Reduced operation, for example at night or on weekends, could not be detected to any significant extent. The exemplary measurement of indoor air quality as an indicator of building occupancy showed a relatively low attendance rate due to the COVID-19 pandemic, and reduction potential was also identified here. These results cover our second key question.
In an iterative process, the platform was implemented with displays for employees (ComfortStripes) and facility management (ComfortHub). Based on the Warming Stripes, which show the change in global temperature and were adapted to building measurement values, employees were shown a simplified representation of their own room temperatures and temperature perception over time. For facility management purposes, the individual adjustments were aggregated to provide an overall view at the heating circuit level and combined with system data (inlet temperatures, energy consumption, outside temperature). With reference to our third key question, this goal was achieved in that customised solutions were developed and tested for the two groups (office staff and facility management).
The field test in winter 2022/2023 met with great interest among employees and attracted a three-digit number of employees to participate, with over 6000 votes collected. The application shows that the ComfortLab platform can be used to record the individual temperature perception of a large number of participants with little effort. The results, overlaid by the 19-degree strategy specified in the EnSikuMaV, show that although a general reduction in the temperature level can significantly reduce energy consumption, this is accompanied in some cases by a significant deterioration in the thermal well-being of employees. Although considerable weather-adjusted savings of up to 30% were achieved in the example of the Berlin property, these are more of a short-term success. The 19-degree strategy was a temporary measure in the wake of the energy crisis in 2022. It was no longer implemented in the subsequent heating period 2023/2024, which is why it can be assumed that the settings in many properties were raised to the previous level again. This goes beyond the project duration and could therefore not be considered further. These findings only partially answer our fourth key question. Due to the time overlap between the field test and the mandatory implementation of the 19 °C strategy, the effect of temperature reduction and energy savings cannot be completely separated. Further research is required here, and a further field test without restriction to specific system settings is necessary.
The future development of the platform offers scope for some optimisations and adjustments. In the current field test, the test subjects had to read and transmit the room temperature independently. In addition to a certain susceptibility to error, this also only allows a snapshot to be taken at the time of the assessment, without taking into account and evaluating the development of the room temperature over time. Above all, this resolution is not sufficient for evaluation during non-attendance times (evenings, weekends, vacation periods). For this reason, communicative temperature sensors should be used that can automatically transmit their data to the building automation system, for example, and be integrated into the platform. Some of the rooms in the Berlin property in the passive house sector already have these, and a prototype integration into the ComfortLab platform was tested as part of the research project. In view of the requirements of the EPBD, the automated recording of indoor air parameters will be mandatory in the future for new buildings and refurbishments, so information on temperatures and air quality in rooms will be included in the building for standardised data collection. On the other hand, manual input by employees in the workflow can also increase engagement with and awareness of the platform and heating and ventilation behaviour.
An existing challenge is greater interaction with facility management and evaluation of the implementation of the strategies. Due to the 19-degree strategy, the ability of the operating staff to influence and take into account the individual perceptions of the participants when setting system parameters was greatly reduced. Therefore, the field test had to be limited to the evaluation of theoretically possible and sensible reductions. In general, the feedback from facility management on the presentation and information content was positive, and this is to be tested in more detail in the future.
The current approach of the ComfortLab platform provides an overview of the recorded room temperatures and the comfort level, aggregated at the heating circuit level. Although this makes it possible to intuitively adjust settings on the heating curve, the plan is to automate this step in the future and to automate adjustments to the heating characteristic curves for day, night and weekend operation by automatically evaluating the settings and parameter changes. By integrating the various building automation protocols with which the measured values are recorded, it is already possible to transfer setpoint specifications to the building automation system.
Another way of using the data from the ComfortLab platform could be to recommend the re-occupancy of offices based on the required comfort temperatures and the utilisation of certain heating circuits. If, for example, offices connected to a heating circuit are only very underutilised for certain days, it may make sense to lower these heating circuits and motivate employees to move to free office space in other heating circuits. Due to the very high home office rate in some cases, this will also be increasingly the case in the future and open opportunities for lowering heating levels in parts of the building. In [
33], a reinforcement-learning-based system was tested that provides employees with recommendations for action to reduce energy consumption. Among other things, a move recommendation was tested in the field test, which recommends that employees move to another office to reduce overall energy consumption. This could also be implemented in the ComfortLab platform to divide heating circuits into different temperature levels.
These four possible further developments of the platform are to be pursued and tested in future projects in the Living Lab approach, thus further strengthening the application of the platform.


 ,
, 


