
Determination, Evaluation, and Validation of Representative Low-Voltage Distribution Grid Clusters


Abstract
1. Introduction
1.1. Research Context
- Which technical and/or geographic–topological parameters are suitable for characterizing LV grids?
- What are the literature’s different approaches defining grid representatives?
- Can the literature’s grid clusters be merged, and how are they distinguished from each other?
- How applicable are merged clusters when considering a distribution system operator’s real LV grid topologies?
1.2. Contributions of This Paper
1.3. Literature Review
1.3.1. Clustering Methods
1.3.2. Clustering Parameters
- Transformer rating: the power level in kilovolt-amperes of the transformer connecting the LV and the medium voltage (MV) grid.
- Line parameters: topological parameters as the number of feeders connected to the transformer, maximum line length, average impedance, number of GCP per line, and average line length (all of these parameters are related to the structure of the grid).
- Number of GCPs: the number of GCPs connected to the transformer within the grid area.
- Number of apartments per GCP: the average number of apartments per GCP or the number of respective electric meters per GCP.
- Distance to a neighbor: the average distance between neighboring GCPs, the distance to the next four neighboring buildings, the distance to the fourth nearest neighboring building, or the number of GCPs per kilometer of grid lines.
- Population density: the density of the population per square km in the LV grid area.
- Other: other parameters, for example, the load boundary of the transformer, region of supply or the municipality, types of buildings, PV potential, degree of underground cables, total consumer resistance, maximum resistance, and cable material.
1.3.3. Methods to Design Reference LV Grids
1.3.4. Key Results in the Literature
- Clustering methods: Different techniques can be applied, depending on the data basis and the objective of the clustering. The most common methods are hierarchical classification, optical classification, and k-means algorithms.
- Clustering parameters: The parameters used to describe LV grids vary a lot in the literature. The clustering process can focus on different parameters, whereby the choice significantly influences the resulting topologies.
- Methods to design reference grids: three different methods are applied to determine reference grids, whereby the choice of method primarily depends on the data basis.
2. Methods to Cluster and Analyze LV Grids
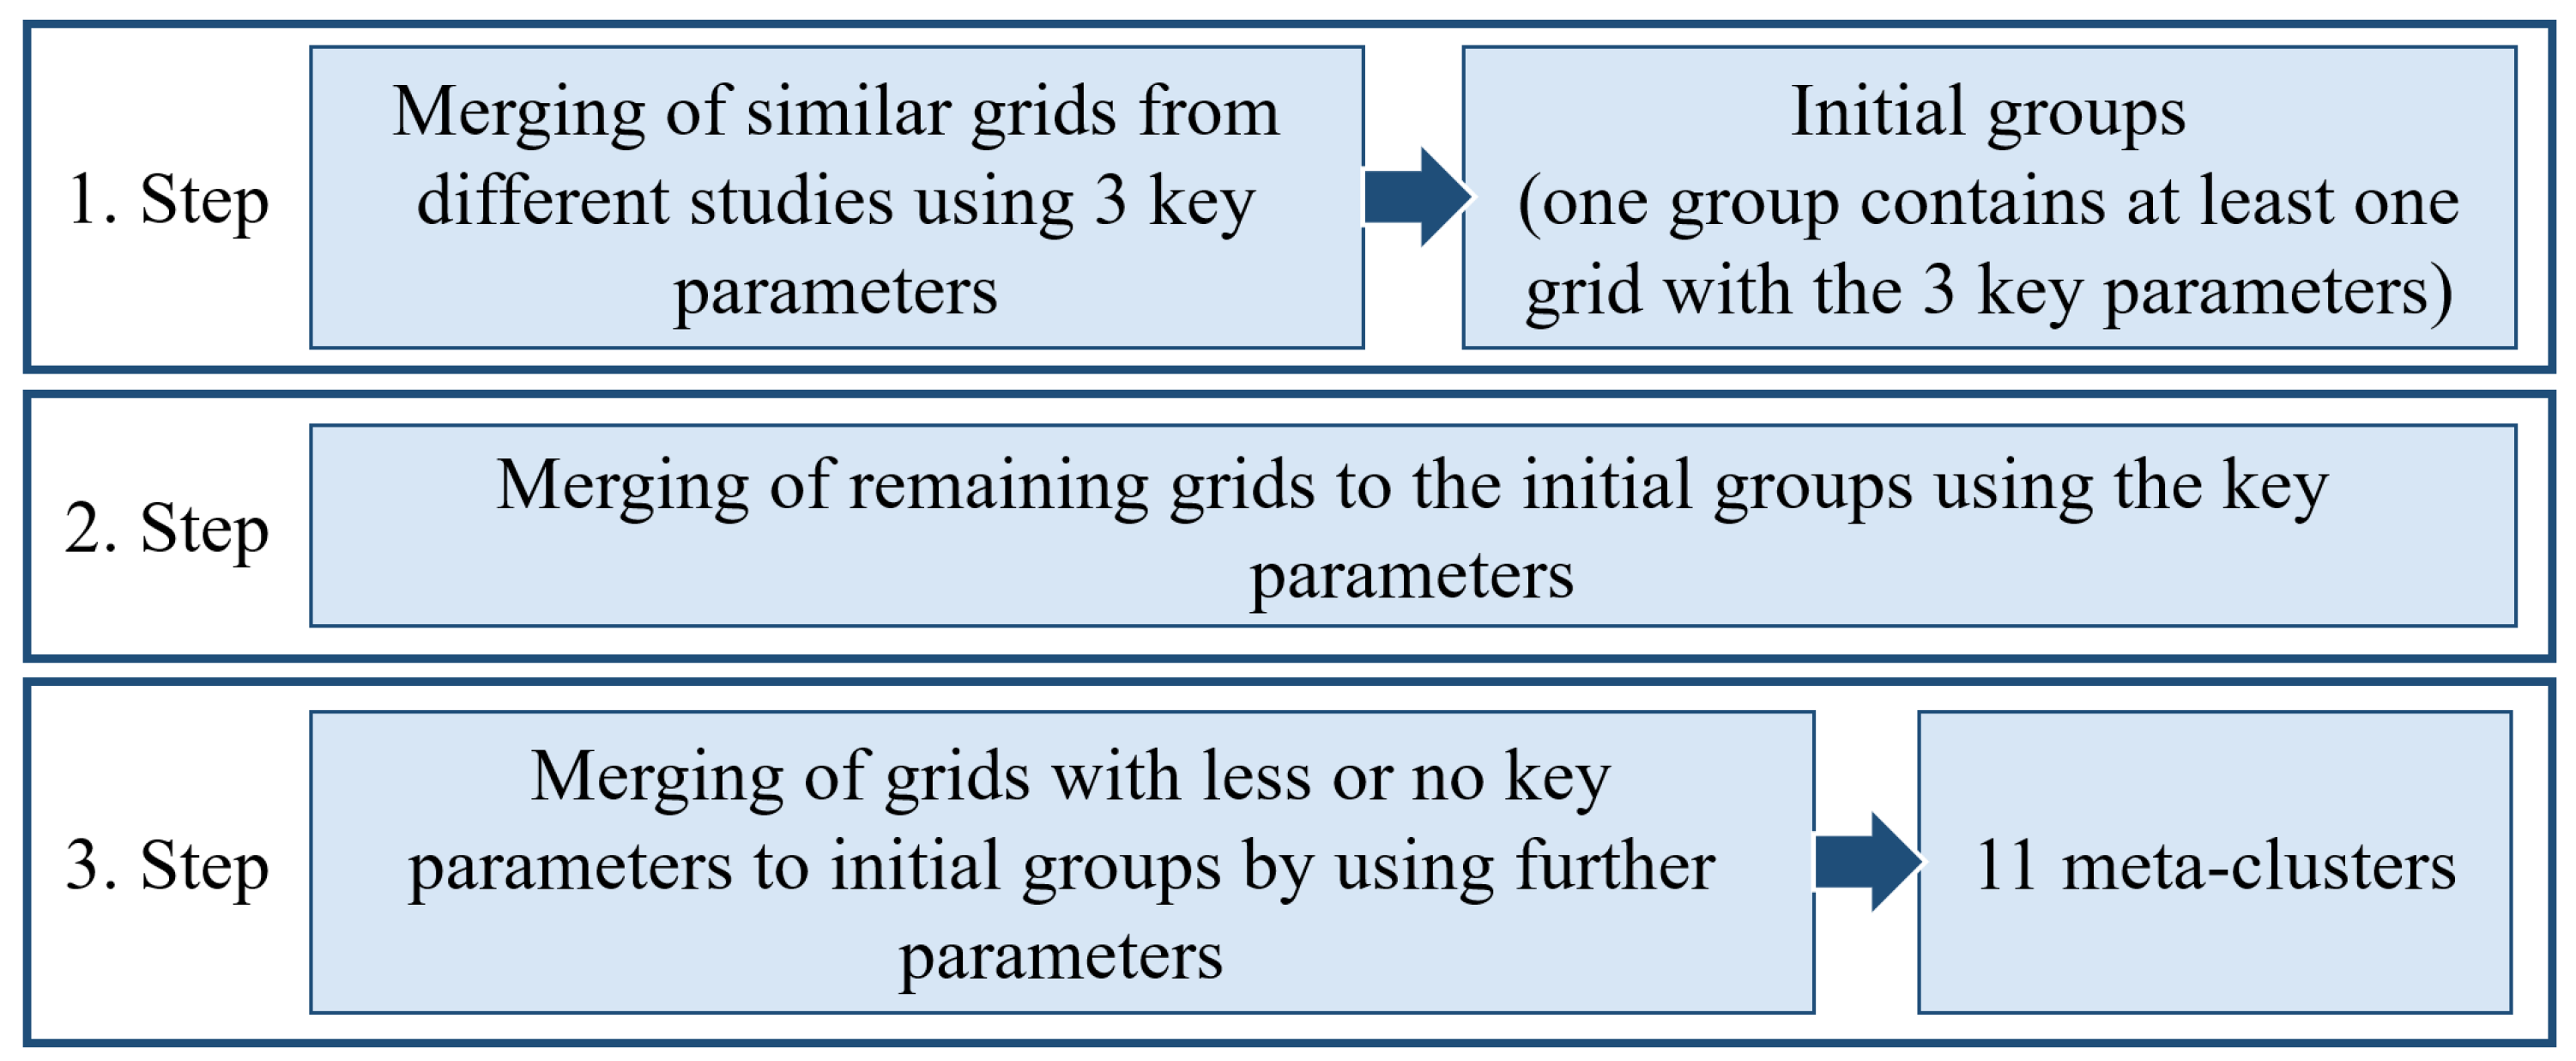
2.1. Identification of Meta-Clusters
- Transformer rating per GCP: the transformer rating in kVA divided by the number of GCPs connected to the line under this transformer.
- Average distance to a neighbor: the distance in meters from one GCP to the next one.
- Average amount of residential/commercial units per GCP: the number of residential or commercial units connected to one GCP.
- Clusters should not overlap in more than one key parameter.
- No gaps were permitted between key parameter ranges of neighboring clusters.
- Most clusters from the literature should fit into one cluster.
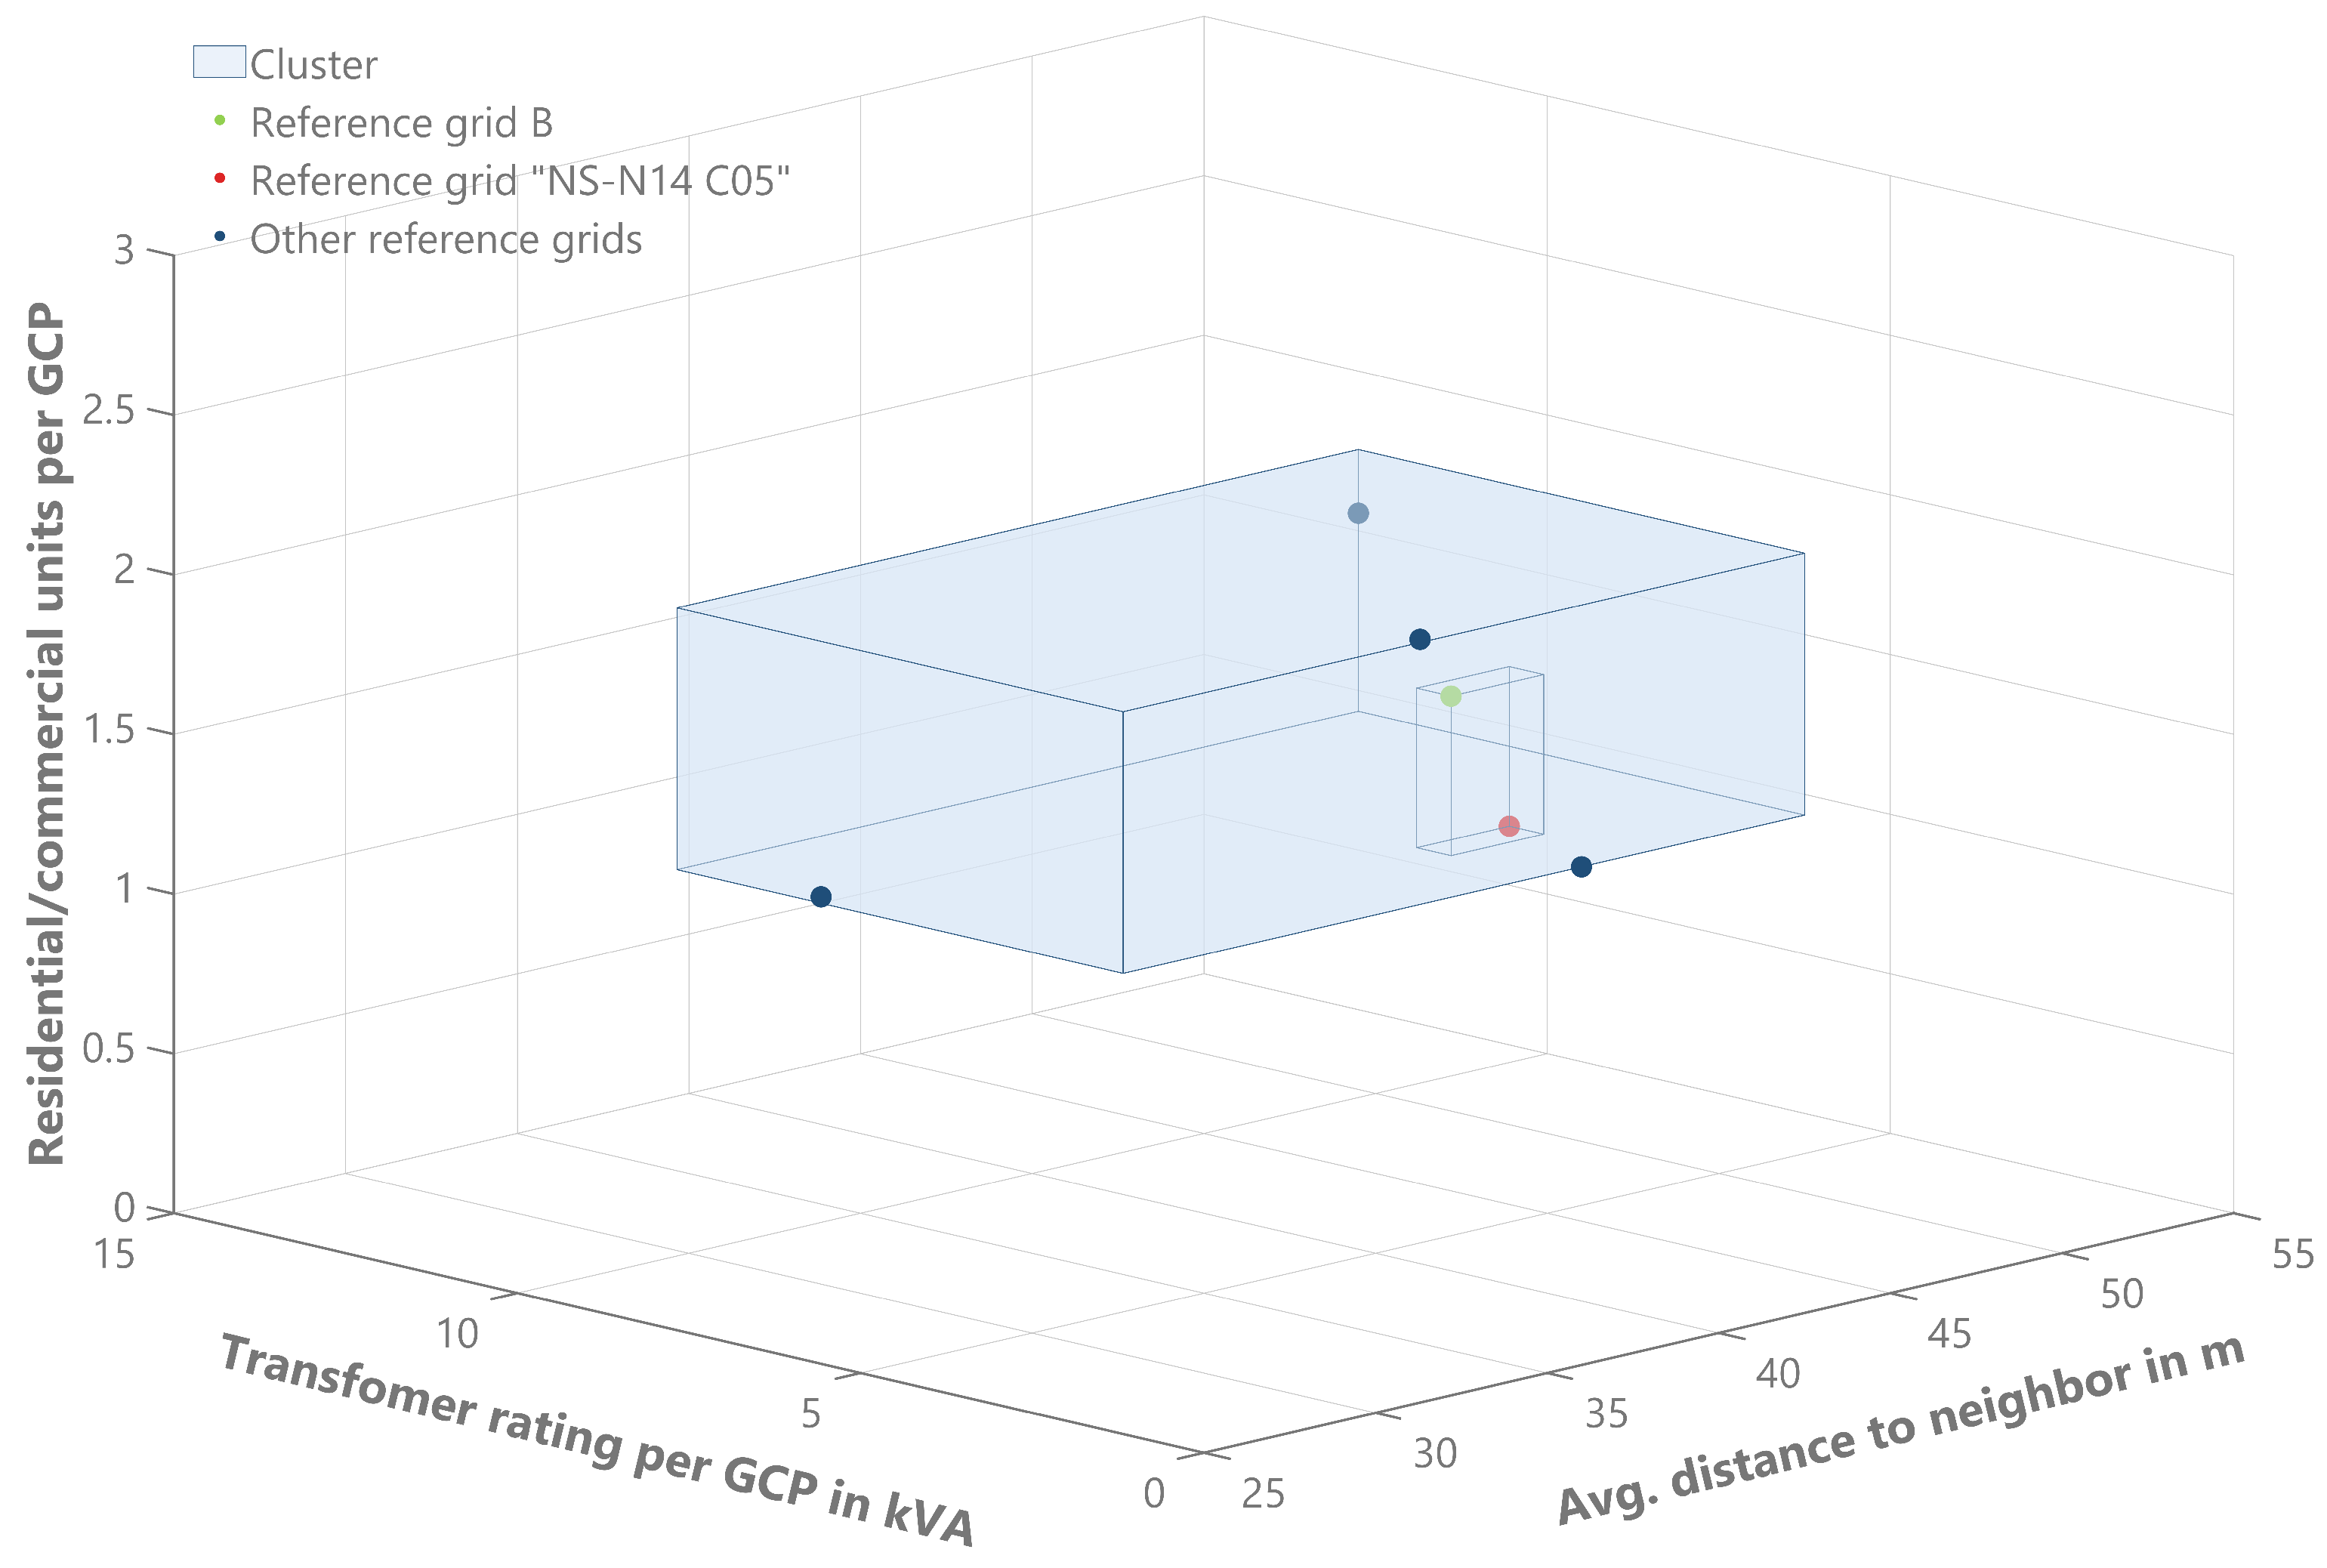
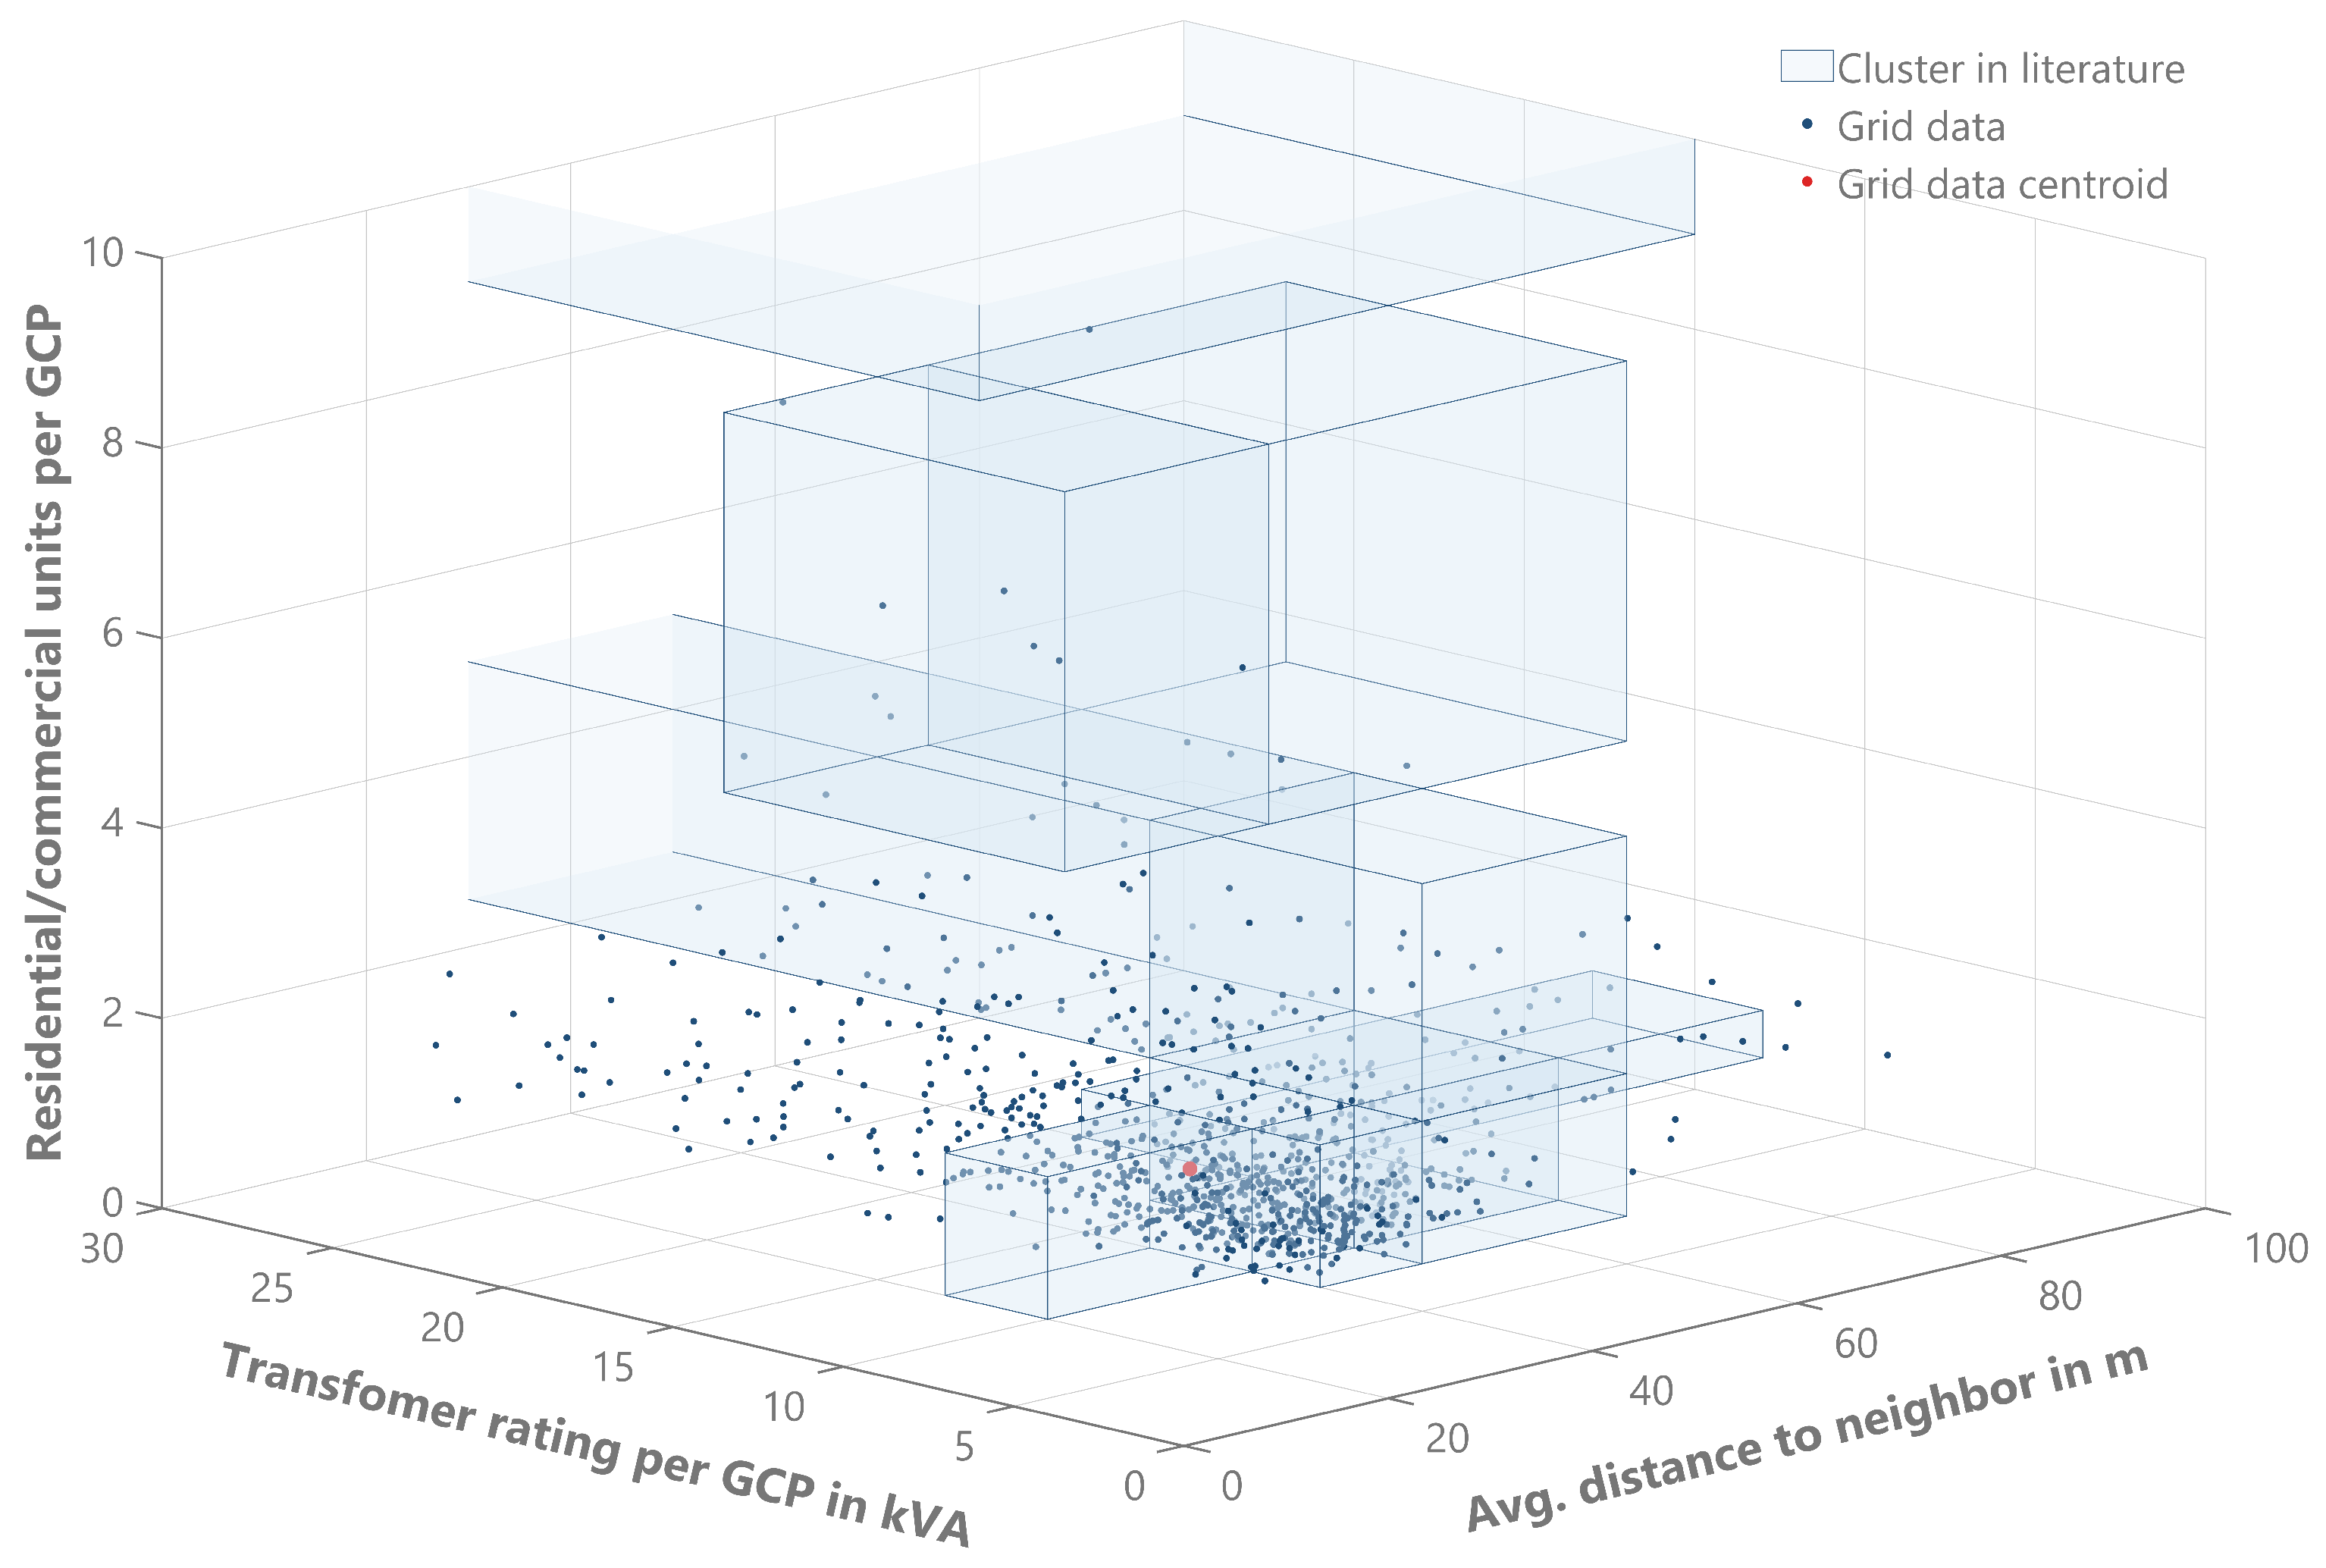
2.2. Fitting of Real LV Grids in the Defined Meta-Clusters
2.3. Analysis of the Assigned Grids’ Characteristics
3. Results of the Clustering and Grid Analysis Process
3.1. Results of the Meta-Cluster Development
3.2. Results of the Fitting of Real LV Grids into Meta-Clusters
3.3. Characteristics of the Grids Assigned to the Meta-Clusters
4. Conclusions and Critical Review
4.1. Conclusions
4.2. Critical Review
4.3. Outlook
Author Contributions
Funding
Data Availability Statement
Conflicts of Interest
Abbreviations
| DSO | distribution system operator |
| EV | electric vehicle |
| GCP | grid connection point |
| HP | heat pump |
| LV | low-voltage |
| MDPI | Multidisciplinary Digital Publishing Institute |
| MV | medium voltage |
| PV | photovoltaic system |
Appendix A. Unification of Cluster-Based Grids
- Merging of grids with all three key parameters.
- The merging of grids with fewer than three key parameters.
- Splitting clusters with wide ranges in comparison to other clusters.
- Adjusting the ranges of key parameters (adjustments about adjacent clusters).

| Step | Grids | Avg. Trans- Former Rating per GCP in kVA | Avg. Range to Neighbor per GCP in m | Residential/ com. Units per GCP |
|---|---|---|---|---|
| 1. | [4] C05 N11 [4] C10 N13 [4] C05 N14 [4] C05 N15 [4] C05 N17 [26] Cluster B | 2.8–9.3 | 28.3–48.1 | 1.3–2.1 |
| 2. | [9] “Dorf” [22] Grid 4 [22] Grid 5 [22] Grid 6 [23] C04 [23] C06 [25] “Weiler” [25] “Dorf” | 2.8–10.5 | 28.3–49 | 1–2.1 |
| 3. | [4] C10 N13 [4] C05 N14 [4] C05 N15 [9] “Dorf“ [22] Grid 4 [22] Grid 5 [22] Grid 6 [23] C04 [25] “Weiler” [25] “Dorf” | 4.4–10.5 | 28.3–48.1 | 1–1.9 |
| [4] C05 N11 [4] C05 N17 [23] C06 [26] Cluster B | 2.8–3.9 | 37.1–49 | 1.3–2.1 | |
| 4. | Cluster 1 | 4–10 | 30–50 | 1–2.5 |
| Cluster 2 | 2–4 | 30–50 | 1–2.5 |
| Step | Grids | Avg. Trans- Former Rating per GCP in kVA | Avg. Range to Neighbor per GCP in m | Residential/ com. Units per GCP |
|---|---|---|---|---|
| 1. | [4] C06 N06 [4] C10 N10 [4] C06 N20 [26] Cluster C | 2.6–3.3 | 15–26.7 | 0.7–2.6 |
| 2. | [13] Cluster L01 [13] Cluster L02 | 2.5–3.4 | 14.8–26.7 | 0.7–2.6 |
| 3. | — | — | — | — |
| 4. | Cluster 3 | 2–4 | 20–30 | 1–2.5 |
| Step | Grids | Avg. Trans- Former Rating per GCP in kVA | Avg. Range to Neighbor per GCP in m | Residential/ com. Units per GCP |
|---|---|---|---|---|
| 1. | [4] C08 N08 [26] Cluster D | 4.1–6.4 | 15–20 | 1.4–2.3 |
| 2. | [9] “Vorstadt” [13] Cluster H [13] Cluster S [26] Cluster E | 4.1–6.4 | 9.7–20 | 1.2–2.3 |
| 3. | — | — | — | — |
| 4. | Cluster 5 | 4–7 | <20 | 1–2.5 |
| Step | Grids | Avg. Trans- Former Rating per GCP in kVA | Avg. Range to Neighbor per GCP in m | Residential/ com. Units per GCP |
|---|---|---|---|---|
| 1. | [4] C05 N05 [4] C05 N16 [4] C05 N18 [4] C05 N19 | 3.5–43.2 | 34.1–46.8 | 2.5–4.2 |
| 2. | [22] Grid 1 | 3.5–43.2 | 34.1–46.8 | 2.5–4.2 |
| 3. | [4] C05 N05 [4] C05 N16 [4] C05 N19 | 11.4–43.2 | 34.1–46.8 | 2.5–3.8 |
| [4] C05 N18 | 3.5 | 34.1 | 4.2 | |
| 4. | Cluster 7 | 2–10 | 30–50 | 2.5–5 |
| Cluster 8 | >10 | 30–50 | 2.5–5 |
| Step | Grids | Avg. Trans- Former Rating per GCP in kVA | Avg. Range to Neighbor per GCP in m | Residential/ com. Units per GCP |
|---|---|---|---|---|
| 1. | [4] C01 N01 [4] C04 N04 | 10–15.8 | 30.8–51.1 | 6.1–8.8 |
| 2. | [26] Cluster F [25] “Kleinst.” | 10–15.8 | 25–51.1 | 6.1–8.8 |
| 3. | [4] C04 N04 | 10 | 51 | 6.1 |
| [4] C01 N01 [26] Cluster F [25] “Kleinst.” | 15–15.8 | 25–30.8 | 8.5–8.8 | |
| 4. | Cluster 6 | 8–18 | 35–70 | 5–9 |
| Cluster 9 | 8–18 | 15–35 | 5–9 |
| Step | Grids | Avg. Trans- Former Rating per GCP in kVA | Avg. Range to Neighbor per GCP in m | Residential/ com. Units per GCP |
|---|---|---|---|---|
| 1. | [4] C07 N07 [4] C09 N09 [4] C07 N12 [26] Cluster H | 13.8–27.3 | 30–97.3 | 9.2–16.8 |
| 2. | — | — | — | — |
| 3. | — | — | — | — |
| 4. | Cluster 10 | 15–35 | 30–100 | 9–26 |
| Step | Grids | Avg. Trans- Former Rating per GCP in kVA | Avg. Range to Neighbor per GCP in m | Residential/ com. Units per GCP |
|---|---|---|---|---|
| 1. | [4] C02 N02 | 40 | 104.2 | 38.2 |
| 2. | [26] Cluster H | 40–67 | 104.2 | 38.2–41 |
| 3. | — | — | — | — |
| 4. | Cluster 11 | >35 | >50 | 26–50 |
| Step | Grids | Avg. Trans- Former Rating per GCP in kVA | Avg. Range to Neighbor per GCP in m | Residential/ com. Units per GCP |
|---|---|---|---|---|
| 1. | — | — | — | — |
| 2. | [9] “Land” [13] Cluster L03 [22] Grid 8 [26] Cluster A [25] “Streusied.” | 10–12.5 | 43.1–87 | 1.3–1.5 |
| 3. | — | — | — | — |
| 4. | Cluster 12 | 10–15 | 40–90 | 1–1.5 |
Appendix B. Comparison of Representative to Represented Grids
| ID | Grids | Centr. Type | Avg. Trans- Former Rating per GCP in kVA | Avg. Range to Neighbor per GCP in m | Residential/ com. Units per GCP |
|---|---|---|---|---|---|
| 1 | 43 | Cuboid Data | 3.00 3.28 | 40.00 33.78 | 1.75 1.59 |
| 2 | 157 | Cuboid Data | 7.00 6.67 | 40.00 36.39 | 1.75 1.52 |
| 3 | 100 | Cuboid Data | 3.00 3.20 | 25.00 24.44 | 1.75 1.47 |
| 4 | 208 | Cuboid Data | 7.00 6.45 | 25.00 24.82 | 1.75 1.52 |
| 5 | 51 | Cuboid Data | 5.50 5.27 | 10.00 17.84 | 1.75 1.59 |
| 6 | 4 | Cuboid Data | 13.00 11.07 | 52.50 37.45 | 7.00 5.69 |
| 7 | 20 | Cuboid Data | 6.00 7.18 | 40.00 35.11 | 3.75 3.10 |
| 8 | 23 | Cuboid Data | 40.00 37.37 | — 38.92 | 3.75 3.68 |
| 9 | 3 | Cuboid Data | 13.00 14.32 | 25.00 27.16 | 7.00 6.88 |
| 10 | 3 | Cuboid Data | 25.00 24.88 | 65.00 39.03 | 17.50 11.51 |
| 11 | 0 | Cuboid Data | — — | — — | 38.00 — |
| 12 | 22 | Cuboid Data | 12.50 12.97 | 65.00 56.64 | 1.25 1.19 |
| 13 | 82 | Cuboid Data | 17.50 15.82 | 40.00 38.47 | 1.75 1.48 |
| 14 | 58 | Cuboid Data | 17.50 15.41 | 25.00 25.32 | 1.75 1.50 |
| 15 | 22 | Cuboid Data | 17.50 16.13 | 10.00 16.92 | 1.75 1.48 |
| 16 | 220 | Cuboid Data | — 103.70 | — 73.17 | 2.50 1.56 |
| 17 | 48 | Cuboid Data | 20.00 20.30 | — 92.23 | 2.50 1.34 |
| 18 | 9 | Cuboid Data | 7.50 11.88 | — 109.93 | 2.50 1.35 |
Appendix C. Statistical Evaluation of Key Grid Parameters


References
- Federal Government of Germany: German Law for the Expansion of Renewable Energies (German Renewable Energy Sources Act—EEG 2023). Available online: https://leap.unep.org/en/countries/de/national-legislation/renewable-energy-sources-act-eeg-2023 (accessed on 22 August 2024).
- Federal Network Agency of Germany (BNetzA): EEG in Zahlen. Available online: https://www.bundesnetzagentur.de/DE/Fachthemen/ElektrizitaetundGas/ErneuerbareEnergien/EE-Statistik/start.html (accessed on 22 August 2024).
- Müller, M. Future grid load with bidirectional electric vehicles at home. In Proceedings of the International ETG Congress, Online, Kassel, Germany, 10 June 2021. [Google Scholar]
- Wintzek, P.; Ali, S.; Monscheidt, J.; Gemsjäger, B.; Slupinski, A.; Zdrallek, M. Planungs- und Betriebsgrundsätze für städtische Verteilnetze—Leitfaden zur Ausrichtung der Netze an ihren zukünftigen Anforderungen. In Neue Energie aus Wuppertal, Band 35; Zdrallek, M., Ed.; University of Wuppertal: Wuppertal, Germany, 2021. [Google Scholar]
- Weiß, A. Simulation and analysis of future electric mobility load effects in urban distribution grids. In Proceedings of the International ETG Congress, Online, Kassel, Germany, 10 June 2021. [Google Scholar]
- Greif, S.; Freiberger, L.; Corradini, R.; Trentmann, L.; Schenk, W. Wärmepumpen in Bestandsgebäuden—Möglichkeiten und Herausforderungen im Eigenheim. In Wärmepumpen in Bestandsgebäuden—Möglichkeiten und Herausforderungen im Eigenheim; Wüstenrot Stiftung: Munich, Germany, 2022; ISBN 978-3-96075-027-7. [Google Scholar]
- Federal Network Agency of Germany (BNetzA): Monitoringbericht 2023—Marktbeobachtung. Available online: https://data.bundesnetzagentur.de/Bundesnetzagentur/SharedDocs/Mediathek/Monitoringberichte/MonitoringberichtEnergie2023.pdf (accessed on 12 August 2024).
- VDE-AR-N 4100; Technische Regeln für den Anschluss von Kundenanlagen an das Niederspannungsnetz und deren Betreib (TAR Niederspannung). Ausgefertigt am 2017-04, Version vom 2017-06. VDE Verband der Elektrotechnik Elektronik Informationstechnik e. V.: Berlin, Germany, 2017.
- Kerber, G. Aufnahmefähigkeit von Niederspannungsverteilnetzen für die Einspeisung aus Photovoltaikkleinanlagen. Doctoral Thesis, Technical University of Munich, Munich, Germany, 2011. [Google Scholar]
- Schneider, K.P.; Chen, Y.; Engle, D.; Chassin, D. A Taxonomy of North American radial distribution feeders. In Proceedings of the 2009 IEEE Power & Energy Society General Meeting, Calgary, AB, Canada, 26–30 July 2009. [Google Scholar] [CrossRef]
- Pilo, F.; Pisano, G.; Scalari, S.; Dal Canto, D.; Testa, A.; Langella, R.; Caldon, R.; Turri, R. ATLANTIDE—Digital archive of the Italian electric distribution reference networks. In Proceedings of the CIRED 2012 Workshop: Integration of Renewables into the Distribution Grid, Lisbon, Portugal, 29–30 May 2012. [Google Scholar] [CrossRef]
- Bracale, A.; Caldon, R.; Celli, G.; Coppo, M.; Dal Canto, D.; Langella, R.; Petretto, G.; Pilo, F.; Pisano, G.; Proto, D.; et al. Analysis of the Italian distribution system evolution through reference networks. In Proceedings of the 2012 3rd IEEE PES Innovative Smart Grid Technologies Europe (ISGT Europe), Berlin, Germany, 14–17 October 2012. [Google Scholar] [CrossRef]
- Meinecke, S.; Drauz, S.; Bornhorst, N.; Spalthoff, C.; Lauven, L.-P.; Cronbach, D.; Menke, J.-H.; Kneiske, T.; Braun, M.; Klettke, A.; et al. SimBench—Elektrische Benchmarkmodelle; Universität Kassel: Kassel, Germany; Fraunhofer IEE: Kassel, Germany; RWTH Aachen University: Aachen, Germany; Technical University of Dortmund: Dortmund, Germany, 2019. [Google Scholar]
- Weisenstein, M.; Wellßow, W.; Ma, H.; Reis, L. Synthetic LV-Grid Models for Scientific Investigations. Available online: https://nbn-resolving.de/urn:nbn:de:hbz:386-kluedo-67555 (accessed on 1 February 2023).
- Meinecke, S.; Sarajlić, D.; Drauz, S.R.; Klettke, A.; Lauven, L.-P.; Rehtanz, C.; Moser, A.; Braun, M. SimBench—A Benchmark Dataset of Electric Power Systems to Compare Innovative Solutions Based on Power Flow Analysis. Energies 2020, 13, 3290. [Google Scholar] [CrossRef]
- Schneider, K.P.; Mather, B.A.; Pal, B.C.; Ten, C.-W.; Shirek, G.J.; Zhu, H.; Fuller, J.C.; Pereira, J.L.R.; Ochoa, L.F.; de Araujo, L.R.; et al. Analytic Considerations and Design Basis for the IEEE Distribution Test Feeders. IEEE Trans. Power Syst. 2008, 33, 3181–3188. [Google Scholar] [CrossRef]
- Kersting, W.H. Radial distribution test feeders. IEEE Trans. Power Syst. 1991, 6, 975–985. [Google Scholar] [CrossRef]
- Kersting, W.H. Radial distribution test feeders. In Proceedings of the 2001 IEEE Power Engineering Society Winter Meeting, Columbus, OH, USA, 28 January–1 February 2001. [Google Scholar] [CrossRef]
- Strunz, K. Benchmark Systems for Network Integration of Renewable and Distributed Energy Resources; International Council on Large Electric Systems: Paris, France, 2014. [Google Scholar]
- Koirala, A.; Suárez-Ramón, L.; Mohamed, B.; Arboleya, P. Non-synthetic European low voltage test system. Int. J. Electr. Power Energy Syst. 2020, 118, 3181–3188. [Google Scholar] [CrossRef]
- Mateo, C.; Prettico, G.; Gómez, T.; Cossent, R.; Gangale, F.; Frías, P.; Fulli, G. European representative electricity distribution networks. Int. J. Electr. Power Energy Syst. 2018, 99, 273–280. [Google Scholar] [CrossRef]
- Schmid, T.; Müller, M.; Kleinertz, B.; Böing, F.; Hinterstocker, M.; Bruckmeier, A.; Köppl, S.; Konetschny, C.; Zeiselmair, A.; Samweber, F. Projekt MONA 2030: Grundlage für die Bewertung von Netzoptimierenden Maßnahmen—Teilbericht Basisdaten; Forschungsstelle für Energiewirtschaft e.V. (FfE): Munich, Germany, 2017. [Google Scholar]
- Eisenreich, M. Einbindung dezentraler Erzeuger am Beispiel von Photovoltaikanlagen ins elektrische Verteilungsnetz und die Auswirkungen auf die Netzstruktur. Doctoral Thesis, Technische Universität Darmstadt, Darmstadt, Germany, 2018. [Google Scholar]
- Bacher, J.; Pöge, A.; Wenzig, K. Clusteranalyse: Anwendungsorientierte Einführung in Klassifikationsverfahren; De Gruyter: Berlin, Germany, 2011; ISBN 9783486710236. [Google Scholar]
- Gust, G. Analyse von Niederspannungsnetzen und Entwicklung von Referenznetzen. Master’s Thesis, Karlsruhe Institut of Technology, Karlsruhe, Germany, 2014. [Google Scholar]
- Scheffler, J. Bestimmung der Maximal Zulässigen Netzanschlussleistung Photovoltaischer Energiewandlungsanlagen in Wohnsiedlungsgebieten. Ph.D. Thesis, University of Technology Chemnitz, Chemnitz, Germany, 2002. [Google Scholar]
- Postigo Marcos, F.; Mateo Domingo, C.; Gómez San Román, T.; Palmintier, B.; Hodge, B.-M.; Krishnan, V.; De Cuadra García, F.; Mather, B. A Review of Power Distribution Test Feeders in the United States and the Need for Synthetic Representative Networks. Energies 2017, 10, 1896. [Google Scholar] [CrossRef]
- Blume, Y.; Ostermann, A.; Reinhard, J.; Müller, M. Anforderungen an aktuelle Verteilnetze und deren zukünftige Versorgungsaufgabe. In Proceedings of the IEWT—12. Internationale Energiewirtschaftstagung, Vienna, Austria, 8–10 September 2021. [Google Scholar]
- Weiss, A.; Biedenbach, F.; Mueller, M. Analyse methodischer Modellierungsansätze im Kontext von Verteilnetzsimulationen. In Proceedings of the IEWT—12. Internationale Energiewirtschaftstagung, Vienna, Austria, 8–10 September 2021. [Google Scholar]


| Name of Method | Reference in Literature | Number of Analyzed Grids | Number of Clusters | Number of Reference Grids |
|---|---|---|---|---|
| k-means | [4] | 7370 | 10 | 20 |
| [13] | 0 | 6 | 6 | |
| Optical classification | [9] | 86 | 3 | 7 |
| [25] | 203 | 5 | 20 | |
| Hierarchical clustering | [22] | 271 | 20 | 9 |
| [23] | 331 | 6 | 12 | |
| Literature | [26] | 0 | 9 | 5 |
| Parameter/Category | Literature |
|---|---|
| Transformer rating | [9,23,25,26] |
| Line parameters | [22,23,26] |
| Number of GCP | [22,25] |
| Number of appartments per GCP | [4,26] |
| Distance to neighbor | [4,9,25,26] |
| Population density | [13,25,26] |
| Other | [9,13,23,25,26] |
| ID | Cluster Name | Transformer Rating per GCP in kVA | Avg. Distance to Neighbor in m | Residential/ com. Units per GCP |
|---|---|---|---|---|
| 1 | Low-density residential area A | 2–4 | 30–50 | 1–2.5 |
| 2 | Low-density residential area B | 4–10 | 30–50 | 1–2.5 |
| 3 | Medium-density residential area A | 2–4 | 20–30 | 1–2.5 |
| 4 | Medium-density residential area B | 4–10 | 20–30 | 1–2.5 |
| 5 | High-density residential area | 4–7 | <20 | 1–2.5 |
| 6 | Low-density multi-family residential area | 8–18 | 35–70 | 5–9 |
| 7 | Multifamily residential area A | 2–10 | 30–50 | 2.5–5 |
| 8 | Multifamily residential area B | >10 | 30–50 | 2.5–5 |
| 9 | High-density multi-family residential area | 8–18 | 15–35 | 5–9 |
| 10 | Urban multifamily residential area | 15–35 | 30–100 | 9–26 |
| 11 | High-rise area | >35 | >50 | 26–50 |
| 12 | Scattered settlement mixed-use area | 10–15 | 40–90 | 1–1.5 |
| 13 | Low-density mixed-use area | 10–25 | 30–50 | 1–2.5 |
| 14 | Medium-density mixed-use area | 10–25 | 20–30 | 1–2.5 |
| 15 | High-density mixed-use area | 10–25 | <20 | 1–2.5 |
| 16 | Commercial area A | >25 | >0 | 0–5 |
| 17 | Commercial area B | 15–25 | >60 | 0–5 |
| 18 | Commercial area C | 0–15 | >90 | 0–5 |
Disclaimer/Publisher’s Note: The statements, opinions and data contained in all publications are solely those of the individual author(s) and contributor(s) and not of MDPI and/or the editor(s). MDPI and/or the editor(s) disclaim responsibility for any injury to people or property resulting from any ideas, methods, instructions or products referred to in the content. |
© 2024 by the authors. Licensee MDPI, Basel, Switzerland. This article is an open access article distributed under the terms and conditions of the Creative Commons Attribution (CC BY) license (https://creativecommons.org/licenses/by/4.0/).
Share and Cite
Weiß, A.; Wendlinger, E.; Hecker, M.; Praktiknjo, A. Determination, Evaluation, and Validation of Representative Low-Voltage Distribution Grid Clusters. Energies 2024, 17, 4433. https://doi.org/10.3390/en17174433
Weiß A, Wendlinger E, Hecker M, Praktiknjo A. Determination, Evaluation, and Validation of Representative Low-Voltage Distribution Grid Clusters. Energies. 2024; 17(17):4433. https://doi.org/10.3390/en17174433
Chicago/Turabian StyleWeiß, Andreas, Elisabeth Wendlinger, Maximilian Hecker, and Aaron Praktiknjo. 2024. "Determination, Evaluation, and Validation of Representative Low-Voltage Distribution Grid Clusters" Energies 17, no. 17: 4433. https://doi.org/10.3390/en17174433
APA StyleWeiß, A., Wendlinger, E., Hecker, M., & Praktiknjo, A. (2024). Determination, Evaluation, and Validation of Representative Low-Voltage Distribution Grid Clusters. Energies, 17(17), 4433. https://doi.org/10.3390/en17174433