Article

Experimental Study on Temperatures of Water Walls in a 1000 MW Ultra-Supercritical Boiler under the Condition of Flexible Peak Regulation

1
College of Building Environment Engineering, Zhengzhou University of Light Industry, Zhengzhou 450000, China
2
Henan Electric Power Generation Limited Company Pingdingshan Generation Branch, State Power Investment Corporation, Pingdingshan 467000, China
3
College of Energy and Power Engineering, Zhengzhou University of Light Industry, Zhengzhou 450000, China
4
Key Laboratory of Low-Grade Energy Utilization Technologies and Systems (Chongqing University), Ministry of Education of China, Chongqing 400044, China
*
Author to whom correspondence should be addressed.
Energies 2024, 17(17), 4375; https://doi.org/10.3390/en17174375
Submission received: 23 July 2024 / Revised: 22 August 2024 / Accepted: 27 August 2024 / Published: 1 September 2024
(This article belongs to the Section J: Thermal Management)

Abstract

:
To meet the Chinese government’s energy-saving and emission-reduction policies, flexible peak regulation is necessary for traditional coal-fired boilers. Flexible peaking leads to large changes in boiler load, which affects the safety of the boiler water wall. In this paper, a 1000 MW ultra-supercritical unit was tracked for three years, and effective data were selected to study the temperature characteristics of the water wall under flexible peak regulation. The results show that the lower the load, the greater the temperature fluctuation of the water wall. The temperature distribution of the spiral water wall is more uniform. The position of the temperature valley value of the rear spiral water wall was found, and the load of more even temperature distribution was also found. The temperature change of the front vertical water wall was the most complex of all the water walls. The 643.9 MW load case showed different behavior to the temperature distribution of the water wall. The side water walls were heated evenly under the different loads. The characteristics of the temperature distribution of the side vertical water wall were found through statistical analysis. The fitting equation for the change rule of the temperature is presented. The higher the load, the better the equations. Finally, this paper gives some advice on how to avoid temperature deviation in the water wall, and the detailed research highlights the safe running of water walls.

1. Introduction

To achieve the goals of “carbon peaking by 2030 and carbon neutrality by 2060” in China, flexible peaking is a method for coal-fired power plants. Therefore, many existing coal-fired power plants will face complex operation conditions with low and medium loads.
The flexible peak regulation could bring new challenges to the safety of water walls and could even cause water wall damage and unit outages [1]. Research statistics show that the unplanned shutdown caused by overheated water wall tube explosions accounts for 57% of shutdowns [2]. To solve this problem, it is very important to study the temperature variation behavior of the water wall under the requirement of flexible peak regulation.
The heat and deformation of the water wall are studied because the thermal deformation of the membrane walls is a severe safety issue [3,4,5,6]. The temperature field around the water wall was reconstructed by Xue and Lv et al. [7,8]. Wang et al. [9] developed a method for slagging distribution prediction and anti-slagging optimization, which opened a new perspective to alleviate the slagging of water walls effectively. Wei et al. [10] studied water wall safety in an opposed firing boiler under flexible peaking conditions. Their research results highlight that the opposing arrangement and the modified arc-shaped structure are effective in reducing operation risks. Zima [11] analyzed temperature drops in the wall thickness of a supercritical boiler water wall tube, which took account of the non-uniformity of the furnace chamber thermal load along its height. Dong et al. [12] studied the distribution of water wall temperature in ultra-supercritical boilers by establishing a coupled heat transfer model. The high-temperature corrosion of water walls was investigated by different researchers [13,14,15,16]. Zhao et al. [13] found that corrosion is aggravated when the corrosion temperature is above 450 °C in the alternating atmosphere. Xiong et al. [14] investigated the high-temperature corrosion of water-cooled wall tubes in a 300 MW boiler and found that the corrosion in this power plant was the typical sulfide type. Cao et al. [15] found that the high-temperature corrosion risk of water walls could be reduced when the second air nozzle is swung upward by 15° and the CO concentration at the place close to the wall surface in the combustion zone is less than 3% with adequate oxygen. Sun et al. [16] found that sulfur is the main factor affecting the high-temperature corrosion of water walls.
Li et al. [17,18] studied the combustion characteristics, water wall temperature, energy conversion, and so on in a supercritical down-fired boiler. Fu et al. [19] investigated the temperature, heat flux, strain, and stress distribution under two different combustion conditions in an opposed wall firing furnace experimental system. Fan et al. [20,21,22] studied water wall tube cracking in an ultra-supercritical boiler caused by deep peaking. Pan et al. [23,24,25] studied thermal–hydraulic calculations, estimated the outlet vapor temperatures and metal temperatures in water wall tubes, and found good flow distribution characteristics and low mass flux deviations in a water wall system. The hydrodynamic characteristics of water walls were studied by Zhu, Lv, and Chen to avoid overheating the water wall tube [26,27,28]. Dong et al. [29] presented a coupled heat transfer model combining the combustion in the furnace and the ultra-supercritical heat transfer in the water wall tubes. Nurbanasari et al. [30] investigated the leakage from water wall tubes in a 660 MW supercritical boiler.
Although the above researchers focus on the deformation, temperature, and thermal–hydraulic characteristics of water walls through experiments or simulations, research on detailed data about the temperature distribution of the water wall from a 1000 MW ultra-supercritical boiler under the condition of flexible peak regulation is scarce. In this paper, we studied the temperature distribution of the water wall by long-term tracking in a 1000 MW ultra-supercritical boiler under the condition of flexible peak regulation. The temperature distribution rule was found through statistical analysis and fitting equations. These are the most valuable data for safe operation of water walls because these data come from a 1000 MW ultra-supercritical boiler.

2. The Specifications of a 1000 MW Ultra-Supercritical Boiler
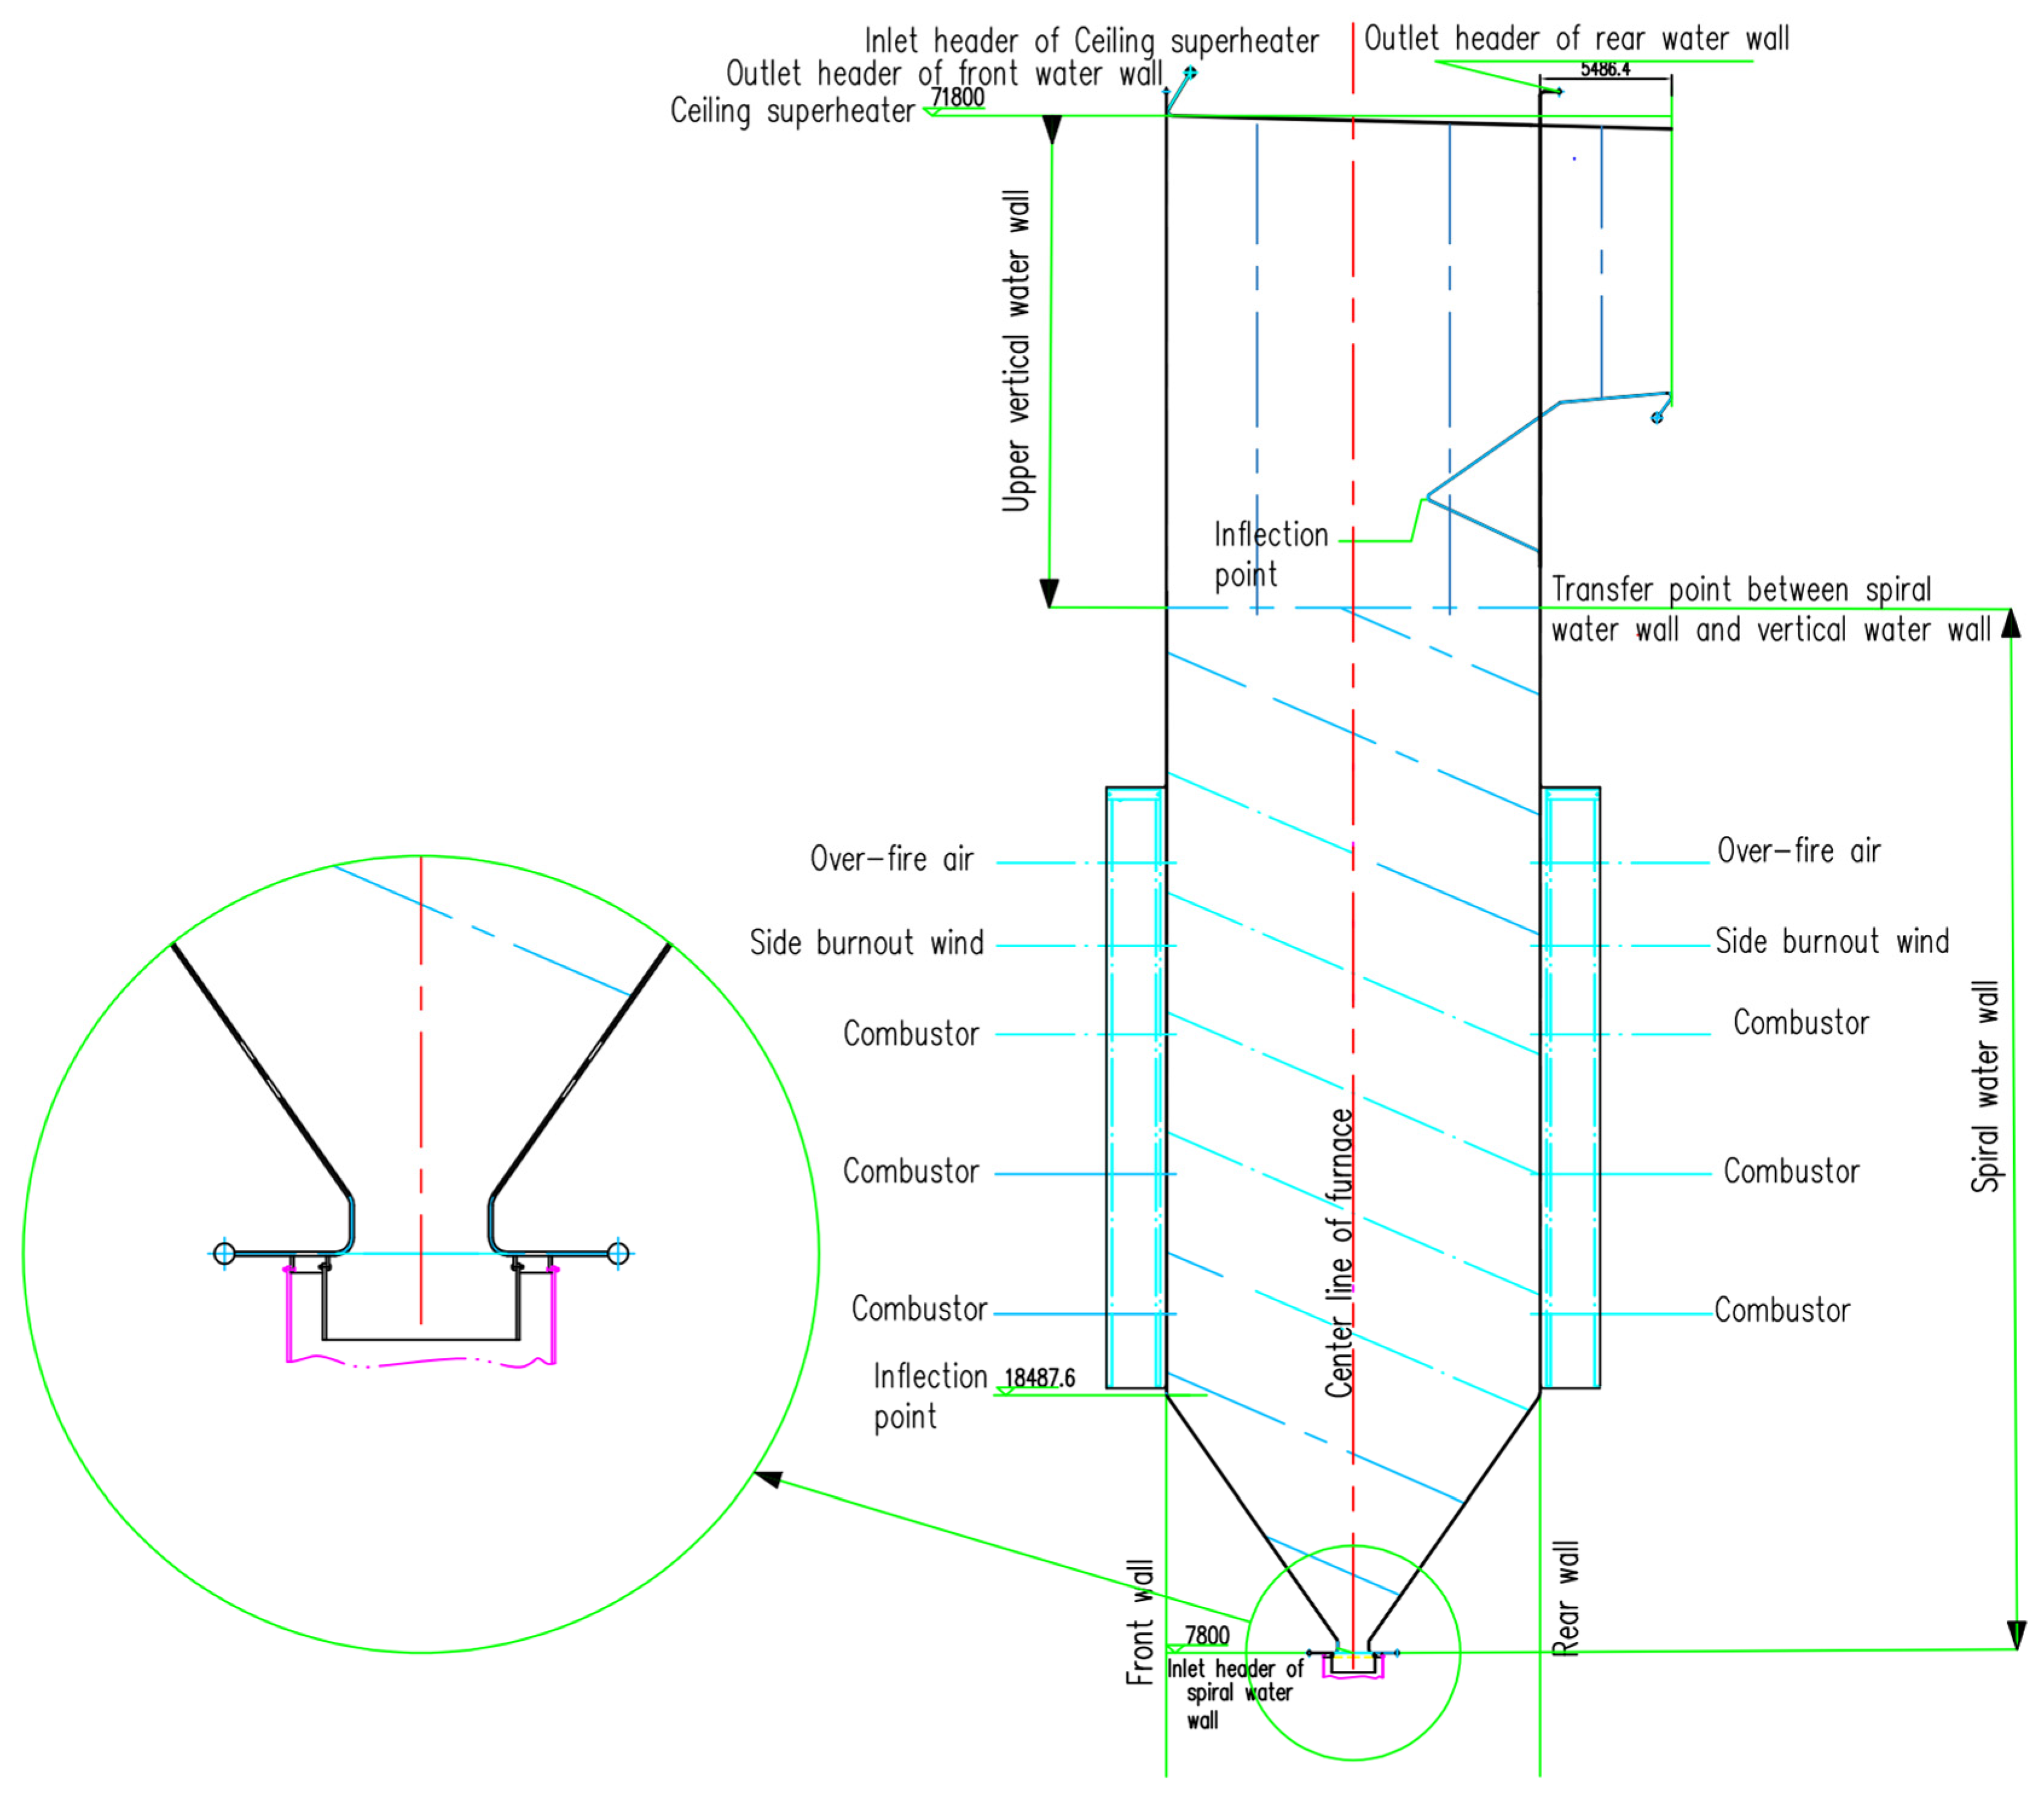
2.1. Furnace

This paper focuses on the water wall of a 1000 MW ultra-supercritical pulverized coal boiler. It is a once-through single-furnace boiler (boiler model: DG3000/26.15-ǁ1) and the furnace height is 64 m. An opposed combustion mode and once intermediate reheat technology are applied. The main design data for the boiler are shown in Table 1. Bituminous coal is the design coal, and the parameters for the coal are shown in Table 2.

2.2. The Arrangement of Water Wall

The furnace is fully encompassed by a welded membrane water wall. The furnace consists of two distinct structures, namely the lower spiral coiled ascending water wall (spiral water wall) and the upper vertical ascending water wall (vertical water wall), which are interconnected by a transition water wall and a mixed header. The layer of the water wall is shown in Figure 1. The lower section of the furnace incorporates a spiral coil design for its water wall, extending to three meters below the folding flame angle. All mid-spiral water wall pipes feature internal threading with six heads and an inclination angle of 60°.
The ratio of the number of spiral pipes to the vertical pipes on the front and side walls is 1:2. The configuration of the rear wall differs from that of the front and side walls. One out of four spiral pipes directly ascend into the vertical water wall, while the other three spiral pipes lead to the outlet header of the spiral water wall, where seven corresponding vertical water wall pipes are drawn out. This kind of transitional water wall can smoothy transfer the working fluid from the spiral water wall to the vertical water wall. The vertical water wall employs a vertically arranged tube screen with a relatively simple structure. To ensure optimal flow distribution in each circuit of the water wall, a throttling hole is incorporated into the inlet header on the side wall of the horizontal flue.
The working fluid is at the front water wall, as well as both sides’ water walls and the condensation pipe of the rear water wall. Several connecting pipes were introduced into the mixing header at the outlet of the steam separator through a tee in the front direction of the furnace. The water wall from the rear wall broken flame angle passes the horizontal flue flow into outlet header, and then a large-diameter connecting pipe is drawn from both ends of this header on either side of the boiler to form a single pipe at the top center with a tee following by connection to transition pipe at end of mixing header in the front direction.

3. Experimental Parameters and Working Conditions

To study the temperature distribution of the water wall under the conditions of flexible peak regulation, the temperature distribution of spiral water walls and vertical water walls was studied separately. Water is liquid in the lower part of the water wall tubes, while the upper part consists of a water–steam mixture. As load increases, the steam-to-water ratio rises. When the load drops below 30%, the operating state of the boiler from the direct-fired boiler transitions to a drum boiler. Concurrently, the water flow state changes from the direct-fired boiler to the drum boiler. The operation conditions of the boiler are shown in Table 3. The monitoring point arrangement is shown in Table 4.

4. Experimental Results and Discussion

The temperature of all the measurement points was collected under the flexible peaking regulation by us. The distribution rule of the temperature along the horizontal direction was analyzed. The reason for the uneven heating of the water wall was studied.

4.1. The Temperature Distribution of the Spiral Water Wall

(1) Temperature analysis of the front water wall
The distribution of temperature of the front water wall is shown in Figure 2 under the conditions of different loads.
It can be seen from Figure 2 that the temperature change of the water wall on the front wall under the 643.9 MW load condition is different from those under other load conditions, and the wall temperature peak appears in the place where the wall temperature valley value of other loads occurs (the reason is not clear). Under other loads, the wall temperature valley value appears at the 10th measuring point. When the loads are 217.7 MW, 267.9 MW, and 348.7 MW, respectively, the wall temperature fluctuation is greater. When the load is 217.7 MW and 267.9 MW, a peak value of wall temperature appears at the 6th and 7th measuring points, respectively. This indicates that the water wall in the right half of the front wall is unevenly heated, which will affect the water flow characteristics in the water wall and the heat exchange characteristics between the water wall and the furnace, and also easily lead to ash and slag aggregation and adhesion. As a result, the uneven heating will damage the heat exchange effect of the water wall and bring great harm to the unit’s operation. A 348.7 MW load leads to the greatest temperature fluctuation of the water wall among all loads for the front spiral water wall. The peak value of wall temperature occurs at the 2nd, 6th, and 8th measuring points under 348.7 MW load, respectively, and the valley value of wall temperature occurs at the 4th, 7th, and 10th. The high temperature, low temperature, mean temperature, and maximum temperature difference of the front spiral water wall are shown in Figure 3. Figure 3 shows that the maximum temperature difference at a 508.4 MW load is minimum and the maximum temperature difference at a 348.7 MW load is the highest among all loads for the front spiral water wall.
(2) Temperature analysis of rear water wall
The temperature of the rear wall under the flexible peaking conditions is summarized in Figure 4.
As shown in Figure 4, the temperature distribution of the rear spiral water wall is more uniform, which indicates that the water wall is heated evenly under this load, the water flow in the water wall is uniform, and the hydrodynamic characteristics are good. Under other loads, the outlet temperature of the spiral water wall of the rear wall has a valley value in the middle outlet of the water wall (the 6th water wall outlet), which indicates that the heat fluctuation of the water wall here is large, and the heat transfer performance is poor. It may be a place where the water wall is easily choked, and the combustion needs to be adjusted in time to avoid ash and slag sticking to the water wall pipe when the temperature of the water wall decreases. The wall temperature is distributed evenly along the rear wall for other measuring points. Under the condition of the same load, the difference between the maximum and minimum values of the wall temperature is shown in Figure 5. With the increase in load, the wall temperature of the water wall shows an upward trend, from an average temperature of 306.7 °C to 397.3 °C, among which the average wall temperature of 643.9 MW is 388.7 °C.
(3) Temperature analysis of the side water wall
The temperature distribution of the side water walls is shown in Figure 6. It shows that the temperature distribution changes under a 643.9 MW load are obviously different from that under other loads. The temperature valley value of the spiral water wall on the left wall appears at the 2nd measuring point, which is 370.7 °C. The wall temperature distribution of the left spiral water wall is more uniform. At a lower load (217.7 MW, 267.9 MW), the wall temperature valley value of the spiral water wall on the right wall is more pronounced (301.5 °C). Under other loads, the wall temperature valley value at the right spiral water wall is not obvious at the 2nd measuring point, while the load is 643.9 MW, the wall temperature at the right spiral water wall shows a small peak value at the 2nd measuring point. It is different from the wall temperature under other loads. The high temperature, mean temperature, low temperature, and maximum temperature difference of the side spiral water wall are shown in Figure 7. It can be seen that the average wall temperature increases with the increase in load, but it does not exceed the wall temperature limit of the water wall (478 °C).
Compared with the above figures, it can be seen that the temperature of the front water wall changes greatly, especially under low load conditions. Generally, the coal quality used for the front wall burners is better under flexible peaking conditions, but the coal quality used for the rear wall burners is poor. When the load is adjusted from high to low, the rear wall burner will be closed first. The flames from the rear wall were uneven, and the flame rushed to the front wall. This is the reason for the uneven temperature distribution of the front water wall.

4.2. The Temperature Distribution of Vertical Water Wall

(1) Temperature analysis of the front vertical water wall
The temperature distribution of the front vertical water wall under flexible peaking conditions is shown in Figure 8. When the load increases from 217.7 MW to 605 MW, there are four high wall temperature peaks in the horizontal distribution, corresponding to the 3rd, 5th, 7th, and 9th water wall measurement points, respectively. When the load is 267.9 MW and 348.7 MW, the wall temperature changes are the most complex, and there are nine peaks corresponding to the 3rd, 5th, 7th, 9th, 11th, 13th, 15th, 17th, and 19th vertical water wall temperature measurement points, respectively. When the load increases from 643.9 MW to 990.1 MW, the wall temperature is relatively stable. The high temperature, mean temperature, low temperature, and maximum temperature difference of the front vertical water wall are shown in Figure 9, and the average temperature of the water wall increases with the increase in load, excluding the 643.9 MW load. These indicate that the lower the load, the more uneven the heating of the water wall. It is easy to cause the internal hydrodynamic anomaly as the water wall is unevenly heated, resulting in a change in the thermal stress of the water wall which can cause a water-cooling tube explosion. The analysis shows that the frequent and wide variation of the water wall temperature here is related to the structure of the furnace. The screen superheater and high temperature superheater are arranged in the upper part of the furnace which affects the gas flow and temperature distribution in the furnace. There is a smoke-deflecting corner in the rear vertical water wall. The high-temperature flue gas flows past the front vertical water wall with the help of such a structure. It is the reason for the uneven heating of the front vertical water wall.
(2) Temperature analysis of the slag tube
The temperature distribution of the slag tube is shown in Figure 10. It can be seen from Figure 10 that the temperature of the slag tube is relatively stable when the load is 643.9 MW. The slag tubes are evenly heated by the high-temperature flue gas under the 643.9 MW condition. Under other loads, the wall temperature at the second measurement point from the left side of the boiler has a peak value and the temperature change rule of the slag tube is consistent.
The high temperature, mean temperature, low temperature, and maximum temperature difference are shown in Figure 11. It can be seen from Figure 11 that the maximum temperature difference is minimum when the load is 643.9 MW, so it is the most suitable load for the slag tube.
(3) Temperature analysis of the side vertical water walls
The temperature distribution of side wall vertical water wall is shown in Figure 12.
It can be seen from Figure 12 that the temperature distribution of the side vertical water wall under different loads varies more than that of the spiral water wall. There is an abnormality in the temperature distribution curve at the 11th measurement point under 267.9 MW and 643.9 MW. The reason was unknown until now. The temperature distributions of the left vertical water wall for 267.9 MW, 348.7 MW, and 448.1 MW are more complex than that of other loads. Under 217.7 MW, 348.7 MW, and 448.1 MW load conditions, the temperatures of the left vertical water wall have high peak values at the 6th measuring point, which are 339 °C, 399.8 °C, and 378 °C, respectively. This indicates that the heating is not uniform at the 6th measurement point of the left vertical water wall which will affect the hydrodynamic characteristics of the water wall. This provides a reference for the adjustment directions of the water–coal ratio and air–powder ratio in the furnace. Compared with other loads, the temperature of the 6th measurement point on the left vertical water wall has more complex variations under a 348.7 MW load. It indicates that the heat fluctuation of the water wall here is large under this load, and the combustion adjustment is also required. When the load is 217.7 MW, 267.9 MW, 348.7 MW, 448.1 MW, and 508.4 MW, respectively, the temperature curve of the right vertical water wall also has a peak value at the 10th measurement point. When the load is 898.7 MW, the right vertical water wall has a temperature valley value at the 10th measurement point. The high temperature, mean temperature, low temperature, and maximum temperature difference of the side vertical water wall are shown in Figure 13.
Although the temperature distributions of the side vertical water wall are not the same under different loads, we found the change rule of the temperature curve as the following equation. The fitting curves are shown in Figure 12. The coefficients and R-square for every fitting curve are shown in Table 5. Table 5 shows that the higher the load, the better the equation for the temperature distributions of the right vertical water wall. Table 5 also shows that the fitting equation is better at excluding the two temperature curves with abnormal temperature at the 11th measurement point under 267.9 MW and 643.9 MW.
y = A + Bx + Cx2
y is the temperature of the side vertical water wall.
A, B, and C are the coefficients of the equation, respectively.
x is the measurement point located on the different places of the side vertical water wall.

4.3. The Comparisons of the Temperatures of the Front, Rear, and Side Water Wall

The comparisons of the mean temperatures and maximum temperature differences of the front, rear, and side water wall are shown in Figure 14.
Figure 14 shows that the maximum temperature difference of the vertical water wall is high. The maximum temperature difference increases first and then decreases with the increase in load. The maximum temperature difference appears at the front vertical water wall. The reasons for this are as follows. The working fluid in the water wall will work under subcritical conditions when the load is lower. The working fluid in the water wall becomes a mixture of the two phases of steam–water. The specific volume of the steam–water changes greatly. In addition, the uniform heat load distribution in the furnace and the mass velocity reduction increase in thermal sensitivity by the side-by-side running of water wall tubes. As a result, the maximum temperature difference of the water wall is larger under the lower power loads [31]. The main factors for the temperature difference of the vertical water wall are the uneven heating among the tubes, uneven flow, and the structure characteristic of the water wall [32]. The pulverized coal is conveyed by the side coal bunker in this experimental boiler unit. There is a large deviation of heat load distribution in the furnace because of the distribution deviation of the air–powder in the combustor, the secondary air volume deviation, and coal quality deviation. It is easier for the temperature difference to occur at the front vertical water wall because of the poor thermal sensitivity caused by the smaller overall flow into the front vertical water wall than that of the rear vertical water wall. The flow cross-sectional area of the overall flow into the front vertical water wall is smaller than that of the rear water wall when the mixed working fluid enters the vertical water wall of the furnace through the middle vertical mixing header. It is the reason for the smaller overall flow into the front vertical water wall. In addition, the furnace of the boiler is wide, the area of the side water wall is smaller than that of the front and rear water walls, and the vertical heating surface of the front water wall is larger than that of the rear water wall. As a result, the heating area of the front water wall is the largest which led to the difference in heat absorption of each part. The temperature difference of the front water wall is greater than that of the side and rear water wall and the accumulated stress will also reach a higher level [32].
The greater the load, the greater the average temperature of the water wall. This is because the larger load needs a greater number of running burners which leads to strong combustion in the furnace and the heat absorbed by the water wall is also greater. Such detailed water wall temperature analysis has not yet been reported for large-scale boilers. We hope the data and analysis on the 1000 MW ultra-supercritical boiler reported in this paper provide valuable insights to boiler designers.

5. Conclusions and Advice

5.1. Conclusions

It can be seen from the above analysis that the water wall temperature does not exceed the limit value under the conditions of different loads (the temperature limit of the spiral water wall is 478 °C and that of the vertical water wall is 507 °C).
  • The temperature distribution of the spiral water wall is more uniform than that of the vertical water wall. The temperature valley value of the rear spiral water wall appears at the middle measuring point. On the whole, the temperature of the water wall is more evenly distributed under the condition of a 643.9 MW load. The temperature distribution of the side spiral water wall is more uniform under different loads. The lower the load, the greater the wall temperature fluctuation.
  • The temperature of the front vertical water wall has a greater number of peaks under low-load operation. When the load is low, the difference of wall temperature is large, and the water wall is not evenly heated.
  • The study found that when the load is 643.9 MW, the change in wall temperature along the horizontal direction of the water wall is different from that under other loads. No reasonable explanation has been found yet. We hope someone can communicate with us.
  • We found the change rule of the temperature curve of the side vertical water wall as this equation: y = A + Bx + Cx2. The higher the load, the better the equation for the temperature distributions of the side vertical water wall.

5.2. Advice

In view of the above temperature deviation of the water wall, this paper puts forward the treatment measures.
  • The flue gas flow and furnace temperature deviation should be controlled by adjusting the air–powder ratio in the combustor.
  • The temperature of the separator remains in the operation range, and the overheating was prevented by adjusting the coal–water ratio in the running state.
  • The operation and combination mode of the coal mill should be standardized. If the carbon content of fly ash can meet the requirement of the running, the lower layer coal mill should be run as much as possible to control the enthalpy increase of the upper furnace.
  • The flow section ratio between the front wall and the rear wall of the vertical water wall should be improved to avoid the flow difference between the front wall and the rear wall.

Author Contributions

Conceptualization, L.Y., J.P., X.W., L.L. and X.L. (Xiaofeng Lu); Methodology, L.Y., J.P., X.L. (Xueling Li), C.L. and X.L. (Xiaofeng Lu); software, L.Y., X.L. (Xueling Li) and C.L.; validation, L.Y. and X.W.; formal analysis, L.Y., J.P., X.L. (Xueling Li) and C.L.; investigation, L.Y. and J.P.; resources, L.Y., X.W. and X.L. (Xiaofeng Lu); data curation, L.Y., J.P. and L.L.; writing—original draft preparation, L.Y., J.P., X.L. (Xueling Li) and C.L.; writing—review and editing, L.Y., X.W. and X.L. (Xiaofeng Lu); project administration, L.L. All authors have read and agreed to the published version of the manuscript.

Funding

This research was funded by the Programs for Science and Technology Development of Henan Province (Grant No. 232102320228), Key Science Research Project of Universities in Henan Province (Grant No. 24A480009), and Doctor Research Fund of Zhengzhou University of Light Industry (Grant No. 2023BSJJ032).

Data Availability Statement

The original contributions presented in the study are included in the article, further inquiries can be directed to the corresponding author.

Conflicts of Interest

Authors Jiang Pu and Liansheng Li were employed by Henan Electric Power Generation Limited Company Pingdingshan Generation Branch, State Power Investment Corporation. The remaining authors declare that the research was conducted in the absence of any commercial or financial relationships that could be construed as a potential conflict of interest.

References

  1. Viswanathan, R.; Sarver, J.; Tanzosh, J.M. Boiler materials for ultra-supercritical coal power plants-steamside oxidation. J. Mater. Eng. Perform. 2006, 15, 255–274. [Google Scholar] [CrossRef]
  2. Gao, C.; Wu, X.; Li, Z.; Fu, J.; Guo, J.; Qu, S.; Li, B. Statistical analysis and improvement measures of unplanned outage of thermal power units in Jilin power grid. Jilin Electr. Power 2017, 45, 1–4. [Google Scholar] [CrossRef]
  3. Ranjeeth, R.; Aditya, D.; Gautam, A.; Singh, S.P.; Bhattacharya, S. Failure investigation of a water-wall tube of fossil-fuel fired boiler. Eng. Fail. Anal. 2024, 155, 107727. [Google Scholar] [CrossRef]
  4. Li, L.; Zhou, Q.; Wen, D.; Li, N.; Yao, Y.; Ao, Y. The working status and deformation risk of membrane walls affected by the arrangement of burners in the arch-fired boiler. Appl. Therm. Eng. 2020, 181, 115995. [Google Scholar] [CrossRef]
  5. Wei, L.; Zhou, Q.; Liu, Z.; Li, N.; Li, L.; Luo, Q. Experimental study on the distribution of temperature and deformation in the water walls of an opposed firing boiler under variable load conditions. J. Energy Eng.—ASCE 2021, 147, 04021040. [Google Scholar] [CrossRef]
  6. Xue, W.; Lu, Y.; Wang, Z.; Cao, S.; Sui, M.; Yang, Y.; Li, J.; Xie, Y. Reconstructing near-water-wall temperature in coal-fired boilers using improved transfer learning and hidden layer configuration optimization. Energy 2024, 294, 130860. [Google Scholar] [CrossRef]
  7. Lv, C.; Wang, G.; Chen, H. Estimation of time-dependent thermal boundary conditions and online reconstruction of transient temperature field for boiler membrane water wall. Int. J. Heat Mass Transf. 2020, 147, 118955. [Google Scholar] [CrossRef]
  8. Wang, T.; Chen, X.; Zhong, W. Air distribution and coal blending optimization to reduce slagging on coal-fired boiler water wall based on POD reduced order modeling for CFD. Fuel 2024, 357, 129856. [Google Scholar] [CrossRef]
  9. Wei, L.; Zhou, Q.; Li, N. Experimental study and simulation analysis of heat and deformation in the water walls of an opposed firing boiler under flexible operating conditions. Appl. Therm. Eng. 2022, 213, 118726. [Google Scholar] [CrossRef]
  10. Zima, W. Analysis of temperature drops on the wall thickness of a supercritical boiler water-wall tube. Therm. Sci. 2019, 23, 1091–1100. [Google Scholar] [CrossRef]
  11. Dong, J.; Fan, H.; Wu, X.; Zhou, T.; Zhang, J.; Zhang, Z. Study on the effect of flame offset on water wall tube temperature in 600 °C and 700 °C ultra-supercritical boiler. Combust. Sci. Technol. 2019, 191, 472–490. [Google Scholar] [CrossRef]
  12. Zhao, Q.; Zhang, Z.; Cheng, D.; Wang, Y.; Deng, X. High temperature corrosion of water wall materials T23 and T24 in simulated furnace atmospheres. Chin. J. Chem. Eng. 2012, 20, 814–822. [Google Scholar] [CrossRef]
  13. Xiong, X.; Liu, X.; Tan, H.; Deng, S. Investigation on high temperature corrosion of water-cooled wall tubes at a 300 MW boiler. J. Energy Inst. 2020, 93, 377–386. [Google Scholar] [CrossRef]
  14. Cao, L.; Peng, R.; Deng, Z. Optimization study on high-temperature corrosion prevention of the water wall of a 1000 MW dual circle tangential boiler during operation. Energy Rep. 2021, 7, 915–925. [Google Scholar] [CrossRef]
  15. Sun, X.; Ning, Y.; Yang, J.; Zhao, Y.; Yang, Z.X.; Zhou, X. Study on high temperature corrosion mechanism of water wall tubes of 350 MW supercritical unit. Eng. Fail. Anal. 2021, 121, 105131. [Google Scholar] [CrossRef]
  16. Li, X.; Zeng, L.; Zhang, N.; Zhang, X.; Song, M.; Chen, Z.; Li, Z. Effects of the gas/particle flow and combustion characteristics on water-wall temperature and energy conversion in a supercritical down-fired boiler at different secondary-air distributions. Energy 2022, 238, 121983. [Google Scholar] [CrossRef]
  17. Li, X.; Zeng, L.; Zhang, N.; Chen, Z.; Li, Z.; Qin, Y. Effects of the air-staging degree on performances of a supercritical down-fired boiler at low loads: Air/particle flow, combustion, water wall temperature, energy conversion and NO emissions. Fuel 2022, 308, 121896. [Google Scholar] [CrossRef]
  18. Fu, J.; Wei, L.; Li, N.; Zhou, Q.; Liu, T. Experimental study on temperature, heat flux, strain and stress distribution of boiler water walls. Appl. Therm. Eng. 2017, 113, 419–425. [Google Scholar] [CrossRef]
  19. Fan, Z.; Wang, Q.; Niu, K.; Jia, J.; Zhang, Z.; Xu, A.; Ma, Y.; Zhan, Y.; Liu, C.; Dong, H. Water wall tube cracking in an ultra-supercritical boiler caused by deep peaking. Trans. Indian Inst. Met. 2022, 75, 183–191. [Google Scholar] [CrossRef]
  20. Srikanth, S.; Gopalakrishna, K.; Das, S.K.; Ravikumar, B. Phosphate induced stress corrosion cracking in a waterwall tube from a coal fired boiler. Eng. Fail. Anal. 2003, 10, 491–501. [Google Scholar] [CrossRef]
  21. Zhang, J.; Zhang, Z.; Zhang, Z.; Song, D.; Su, D.; Leng, J. Reason analysis and process on vertical rising rifled tube transverse crack of ultra-supercritical boiler. Northeast. Electr. Power Technol. 2013, 34, 24–30. [Google Scholar]
  22. Pan, J.; Yang, D.; Yu, H.; Bi, Q.; Hua, H.; Gao, F.; Yang, Z. Mathematical modeling and thermal-hydraulic analysis of vertical water wall in an ultra supercritical boiler. Appl. Therm. Eng. 2009, 29, 2500–2507. [Google Scholar] [CrossRef]
  23. Pan, J.; Yang, D.; Chen, G.; Zhou, X.; Bi, Q. Thermal-hydraulic analysis of a 600 MW supercritical CFB boiler with low mass flux. Appl. Therm. Eng. 2012, 32, 41–48. [Google Scholar] [CrossRef]
  24. Pan, J.; Wu, G.; Yang, D. Thermal-hydraulic calculation and analysis on water wall system of 600 MW supercritical CFB boiler. Appl. Therm. Eng. 2015, 82, 225–236. [Google Scholar] [CrossRef]
  25. Zhu, X.; Wang, W.; Xu, W. A study of the hydrodynamic characteristics of a vertical water wall in a 2953t/h ultra-supercritical pressure boiler. Int. J. Heat Mass Transf. 2015, 86, 404–414. [Google Scholar] [CrossRef]
  26. Lyu, J. Investigation on Heat Flux and Hydrodynamics of Water Wall of a Supercritical Pressure Circulating Fluidized Bed Boiler. Ph.D. Thesis, Tsinghua University, Beijing, China, 2005. [Google Scholar]
  27. Chen, Y.; Lu, X.; Zhang, W.; Wang, Q.; Chen, S.; Fan, X.; Li, J. An experimental study on the hydrodynamic performance of the water-wall system of a 600 MW supercritical CFB boiler. Appl. Therm. Eng. 2018, 141, 280–287. [Google Scholar] [CrossRef]
  28. Dong, J.; Zhou, T.; Wu, X.; Zhang, J.; Fan, H.; Zhang, Z. Coupled heat transfer simulation of the spiral water wall in a double reheat ultra-supercritical boiler. J. Therm. Sci. 2018, 27, 592–601. [Google Scholar] [CrossRef]
  29. Nurbanasari, M.; Abdurrachim. Investigation of leakage on water wall tube in a 660 MW supercritical boiler. J. Fail. Anal. Prev. 2014, 14, 657–661. [Google Scholar] [CrossRef]
  30. Fan, Q. Research on the water wall temperature excursion in the supercritical and ultra-supercritical boilers. Electr. Power 2006, 39, 59–63. [Google Scholar]
  31. Che, D. The Boiler; Xi’an Jiaotong University Press: Xi’an, China, 2018. [Google Scholar]
  32. Huang, S.; Lv, X.; Wei, W.; Zhuang, J. Countermeasures against water wall temperature deviation of ultra-supercritical boiler. Power Energy 2015, 36, 566–569. [Google Scholar]
Figure 1. The arrangement of the water-cooling wall.
Energies 17 04375 g001
Figure 2. The temperature distribution of the front spiral water wall under different load conditions.
Energies 17 04375 g002
Figure 3. The high temperature, low temperature, mean temperature, and maximum temperature difference of front spiral water wall.
Energies 17 04375 g003
Figure 4. The temperature distribution of rear spiral water wall under different load conditions.
Energies 17 04375 g004
Figure 5. The high temperature, mean temperature, low temperature, and maximum temperature difference of the rear spiral water wall.
Energies 17 04375 g005
Figure 6. The temperature distribution of the side spiral water walls under different load conditions.
Energies 17 04375 g006
Figure 7. The high temperature, mean temperature, low temperature, and maximum temperature difference of the side spiral water wall.
Energies 17 04375 g007
Figure 8. The temperature distribution of front vertical water wall under different load conditions.
Energies 17 04375 g008
Figure 9. The high temperature, mean temperature, low temperature, and maximum temperature difference of the front vertical water wall.
Energies 17 04375 g009
Figure 10. The temperature distribution of the slag tube under different load conditions.
Energies 17 04375 g010
Figure 11. The high temperature, mean temperature, low temperature, and maximum temperature difference of the slag screen.
Energies 17 04375 g011
Figure 12. The temperature distribution of the side vertical water wall under different load conditions.
Energies 17 04375 g012
Figure 13. The high temperature, mean temperature, low temperature, and maximum temperature difference of the side vertical water wall.
Energies 17 04375 g013
Figure 14. Maximum temperature difference of water wall under the condition of the different loads.
Energies 17 04375 g014
Table 1. Main design data of the boiler.
ItemsUnitBMCRTHABRL
Superheated steam flow ratet/h31102724.042901.64
Outlet pressure of superheated steamMpa(a)26.2525.9826.11
Outlet temperature of superheated steam°C605605605
Reheat steam flowt/h2469.162186.032299.53
Inlet steam pressure of reheaterMpa(a)5.514.895.13
Outlet steam pressure of reheaterMpa(a)5.264.694.91
Inlet steam temperature of reheater°C359345351
Outlet steam temperature of reheater°C603603603
Inlet water temperature of economizer°C302293297
BMCR: Boiler Maximum Continuous Rating. THA: Turbine Heat Acceptance. BRL: Boiler Rated Load.
Table 2. The parameters of coal.
SymbolUnitDesign Bituminous CoalSymbolUnitDesign Bituminous Coal
Car%50.64Fe2O3%3.57
Har%3.43CaO%1.06
Oar%5.84MgO%0.50
Nar%0.83SO3%0.84
Sar%0.26Na2O%0.41
Mar%7.50K2O%0.76
Mad%1.60TiO2%1.32
Aar%31.5MnO2%0.011
Vdaf%36.43Others%0.299
HGI 81.00DT°C>1500
Qnet,arMJ/kg19.66ST°C>1500
SiO2%64.08FT°C>1500
Al2O3%27.15
DT: Deformation Temperature. ST: Softening Temperature. FT: Flow Temperature. HGI: Hardgrove Grindability Index.
Table 3. Working conditions of the boiler.
Load (MW)Main Steam Pressure (Mpa)Main Steam Temperature (°C)Oxygen Content (%)Water–Fuel RatioAir Flow
(t/h)
217.79.40563.46.826.81606
267.911.45570.08.105.21630
348.712.05599.16.164.81821
448.112.85601.04.134.82173
508.412.42582.45.795.52367
605.014.80600.04.325.12569
643.923.17598.53.514.42304
758.818.58599.43.224.62958
804.619.09588.42.914.93018
898.722.15598.62.985.13252
990.125.03598.11.946.03410
Table 4. Monitoring point arrangement.
Monitoring Point NameMonitoring PointMonitoring Point Elevation
Outlet wall temperature of rear wall spiral water wall 1-11From left of boiler, fit on 26th, 76th, 126th, 176th, 226th, 276th, 326th, 376th, 426th, 476th, and 526th pipes.51,300 mm
Outlet temperature of side wall spiral water wall 1-10From front of boiler, fit on
26th, 76th, 126th, 176th, and 226th pipes (symmetrical arrangement, five monitoring points on left wall and five points on right wall).
Outlet wall temperature of front wall spiral water wall 1-11From left of boiler, fit on 26th, 76th, 126th, 176th, 226th, 276th, 326th, 376th, 426th, 476th, and 526th pipes.
Outlet wall temperature of the front wall upper water wall 1-20From left of boiler, fit on
27th, 52nd, 77th, 101st, 125th, 149th, 173rd, 197th, 221st, 244th, 267th, 290th, 314th, 338th, 362nd, 386th, 410th, 434th, 458th, and 508th pipes.
72,300 mm
Outlet temperature of side wall upper water wall 1-24From front of boiler, fit on 12nd, 23rd, 47th, 71st, 96th, 121st, 147th, 173rd, 197th, 221st, 224th, and 267th pipes.
Outlet wall temperature of slag tube 1-6From left of boiler, fit on 8th, 16th, 25th, 34th, 42nd, and 51st pipes.
Table 5. The coefficients and R-squares for the fitting equation.
Load
(MW)
The Fitting Equation y = A + Bx + Cx2
Left WallRight Wall
The CoefficientR-SquareThe CoefficientR-Square
ABCABC
217.7297.9045510.90774−0.960090.77022301.163641.92108−0.188010.44605
267.9338.39091−3.577200.480520.31690330.922735.45055−0.529870.22169
348.7313.2818222.92143−1.983470.71121339.686363.32982−0.35410.28670
448.1339.450009.08307−0.935810.62520333.779553.36426−0.225950.09376
508.4339.272735.88327−0.623030.59538336.156822.52600−0.206170.21513
605.0352.784096.27635−0.714560.65771348.450003.58891−0.330670.46070
643.9386.570451.467560.147980.20792395.015154.03741−0.395920.84395
758.8363.806829.61266−0.941180.67925369.350002.57822−0.298000.56748
804.6364.677278.27727−0.804550.68683368.715913.85992−0.379950.65562
898.7382.993188.45227−0.828150.71737384.779554.33279−0.440630.70976
990.1398.427278.16464−0.809490.77223393.634097.56396−0.693380.78337
Disclaimer/Publisher’s Note: The statements, opinions and data contained in all publications are solely those of the individual author(s) and contributor(s) and not of MDPI and/or the editor(s). MDPI and/or the editor(s) disclaim responsibility for any injury to people or property resulting from any ideas, methods, instructions or products referred to in the content.

