1. Introduction
With the increasing deployment of gas-insulated switchgear (GIS), the prevention of GIS breakdowns has become increasingly critical for ensuring the safe and stable operation of power systems. The insulation pull rod, as an essential transmission mechanism in GIS, is a frequent source of faults during its operation [
1,
2,
3]. The frequent opening and closing operations and complex operating conditions of GIS impose high demands on the insulation performance and mechanical strength of the insulation pull rod [
4]. During the production, installation, and operation of the insulation pull rod, defects such as white spots, cracks, and impurities often appear on its surface or inside it. These defects can cause electric field distortion and partial discharge under actual operating conditions and may further develop under strong mechanical stress, ultimately leading to breakdown accidents [
5,
6,
7]. Therefore, there is an urgent need to develop highly sensitive methods for detecting defects in insulation pull rods.
Currently, numerous researchers have proposed various methods for detecting defects in insulation pull rods. Most researchers focus on measuring partial discharge via the pulse current to identify defects in insulation pull rods. Studies have found that this method is highly sensitive to larger air gap defects within the insulation pull rod, with an increased air gap diameter leading to a higher discharge quantity and frequency. However, it fails to accurately measure characteristic signals for smaller defects [
7,
8,
9]. Additionally, X-ray and ultrasonic testing have been applied by researchers to detect defects in insulation pull rods. These methods can intuitively display the size and shape of defects, and the results can be preserved for long periods. Nevertheless, detecting minor defects remains challenging and inefficient, failing to meet the accurate and efficient detection requirements for insulation pull rods before factory release [
10,
11,
12]. Moreover, there is no unified specific technical standard for factory inspection of insulation pull rods in China. The pull rod is a hollow tube made of fiber-reinforced epoxy resin composite. Due to the good transparency of the epoxy resin, when illuminated from within using a light tube, defects on both the surface and inside of the pull rod can be easily observed, as shown in
Figure 1. Leveraging the hollow and transparent structural advantages of insulation pull rods, workers often illuminate the interior and visually inspect for defects before factory release. However, this visual inspection method is labor-intensive, highly subjective, prone to misjudgment and oversight, and significantly increases the safety risks of equipment in operation.
In recent years, with the rapid development of deep learning technology, computer vision-based object detection algorithms have become a research hotspot in the field of industrial defect detection. Among these, the two-stage detection networks represented by the R-CNN series [
13] and the single-stage detection networks represented by the SSD and YOLO series [
14,
15,
16] are the most widely used. Zhao et al. [
17] improved the anchor box generation method and the non-maximum suppression (NMS) in the region proposal network (RPN) of the Faster R-CNN, enhancing the network’s performance in detecting insulators. Kang et al. [
18] replaced the feature extraction network in the original SSD network with ResNet50 and added a small object detection layer on top of the original six feature prediction layers, significantly improving the network’s detection accuracy for printed circuit boards (PCBs). Chen et al. [
19] utilized Swin Transformer as the feature extraction network and incorporated convolution and attention mechanisms to rearrange the channels in the feature map, effectively improving the accuracy of PCB defect detection.
However, the following challenges remain in achieving efficient defect detection for insulation pull rods:
(1) The existing detection methods are inefficient and struggle to accurately identify mixed defects and small defect regions.
(2) The traditional methods lack timeliness in intelligent analysis, and the detection results are difficult to preserve.
(3) The effectiveness of deep learning networks for insulation pull rod defect detection has not yet been verified or studied.
To address the aforementioned issues, this paper proposes the use of deep learning networks to achieve the rapid and accurate detection of defects in insulation pull rods. Additionally, an intelligent defect detection device is developed based on a pre-trained model specifically designed for insulation pull rod defects. The feasibility and effectiveness of this method are validated through experiments.
2. Methods for Detecting Defects in Insulation Pull Rods
Based on the successful application of existing object detection algorithms in the power industry, computer vision technology offers a potential solution to the challenges of low detection efficiency and poor timeliness of intelligent analysis in the current methods for detecting defects in insulation pull rods. To meet the quality inspection requirements of insulation pull rods before factory release, and considering the detection performance and speed of the existing object detection algorithms, this paper selects the YOLOv5s network, which is the most widely used in the field of industrial defect detection, to achieve efficient and accurate detection of defects in insulation pull rods.
As a classic object detection model in the YOLO series, YOLOv5 offers fast and accurate detection performance and is widely used in the field of industrial defect detection [
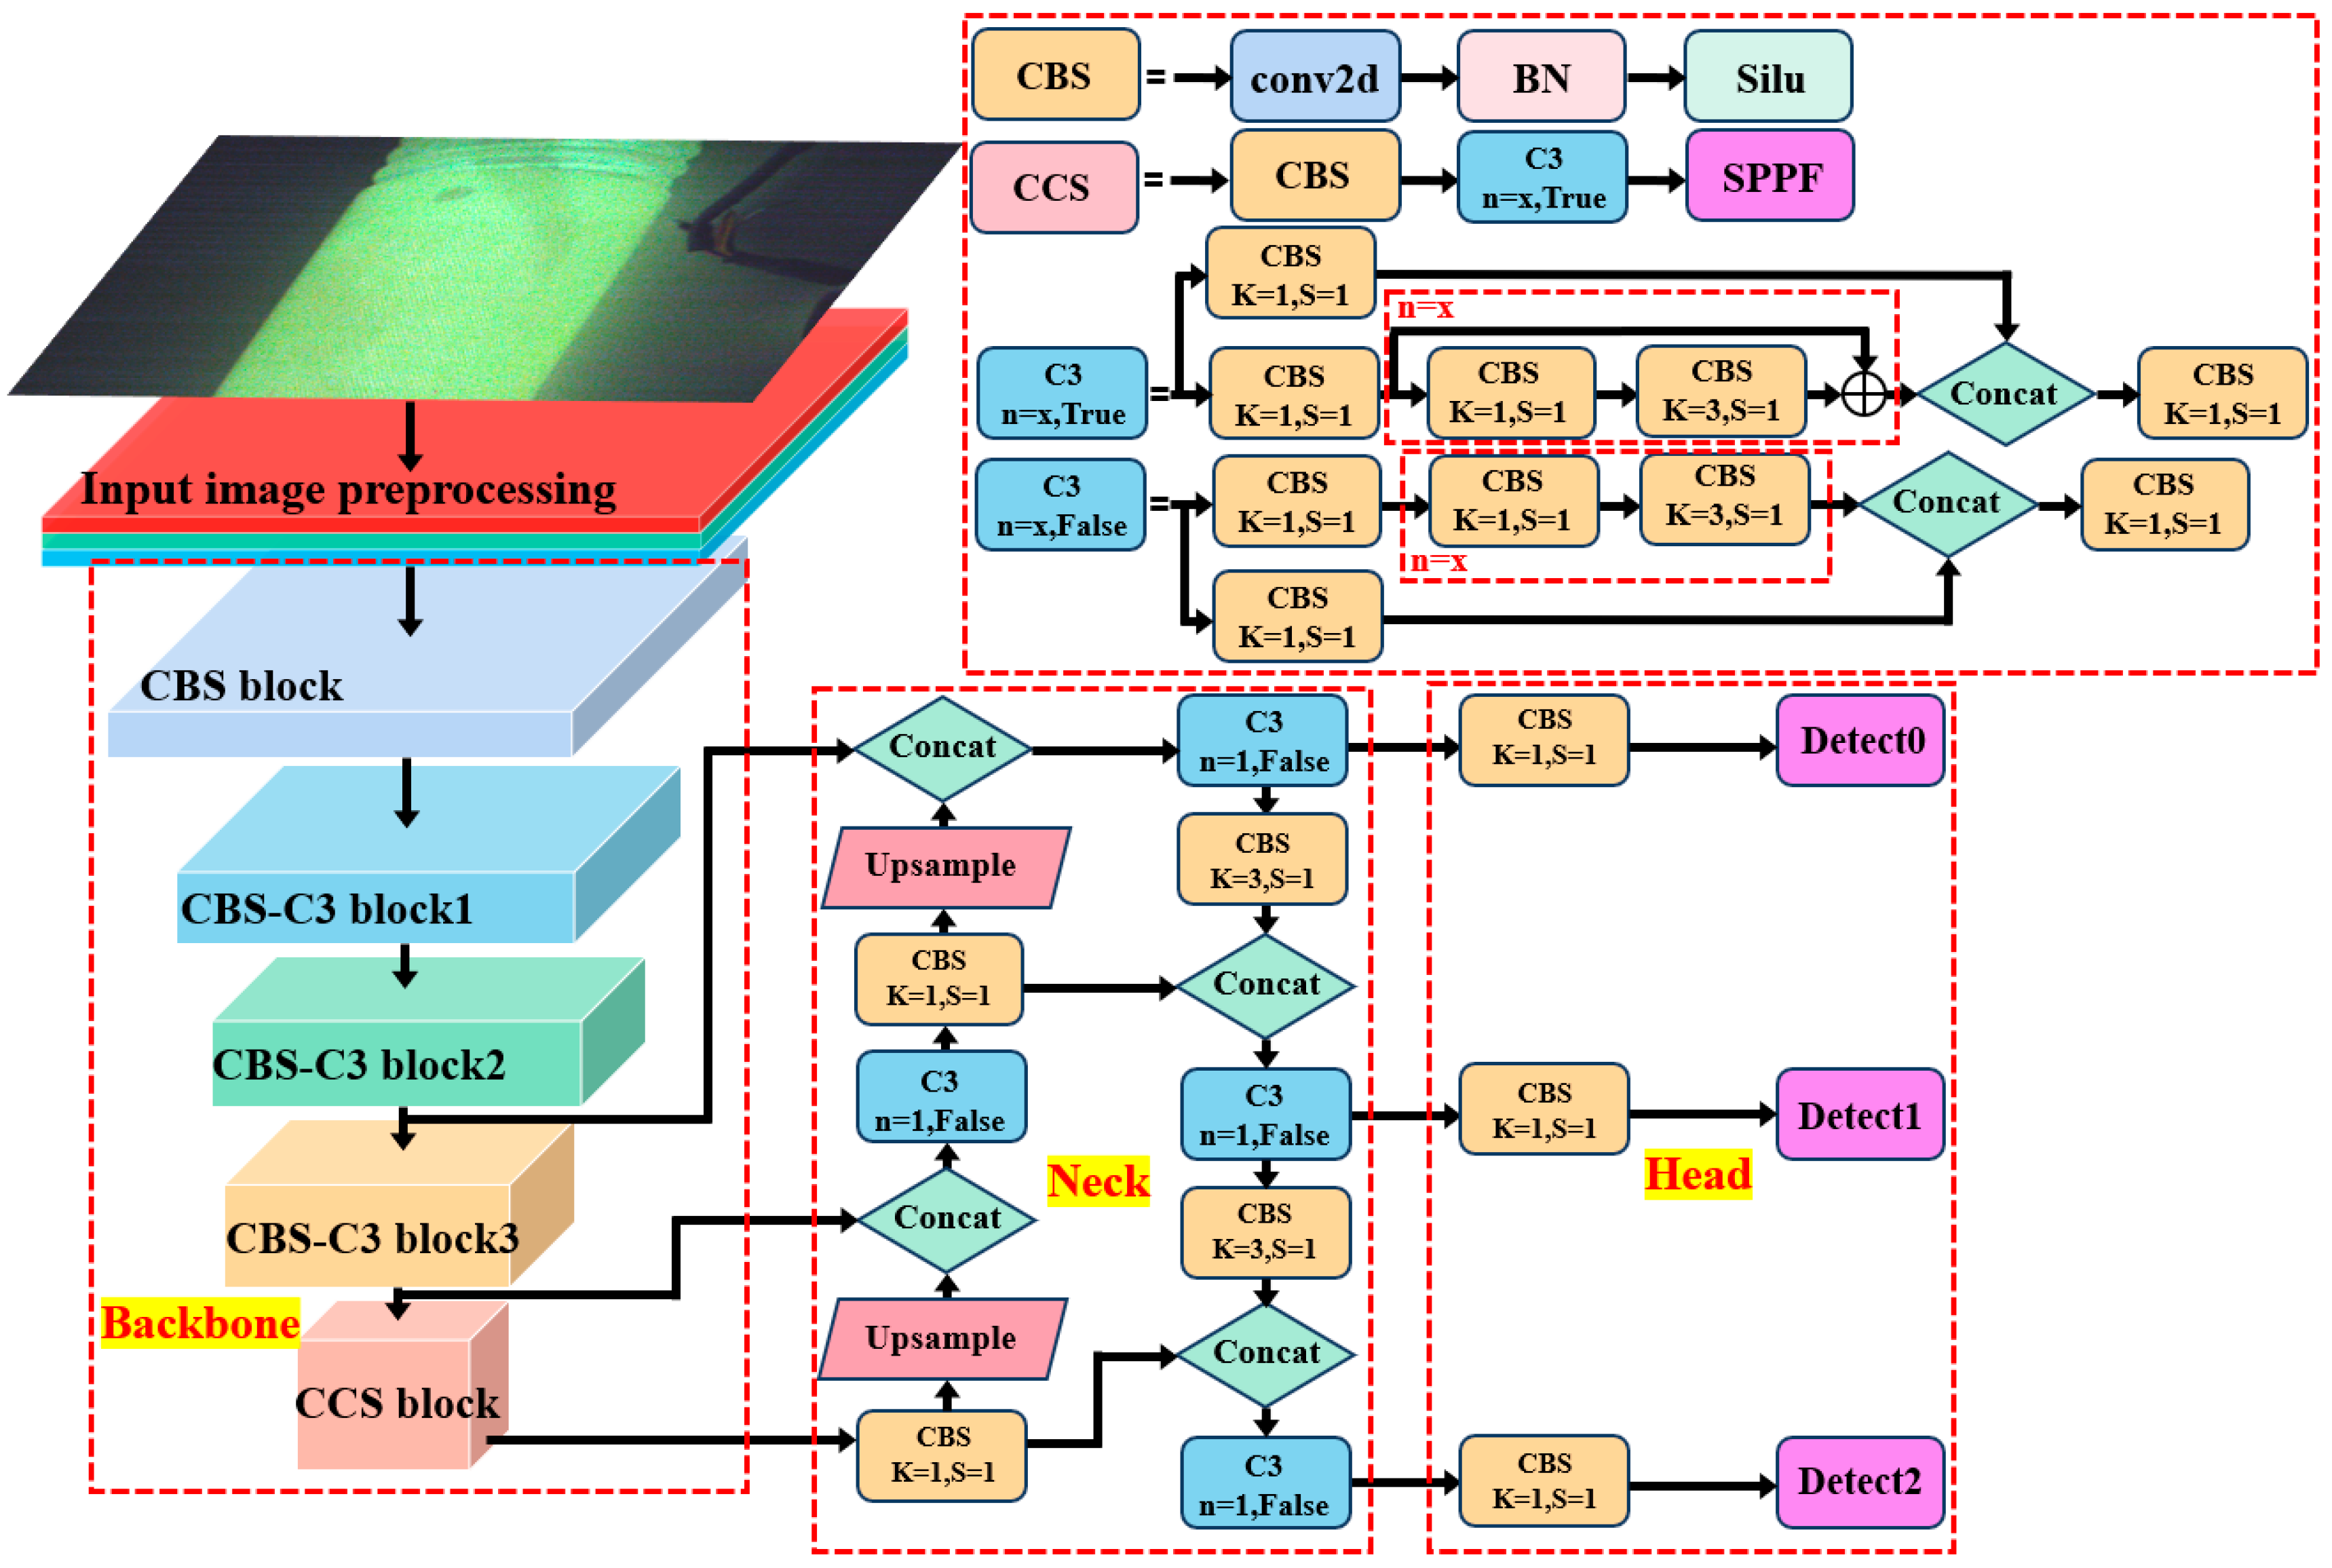
20]. To meet the needs of different application scenarios, the YOLOv5 network provides four different models of varying scales: YOLOv5s, YOLOv5m, YOLOv5l, and YOLOv5x. Compared to other models, the YOLOv5s model has a smaller depth and width, fewer parameters, and faster inference speed. This paper selects the YOLOv5s model for identifying defects in insulation pull rods. Its network structure mainly comprises three parts: the Backbone feature extraction network, the Neck feature fusion network, and the Head prediction network, as shown in
Figure 2.
The Backbone, serving as the backbone feature extraction network, is utilized to extract image features, transforming input images into multi-layer feature maps for subsequent operations. The Backbone achieves image feature extraction and transformation, as well as the deepening of the network depth and receptive field, through its constituent modules: CBS (Convolutional Block), C3, and SPPF (Spatial Pyramid Pooling Fusion). CBS module comprises convolutional layers, Batch Normalization (BN) layers, and activation functions. The convolutional layers act as sliding windows over the input image, operating on the image feature values within the window region with convolutional kernels. The BN layer normalizes the feature value distribution of the convolutional layer output, and finally, the activation function introduces non-linear transformation capability to the neural network. The C3 module consists of multiple CBS blocks, where the first CBS module has a stride of 2 in the convolutional layers, reducing the size of the feature map by half. Subsequent CBS modules have a stride of 1 in the convolutional layers, and all CBS blocks utilize 3 × 3 convolutional kernels. Between each CBS block, BN layers and LeakyReLU activation functions are added to enhance the stability and generalization performance of the model. Additionally, the C3 module introduces a residual structure through the Bottleneck module to increase the network depth and receptive field, improving the network’s image feature extraction capability. The SPPF module comprises CBS modules, maximum pooling downsampling operations, and Concat modules. It performs different maximum pooling downsampling operations on the input feature maps to obtain a set of feature maps with different sizes. These feature maps are then concatenated through the Concat module, and finally, the concatenated feature vectors are dimensionally reduced through fully connected layers to obtain fixed-size feature vectors.
The Neck, a feature fusion network for the neck region, achieves feature fusion of different-level feature maps by performing top-down and bottom-up upsampling operations, generating feature maps with multiple scales of information to obtain richer feature representations. The Neck employs the Feature Pyramid Network (FPN) structure for top-down upsampling, upsampling the feature maps outputted by the last layer of the Backbone and fusing them with feature maps of the same scale from the Backbone, resulting in richer feature representations. This operation is repeated twice to transfer deep semantic features to shallow layers, thereby enhancing the semantic representation at multiple scales. Additionally, the Neck utilizes the Path Aggregation Network (PAN) structure for bottom-up downsampling, performing downsampling operations on the feature maps outputted by the last layer of the FPN structure and fusing them with feature maps of the same scale from the FPN. This process is repeated until reaching the top layer of the FPN, transferring positional information from shallow layers to deep layers, thereby enhancing the localization capabilities at multiple scales.
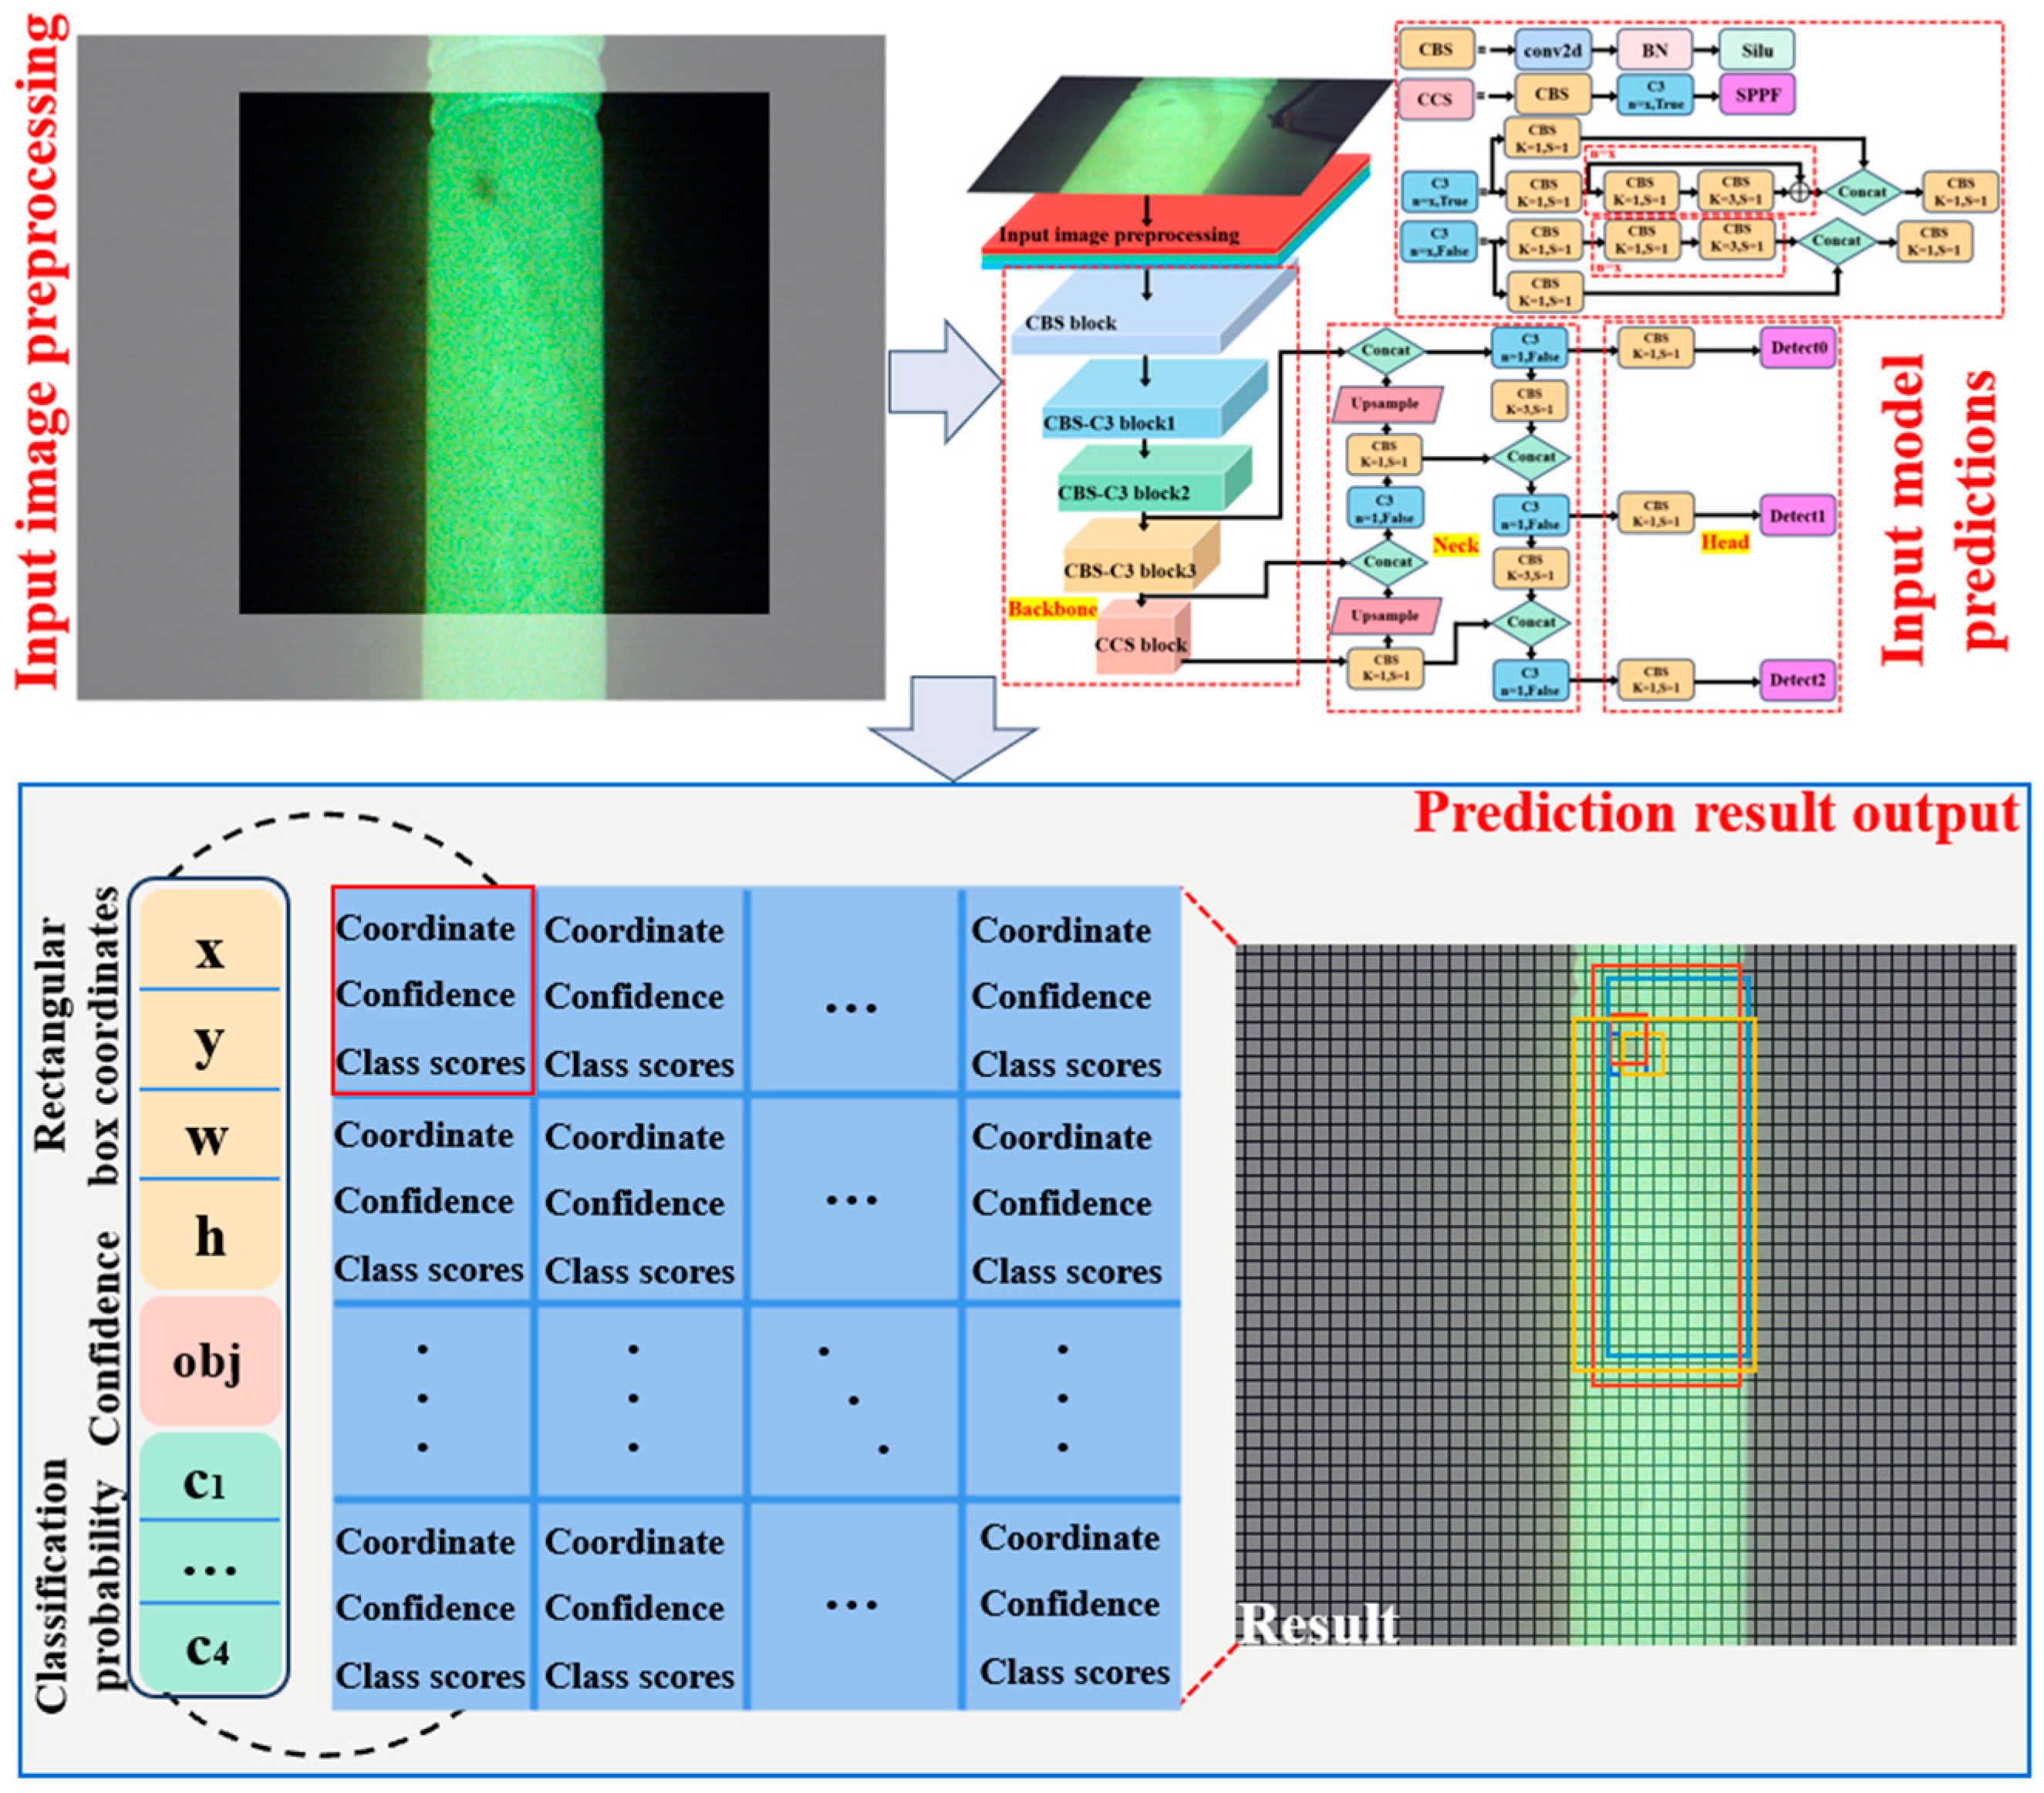
The Head, a component of the network responsible for the final predictions, has a simple structure consisting of only three 1 × 1 convolutions corresponding to three detection feature layers. These convolutions are used to adjust the dimensionality of feature maps at different scales (80 × 80 × 256, 40 × 40 × 512, and 20 × 20 × 1024) outputted by the Backbone and Neck. They transform these feature maps into three different scales (80 × 80 × 255, 40 × 40 × 255, and 20 × 20 × 255), corresponding to dividing the input 640 × 640 feature map into grids of sizes 80 × 80, 40 × 40, and 20 × 20. Each grid contains information about three anchor boxes, with each anchor box providing predictions for target coordinates, dimensions (width and height), classification probabilities, and confidence. Classification probabilities indicate the category information of predicted targets within the grid, while confidence represents the probability of the presence of a detection target within the grid; a higher confidence indicates a higher likelihood of the presence of a target. Finally, the network output layer provides predictions for all grids. The detection process of inputting the inspected insulation pull rod images into the network is illustrated in
Figure 3.
The input images of insulation pull rod defects undergo image preprocessing within the network. During this stage, the images are adaptively resized to the network’s predefined input size and normalized to floating-point values between 0 and 1. Additionally, the images are subjected to Mosaic data augmentation within the preprocessing module, enriching the dataset, increasing the target capacity, and enhancing the network’s robustness. The preprocessed images first pass through the Backbone feature extraction network for feature extraction. Then, they proceed to the Neck feature fusion network, where the image features output by the Backbone are further extracted and fused. Finally, the Head prediction network classifies the output of the feature by the Neck. During training, the network uses an adaptive anchor box assignment strategy to match the best anchor box values closest to the true bounding boxes of the insulation pull rod defects. It outputs the displacement interpolation between the predicted and true bounding boxes based on the preset initial anchor box values, continuously updating the weight parameters through backpropagation.
3. Intelligent Detection Equipment for Insulation Pull Rod Defects
3.1. Hardware Image Acquisition Device for Insulation Pull Rod Defects
To instantiate the application of deep learning networks in the task of detecting defects in insulation pull rods, we address the existing challenges of low detection efficiency and poor timeliness of intelligent analysis in the current methods for insulation pull rod defects detection. Combining the defect detection model obtained after training the YOLOv5s network, we construct an intelligent detection device for insulation pull rod defects based on transparent imaging and subsequently integrate the development of an image acquisition interface with the defect detection program, establishing an insulation pull rod defects detection system based on YOLOv5s.
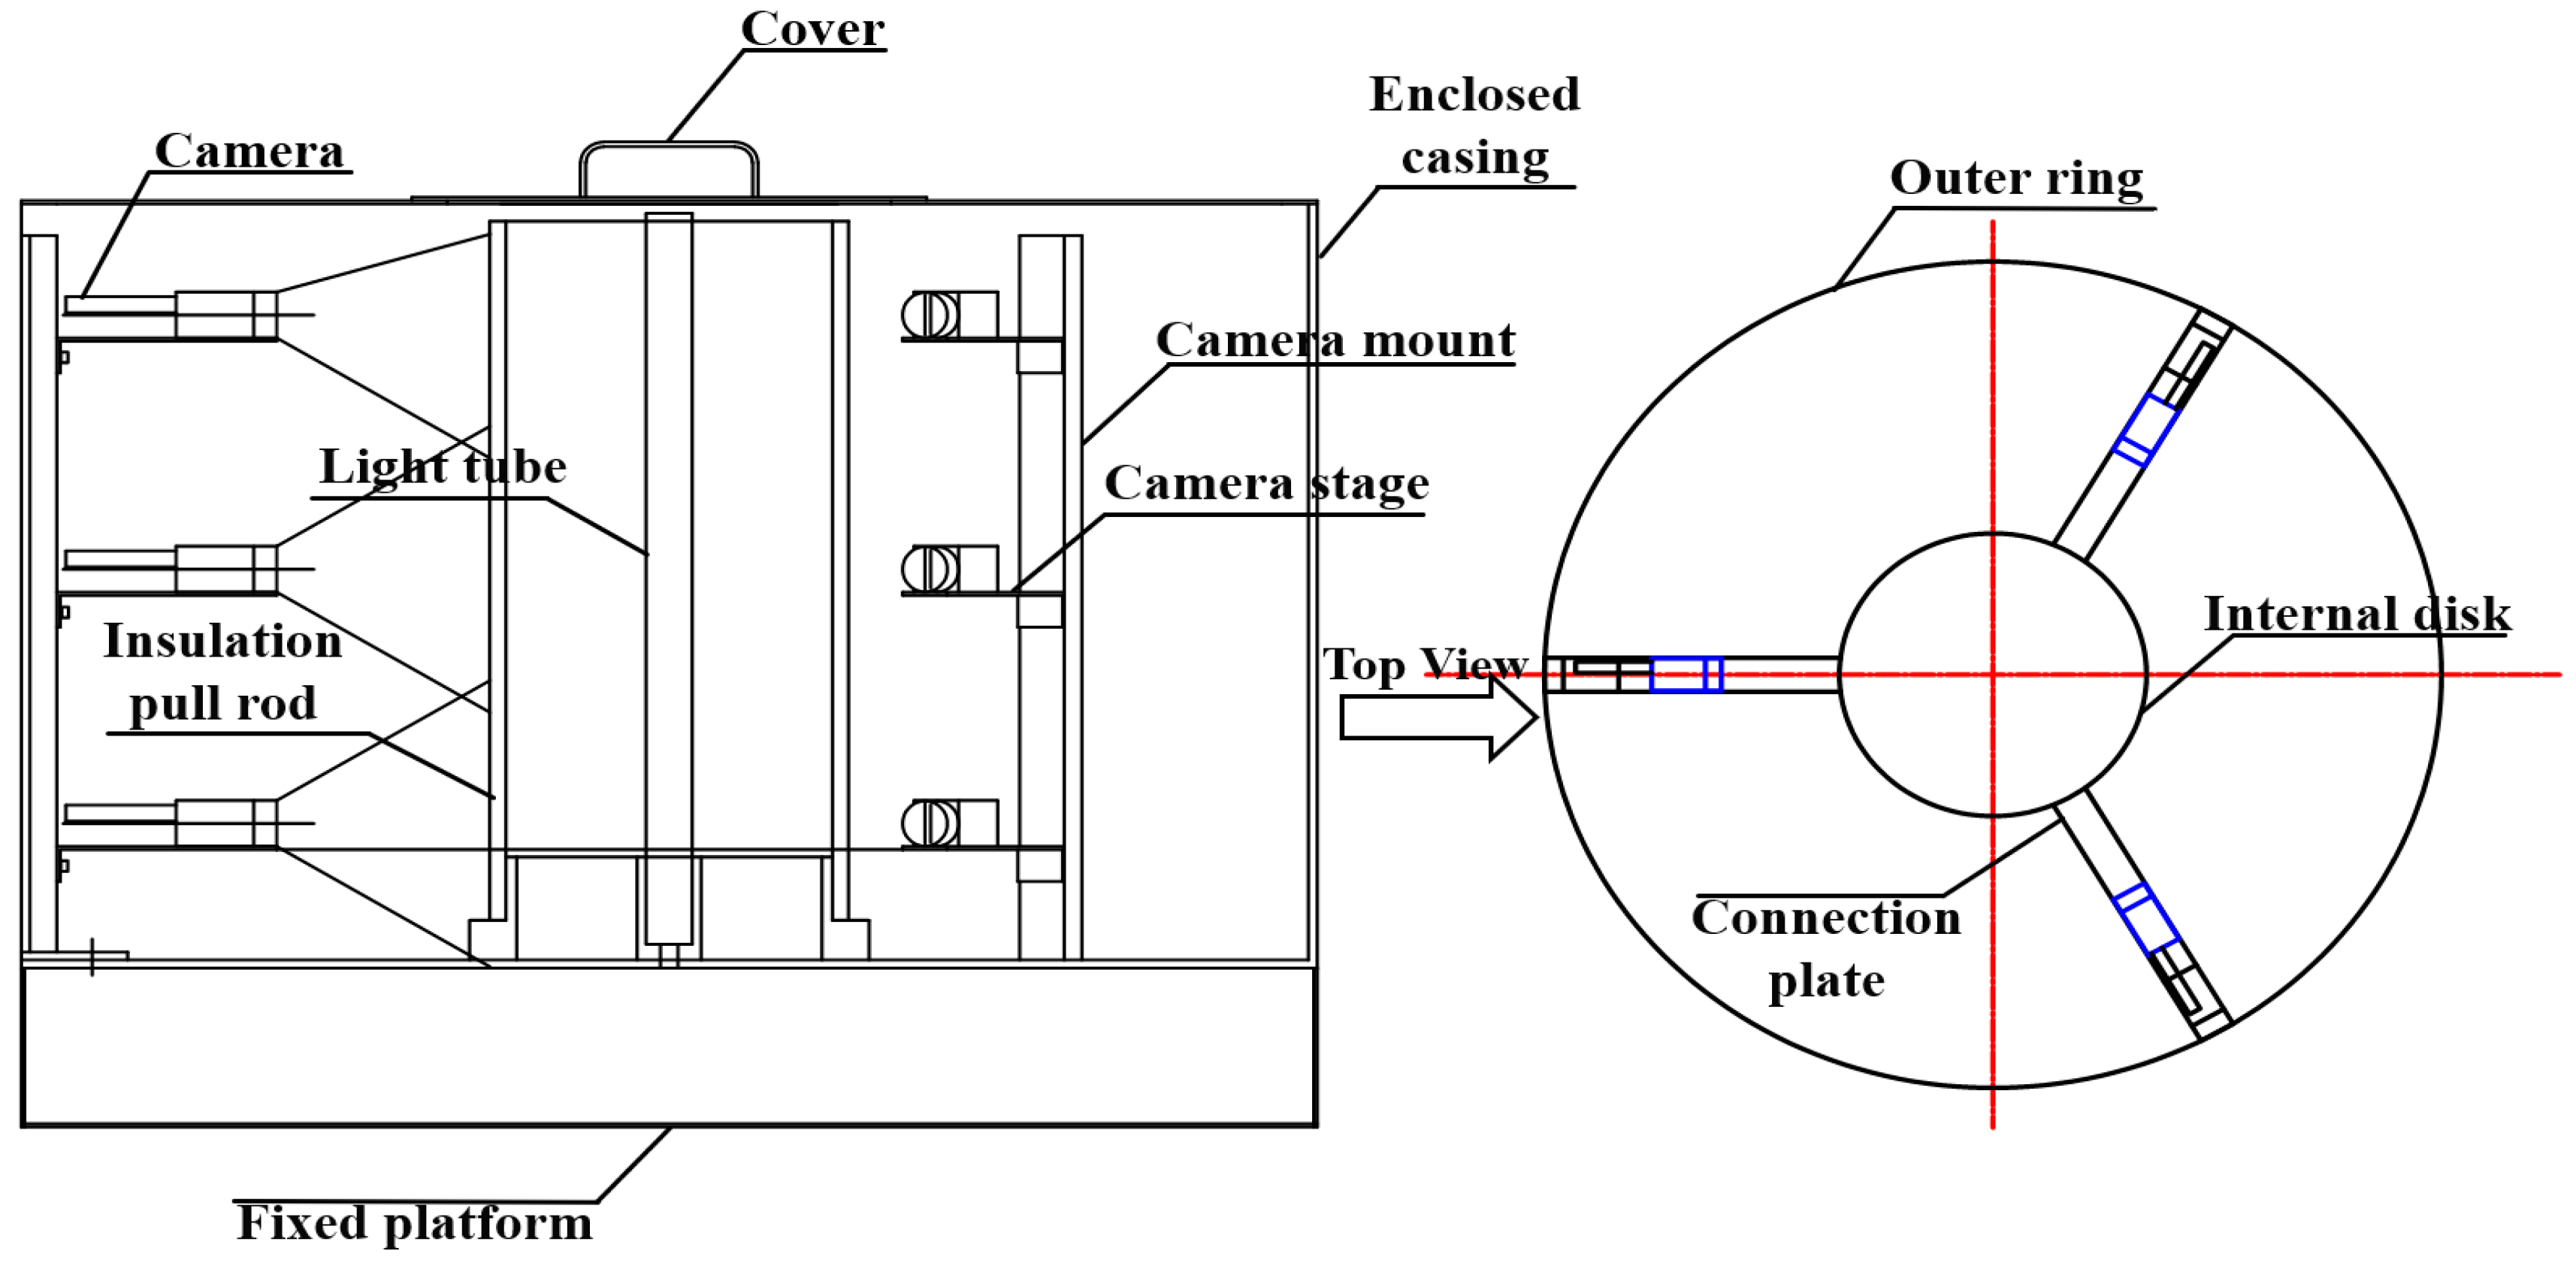
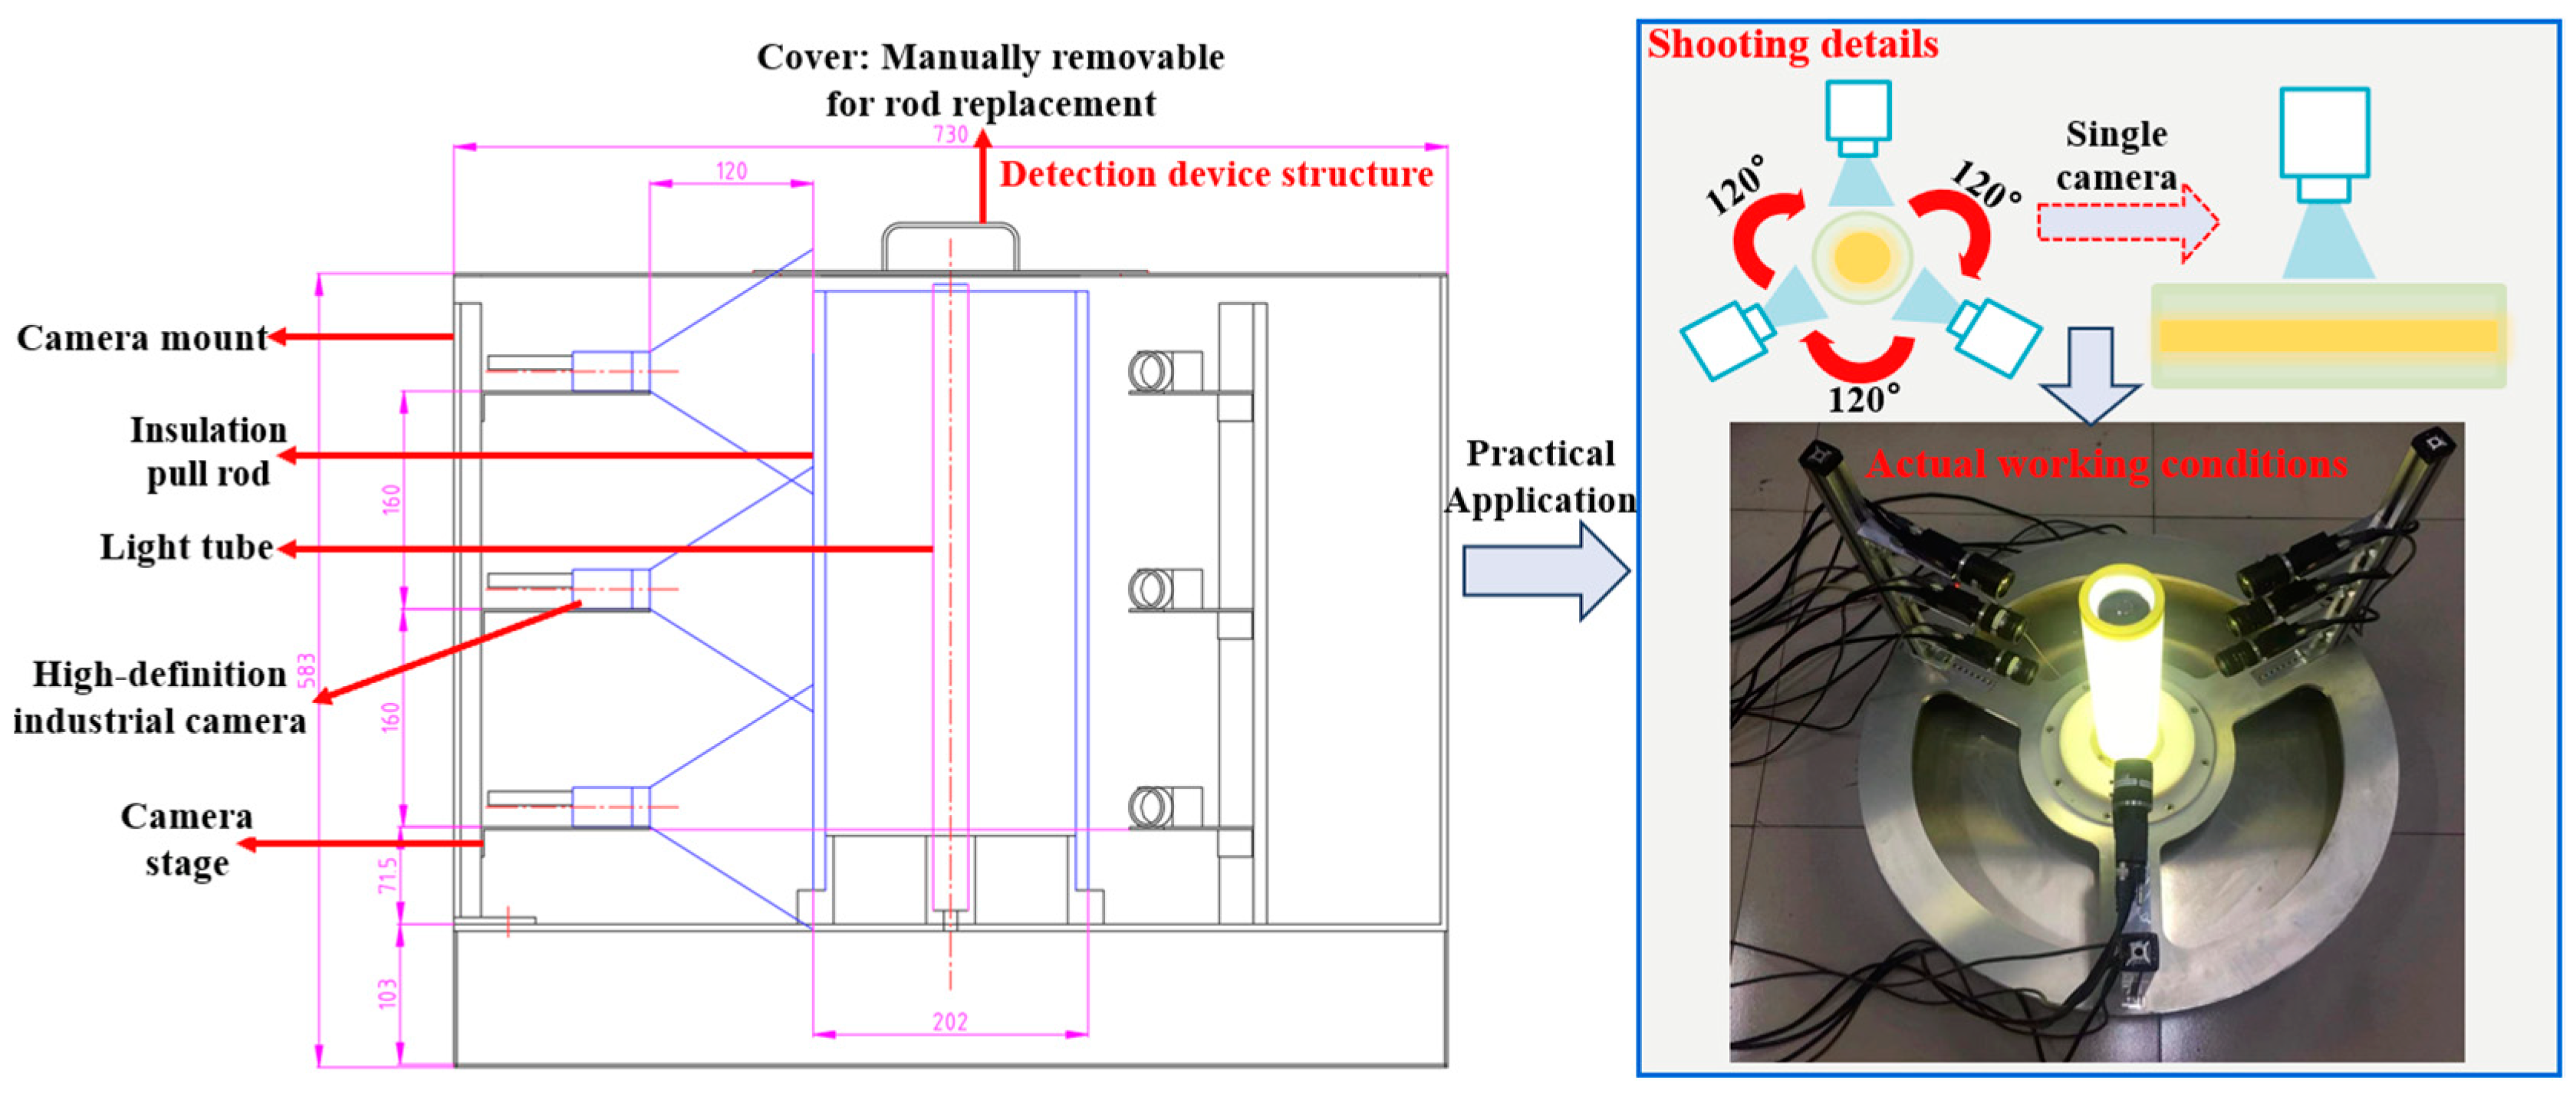
Based on the hollow and transparent structure characteristics inside the insulation pull rod, we constructed an intelligent detection device for insulation pull rod defects based on the principle of illuminating the interior of the insulation pull rod and utilizing high-definition industrial cameras for image acquisition, as shown in
Figure 4. The intelligent detection device for insulation pull rod defects described in this paper includes a bottom fixed platform and a light-emitting tube positioned at the center of the fixed platform. Due to the insulation rod’s hollow interior and excellent transparency, during detection, three sets of camera adjustment brackets are evenly distributed along the edges of the fixed platform. Each set of camera adjustment brackets is equipped with three camera mounting platforms, with a high-definition industrial camera mounted on each camera mounting platform. The cameras are connected to a camera control device. A closed cover is fixed above the fixed platform to provide a light-free shooting environment for the internal devices. A circular opening with a diameter of 20 cm is provided at the top of the closed cover, with a cover body installed on it to facilitate the replacement of the insulation pull rod during the detection process and to observe the operation of the internal devices.
The fixed platform supplies power to the light tube and provides support for both the insulation pull rod and the light tube. The fixed platform consists of an inner circular disc and an outer circular ring, with the light tube placed on the inner circular disc. Three connecting plates are arranged between the inner circular disc and the outer circular ring, with each adjacent pair of connecting plates separated by an angle of 120°. The connecting plates are equipped with grooves containing mounting holes. At the bottom of the camera adjustment bracket, there is a fixed plate that fits into the grooves on the connecting plates. Both the camera adjustment bracket and the camera mounting platform are connected via screws. The actual shooting distance, i.e., the distance between the camera lens and the rod, is controlled by adjusting the screw at the bottom of the camera adjustment bracket. Furthermore, the positions of the camera mounting platforms can be adjusted via screws, thereby altering the distances between the cameras and achieving 360° full-view shooting of the insulation pull rod.
Additionally, through extensive experiments, we have discovered that different shooting distances result in varying levels of clarity in capturing defects on the insulation pull rod. To ensure the clarity of defect information in the collected images, the distance from each camera adjustment bracket to the light tube should be kept within 12 cm. Moreover, to achieve imaging of the entire area of the insulation pull rod, the distance between the high-definition industrial cameras in this device should be controlled within 5–6 cm. At this distance, the field of view for the insulation pull rod in the obtained image is 13–15 cm. Consequently, to ensure complete image acquisition of the 48-cm-long rod under inspection, three high-definition industrial cameras should be mounted on each camera bracket.
In the specific usage of the device described in this paper, firstly, the light tube and camera adjustment bracket are assembled onto the fixed platform, and the insulation pull rod is mounted onto the light tube. Then, the distance between the camera adjustment bracket and the insulation pull rod (i.e., the shooting distance) is adjusted by the screw at the bottom of the camera adjustment bracket. Next, the position of the camera mounting platform is adjusted using the screw on the camera mounting platform to achieve distance adjustment between the cameras, ensuring the acquisition of the clearest image of the insulation pull rod area. The images of the insulation pull rod captured by the cameras are transmitted to the camera control system for detection. The physical insulation pull rod and the actually captured images are shown in
Figure 5.
3.2. The Intelligent Detection System for Insulation Pull Rod Defects
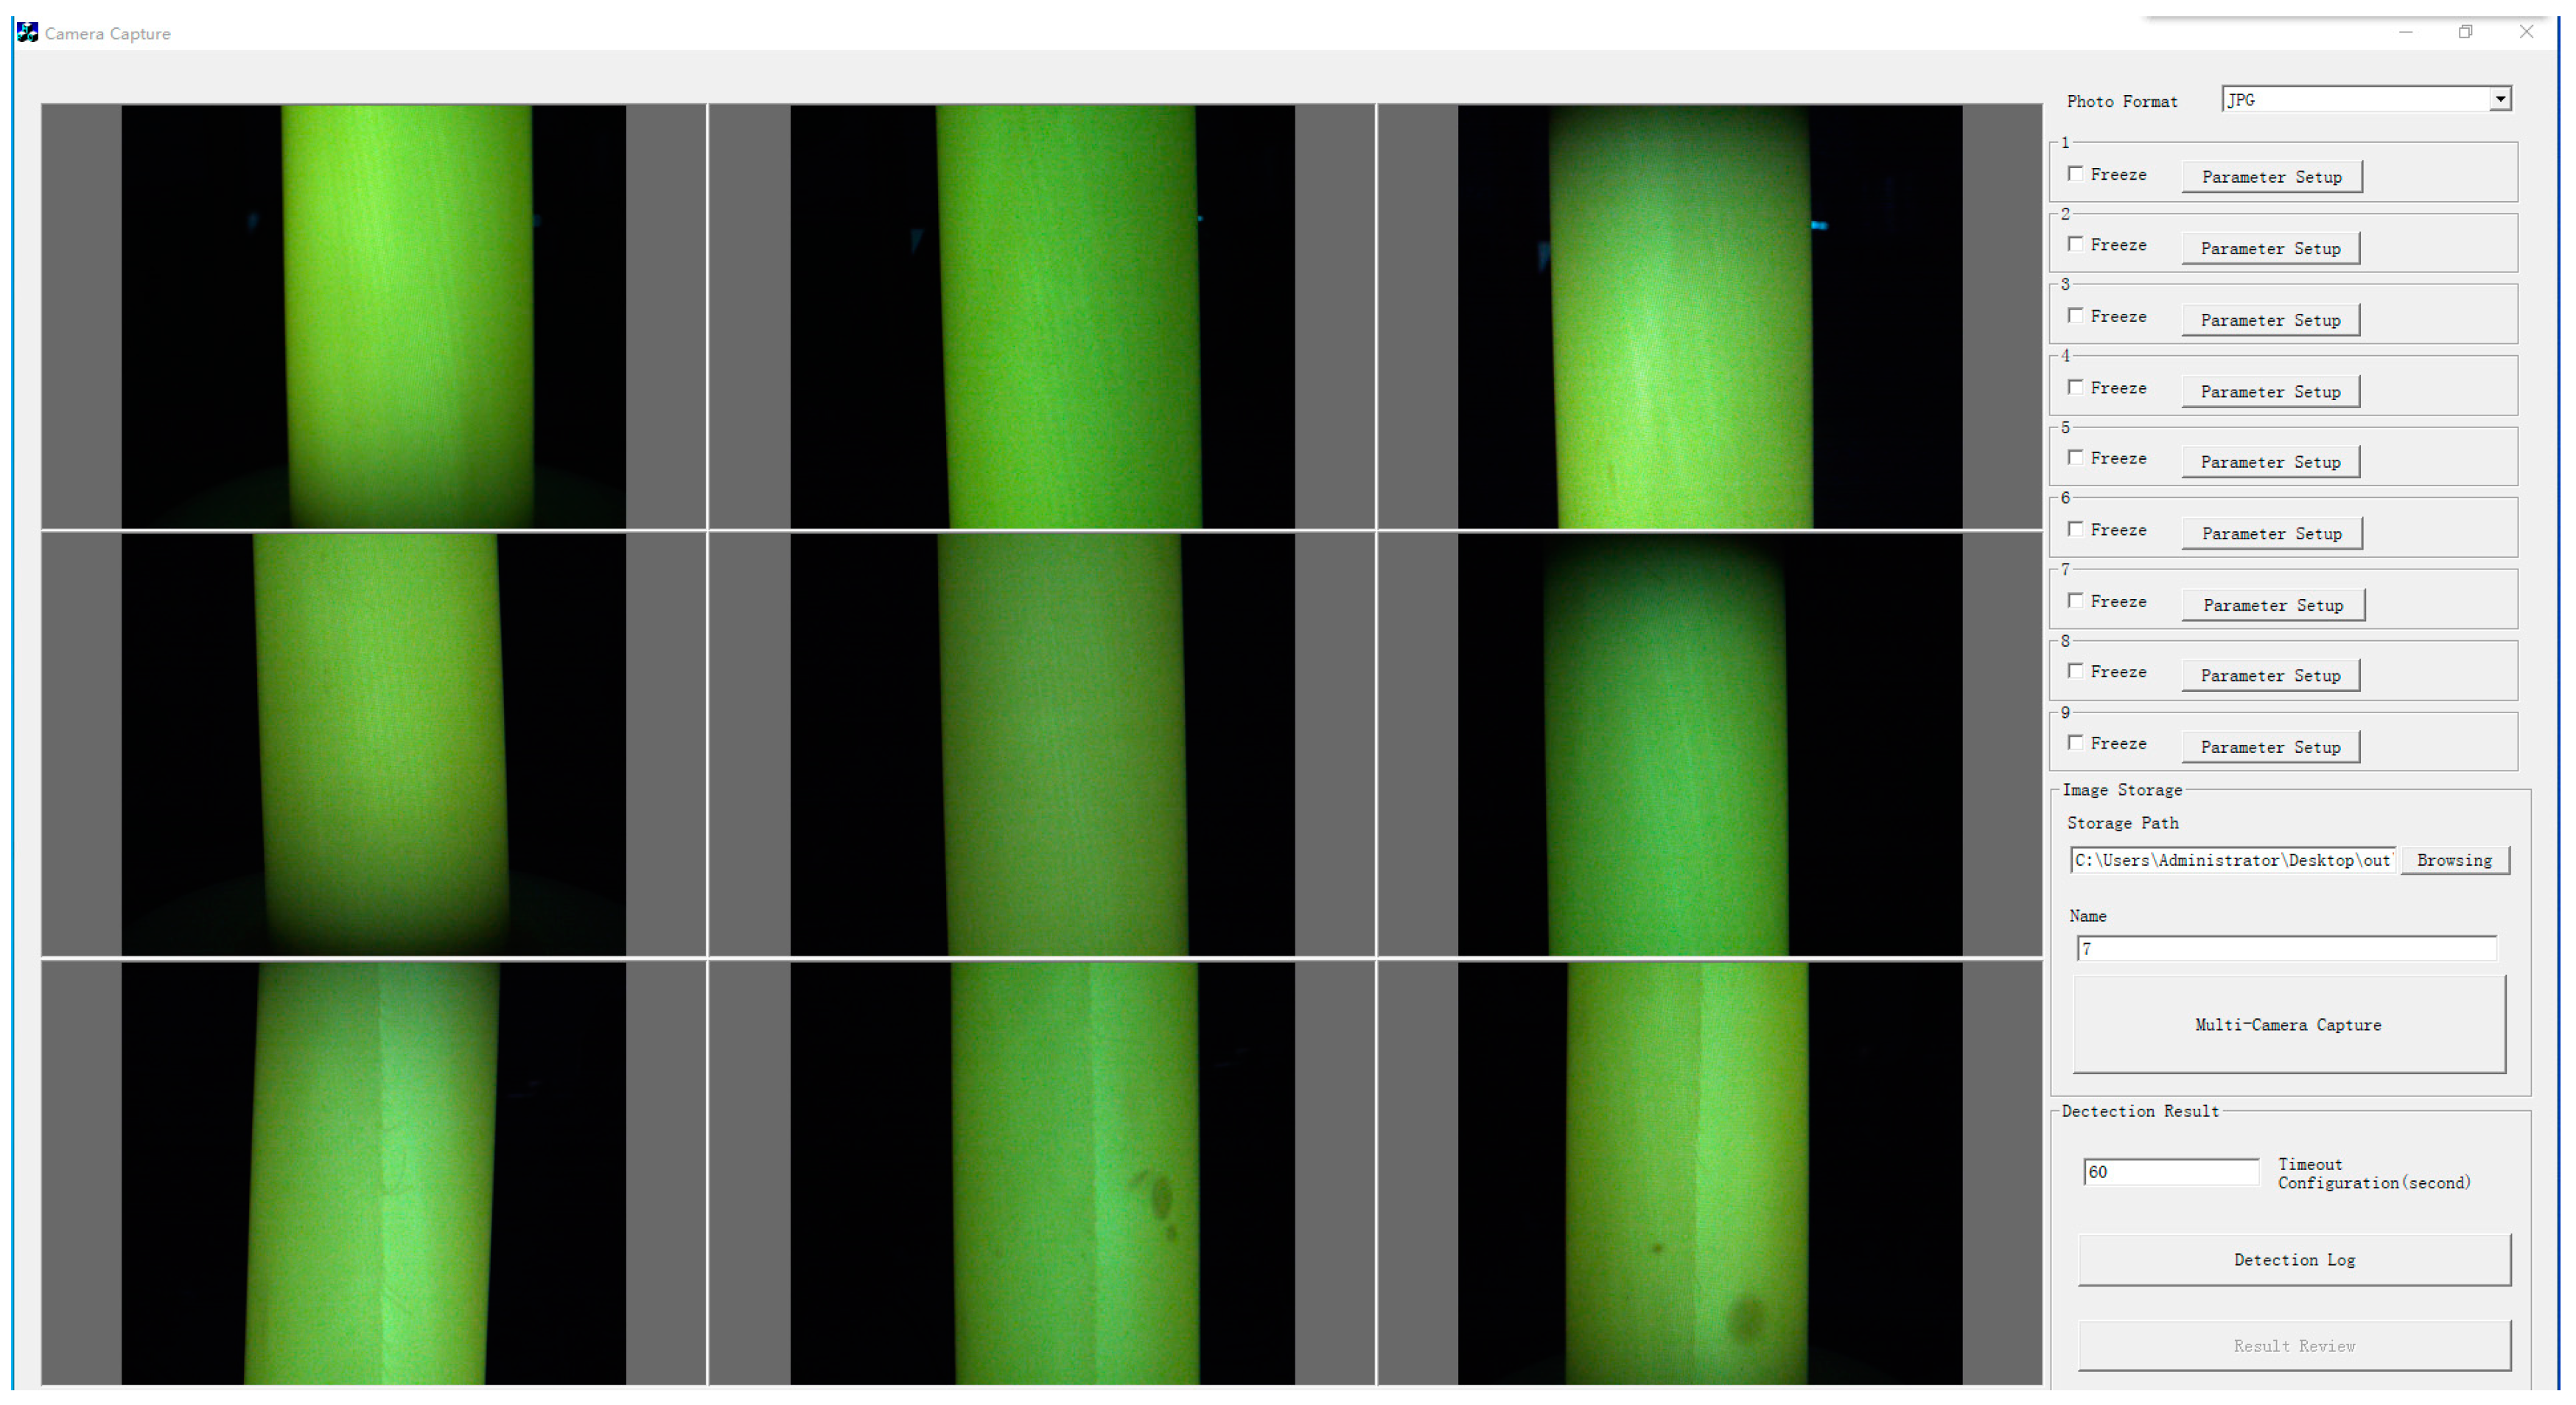
Based on the above research, the control interface for multiple cameras was developed using the built-in control software of high-definition industrial cameras. The graphical interface was developed using C++ language. In this control interface, clicking on control buttons triggers corresponding action events to adjust the parameters of each camera, capture images from each camera, and achieve synchronous shooting with multiple cameras. The control interface also displays the captured images from each camera in real time. The specific process is shown in
Figure 6.
Furthermore, to achieve rapid and accurate detection of insulation pull rod defects, the control interface for multiple cameras needs to be integrated with the YOLOv5 detection program. First, a web application is built using the Flask framework. By sending a POST request to a Flask route and providing the paths for the input and output folders (i.e., the path of the images to be inspected after shooting and the storage path of the detection results after processing), the insulation pull rod defects detection model, obtained from training, is invoked to execute the detection program. When the “Multi-Camera Capture” button is clicked after entering the storage path of the captured images in the control interface, an action event for acquiring images of the rod to be inspected is triggered. This controls the synchronous operation of the nine industrial cameras in the device to simultaneously capture images of the entire insulation pull rod, storing the images in a specified folder. Next, clicking the “Detection Record” button triggers the execution of the insulation pull rod defects detection program. The storage path of the captured images entered before clicking the “Multi-Camera Capture” button is sent via a POST request through the Flask route, allowing the detection program to receive the path of the images to be inspected and the storage path of the output detection results and to execute the related detection commands. Therefore, after clicking the “Multi-Camera Capture” and “Detection Record” buttons, two subfolders are generated under the specified output image storage folder: “original” and “detect”, which store the original images of the insulation pull rod and the defect detection result images, respectively. Additionally, the “Detection Record” event is further developed to provide detailed records of the detection progress, detection results, detection details, and detection time under the corresponding detection record interface, which are saved after clicking the “Detection Record” button. The specific interface is shown in
Figure 7.
Therefore, during the actual operation of this device, the hardware acquisition system first captures images of the insulation pull rod to be inspected and stores the images in a designated folder. Then, the storage address of the images to be inspected is transmitted to the insulation pull rod defects detection program via a POST request, invoking the pre-trained insulation pull rod defects detection model to detect defects in the input images. Finally, the detection results are output to the specified folder. This process achieves the efficient and accurate detection of insulation pull rod defects, meeting the quality inspection requirements for insulation pull rods in the actual production process.
4. Experiments and Results Analysis
4.1. Validation of the Effectiveness of the YOLOv5s Network
To validate the effectiveness of deep learning networks in the task of detecting insulation pull rod defects, and to demonstrate the advantages of the YOLOv5s network compared to other target detection algorithms in this context, this paper constructs an insulation pull rod defects dataset. The YOLOv5s network, along with commonly used target detection algorithms in the field of industrial defect detection—Faster R-CNN, SSD, and YOLOv4, are trained separately. The corresponding models obtained after training are tested on the test set, and the experimental results are compared.
Based on the 128 insulation pull rods containing four common types of defects (bubbles, white spots, cracks, and impurities) provided by a high-voltage switch company in Shandong, images were captured using a 5-megapixel high-definition industrial camera, resulting in 626 raw images of insulation pull rod defects. Using the Labelimg annotation tool, these four types of defects were labeled as “bubble”, “crackle”, “impurity”, and “white spot”, respectively. To ensure the stability of training and the generalization ability of the trained model, the dataset needed to be further expanded and diversified. Therefore, traditional data augmentation strategies (random rotation, flipping, scaling, sharpening, and color space transformation) combined with Mosaic data augmentation were applied to enhance the defect images. After augmentation, the original data capacity expanded to 3207 images, which were then divided into training and validation sets at a ratio of 9.5:0.5, resulting in a training set of 3042 images and a validation set of 165 images. Additionally, to fully validate the effectiveness and advantages of the YOLOv5s network in the task of insulation pull rod defects detection, 170 more raw images of insulation pull rod defects were taken outside the training and validation sets, and the defect areas were annotated. Random rotation, flipping, sharpening, and scaling were used to augment these raw images, establishing a corresponding test set with a capacity of 594 images.
Furthermore, this paper utilizes the insulation pull rod defects dataset to train Faster R-CNN, SSD, YOLOv4, and YOLOv5s networks separately and tests the corresponding models obtained after training on the test set to compare their detection performance. To ensure the stability of each network’s training and the performance of the trained models, we primarily used the preset parameters provided by the official sources during the experiments. Considering the memory requirements of the hardware equipment (NVIDIA GeForce RTX3060 (8G)) used in the experiments, we set the number of epochs to 300 and the batch size to 8. Additionally, each network was initialized with the respective pre-trained weights obtained from training on large public datasets. To prevent duplicate data augmentation of the defect images, the Mosaic data augmentation operation in the YOLOv4 and YOLOv5s networks was disabled.
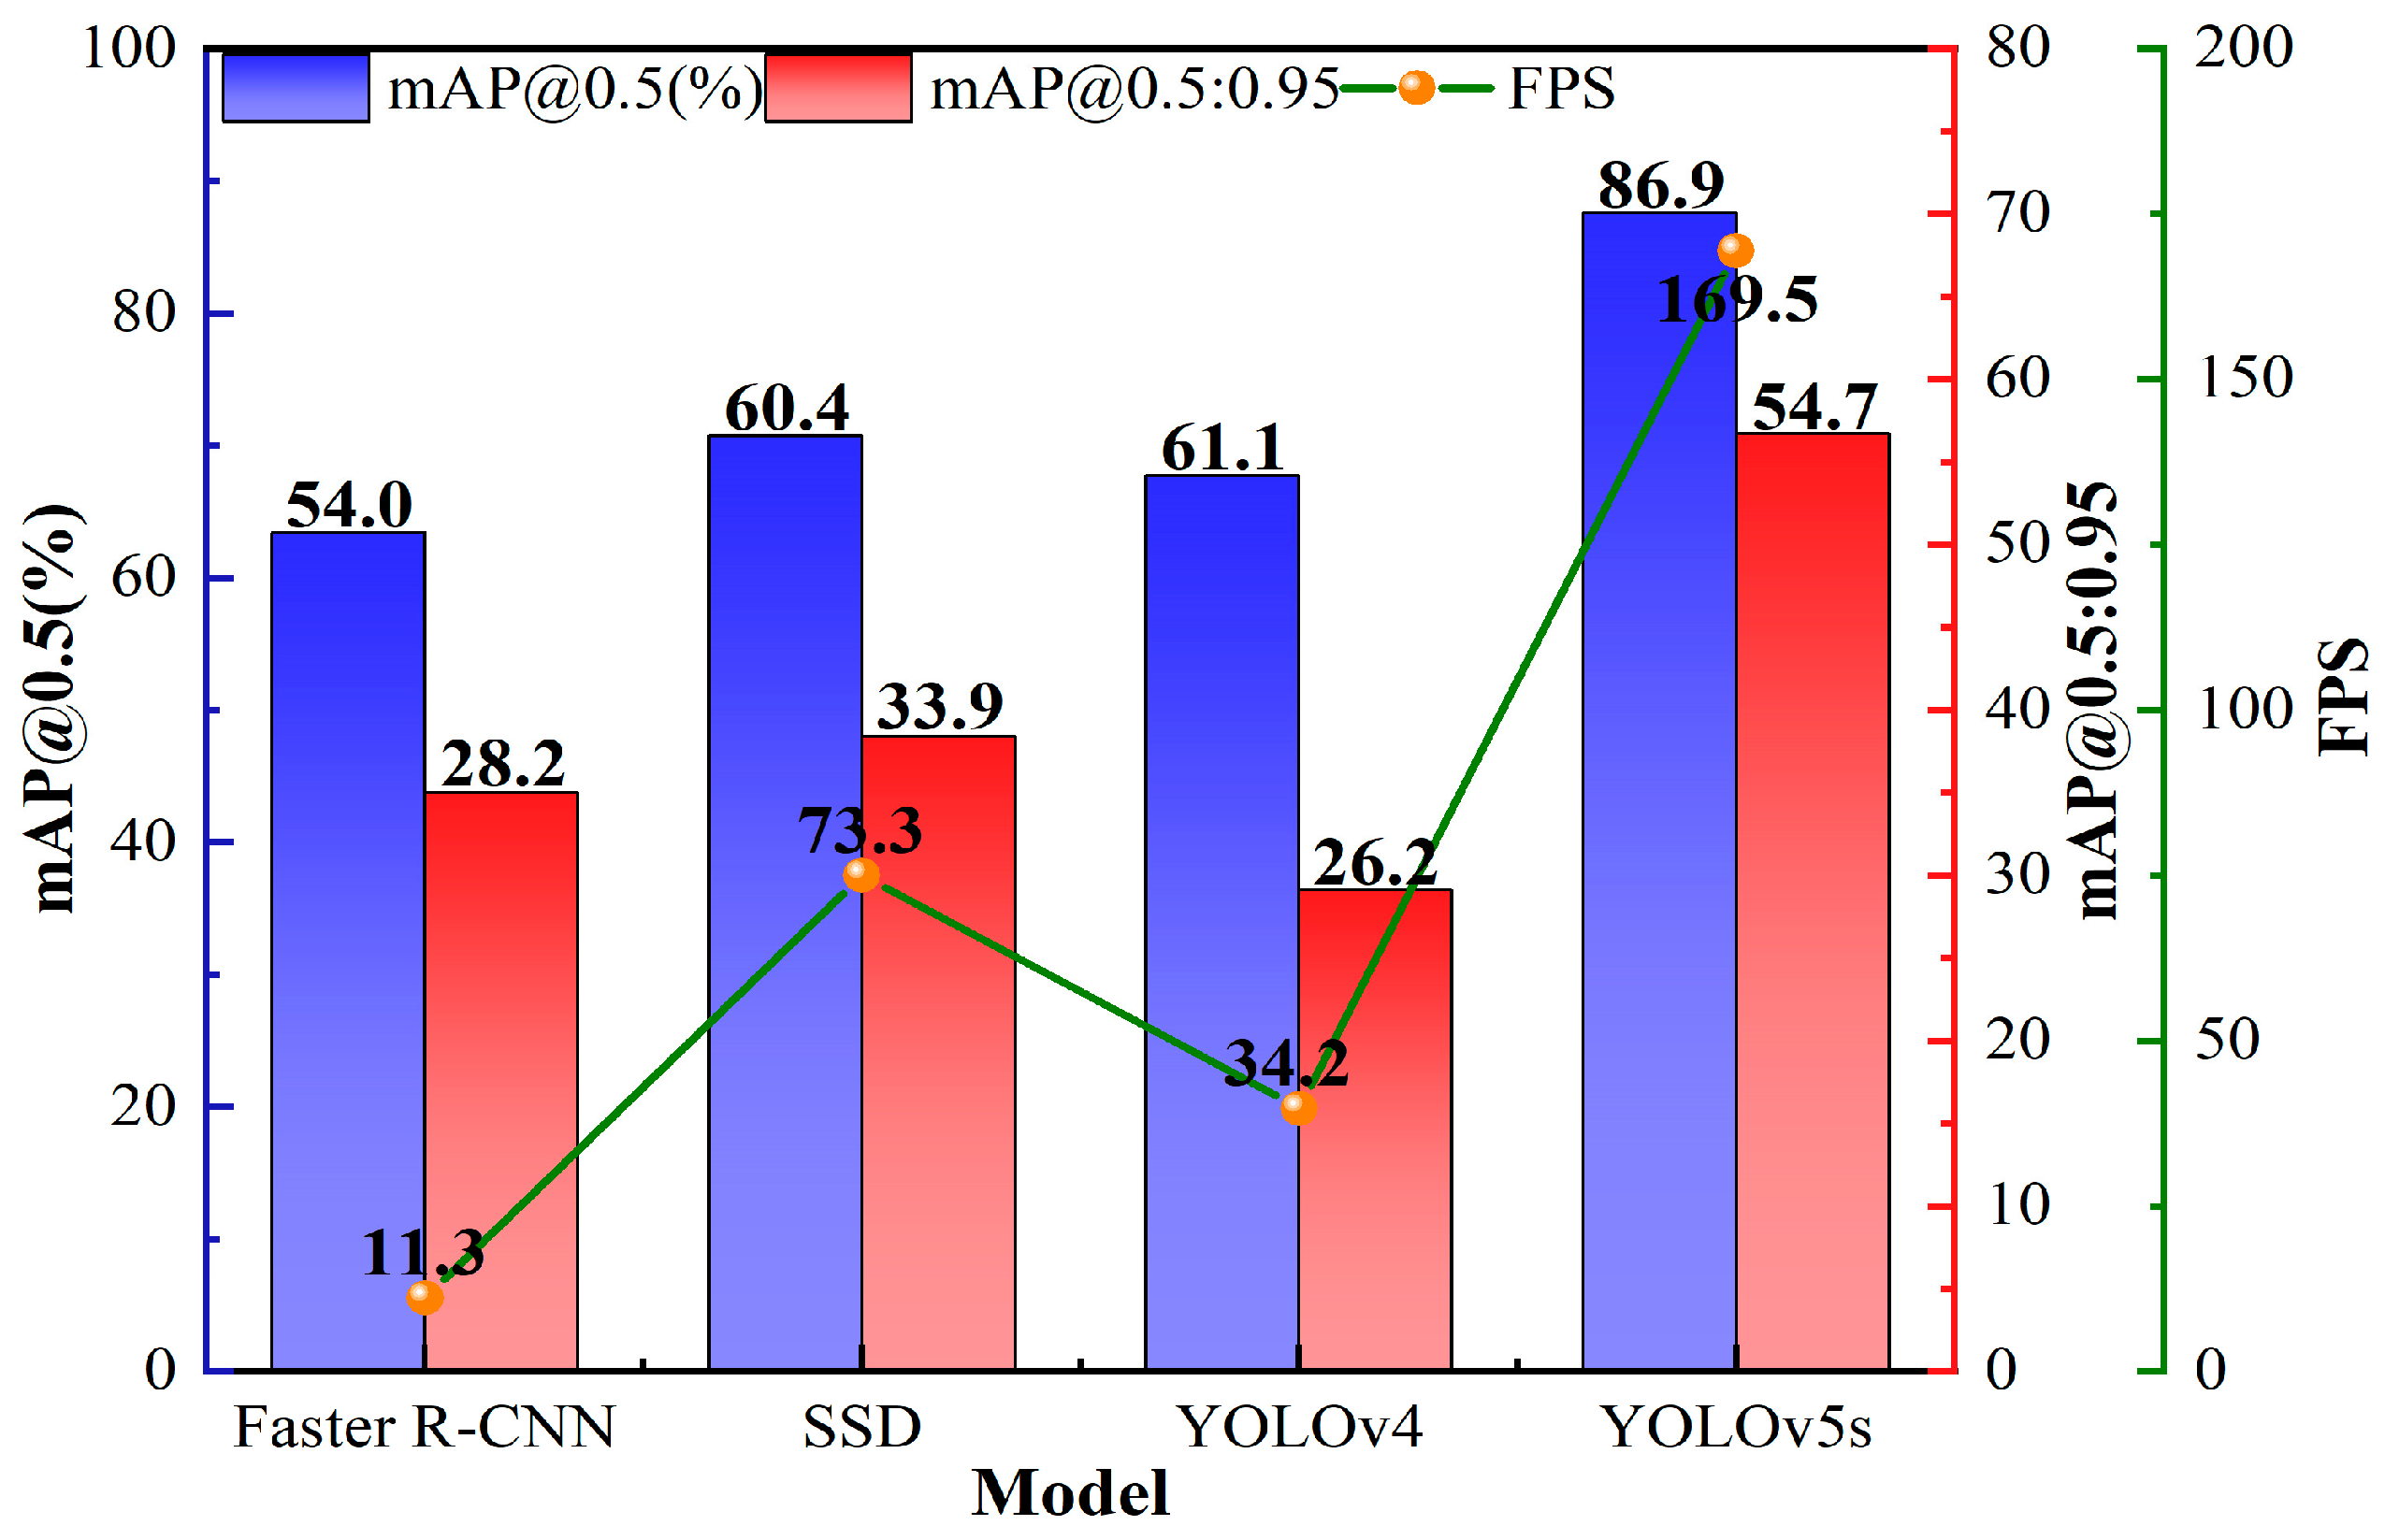
Furthermore, when comparing the detection performance of each model trained on insulation pull rod defects, to meet the quality inspection requirements before rod shipment, this paper provides the Average Precision (AP) for each type of defect and the mean Average Precision (mAP) across all four defect types as evaluation metrics for the detection accuracy of insulation pull rod defects. The FPS (frames per second) is used to describe the detection speed of each network for insulation pull rod defects. AP@0.5 represents the AP value when the IoU threshold is 0.5, and AP@0.5:0.95 represents the average of all AP values when the IoU threshold increases from 0.5 to 0.95 in increments of 0.05. Similarly, mAP has the same threshold meaning. The experimental results of the models trained on the test set are shown in
Table 1. For ease of analysis, the data from
Table 1 were visualized to display the detection results of the four models on the test set.
From
Table 1 and
Figure 8, it is evident that both the Average Precision (AP) for each type of defect and the mean Average Precision (mAP) across all four defect types indicate a significant superiority of the YOLOv5s network over the other three target detection algorithms. Specifically, the mAP@0.5:0.95 is 0.547, and the mAP@0.5 reaches 0.869. Moreover, the YOLOv5s network demonstrates a notably higher detection accuracy (mAP@0.5) for bubbles, white spots, and crack defects, all exceeding 0.85, compared to the other three networks. Additionally, for small target defects like impurities, the YOLOv5s network also outperforms the other three networks by a large margin. Furthermore, according to
Table 1, it is evident that the YOLOv5s network exhibits a significantly higher detection speed for insulation pull rod defects compared to the other three networks, with a FPS value of 169.5, indicating an inference of approximately 170 insulation pull rod images per second.
In conclusion, the YOLOv5s network is better suited for insulation pull rod defect detection tasks, exhibiting significant improvements in both detection accuracy and speed compared to traditional target detection networks.
4.2. Instantiation Validation of the Insulation Pull Rod Defect Intelligent Detection Device
Building upon the aforementioned research, to instantiate the application of deep learning networks in the task of insulation pull rod defect detection and, concurrently, to further validate the effectiveness and advantages of the YOLOv5s network in this task, we utilized the insulation pull rod defect intelligent detection device developed in this study in combination with the models trained on the aforementioned networks. By executing the image hardware acquisition device and defect detection program in parallel, we achieved the instantiation application of deep learning networks.
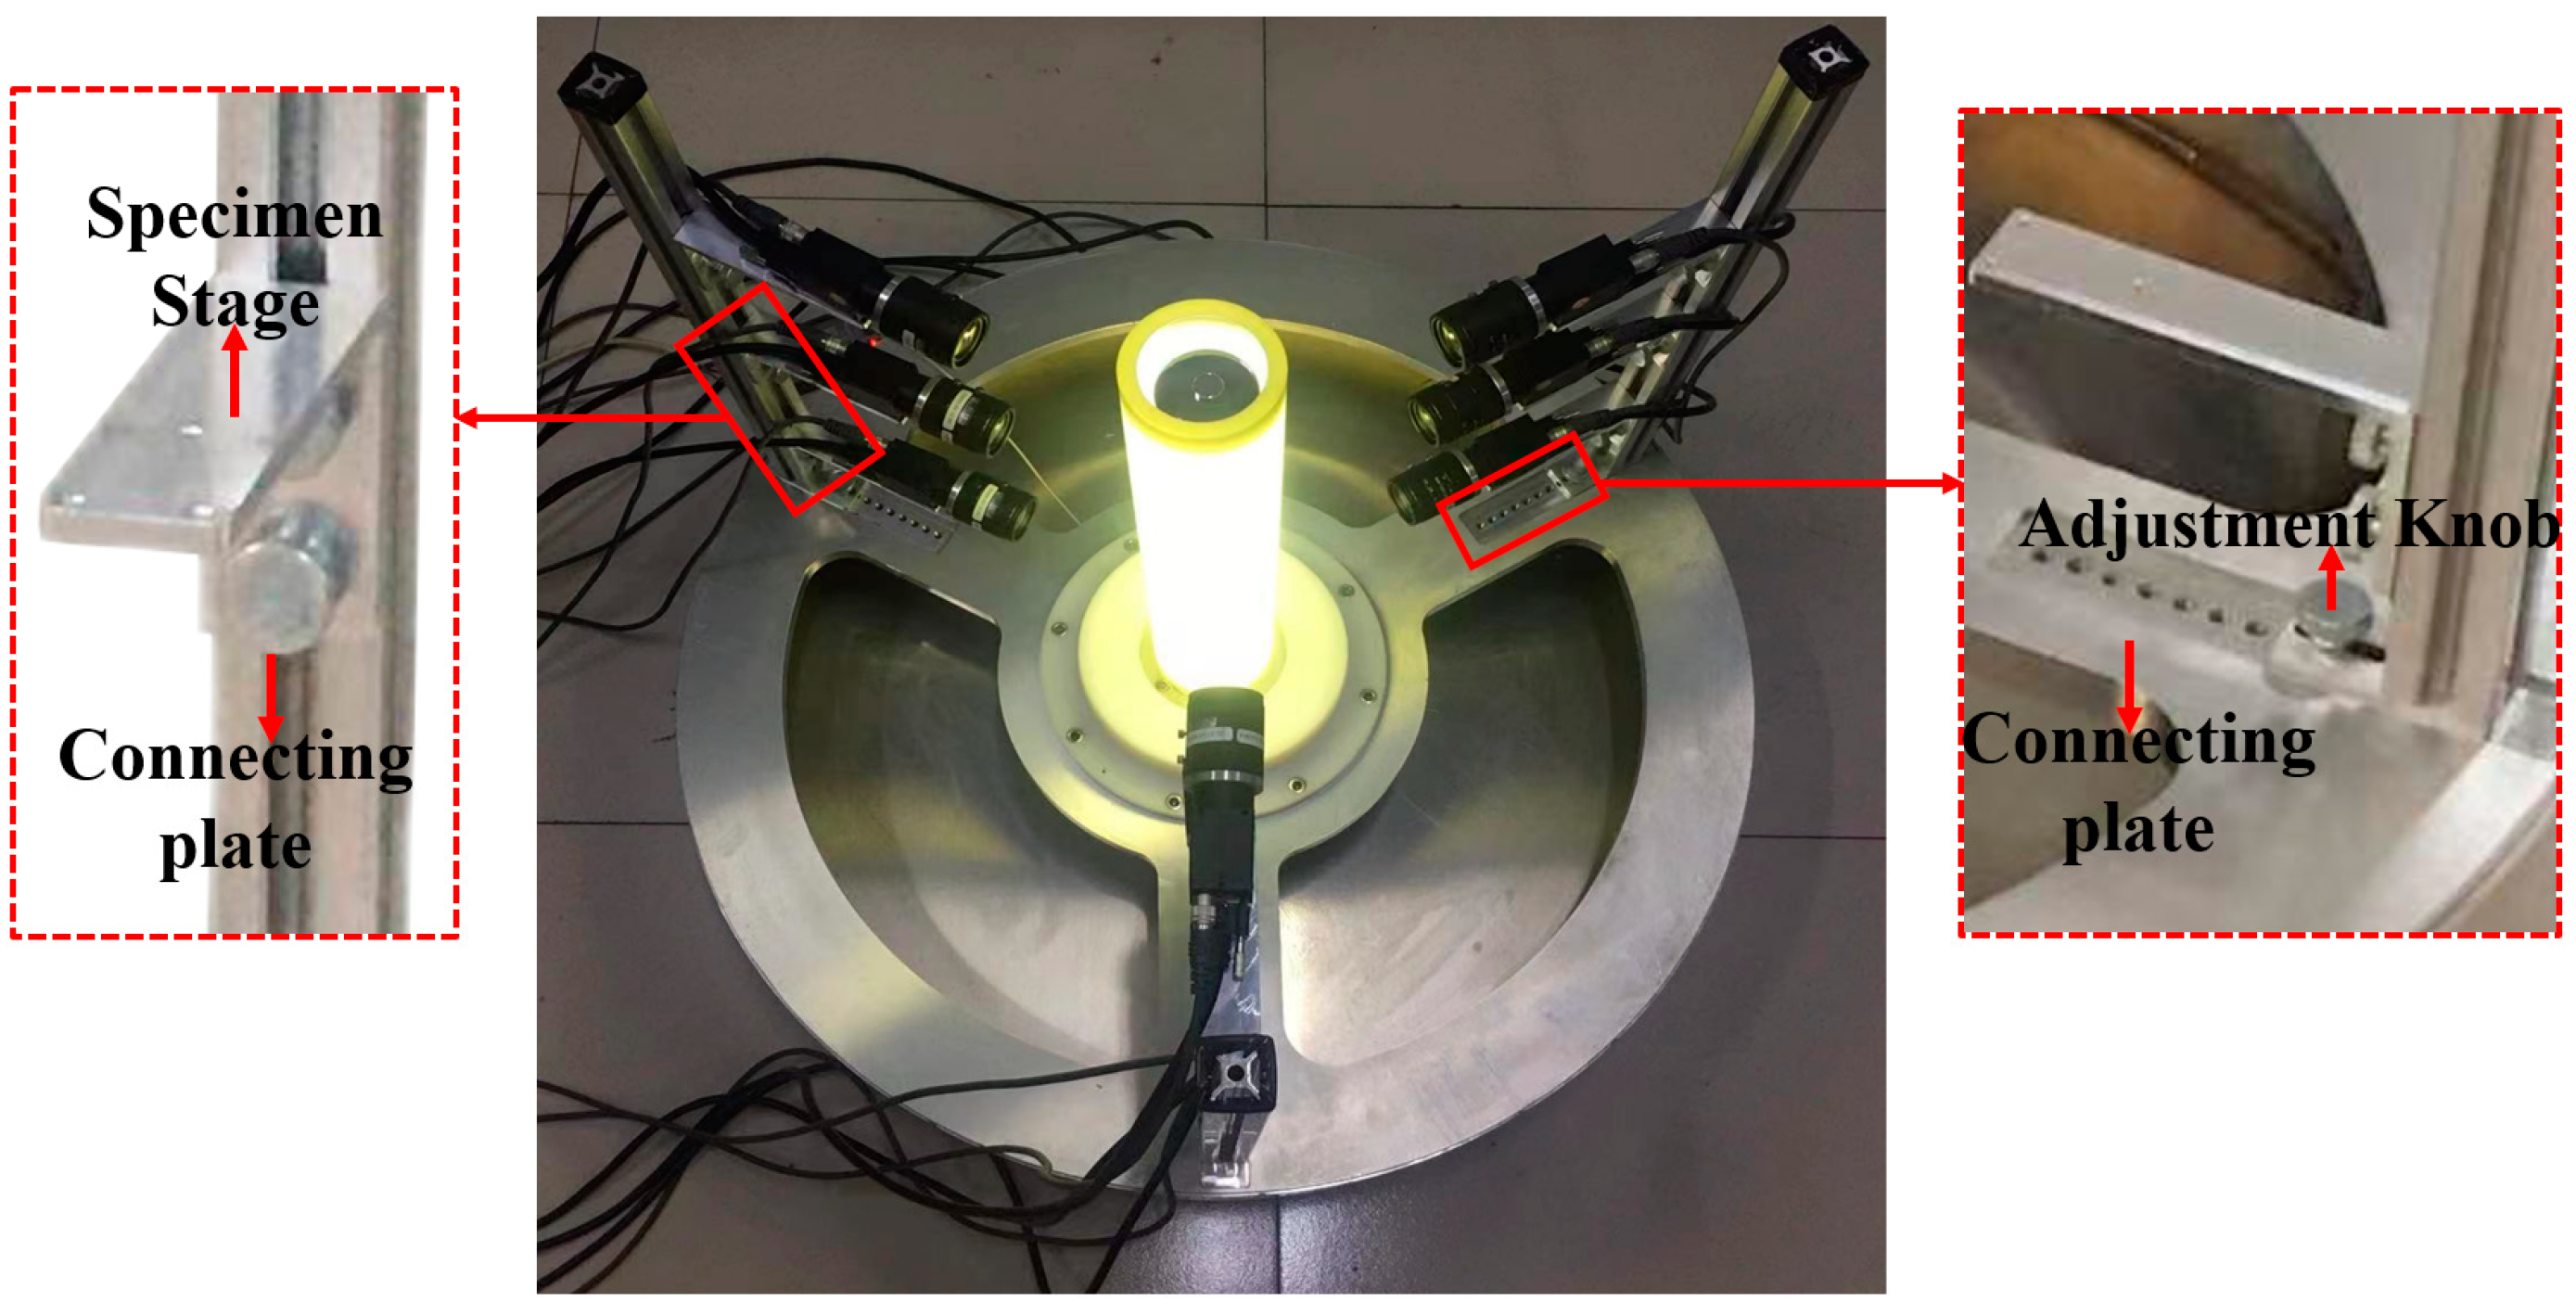
First, adjust the position of the camera bracket on the connecting plate by using the adjustment knob at the bottom of the bracket within the device, thereby modifying the shooting distance between the camera bracket and the rod sample to ensure it is within the appropriate range. Next, use the adjustment knob at the bottom of the camera stage to change the distance between multiple cameras on the bracket, thus achieving full-area image acquisition of the rod under inspection, as shown in
Figure 9. Place the rod under inspection so that the lamp tube runs through its interior. Using the control interface of the intelligent insulation pull rod defect detection system, control nine cameras simultaneously to capture images of the rod and invoke the pre-trained model to detect defects in the collected images synchronously. This method integrates the insulation pull rod hardware image acquisition device with the defect detection program and compares the detection performance of different networks by using the models trained with the four different networks described in this paper.
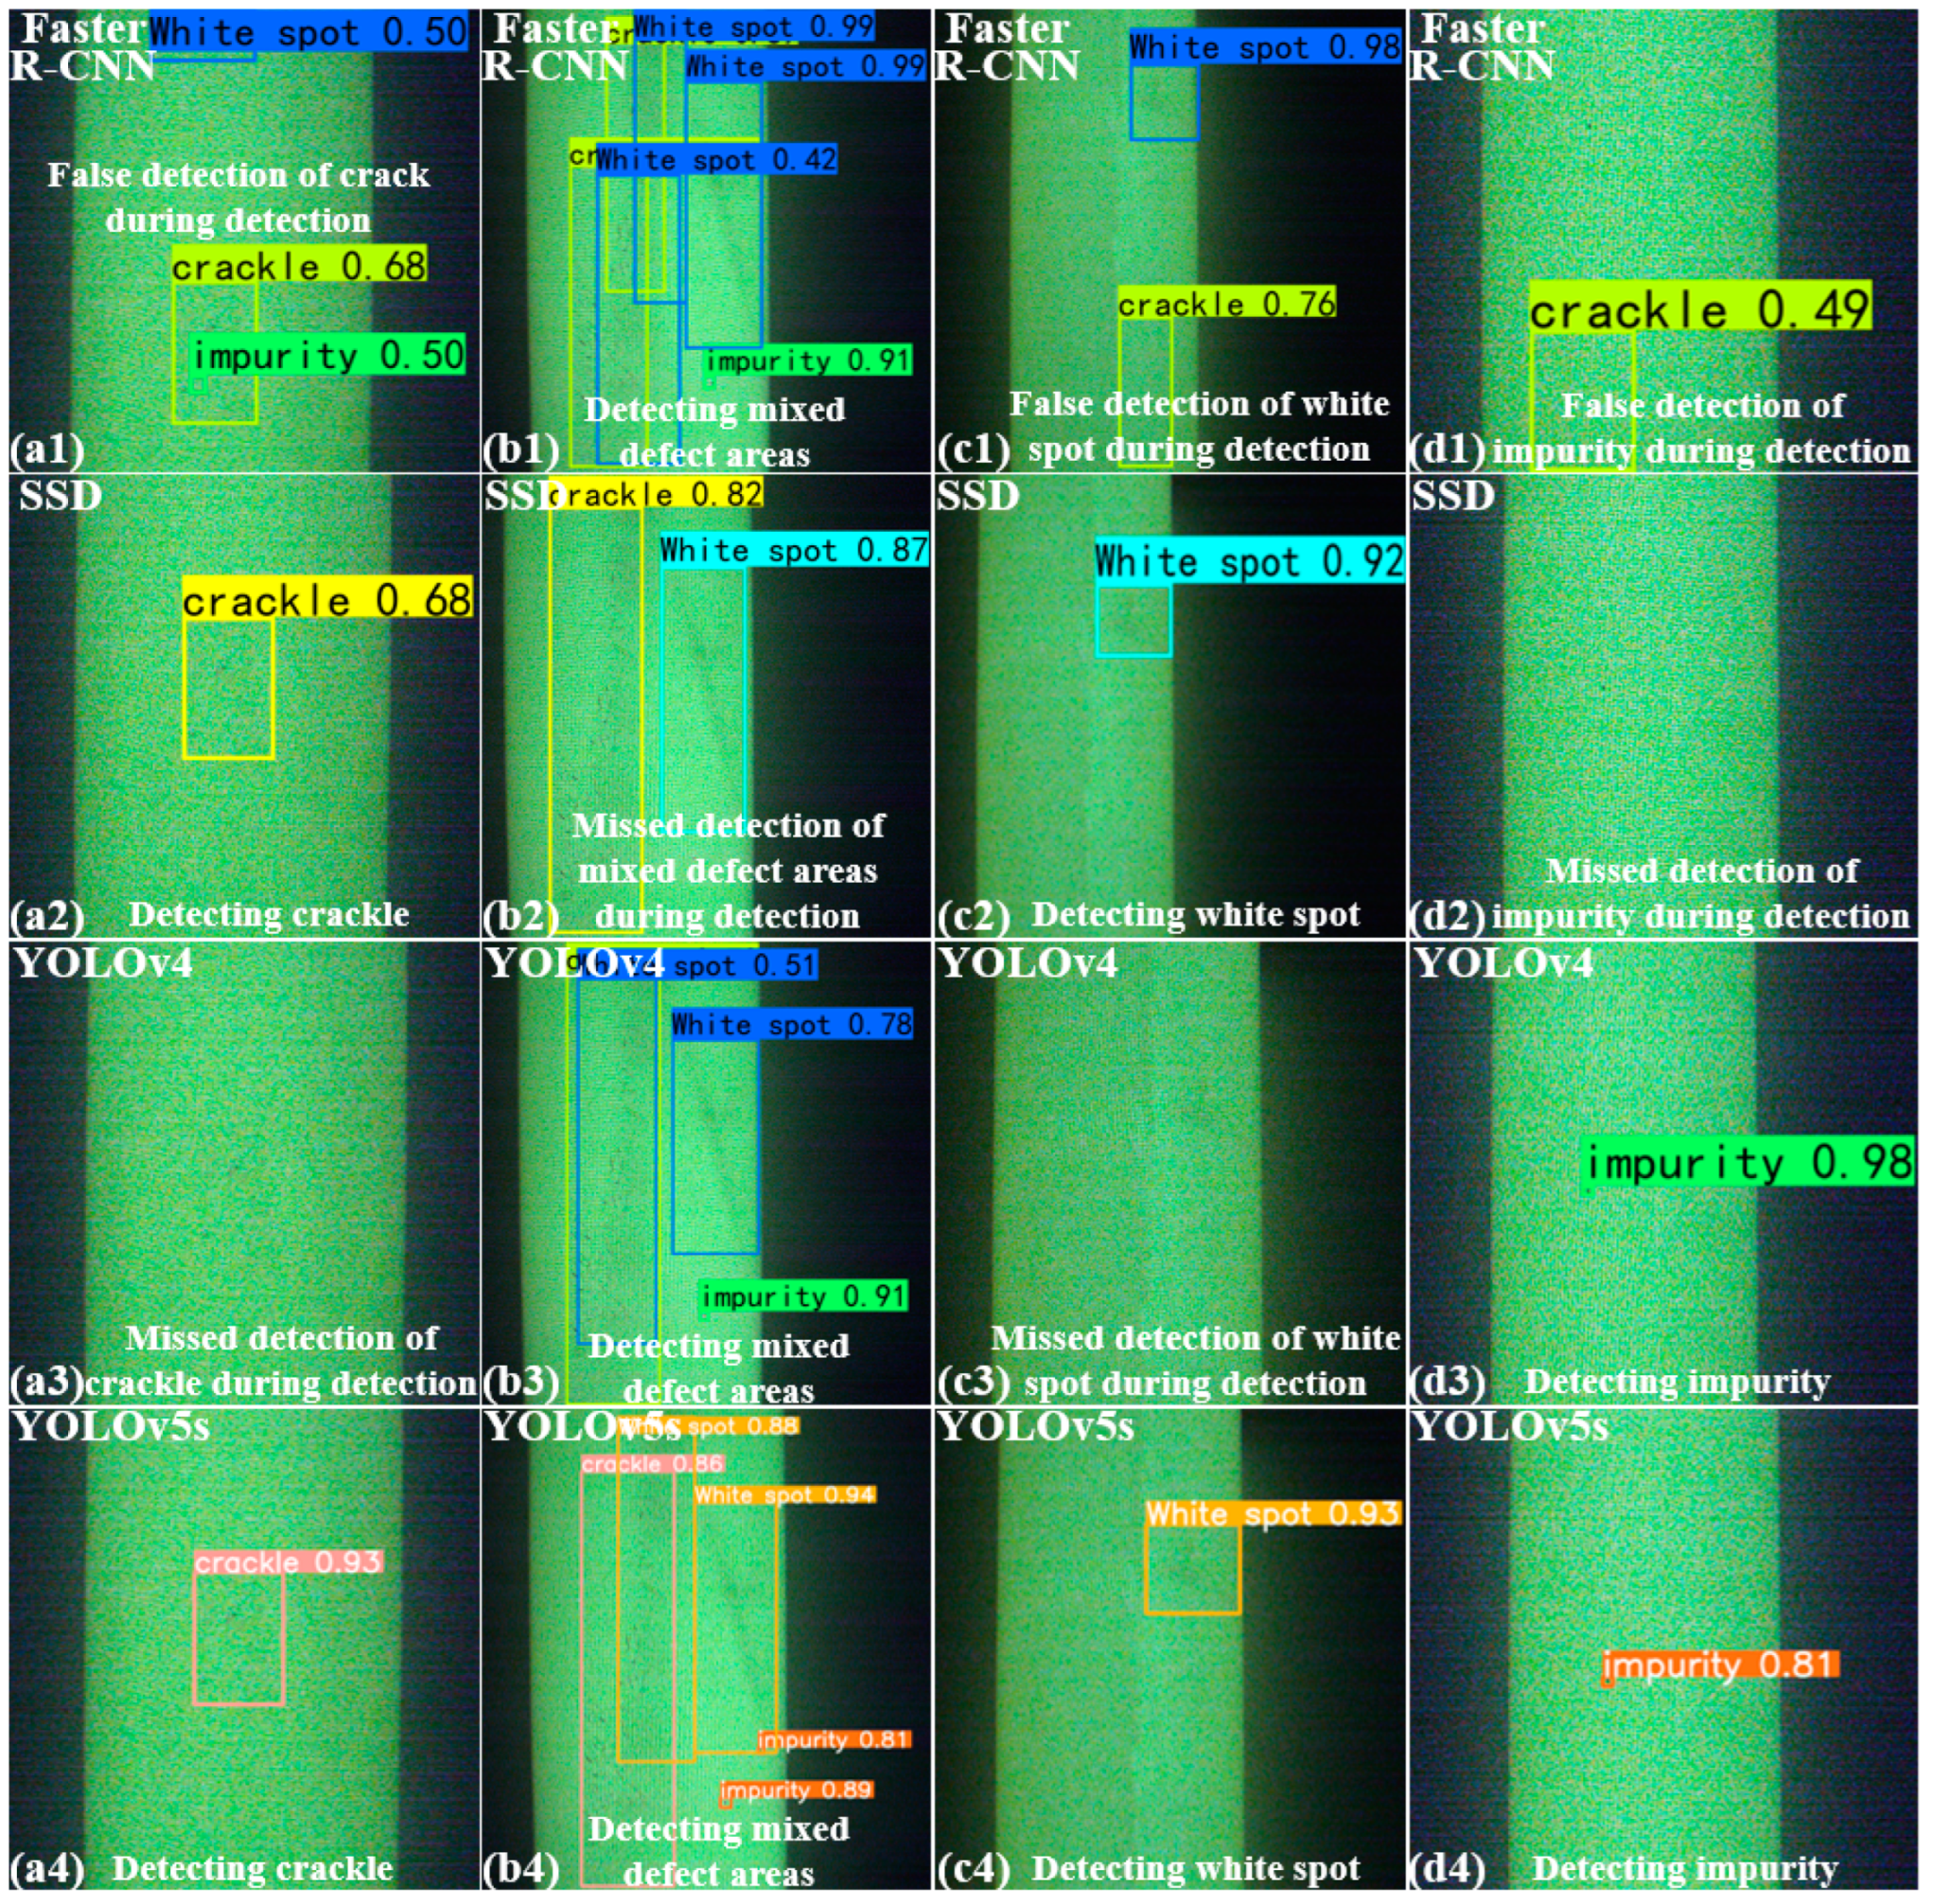
To comprehensively evaluate the detection performance of the networks, insulation pull rods with small region defects, inconspicuous defects, and mixed defect regions were selected for inspection.
Figure 10 visualizes the detection results of the four pre-trained models of the insulation pull rod defect intelligent detection device as described above. It is evident from
Figure 10 that the model trained on the YOLOv5s network exhibits the best detection performance. Whether it is an inconspicuous defect or a mixed defect region, this model accurately delineates the defects under inspection, thus successfully realizing the instantiation application of deep learning networks in the task of insulation pull rod defect detection. Additionally, the prediction confidence of YOLOv5s is higher. Conversely, the other three models often exhibit missed detections or false alarms for the same defect region, further indicating that the YOLOv5s network outperforms the others in detecting insulation pull rod defects.
5. Conclusions
Given the subjectivity and tendency for missed detections, false alarms, and difficulty in preserving detection results in the current insulation pull rod defect detection methods, this study investigates the feasibility of deep learning networks in the task of insulation pull rod defects detection. Additionally, it constructs a defect intelligent detection device based on deep learning networks and establishes an insulation pull rod defect detection system by combining the models obtained from training the YOLOv5s network. Based on the aforementioned work, the following conclusions are drawn:
(1) The use of deep learning networks enables the rapid and accurate detection of insulation pull rod defects. Compared to traditional object detection algorithms, YOLOv5s demonstrates superior detection performance. It achieves a mAP@0.5 of 0.869, mAP@0.5:0.95 up to 0.547, and a FPS of 169.5, meeting the requirements for fast and accurate detection in practical production scenarios.
(2) The insulation pull rod defect intelligent detection device constructed based on the YOLOv5s network effectively addresses challenges such as the inefficiency of visual inspection methods, providing new insights for insulation pull rod defect detection.
Additionally, based on the experimental results, it is evident that the original deep learning network exhibits low accuracy and poor performance in detecting impurity defects in insulation pull rods. To address these issues, future research must tackle the following challenges: First of all, investigate and design a robust feature extraction network for insulation pull rod defects that effectively captures both global and local details in the feature maps while minimizing the loss of information during feature fusion, and develop effective data augmentation strategies to enhance the quality of insulation pull rod images, which often suffer from poor image quality and significant background noise. These strategies should aim to expand and diversify the dataset while ensuring the network can effectively extract features from the defect regions.
Author Contributions
Conceptualization, H.Y., S.N.; methodology, X.W.; software, S.L., G.Y.; validation, H.L.; formal analysis, H.Y.; investigation, X.F.; resources, X.F.; data curation, H.Y., S.N.; writing—original draft preparation, H.Y.; writing—review and editing, C.L.; project administration, S.N.; funding acquisition, S.N. All authors have read and agreed to the published version of the manuscript.
Funding
This work was supported by the State Grid Corporation Headquarters Technology Project (under grant no. 520530230017).
Data Availability Statement
The data supporting the findings of this study are available from the corresponding author upon reasonable request due to the difficulty in obtaining experimental data.
Conflicts of Interest
The authors declare no conflict of interest.
References
- Niu, S.; Li, S.; Liang, J.; Li, G.; Hu, F.; Zhang, H.; Zhu, Y.; Fan, X.; Li, C. Simulation and Characterization of Micro-Discharge Phenomena Induced by Glitch Micro-Defects on an Insulated Pull Rod Surface. Energies 2024, 17, 2594. [Google Scholar] [CrossRef]
- Zhao, R.Y.; Chen, Y.; Li, J.; Liu, S.; Wang, Y.; Aung, H.H.; Kong, X.; Du, B. Interface damage driven electrical degradation dynamics of glass fiber-reinforced epoxy composites. Compos. Sci. Technol. 2023, 233, 109921. [Google Scholar] [CrossRef]
- Jin, S.F.; Cheng, J.W.; Tian, H.D.; Xie, Z.; Wu, Z.; Peng, Z. Simulation analysis of internal defects in GIS disconnector on electric field of pull rod. In Proceedings of the 2020 IEEE International Conference on High Voltage Engineering and Application (ICHVE), Beijing, China, 6–10 September 2020; pp. 1–4. [Google Scholar]
- Liu, P.; Wu, Q.; Wang, H.; Cui, B.; Wu, Z.; Chen, Y.; Yang, Y.; Peng, Z. Simulation test study on fatigue characteristics of circuit breaker insulation pull rod. IET Sci. Meas. Technol. 2022, 16, 491–502. [Google Scholar]
- Li, C.Y.; Zhu, Y.J.; Hu, J.; Li, Q.; Zhang, B.; He, J. Charge cluster triggers unpredictable insulation surface flashover in pressurized SF6. J. Phys. D Appl. Phys. 2020, 54, 015308. [Google Scholar] [CrossRef]
- Li, C.Y.; Hu, J.; Lin, C.J.; Zhang, B.; Zhang, G.; He, J. Surface charge migration and dc surface flashover of surface-modified epoxy-based insulators. J. Phys. D Appl. Phys. 2017, 50, 065301. [Google Scholar] [CrossRef]
- Fan, X.H.; Niu, S.; Luo, H.H.; Liang, J.; Liu, F.; Li, W.; Liu, W.; Gao, W.; Huang, Y.; Li, C.; et al. Photon counting technique as a potential tool in micro-defect detection of epoxy insulation pull rod in gas-insulated switchgears. High Volt. 2024, 9, 267–274. [Google Scholar] [CrossRef]
- Chen, Y.; Hou, C.Y.; Kong, X.X.; Wang, Y.; Wang, L.; Du, B. Effects of Different Defects on the Electric Field Distribution of Insulation Rod for GIS. In Proceedings of the 2023 IEEE 4th International Conference on Electrical Materials and Power Equipment (ICEMPE), Shanghai, China, 7–10 May 2023; pp. 1–4. [Google Scholar]
- Khan, Q.; Refaat, S.S.; Abu-Rub, H.; Toliyat, H.A. Partial discharge detection and diagnosis in gas insulated switchgear: State of the art. IEEE Electr. Insul. Mag. 2019, 35, 16–33. [Google Scholar] [CrossRef]
- Li, T.H.; Pang, X.H.; Jia, B.Y.; Xia, Y.; Zeng, S.; Liu, H.; Tian, H.; Lin, F.; Wang, D. Detection and diagnosis of defect in GIS based on X-ray digital imaging technology. Energies 2020, 13, 661. [Google Scholar] [CrossRef]
- Zhang, X.L.; Cheng, L.; Liu, Y.F.; Tao, B.; Wang, J.; Liao, R. A review of non-destructive methods for the detection tiny defects within organic insulating materials. Front. Mater. 2022, 9, 995516. [Google Scholar] [CrossRef]
- Zhang, X.B.; Luo, G.F. Defect detection method of GIS insulation pull rod based on industrial CT. Nondestruct. Test. 2022, 44, 17–21. [Google Scholar]
- Xue, R.D.; Chen, Y.; Han, X.C.; Tao, B.; Wang, J.; Liao, R. Defect Detection and Recognition of Insulation Pull Rod Based on the Ultrasonic Method. In Proceedings of the 2022 IEEE 4th International Conference on Dielectrics (ICD), Palermo, Italy, 3–7 July 2022; pp. 417–420. [Google Scholar]
- Ren, S.Q.; He, K.M.; Girshick, R.; Sun, J. Faster R-CNN: Towards real-time object detection with region proposal networks. IEEE Trans. Pattern Anal. Mach. Intell. 2017, 39, 1137–1149. [Google Scholar] [CrossRef] [PubMed]
- Liu, W.; Anguelov, D.; Erhan, D.; Szegedy, C.; Reed, S.; Fu, C.Y.; Berg, A.C. Ssd: Single shot multibox detector. In Proceedings of the European Conference on Computer Vision, Amsterdam, The Netherlands, 11–14 October 2016; pp. 21–37. [Google Scholar]
- Redmon, J.; Divvala, S.; Girshick, R.; Farhadi, A. You only look once: Unified, realtime object detection. In Proceedings of the IEEE Conference on Computer Vision and Pattern Recognition, Las Vegas, NV, USA, 27–30 June 2016; pp. 779–788. [Google Scholar]
- Bochkovskiy, A.; Wang, C.; Liao, H.M. YOLOv4: Optimal Speed and Accuracy of Object Detection. arXiv 2020, arXiv:2004.1093. [Google Scholar]
- Zhao, Z.B.; Zhen, Z.; Zhang, L.; Qi, Y.; Kong, Y.; Zhang, K. Insulator Detection Method in Inspection Image Based on Improved Faster R-CNN. Energies 2019, 12, 1204. [Google Scholar] [CrossRef]
- Kang, L.T.; Ge, Y.W.; Huang, H.; Zhao, M. Research on PCB defect detection based on SSD. In Proceedings of the 2022 IEEE 4th International Conference on Civil Aviation Safety and Information Technology (ICCASIT), Dali, China, 12–14 October 2022; pp. 1315–1319. [Google Scholar]
- Chen, W.; Huang, Z.T.; Mu, Q.; Sun, Y. PCB defect detection method based on transformer-YOLO. IEEE Access 2022, 10, 129480–129489. [Google Scholar] [CrossRef]
| Disclaimer/Publisher’s Note: The statements, opinions and data contained in all publications are solely those of the individual author(s) and contributor(s) and not of MDPI and/or the editor(s). MDPI and/or the editor(s) disclaim responsibility for any injury to people or property resulting from any ideas, methods, instructions or products referred to in the content. |
© 2024 by the authors. Licensee MDPI, Basel, Switzerland. This article is an open access article distributed under the terms and conditions of the Creative Commons Attribution (CC BY) license (https://creativecommons.org/licenses/by/4.0/).

 and
and 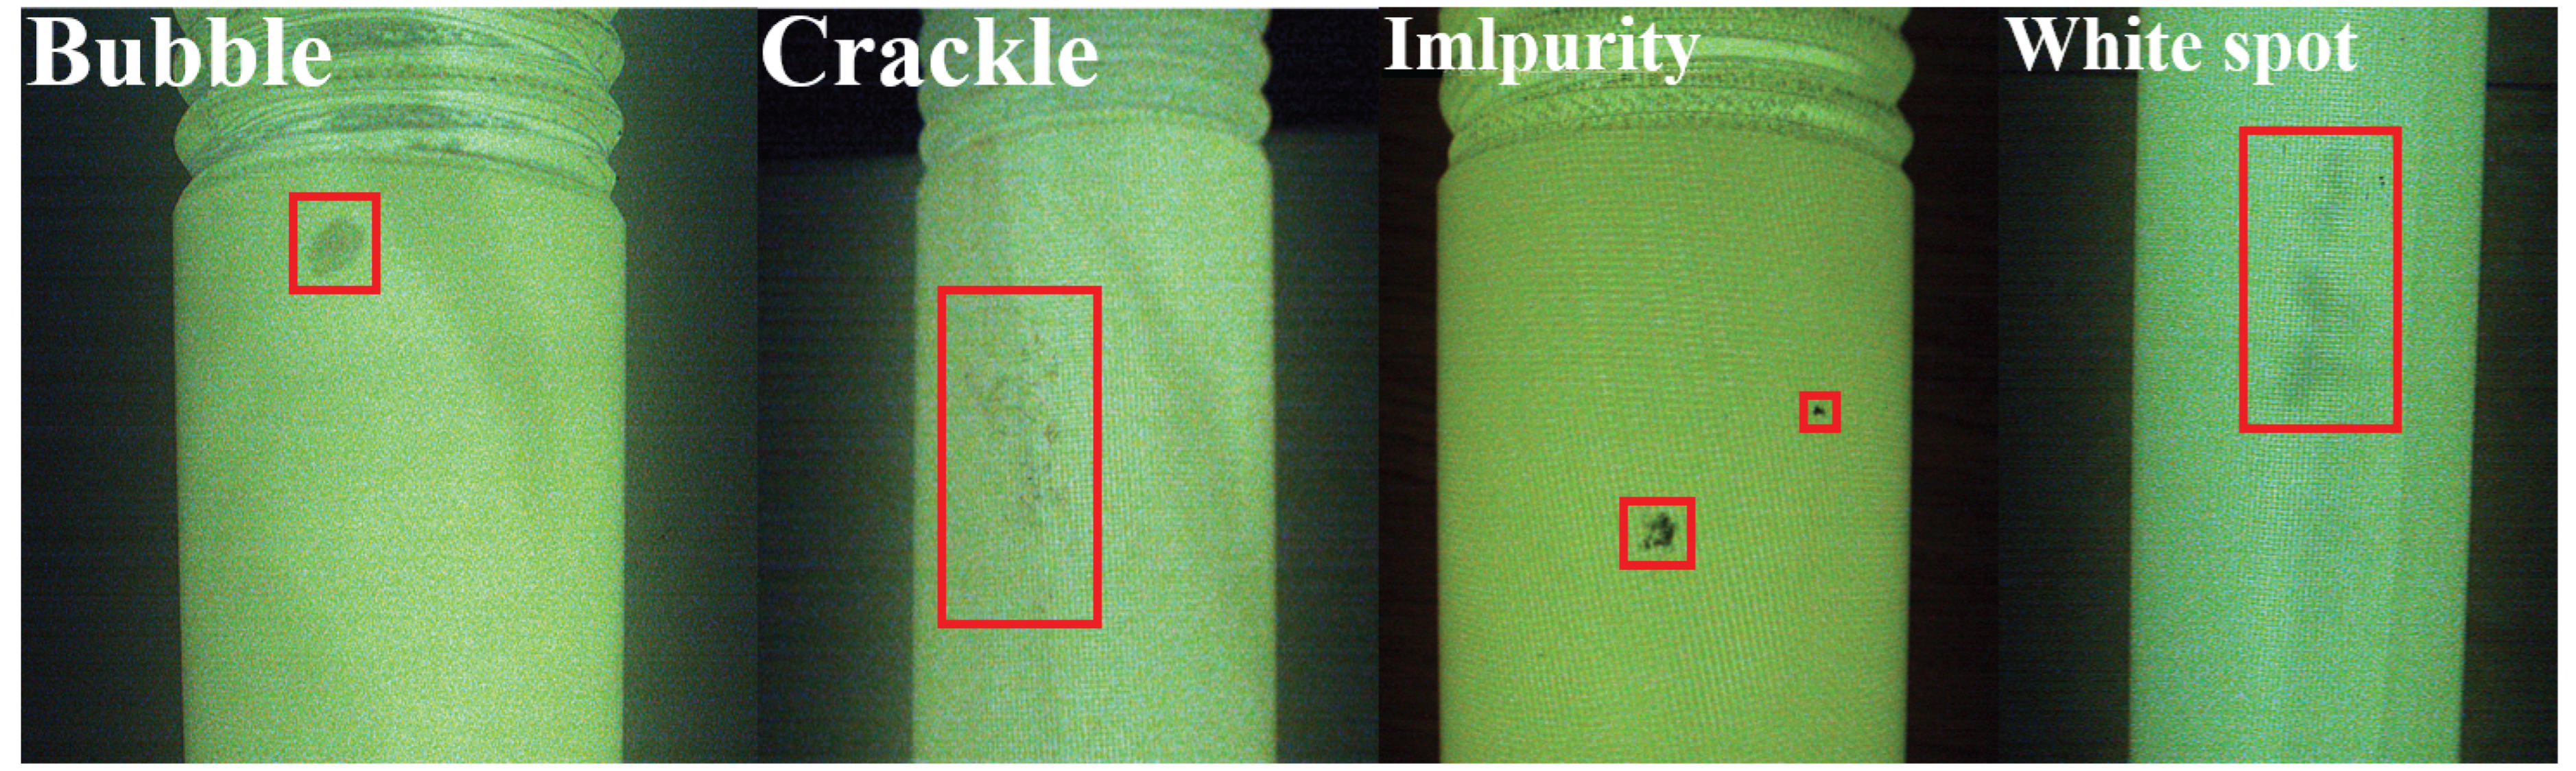

