Article

Process Modelling of Integrated Bioethanol and Biogas Production from Organic Municipal Waste

Department of Biotechnology, Faculty of Technology Novi Sad, University of Novi Sad, Bulevar cara Lazara 1, 21000 Novi Sad, Serbia
*
Author to whom correspondence should be addressed.
Energies 2024, 17(17), 4286; https://doi.org/10.3390/en17174286
Submission received: 19 July 2024 / Revised: 15 August 2024 / Accepted: 24 August 2024 / Published: 27 August 2024

Abstract

:
One of the key guidelines in the European waste management policy is the diversion of waste from landfills, preventing harmful effects on human health and the environment and ensuring that economically valuable waste materials are efficiently recycled and reused through proper management. The organic fraction of municipal waste is abundant and contains biodegradable ingredients such lignocellulose, starch, lipids, pectin, and proteins, making it suitable for biotechnological production. Taking into account that a large amount of organic waste is disposed of in landfills, within this work, the amount of organic waste disposed of in the landfill in Banja Luka was considered. Four simulation model scenarios of the integrated production of bioethanol and biogas are generated, and their process and economic aspects are discussed. In the first two modelled scenarios, the pretreatment conditions (1% sulfuric acid and a different neutralization agent) were varied, while in the other two, the share of the amount of raw material used for the production of bioethanol, i.e., biogas, was varied (split factor: 10–90%). The modelled plant, with a designed capacity of 6 tons/h of organic waste, is a significant bioethanol producer, generating 5,000,000 L/year. The profitability indicators, when examined, revealed that dedicating a portion of the organic municipal waste input exclusively to biogas production leads to decreased process efficiency. Based on the modeled process parameters, ethanol’s minimum feasible selling price is $0.6616 per liter, while regarding the composition of organic municipal waste, carbohydrates have the most significant impact on the viability of the process. The developed model represents an excellent basis for further development of this integrated bioprocess in such a way that it can be modified with new process parameters or economic or ecological indicators and used at all levels of bioprocess design. Additionally, the obtained sustainable integrated bioethanol and biogas production plant models could support forthcoming steps in municipal waste management by providing reliable data on the conditions under which the integrated process of bioethanol and biogas production would take place, as well as the technical feasibility and economic profitability of such organic municipal waste utilization.

1. Introduction

Population growth coupled with rising living standards lead to increased demands for energy and consumption of natural resources. Simultaneously, awareness of environmental protection issues and a strong interest in reducing the consumption of fossil fuels are also developing [1,2]. One of the main goals of the EU energy policy is to promote the use of renewable energy sources to reduce GHG emissions and ensure energy supply, reducing dependence on fossil fuels. The revised Renewable Energy Directive [3] sets an EU binding target of 42.5% share of renewable sources by 2030. According to the Framework Energy Strategy of Bosnia and Herzegovina (B&H) [4], harnessing the full potential of renewable energy sources is essential for achieving energy security of supply and creating sustainable development and a competitive energy sector. In addition, by signing the EU Green Agenda for the Western Balkans in 2020, B&H has been committed to transitioning to an economy and society with zero net greenhouse gas emissions by 2050. Waste management legislation in B&H is harmonized with EU directives, whereas it is still based exclusively on landfills. Unsuitable waste management may significantly endanger the environment and human health while reducing the potential for waste to be used as a resource [5,6].
Large amounts of generated waste, especially in urban areas, are detrimental to human health and the environment, resulting in increasingly strict requirements that regulate waste management. Waste to energy conversion is a crucial aspect of sustainable waste management, and the optimal treatment of waste depends on its origin and characteristics. Biodegradable waste can be used to obtain high-value products and energy, reducing the total amount of waste, environmental pollution, and space required for disposal [7,8,9]. The organic fraction of municipal waste has great potential for bioethanol and biogas production due to its availability in significant quantities and the presence of biodegradable materials, i.e., starch and cellulose have the potential to be converted into bioethanol, in contrast to lipids, proteins, and pectin, which can only be converted into biogas through anaerobic digestion, where a microbial consortium breaks down organic matters under an oxygen-depleted environment [10]. In recent decades, the organic fraction of municipal solid waste is used as feedstock for the production of bioethanol [11,12] and biogas [13,14], and additionally, there are studies of the integrated production of bioethanol and biogas from the organic fraction of municipal waste [15,16]. Additionally, integrated production of bioethanol and biogas from different raw materials such as sugar beets [17], food waste [18], triticale grain [19], and waste paper [20] has been studied. Furthermore, modeling and simulation of integrated production of bioethanol and biogas in SuperPro Designer software is presented in the studies in which different grains are used as feedstock [21,22]. However, research with modeling and simulation of integrated production of bioethanol and biogas from organic municipal waste (OMW) in SuperPro Designer software, to the best of the authors’ knowledge, is lacking.
SuperPro Designer is a process simulator specially developed for modelling and simulation of biotechnological processes [23] and is applied for techno-economic analysis of different bioprocesses and with different raw materials [14,24,25,26]. The use of modelling and simulation has great significance in bioprocess design and its development. It enables the prediction of different scenarios that may occur during the bioprocess, while during the design and development of the bioprocess and in transferring lab- and pilot-scale bioprocesses to the industrial level, it can substitute for experiments and help in decision-making [27,28,29]. Bioprocess simulation is a valuable tool for engineers and scientists, as it allows for the interpretation of results, analysis of the entire process, prioritization of issues, and guidance for research efforts. Additionally, simulation helps in identifying the most important areas for improvement as well as elimination of alternatives with little cost-effective potential [30].
According to data from the Statistical Office of B&H, in 2023, B&H generated 1.2 million tons of municipal waste [31], and almost 40% of the total amount of municipal waste is organic waste [32]. Due to its availability and abundance, organic municipal waste could have great potential as feedstock in waste biorefineries for bioethanol and biogas production in B&H. Therefore, this research aims to provide a simulation solution for integrated production of bioethanol and biogas from the OMW and present the justification of this concept from the process, economic, and environmental aspects. In addition, by modelling values for the landfill in Banja Luka, four scenarios of integrated production of bioethanol and biogas will be examined, with the selection of the simulation model that is the most adequate from an ecological and economic point of view. The obtained results could help decision-makers in future steps in the improvement of municipal waste management by providing reliable data on technical feasibility and economic profitability, as well as the conditions under which the observed bioprocesses are carried out.

2. Materials and Methods

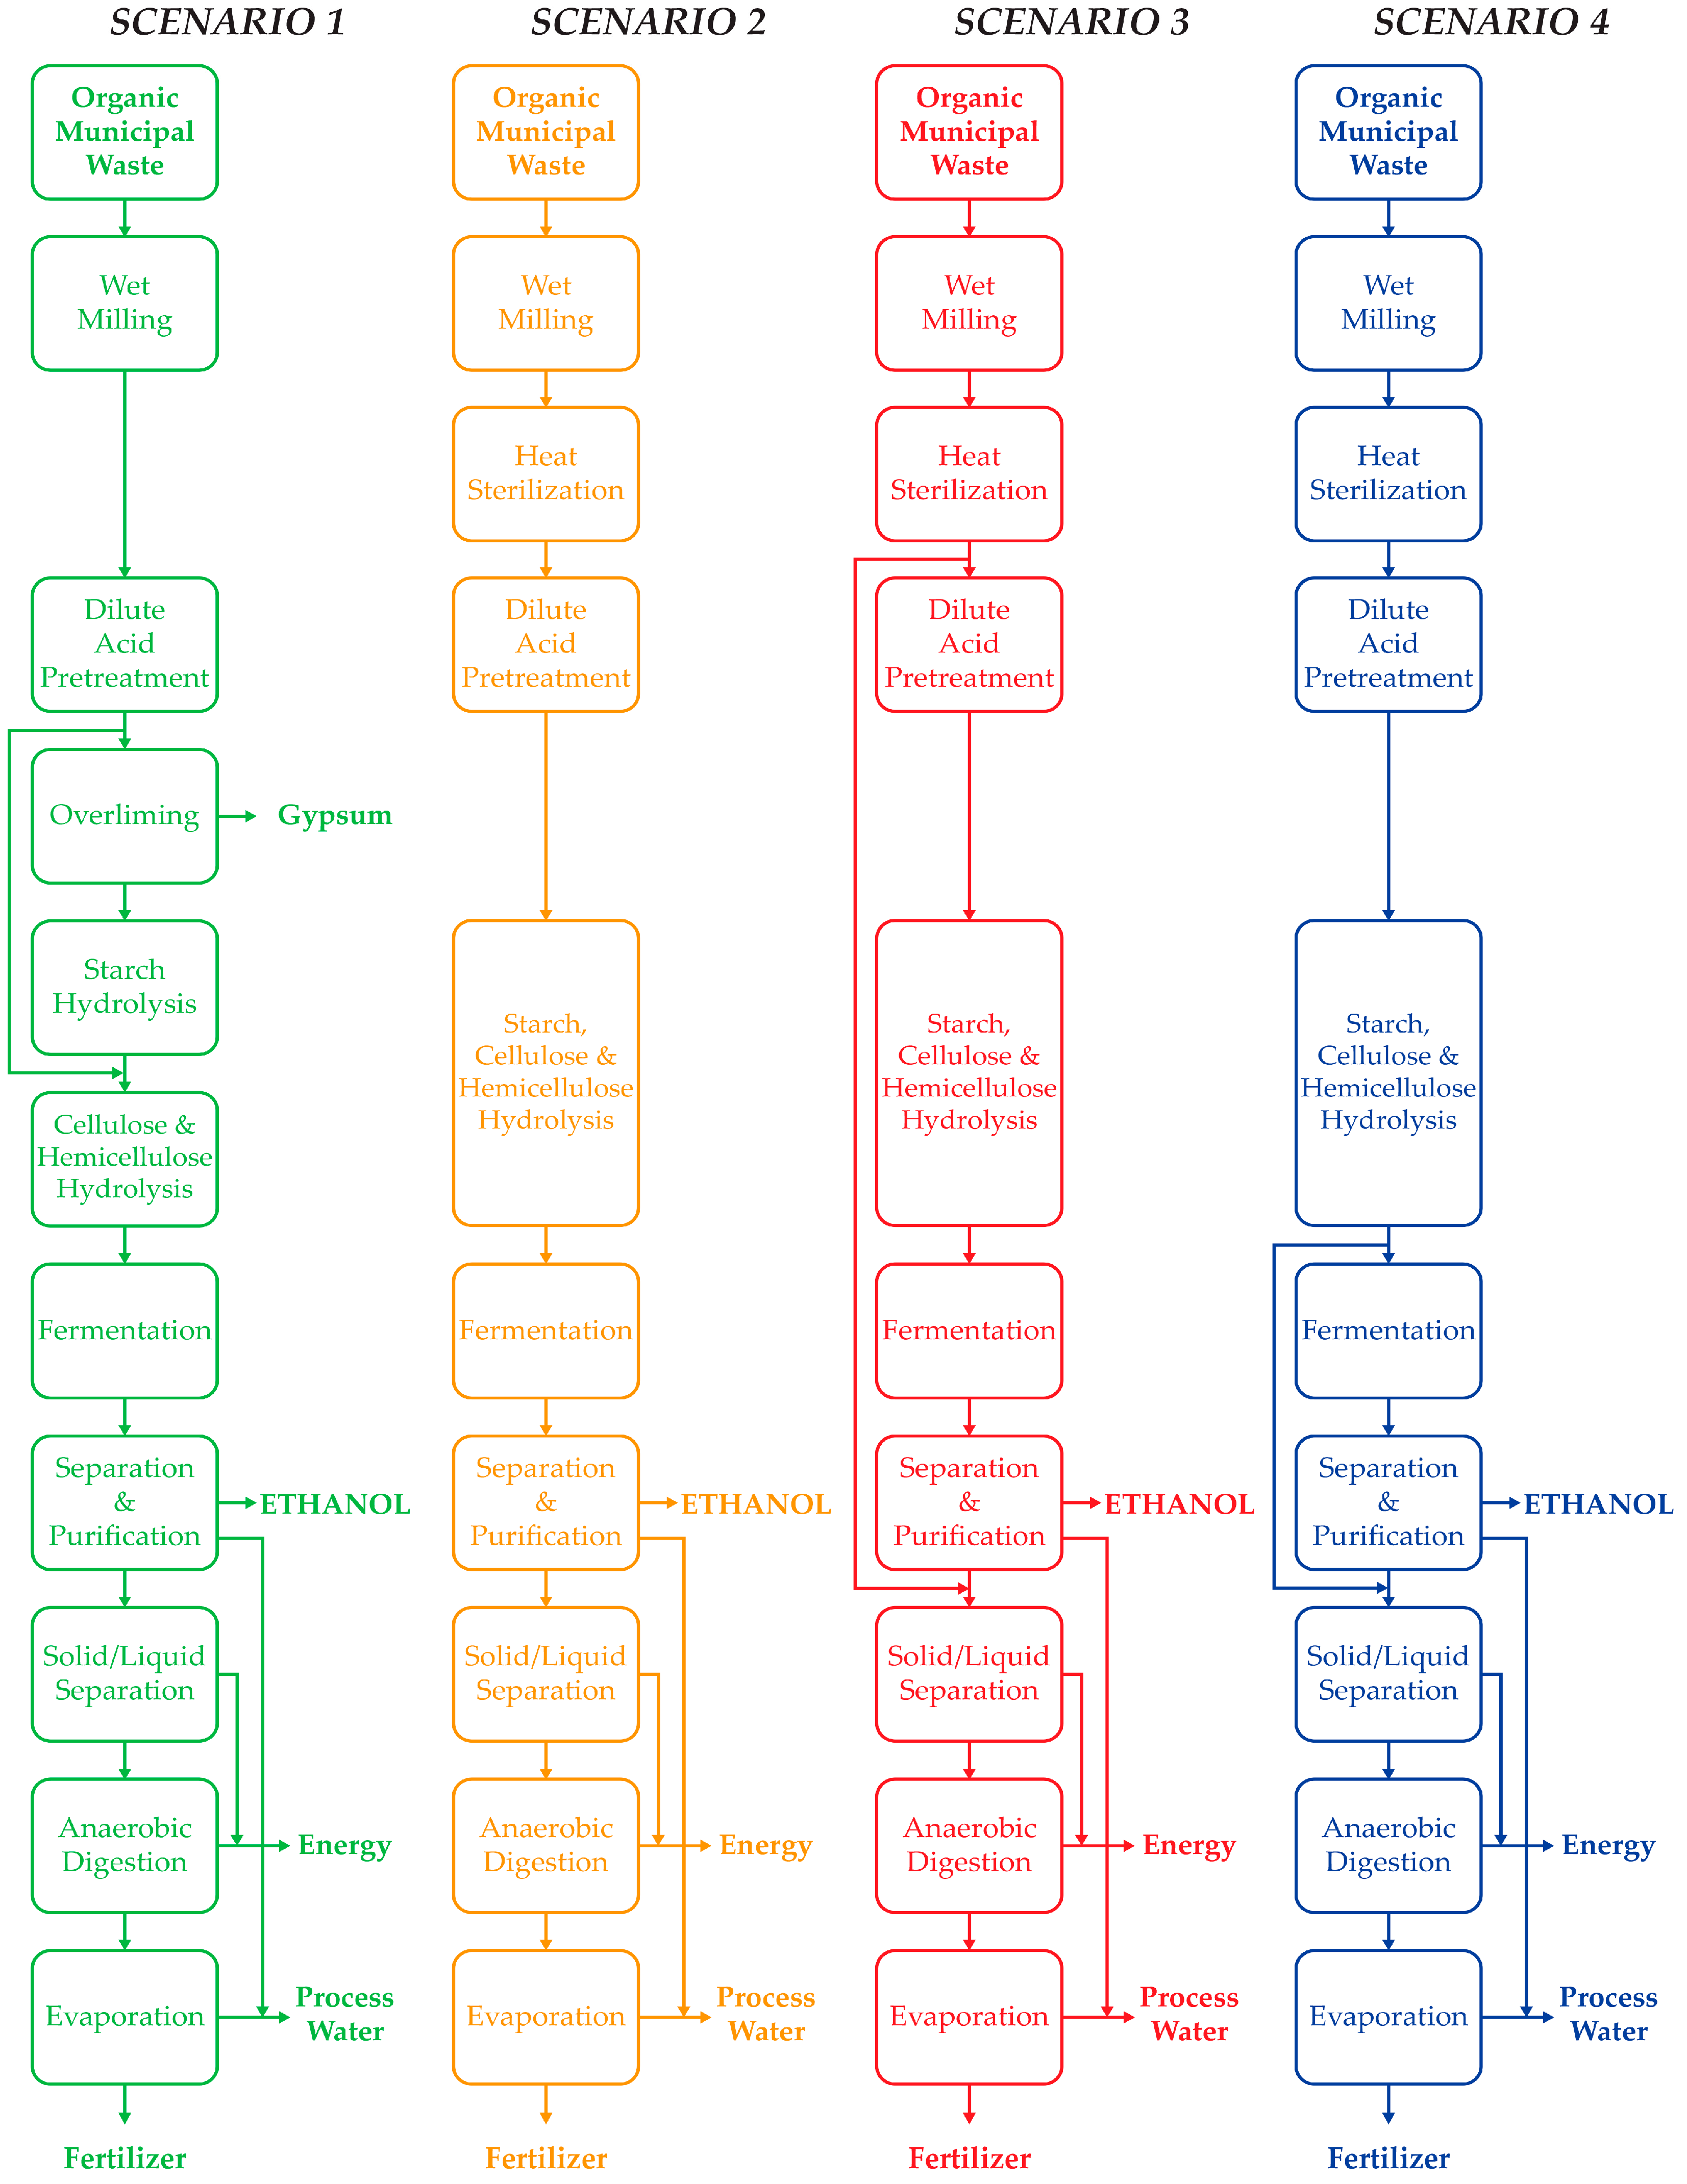
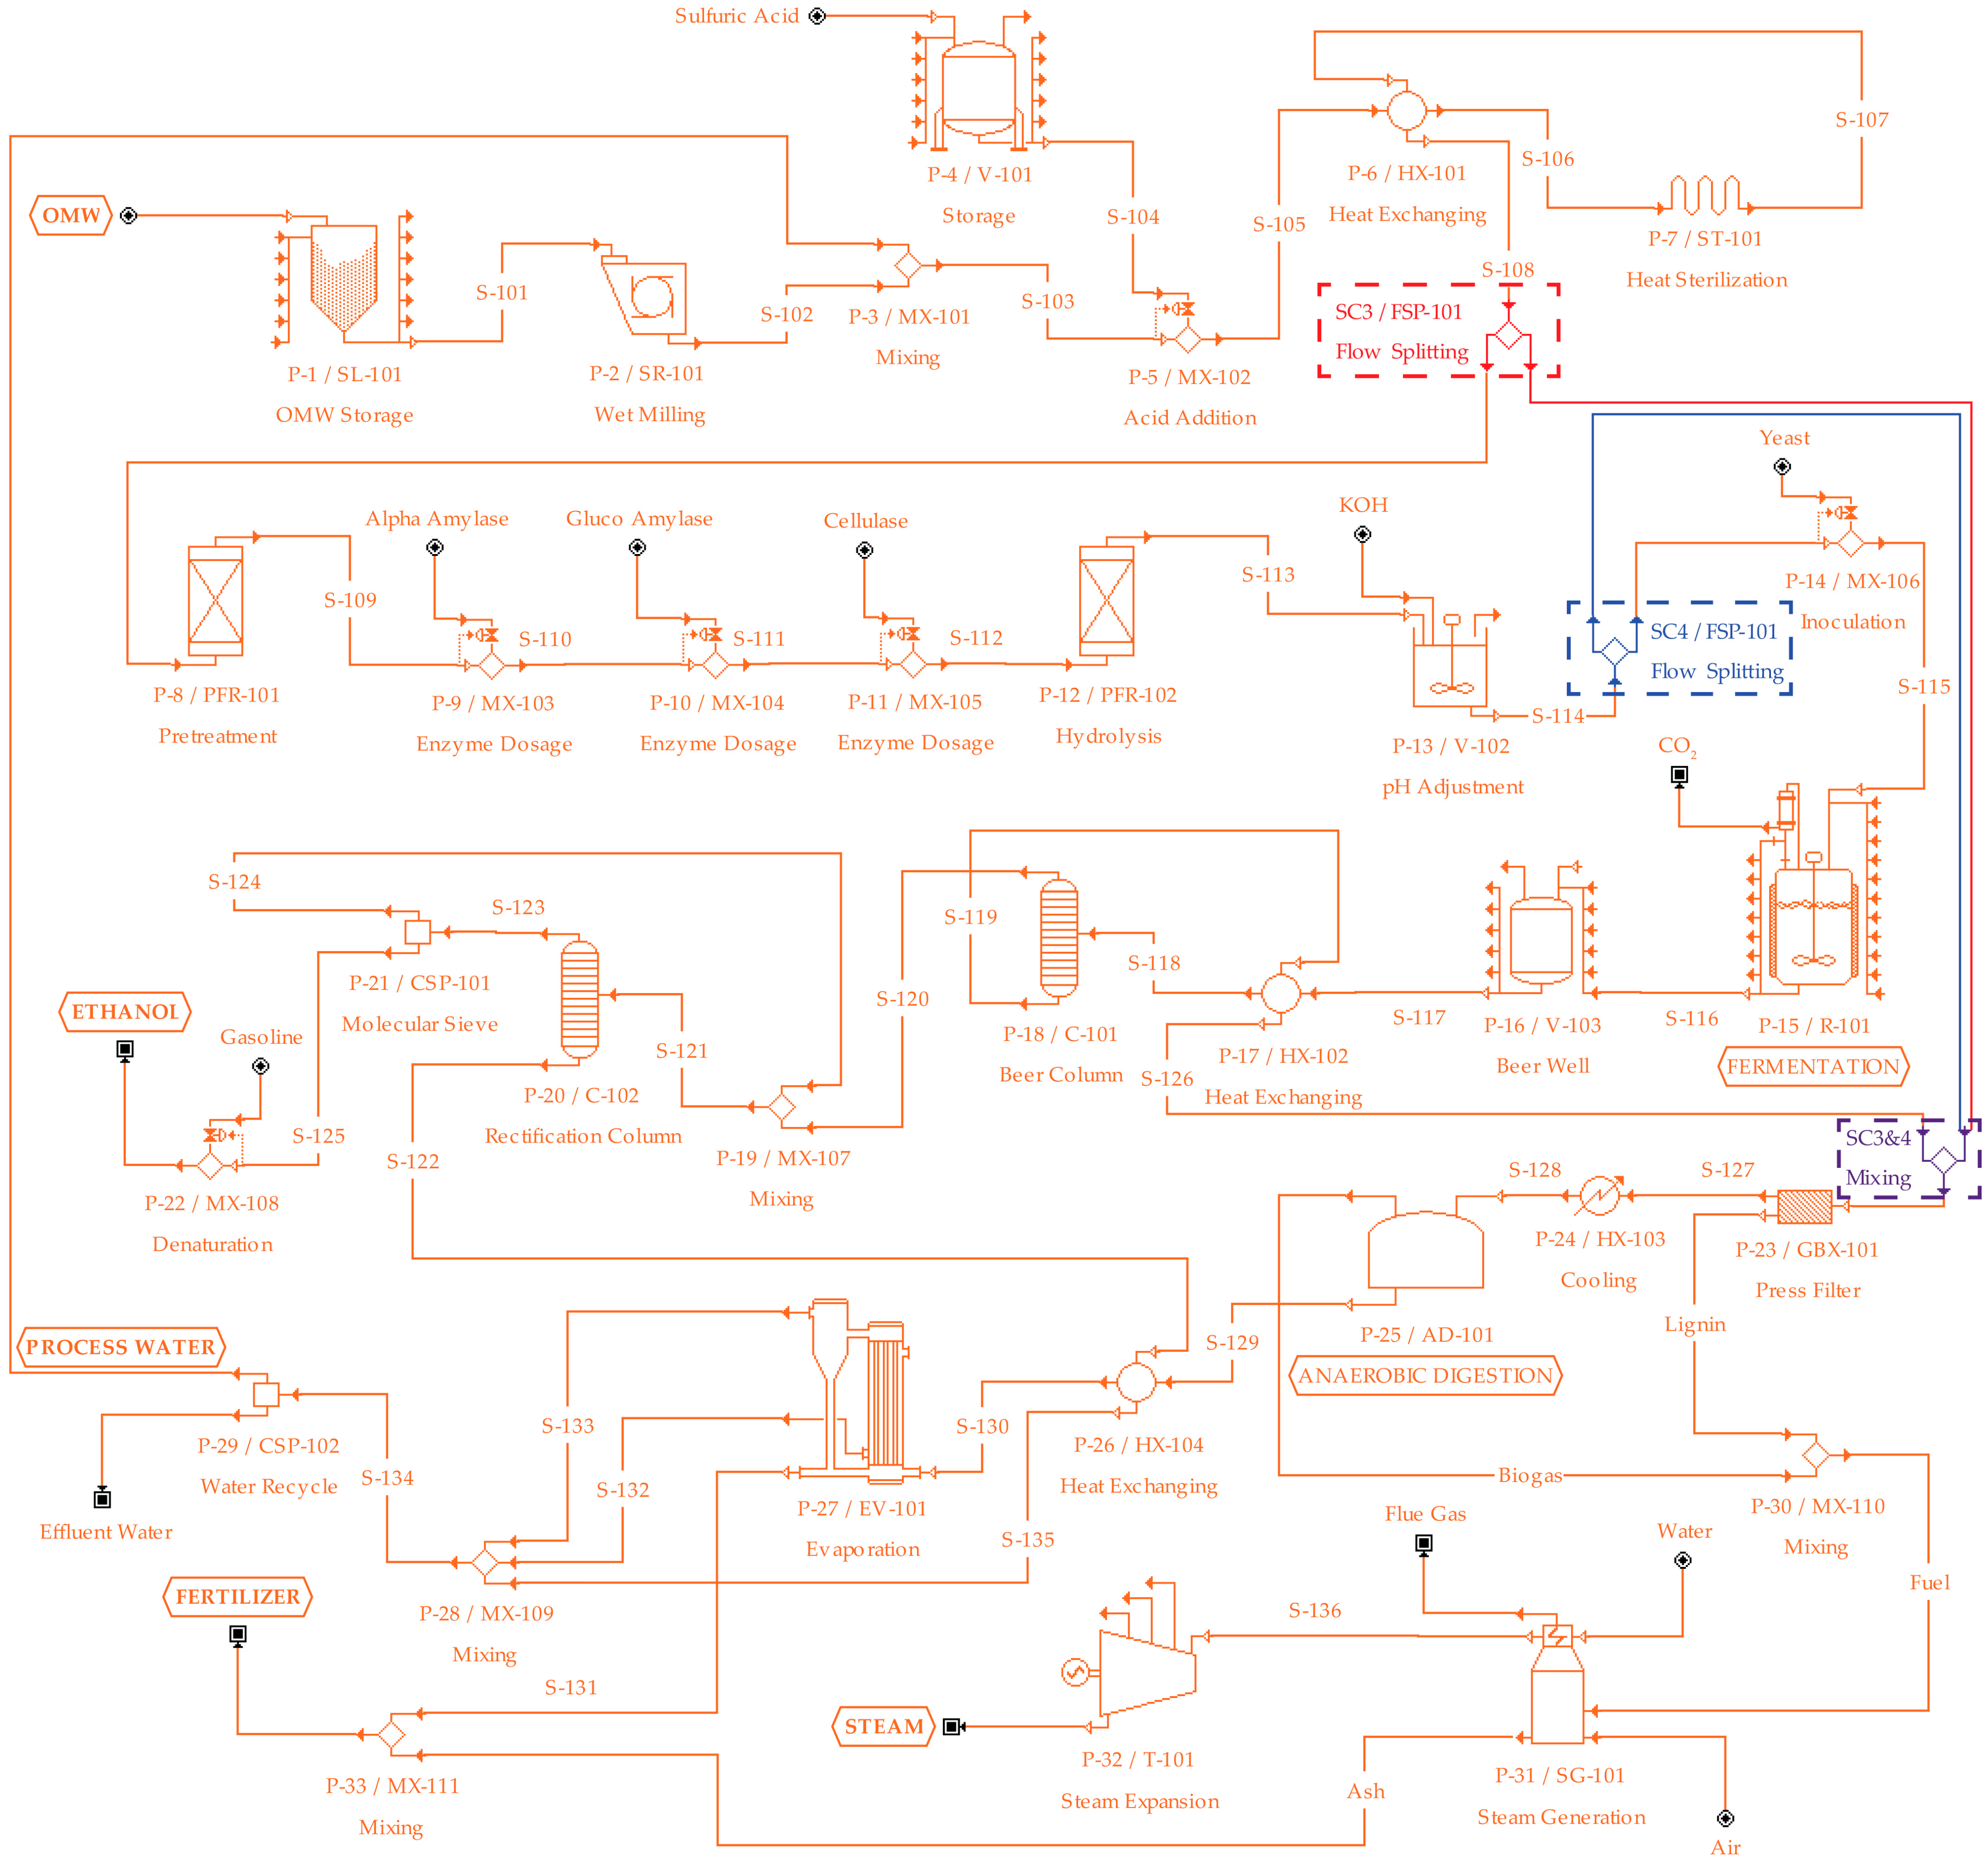
2.1. Process Description

In order to examine different ways of utilizing OMW in an integrated process for bioethanol and biogas production, four different case scenarios were created and are presented in Figure 1. All of the scenarios tend to exploit all process outlets in order to be in agreement with the circular economy model.
Scenario 1, or SC1, (Figure 1 green diagram) begins with wet milling of the feedstock, after which it is pretreated with acid at a low concentration. The combination of dilute acid treatment and enzymatic treatment is an efficient method of pretreatment, leading to less inhibitor generation in comparison to concentrated acid pretreatment. The dilute acid treatment enhances the substrate’s accessibility, hence promoting more efficient enzymatic hydrolysis and saccharification [33]. What follows is the separation of the liquid and solid phases, where the liquid phase is subjected to overliming, which generates gypsum as a by-product. Overliming is a promising approach for detoxifying dilute-acid hydrolysates and enhancing their fermentability, because it neutralizes the acid and reduces the concentration of the undesirable by-products furfural and 5-hydroxymethylfurfural [34]. The remaining liquid is used in a two-step starch hydrolysis (liquefaction and saccharification) process, before being mixed together with the solid phase from the dilute acid pretreatment. This mixture is then exposed to enzymatic hydrolysis of its cellulosic part. In this form, it is ready for fermenting the obtained sugars into ethanol, which is separated by a series of distillation and rectification columns and molecular sieves. The bottom outlet of the distillation column (stillage) is divided into a liquid phase and a solid phase, where the former is sent to an anaerobic digester for biogas production, which is then used together with the latter (stillage solid fraction) as fuel for steam (recycled heating for the process) and electricity (by-product) generation. The remaining sludge from the digester is concentrated in an evaporator to obtain another by-product, which can be sold as soil fertilizer. Finally, process water can be recycled by exploiting the bottom phase of the rectifier, as well as the evaporator condensate.
Scenarios 2, 3, and 4 (Figure 1 orange, red, and blue diagrams, respectively) differ from scenario 1 only in the pretreatment section of the process, i.e., in which operations and processes are used. Unlike scenario SC1, where calcium hydroxide is used to neutralize acids with the production of gypsum as a by-product, in scenario SC2, potassium hydroxide is used, which has a high solubility in water; hence, more glucose is obtained by neutralizing potassium hydroxide than by neutralizing calcium hydroxide [35]. Additionally, although overliming is widely acknowledged as the predominant treatment method, it does have a disadvantage in terms of sugar losses [36]. Namely, in scenario 2 (SC2), the OMW is sterilized after wet milling, before being subjected to dilute acid pretreatment, and the subsequent starch and cellulose hydrolysis is performed simultaneously before pH adjustment and being sent to the fermentation section. Scenarios 3 (SC3) and 4 (SC4) are options of SC2, with the addition of a flow splitter in the production process, sending one part of the inlet stream down its usual path of SC2, while the other part is led directly to biogas production together with the distillation stillage. The flow splitter in SC3 is positioned between the sterilization and dilute acid pretreatment operations (Figure 1 red diagram). In SC4, the splitter and additional stream are introduced after the simultaneous hydrolysis and pH adjustment procedures, and before the ethanol fermentation process, as displayed in Figure 1’s blue diagram.

2.2. Process Design

Performing the mathematical calculations of mass and energy balances in order to model and design the aforementioned scenarios of integrated bioethanol and biogas production from OMW was facilitated by a simulation software SuperPro Designer v11.0 (Intelligen, Inc., Freehold, NJ, USA). All of the data used as inputs in order to feed the simulation tool for obtaining the desired process model and execute the economic analysis for different scenario comparison, as well as to perform a sensitivity analysis of the best-case scenario, were taken from previously published data, literature, industry and supplier information, experts in the field, etc.
Figure 2 and Figure 3 are obtained directly from SuperPro Designer software and represent the process flow diagrams of SC1 (green) and SC2 (orange), respectively, with process options on Figure 3 for SC3 (red flow splitter and stream line) and SC4 (blue flow splitter and stream line), where both SC3 and 4 have a flow mixer (purple) introduced before the press filter.
The base for model generation was feedstock availability from a landfill in Banja Luka, Republic ofSrpska, which receives 493 t/dan of waste, out of which around 30% or 145 t/dan is OMW, leading to a 6 t/h inlet quantity for the process. The average content of this OMW was also obtained from the same landfill and is shown in Table 1.
In SC1 (Figure 2), after extracting the OMW from the rest of the waste that comes into the landfill, which is already a standard procedure in this company, it is briefly stored (0.5 days) in a storage silo (P-1/SL-101) with a volume of 715 m3. Since the OMW has a favorable moisture content, wet milling can be used to physically prepare the raw material for better subsequent thermo-chemical and enzymatic treatment [37]. Wet milling has several advantages over dry milling in terms of costs, which are associated with energy usage for milling itself and feedstock drying before milling, as well as dust control during milling [38]. Hence, a 90 kW rasper (P-2/SR-101) is needed for milling purposes. The milled OMW is mixed (P-3/MX-101) with 4596 kg/h of recycled process water, obtained from the rectifier and evaporator, in order to increase the moisture content to 80% [39]. About 109 kg/h of sulfuric acid, in the form of a 98% solution, is then added to the mixture (P-5/MX-102) from a 3.24 m3 storage tank (P-4/V-101) in order to get a 1% H2SO4 concentration. The dilute acid mixture is preheated (P-6/HX-101) by the outlet from the pretreatment reactor, which saves up energy needed for heating and cooling. In the 4.82 m3 pretreatment vessel (P-7/PFR-101), this mixture is heated to a final temperature of 160 °C and held at this temperature for 30 min [10] before being sent for partial cooling in the aforementioned heat exchanger (P-6/HX-101). The reactions taking place in the pretreatment reactor are shown in Table 2.
A press filter (P-8/GBX-101) is used to split the pretreated slurry into a liquid phase and a solid phase. The liquid phase is sent to a 9 m3 vessel (P-9/V-102) with 1 h residence time, where lime (Ca(OH)2) is added in surplus to neutralize the acid, thus forming gypsum (Table 2). In the following step, a 0.3 m3 vessel (P-10/V-103) with a 2 min residence time is used for pH adjustment [15]. The formed gypsum, and thus the first by-product, is separated in a combination of operations, which consists of an 8.2 m3/h throughput hydrocyclone (P-11/CY-101) and rotary drum filter (P12/RVF-101) with an 11 m2 filter area.
The remaining liquids from the gypsum separation procedures are mixed (P-13/MX-103) and preheated (P-14/HX-102) in the same way as in the dilute acid pretreatment section, only this time the heating fluid is the liquefaction reactor outlet (S-120). After heating, the enzyme (α-amylase) is loaded (0.002 kg enzymes per 1 kg of starch present) into the mixture [10] and then sent through a 16 m3 liquefaction reactor (P-16/PFR-102), where it is held for 2 h at 90 °C [10,40] in order for the reactions from Table 2 to take place. When the liquefaction outlet transfers its heat to the fresh inlet in the P-14/HX-102, it is ideally cooled to 65 °C [10], thus being ready for glucoamylase addition in the same loading dosage as the previous enzyme, and passed through a 243 m3 saccharification reactor (P-18/PFR-103) for 30 h [10] with the appropriate reaction occurring, as presented in Table 2. At this moment, the solid part from the press filter (S-110) is mixed with the starch hydrolysate (S-124) in order to hydrolyze the cellulosic part in three 250 m3 hydrolysis reactors (P-21/PFR-104) operating at 45 °C for 72 h [10] with reactions taken from Table 2.
Table 2. Reactions and their conversion percentages for the process model.
ProcedureReaction with
Mass Stoichiometric Coefficients
Conversion
%
Reference
Pretreatment
P-7/PFR-101
162 Cellulose + 18 Water → 180 Glucose13.04[39]
132 Hemicellulose + 18 Water → 150 Xylose60.26
180 Glucose → 126 Hydroxymethylfurfural + 54 Water5.00
150 Xylose → 96 Furfural + 54 Water5.00
1 Lignin → 1 Soluble Lignin5.00
162 Starch + 18.02 Water → 180.16 Glucose10.00
Overliming74.09 Ca(OH)2 + 98.08 H2SO4 → 136.14 CaSO4 + 36.03 Water100.00[2]
P-9/V-102136.14 CaSO4 + 36.03 Water → 172.17 Gypsum100.00
Liquefaction162 Starch + 18.02 Water → 180.16 Glucose35.00[15]
P-16/PFR-102
Saccharification162 Starch + 18.02 Water → 180.16 Glucose95.00[15]
P-18/PFR-103
Hydrolysis162 Cellulose + 18 Water → 180 Glucose80.00[15]
P-21/PFR-104132 Hemicellulose + 18 Water → 150 Xylose80.00
Fermentation180 Glucose → 88 Carbon Dioxide + 92 Ethanol95.00
P-23/R-101150 Xylose → 73.33 Carbon Dioxide + 76.67 Ethanol70.00[15]
0.22 Glucose + 0.41 Proteins → 0.56 Biomass 70.00
Anaerobic Digestion
P-33/AD-101
1 Glucose + 1 Water → 3.3 Carbon Dioxide + 3.3 Methane50.00[41]
43.70 Lipids + 24.50 Water → 15.25 Carbon Dioxide + 34.75 Methane70.00
1.12 Proteins + 14.50 Water → 3.75 Carbon Dioxide + 16.25 Methane70.00
1 Glucose → 5 Sludge + 5 Water90.00
1 Xylose → 1 Sludge90.00
1 Starch → 5 sludge + 4 Water86.00
A yeast strain, capable of utilizing both glucose and xylose, is added to the final hydrolysate (S-126) so it has an initial concentration of 2.5 g/L [2] when entering the 552 m3 fermenter (P-23/R-101) operating at 32 °C for 48 h [10,42] with the reactions in Table 2. The fermentation broth is stored in beer wells (P-24/V-104) in order to maintain a constant supply of input for the ethanol separation section. From there, the fermentation broth is preheated (P-25/HX-103) by the bottom phase (S-131) of the 12.8 m high with 0.193 m diameter and 28 stages subsequent distillation column (P-26/C-101), from which a 40–60% ethanol-water mixture is obtained as a top phase (S-132). This ethanol in water stream is mixed (P-27/MX-109) with a higher ethanol content mixture left from the molecular sieves before going through a 7.3 m high and 0.2 m in diameter rectifier column (P-28/C-102) with 16 stages, which produces a 93% ethanol solution at the top. This solution is brought to absolute ethanol content (99.99%) by molecular sieves (P-29/CSP-101). The final product is denaturized by gasoline addition in a concentration of 1%, thus obtaining 530.88 kg/h of the main product (MP).
The distillation stillage (S-131), after preheating the fermentation broth, is divided into a liquid phase and a solid phase by a press filter (P-31/GBX-102), where the liquid phase is sent to anaerobic digestion (P-33/AD-101) at 35 °C and with a total volume of 2106 m3. Following the reactions in the digester, defined in Table 2, the produced biogas (77,366 m3/h) is used together with 1207 kg/h of the solid phase from the press filter as fuel for steam generation (P-39/SG-101), which is further passed through a turbine (P-40/T-101) to generate electricity as a by-product (955 kW) and heating for the process (5365 kg/h of steam).
Stream S-141, containing the digested sludge, is preheated (P-34/HX-105) by the bottom outlet stream (S-134) of the rectification column (P-28/C-102), before being concentrated in an evaporator (P-35/EV-101) with a mean heat transfer area of 43.5 m2. The obtained concentrate is mixed (P-41/MX-113) together with the ashes from the steam generator to obtain 1162 kg/h of another by-product, which can be sold as fertilizer. Finally, the condensates of the evaporator (S-144 and S-145) and the cooled bottoms of the rectifier (S-147) are mixed (P-36/MX-111) to obtain process water, which is partially recycled in mixing with the milled OMW (P-3/MX-101).
In the other three scenarios (SC 2, 3, and 4) the pretreatment section is different compared to SC1 in the following procedures, according to Moreno et al. [16]: (a) a sterilization step is added before the pretreatment reactor due its lower operational temperature; (b) the hydrolysis of complex carbohydrates (starch, cellulose, and hemicellulose) is executed in one hydrolysis reactor simultaneously, with all enzymes (α-amylase, glucoamylase and cellulase) added together; and c) the neutralization of sulfuric acid is performed partially (in order to adjust the pH value) with the addition of KOH, which generates potassium sulfate and water (thus leaving out the need for gypsum separation procedures). The new sterilization procedure (P-7/ST-101) in Figure 3 is a 32 m long and 31.5 cm in diameter tube for holding the 10,535.4 L/h at 121 °C.
In SC2, the pretreatment reactor (P-8/PFR-101) following the sterilization step operates at 50 °C for 24 h, which defines its volume to be 252 m3. What follows it is the addition of amylolytic and cellulolytic enzymes in order to hydrolyze the pretreated slurry in a reactor (P-12/PFR-102) operating at identical conditions and identical in volume as the pretreatment reactor. Only after the hydrolysis, 60 kg/h KOH is added to reduce the acidity of sulfuric acid and set the pH to 5.5 in procedure P-13/V-102, before adding the inoculum (this time 1 g/L, according to Moreno et al. [16]) and sending it to fermentation and the usual process pathway, similar to SC1. In SC3, a flow splitter is introduced to stream S-108 (red flow splitter and stream line in Figure 3), as mentioned in Section 2.1, thus influencing the volume of the pretreatment and hydrolysis reactors (25–225 m3) and the quantity of enzyme loading, which depend on how much of the mixture is sent to ethanol production (10–90%) after sterilization. However, this is not the case for SC4 because the splitting of the flow is done after the pH adjustment procedure (blue flow splitter and stream line in Figure 3).
It should be noted that in SC 2, 3, and 4, the reactions that are defined in certain procedures are identical to the ones in SC1 (Table 2), with the only difference being that there is no overliming reaction (as mentioned above), and the liquefaction, saccharification, and hydrolysis reactions occur simultaneously in one procedure (P-12/PFR-102).

3. Results and Discussion

3.1. Economic Analysis

3.1.1. Scenario 1 vs. Scenario 2

Based on the input data from Section 2, the simulation tool performed mass and energy balance calculations and, in that way, defined the procedure units’ size, capacity, or throughput. According to this equipment data, unit costs were determined based on cost models from published data [43,44], equipment suppliers, experts in the field, etc. If the equipment size differed from the suppliers or did not have a cost model, an exponential scaling equation was used [2]. The sum of the individual equipment costs provided the total equipment purchase cost (PC), which was used together with PC factors to calculate the total capital investment (TCI), and its comparison for SC1 and SC2 is shown in Table 3. As can be seen from Table 3, the TCI is $7 million lower for SC2 compared to SC1, due to less equipment being needed for SC2 (comparing Figure 2 and Figure 3), i.e., the absence of two reactors, the overliming vessel, and gypsum separation units, besides the additional sterilization unit.
Compared to other integrated production of bioethanol and biogas simulations, the results concur with previously published data. Mupondwa et al. [19] examined an integrated process of triticale grain and straw (starch and cellulose) conversion to bioethanol and biogas and got a $140,000,000 TCI for processing 90 t/h (45 t/h of grain and 45 t/h of straw), which when scaled down to SC2 capacity is in agreement. Oleskowicz-Popiel et al. [22] also examined an integrated bioethanol and biogas production from a combination of rye grain, whey, and clover grass stillage with a plant capacity that is utilizing around five times less raw material than SC2 and got only a three times lower TCI.
On the other side, the operating costs are calculated from input prices for labor, bulk materials, and utilities, which are summarized in Table 4. The OMW price in Table 4 is set to zero because of the assumption that the company that will invest in this project is the landfill itself, which is obtaining OMW for free, i.e., collecting it from the local municipality. Likewise, the cooling specifications of certain procedures in the process define the cooling agent (water) characteristics and purity, which ultimately affect the expenses associated with purchasing these commodities.
The prices from Table 4 are used together with the required annual amounts of the cost items in order determine their total annual cost. Finally, by adding up the annual cost of each commodity, the operating cost is obtained. Figure 4 shows the share of major cost items in operating costs or in respective subsections of operating costs. For SC1, the operating costs equal up to $4,955,000, while for SC2, they are $4,220,000. This difference is probably due to the lower inoculum quantity needed for SC2, since it represents a major cost component in the bulk material expenses (Figure 4A). Furthermore, the demand for labor in SC2 is slightly reduced because there are fewer procedures to be managed (lack of gypsum formation and separation units). The lower procedure number in SC2 is usually associated with lower facility-dependent costs as well. Safaat et al. [49] showed that the operating costs for such a production plant are usually between 10–30% depending on the feedstock used (sugar beet, grass, straw, and elephant grass), which is in agreement with this study.
Besides the difference in biomass share in the raw material costs, from Figure 4A, it can be seen that the share of other raw material items is nearly the same, except for calcium hydroxide and potassium hydroxide, since the former appears only in SC1, and the latter appears only in SC2. The total raw material costs sum up to $2,048,000 and $1,533,000 for SC1 and SC2, respectively. Concerning the share of utilities cost, shown in Figure 4B, it can be noted that they are almost identical, so that their totals are $1,675,000 for SC1 and $1,685,000 for SC2. By analyzing Figure 4C (operating cost share) for SC1, the dominant cost item is the raw material, followed by utilities, with labor and facility costs sharing third place, and laboratory/QC/QA expenses have the smallest share. On the other side, the share of operating costs for SC2 (Figure 4C) has a switch between the first two, i.e., utilities have the largest share, with raw materials in second. Again, this is due to lower yeast need in SC2. When Pan et al. [50] analyzed an integrated sugarcane bagasse biorefinery for bioethanol and biogas production, utilities had the largest part in operating expenses (out of which steam had the largest part), followed by costs associated with raw materials.
After completing the TCI and operating costs calculations, a profitability analysis is performed and shown in Table 5. Ethanol is considered as the main product (revenue), with a selling price of 1.29 $/L [51]. Produced biogas is converted into two by-products, electricity and steam. For electricity, a selling option is chosen rather than using it in the process, due to the subsidized price of renewable electricity in the Republic of Srpska of 0.16 $/kWh [48]. Steam (Figure 2 and Figure 3), which can be used for heating in the process, has the same selling price as if it was purchased (Table 4). The fertilizer stream, i.e., concentrated digestate sludge and steam generation ash, can be sold for a price of 165.00 $/MT [52].
In Table 5, the net operating cost is determined by subtracting total credits from the actual operating cost, the gross profit is obtained by subtracting net OC from total revenues, and the net profit is calculated by subtracting taxes (20%) from the gross profit. Both examined scenarios (SC1 and SC2) have favorable economic parameters, with those associated with SC1 being comparable and similar to previously published ones [50]. On the other side and due to lower TCI (Table 3) and operating costs and with about the same revenues (leading to a higher net annual profit), SC2 outperforms SC1 in terms of the chosen profitability markers, primarily payback time (PBT), followed by gross margin (GM), return on investment (ROI), internal rate of return (IRR), and net present value (NPV). Thus, SC2 is more economically viable and is chosen for is further modification options through SC3 and SC4.

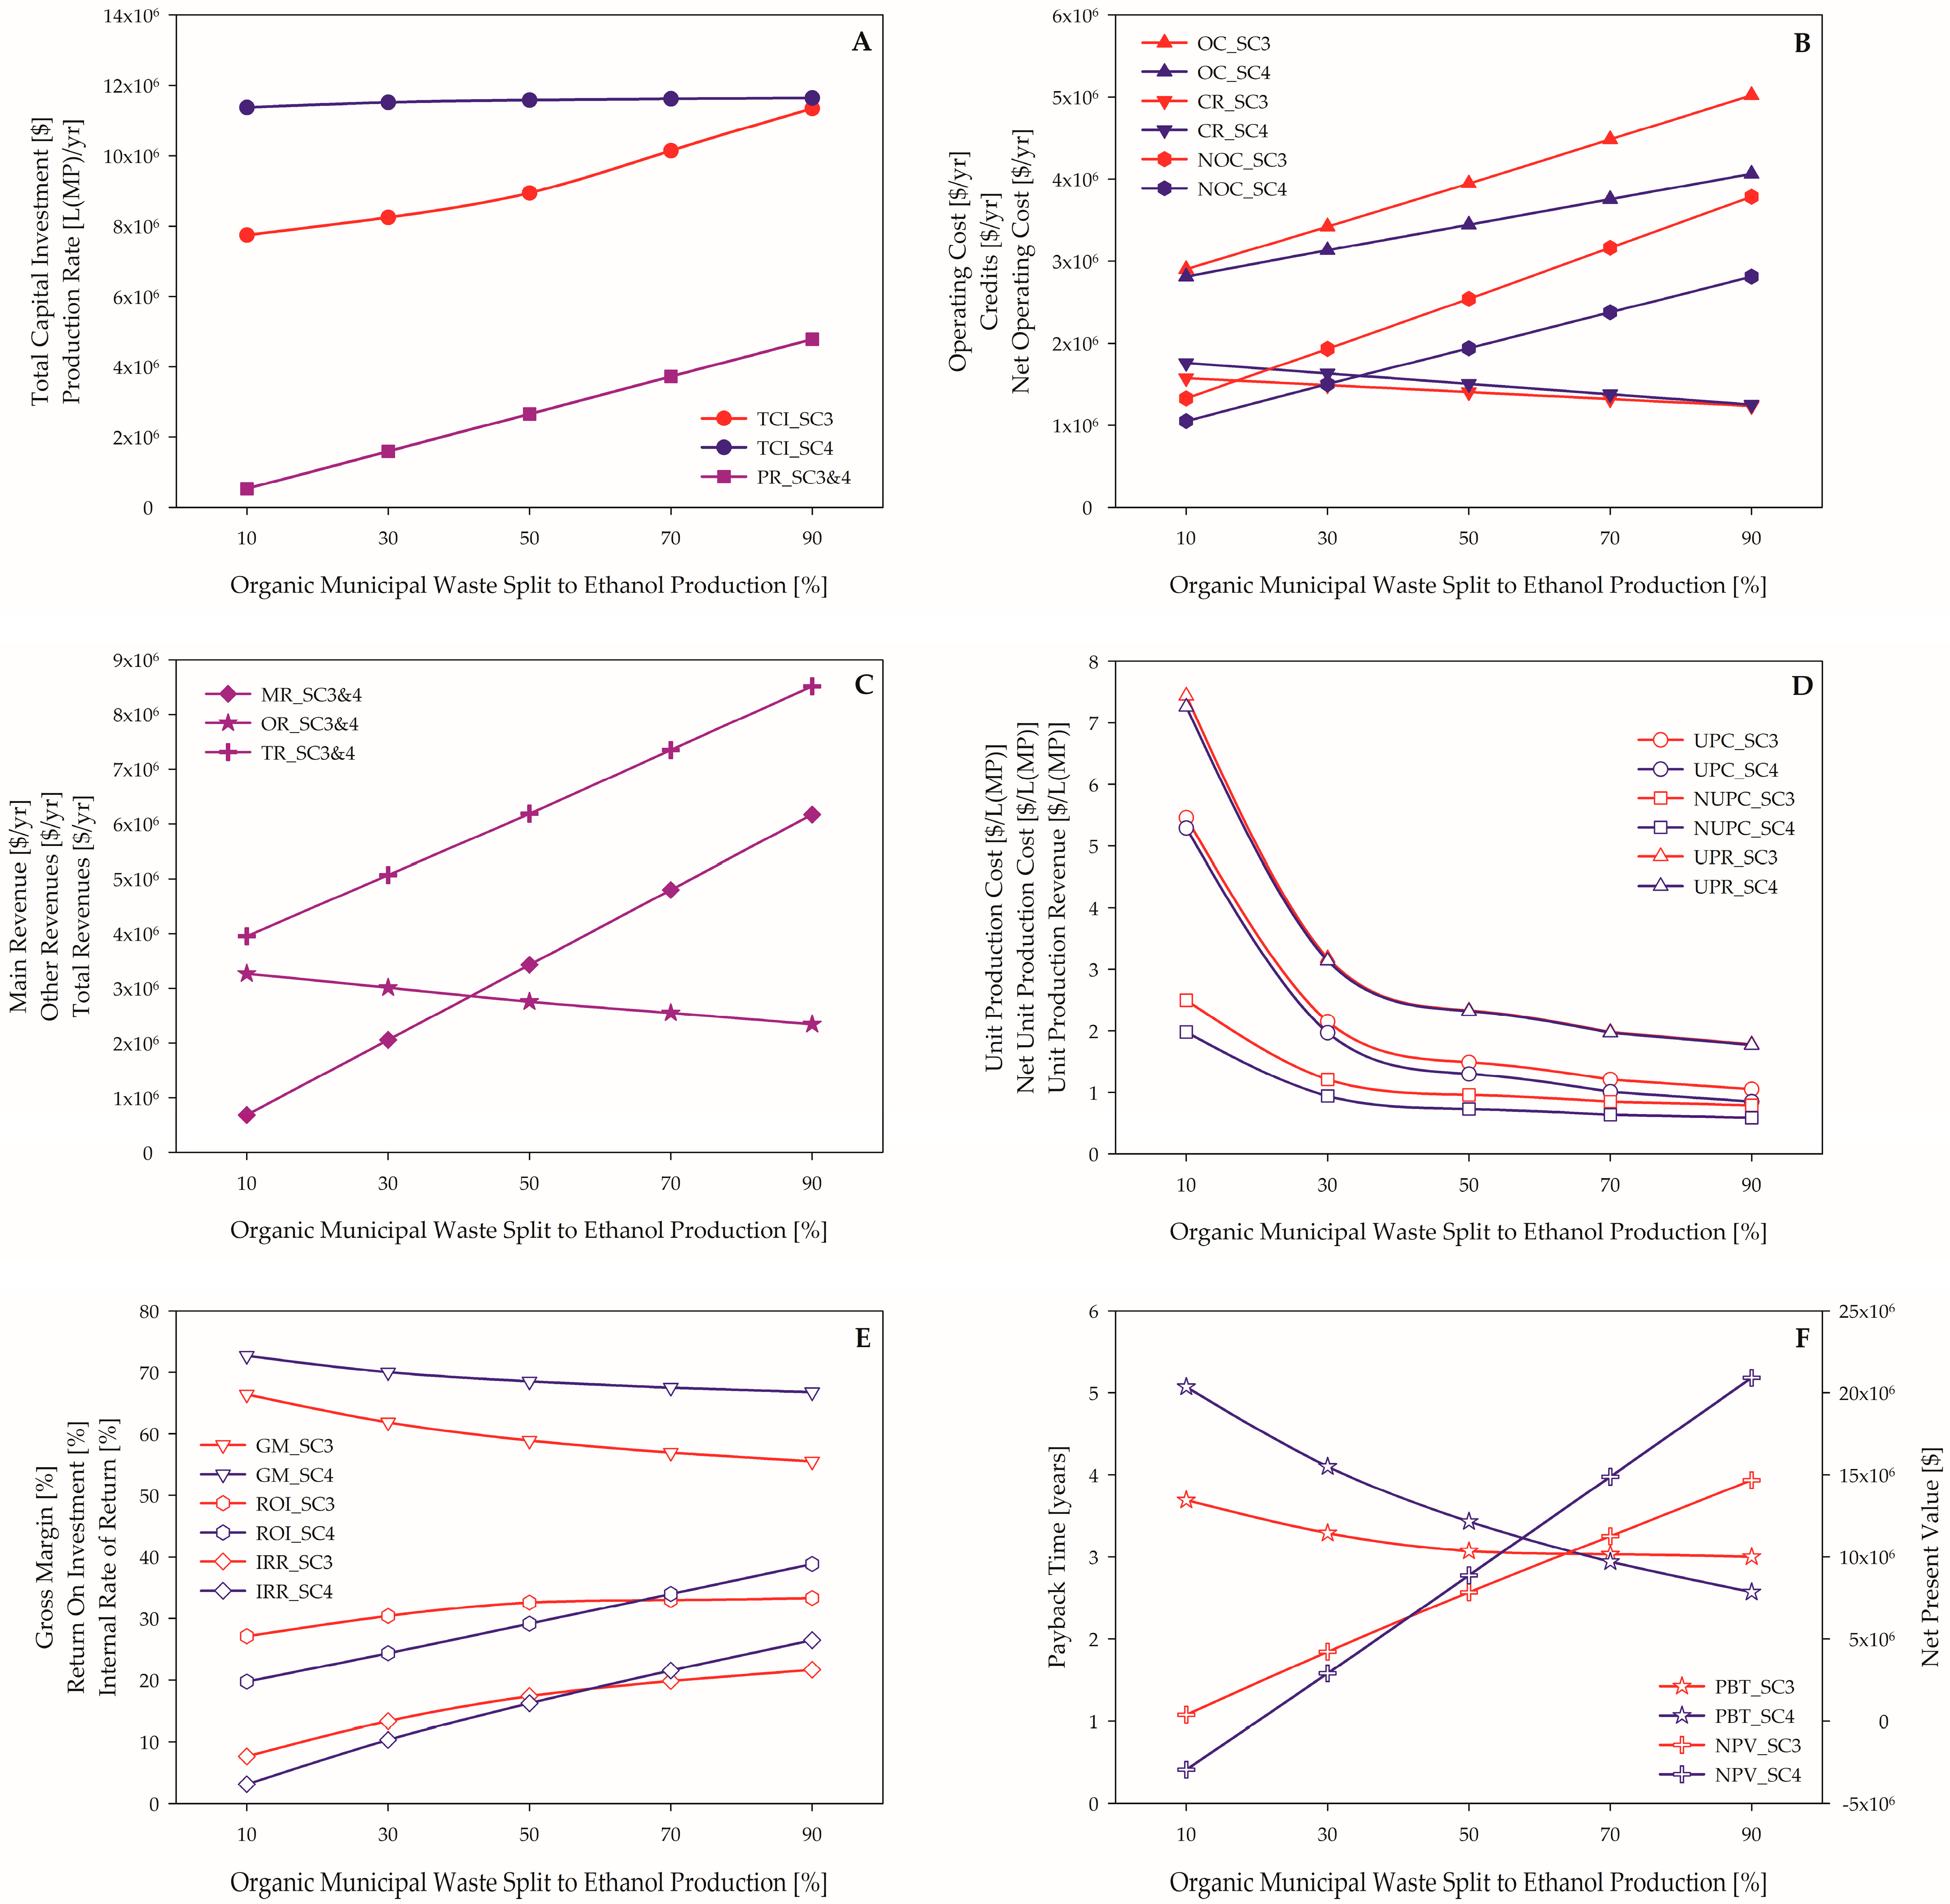
3.1.2. Scenario 3 vs. Scenario 4

Since SC2 turned out to be more profitable than SC1, as well as having several revenues (ethanol and biogas, where the latter is converted to process heat and sellable electricity), SC3 and SC4 examine the effect of distributing the inlet quantity of raw material between the fermentation and anaerobic digestion at different points in the process (Figure 3 red and blue stream lines, respectively). The split factors that had been investigated were 10, 30, 50, 70, and 90% of OMW being sent to ethanol production, while the remaining was used for biogas production together with distillation stillage. This influence of flow split on the overall process profitability indexes is investigated, summarized, and presented in Figure 5.
In Figure 5A, the TCI is lower for SC3 compared to SC4. For SC3, the TCI is gradually increasing as the share of OMW to ethanol production increases (with a slight change in slope at 50%), while for SC4, the TCI is at an almost constant value throughout the whole investigated range. This is the consequence of the flow splitter positioning. In SC3, the split is made before pretreatment and hydrolysis, so the sizing of this equipment is subjected to the inlet flow, i.e., less inlet leads to equipment that is smaller in size and thus cheaper. As the inlet increases, the size and price increase as well, meaning that the TCI will eventually come to a mitting point, which can be seen in Figure 5A. Since the split of OMW flow in SC4 is after pretreatment and hydrolysis, the fluctuation of TCI is minimal due to the fact that these reactors are the same size and cost the same as for SC2. The PRs of SC3 and SC4 are identical for the examined range of the split factor, i.e., it is not influenced by its positioning, hence there is one plot in Figure 5A to represent both scenarios. As expected, the PR increases with the increase in the split to ethanol production. As more material is being sent to ethanol fermentation, more of the MP is being obtained and thus a higher PR.
Figure 5B shows that OCs for SC3 have a steeper slope, with the increase in the OMW percentage sent to ethanol production due to the change in the equipment size of the pretreatment and hydrolysis reactors, which in turn contributes to higher utilities consumption (which have the highest share in OC—Figure 4). The credits, however, have a decline with the split factor increase, since less OMW is sent to biogas production and more to fermentation. In this case, SC3 has lower incomes associated with credits compared to SC4. This ultimately means that the NOC (OC − CR) become more resistant to the change in the split factor, with SC4 having favorable data. However, this shows that the ethanol production part has a greater effect on the entire process. Likewise, SC4 showed more stable options in terms of the parameters presented in Figure 5A,B.
All of the revenues have identical data points for the investigated split factor range, so they are presented together for SC3 and SC4 in Figure 5C. The MR increases as the split to ethanol increases, while the OR slowly decreases (less biogas production), which finally causes the TR to have a slighter increase (smaller slope) compared to MR.
The drop in UPC, NUPC, and UPR in Figure 5D with the increase in OMW share sent to fermentation changes drastically after 30%, probably meaning that going below this split factor could be economically unjustified. UPR values are nearly the same for SC3 and SC4, while UPC is lower and NUPC even lower (due to higher CR in Figure 5B) for SC4 across the entire examined range of the split. Figure 5D can also be viewed as some kind of an economies of scale analysis, since increasing the share of feedstock being sent to ethanol fermentation increases the plant size (pretreatment vessels and bioreactor), thus potentially showing when the production becomes most efficient when being scaled up, and that is over the 30% mark of the split factor.
GM is lower in all examined cases for SC3 (Figure 5E). It is declining with more ethanol production. For SC3, ROI and IRR seem to reach a plateau after 50%, while these indexes have a linear increase for SC4 with higher percentages of OMW to ethanol. There is even an intersection (at the split 60 and 65% for IRR and ROI, respectively), which could be a turning point going in favor of SC4.
The trend of PBT for SC3 (Figure 5F) is similar to IRR and ROI, but it reaches a plateau after an initial decrease from 10 to 50% of the split factor. There is an intersection with PBT for SC4 again at 65% of the split, from where PBT_SC4 becomes lower in comparison to PBT_SC3. On the other hand, the NPV values for SC3 and 4 have an intersection around the 40% split factor, after which the value is higher for SC4. It is worthy of mentioning that the NPV for SC4 at the split factor 10% is negative.
According to all of the aforementioned comparison for SC3 and SC4, it can be concluded that SC4 is a better option when the split factor is over 65%, both options are good (“gray area”) in the range of the split factor from 30–40 to 65%, and under 30%, SC3 has the advantage. Regardless of these conclusions, SC2 remained the process option with the most positive economic factors. That is why the subsequent sensitivity analysis is performed on SC2.

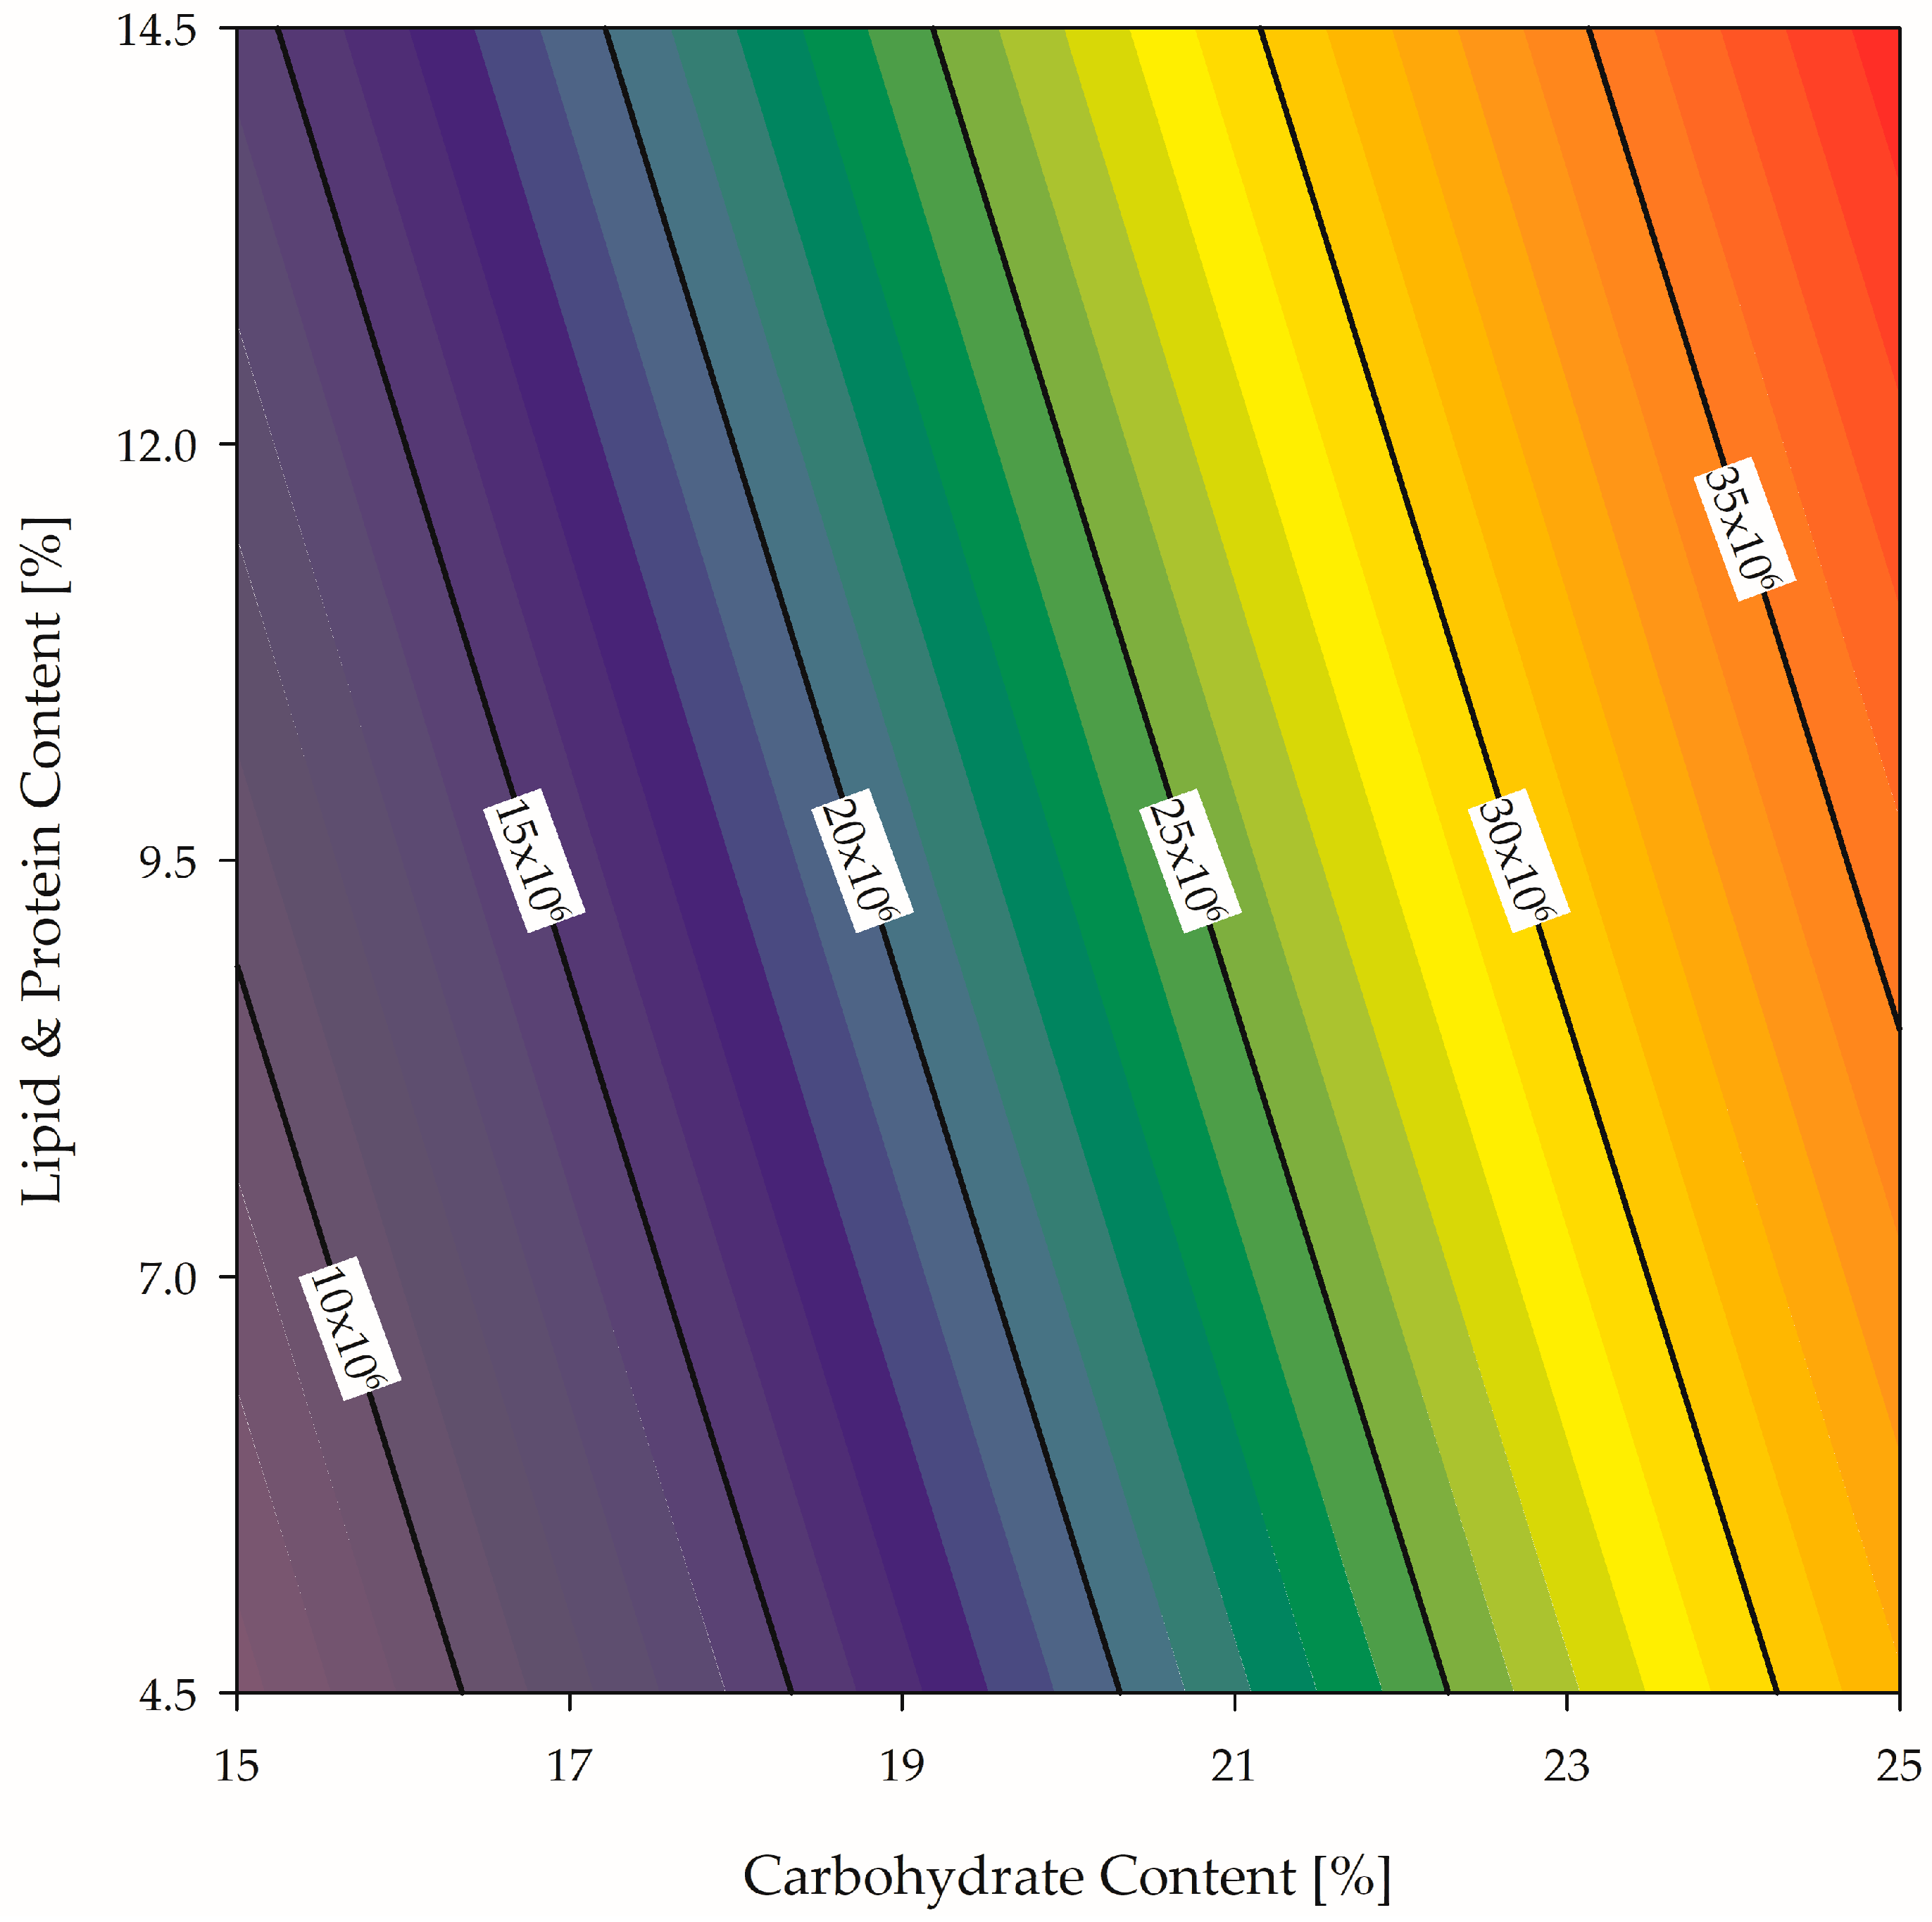
3.2. Sensitivity Analysis

When only bioethanol or biogas is produced from sugarcane bagasse, biogas has a slight advantage from an economical point of view [50]. However, in an integrated process, as the comparison of SC3 and SC4 made clear, ethanol is the main product, and the process should be directed towards its production in the highest amount possible. Since it is the revenue that highly influences the integrated process of bioethanol and biogas production from OMW and its price fluctuation on the global market (from 0.709 to 2.339 $/L [51], as well as the fact that NPV was shown to be the most sensible profitability marker in this study as well as other previously published studies [49], a sensitivity analysis of ethanol price on NPV was performed for SC2. This analysis was also used to determine the ethanol price at which the NPV is equal to zero. The results are presented in Figure 6, and as can be seen, the NPV is positive in the examined range of the current global ethanol prices. However, the NPV become 0 for the ethanol selling price of 0.6616 $/L, which is 4 cents under the lowest global price.
Besides the MP selling price, Pan et al. [50] showed that the substrate availability in the reaction mixture (weather for bioethanol or biogas production) influences the NPV to the same extent. Thus, a second sensitivity analysis was performed in order to investigate the effect of OMW composition, which fluctuates seasonally and geographically. Ethanol is mostly produced from carbohydrates (monosaccharides, starch, cellulose, and hemicellulose), while biogas is mostly produced from lipids and proteins. Summing up the carbohydrates from Table 1, around 20% is obtained, while lipids and proteins content is around 9.5% in OMW. Thus, the influence of a broad range of carbohydrate (15–25%) and lipids and proteins content (4.5–14.5%) on NPV for SC2 was examined, and the results are shown in Figure 7. The obtained NPV values varied from $10 to $35 million, meaning that the process is viable from an economical point of view in the examined range of OMW composition. However, it is worth noticing that the carbohydrate content has a greater effect on the NPV than the lipids and proteins content, which in turn is just another proof that ethanol should be the main product of the examined process, because it is mostly produced from carbohydrates, which are more present in OMW compared to other components.

4. Conclusions

This paper presents, through a series of analyses, different scenarios for a simulation model of an integrated process for bioethanol and biogas production from organic municipal waste in order to determine the best process option. The designed capacity of the plant is to process six tons of raw material per hour and to produce 5,000,000 L of ethanol annually, together with all other process outlets turned into by-products representing additional revenue. An economic analysis showed that simultaneous feedstock hydrolysis performs better than sequential hydrolysis. Another analysis of profitability markers showed that distributing one part of the organic municipal waste inlet directly to biogas production only lowers the process performance. Additionally, under the defined process conditions, the lowest plausible selling price of ethanol is 0.6616 $/L. Concerning the organic municipal waste composition in terms of carbohydrates and lipids and proteins, the former has a stronger influence on process viability. This research provides significant simulation findings on various technological setups for producing value-added products from waste, and the obtained results provide a valuable tool for decision-making when assessing the feasibility of integrating bioethanol and biogas production for utilizing organic municipal waste. Finally, the obtained model can be used to further develop the process and ultimately help in waste management and enhance circular economy.

Author Contributions

Conceptualization, D.V., S.D., and B.B.; methodology, B.G., D.V., S.D. and B.B.; software, B.G. and D.V.; data curation, B.G.; writing—original draft preparation, B.G., D.V., S.D. and B.B.; writing—review and editing, D.V., S.D. and B.B.; supervision, D.V., S.D. and B.B. All authors have read and agreed to the published version of the manuscript.

Funding

This work was supported by the Ministry of Science, Technological Development and Innovation of the Republic of Serbia (Grant no. 451-03-65/2024-03/200134).

Data Availability Statement

Data are contained within the article.

Conflicts of Interest

The authors declare no conflicts of interest.

Abbreviations and Acronyms

B&HBosnia and Herzegovina
CFCContractor’s Fee and Contingency
CRCredits
DFCCDirect Fixed Capital Cost
EUEuropean Union
GHGGreenhouse Gas
GMGross Margin
IRRInternal Rate of Return
MPMain Product
MRMain Revenue
NOCNet Operating Cost
NPVNet Present Value
NUPCNet Unit Production Rate
OCOperating Cost
OMWOrganic Municipal Waste
OROther Revenues
PBTPayback Time
PCPurchase Cost
PRProduction Rate
QAQuality Analysis
QCQuality Control
ROIReturn on Investment
SC1 Scenario 1
SC2 Scenario 2
SC3 Scenario 3
SC4Scenario 4
TCITotal Capital Investment
TPCTotal Plant Cost
TPDCTotal Plant Direct Capital
TPICTotal Plant Indirect Cost
TRTotal Revenues
UPCUnit Production Cost
UPRUnit Production Revenue

References

  1. Alao, M.A.; Popoola, O.M.; Ayodele, T.R. Waste to energy nexus: An overview of technologies and implementation for sustainable development. Clean. Energy Syst. 2022, 3, 100034. [Google Scholar] [CrossRef]
  2. Vučurović, D.; Bajić, B.; Vučurović, V.; Jevtić-Mučibabić, R.; Dodić, S. Bioethanol Production from Spent Sugar Beet Pulp—Process Modeling and Cost Analysis. Fermentation 2022, 8, 114. [Google Scholar] [CrossRef]
  3. Directive (EU) 2023/2413 of the European Parliament and of the Council, Official Journal of the European Union. 2023. Available online: https://eur-lex.europa.eu/legal-content/EN/TXT/PDF/?uri=OJ:L_202302413 (accessed on 24 April 2024).
  4. Framework Energy Strategy of Bosnia and Herzegovina until 2035, Official Gazette of BiH, No. 70/18, Sarajevo. 2018. Available online: http://www.sluzbenilist.ba/page/akt/du8gztz5k76kjn45hnsd2ZBw (accessed on 29 April 2024).
  5. Bajić, B.; Dodić, S.; Vučurović, D.; Dodić, J.; Grahovac, J. Waste-to-energy status in Serbia. Renew. Sust. Energ. Rev. 2015, 50, 1437–1444. [Google Scholar] [CrossRef]
  6. Naveenkumar, R.; Iyyappan, J.; Pravin, R.; Kadry, S.; Han, J.; Sindhu, R.; Awasthi, M.K.; Rokhum, S.L.; Baskar, G. A strategic review on sustainable approaches in municipal waste management and energy recovery: Role of artificial intelligence, economic stability and life cycle assessment. Bioresour. Technol. 2023, 379, 129044. [Google Scholar] [CrossRef]
  7. Katinas, V.; Marciukaitis, M.; Perednis, E.; Dzenajaviciene, E.F. Analysis of biodegradable waste use for energy generation in Lithuania. Renew. Sustain. Energy Rev. 2019, 101, 559–567. [Google Scholar] [CrossRef]
  8. Prasoulas, G.; Gentikis, A.; Konti, A.; Kalantzi, S.; Kekos, D.; Mamma, D. Bioethanol Production from Food Waste Applying the Multienzyme System Produced On-Site by Fusarium oxysporum F3 and Mixed Microbial Cultures. Fermentation 2020, 6, 39. [Google Scholar] [CrossRef]
  9. Mosquera-Toscano, H.G.; González-Barceló, O.; Valdez-Vazquez, I.; Durán-Moreno, A. Ethanol and Methane Production from the Organic Fraction of Municipal Solid Waste in a Two-Stage Process. BioEnergy Res. 2024, 17, 634–645. [Google Scholar] [CrossRef]
  10. Mahmoodi, P.; Karimi, K.; Taherzadeh, M.J. Hydrothermal processing as pretreatment for efficient production of ethanol and biogas from municipal solid waste. Bioresour. Technol. 2018, 261, 166–175. [Google Scholar] [CrossRef]
  11. Varghese, S.; Demeke, M.M.; Verhe, R.; Redant, E.; Cruyssen, C.V.; Thevelein, J.M. Process optimization for saccharification and fermentation of the Organic Fraction of Municipal Solid Waste (OFMSW) to maximize ethanol production performance. Bioresour. Technol. Rep. 2023, 24, 101681. [Google Scholar] [CrossRef]
  12. Nishimura, H.; Tan, L.; Sun, Z.-Y.; Tang, Y.-Q.; Kida, K.; Morimura, S. Efficient production of ethanol from waste paper and the biochemical methane potential of stillage eluted from ethanol fermentation. Waste Manag. 2016, 48, 644–651. [Google Scholar] [CrossRef]
  13. Morero, B.; Vicentin, R.; Campanella, E.A. Assessment of biogas production in Argentina from co-digestion of sludge and municipal solid waste. Waste Manag. 2017, 61, 195–205. [Google Scholar] [CrossRef] [PubMed]
  14. Achinas, S.; Martherus, D.; Krooneman, J.; Euverink, G.J.W. Preliminary Assessment of a Biogas-Based Power Plant from Organic Waste in the North Netherlands. Energies 2019, 12, 4034. [Google Scholar] [CrossRef]
  15. Mahmoodi, P.; Karimi, K.; Taherzadeh, M.J. Efficient conversion of municipal solid waste to biofuel by simultaneous dilute-acid hydrolysis of starch and pretreatment of lignocelluloses. Energy Convers. Manag. 2018, 166, 569–578. [Google Scholar] [CrossRef]
  16. Moreno, A.D.; Magdalena, J.A.; Oliva, J.M.; Greses, S.; Lozano, C.C.; Latorre-Sanchez, M.; Negro, M.J.; Susmozas, A.; Iglesias, R.; Llamas, M.; et al. Sequential bioethanol and methane production from municipal solid waste: An integrated biorefinery strategy towards cost-effectiveness. Process Saf. Environ. Prot. 2021, 146, 424–431. [Google Scholar] [CrossRef]
  17. Cardenas-Fernandez, M.; Bawn, M.; Hamley-Bennett, C.; Bharat, P.K.V.; Subrizi, F.; Suhaili, N.; Ward, D.P.; Bourdin, S.; Dalby, P.A.; Hailes, H.C.; et al. An Integrated Biorefinery Concept for Conversion of Sugar Beet Pulp into Value-Added Chemicals and Pharmaceutical Intermediates. Faraday Discuss. 2017, 202, 415–431. [Google Scholar] [CrossRef] [PubMed]
  18. Demichelis, F.; Fiore, S.; Pleissner, D.; Venus, J. Technical and economic assessment of food waste valorization through a biorefinery chain. Renew. Sust. Energy Rev. 2018, 94, 38–48. [Google Scholar] [CrossRef]
  19. Mupondwa, E.; Li, X.; Tabil, L. Integrated bioethanol production from tricitale grain and lignocellulosic straw in Western Canada. Ind. Crops Prod. 2018, 117, 75–87. [Google Scholar] [CrossRef]
  20. Nishimura, H.; Tan, L.; Kira, N.; Tomiyama, S.; Yamada, K.; Sun, Z.-Y.; Tang, Y.-Q.; Morimura, S.; Kida, K. Production of ethanol from a mixture of waste paper and kitchen waste via a process of successive liquefaction, presaccharification, and simultaneous saccharification and fermentation. Waste Manag. 2017, 67, 86–94. [Google Scholar] [CrossRef]
  21. Li, X.; Mupondwa, E. Commercial feasibility of an integrated closed-loop ethanol-feedlot-biodigester system based on triticale feedstock in Canadian Prairies. Renew. Sustain. Energy Rev. 2018, 97, 401–413. [Google Scholar] [CrossRef]
  22. Oleskowicz-Popiel, P.; Kadar, Z.; Heiske, S.; Klein-Marcuschamer, D.; Simmons, B.A.; Blanch, H.W.; Schmidt, J.E. Co-production of ethanol, biogas, protein fodder and natural fertilizer in organic farming—Evaluation of a concept for a farm-scale biorefinry. Biores. Technol. 2012, 104, 440–446. [Google Scholar] [CrossRef]
  23. Cаnizales, L.; Rojas, F.; Pizzaro, C.A.; Caciedo-Ortega, N.H.; Villegas-Torres, M.F. SuperPro Designer user oriented software used for analyzing the techno-economic feasibility of electronical energy generation from sugarcane vinasse in Columbia. Processes 2020, 8, 1180. [Google Scholar] [CrossRef]
  24. Khajeeram, S.; Unrean, P. Techno-economic assessment of high-solid simultaneous saccharification and fermentation and economic impacts of yeast consortium and on-site enzyme production technologies. Energy 2017, 122, 194–203. [Google Scholar] [CrossRef]
  25. Ortiz, I.; Valdez-Vazquez, I.; Hernandez-Vazquez, A.; Olivares-Hernandez, R.; Carrillo-Reyes, J.; Alatriste-Mondragon, F.; Buitron, G.; Razo-Flores, E. Process design and economic evaluation for methane and electricity production from Agave bagasse using different pretreatments. Energy Convers. Manag. 2024, 306, 118319. [Google Scholar] [CrossRef]
  26. Rahman, S.S.A.; Pasupathi, S.; Karuppiah, S. Statistical optimization, kinetic modeling, and techno-economic analysis for the production of high molecular mass dextran using sugarcane industrial waste—Molasses. Bioresour. Technol. Rep. 2024, 27, 101902. [Google Scholar] [CrossRef]
  27. Heinzle, E.; Biwer, A.P.; Cooney, C.L. Development of Sustainable Bioprocesses: Modeling and Assessment; John Wiley & Sons Ltd.: Hoboken, NJ, USA; Chichester, UK, 2006; The Atrium, Southern Gate; ISBN 978-0-470-01559-9. [Google Scholar]
  28. Sokolowski, J.A.; Banks, C.M. Modeling and Simulation Fundamentals: Theoretical Underpinnings and Practical Domains; John Wiley & Sons, Inc.: Hoboken, NJ, USA, 2010; ISBN 978-0-470-48674-0. [Google Scholar]
  29. Harrison, R.G.; Todd, P.W.; Rudge, S.R.; Petrides, D.P. Bioseparations Science and Engineering, 2nd ed.; Oxford University Press: Oxford, UK, 2015; ISBN 978-0-19-539181-7. [Google Scholar]
  30. Petrides, D.; Cooney, C.L.; Evans, L.B.; Field, R.P.; Snoswell, M. Bioprocess simulation: An integrated approach to process development. Computers Chem. Eng. 1989, 13, 553–561. [Google Scholar] [CrossRef]
  31. Agency for Statistics of Bosnia and Herzegovina—BHAS, First Release, Environment, Sarajevo. 2023. Available online: https://bhas.gov.ba/data/Publikacije/Saopstenja/2023/ENV_01_2022_Y1_1_BS.pdf (accessed on 25 April 2024).
  32. Government of Republic of Srpska. Waste Management Plan for Republic of Srpska. 2019. Available online: https://www.vladars.net/sr-SP-Cyrl/Vlada/Ministarstva/mgr/Documents/%D0%A0%D0%B5%D0%BF%D1%83%D0%B1%D0%BB%D0%B8%D1%87%D0%BA%D0%B8%20%D0%BF%D0%BB%D0%B0%D0%BD%20%D1%83%D0%BF%D1%80%D0%B0%D0%B2%D1%99%D0%B0%D1%9A%D0%B0%20%D0%BE%D1%82%D0%BF%D0%B0%D0%B4%D0%BE%D0%BC%20%D0%B7%D0%B0%20%D0%BF%D0%B5%D1%80%D0%B8%D0%BE%D0%B4%202019-2029_599263879.pdf (accessed on 13 July 2024).
  33. Bibra, M.; Samanta, D.; Kumar Sharma, N.; Singh, G.; Johnson, G.R.; Sani, R.K. Food waste to bioethanol: Opportunities and Challenges. Fermentation 2023, 9, 8. [Google Scholar] [CrossRef]
  34. Millati, R.; Niklasson, C.; Taherzadeh, M.J. Effect of pH, time and temperature of overliming on detoxification of dilute-acid hydrolyzates for fermentation by Saccharomyces cerevisiae. Process Biochem. 2002, 38, 515–522. [Google Scholar] [CrossRef]
  35. Seong, H.A.; Lee, J.S.; Yoon, S.Y.; Song, W.Y.; Shin, S.Y. Fermentation characteristics of acid hydrolysates by different neutralizing agents. Int. J. Hydrogen Energy 2016, 41, 16365–16372. [Google Scholar] [CrossRef]
  36. Martinez, A.; Rodriguez, M.E.; York, S.W.; Preston, J.F.; Ingram, L.O. Effects of Ca(OH)2 treatments (‘overliming’) on the composition and toxicity of bagasse hemicellulose hydrolysates. Biotechnol. Bioeng. 2000, 69, 526–536. [Google Scholar] [CrossRef]
  37. Smith, Z.; Isaac, B.; Tumuluru, J.S.; Yancey, N. Grinding and Pelleting Characteristics of Municipal Solid Waste Fractions. Energies 2024, 17, 29. [Google Scholar] [CrossRef]
  38. Kappe, J.; Sautner, K.H. Process for the Manufacture of Bioethanol. World Intellectual Property Organization. 2009, WO2009072878A1. Available online: https://patents.google.com/patent/WO2009072878A1/en (accessed on 1 July 2024).
  39. Kumar, D.; Murthy, G.S. Impact of pretreatment and downstream processing technologies on economics and energy in cellulosic ethanol production. Biotechnol. Biofuels 2011, 4, 27. [Google Scholar] [CrossRef]
  40. Ebrahimian, F.; Khoshnevisan, B.; Mohammadi, A.; Karimi, K.; Birkved, M. A biorefinery platform to valorize organic fraction of municipal solid waste to biofuels: An early environmental sustainability guidance based on life cycle assessment. Energy Convers. Manag. 2023, 283, 116925. [Google Scholar] [CrossRef]
  41. Sarker, S.; Lamb, J.J.; Hjelme, D.R.; Lien, K.M. A Review of the Role of Critical Parameter in the Design and Operation of Biogas Production Plants. Appl. Sci. 2019, 9, 1915. [Google Scholar] [CrossRef]
  42. Gupte, A.P.; Di Vita, N.; Myburgh, M.W.; Cripwell, R.A.; Basaglia, M.; Van Zyl, W.H.; Viljoen-Bloom, M.; Casella, S.; Favaro, L. Consolidated bioprocessing of the organic fraction of municipal waste into bioethanol. Energy Convers. Manag. 2024, 302, 118105. [Google Scholar] [CrossRef]
  43. Sánchez-Martín, L.; Ortega Romero, M.; Llamas, B.; Suárez Rodríguez, M.d.C.; Mora, P. Cost Model for Biogas and Biomethane Production in Anaerobic Digestion and Upgrading. Case Study: Castile and Leon. Materials 2023, 16, 359. [Google Scholar] [CrossRef] [PubMed]
  44. Kim, J.Y.; Salim, S.; Cha, J.M.; Park, S. Development of Total Capital Investment Estimation Module for Waste Heat Power Plant. Energies 2019, 12, 1492. [Google Scholar] [CrossRef]
  45. Tax Administration Office of Republic of Srpska. Decision on the Lowest Salary in the Republic of Srpska for 2024. Available online: https://poreskaupravars.org/wp-content/uploads/2024/02/Scan05012024.pdf (accessed on 1 July 2024).
  46. ChemAnalyst. Commodity Prices Database. Available online: https://www.chemanalyst.com/ (accessed on 1 July 2024).
  47. Global Petrol Prices. Gasoline Prices. Available online: https://www.globalpetrolprices.com/gasoline_prices/ (accessed on 1 July 2024).
  48. Republic of Srpska Institute of Statistics. Statistical Yearbook Republic of Srpska 2023. Available online: https://www.rzs.rs.ba/static/uploads/bilteni/godisnjak/2023/StatistickiGodisnjak_2023_WEB.pdf (accessed on 1 July 2024).
  49. Safaat, M.; Wulan, P.P.D.K. Technoeconomic Analysis of Integrated Bioethanol from Elephant Grass (Pennisetum purpureum) with Utilization of Its Residue and Lignin. Ind. J. Teknol. Dan Manaj. Agroindustri 2022, 11, 64–80. [Google Scholar] [CrossRef]
  50. Pan, S.; Zabed, H.M.; Zhao, M.; Qi, X.; Wei, Y. Techno-economic and life cycle assessments for bioenergy recovery from acid-hydrolyzed residues of sugarcane bagasse in the biobased xylose production platform. J. Clean. Prod. 2023, 400, 136718. [Google Scholar] [CrossRef]
  51. Global Petrol Prices. Ethanol Prices. Available online: https://www.globalpetrolprices.com/ethanol_prices/ (accessed on 1 July 2024).
  52. Statista. Monthly Price for Fertilizers from 2022 to 2024, by Product. Available online: https://www.statista.com/statistics/1288602/quarterly-fertilizer-price-development-by-product/ (accessed on 1 July 2024).
Figure 1. Block diagrams of different case scenarios for organic municipal waste conversion to ethanol and biogas: scenario 1—green; scenario 2—orange; scenario 3—red; scenario 4—blue.
Energies 17 04286 g001
Figure 2. Process flow diagram of integrated bioethanol and biogas production from organic municipal waste according to scenario 1, where the raw material undergoes multi-stage hydrolysis.
Energies 17 04286 g002
Figure 3. Process flow diagram of integrated bioethanol and biogas production from organic municipal waste according to scenario 2, where the raw material undergoes simultaneous hydrolysis; scenario 3, where part of the material is sent directly to biogas production before hydrolysis (red flow splitter and red stream line); and scenario 4, where part of the raw material is sent directly to biogas production after hydrolysis (blue flow splitter and blue stream line). The purple flow mixer is introduced for both scenarios 3 and 4.
Energies 17 04286 g003
Figure 4. Share of major cost items for: (A)—raw material; (B)—utilities; (C)—operating costs.
Energies 17 04286 g004
Figure 5. The influence of the flow split factor for OMW to ethanol/biogas production on profitability markers of SC3 and SC4: (A)—TCI and Production Rate (PR); (B)—OC, Credits (CR), and Net OC (NOC); (C)—Revenues; (D)—UPC, NUPC, and UPR; (E)—GM, ROI, and IRR, (F)—PBT and NPV.
Energies 17 04286 g005
Figure 6. Sensitivity analysis of SC2 in terms of ethanol selling price influence on NPV.
Energies 17 04286 g006
Figure 7. The influence of OMW composition (carbohydrates, lipids, and proteins content) on NPV for SC2.
Energies 17 04286 g007
Table 1. Chemical composition of the process inlet stream (organic municipal waste).
ComponentFlowrate
kg/h
Mass Composition
%
Moisture3880.80064.6800
Starch607.36210.1227
Cellulose329.9585.4993
Hemicellulose173.9882.8998
Monosaccharides107.0221.7837
Lignin186.0663.1011
Lipids270.8344.5139
Protein301.7525.0292
Ash142.2182.3703
Total6000.000100.0000
Table 3. Fixed capital estimate summary for SC1 and SC2 (prices in $).
ItemSC1SC2
Total Plant Direct Capital (TPDC)
1. Equipment Purchase Cost10,430,0006,415,000
2. Installation1,739,0001,042,000
3. Process Piping626,000385,000
4. Instrumentation313,000192,000
5. Insulation104,00064,000
6. Electrical417,000257,000
7. Buildings522,000321,000
8. Yard Improvement209,000128,000
9. Auxiliary Facilities417,000257,000
TPDC14,777,0009,061,000
Total Plant Indirect Cost (TPIC)
10. Engineering443,000272,000
11. Construction1,034,000634,000
TPIC1,478,000906,000
Total Plant Cost (TPC = TPDC + TPIC)
TPC16,255,0009,967,000
Contractor’s Fee & Contingency (CFC)
12. Contractor’s Fee488,000299,000
13. Contingency1,138,000698,000
CFC = 12 + 131,625,000997,000
Direct Fixed Capital Cost (DFC = TPC + CFC)
DFC17,880,00010,964,000
14. Working Capital393,000340,000
15. Startup and Validation536,000329,000
Total Capital Investment (TCI = DFC + 14 + 15)
TCI18,810,00011,633,000
Table 4. Annual operating costs summary for SC1 and SC2.
Cost ItemUnit CostSource
Labor
Labor5.750 $/h[45]
Bulk Materials
α-amylase3.000 $/kgLocal supplier
Ca(OH)20.130 $/kg[46]
Cellulase3.500 $/kgLocal supplier
Gasoline1.320 $/kg[47]
Glucoamylase4.500 $/kgLocal supplier
H2SO4 (98% w/w)0.059 $/kg[46]
KOH0.580 $/kg[46]
OMW0.000 $/kgN.A.
Water0.0003 $/kg[48]
Biomass5.000 $/kgLocal supplier
Utilities
Std Power0.070 $/kWh[48]
Steam12.000 $/MT[48]
Cooling Water0.050 $/MT[48]
Chilled Water0.400 $/MT[48]
CT Water0.070 $/MT[48]
Table 5. Profitability analysis for SC1 and SC2.
ItemSC1SC2
ValueUnitValueUnit
Revenue/Credit Production Rates
Gypsum (Revenue)2263MT/yr--
Ethanol (Main Revenue)5,200,807L(STP)/yr5,314,850L(STP)/yr
Steam (Revenue)42,497MT/yr41,895MT/yr
Fertilizer (Revenue)9208MT/yr10,204MT/yr
Electricity (Credit)7,568,590kWh/yr7,444,602kW-h/yr
Annual Revenues/Credits
Gypsum (Revenue)22,632$/yr--
Ethanol (Main Revenue)6,709,041$/yr6,856,156$/yr
Steam (Revenue)509,966$/yr502,741$/yr
Fertilizer (Revenue)1,519,370$/yr1,683,584$/yr
Electricity (Credit)1,210,974$/yr1,191,136$/yr
Total Revenues8,761,009$/yr9,042,481$/yr
Total Credits1,210,974$/yr1,191,136$/yr
Operating Cost (OC)
Actual OC4,995,000$/yr4,220,000$/yr
Net OC3,784,000$/yr3,029,000$/yr
Unit Production Cost/Revenue
Unit Production Cost (UPC)0.96$/L(STP) MP0.79$/L(STP) MP
Net Unit Production Cost (NUPC)0.73$/L(STP) MP0.57$/L(STP) MP
Unit Production Revenue (UPR)1.68$/L(STP) MP1.70$/L(STP) MP
Gross Profit4,977,000$/yr6,014,000$/yr
Taxes (20%)995,000$/yr1,203,000$/yr
Net Profit3,982,000$/yr4,811,000$/yr
Gross Margin (GM)56.81%66.51%
Return On Investment (ROI)21.17%41.36%
Payback Time (PBT)4.72years2.42years
Internal Rate of Return (IRR)13.61%28.87%
Net Present Value (NPV)9,875,468$23,951,483$
Disclaimer/Publisher’s Note: The statements, opinions and data contained in all publications are solely those of the individual author(s) and contributor(s) and not of MDPI and/or the editor(s). MDPI and/or the editor(s) disclaim responsibility for any injury to people or property resulting from any ideas, methods, instructions or products referred to in the content.

