Article

Heat Pipe-Based Cooling Enhancement for Photovoltaic Modules: Experimental and Numerical Investigation

by
Shuailing Ma
1,2,
Yingai Jin
1,2,* and
Firoz Alam
3
1
National Key Laboratory of Automotive Chassis Integration and Bionics, Changchun 130022, China
2
College of Automotive Engineering, Jilin University, Changchun 130022, China
3
School of Engineering (Aerospace, Mechanical and Manufacturing), Royal Melbourne Institute of Technology University, Melbourne, VIC 3000, Australia
*
Author to whom correspondence should be addressed.
Energies 2024, 17(17), 4272; https://doi.org/10.3390/en17174272
Submission received: 28 April 2024 / Revised: 24 June 2024 / Accepted: 26 June 2024 / Published: 27 August 2024

Abstract

:
High temperatures in photovoltaic (PV) modules lead to the degradation of electrical efficiency. To address the challenge of reducing the temperature of photovoltaic modules and enhancing their electrical power output efficiency, a simple but efficient photovoltaic cooling system based on heat pipes (PV-HP) is introduced in this study. Through experimental and numerical investigations, this study delves into the temperature characteristics and power output performance of the PV-HP system. Orthogonal tests are conducted to discern the influence of different factors on the PV-HP system. The experimental findings indicate that the performance of the PV-HP system is superior to that of the single system without heat pipes. The numerical simulation shows the effects of system structural parameters (number of heat pipes, angle of heat pipe condensation section) on system temperature and power output performance. The numerical simulation results show that increasing the angle of the heat pipe condensation section and the number of heat pipes leads to a significant drop in system temperature and an increase in the efficiency of the photovoltaic cells.

1. Introduction

Relying solely on traditional energy sources cannot meet human needs; there is also a need to develop renewable energy sources [1]. With the emergence of solar energy technology worldwide in regions with hot weather and intense sunlight, the high temperature of photovoltaic (PV) cells has become one of the primary concerns [2]. Research indicates that approximately 9% to 12% of the sunlight incident on the surface of PV cells is directly converted into electrical energy, while the remaining approximately 80% is converted in the form of heat energy [3]. Additionally, the electricity generation efficiency of PV modules is influenced by their temperature. A temperature increases of 1 °C results in a decrease in the electricity generation efficiency of PV modules by 0.3% to 0.5% [4].
Researchers have long been interested in finding efficient cooling methods for PV panels [5]. Photovoltaic cell cooling methods can generally be categorized into active cooling [6] and passive cooling [7]. Active cooling systems require external power to operate devices such as fans or pumps, which then act on the surface of the cells to remove heat. The main forms of active cooling include forced-air cooling [8,9], water cooling [10], and nanofluid cooling [11]. Due to the use of active components, active cooling demonstrates higher heat dissipation capacity during PV cooling processes compared to passive cooling, making it more effective in improving the electrical efficiency of photovoltaic cells. Passive cooling systems do not require additional power for cooling PV panels and do not incur parasitic energy consumption [12]. The temperature of PV cells is regulated by various methods including phase change material (PCM) [13], heat pipe [14], liquid immersion [15], radiative cooling [16], etc. The aforementioned cooling techniques primarily focus on efficiently dissipating heat from PV cells. And there is extensive research exploring PV cooling systems using spectral beam-splitting technology (BSPT) [17]. By employing spectral beam-splitting filters, it is possible to selectively absorb useful solar radiation, effectively mitigating the issue of excessive temperature in PV cells [18]. Beam-splitting technology is typically utilized in concentrated PV systems. This technique, through concentrating and splitting sunlight, effectively enhances the energy utilization efficiency of PV systems [19]. Analyzing various types of cooling systems reveals that heat pipe cooling consumes no additional energy and possesses excellent thermal conductivity, effectively reducing the temperature of PV cells. Theoretical and experimental investigations have been conducted to understand the thermal performance of PV modules employing heat pipes. Alizadeh et al. [20] conducted a numerical investigation on a pump heat pipe (PHP)-based PV cooling system. The results revealed that the use of heat pipes as passive cooling mechanisms improves the yield, resulting in an 18% increase in electrical power output and a 10% reduction in payback period compared to an active water-cooled PV system. Additionally, Amri et al. [21] conducted a systematic theoretical analysis of the heat transfer process in heat pipe-based flat-plate solar collectors and determined experimentally the optimal ratio between the evaporation and condensation sections of the heat pipe. Du et al. [22] designed a system consisting of solar cells and nano-coated heat pipe plates for thermal management. Using a conjugate heat transfer model, they calculated the temperature of the solar cells and the corresponding evaporative heat flux density. The results indicated that heat pipes can provide sufficient cooling for solar cells under varying solar irradiance levels. Moradgholi et al. [23] proposed a photovoltaic/thermal (PV/T) hybrid system that utilizes heat pipes to absorb excess heat from solar PV cells and maintain isothermal conditions. During springtime, the average electricity generation of the PV/T system was found to be 5.67% higher compared to a standalone PV system. Koundinya et al. [24] utilized finned heat pipes to reduce operating temperatures. They conducted experiments on a prototype and compared the results with computational simulations. The findings indicated that employing this method can achieve a maximum temperature reduction of 13.8 K. There is a mismatch between the instantaneous presence of solar energy and the user’s energy needs, and phase change materials can store some of the energy [25]. Zhou et al. [26] proposed a new configuration for a photovoltaic–thermal management system utilizing phase change materials (PCMs) coupled with heat pipes (PV-PCM/HP). Experimental results demonstrated that the performance of the coupled PCM/HP system surpassed that of a single system. Soliman et al. [27] conducted an experimental study on the performance of concentrated solar cells using flat heat pipes for cooling. The results showed that photovoltaic cell efficiency and output power increased with an increase in the length of the heat pipe condenser and decreased as the length of the adiabatic section was reduced. Ji et al. [28] proposed a new type of heat pipe system with dual condensers and analyzed its performance under different climatic conditions. The results indicate that the system exhibits stable performance and is suitable for various climate conditions. Fu and his team [29] examined the performance of the proposed novel vacuum tube PV/T system with heat pipes through experiments and solving the system’s energy model. The results show that the new vacuum tube PV/T system can significantly reduce the photovoltaic temperature, and the overall efficiency can reach 68.44%.
Furthermore, the energy on the photovoltaic cells that is not used for electricity generation can be stored and utilized [30]. Soliman et al. [31] designed a sliding window system integrating phase change materials (PCMs) with photovoltaic cells. Through heat transfer facilitated by the phase change materials, this design not only reduces the temperature of the photovoltaic cells but also lowers the temperature of the inner walls. Meanwhile, Wang et al. [32] designed a solar energy insulation system for buildings using flat-plate heat pipes and phase change materials (PCMs). Their results indicate that increasing the tilt angle of the flat-plate heat pipe condensation section prolongs the complete melting time of the PCM. Ji et al. [28] conducted simulation analyses of a heat pipe PV/T system operation in various regions during summer and winter. The results indicate that in the summer heating water mode, the system can heat water from 25 °C to 46.1 °C. In winter heating mode for colder regions, the average air outlet temperature at the condensation section can reach 17.4 °C.
Based on the existing literature review, using heat pipes for photovoltaic (PV) cooling combined with forced-air cooling can effectively and rapidly reduce the temperature of PV cells. However, the anti-gravity performance of heat pipes directly affects their heat transfer efficiency. Therefore, this study integrates heat pipes with good anti-gravity performance with PV modules to design the PV-HP system, allowing PV modules to be installed at any angle and thereby expanding their range of applications. Additionally, an experimental testing system was constructed, and performance experiments were conducted to validate the superiority of the proposed system. Furthermore, simulation studies were carried out to analyze the impact of system structural parameters on system performance.

2. Experimental Setup

The schematic diagram of the PV-HP module is illustrated in Figure 1. The system mainly consists of a glass cover, PV layer, thermal conductive silicone layer, aluminum absorber plate, insulation cotton, and heat pipes. The heat pipes are adhered to the back of the PV modules with high-temperature resistant thermal conductive silicone grease and aluminum absorber plate, ensuring tight contact between the evaporation section of the heat pipe and the absorber plate. Additionally, insulation cotton is applied to the back of the photovoltaic panel, while the condensation section protrudes from the side of the panel to exchange heat with the surrounding environment.
The operating principle of the entire system is as follows: Solar energy absorbed by the PV modules is converted into heat, which is then transferred to the evaporation of the heat pipes. The heat is further transferred through the phase change of the working fluid inside the heat pipes, ultimately reaching the condensation of the heat pipes.

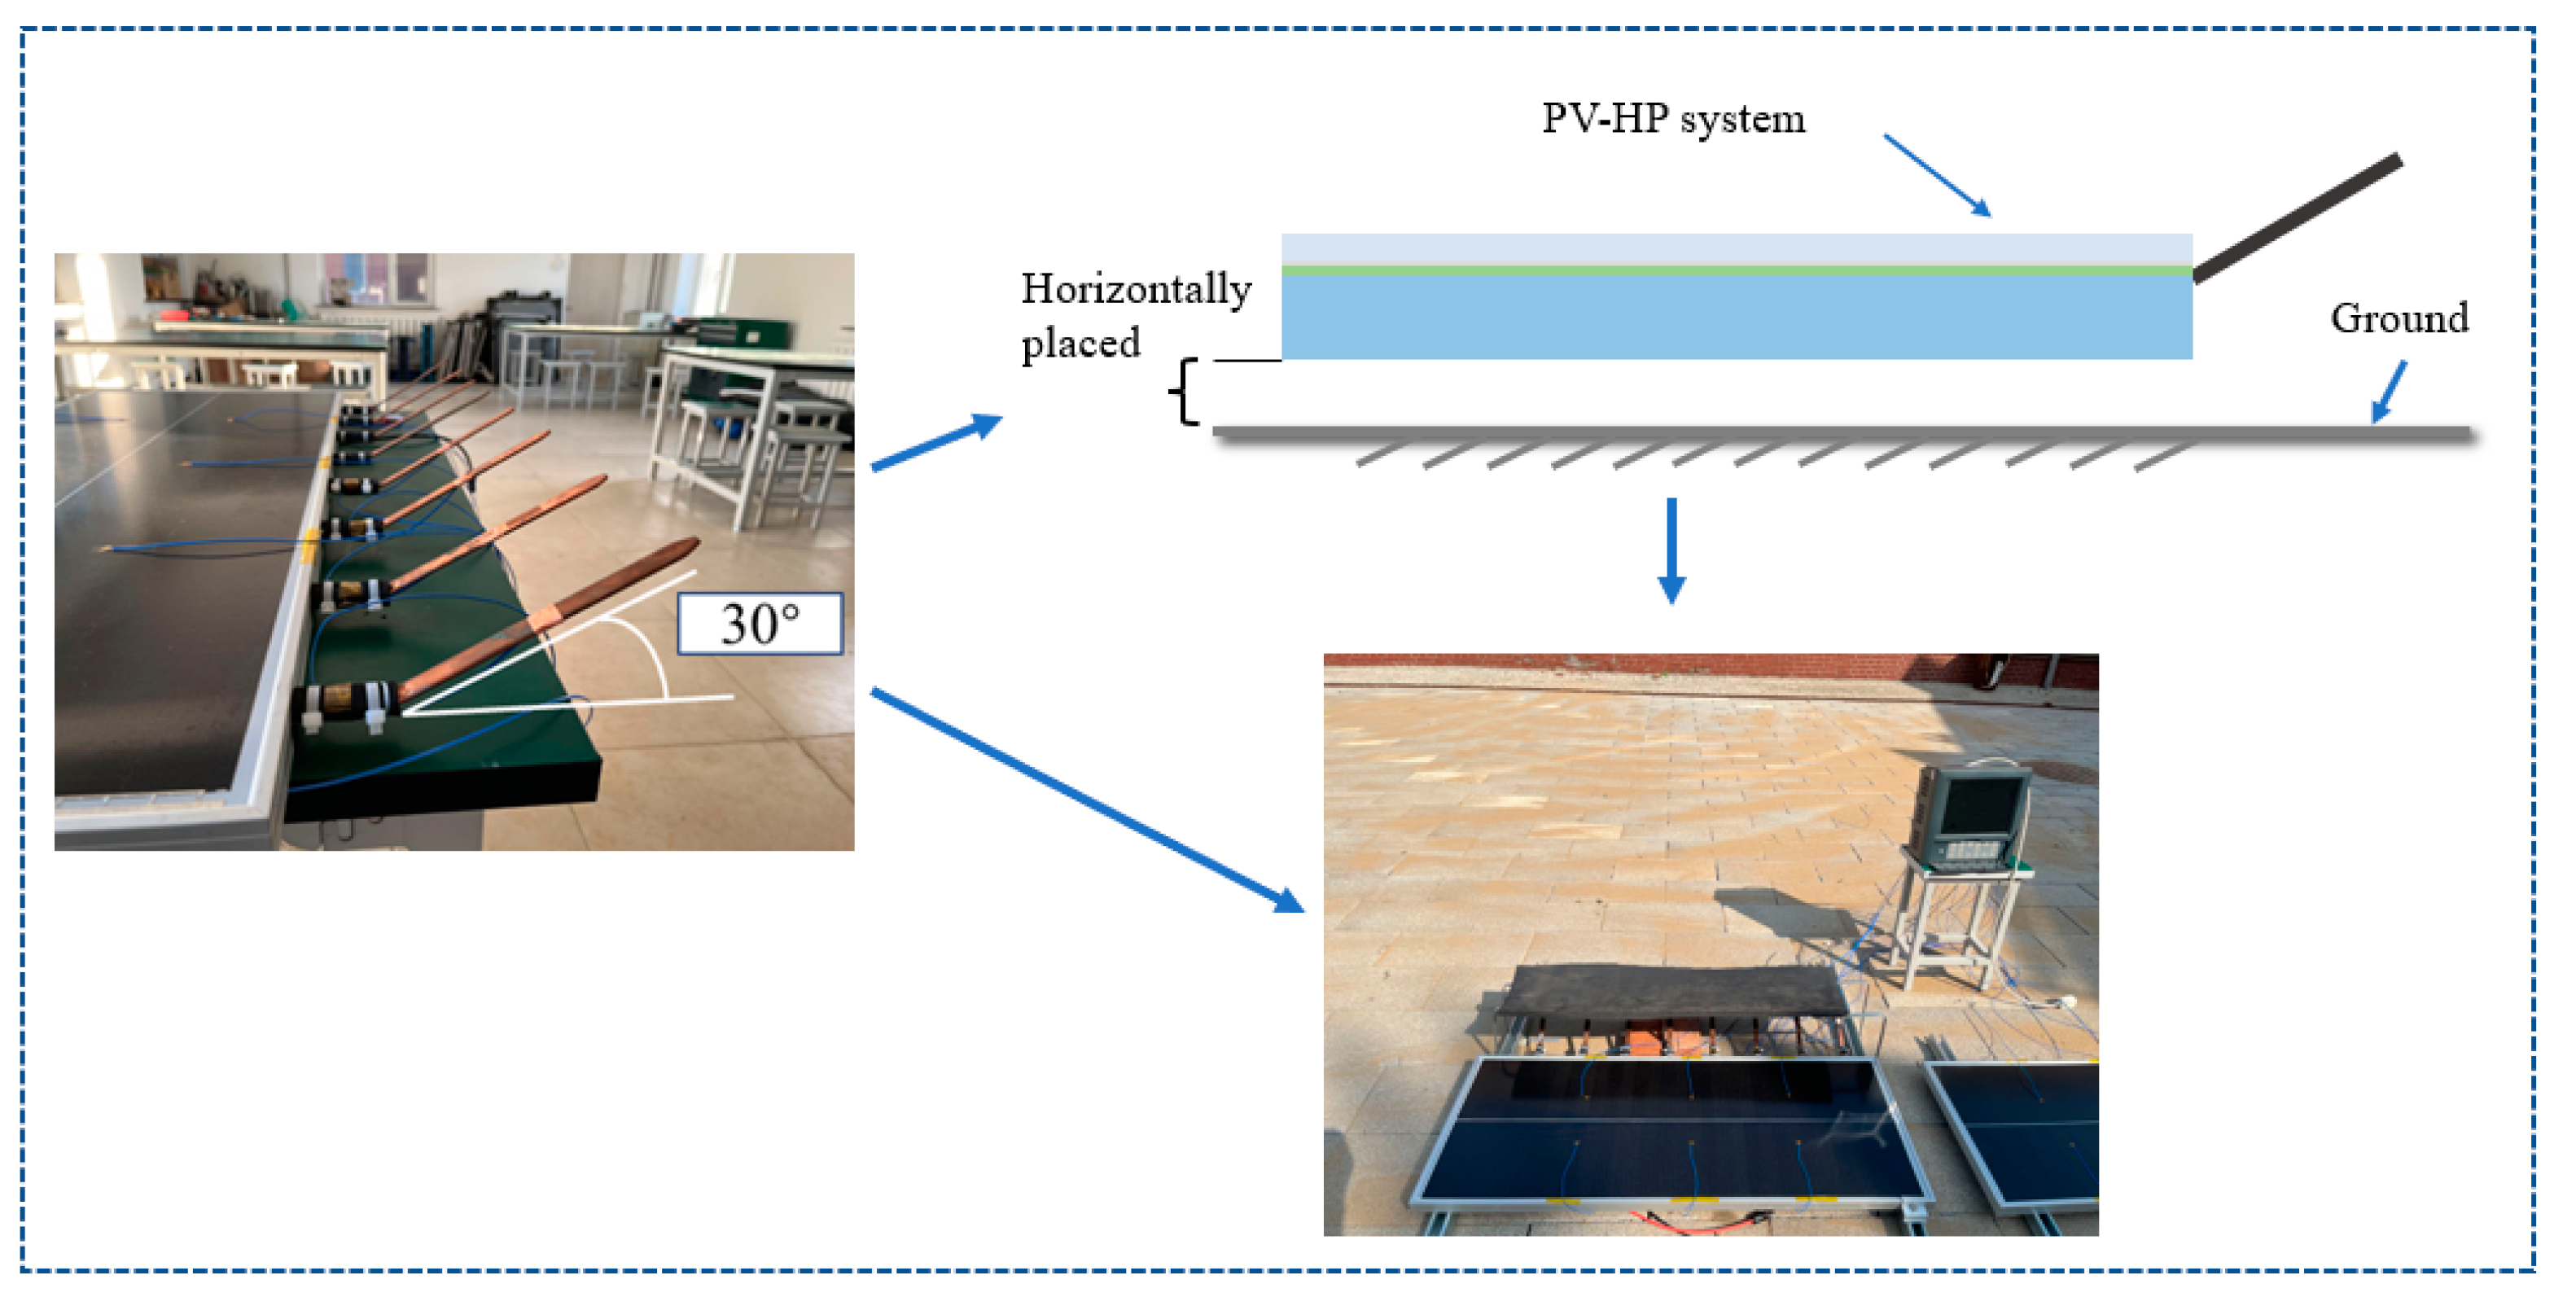
2.1. Experimental Setup

The experimental setup includes photovoltaic modules with dimensions of length = 1080 mm, width = 450 mm, and thickness = 30 mm. Additionally, to demonstrate the superiority of the established PV cooling system in temperature control and efficiency enhancement, a comparative experiment has been conducted using a PV module of the same size as a reference. Figure 2 depicts the schematic diagram of the PV-HP system. The main parameters of the PV-HP modules are listed in Table 1. The heat pipes are constructed of copper, with pure water serving as the internal working fluid. The cross-sectional dimensions of the heat pipes are 15 mm × 1.5 mm. The lengths of the evaporation section, condensation section, and adiabatic section of the heat pipes are 400 mm, 150 mm, and 50 mm, respectively. This heat pipe exhibits a thermal resistance of less than 0.1 °C/W, indicating high efficiency in thermal conduction.
The experiment was conducted in the Changchun area, Northeast China, with the performance testing period from 10:00 to 16:00 under clear to partly cloudy weather conditions. An experimental test system for the PV-HP module was constructed outdoors, as shown in Figure 3. Measurements in the experimental setup primarily include temperature, electrical power, and environmental parameters, with all data being transmitted to a computer for processing.
Temperature measurements were conducted using K-type thermocouples, which respectively record the temperature data of the PV modules’ surface and the heat pipes data, and the data were collected by a data logger. The measurement positions of the thermocouples are shown in Figure 4. Additionally, temperature cloud maps of the PV modules were generated by infrared camera. The I-V recorder was used to record the power generation status of the photovoltaic cells. The solar radiation received by the solar cells was recorded by a pyranometer, while the wind speed was recorded by a radiation detector. Using 5 identical cooling fans for air cooling, each fan has a power of 3.6 W, and the power supply for fans is provided separately. The parameters of the measuring instruments are listed in Table 2.

2.2. Experimental Results

2.2.1. Performance Comparison of Experiment Results

To investigate the overall daily performance of the PV-HP system, an outdoor experimental test was conducted on 10 June 2023, from 10:00 to 16:00. The experiment utilized a PV without cooling as the reference (PV-ref). The PV-HP system was set at an inclination angle of 40°. The solar irradiance and ambient temperature variations throughout the day are depicted in Figure 5a. On the experimental day, solar irradiance exhibited significant fluctuations between 11:30 and 12:30, with minor fluctuations during the remaining time periods. The maximum irradiance recorded was 937.12 W/m2, with an average of 591.79 W/m2, and irradiance levels above 650 W/m2 accounted for 50% of the total. Additionally, ambient temperature fluctuated within normal ranges, generally exhibiting an upward trend followed by a decline. The average temperature during the experimental period was 30.75 °C.
According to the curves depicted in Figure 5b, due to the thermal management effect of the heat pipes on the PV modules, the surface average temperature of the PV modules T(PV-HP) is lower compared to T(PV-ref). The temperature difference between them fluctuated within the range of 3 to 10 °C. The maximum value of T(PV-HP) recorded on the surface was 58.58 °C, with an average value of 45.32 °C. Conversely, the maximum value of T(PV-ref) observed on the PV module surface was 65.28 °C, with an average value of 52.79 °C. Throughout the entire experimental period, the average temperature difference between the two PV modules was 5.47 °C, representing a relative decrease in temperature of 10.36%. This reduction in temperature is equivalent to a potential increase in the theoretical power generation efficiency of the photovoltaic cells by 2.81%.
Figure 5c depicts the daily variation curves of the PV power (P(PV-HP) and P(PV-ref)). Due to the cooling effect of the heat pipes, the surface temperature of the PV modules in the PV-HP system is lower, resulting in an increase in power output during system operation. Throughout the entire experimental phase, the maximum value of the P(PV-HP) was recorded as 35.78 W, with an average value of 27.6 W. In comparison, the maximum value of P(PV-ref) was 32.75 W, with an average of 25.29 W. The maximum difference between the P(PV-HP) and P(PV-ref) was 5.24 W, with an average difference of 2.31 W. Instances where the power difference exceeded 2.5 watts accounted for 41.67% of the entire phase. The photovoltaic power output of the PV-HP system was thus 9.13% higher compared to the PV-ref.

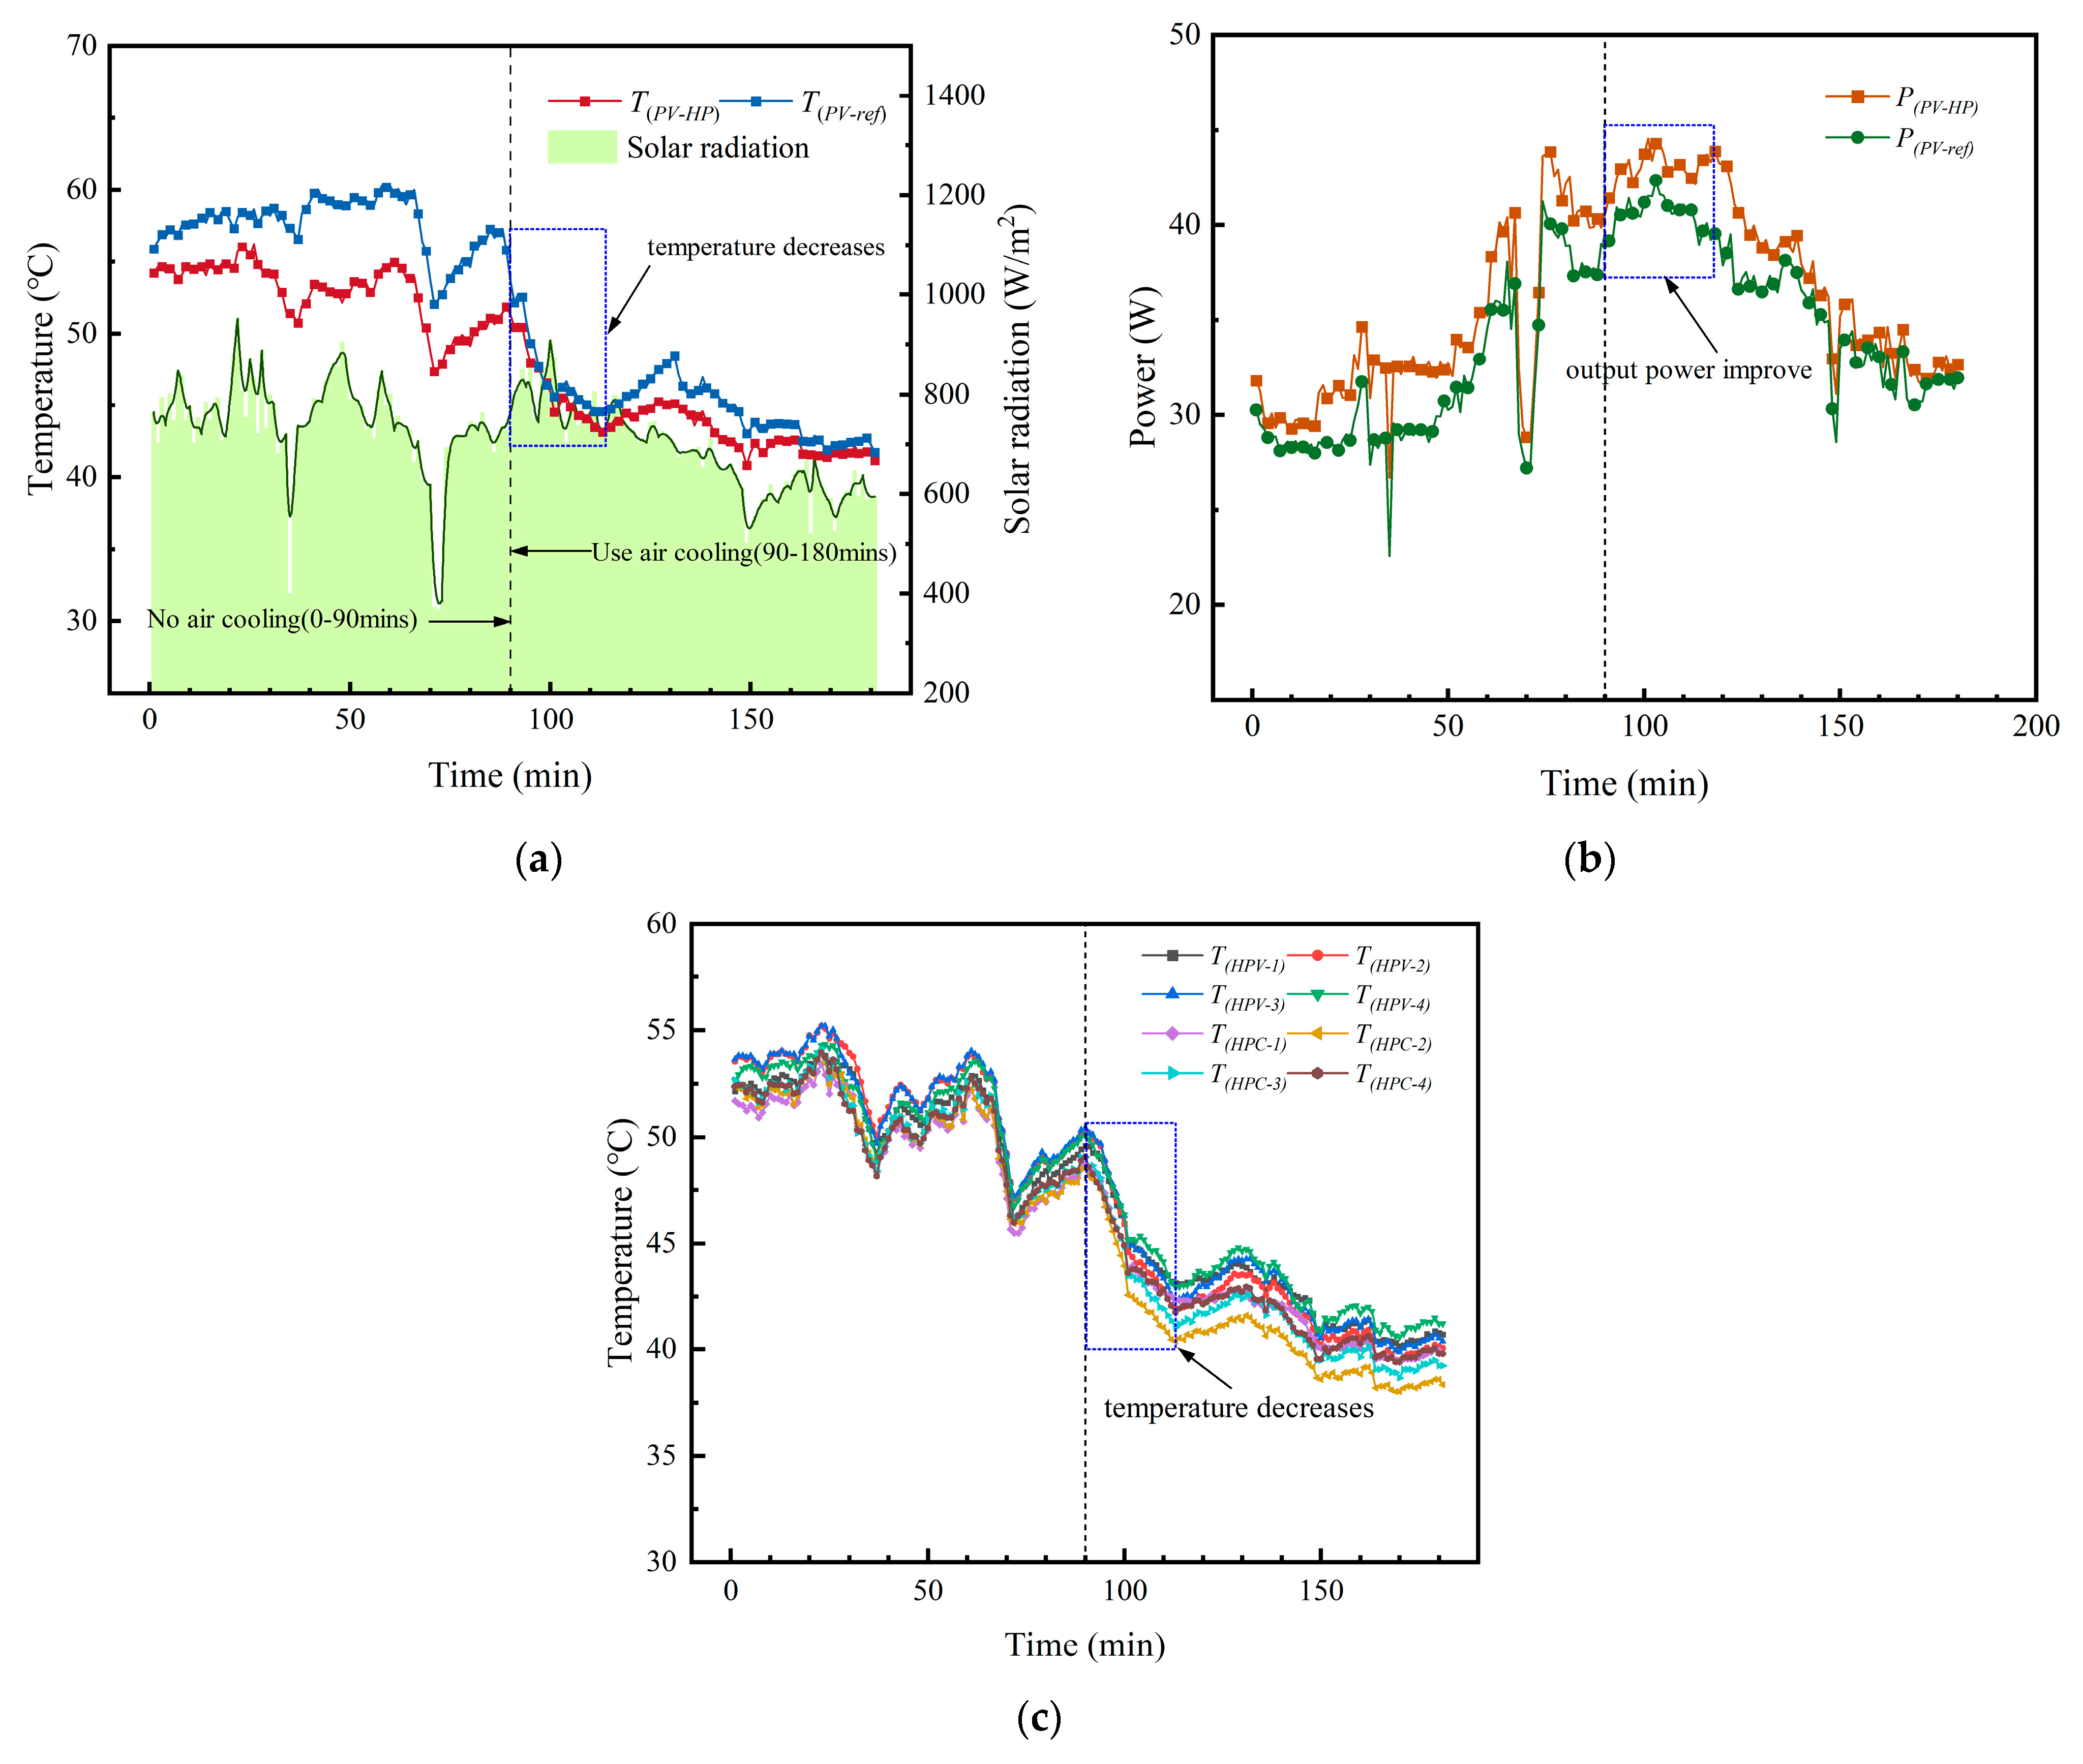
2.2.2. Impact of Air Cooling on the Performance of the PV-HP System

To investigate the impact of activating air cooling on the PV-HP system, an experiment was conducted on 2 September 2023, lasting 180 min. The experiment comprised two phases: the first 90 min without air cooling and the subsequent 90 min with air cooling (wind speed of the fan is 2.1 m/s). According to the variation curves of the PV modules surface temperature shown in Figure 6a, during the initial 0–90 min period, there was a significant difference between the values of the T(PV-HP) and T(PV-ref), with a maximum difference of 6.56 °C and an average temperature difference of 4.74 °C. Following the activation of air cooling during the 90–113 min period, both T(PV-HP) and T(PV-ref) rapidly decreased to their lowest points. Between 113 and 130 min, both of them experienced a slight rise, and from 130 to 180 min, the values of T(PV-HP) and T(PV-ref) fluctuated in response to variations in solar irradiance. After turning on the fan for 90–180 min, the average temperature difference between T(PV-HP) and T(PV-ref) was 1.42 °C, lower than the period before turning on the fan. This discrepancy can be attributed to structural factors. Specifically, the condensing section of the heat pipe is less affected by wind speed, resulting in smaller differences in cooling rates between the two temperatures.
Figure 6b shows the power variation of two PV modules. During the experiment, there were significant fluctuations in power generation at approximately the 33rd, 70th, and 150th minutes due to brief cloud cover. In the first 90 min of the experiment, the maximum value difference between P(PV-HP) and P(PV-ref) was 4.63 W, with an average difference of 2.49 W. The PV-HP exhibited a 10.15% improvement in power generation efficiency compared to the PV-ref. Between the 90th and 115th minutes, the addition of air cooling resulted in an improvement in power output; both PV-HP and PV-ref quickly reached their peak power output levels at the 103rd minute, and then fluctuated mainly in response to changes in solar radiation from the 120th minute until the end of the 180 min experiment. In the latter 90 min, the power generation efficiency of PV-HP was, on average, 5.36% higher than that of PV-ref.
Figure 6c indicates the temperatures of the evaporation and condensation sections (T(HPV) and T(HPC)) of the four heat pipes (as shown in Figure 2). It can be observed that the trends in temperature variation among the curves are consistent, and the differences are relatively small. After activating the air cooling, both T(HPV) (1,2,3,4) and T(HPC) (1,2,3,4) decreased rapidly. Between the 90th and 114th minutes, the temperatures of each evaporation and condensation section decreased to their lowest points at a relatively high rate. The average value differences between the T(HPV) and T(HPC) (1,2,3,4) were less than 1.8 K, indicating that the heat transfer capability of the heat pipes is good, and heat can effectively transfer from the evaporation sections to the condensation sections.

2.2.3. Impact of Angle of HPC on the Performance of the PV-HP System

The thermal conductivity of a gravity heat pipe is influenced by gravity. Tilting the heat pipe at a certain angle relative to the ground will facilitate the return of liquid working fluid at the condensation section, thereby accelerating heat transfer. In this study, the photovoltaic cells were placed horizontally, and only the condensation section of the heat pipe was bent at a certain angle to simplify the system. Additionally, to avoid damage to the outer wall of the heat pipe due to repeated bending, during the experiment, the condensation section of the heat pipe was bent to 30° in one step, while other angles (10°, 20°) were simulated through computational modeling, as shown in Figure 7.
The experiment was conducted from 11:00 to 14:00 on 11 September 2023. The temperature curves of PV-HP and PV-ref are shown in Figure 8a. In the first 90 min of the experiment, the maximum value difference between T(PV-HP) and T(PV-ref) was 4.27 °C, with an average difference of 2.8 °C. Between 90 and 115 min, T(PV-HP) and T(PV-ref) gradually decreased; from the 115th minute to the 180th minute, there were fluctuations in solar radiation, causing changes in T(PV-HP) and T(PV-ref). In the second 90 min, the maximum temperature difference between the two was 7.25 °C, with an average difference of 3.91 °C, compared to the first 90 min, there was an increase in the average temperature difference between T(PV-HP) and T(PV-ref). This increase is attributed to setting the condensing section to 30°, which allowed the airflow from the fan to not only affect the surface of the PV modules but also the condensation section of the heat pipes. The cooling effect of the airflow accelerated the phase change heat transfer within the pipes, facilitating better heat dissipation from the condensation section of the heat pipes.
Figure 8b illustrates the power variation between the PV-HP and the PV-ref when the angle of the condensation sections of the heat pipe are set to 30°. Between 0 and 90 min, air cooling was not employed, and the values of both P(PV-HP) and P(PV-ref) mainly followed variations in solar radiation, and P(PV-HP) was 5.25% higher than P(PV-ref). After activating the air cooling at the 90th minute, the temperature of the PV modules decreased, leading to an improvement in PV power output. P(PV-HP) and P(PV-ref) reached their maximum values at the 117th minute. Subsequently, as solar radiation fluctuated, PV power also began to fluctuate and decrease from the 117th minute to the 180th minute. During the period from 90 to 180 min, P(PV-HP) was 6% higher than P(PV-ref).
The temperature variation curves of the HPCs and HPVs are shown in Figure 8c. The trends in values of both T(HPC) and T(HPV) (1,2,3,4) remained consistent with the surface temperature variation trend of the PV modules. Within the period of 90 to 118 min after the implementation of air cooling, their values gradually decrease and reach their lowest point around 118 min.
Comparative analysis between Figure 6a and Figure 8a revealed that with the use of air cooling, different variations are observed in the temperature difference between T(PV-HP) and T(PV-ref). These differences are summarized in Table 3.

2.3. Analysis of Experimental Errors

Inevitable errors may occur during the experimental process, so it is necessary to assess whether the experimental errors are within a reasonable range. The following equations are used to determine the errors [33]:
R I = ( W I 2 3 ) 0.5
R E = d y y = f x 1 d x 1 y + f x 2 d x 2 y + + f x n d x n y
R M E = 1 N | R E | N
where R I means the error of directly measurable physical quantity; W I is the accuracy of the measuring instrument; R E is the error of indirectly measurable physical quantity; x i ( i = 1 , 2 , 3 , , n ) , the directly measurable physical quantities that cause errors in indirectly measurable physical quantities; f x i ( i = 1 , 2 , 3 , , n ) , error transmission coefficient of directly measurable physical quantities; R M E is relative average error.
According to the above formulas, the relative average errors for the photocurrent and the photovoltaic efficiency are calculated to be 3.51% and 4.12%, respectively.

3. Numerical Modeling

Due to constraints such as experimental time, equipment, and environmental conditions, it is not possible to comprehensively experimentally study all factors of the PV-HP system. Therefore, the operational characteristics of the PV-HP system using simulation methods have been chosen for investigation. In this study, a physical model and a mathematical model based on the constructed PV-HP experimental system have been developed. Figure 9 depicts a cross-sectional schematic of the physical model. Table 4 displays the main information for each layer of the PV-HP.

3.1. Mathematical Model

For the PV-HP system, the following assumptions are made to facilitate numerical analysis:
  • Solar light incidence is perpendicular to the surface of the photovoltaic panel.
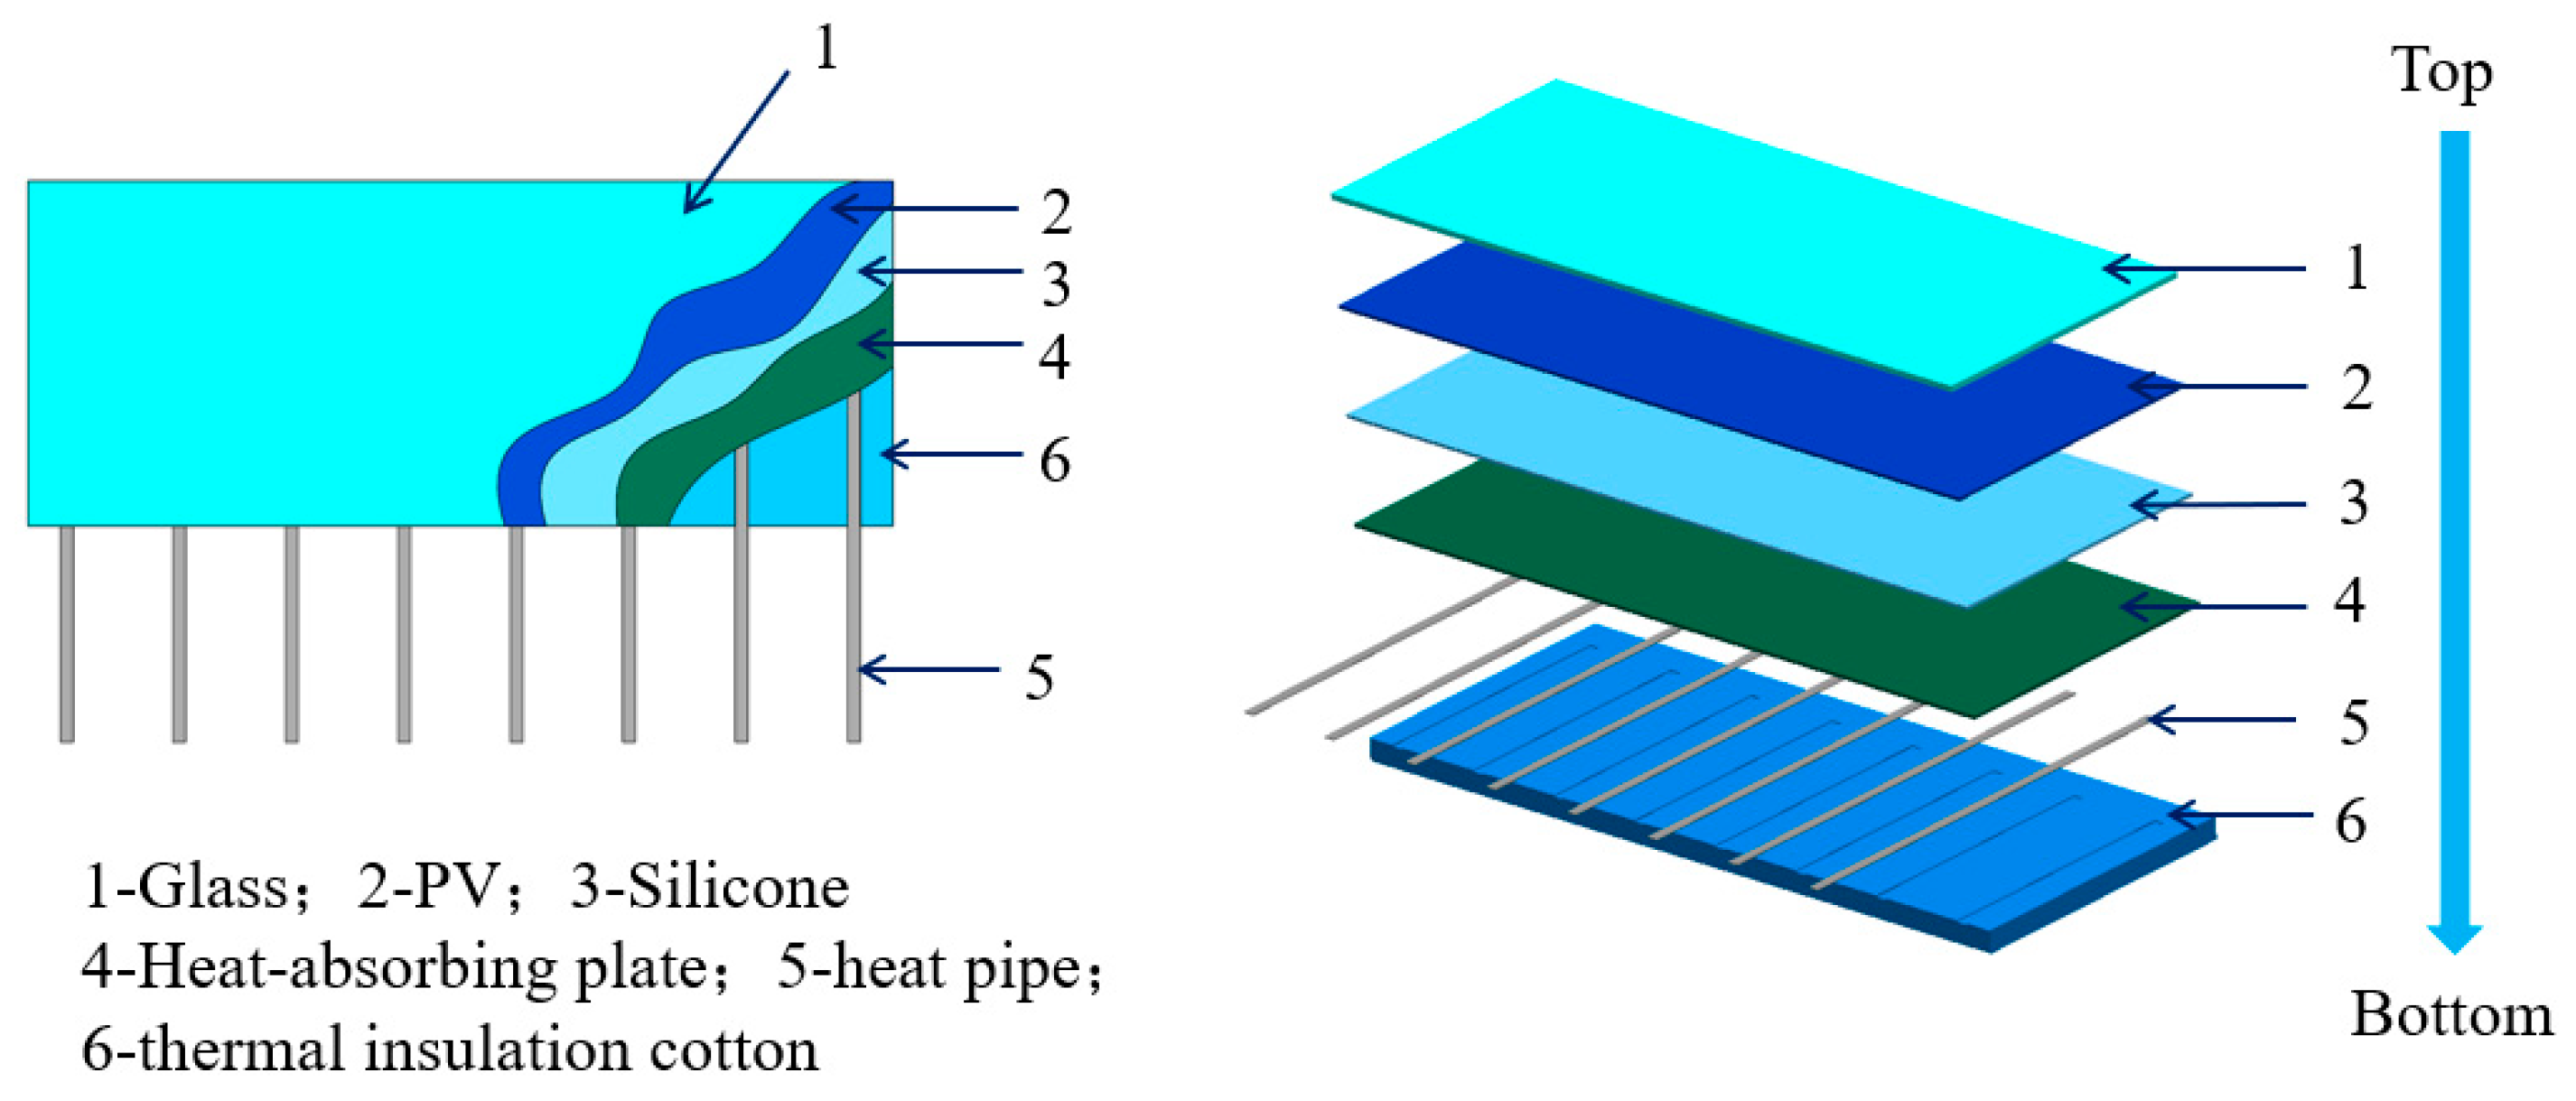
  • Photovoltaic assembly considers only the glass cover and the cell layer, which are closely integrated, neglecting any contact thermal resistance.
  • The aluminum frame is not considered, only the effective generating area is taken into account.
  • Thermal insulation cotton provides effective insulation, and there are no additional heat losses in the system.
  • Temperature distribution in the evaporation section of the heat pipe is uniform, disregarding any longitudinal heat conduction.
Based on the aforementioned assumptions, the energy transfer model for the PV-HP system is as follows [28]:
For glass cover
ρ g c g σ g T g t = h a ( T a T g ) + h s k y ( T s k y T g ) + h g , P V ( T P V T g ) + G α g
where ρ g is the density of glass, kg / m 3 ; c g is the specific heat capacity of glass (J/(kg·°C)), σ g is the thickness of glass, m; T a is the ambient temperature, °C; T s k y is the temperature of sky, °C, T s k y = 0.0552 T a 1.5 ; T g is the temperature of glass, °C; T P V is the temperature of PV, °C; G is the solar radiation, W / m 2 ; α g is the absorptivity of glass, 0.04; h a is the heat transfer coefficient between glass and the ambient environment; h s k y is the heat transfer coefficient between glass and the sky; h g , P V is the heat transfer coefficient between glass and the PV, (W/(m2·°C)).
h a , h s k y , h g , P V can be calculated using the following formula:
h a = 2.8 + 3.8 v
h s k y = ε g σ ( T s k y 2 + T g 2 ) ( T s k y + T g )
h g , P V = σ ( T P V 2 + T g 2 ) ( T P V + T g )
where v is the wind speed, m/s; ε g is the emissivity of the glass, 0.85; σ is the Stephen Boltzmann constant.
For the PV module
To simplify calculations, photovoltaic (PV) cells are assumed to be uniform and homogeneous. Materials such as Tedlar, EVA, PET, etc., within the PV module are not considered. Using an overall modeling approach to derive the energy balance equation for the PV panel, as follows:
ρ P V c P V σ P V T P V t = h g , P V ( T g T P V ) + G τ α P V + ( T a l T P V ) R s i E P V
where ρ P V is the density of PV, kg / m 3 ; c P V is the specific heat capacity of PV, (J/(kg·°C)); σ P V is the thickness of PV, m; T a l is the temperature of plate absorber, °C; R s i is the thermal resistance of silicone, (m2·°C)/W; E P V is the electric power of the PV cell, can be calculated using the following formula:
E P V = G τ α P V η P V
where τ is the transmissivity of glass, 0.91; α P V is the absorptivity of the photovoltaic panel to solar radiation, 0.9; η P V is the PV’s photoelectric conversion efficiency, has a linear relationship with the temperature of the photovoltaic panel as follows:
η P V = η ( 1 0.0045 ( T P V 25 ) )
where η is the photoelectric conversion efficiency of the photovoltaic cell under standard conditions ( T P V = 25 °C, G = 1000 W/m2), assumed to be 0.15 in this paper.
For the plate absorber
ρ a l c a l σ a l a l t = ( T P V T a l ) R s i + ( 1 β ) h a l , a ( T a T a l ) + β ( T H e v a T a l ) R s i
where ρ a l is the density of the plate absorber, kg / m 3 ; c a l is the specific heat capacity of the plate absorber, (J/(kg·°C)); σ a l is the thickness of the plate absorber, m; β is the ratio of the evaporator area of the heat pipe to the area of the photovoltaic backplane; T H e v a is the temperature of the heat pipe evaporator, °C; h a l , a is the heat transfer coefficient between the absorber plate and the surrounding environment, being calculated by the following formula:
h a l , a = 1 κ s λ s + 1 h s
where λ s is the thickness of thermal insulation cotton, m; κ s is thermal conductivity of insulation cotton, W/(m·°C); h s is the surface convective heat transfer coefficient between insulation cotton and air, W/(m·°C).
For the heat pipe
This paper simplifies the energy transfer of heat pipes, disregarding internal phase changes and wall thermal resistance.
ρ H e v a c H e v a σ H e v a T H e v a t = ( T H c o n T H e v a ) R e v a , c o n + β ( T a l T H e v a ) R s i + β h H e v a , a ( T a T H e v a )
where ρ H e v a is the density of the heat pipe evaporator, kg / m 3 ; c H e v a is the specific heat capacity of heat pipe evaporation, (J/(kg·°C)); σ H e v a is the thickness of heat pipe evaporation, m; R e v a , c o n is thermal resistance between the evaporator section and the condenser section of the heat pipe, (m2·°C)/W; T H c o n is the temperature of the heat pipe condensation, °C; h H e v a , a is the overall heat transfer coefficient between the evaporator section of the heat pipe and the air, being calculated by using following equations:
h H e v a , a = 1 κ h λ h + κ s λ s + 1 h s
where κ h , λ h are the thickness (m), and thermal conductivity (W/(m·°C)), respectively, of the heat pipe.
ρ H c o n c H c o n σ H c o n T H c o n t = ( T H e v a T H c o n ) R e v a , c o n + θ h H c o n , a ( T a T H c o n )
where ρ H c o n is the density of heat pipe condensation; c H c o n is the specific heat capacity of heat pipe condensation, (J/(kg·°C)); σ H c o n is the thickness of heat pipe condensation, m; h H c o n , a is the overall heat transfer coefficient between the condensation section of the heat pipe and the air, being calculated by Equation (16).
h H c o n , a = 1 κ h λ h + 1 h
Some important parameters and their values used in the mathematical model are shown in Table 5.

3.2. System Performance

The photovoltaic–electric (PV-HP) system’s photovoltaic efficiency is defined as the ratio of the electricity generated by the photovoltaic panel to the total solar radiation received by the photovoltaic panel, and the equation is:
η P V = U I G A
where U is the PV’s output voltage, V, and I is its output current, A; A is the photovoltaic cell area, m2.

3.3. Solution Methods

This study simplifies the boundary conditions used in the simulation as follows: (1) The PV-HP assembly is axisymmetric along the length and width direction. (2) Radiative heat transfer is not considered. (3) Good connections between different materials are assumed, and contact thermal resistance is ignored. The boundary conditions are set as shown in Figure 10.
The use of a User-Defined Function (UDF) to describe the PV module surface’s photovoltaic conversion and heat transfer processes was proposed. During the simulation, the phase change heat transfer process inside the heat pipes was not considered. Based on the high thermal conductivity of the heat pipe, it would be treated as a high-conductivity solid entity. The equivalent thermal conductivity coefficient was obtained from the theoretical formula provided in reference [35], set to 9000 W/(m·°C) in this study.
The simulation was conducted on the ANSYS 2022 platform. It employed a pressure-based segregated implicit solver for steady-state numerical calculations. Absolute velocity is used during the computation, and a coupled algorithm was employed for pressure–velocity coupling iterative calculations. Second-order upwind schemes were utilized for the momentum equation, turbulent kinetic energy equation, and turbulent dissipation rate equation to enhance computational accuracy. The convergence criterion for the energy equation was set to 10−6, while for the momentum equation, continuity equation, k equation, and epsilon equation, were set to 10−4. Additionally, monitoring was performed on the average temperature and heat transfer rate on the surface of the PV.
The number of grids can affect the simulation results, and the average temperature of the PV surface was selected as the evaluation criterion for grid independence verification. The average temperature of the photovoltaic surface was calculated under the same conditions (8 heat pipes, wind speed = 2 m/s, ambient temperature = 26.85 °C, solar radiation intensity = 800 W/m2) with different numbers of grids. The results are shown in Table 6. Comparing the results of the third calculation with the fourth and fifth calculations, the temperature error values vary between 0.002 and 0.008 °C. Considering both computational accuracy and computing resources, a model with 3,189,463 grids was selected for further numerical research.

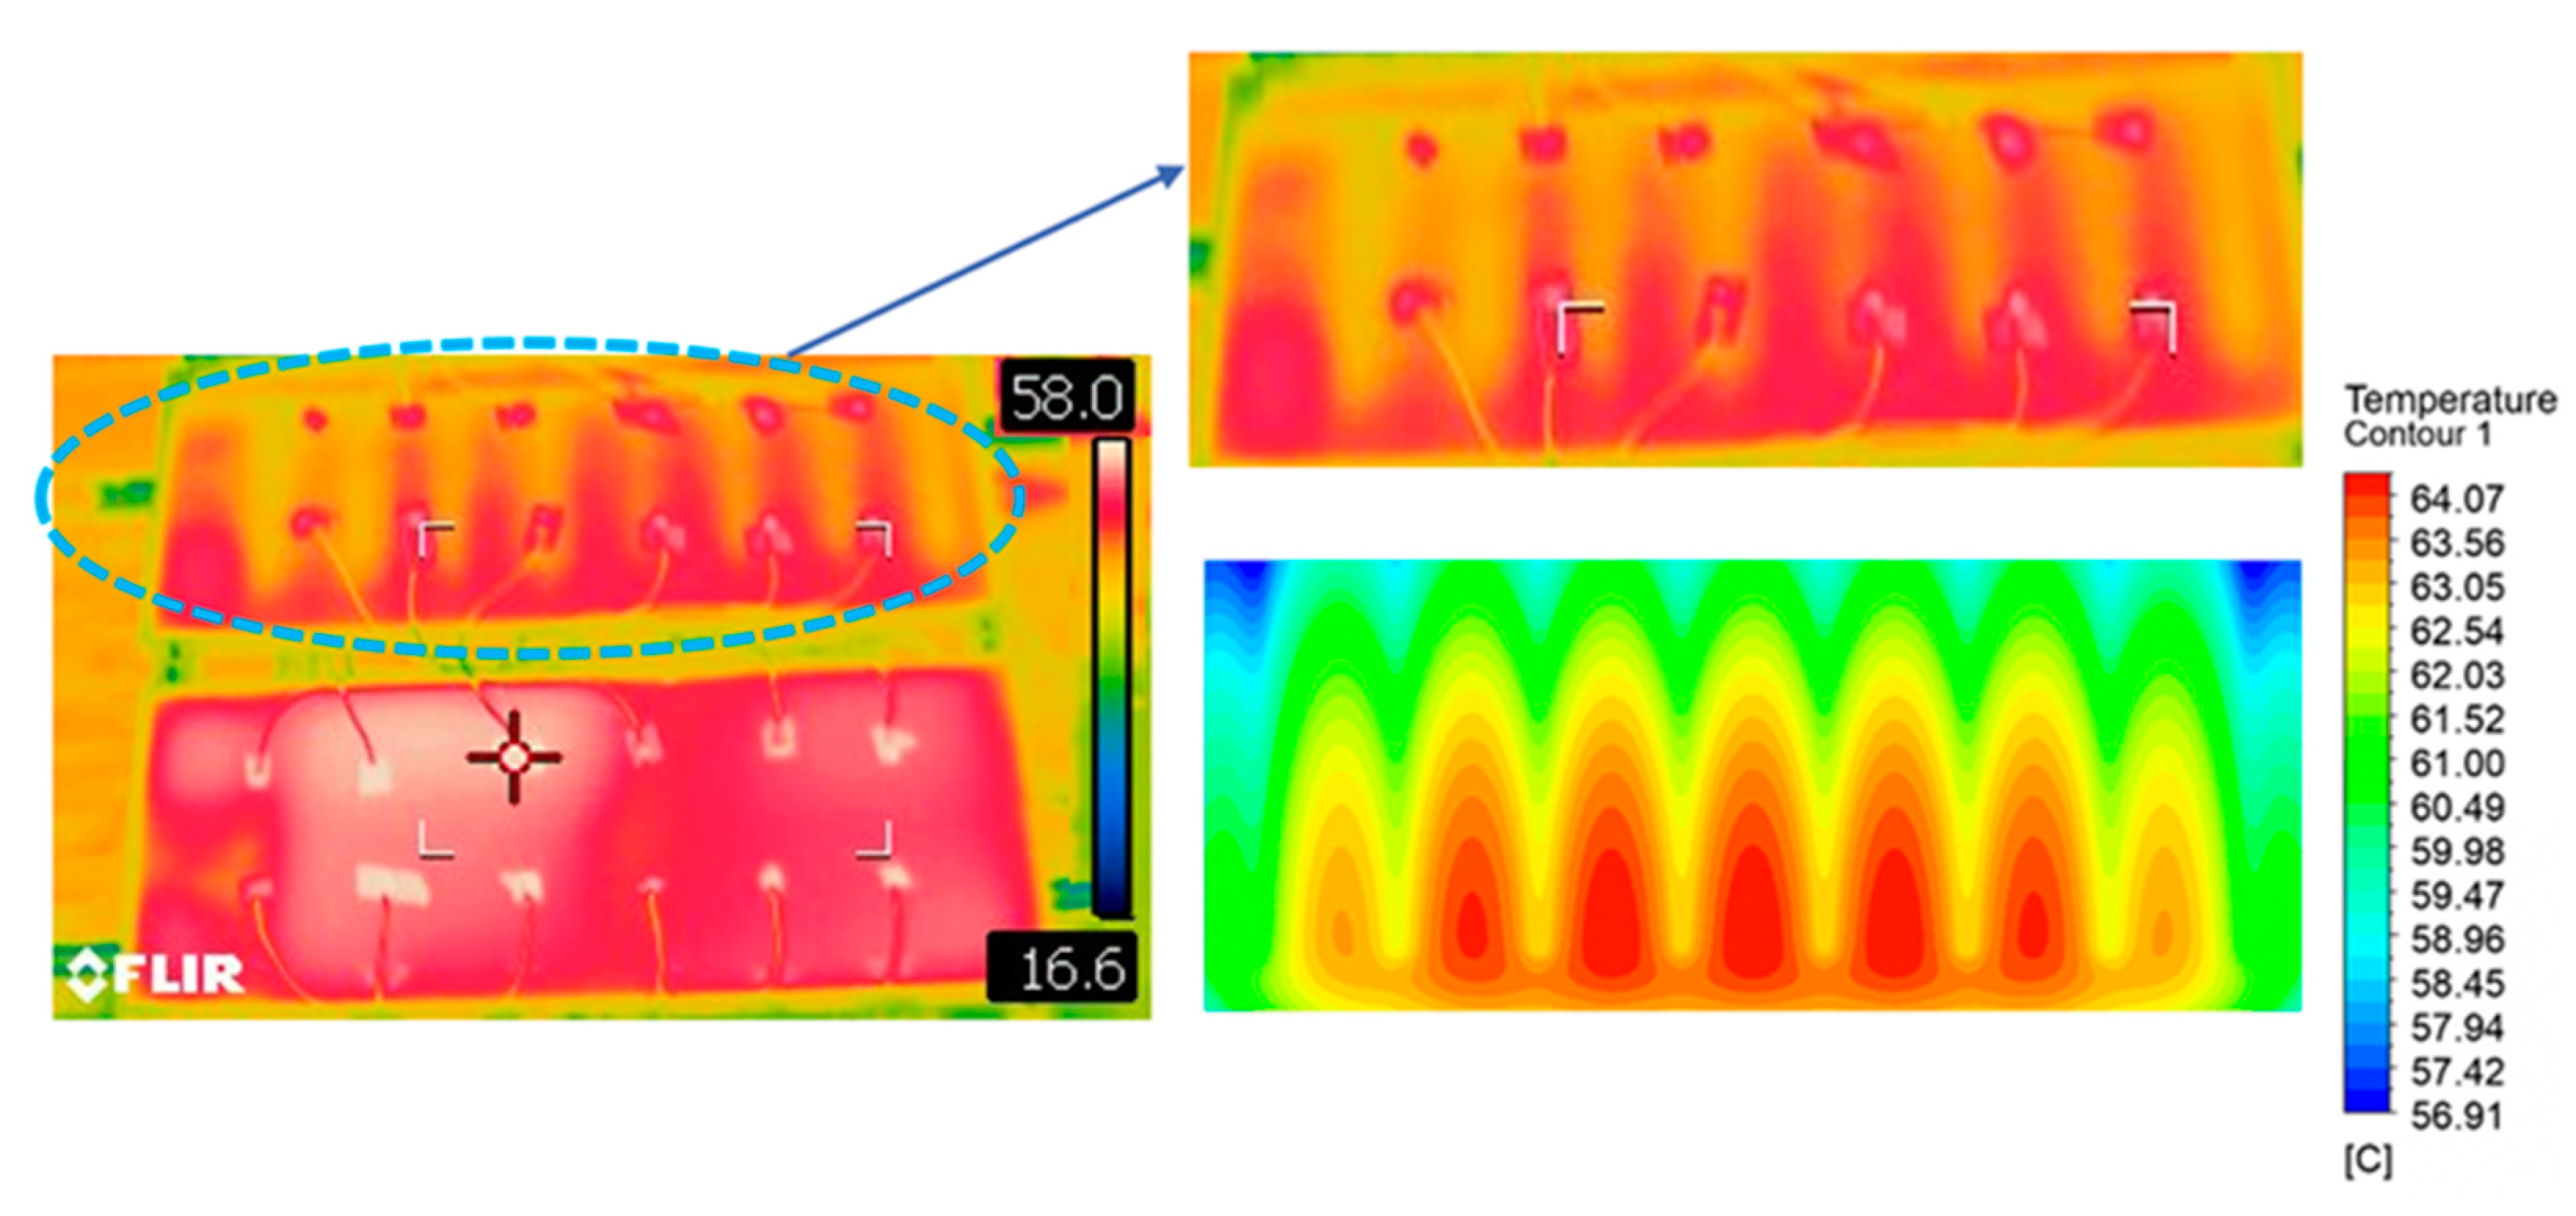
3.4. Validation of the Numerical Model

This study validated the accuracy of the simulation model. The data on September 10th were used for the simulation. The average values within each ten-minute interval of each stage were extracted and utilized as the boundary conditions for the simulation. Figure 11 compares the simulated temperature distribution with the actual temperature distribution, showing a close resemblance. Table 7 shows the differences between the simulated values and the experimental values, with errors ranging from about 4% to 9%.

4. Results and Discussion

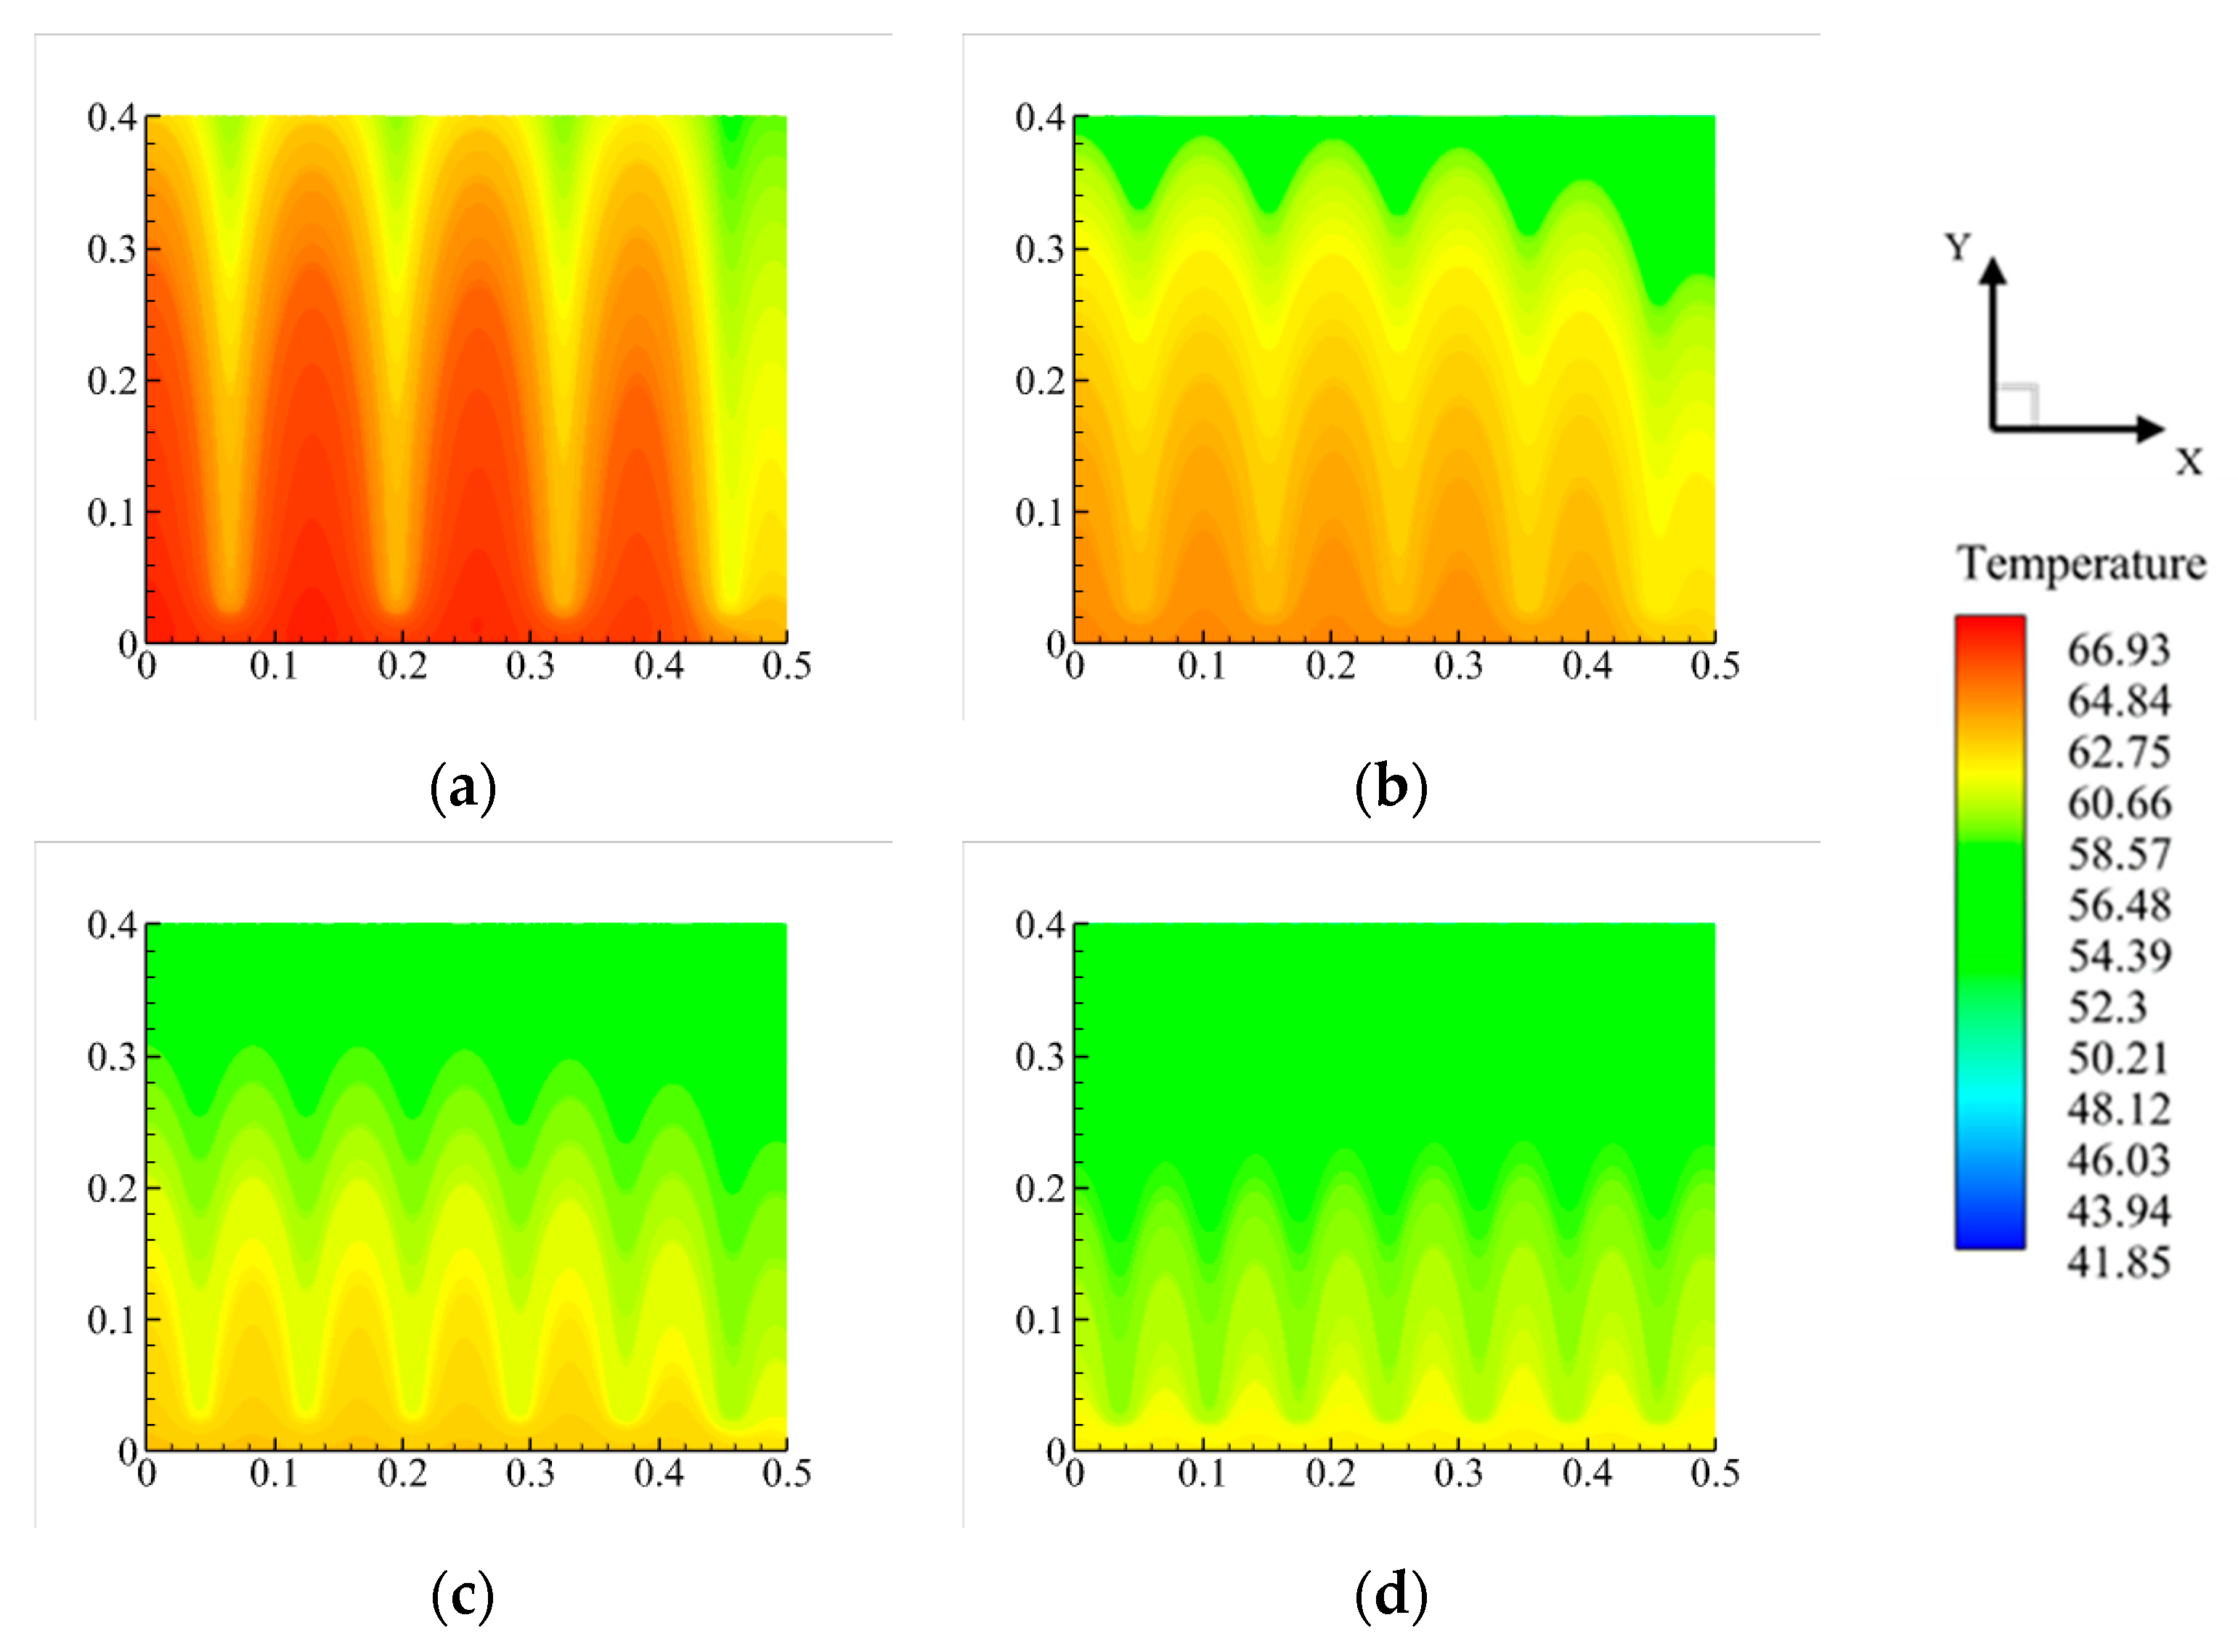
4.1. The Effect of Number of HP

Figure 12 represents the computational fluid dynamics (CFD) simulation surface cloud map of the PV module under conditions (solar radiation = 800 W/m2; ambient temperature = 26.85 °C; inlet velocity = 2 m/s; The number of heat pipes (N(HP)), N(HP) = 8,10,12,14). N(HP) increased from 8 to 14 pcs, resulting in a decrease of 4.09 °C in the surface average temperature of the PV module. Meanwhile, the average temperature difference between the evaporation and condensation sections of the heat pipes decreased from 5.19 °C to 4.64 °C, as shown in Figure 13a. The reason for the reduction in the temperature difference between evaporation and condensation is that with the increase in the number of heat pipes, the heat transfer per individual heat pipe decreases. Consequently, each heat pipe transfers heat at a lower rate, leading to a decrease in the temperature difference between evaporation and condensation.
Figure 13b indicates that the increase in N(HP) from 8 to 14 pcs resulted in the system’s photovoltaic power and efficiency increasing from 39.48 W to 40.76 W and from 12.34% to 12.74%, respectively, marking a 3.24% improvement in photovoltaic efficiency. This enhancement stems from the fact that under the same solar radiation conditions, the energy input to the system remained constant. However, the increase in N(HP) allowed unconverted solar energy to be transferred more rapidly to the surroundings via the heat pipes. Consequently, the temperature of the PV modules decreased, leading to improved electricity generation efficiency and power.

4.2. Effect of Angle of Condensation

Figure 14 represents the CFD simulation surface cloud map of the PV module under conditions (solar radiation = 800 W/m2; ambient temperature = 26.85 °C; inlet velocity = 2 m/s; the angle of the condensation (An(HPC)), An(HPC) = 0, 10, 20, 30). Figure 15a shows that as An(HPC) increases from 0° to 30°, the temperature of the PV modules decreased from 65.47 °C to 61.34 °C, with a temperature decrease of 4.13 °C. As the An(HPC) increased, the heat pipes’ heat transfer capability were improved. Simultaneously, the average temperature difference between the evaporation and condensation sections of the heat pipes increased from 3.7 °C to 5.34 °C. This phenomenon occurred because the heat transfer capability of the heat pipes improves, resulting in an increase in heat transfer power and, consequently, an increase in the average temperature difference between the evaporation and condensation sections of the heat pipes.
The increase in the An(HPC) coincided with a synchronous increase in the PV-HP system’s output power and efficiency, shown as Figure 15b. As the An(HPC) increased from 0° to 30°, the photovoltaic power and efficiency increased from 39.04 W to 39.93 W and from 12.27% to 12.55%, respectively. This results in a 2.28% improvement in the PV module’s power output efficiency.

4.3. Comparative Analysis

To validate the performance of the PV-HP system, we compared it with the PV-PCM/HP system proposed in Reference [26]. Both this study and the literature established a PV-ref baseline. By analyzing the temperature difference between the system and PV-ref, under higher irradiance levels than those reported in Reference [26], the cooling effect of the PV-HP system surpasses that of the PV-PCM/HP system. Furthermore, the maximum temperature of the PV-HP system reached 58.58 °C, whereas in Reference [26], it was 66.85 °C. However, when comparing the performance after incorporating air cooling, the cooling system in the Reference [36] used more heat pipes, resulting in better cooling performance than the PV-HP system. In Reference [23], researchers added an additional cooling jacket to the heat pipe PV/T system, resulting in a maximum temperature reduction of 15 °C during the summer. The overall efficiency improved by 44.38%. However, the study noted limitations in power generation due to the use of low-power photovoltaic cells (20 W).
Based on the research from relevant literature, the thermal performance of existing heat pipe PV/T systems is briefly summarized. In Reference [28], the heat pipe extracts heat from a 200 W photovoltaic cell to heat 150 L of water from 25 °C to 46.1 °C. the overall efficiency in summer can reach 60.6% and in winter reaches 55.4%. In Reference [36], heat from the PV cells (365 W) is dissipated using a fan. The system achieves an overall efficiency of 53.4% in winter. In Reference [37], adding phase change materials at the condensation section of the heat pipe can increase the overall efficiency of the heat pipe PV/T system to 56.45%. Solar energy can be used in other forms. Compared with the PV-HP system, a solar air heater has a higher thermal energy utilization efficiency but is at a disadvantage in electricity generation [30].

5. Conclusions

This study proposes a novel heat pipe-based PV cooling system and experimentally verifies its performance. In order to investigate the effect of the number of heat pipes and the inclination angle of the condensing section of the heat pipes on the performance of the system, three-dimensional CFD simulations are performed. The main conclusions of this study are as follows:
(1)
The experimental findings’ performance comparison indicates that the temperature of photovoltaic cells mainly fluctuates with solar radiation intensity. The use of heat pipes effectively reduces the temperature of photovoltaic cells, with a temperature difference of 5.47 °C between the PV-HP system and the reference photovoltaic cells, representing a temperature decrease of 10.36%. The PV-HP system increases its average output power by 9.13% when compared to the reference photovoltaic cells. The findings emphasize the PV-HP system’s significant effectiveness in temperature control and efficiency improvement.
(2)
The performance of PV-HP with reference PV cells after adding air cooling is analyzed comparatively. When the fan was turned on for 13 min, the temperature of the PV-HP was reduced from 51.28 °C to 43.16 °C, and its power was increased by 10.15%. Furthermore, the fan’s activation reduced the average temperature difference between PV-HP and PV-ref from 4.75 °C to 1.42 °C. The air-cooling contributes positively when An(HPC) is zero.
(3)
The effect of the heat pipe condensing section angle of 30° on the performance of PV-HP was analyzed. The experimental results reveal that when the An(HPC) is 30°, the average surface temperature difference between the PV-HP and the PV-ref rises from 2.8 °C before the fan turns on to 3.91 °C after the fan turns on. This means that adjusting the inclination angle can help the heat be transferred more effectively.
(4)
The N(HP) has decreased from 8 to 4, resulting in an average temperature reduction of PV cells from 64.45 °C to 58.54 °C, while the PV efficiency has increased from 12.34% to 12.74%. Meanwhile, the An(HPC) increased from 0° to 30°, reducing the average temperature of PV cells from 65.47 °C to 61.34 °C and increasing PV efficiency from 12.27% to 12.55%. When the number of heat pipes is 14 and the inclination angle of the condensation section of the heat pipe is 30 °C, the PV-HP system achieves its maximum photovoltaic power output. However, increasing the number of heat pipes increases the cost.
(5)
The heat pipe can combine with other working fluids to collect and utilize the heat from PV cells. This paper did not collect heat through the condensation section of the heat pipe; future research could explore this aspect to enhance energy utilization efficiency.

Author Contributions

S.M.: conceptualization, methodology, investigation, writing—original draft preparation, formal analysis, and visualization. Y.J.: conceptualization, methodology, validation, supervision, and writing—review and editing. F.A.: writing—review and editing, visualization, and supervision. All authors have read and agreed to the published version of the manuscript.

Funding

This research was funded by the Changsha Automobile Innovation Research Institute Innovation Project (CAIRIZT20220205).

Data Availability Statement

The data presented in this study are available upon request from the corresponding author.

Conflicts of Interest

The authors declare no conflicts of interest.

Abbreviations

Nomenclature
Aarea(m2)
cspecific heat capacity(J/(kg·°C))
Eelectrical energy production(W)
Gsolar irradiance(W/m2)
hconvective heat transfer coefficient(W/(m2·°C)
Icurrent(A)
Pelectrical power output(W)
Rthermal resistance(°C/W)
Ttemperature (°C)
Uvoltage (V)(V)
vwind speed(m/s)
αabsorptivity
ρdensity (kg/m3)
ηPV electrical efficiency (%)
εemissivity
σthickness(m)
βthe ratio of the evaporator area of the heat pipe to the area of the photovoltaic backplane
λthermal conductivity(W/(m·°C)
Abbreviation
PVPhotovoltaic
PV-HPPhotovoltaic-Heat pipe
PV-refReference photovoltaic
PV/TPhotovoltaic/Thermal
PHPPump heat pipe
BSPTBeam-splitting photothermal system
HPHeat pipe
HPCCondensation section of heat pipe
HPVEvaporation section of heat pipe
N(HP)Number of heat pipes
An(HPC)Tilt angle of the condensation of heat pipe

References

  1. Shayan, M.E.; Najafi, G.; Ghobadian, B.; Gorjian, S.; Mamat, R.; Ghazali, M.F. Multi-microgrid optimization and energy management under boost voltage converter with Markov prediction chain and dynamic decision algorithm. Renew. Energy 2022, 201, 179–189. [Google Scholar] [CrossRef]
  2. Wang, Z.; Song, Z.; Yan, Y.; Liu, S.; Yang, D. Perovskite—A Perfect Top Cell for Tandem Devices to Break the S–Q Limit. Adv. Sci. 2019, 6, 1801704. [Google Scholar] [CrossRef]
  3. Fernández, Á.; Rosell-Mirmi, J.; Regany, D.; Vilarrubí, M.; Barrau, J.; Ibañez, M.; Rosell-Urrutia, J. Impact of DC-DC Converters on the Energy Performance of a Dense Concentrator PV Array under Nonuniform Irradiance and Temperature Profiles. Energies 2024, 17, 1235. [Google Scholar] [CrossRef]
  4. Raina, G.; Sinha, S.; Saini, G.; Sharma, S.; Malik, P.; Thakur, N.S. Assessment of photovoltaic power generation using fin augmented passive cooling technique for different climates. Sustain. Energy Technol. Assess. 2022, 52, 102095. [Google Scholar] [CrossRef]
  5. Ghadikolaei, S.S.C. Solar photovoltaic cells performance improvement by cooling technology: An overall review. Int. J. Hydrog. Energy 2021, 46, 10939–10972. [Google Scholar] [CrossRef]
  6. Piasecka, M.; Piasecki, A.; Dadas, N. An Experimental Investigation and Numerical Simulation of Photovoltaic Cells with Enhanced Surfaces Using the Simcenter STAR-CCM+ Software. Energies 2023, 16, 8047. [Google Scholar] [CrossRef]
  7. Rabie, R.; Emam, M.; Elwardany, A.; Ookawara, S.; Ahmed, M. Performance evaluation of concentrator photovoltaic systems integrated with combined passive cooling techniques. Sol. Energy 2021, 228, 447–463. [Google Scholar] [CrossRef]
  8. Maghrabie, H.M.; Mohamed, A.S.A.; Ahmed, M.S. Experimental Investigation of a Combined Photovoltaic Thermal System via Air Cooling for Summer Weather of Egypt. J. Therm. Sci. Eng. Appl. 2020, 12, 041022. [Google Scholar] [CrossRef]
  9. Özcan, Z.; Gülgün, M.; Şen, E.; Çam, N.Y.; Bilir, L. Cooling channel effect on photovoltaic panel energy generation. Sol. Energy 2021, 230, 943–953. [Google Scholar] [CrossRef]
  10. Nižetić, S.; Čoko, D.; Yadav, A.; Grubišić-Čabo, F. Water spray cooling technique applied on a photovoltaic panel: The performance response. Energy Convers. Manag. 2016, 108, 287–296. [Google Scholar] [CrossRef]
  11. Ebaid, M.S.Y.; Ghrair, A.M.; Al-Busoul, M. Experimental investigation of cooling photovoltaic (PV) panels using (TiO2) nanofluid in water -polyethylene glycol mixture and (Al2O3) nanofluid in water- cetyltrimethylammonium bromide mixture. Energy Convers. Manag. 2018, 155, 324–343. [Google Scholar] [CrossRef]
  12. Kandeal, A.W.; Thakur, A.K.; Elkadeem, M.R.; Elmorshedy, M.F.; Ullah, Z.; Sathyamurthy, R.; Sharshir, S.W. Photovoltaics performance improvement using different cooling methodologies: A state-of-art review. J. Clean. Prod. 2020, 273, 122772. [Google Scholar] [CrossRef]
  13. Ma, T.; Li, Z.; Zhao, J. Photovoltaic panel integrated with phase change materials (PV-PCM): Technology overview and materials selection. Renew. Sustain. Energy Rev. 2019, 116, 109406. [Google Scholar] [CrossRef]
  14. Al-Mabsali, S.A.; Chaudhry, H.N.; Gul, M.S. Numerical Investigation on Heat Pipe Spanwise Spacing to Determine Optimum Configuration for Passive Cooling of Photovoltaic Panels. Energies 2019, 12, 4635. [Google Scholar] [CrossRef]
  15. Gao, Y.; Wu, D.; Dai, Z.; Wang, C.; Chen, B.; Zhang, X. A comprehensive review of the current status, developments, and outlooks of heat pipe photovoltaic and photovoltaic/thermal systems. Renew. Energy 2023, 207, 539–574. [Google Scholar] [CrossRef]
  16. Ahmed, S.; Li, Z.; Javed, M.S.; Ma, T. A review on the integration of radiative cooling and solar energy harvesting. Mater. Today Energy 2021, 21, 100776. [Google Scholar] [CrossRef]
  17. Hu, T.; Kwan, T.H.; Yang, H.; Wu, L.; Liu, W.; Wang, Q.; Pei, G. Photothermal conversion potential of full-band solar spectrum based on beam splitting technology in concentrated solar thermal utilization. Energy 2023, 268, 126763. [Google Scholar] [CrossRef]
  18. Jiang, T.; Zou, T.; Wang, G.; Lin, J.; Duan, Y.; Peng, H.; Chen, H. Design and thermodynamic analysis of an innovative parabolic trough photovoltaic/thermal system with film-based beam splitter. Case Stud. Therm. Eng. 2023, 47, 103093. [Google Scholar] [CrossRef]
  19. Ma, B.-C.; Lin, H.; Zhu, Y.; Zeng, Z.; Geng, J.; Jing, D. A new Concentrated Photovoltaic Thermal-Hydrogen system with photocatalyst suspension as optical liquid filter. Renew. Energy 2022, 194, 1221–1232. [Google Scholar] [CrossRef]
  20. Alizadeh, H.; Nazari, M.A.; Ghasempour, R.; Shafii, M.B.; Akbarzadeh, A. Numerical analysis of photovoltaic solar panel cooling by a flat plate closed-loop pulsating heat pipe. Sol. Energy 2020, 206, 455–463. [Google Scholar] [CrossRef]
  21. Al-Amri, F.; Maatallah, T.S.; Al-Amri, O.F.; Ali, S.; Ali, S.; Ateeq, I.S.; Zachariah, R.; Kayed, T.S. Innovative technique for achieving uniform temperatures across solar panels using heat pipes and liquid immersion cooling in the harsh climate in the Kingdom of Saudi Arabia. Alex. Eng. J. 2022, 61, 1413–1424. [Google Scholar] [CrossRef]
  22. Du, Y. Advanced thermal management of a solar cell by a nano-coated heat pipe plate: A thermal assessment. Energy Convers. Manag. 2017, 134, 70–76. [Google Scholar] [CrossRef]
  23. Moradgholi, M.; Nowee, S.M.; Abrishamchi, I. Application of heat pipe in an experimental investigation on a novel photovoltaic/thermal (PV/T) system. Sol. Energy 2014, 107, 82–88. [Google Scholar] [CrossRef]
  24. Koundinya, S.; Vigneshkumar, N.; Krishnan, A.S. Experimental Study and Comparison with the Computational Study on Cooling of PV Solar Panel Using Finned Heat Pipe Technology. Mater. Today Proc. 2017, 4, 2693–2700. [Google Scholar] [CrossRef]
  25. Shayan, M.E.; Najafi, G.; Lorenzini, G. Phase change material mixed with chloride salt graphite foam infiltration for latent heat storage applications at higher temperatures and pressures. Int. J. Energy Environ. Eng. 2022, 13, 739–749. [Google Scholar] [CrossRef]
  26. Zhou, X.; Cao, X.; Leng, Z.; Zhou, X.; Liu, S. Study on the temperature control performance of photovoltaic module by a novel phase change material/heat pipe coupled thermal management system. J. Energy Storage 2023, 64, 107200. [Google Scholar] [CrossRef]
  27. Soliman, A.M.A.; Hassan, H. An experimental work on the performance of solar cell cooled by flat heat pipe. J. Therm. Anal. Calorim. 2021, 146, 1883–1892. [Google Scholar] [CrossRef]
  28. Ji, Y.; Zhou, J.; Zhao, K.; Zhang, N.; Lu, L.; Yuan, Y. A novel dual condensers heat pipe photovoltaic/thermal (PV/T) system under different climate conditions: Electrical and thermal assessment. Energy 2023, 278, 128023. [Google Scholar] [CrossRef]
  29. Fu, Z.; Xue, M.; Shao, Z.; Zhu, Q. Performance evaluation of a novel vacuum-tube PV/T system with inserted PV module and heat pipe. Renew. Energy 2024, 223, 120027. [Google Scholar] [CrossRef]
  30. Shayan, M.E.; Ghasemzadeh, F.; Rouhani, S.H. Energy storage concentrates on solar air heaters with artificial S-shaped irregularity on the absorber plate. J. Energy Storage 2023, 74, 109289. [Google Scholar] [CrossRef]
  31. Soliman, A.S.; Radwan, A.; Fouda, M.S.; Sultan, A.A.; Abdelrehim, O. Energy assessment of a sliding window integrated with PV cell and multiple PCMs. J. Energy Storage 2024, 86, 111341. [Google Scholar] [CrossRef]
  32. Wang, Z.; Zhu, J.; Wang, M.; Gao, Q. Experimental study on heat transfer and storage of a heating system coupled with solar flat heat pipe and phase change material unit. J. Energy Storage 2023, 73, 108971. [Google Scholar] [CrossRef]
  33. Ji, J.; He, H.; Chow, T.; Pei, G.; He, W.; Liu, K. Distributed dynamic modeling and experimental study of PV evaporator in a PV/T solar-assisted heat pump. Int. J. Heat Mass Transf. 2009, 52, 1365–1373. [Google Scholar] [CrossRef]
  34. Shan, F.; Tang, F.; Cao, L.; Fang, G. Comparative simulation analyses on dynamic performances of photovoltaic–thermal solar collectors with different configurations. Energy Convers. Manag. 2014, 87, 778–786. [Google Scholar] [CrossRef]
  35. Zhang, Q.; Cao, G.; Zhang, X. Study of wet cooling flat heat pipe for battery thermal management application. Appl. Therm. Eng. 2023, 219, 119407. [Google Scholar] [CrossRef]
  36. Wang, G.; Yang, Y.; Yu, W.; Wang, T.; Zhu, T. Performance of an air-cooled photovoltaic/thermal system using micro heat pipe array. Appl. Therm. Eng. 2022, 217, 119184. [Google Scholar] [CrossRef]
  37. Gad, R.; Mahmoud, H.; Ookawara, S.; Hassan, H. Evaluation of thermal management of photovoltaic solar cell via hybrid cooling system of phase change material inclusion hybrid nanoparticles coupled with flat heat pipe. J. Energy Storage 2023, 57, 106185. [Google Scholar] [CrossRef]
Figure 1. Schematic diagram of the PV-HP module.
Energies 17 04272 g001
Figure 2. Schematic diagram of the PV-HP system.
Energies 17 04272 g002
Figure 3. The experimental test system for the PV-HP module.
Energies 17 04272 g003
Figure 4. Measurement positions of the thermocouples.
Energies 17 04272 g004
Figure 5. (a) Variation in solar irradiance and ambient temperature vs. time; (b) Variation in surface average temperature of PV-HP and PV-ref vs. time; (c) Variation in power output of PV-HP and PV-ref vs. time.
Energies 17 04272 g005
Figure 6. Influence of a 0° angle on the HPC on (a) Surface average temperature of PV-HP and PV-ref; (b) Output power of PV-HP and PV-ref; (c) Temperature of HPC and HPV.
Energies 17 04272 g006
Figure 7. Schematic of setting the angle at 30° for the HPCs.
Energies 17 04272 g007
Figure 8. Influence of a 30° angle on the HPC on (a) Surface average temperature of PV-HP and PV-ref; (b) Output power of PV-HP and PV-ref; (c) Temperature of HPC and HPV.
Energies 17 04272 g008
Figure 9. Cross-sectional schematic of the PV-HP model.
Energies 17 04272 g009
Figure 10. Boundary conditions of PV-HP module.
Energies 17 04272 g010
Figure 11. Comparison between simulated cloud maps and infrared image.
Energies 17 04272 g011
Figure 12. Temperature cloud maps of PV module under: (a) N(HP) = 8; (b) N(HP) = 10; (c) N(HP) = 12; (d) N(HP)= 14.
Energies 17 04272 g012
Figure 13. Effect of N(HP) on: (a) temperature of PV-HP; (b) power output and efficiency.
Energies 17 04272 g013
Figure 14. Temperature cloud maps of PV module under: (a) An(HPC) = 0; (b) An(HPC) = 10; (c) An(HPC) = 20; (d) An(HPC) = 30.
Energies 17 04272 g014
Figure 15. Effect of An(HPC) on: (a) temperature of PV-HP; (b) power output and efficiency.
Energies 17 04272 g015
Table 1. Major parameters of the PV-HP module.
ComponentParameterValue
PV moduleMaximum power100 W
Voltage at maximum power17.10 V
Current at maximum power5.85 A
Size1080 mm × 450 mm
Effective PV cell area0.398 m2
Heat pipeSize600 mm × 15 mm × 1.5 mm
Condensation150 mm
Evaporation400 mm
Insulation50 mm
Max heat transfer power60 W
Average heat transfer thermal resistance0.07 °C/W
Heat-absorbing plateThickness0.5 mm
SiliconeAverage thickness0.4 mm
Thermal insulation cottonThickness30 mm
Thermal conductivity0.074 W/(m·°C)
Table 2. Parameters of the measuring instruments.
ApparatusTypeMeasured DataMeasurement RangeMeasurement Error
ThermocoupleZW-KTemperature0–200 °C±0.2 °C
I-V recorderSZCW-DW-81Current0.999–9.999 A≤±1 mA
Voltage9.999–600 V≤±1 V
Radiation detectorSANPO-ST8916Solar radiation0.1–1999.9 W/m2±5 W/m2
AnemometerSMART-VT110Wind speed0.15–30 m/s±3%
Data collectorMEACON-MIK-R8000D---
Table 3. Average difference between T(PV-HP) and T(PV-ref).
Average Difference between T(PV-HP) and T(PV-ref) Before Using Air CoolingAfter Using Air Cooling
At 0° of HPCs4.75 °C1.42 °C
At 30° of HPCs2.80 °C3.91 °C
Table 4. Thickness and thermodynamic parameters of each layer of the PV-HP [34].
ComponentThickness (mm)Conductivity (W/(m·°C))Density (kg/m3)Specific Heat (J/(kg·°C))
Glass3.21.152200830
PV0.5168.002330757
Silicone0.42.402000700
Plate absorber0.5202.402719871
Thermal insulation cotton300.0742300381
Heat pipe1.590008960386
Table 5. Some major parameters used in the mathematical model.
ParametersValueUnit
Absorptivity0.04——
GlassEmissivity0.85——
Transmissivity0.91——
PVAbsorptivity0.9——
Solar radiation intensity 800W/m2
Ambient temperature 26.85°C
Wind speed 2m/s
Sky temperature 7.68°C
Table 6. Effect of number of grids on simulation results.
No.Number of GridsAverage PV Surface Temperature (°C)|Ni+1 − Ni|
11,422,48364.344-
22,260,99264.4390.085 °C
33,189,46364.4470.008 °C
45,321,53264.4490.002 °C
510,572,06464.4460.003 °C
Table 7. Errors between experimental and simulated PV temperatures.
TimeAverage Solar Radiation
(W/m2)
Average Ambient Temperature
(°C)
Average Temperature (Exp)
(°C)
Average Temperature (Sim)
(°C)
Average Errors
(%)
10:55–11:05869.4630.1457.3262.28.56%
11:25–11:35687.5230.1145.6548.776.19%
11:55–12:05420.1530.6544.1546.274.87%
12:25–12:35852.1731.4653.4157.768.35%
12:55–13:05735.5531.7350.6852.566.57%
13:25–13:35668.3730.9750.2653.726.85%
13:55–14:05334.0830.1443.0244.144.70%
14:25–14:35404.9930.0843.8946.165.37%
14:55–15:05447.3729.6445.3247.534.46%
15:25–15:35398.7429.1244.7446.985.23%
Disclaimer/Publisher’s Note: The statements, opinions and data contained in all publications are solely those of the individual author(s) and contributor(s) and not of MDPI and/or the editor(s). MDPI and/or the editor(s) disclaim responsibility for any injury to people or property resulting from any ideas, methods, instructions or products referred to in the content.

