1. Introduction
Solar energy is one of the most important renewable energy sources in the world. According to data from the International Energy Agency, by 2020, the estimated global electric power converted by photovoltaic panels was 3.1%. This amount represented the third largest renewable energy source worldwide, only behind hydroelectric and wind power generation. With a growth of about 23% compared to the previous year (2019), it is currently the energy source with the fastest growing rate. The same agency estimates that if the growth rate of solar energy continues to be this high, in 2030, 6970 TWh will be generated, meaning an increase of 850% over what was produced in 2020. Data gathered from this agency also show that the three countries with the largest amount of electrical energy converted from solar energy were China, the United States and the United Kingdom, with 48.2 GWh, 19.3 GWh and 19.0 GWh, respectively [
1].
Another way to obtain electricity outside of photovoltaic panels is by taking advantage of temperature gradients. Temperature differential can be transformed into electrical energy using modules made with two different types of semiconductors (P and N type). These modules, or thermoelectrical modules as they are known, convert electricity via the Seebeck effect. This effect is a thermoelectrical phenomenon in which two semiconductors are placed next to each other, then, one side is heated while the other side is cooled down; as a result, a temperature gradient encourages electrons to jump from one material to another producing a voltage differential, as explained by Alaoui [
2] and Miltrani et al. [
3]. Furthermore, Paradiso and Starner [
4] explain that this method of energy conversion has already been used in different applications, such as clocks, watches and smart wearables. In addition, the efficiency in applications such as smart wearables remains low (around 1%). Moreover, recent studies have found that the efficiency of thermoelectric modules is at most 3% [
5]. The main challenge of this energy source is maintaining the previous temperature difference to obtain better efficiency. In addition, when presented as energy generators, thermoelectrical modules can be used as a power supply for autonomous sensing devices, such as the one presented by Dalola et al. [
6].
Thermoelectrical modules for energy conversion have been proposed in diverse contexts. An example of energy conversion in these domains is the project proposed by Zheng et al. [
7]. This model presents a device that consists of a solar concentrator, a thermoelectric modules grid and a cooling system that works on water to achieve the largest efficiency possible. Another notable application of this technology in residencies is the one proposed by Inthachai et al. [
8], where the usage of thermoelectrical modules over the roof of a house to gather solar energy is proposed. This presents an advantage over photovoltaic systems because these modules can adapt to any roof geometry and cover the whole surface area instead of being limited to rectangular shapes. It is relevant to mention that during the reported experiments, the temperature differential was constant throughout the data gathering.
One of the ways to expand the scale of utilization of thermoelectrical models is by putting them in pavement or asphalt roads. The model proposed by Mona et al. indicates that it is possible to extract energy from thermoelectrical modules under the pavement to take advantage of the heating it gets from the sun. In order to obtain the highest amount of temperature differential, a water-based cooling system is implemented by installing water canals under the pavement [
9]. Similarly, the proposed model and the experiment conducted with it by Jiang et al. [
10] show the effectiveness of thermoelectrical modules in asphalt applications, where a vapor chamber is utilized as an example of a heat generator for the module in one side, whereas in the other side, a water cooling system is applied. The results showed an instant production of 0.56 V per module of 30 × 30 × 10 cm, with a potential of recollecting 33 kWh of electrical energy per day in an area of 10,000 m
2. With that energy, it is possible to keep a ceiling fan on for 660 h. However, one of the limitations when describing thermoelectrical systems is how the converted energy is stored. At this scale, a specialized battery pack needs to be designed, taking into consideration the multiple factors that involve thermoelectrical electricity. An example of a battery pack designed specifically for these applications is the one described by Zhu et al. [
11]. This design takes into consideration different elements of thermoelectrical modules, such as temperature changes and current inconsistencies.
Experimental procedures have been made with this technology, many with positive outcomes that validate its application. An example is the investigation carried out by Jamaludin et al. [
12], in which a thermoelectrical conversion system is installed under a residential roof consisting of concrete shingles. This system consisted of four thermoelectrical modules connected in series and obtained up to 65.22
W at 138
. In this experiment, the energy was measured from 8:00 to 18:00. Another experiment on the implementation of thermoelectrical-based energy conversion on a large scale was conducted by Mona et al. [
9]. This experiment compared the electric potential produced by installing two thermoelectrical modules in 150 × 150 mm blocks of cement and pavement, both with a height of 50 mm. For this experiment, conducted in Chiang Miai, Thailand, the thermoelectrical modules produced 168.5 mV and 134.4 mV from asphalt and cement, respectively.
To calculate the surface temperature of the different geographical zones, it is necessary to know the solar irradiation specific to each area. One of the most important databases is the Langley center of investigation of the National Aeronautics and Space Administration, NASA [
13]. This database contains the surface temperature, radiation and solar irradiation worldwide and these data are specially useful when calculating the temperature that different objects will reach when left in the sun. Furthermore, this database has been used in the past to design heat maps in the city of Monterrey in northeast Mexico, to calculate the solar irradiation on this area [
14] and to identify the optimal tilt angle for a surface to gather the biggest amount of solar energy, for the same urban area, as presented by Quiroga-Ocaña et al. [
15]. For instance, another way of obtaining solar measurements in Mexico is to use the information collected by meteorological stations deployed over the country; however, these measurements are not public and could have a higher error than those given in the aforementioned NASA database [
16]. Therefore, using information from NASA reduces the cost of research without negatively impacting the quality of data for decision-making and it is the approach applied in this investigation.
An idea that emerged at a Mexican university is Distrito Tec, an area surrounding the Tecnológico de Monterrey campus, in the city of Monterrey, Mexico, where urban living lab pilots are being implemented, in the context of sustainable and smart cities.
Figure 1 shows a map of Mexico and neighboring countries and allows one to identify the metropolitan area of Monterrey, in the northeastern region of the country. The map also depicts the annual temperature at a height of two meters above sea level, in °K for the territory of Mexico and surrounding countries. The color intensity of the map indicates the temperature, with red representing the highest temperatures. For reference, Monterrey is equivalent to 294.906 Kelvin, which is approximately 21.8 degrees Celsius.
Considering the reported literature about the amount of energy that can be harvested using thermoelectrical modules, this investigation is aimed at calculating the potential annual average of heat energy that could be converted and stored at Distrito Tec. To determine temperature variations without the need for traditional weather stations or local sensors, a data-driven approach is employed using thermal simulation software. This approach utilizes geospatial information, eliminating the expenses associated with equipment and ongoing maintenance. In addition, the proposed approach utilizes databases that provide the solar irradiance, surface temperature and geographic coordinates, leading to a flexible and adaptable solution.
This manuscript is organized as follows:
Section 2 describes the data source used in this research.
Section 3 presents the methodology applied for data processing, which includes the description of the model, simulation software and statistical methods used to analyze and validate the results given by the software and the approach to the calculations involving the energy conversion using thermoelectric modules.
Section 4 consists of the results and discussions regarding the calculated energy and its possible storage. Finally,
Section 5 provides the conclusions and offers a brief mention of further research opportunities.
2. Data Sources
This section describes the sources of information from which data and information were extracted for the development of this research. Two databases were used: the National Aeronautics and Space Administration (NASA) and the Mexican National Institute of Geography and Statistics (INEGI; its acronym in Spanish) [
17]. In addition, thermoelectric module (TEM) data were obtained from a reported experimental characterization aimed at extracting electrical energy from a temperature differential [
18].
The Mexican National Weather Service (SMN; its acronym in Spanish) has meteorological stations capable of measuring solar irradiation via pyranometers and pyrheliometers; the disadvantage is that there are only four stations deployed in the metropolitan area of Monterrey and this is not enough for the irradiance estimation [
19]. Due to this, it was decided not to use the SMN information in this research study, but to refer to the database of NASA’s Surface Meteorology and Solar Energy (SSE) project, named Power Project. This collection of data contains free access to information about solar measurements, such as surface temperature and solar irradiation [
13]. The data obtained from NASA’s SSE were further employed as the measurement parameters for the SolidWorks (v2021) simulation.
To calculate the entire potential energy, a second database was used. The cartography and geo-statistics for urban and rural city blocks is an open access database supported by the INEGI [
17]. The information is found in the Urban Development Plan of the Metropolitan Area of Monterrey 2013–2025 (in Spanish) [
20]. The required geographical data are available to the public at the website of the Municipal Institute of Urban Planning and Coexistence of Monterrey (IMPLAN MTY; its acronym in Spanish) [
21]. The map of E05d Secondary South Zone Delegation was downloaded from this database and was processed in the QGIS v3.26 software, an open source and free software item for geographic information [
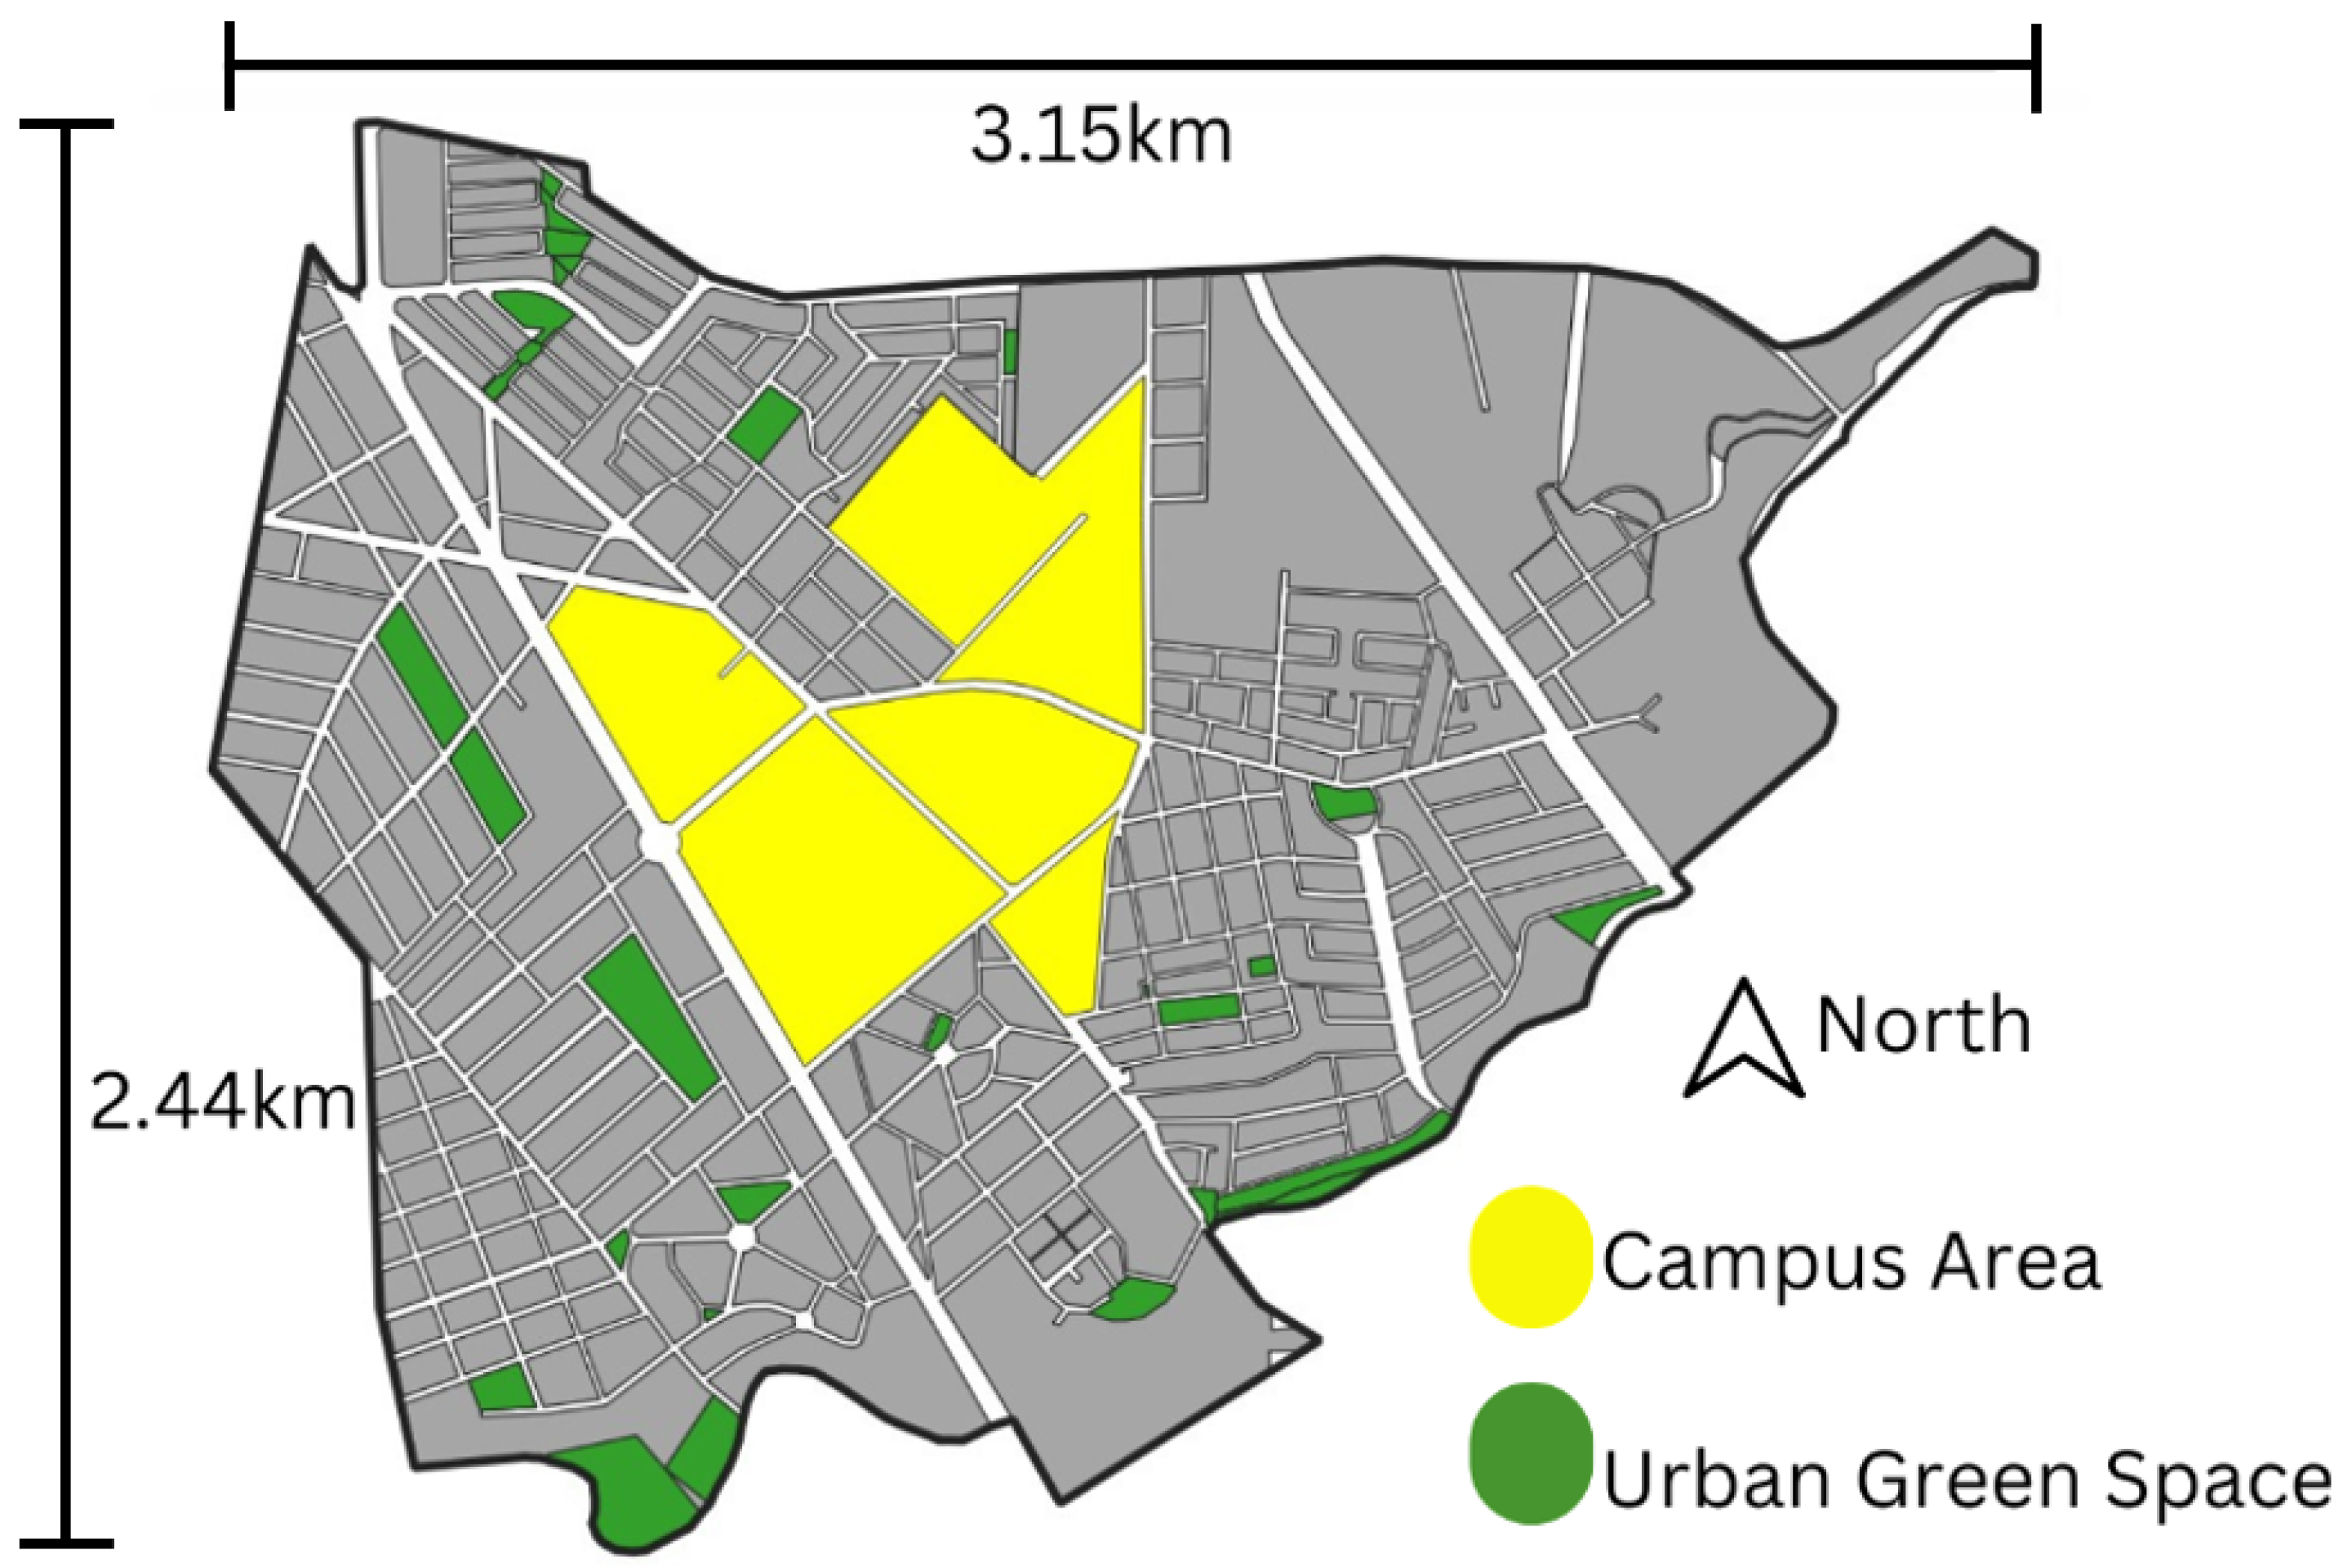
22], to select the Tec District area, apply filters, assign colors and generate the map of the studied area. Moreover, the information in the database separates the land usage by type, environmental characteristics and type of building presented in such an area. This information was employed to identify the green areas, vehicle roads, the university campus and the available surfaces for further potential energy calculations, as shown in
Figure 2.
The present research uses NASA’s database SSE to gather data related to solar irradiation and the INEGI repository for the geo-statistic information. In both databases, the key parameter to find the data was location, i.e., latitude and longitude coordinates. This research effort was for the studied extent, an area that surrounds the Tecnológico de Monterrey, a university in northeast Mexico. The coordinates of Distrito Tec, in decimal degrees, are latitude 25.650686 and longitude −100.289770. To obtain the target area in the case study, the different city blocks within the bounds of the coordinates were selected from the available map and the outcome was a map where all the different areas can be identified as in
Figure 2, from [
21,
22]. The present study considers the total enclosed surface in Distrito Tec after having removed the areas of the campus, the urban green space and the streets (indicated in white).
The thermoelectric module research was developed in a graduate thesis research. The characterization of the electrical parameters of the TEC1-12710 ((Purchased from Steren, in Hermosillo, Mexico). Technical information on this thermoelectric module model can be found at [
23]) commercial thermoelectric module were open and closed circuit voltage, as well as the current it can provide to a load. Temperature differences between the hot and cold sides of the device were varied to measure voltage and current with a known load. The parameters were identified from a prototype designed especially for that application and the prototype emulated the change in temperatures presented in a concrete slab of a roof of a house that receives solar irradiation on one side and on its counterpart is at the temperature of a house with the air conditioning on. The purpose was to estimate the amount of energy that the TEM delivered at different temperature differences between the cold face and the hot face. In addition, for detailed information on reported experiments and results, the reader is invited to review [
18]. Furthermore, as indicated in [
24], the optimal thermoelectric module in terms of cost-effectiveness and efficiency is 3%, employing a commercial semiconductor of bismuth telluride (
) compound.
3. Applied Research Methodology
The project analyzes a system consisting of a hypothetical concrete roof of 10 cm thick that is heated by sunlight on one side and cooled on the other face by air in a typical accepted value of comfortable temperature indoors, i.e., 24 °C [
25,
26]. As part of the calibration methodology, this research effort employs a previous validated TEM characterization attached to a particular sized slab [
18]. The 10 cm
3 concrete cube was used as a heat storage reference to estimate the energy-conversion capacity of a general-purpose thermoelectric module. This is only to illustrate the equivalent electrical energy that is stored in the Distrito Tec concrete structures.
In this system, a thermoelectrical Peltier module is placed in the interior side of the concrete roof. Its hot face is warmed by the heat coming from the roof of the building when it receives solar irradiation, whereas the cold face of the TEM is affected by the room temperature, as shown in
Figure 3. The figure displays the elements that constitute the thermoelectrical system. From above comes heat from the sun and from below there is a flow of air at the temperature of the room. At the bottom of the image, there is visual representation of a commercial device for cooling/heating. The apparatus allows the temperature of the room to be kept constant, in contact with the cold face of the TEM. For more information about the employed thermoelectrical module’s parameters, refer to Félix-Herrán et al. [
18] and the TEM module manufacturer’s data sheet [
27].
To estimate the potential (promising or possible) electrical resource, the investigation was divided into four stages, each one with a specific purpose. The first part was the data regression of a single module energy conversion. The second step was the simulation of the thermal behavior of concrete blocks when exposed to direct sunlight. The third phase was the calculation of the potential area where thermoelectrical modules could be installed. The fourth stage consisted of the combination of all the gathered data to estimate the total potential electrical energy that could be available in the Distrito Tec area. Based on the experimental design, the applied research methodology to estimate the electrical resource is illustrated in
Figure 4, where the word “potential” continues to be used as a synonym for “promising”.
In
Figure 4, the blue romboids represent the inputs from the data sources. These data sources are NASA’s solar database, INEGI’s database and the results from an experiment reported in [
18] that aided in the understanding of thermoelectrical modules’ energy-transformation characteristics [
13,
17]. In addition, the two main activities come from an experiment design, where the data regression and estimation and the case study were developed almost in parallel.
3.1. Single Module Modeling
In order to conduct an analysis of the overall energy-harvesting potential of Distrito Tec, a model of the energy conversion of a single thermoelectric module is required. In this case, the heat energy to electrical energy conversion model in [
18] is applied herein due to its practical approximation. The model considers temperature differences on concrete similar to those produced by solar irradiation, thus assumed to fit well with the predicted solar irradiation on the area. Furthermore, the text here was moved to added text a proportional relationship between temperature difference in concrete to voltage was experimentally found, which is then applied to the temperature gradient mapping of Distrito Tec. Detailed information about the experimental effort, including the list of materials and equipment, can be found in
Section 2 of [
18]. Therefore, annual data of solar irradiation are used to compute the energy-harvesting capacity of the designated area. These results were plotted using the Excel spreadsheet for data analysis and to further understand the behavior of the system.
The built-in Microsoft Excel’s v16.0 interpolation functions were employed to estimate the energy output capacity of Distrito Tec as if it was fitted with thermoelectric modules. This process required obtaining the electrical voltage differential measured between the terminals of the thermoelectric module. Due to the behavior of the data and potential polynomial structure for approximation, three different equations were explored for modeling estimation. The applied interpolation methods were linear, third-degree polynomial and third-degree polynomial interpolation considering a zero temperature differential resulting in a zero voltage output. The outcomes obtained by applying the interpolation methods to the data are shown in
Figure 5,
Figure 6 and
Figure 7 (See
Supplementary Material).
Subsequently, the error of each interpolation was computed using the two formulas described in Equations (
1) and (
2).
The calculation from Equations (
1) and (
2) facilitated the evaluation of each interpolation’s accuracy (model’s output vs experimental data). By employing these approaches, a data regression was developed to enable estimation of the voltage output for a given temperature differential. The obtained results provide valuable insights into the relationship between temperature differentials and voltage signals. Certainly, for each approximation, a table was computed to compare the average closeness. Results are presented in
Table 1,
Table 2 and
Table 3. Considering the three applied approaches, it was observed that the one that best described the outcome of the system was the polynomial method without assuming zero voltage at zero temperature differential, as shown in
Table 4.
3.2. Simulation
To understand the temperature behavior of concrete when exposed to sunlight, a 10 mm concrete cube object was designed and studied in SolidWorks v2022
® to emulate the real nature of a concrete block. Using the software’s thermal analysis capabilities, three different thermal loads were taken into consideration when doing the experiment. The inputs were radiation, heat flow and convection and the thermal loads were equally distributed along the upper and lower faces. The simulation effort conducted in SolidWorks
® is exemplified in
Figure 8. All of the loads were adjusted depending on the day of the month and the values were obtained from NASA’s Surface Meteorology and Solar Energy (SSE).
For the simulation to be close to the real concrete behavior, the design was attributed to nominal thermal parameters; these parameters can be seen in
Table 5. Convection is a heat-transfer mode in which heat is transferred between a solid surface and an adjacent moving fluid (or gas). The value of convection is around 5–25 and for the purpose of simulation, 15 was chosen as the mean value [
28]. It is important to clarify that the heat-transfer coefficient used in this research is only an approximation. To have a more exact value, the data about roof inclination and surface blown by an air stream considering the average wind speed in the region should be considered, but that information is not currently available for the roofs at Distrito Tec.
Other parameters needed for the simulations were taken from the work in Kodur [
29]. Properties of concrete are dependant on moisture content and composition of the concrete mix; for this reason, the selected values are just an approximation taken from Kodur’s proposed ranges. The selected values are listed in
Table 6. This process was repeated every hour of the most significant day of every month to characterize the concrete thermal behavior throughout the year. Instead of working with 365 days for solar irradiation analysis, it is acceptable to work just with the 12 days of the year that represent the average temperature of the month, as explained in [
30,
31]. This information is listed in
Table 7 and was extracted from Enríquez-Velásquez et al. [
32].
3.3. Calculations of Area
To calculate the amount of potential area that could be useful in Distrito Tec, a land-usage database was consulted. The areas that were taken into consideration were as follows: buildings of any type, roads, cemented parking lots and sidewalks. To obtain this information, the district delimitations were set using the perimetral streets as defining lines. This gives the city block’s land-usage data and its total area. For the calculations, the parks, green infrastructure and school campus were not taken into consideration. The remaining area was then added, thus giving the potential usable area in square meters [
21].
3.4. Calculations of Concrete Temperature
For this subsection of the calculations, the past data were utilized. First, the time of day for the most significant day was used as input in the NASA weather-tracking software v9.6.12 [
1] to obtain the factors that affect the concrete temperature. The data were introduced into the thermal analysis software where the behavior of the concrete would be simulated. For maximized closeness to real life temperature calculations, concrete thermal properties were used; such properties can be seen in
Table 6. The software’s output was a thermal grid that behaved like a temperature hue. An instance of the software computation in SolidWorks can be seen in
Figure 9.
As explained in
Section 3.2, the simulation used the values of convection, radiation and heat flow from the outside environment obtained from the NASA database. These values were considered for 15 April, along with the value of natural convection for the air (
Table 5) and considering the material properties in
Table 6. SolidWorks computed that 43.27 °C was the temperature of the outer layer of the ceiling. On the other hand, if the internal temperature of the room was defined as 24 °C, then the temperature of the inner layer of the ceiling was calculated as 34.55 °C according to the simulation. These are the maximum and minimum values found in the simulation depicted in
Figure 9.
The software includes the concrete characteristics of
Table 5 and
Table 6, as well as the surface temperature and irradiation. With this information, SolidWorks generates the temperature distribution from the outer surface to the inner surface (the ceiling of the room). An example of the retrieved temperature values can be seen in
Table 8. This example shows simulations for the first 4 h for January’s most significant day; however, this experiment was conducted every hour of every month’s most significant day (288 simulations in total).
3.5. Calculations of Promising Energy
The temperature difference was calculated using the inner temperature of the concrete block and the assumed room temperature, 24 °C in this case. This deviation was then tabulated as seen in
Table 9. This differential is then used as an input in the selected voltage-generation function, depicted in
Figure 5. The calculated amount of voltage produced by this system was then tabulated as in
Table 10. Furthermore, the generated voltage was the input to a system that consisted of a single 1 ohm resistor to cause the current to mimic the voltage. As a consequence, the power is the voltage squared, as tabulated in
Table 11. Those instant watts were multiplied by 3600 to account for the accumulated energy in an hour, assuming that the temperature is maintained for the entire hour; the results are tabulated in
Table 12. From
Table 9,
Table 10,
Table 11 and
Table 12, the hours describe the first four hours in the day as in
Table 8. Finally, these procedures were used in the remaining hours of the most significant day in January and later every significant day for the other eleven months for the annual calculation.
4. Results and Discussion
The simulation results reveal the promising electrical energy that could be harvested through the implementation of thermoelectric modules on concrete roofs in the area of Distrito Tec. The energy output, expressed in Wh, is presented for each month of the year.
Table 13 illustrates the estimated possible electrical energy, per month, obtained from the simulations. Furthermore, it is important to note that these values represent the total electrical energy, per month, converted by a single module. Moreover, in
Table 13, to calculate the monthly energy obtained in Wh, the sum of the total energy obtained in one day was calculated and this amount was multiplied by the number of days in the month.
The size of a single thermoelectric module utilized in the simulations is approximately 0.0016 m
2 [
18]. On average, per day, one module could provide 34.5667 Wh of energy. In addition, one square meter can fit 625 modules, which will be the equivalent of 21.590 kWh of energy per day. Taking into account the current potential of this technology, it is envisioned that the modules could be installed across an area of 3,004,694.602 m
2 = 3.0047 km
2 in the available areas within the Distrito Tec. Assuming that this area was completely covered with thermoelectric modules, 23.678 TWh could be obtained per year. (
Supplementary Material was used to obtain results in
Table 10,
Table 11,
Table 12 and
Table 13).
These results highlight the amount of solar energy that is not used in a sector of an urban area and that could be converted into electrical energy to help meet the needs of the city. By taking advantage of temperature differences in thermoelectric modules placed on concrete roofs to extract electrical energy, the motivation to investigate these conversion technologies increases. Furthermore, the data provide insights into the monthly variations in energy conversion and highlight the significance of optimizing the module deployment for maximum efficiency throughout the year.
To efficiently utilize this energy, it is necessary to be able to store it. This could be stored in battery packs. These systems are capable of storing certain amounts of energy and holding it for later use. Usually, battery packs are specifically designed for energy-transformation systems, but given that thermoelectric generation is such a novel system, a battery pack for solar panel systems could be chosen as an example. These battery systems serve as backup power during outages, as they store energy that can be used to power houses during periods of inefficiencies on energy transformation. Different characteristics can be used to select a battery system; some examples are the following: power output, modular design, efficiency, performance and even price [
33].
To better understand these energy-storage systems, five different commercial batteries were analyzed. The maximum storage capacity of these batteries was extracted and the average was calculated, resulting in 13.6 kWh [
33]. If this capacity is considered, it would need two battery packs to be able to store the daily energy transformed by one square meter covered in these thermoelectrical modules, which accumulate approximately 21.6 kWh each day. Furthermore, a single proposed battery pack could be fully charged in just 16 h, assuming those hours are daylight and that the average energy transformation is one square meter of thermoelectrical modules. These findings lay the groundwork for further analysis and exploration of the feasibility and economic viability of implementing thermoelectric systems on a larger scale in the urban environment.
An estimate of the cost of energy recovery with TEMs and its comparison with solar panels helps to gauge the current situation of this renewable energy source. As mentioned earlier in this section, the area of a TEM module referred to in this research is 0.0016 m
2, so 625 modules are required to cover one square meter. If the cost of one single TEM, model TEC1-12710, is approximately 6.75 USD [
34], then it costs 4218.75 USD to cover one square meter. Meanwhile, the average cost per square foot of a solar panel is 8.77 USD [
35], equivalent to 94.4 USD per m
2. When comparing both technologies, it is estimated that the cost of recovering energy with TEMs is approximately 44 times higher than doing so with solar panels. There is a considerable area of opportunity to continue researching ways of improving the efficiency of TEMs and thus reduce the cost of thermoelectric modules for a more affordable clean energy-recovery solution. Moreover, it is known that at present efficiencies TEMs cannot be a profitable investment; however, the potentially high levels of stored energy in concrete should provide an incentive to explore further improvements of the technology or alternatives to be able to exploit this source of energy in the future.
5. Conclusions and Further Work
In this study, the promising energy converted from temperature differentials on concrete roofs in the city of Monterrey was investigated. The means of transforming heat energy into electrical energy was a thermoelectric module. The simulation results provided valuable insights into the monthly energy patterns and the overall feasibility of this technology for renewable energy.
The analysis of the simulation data revealed that the implementation of thermoelectric modules on concrete roofs has the potential to generate a significant amount of electricity. The results demonstrated varying energy-extraction levels throughout the year, with peak values observed during the summer months of June and July. These findings highlight the importance of considering seasonal variations when designing and implementing thermoelectric systems. Furthermore, the simulations showed that thermoelectrical modules holds promising prospects for achieving significant electrical energy within the city. This resource comes from solar thermal energy that is not being used.
The implications of this study extend beyond the analyzed area. The utilization of thermoelectric modules on concrete roofs presents an innovative approach to harnessing renewable energy from existing infrastructure. This technology can potentially contribute to the overall energy-transition efforts and promote sustainable development in urban areas. However, it is important to note that further research and development are needed to address several challenges. Improving the efficiency and reliability of thermoelectric modules, optimizing the design and deployment strategies and assessing the economic viability of large-scale implementation are key areas that require attention.
Because it is too complex to collect the inclination parameters of the concrete roofs in Distrito Tec, this manuscript’s objective is only to illustrate the amount of heat energy stored in the specified inner-city area considering horizontal flat roofs and only an ideal case of thermoelectric modules properly attached to the roof and no roof inclination. Sun rays hit the roof surface at a different angle depending on the time of the year, but in this first approach a representative simplification is considered for the research results. Moreover, wind, humidity and other factors also change with the time of the year and were also not considered in the current study. Further work could include some of these considerations to make estimations increasingly closer to exact values.
Furthermore, the findings of this study highlight the potential of a substantial energy conversion from temperature differentials on concrete roofs using thermoelectric modules. The results provide valuable insights for policy makers, urban planners and researchers interested in the development and integration of renewable energy technologies. With continued advancements in thermoelectric systems and supportive policies, this technology holds promise as a viable and sustainable solution for meeting the growing energy demands of urban environments.
Future research should focus on refining the simulation models and conducting on-site experiments. In addition, exploring innovative applications and integration possibilities of thermoelectric modules within the urban landscape could complement the research. These efforts could contribute to the development of efficient and scalable thermoelectric systems and facilitate the transition towards a more sustainable energy future.


 ,
, 


