Article

Research on the Structural Performance of Liquid Nitrogen Ice Plugs on Nuclear Power Pipes

1
China Nuclear Power Operation Management Co., Ltd., Jiaxing 314300, China
2
School of Materials Science and Engineering, University of Science and Technology Beijing, Beijing 100083, China
3
School of Energy and Power Engineering, Jiangsu University, Zhenjiang 212013, China
*
Author to whom correspondence should be addressed.
Energies 2024, 17(17), 4211; https://doi.org/10.3390/en17174211
Submission received: 29 June 2024 / Revised: 15 August 2024 / Accepted: 21 August 2024 / Published: 23 August 2024
(This article belongs to the Section B4: Nuclear Energy)

Abstract

:
Nuclear energy, as an important component of the power system, has become a key focus of future energy development research. Various equipment and pipelines in nuclear power plants require regular inspection, maintenance, and repair. The pipelines in nuclear power plants are typically large, necessitating a device that can locally isolate sections of the pipeline during maintenance operations. Ice plug freezing technology, an economical and efficient method for maintaining and replacing equipment without shutdown, has been widely applied in nuclear power plants. The structure of the ice plug jacket, a type of low-temperature jacket heat exchanger, affects the flow path of the working fluid within the jacket and consequently impacts heat transfer. This study utilizes Computational Fluid Dynamics (CFD) to establish five types of jacket structures: standard, center-offset (center-in, side-out), helical, helical fin, and labyrinth. The effects of different structures on the freezing characteristics of ice plugs are analyzed and compared. The research indicates that the labyrinth jacket enhances the heat transfer performance between liquid nitrogen and the liquid inside the pipe, forming a larger ice layer at the same liquid nitrogen flow rate. Additionally, the standard jacket has the shortest sealing time at high liquid nitrogen flow rates.

1. Introduction

In recent years, the rapid development of global technology has led to increasing energy consumption across various industries worldwide [1]. However, the reserves of fossil fuels are gradually decreasing, causing a decline in traditional energy sources and the rise of various new energy sources. Nuclear energy, as a significant component of renewable energy, has become a critical direction for future development in the power industry. It not only offers substantial environmental benefits but also holds exceptional significance for the low-carbon emission society currently advocated worldwide [2]. Compared to renewable energies like solar and wind power, nuclear power plants have notable advantages in terms of reliability and stability, playing a crucial role in load balancing within regional and national power grids [3]. However, nuclear power generation carries certain risks; severe accidents can cause significant harm to human health [4], thus necessitating high safety standards in its practical application [5].
To ensure the safety of personnel, nuclear power plants require regular inspections and maintenance to guarantee the safe operation of equipment and pipelines [6]. Typically, pipeline maintenance involves draining the liquid from the pipes, followed by cutting, repairing, welding, or replacing the pipelines. However, nuclear power plants have stringent requirements for the integrity and continuous operation of their equipment. The equipment is large and immovable, and the construction requirements are highly demanding. Additionally, to prevent the leakage of radioactive liquids, there is a need for a device that can isolate the upstream and downstream sections of the pipeline without damaging its internal structure. This is where ice plug technology becomes a key research focus for nuclear pipeline maintenance. The principle of ice plug technology is simple. As shown in Figure 1, cryogenic media such as dry ice and liquid nitrogen [7,8] are introduced into the jacket surrounding the pipeline. The jacket exchanges heat with the pipeline wall, cooling the fluid inside the pipeline and causing it to solidify, forming an ice plug. This ice plug effectively seals the pipeline, thereby isolating the upstream and downstream sections. Currently, ice plug technology has matured and is widely used in pipeline maintenance across various industries worldwide.
Wang [10] conducted simulations on 3, 4, and 10-inch pipelines to obtain the corresponding temperature and stress fields. The results showed that the stress impacts in pipelines of different sizes and materials during ice plug formation are within acceptable limits and do not affect pipeline performance. Li et al. [11] conducted freezing experiments on 304 L material, measuring its tensile and yield strengths, and investigated the effects of welds during ice plug formation. They concluded that the tensile and yield strengths of 304 L material fully meet the performance requirements for ice plug formation, and the heat generated by welding does not affect the formation strength of the ice plug. However, the weld area is more prone to plastic fracture compared to other regions. Xie et al. [9] studied the effects of temperature, pressure, and pipeline stress distribution during ice plug formation and found that the stress on the pipe wall is mainly determined by low temperatures. They emphasized that controlling the temperature difference on the pipe wall is crucial to reducing the stress impact caused by low temperatures. The research demonstrates that complex temperatures are a key factor affecting ice plug formation; such temperatures can induce natural convection, interact with the pipe wall, and influence the formation process of the ice plug [7].
Gyongyoşi et al. [12,13,14] constructed a 200 mm pipeline ice plug test rig and conducted related studies on ice plug formation. They concluded that the flow rate of liquid nitrogen and the position of the jacket has a decisive impact on ice plug formation. The speed of ice plug formation is positively correlated with the liquid nitrogen flow rate, and the injection method of liquid nitrogen affects the position of ice plug formation. Ice plugs form faster at the liquid nitrogen flushing site, and increasing the injection pressure of liquid nitrogen can increase the volume of the ice plug formed. Du et al. [15] analyzed the application of ice plug freezing technology in various scenarios during nuclear power plant maintenance and proposed considerations for its implementation. Liu [16] compared the scenarios of pre-injection of liquid nitrogen and no pre-injection, concluding that pre-injection of liquid nitrogen before the operation can enhance heat transfer and accelerate ice plug formation. Injecting liquid nitrogen into the jacket in advance creates a higher temperature difference, enhancing heat exchange. At this point, the thermal diffusivity is high, and due to the high thermal conductivity of the pipe wall, rapid cooling can be achieved. Gui et al. [17] applied this technology to mini/micro pipelines. Takefuj [18] compared dual ice plug and single ice plug systems, concluding that the strength of ice plugs formed under dual conditions is about four times that of single ice plugs.
For ice plug jackets, the structure is relatively simple and typically consists of four parts: the inner pipe, the outer pipe, the gap between the inner and outer pipes, and the outer insulation system. When the working fluid is introduced into the jacket, the interior of the jacket is in a sealed environment. Compared to the stable heat transfer inside the pipe, the heat transfer within the jacket is complex due to the intricate flow field and variable geometry. Therefore, to ensure the experimental structure is predictable, the flow field within the jacket should be designed according to standards, and the same type of working fluid should be used inside the jacket.
Essentially, a pipeline ice plug jacket is a type of low-temperature jacketed heat exchanger where heat is transferred from the high-temperature medium inside the pipe to the low-temperature medium within the jacket [19]. The design of the jacket should adhere to the corresponding thermal theories [20], starting from the areas with lower heat transfer coefficients [21]. To enhance the heat transfer coefficient, structures such as helical fins, baffles [22], and ribbed tubes [23] are often used to increase the heat transfer area, thereby improving heat transfer efficiency. Additionally, the flow field within the jacket significantly impacts heat transfer efficiency [24,25,26,27,28,29,30].
Despite extensive research on pipeline ice plugs both domestically and internationally, there has been limited investigation into the impact of the internal structure of ice plug jackets on the ice plug formation process. Liquid nitrogen, being a cryogenic liquid, absorbs heat and vaporizes during the reaction, potentially disrupting the flow path within the jacket. Without structural design to constrain the flow path of liquid nitrogen, this can lead to uneven pipe temperatures and irregular ice formation. In this study, five different jacket structures were designed and simulated using FLUENT 2022 R1 [31]. The research examines the ice plug formation time, liquid nitrogen consumption during the formation process, the ice volume within the pipe at the time of ice plug formation, and the ice volume per kilogram of liquid nitrogen to explore the influence of jacket structure on the ice plug formation process.

2. Modelling

2.1. Geometric Model

The pre-processing stage for FLUENT calculations involves establishing relevant models for the research subject. When constructing the pipeline jacket model, the following aspects should be standardized:
Ignore the effects of welds and other manufacturing details on the overall structure.
Assume the working fluid (water) in the pipeline is stationary and fully occupies the pipeline.
Assume the liquid nitrogen always completely fills the internal structure of the jacket.
Since the pipeline structure remains the same, the difference between the five scenarios lies solely in the jacket structure. Based on these assumptions, five three-dimensional jacket models were created. Their cross-sectional views are shown in Figure 2, and the structural dimensions of the five jackets are listed in Table 1.

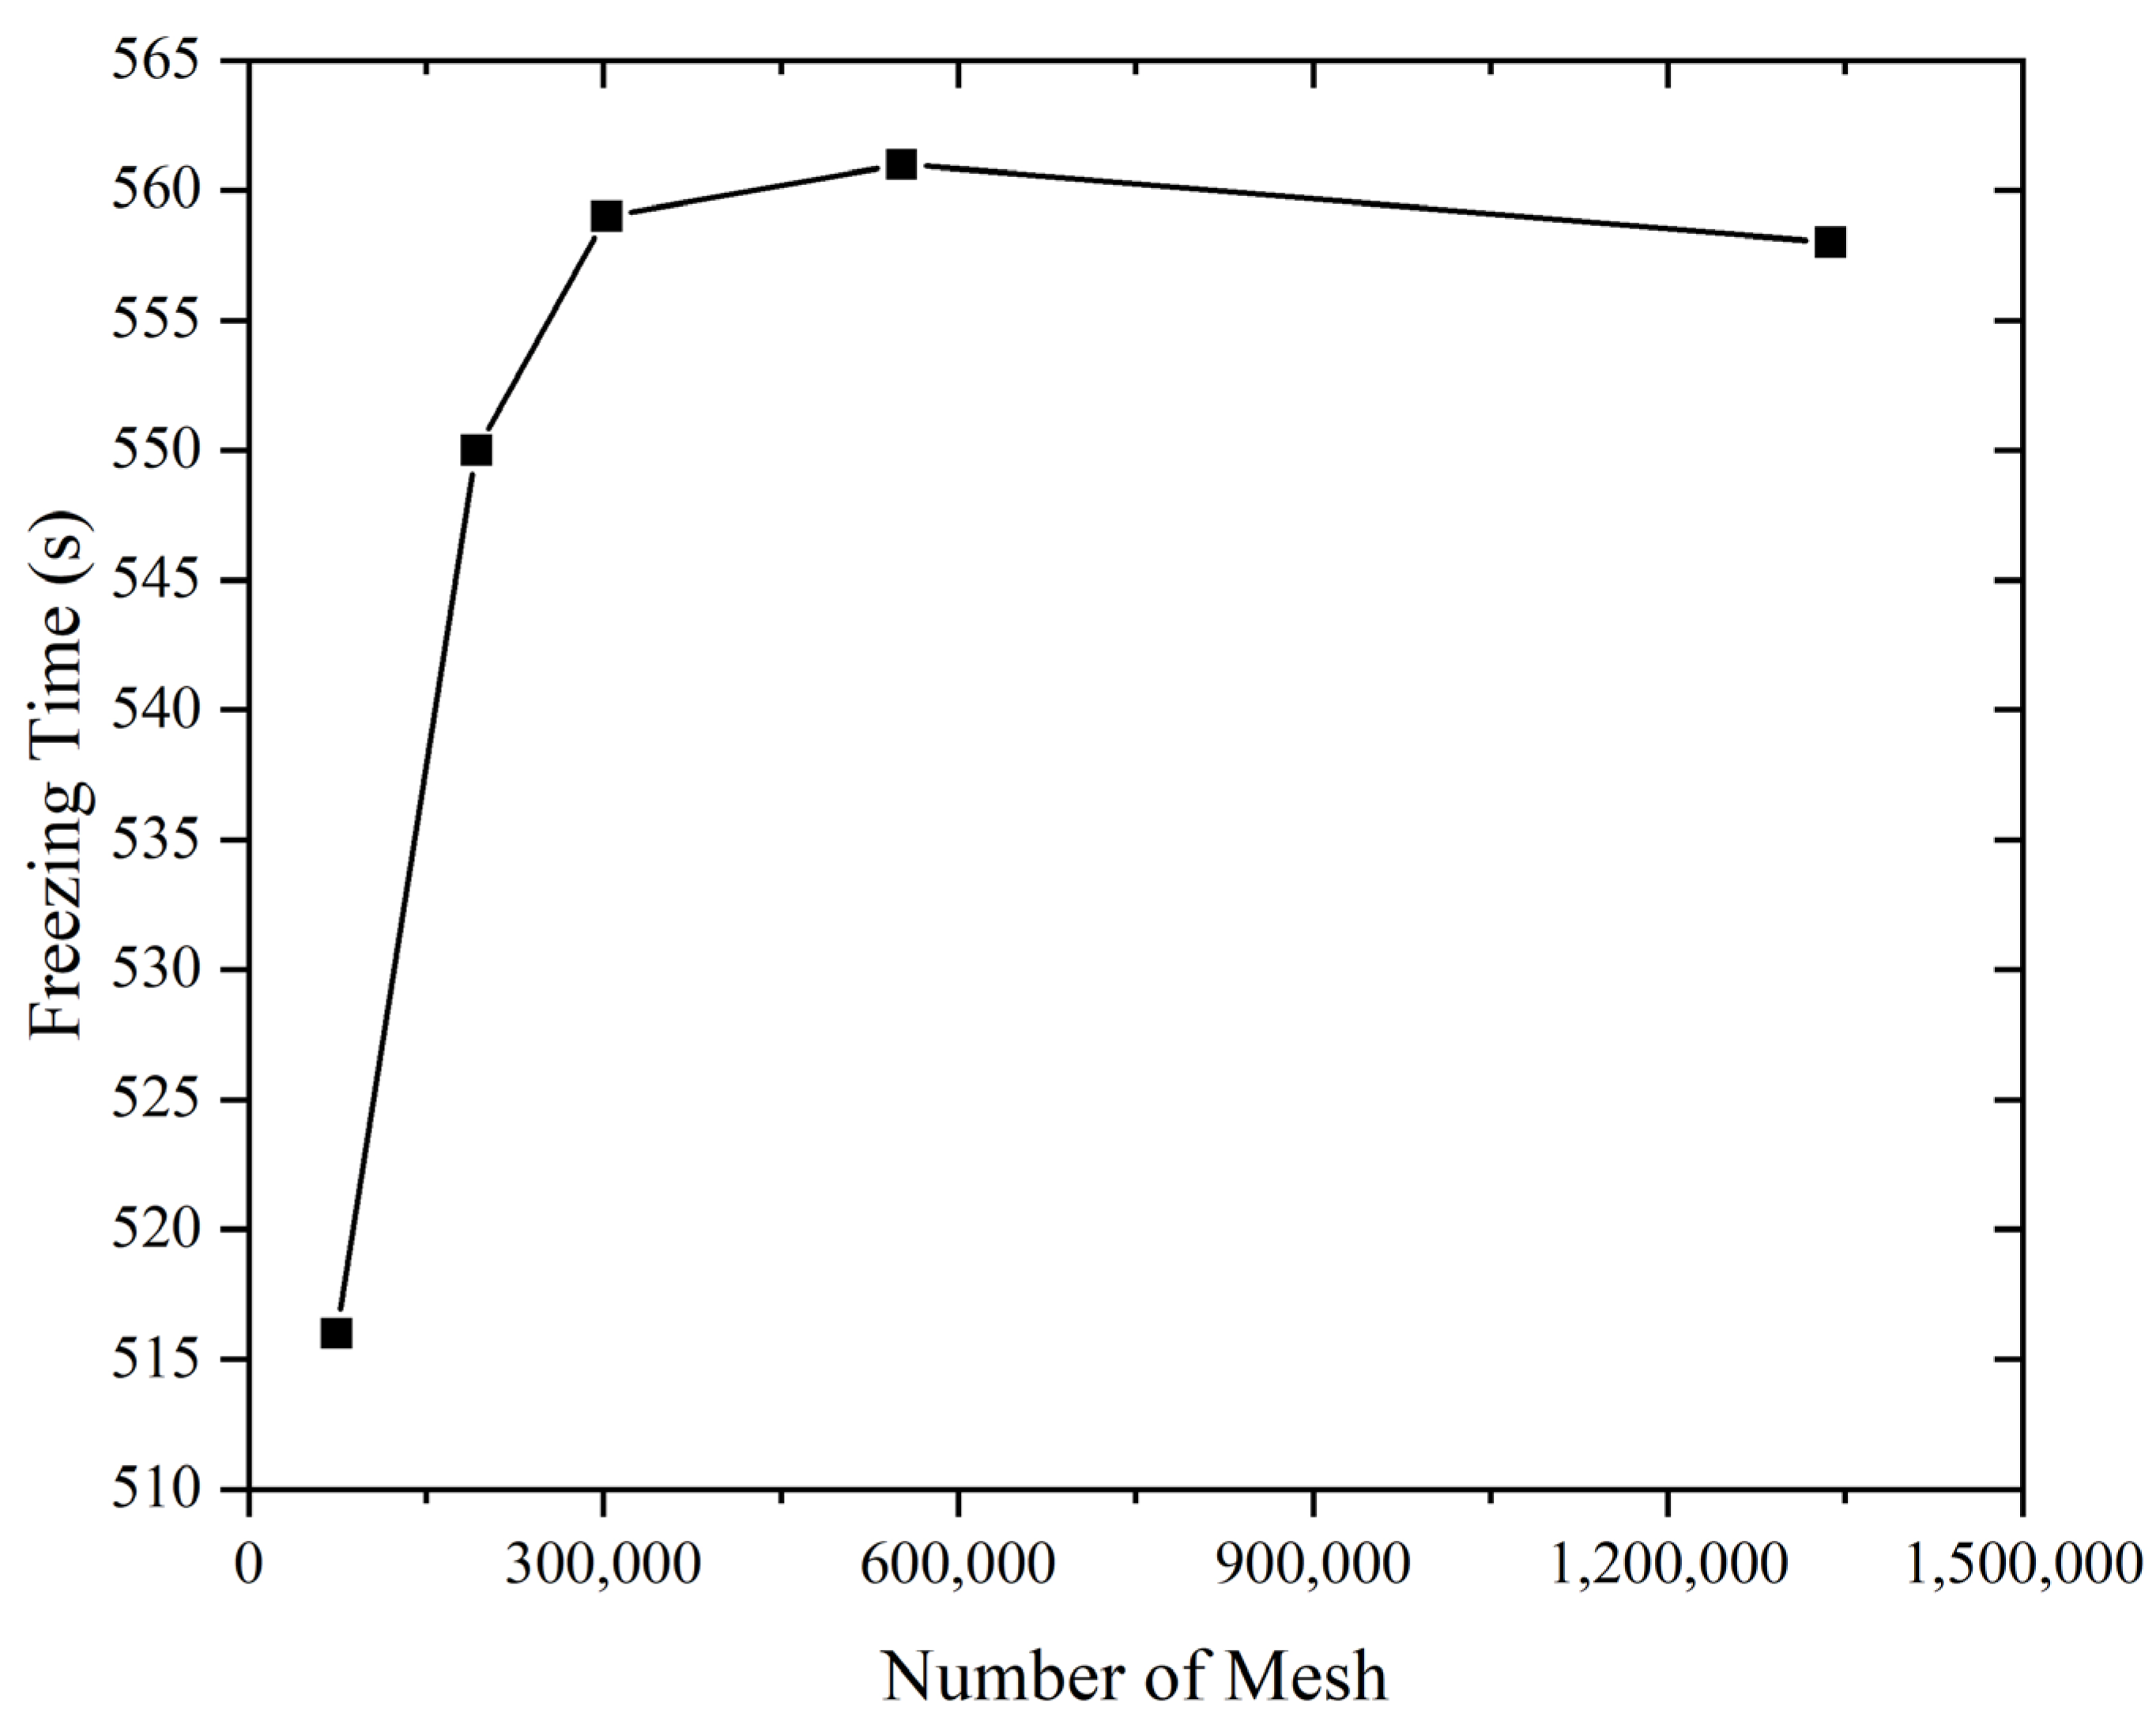
2.2. Mesh Independence Analysis

The pipeline sections and internal working fluids of the five jacket structures were modeled and meshed in the same way. The specific mesh divisions are shown in Figure 3. Except for the helical tube jacket, the outer shells of the remaining four jackets are also identical, differing only in their internal structures. The detailed mesh divisions for these structures are shown in Figure 4.
For the five jacket types, except for the helical tube jacket, the outer shapes are identical. The heat transfer part involves liquid nitrogen within the jacket. Therefore, in the mesh division of the jackets, only the mesh division of the liquid nitrogen inside the jacket is shown. The specific mesh division is illustrated in Figure 5.
To eliminate the influence of mesh size on the calculation results, a grid independence verification is necessary. As shown in Figure 6, the number of divided grids is 74,328, 192,713, 302,692, 552,039, and 1,337,526, corresponding to ice plug formation times of 516 s, 550 s, 559 s, 561 s, and 558 s, respectively.
As shown in Figure 5, when the number of grids increases from 74,328 to 192,713, the ice plug formation time increases by 34 s. When the number of grids exceeds 300,000, the ice plug formation time begins to stabilize, fluctuating only within a small range. To conserve computational resources, a grid number of 302,629 was chosen for subsequent simulations.

2.3. Boundary Condition

Due to the design involving fluid flow and solid-liquid phase change, transient calculations were employed in this study. The Realizable k-epsilon model was selected for turbulence modeling. The SIMPLEC algorithm was used for computations, as it balances computational accuracy with reduced computational effort. The boundary parameter settings are shown in Table 2. Additionally, the liquid nitrogen flow rate at the inlet was controlled, with flow rate gradients set at 0.1 m/s, 0.2 m/s, 0.3 m/s, 0.4 m/s, and 0.5 m/s.

2.4. Physical Properties

The physical properties used in the simulation are listed in Table 3.

3. Results and Discussion

3.1. Analysis of Temperature Distribution inside the Pipeline and Ice Formation Scenarios

Figure 7 shows the cross-sectional temperature distributions of the pipeline for the five jacket structures during ice plug formation at a liquid nitrogen flow rate of 0.1 m/s. To observe the temperature distribution and ice layer growth within the pipeline, slices were taken at specific intervals in the study area (the water inside the pipeline). The slicing points were located at Z = 0.135 m, Z = 0.155 m, Z = 0.175 m, Z = 0.195 m, Z = 0.215 m, Z = 0.235 m, Z = 0.255 m, Z = 0.275 m, Z = 0.295 m, and Z = 0.315 m.
As shown in Figure 7, the same temperature range was adopted to ensure that the temperature contour plots for the slices of the five jacket structures were drawn and analyzed under a unified standard. Figure 7A,B illustrate the differences in the liquid nitrogen inlet and outlet configurations. Due to the lack of special structures within the jackets, the liquid nitrogen flow inside the jackets is irregular turbulence, with low temperatures mainly concentrated at the liquid nitrogen impact points. Additionally, since the liquid nitrogen inlet is at the top of the model, the overall temperature distribution inside the pipe shows lower temperatures at the top and higher temperatures at the bottom.
Figure 7C–E show that due to the presence of specific internal structures within the jackets, the liquid nitrogen flow is orderly turbulence. These structures enhance the circulation of liquid nitrogen in the annular region of the pipe. Similar to the standard and central inlet-side outlet jackets, the areas near the liquid nitrogen inlets and outlets are significantly cooler due to the liquid nitrogen impingement. However, compared to the standard and center-offset jackets, the temperature distribution around the pipe is more uniform, with no significant gradient from top to bottom. Particularly in Figure 7C, the internal pipe temperature distribution is noticeably lower than in the other four cases. Although the liquid nitrogen flow rate is the same for all five cases, the inlet area for the helical jacket is twice that of the other four, resulting in double the flow rate. Therefore, the absolute temperature values in the contour plot for the helical jacket are not directly comparable, but the temperature distribution within the pipe can still be analyzed. Overall, applying certain structures within the jackets can better control the liquid nitrogen flow. These structures enable the liquid nitrogen to participate more fully in heat exchange with the pipe walls, leading to a more uniform ice plug formation.
Based on comparative mechanical analysis of ice [32,33], both compressive and tensile strengths of ice increase with decreasing temperature. As shown in Figure 7, within the closure region of the Standard Jacket, where the central pipe temperature drops below 273.15 K, the lowest temperature at the pipe center occurs at Z = 0.175 m, with a center temperature of 240 K. Overall, the temperature range in the ice formation region is 240 to 264 K. For the Center-offset Jacket, the lowest central pipe temperature is observed at Z = 0.215 m, measuring 252 K, with a temperature range of 252 to 264 K within the closure region. In the case of the Labyrinth Jacket, the lowest central pipe temperature within the ice formation region is at Z = 0.175 m, registering 216 K, with a temperature range of 216 to 264 K. Similarly, for the Helical Fin Jacket, the lowest central pipe temperature in the ice formation region is at Z = 0.175 m, at 228 K, with a temperature range of 228 to 252 K. From a strength perspective of ice formation, the Standard Jacket exhibits slightly higher ice strength compared to the Center-offset Jacket, but significantly lower strength than the Helical Fin and Labyrinth Jackets. Additionally, the Labyrinth Jacket shows slightly higher ice formation strength than the Helical Fin Jacket. This underscores the significant improvement in ice formation strength achievable by designing corresponding surrounding pipe-type jacket internal structures.
Figure 8 shows the cross-sectional liquid fraction distributions of the pipeline for the five jacket structures during ice plug formation at a liquid nitrogen flow rate of 0.1 m/s.
Combined with Figure 7, the standard and center-offset jacket types exhibit irregular turbulent flow inside due to their lack of internal structure. As shown in Figure 8A, the standard jacket forms a completely closed ice plug at Z = 0.175 m, the point of liquid nitrogen inlet into the pipeline. In Figure 8B, the center-offset jacket closes the ice plug between Z = 0.215 m and Z = 0.235 m, corresponding to the liquid nitrogen inlet. This demonstrates that without a specific internal structural design of the pipeline, ice plug formation correlates with the entry and exit of liquid nitrogen, with closure points near the inlet.
Consistent with the results shown in Figure 7, the helical jacket, helical fin jacket, and labyrinth jacket exhibit larger and more uniform ranges of ice plug formation. As depicted in Figure 8C, the helical jacket forms a completely closed ice plug from Z = 0.215 m to Z = 0.275 m, with nearby slices also showing essentially closed ice plugs. In Figure 8D, the helical fin jacket completely closes the ice plug from Z = 0.155 m to Z = 0.175 m, with nearby regions also showing mostly closed ice plugs. Figure 8E shows the labyrinth jacket forming a completely closed ice plug from Z = 0.175 m to Z = 0.195 m. Compared to jackets without internal structural features, these jackets exhibit larger ice formation ranges and greater ice volumes, although they produce thinner ice layers at the jacket ends.

3.2. Comprehensive Performance Comparison of Four Jacket Structures

To comprehensively evaluate the heat transfer capability of jackets with different structures, we introduce the comprehensive evaluation factor J under equal pumping power, which is defined as follows:
J = ( N u N u 0 ) / ( f / f 0 ) 1 / 3
where Nu is Nusselt number, the subscript in the formula corresponds to the Standard jacket.
The performance evaluation criterion(PEC) is as follows:
P E C = ( N u ) / f 1 / 3
where f is the resistance factor, expressed as follows:
f = 2 d ρ u i n 2 · P l
where P / l is the unit length helical tube pressure drop, d is the tube inner diameter, and u is the inlet velocity. J is obtained by calculating the ratio of P E C of the studied structure to that of a helical smooth tube. The higher J is, the better the comprehensive performance of the helical tube with the corresponding structure.
Table 4 presents a comparison of the results for three jacket structures with a standard jacket at a liquid nitrogen flow rate of 0.2 m/s. The table shows that the use of a helical tube and the addition of internal structures increase both the Nusselt number (Nu) and the pressure drop. Compared to the standard jacket, the comprehensive evaluation factors for the labyrinth jacket and the helical fin jacket are both greater than 1, indicating that their overall performance is superior to that of the standard jacket. In contrast, the comprehensive performance of the helical tube jacket is less than 1, suggesting that its overall performance is inferior to that of the standard jacket. The results in Section 3.3 and Section 3.4 further illustrate the overall performance ranking of the jackets as follows: Labyrinth jacket > Helical fin jacket > Standard jacket > Helical jacket.

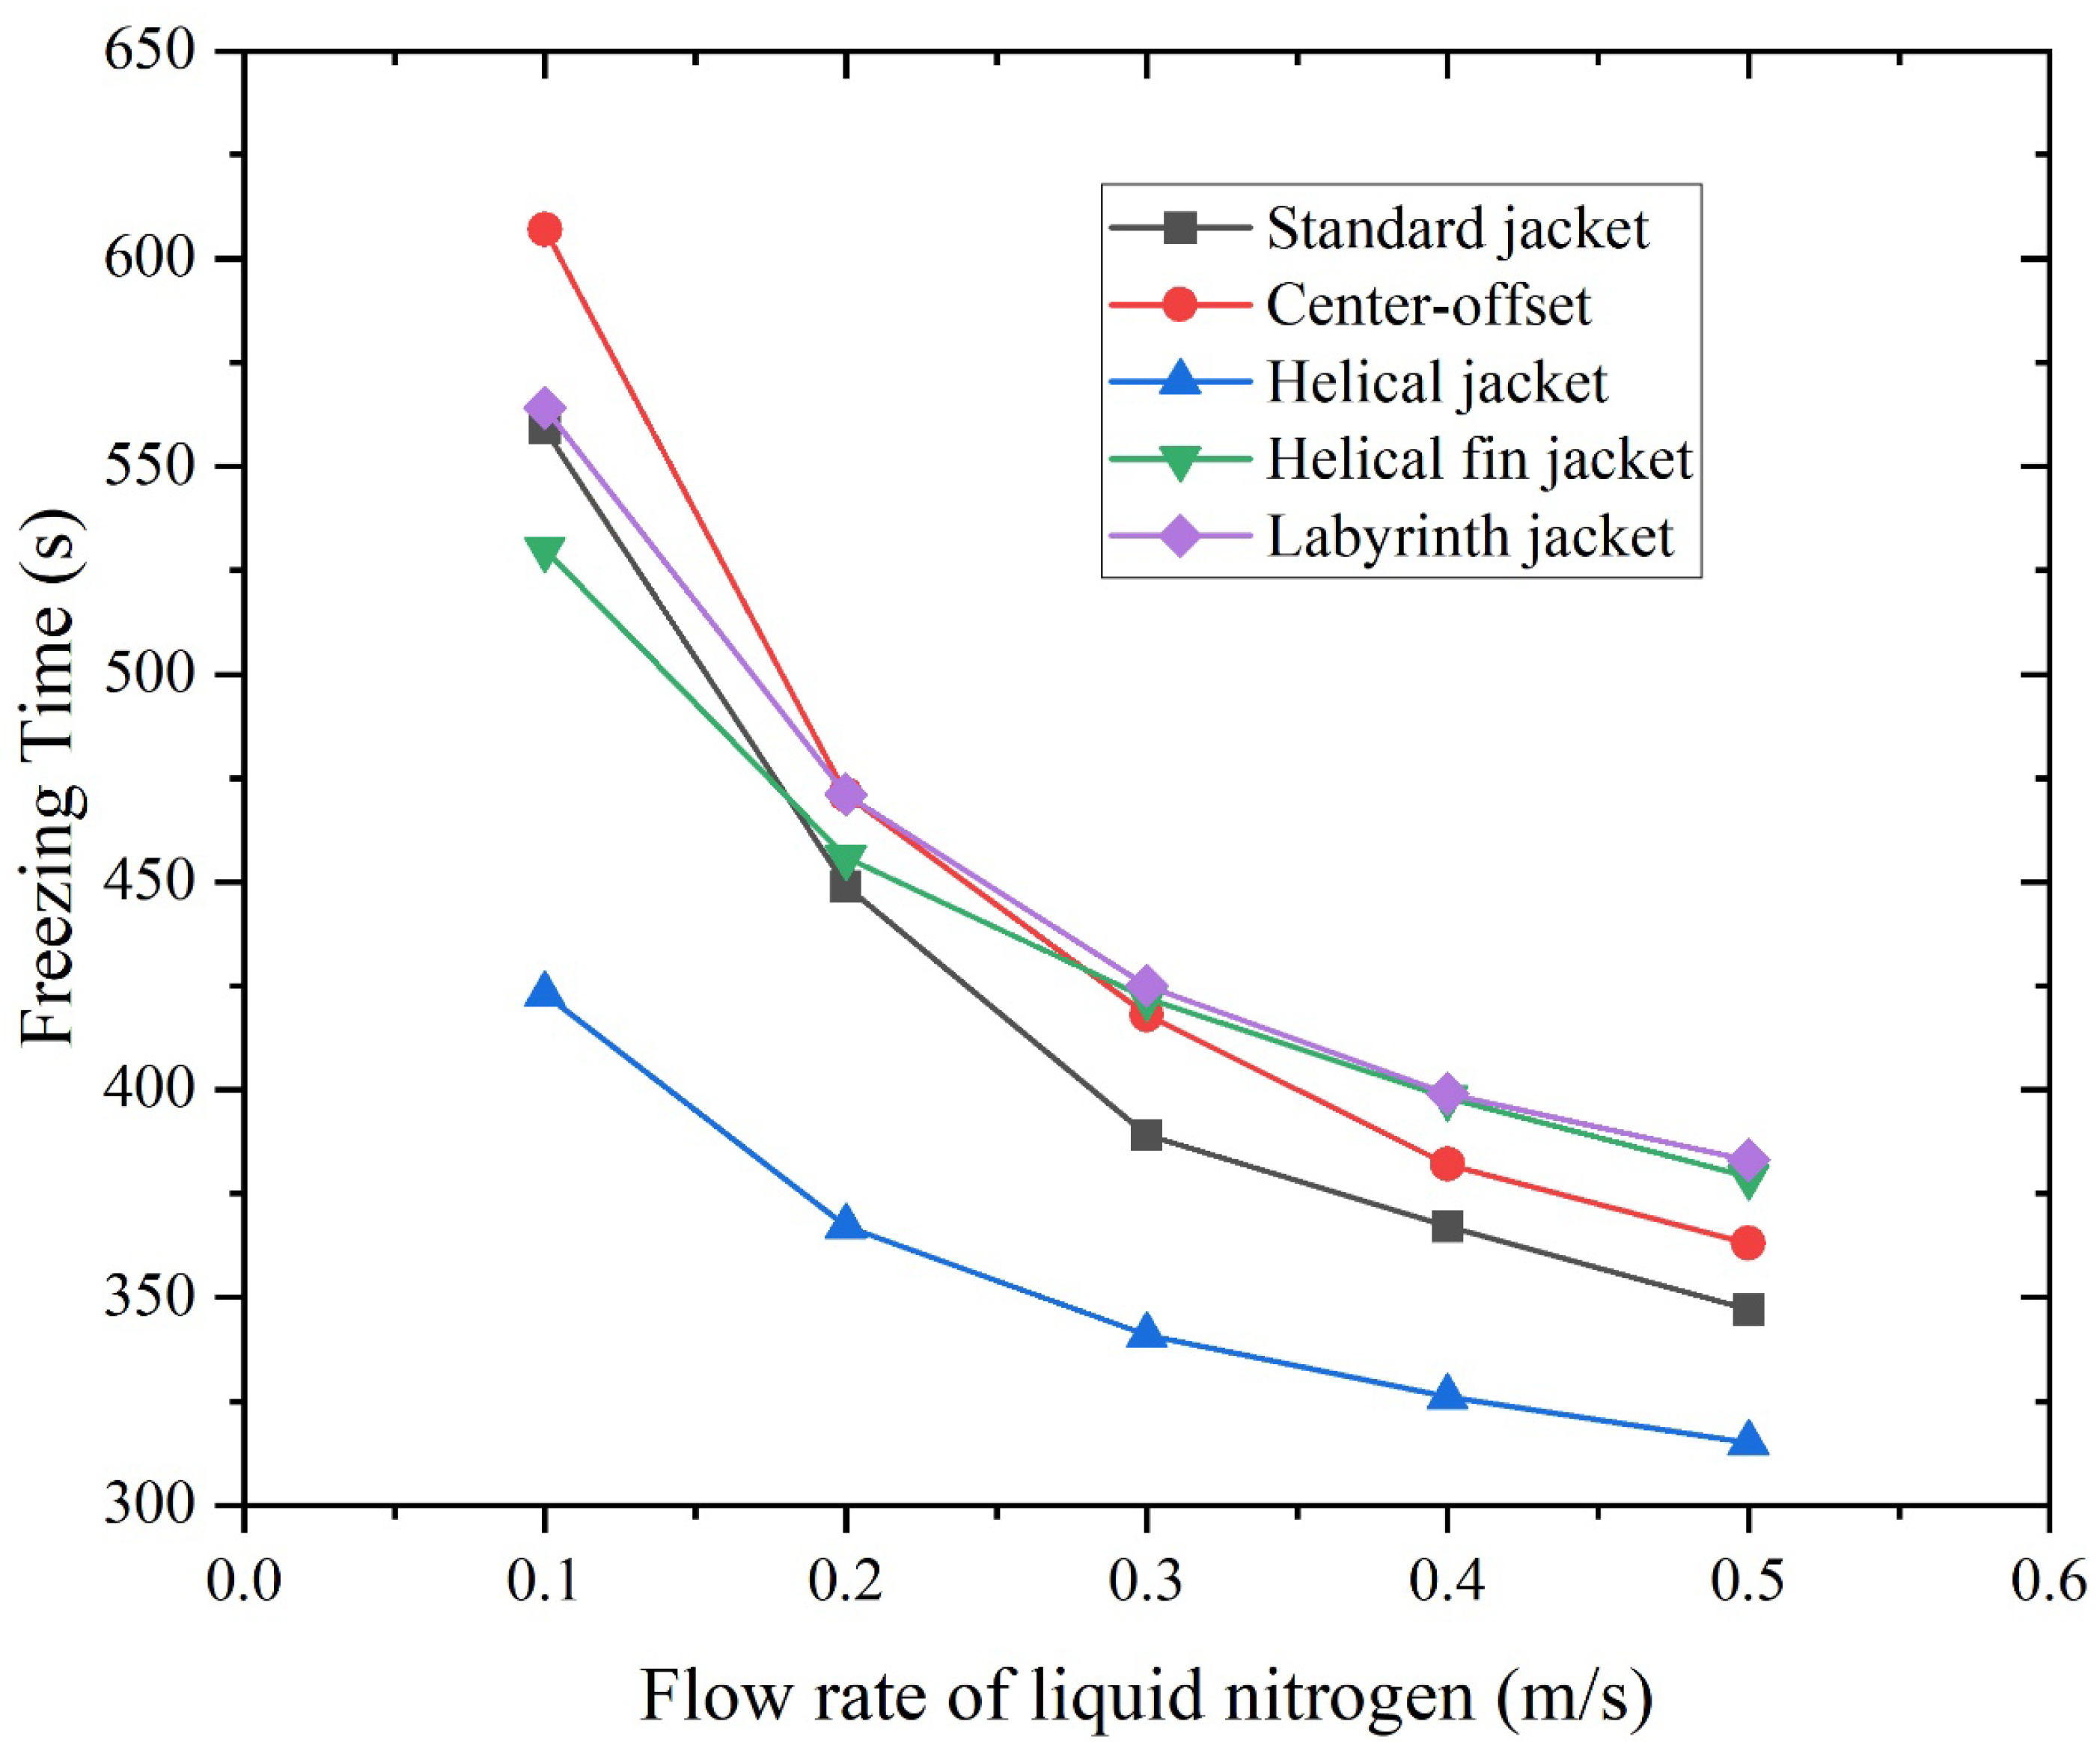
3.3. Freezing Time and Liquid Nitrogen Consumption Corresponding to Five Types of Jackets under Liquid Nitrogen Gradient Flow Rate

Figure 9 illustrates the freeze time of ice plugs for five jacket structures under varying liquid nitrogen flow rates.
As shown in Figure 9, the freeze time decreases correspondingly with increasing flow rates across all five conditions. Comparing the freeze times among these conditions, while the helical jacket exhibits the shortest freeze time at the same flow rate, its liquid nitrogen inlet area is twice that of the other four conditions, rendering it less comparable. As shown in the figure, increasing the liquid nitrogen flow rate from 0.1 m/s to 0.5 m/s reduces the freeze time for the standard jacket from 559 s to 347 s, a decrease of 37.92%. The center-offset jacket decreases from 607 s to 363 s, a reduction of 40.20%. The helical jacket decreases from 432 s to 315 s, a reduction of 25.53%. The helical fin jacket decreases from 530 s to 379 s, a reduction of 28.49%. The labyrinth jacket decreases from 564 s to 383 s, a reduction of 32%. On average, the freeze time across the five conditions decreases by 33%. Since the center-offset jacket structure and the standard jacket have no special internal structures, an increase in liquid nitrogen flow rate allows for faster diffusion to both ends, resulting in quicker cooling of the fluid inside the pipe. The reason the cooling rate of the center-offset jacket is faster than that of the standard jacket is due to structural limitations. With jackets of the same length, the time required for the standard jacket to diffuse from one end to the other is greater than the time needed for the center-offset jacket to diffuse from the center to both ends. As analyzed earlier, the helical jacket, labyrinth jacket, and helical fin jacket have more uniform internal temperature distributions, which correspond to higher internal ice plug strength.
Figure 10 displays the liquid nitrogen consumption for five jacket structures at various liquid nitrogen flow rates.
As shown in Figure 10, the liquid nitrogen consumption for all four jacket types increases linearly with the rise in the liquid nitrogen flow rate. When the flow rate increases from 0.1 m/s to 0.5 m/s, the standard jacket’s nitrogen consumption at the moment of ice plug formation increases from 3.55 kg to 11 kg, representing a 210.38% increase. Similarly, the center-offset jacket’s consumption rises from 3.85 kg to 11.51 kg (an increase of 199.01%), the helical fin jacket’s from 3.36 kg to 12.02 kg (an increase of 257.55%), and the labyrinth jacket’s from 3.58 kg to 12.15 kg (an increase of 239.54%). These data indicate that jackets without specific internal structural features consume less liquid nitrogen compared to helical fin and labyrinth jackets at higher liquid nitrogen flow rates. However, at lower flow rates, the helical fin and labyrinth jackets exhibit lower nitrogen consumption.

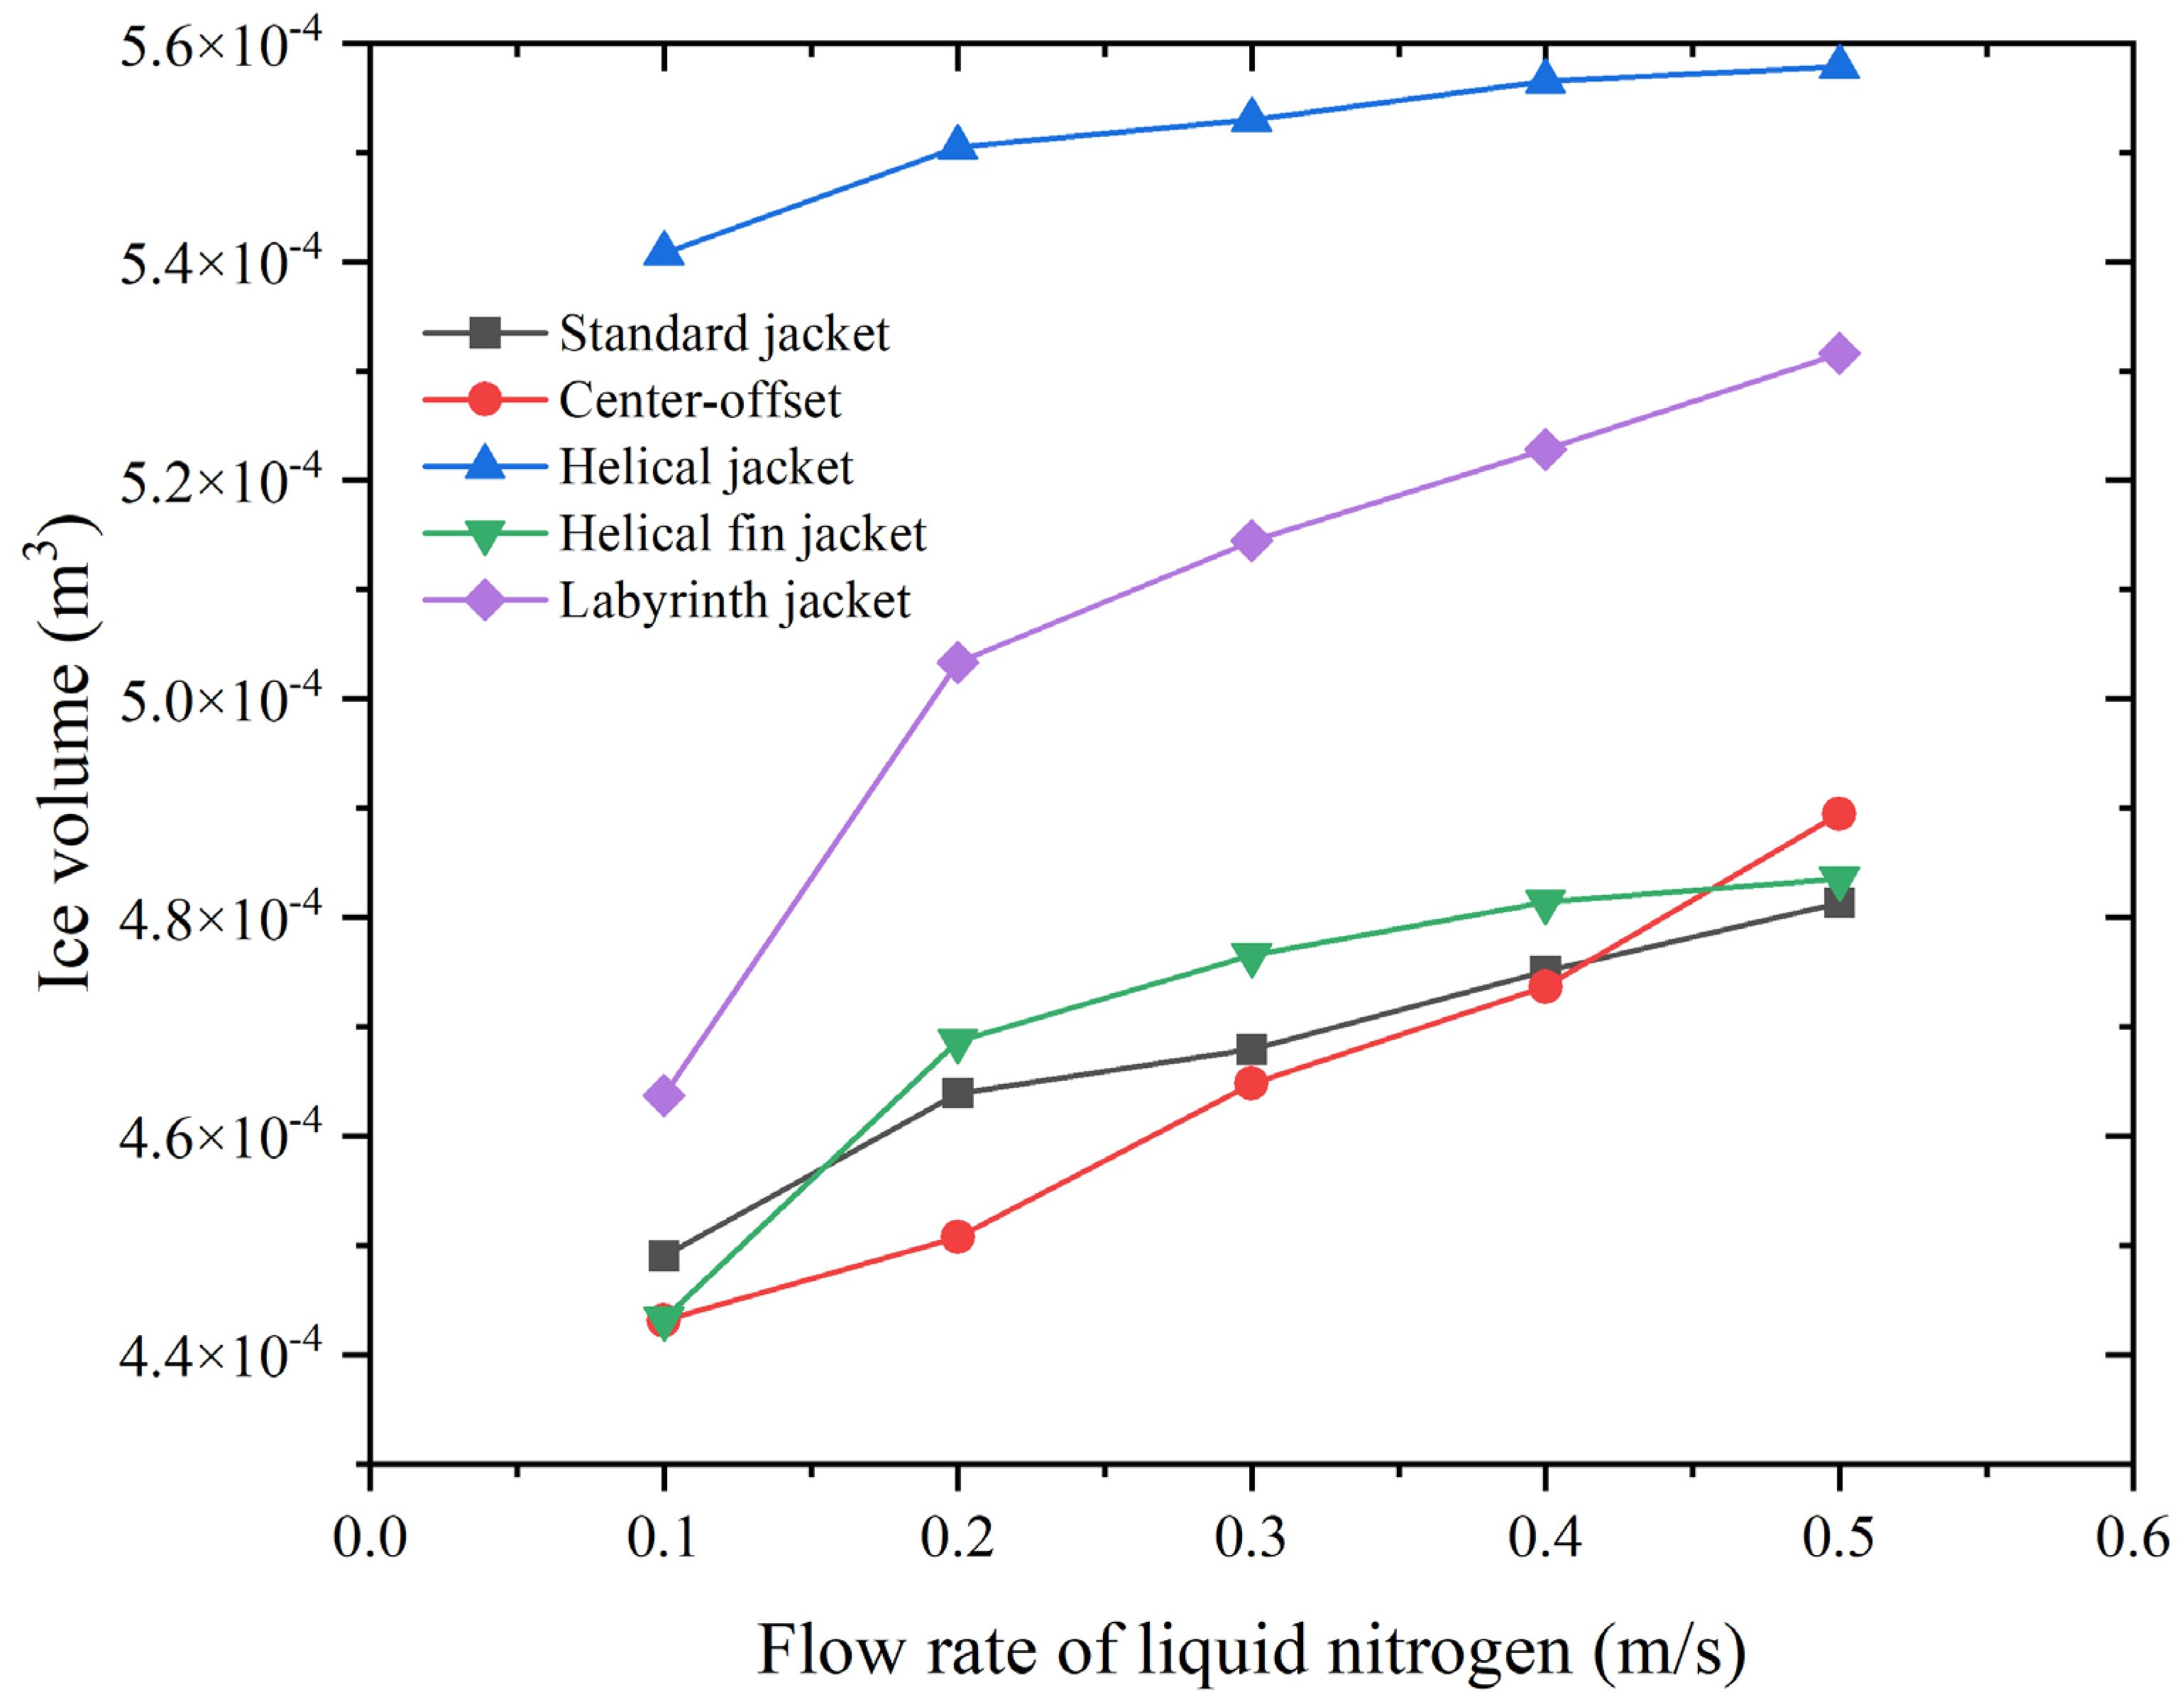
3.4. Ice Volume Corresponding to Formation Time of Ice Plugs for Five Types of Jackets under Liquid Nitrogen Gradient Flow Rate

Figure 11 illustrates the ice formation volumes within pipelines for five jacket structures at various liquid nitrogen flow rates.
As shown in Figure 11, the ice volumes increase with higher liquid nitrogen flow rates corresponding to the moment of ice plug formation. Similarly, due to its double liquid nitrogen flow rate compared to the other four jackets, the helical jacket exhibits a noticeable advantage in ice formation volume. When the liquid nitrogen flow rate increases from 0.1 m/s to 0.5 m/s, the ice volume inside the standard jacket increases from 4.49 × 10⁻⁴ m³ to 4.81 × 10⁻⁴ m³. The center-offset jacket increases from 4.43 × 10⁻⁴ m³ to 4.89 × 10⁻⁴ m³. The helical fin jacket increases from 4.43 × 10⁻⁴ m³ to 4.84 × 10⁻⁴ m³. The labyrinth jacket increases from 4.64 × 10⁻⁴ m³ to 5.32 × 10⁻⁴ m³. Overall, the labyrinth jacket consistently shows larger ice formation volumes inside the pipeline compared to the other three types of jackets, whether at low or high liquid nitrogen flow rates. The helical fin jacket produces more ice than the standard jacket and, under moderate liquid nitrogen flow conditions, is also more than the center-offset jacket. The center-offset jacket produces less ice volume at low flow rates compared to the standard jacket but surpasses it at high flow rates, showing an overall increasing trend in ice formation volume compared to the standard jacket. Additionally, the chart shows that as the liquid nitrogen flow rate increases, the ice volume for each jacket structure consistently grows, but the growth rate slows down as the flow rate increases. This indicates that when the flow rate exceeds 0.2 m/s, its influence on the ice volume begins to diminish.
To explore the performance of the helical coil jacket and the energy-saving capabilities of the other four types of jackets, this study calculates the ice formation volume inside the pipeline at the moment of ice plug formation divided by the corresponding liquid nitrogen consumption. This ratio represents the ice formation volume per kilogram of liquid nitrogen (m³/kg).
Figure 12 displays the ice formation volumes per kilogram of liquid nitrogen consumption for five jacket structures at various liquid nitrogen flow rates.
As shown in Figure 12, the ice formation volume per kilogram of liquid nitrogen consumption decreases linearly with increasing liquid nitrogen flow rates for the five jacket structures. This demonstrates that while higher liquid nitrogen flow rates shorten the ice plug formation time, they also increase the corresponding energy consumption ratio. Therefore, for energy-saving considerations, it is advisable to maintain lower liquid nitrogen inlet flow rates.
Specifically, when the liquid nitrogen flow rate increases from 0.1 m/s to 0.5 m/s, the ice formation volume per kilogram of liquid nitrogen consumption decreases for each jacket type: the standard jacket decreases from 1.27 × 10⁻⁴ to 4.37 × 10⁻⁵, the center-offset jacket decreases from 1.15 × 10⁻⁴ to 4.25 × 10⁻⁵, the helical jacket decreases from 1.01 × 10⁻⁴ to 2.79 × 10⁻⁵, the labyrinth jacket decreases from 1.30 × 10⁻⁴ to 4.38 × 10⁻⁵, and the helical fin jacket decreases from 1.32 × 10⁻⁴ to 4.02 × 10⁻⁵. Comparing these lines, except at a liquid nitrogen flow rate of 0.1 m/s where the labyrinth jacket’s ice formation volume per unit nitrogen consumption is slightly lower than that of the helical fin jacket, its values are higher than the other four types of jackets under other liquid nitrogen flow rate conditions.
From the perspective of saving liquid nitrogen consumption, the labyrinth and helical fin jackets are preferable at low liquid nitrogen flow rates (0.1 m/s). In the range of 0.2 m/s to 0.5 m/s, the labyrinth jacket proves more economical with liquid nitrogen consumption. Therefore, it is advisable to choose the labyrinth jacket particularly under high liquid nitrogen flow rate conditions.

3.5. Comparison of Experimental and Simulation Results

To verify the model’s accuracy, experiments were conducted on a 2-inch standard jacket. Figure 13 shows the experimental setup. The entire ice plug freezing test rig consists of four main components: the liquid nitrogen cooling system, the main experimental pipeline, the circulation loop, and the data acquisition system. During the experiment, the liquid nitrogen cooling system is used to cool the main pipeline, causing the liquid inside the pipe to continuously form an ice layer that isolates the upstream and downstream sections of the pipeline. The circulation loop allows for the entry and discharge of liquid within the system. The data acquisition system is used to collect data on the pipe wall temperature and the freezing time.
The experimental results are shown in Table 5, where the ice plug formation times were recorded as 584 s and 670 s in two separate trials. Simulation results indicated an ice plug formation time of 559 s at low liquid nitrogen flow rates for the standard jacket. The experimental data showed errors of 4.93% and 16.57% relative to the simulated data. These discrepancies can be attributed to insulation imperfections in the experimental setup, inherent heat losses in the apparatus, and challenges in precise control of liquid nitrogen flow rates during experiments. Despite these challenges, the simulated data closely matched the experimental results.

4. Conclusions

This study investigates the thermal characteristics of ice plug formation processes influenced by internal jacket structures. Five different jacket configurations were established, and varying liquid nitrogen flow rates were employed to analyze temperature distribution inside the pipeline at ice plug formation, as well as ice layer growth, ice plug formation time, ice formation volume, and the ice formation volume per kilogram of liquid nitrogen consumed. The specific conclusions are summarized as follows:
1.
The labyrinth and helical fin jackets exhibit lower internal temperatures at the moment of ice plug formation compared to the standard and center-offset jackets. Based on ice mechanics, the labyrinth jacket demonstrates higher ice plug strength;
2.
Regarding the time of ice plug formation, at a liquid nitrogen flow rate of 0.1 m/s, the helical jacket has the shortest time at 423 s, but its liquid nitrogen consumption is significantly higher than the other four types. When considering nitrogen consumption, the helical fin jacket should be chosen at lower flow rates, while the standard jacket is preferable at higher flow rates;
3.
In terms of ice formation volume, the helical jacket exhibits the largest ice formation, but its liquid nitrogen consumption is much higher than the other four types. When considering nitrogen consumption, the labyrinth jacket shows the largest volume;
4.
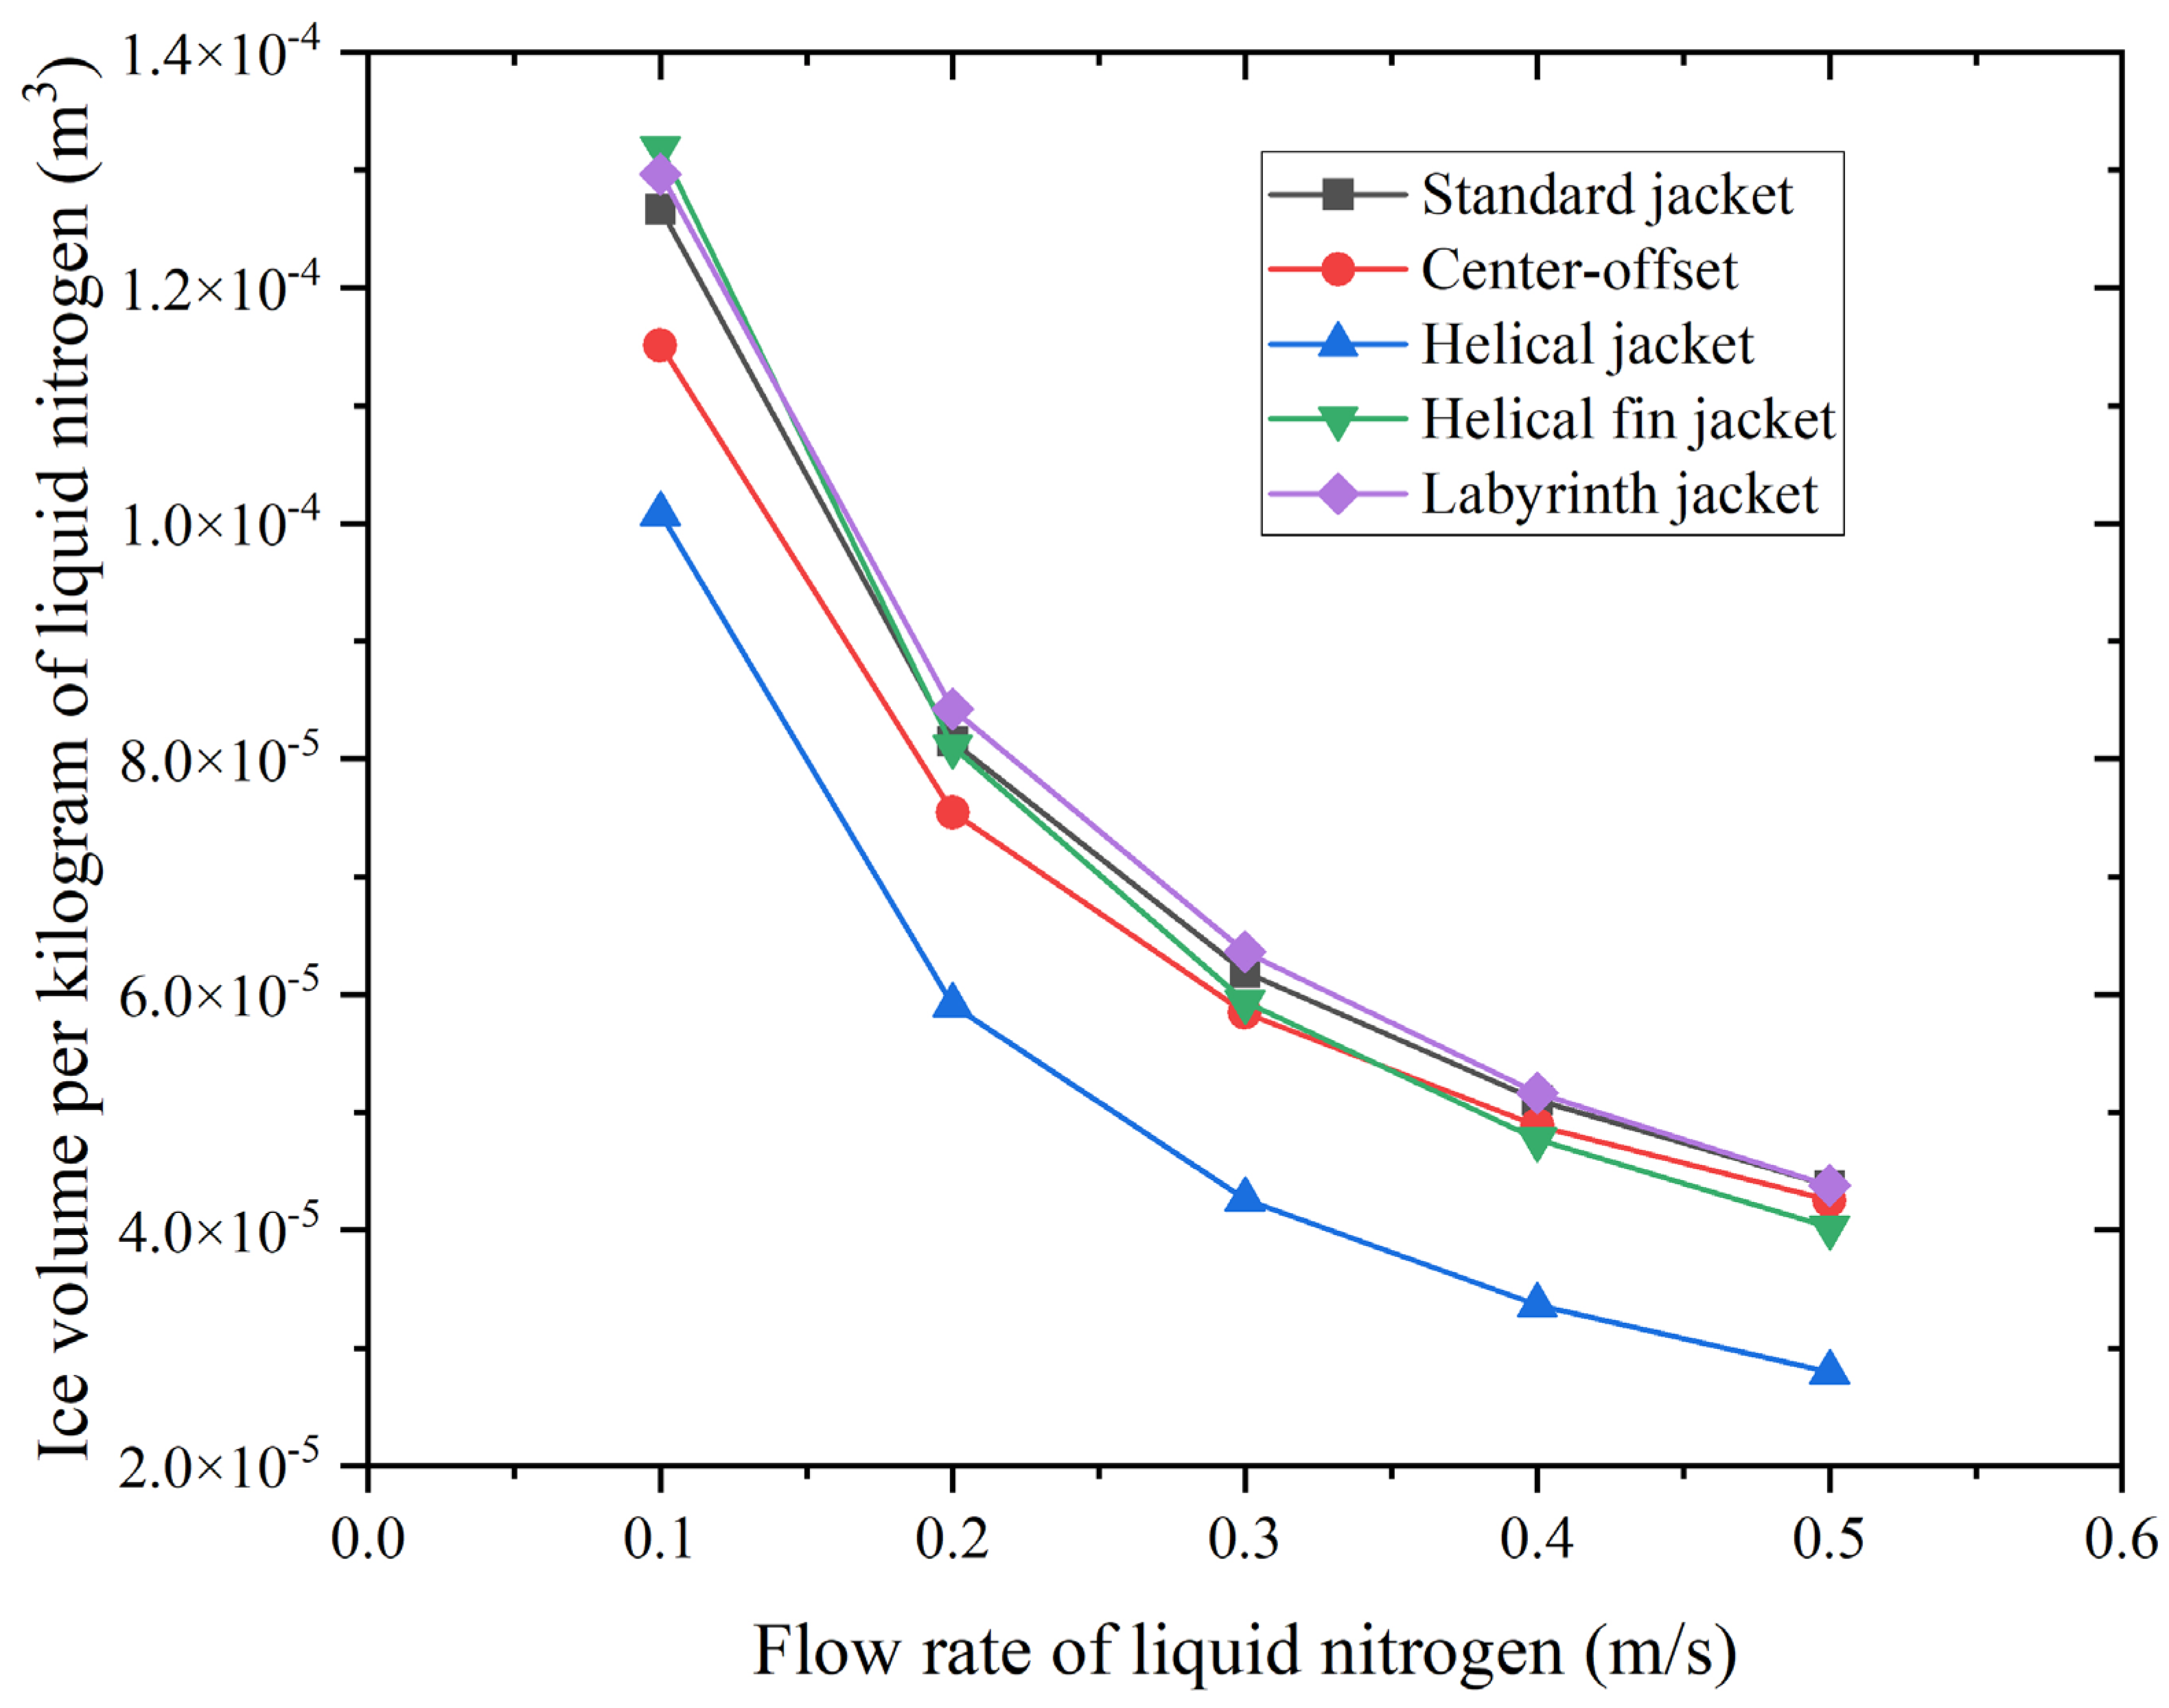
Regarding the ice formation volume per kilogram of liquid nitrogen consumed, at a flow rate of 0.1 m/s, the helical fin jacket has a larger volume. At flow rates greater than 0.1 m/s, the labyrinth jacket shows a larger corresponding value. Therefore, considering all factors, the labyrinth jacket has the lowest energy consumption ratio. Compared with the single-jacket freezing method, the multi-jacket method can make the freezing time reduced by 11~22% and the liquid nitrogen consumption reduced by 18~26%.

Author Contributions

Methodology, W.Z.; Software, H.L.; Validation, H.C.; Formal analysis, K.X. and M.H.; Investigation, W.Z.; Writing—original draft, K.X. and M.H.; Writing—review & editing, H.L. and Y.F.; Supervision, L.W. and Y.F.; Funding acquisition, L.W. All authors have read and agreed to the published version of the manuscript.

Funding

This research received no external funding.

Data Availability Statement

The original contributions presented in the study are included in the article, further inquiries can be directed to the corresponding author.

Conflicts of Interest

Authors Wei Zhang, Ke Xu and Ming-Lei Hu were employed by the company China Nuclear Power Operation Management Co., Ltd. The remaining authors declare that the research was conducted in the absence of any commercial or financial relationships that could be construed as a potential conflict of interest.

References

  1. Aydin, G.; Jang, H.; Topal, E. Energy consumption modeling using artificial neural networks: The case of the world’s highest consumers. Energy Sources Part B Econ. Plan. Policy 2016, 11, 212–219. [Google Scholar] [CrossRef]
  2. Jin, L. Research on safety influencing factors and maintenance strategy of nuclear power operation. Ind. Technol. Forum 2022, 21, 224–225. [Google Scholar] [CrossRef]
  3. You, J.; Wu, J.; Xu, L.; Xie, Y.; Qiu, J.; Wan, L.; Qin, Q. Exploration on the comprehensive data reconciliation framework for unknown parameter inference in the nuclear power plant system. Appl. Therm. Eng. 2024, 247, 123138. [Google Scholar] [CrossRef]
  4. Huang, S.-X.; Zhang, J.-P.; Yang, W.-D.; Wang, Z.-F.; Hu, F.; Liu, F.; Sheng, L.; Zeng, Q.-C. Predicting and Controlling Nuclear Accident Hazards: Issues and Challenges. Aerosol Air Qual. Res. 2016, 16, 417–429. [Google Scholar] [CrossRef]
  5. He, S. Analysis of factors affecting the operational safety of nuclear power. Ind. Technol. Forum 2022, 21, 65–66. [Google Scholar] [CrossRef]
  6. Yang, H.S. Research on the influence factors of nuclear power operation safety. Mod. Enterp. Cult. 2019, 23, 191. [Google Scholar]
  7. Keary, A.C.; Bowenl, R.J. On the prediction of local Ice formation in pipes in the presence of natural convection. J. Heat Transf. 1999, 121, 934–944. [Google Scholar] [CrossRef]
  8. Shamsundar, N. Approximate calculation of multidimensional solidification by using conduction shape factors. ASME Trans. J. Heat Transf. 1982, 104, 8–12. [Google Scholar] [CrossRef]
  9. Xie, L.J.; Shen, X.; Lin, H.B.; Zhang, W.; Hu, M.L.; Bian, C.H. Study of liquid nitrogen ice plug test and its stress distribution in industrial pipelines. Cryog. Eng. 2020, 6, 38–43. [Google Scholar]
  10. Wang, H.Y. Research on the Application of Ice Plug Technology in Nuclear Power Plants. Master’s Thesis, Shanghai Jiaotong University, Shanghai, China, 2006. [Google Scholar]
  11. Li, W.; Zhou, L.K.; Yuan, Y.; Yuan, Y.; Fang,, Q.S.; Qiao,, Y.L. Simulation of Ice Plug Formation and Material Damage Characteristics in Depressurization System Pipelines of Generation III Nuclear Power Plants. Nucl. Sci. Eng. 2023, 43, 1049–1058. [Google Scholar] [CrossRef]
  12. Corbescu, B.; Puiu, D.; Gyongyosi, T.; Panaitescu, V. Forming an ice plug inside a high diameter pipeline in stationary water using a nitrogen vapour exhaust restriction. J. Phys. Conf. Ser. 2018, 1122, 012002. [Google Scholar] [CrossRef]
  13. Gyongyoşi, T.; Valeca, Ș.; Deloreanu, G.I.R. Încercări de formare a dopului de gheaţă într-o conductă orizontală umplută cu apă, în regim static (fără circulaţia fluidului). ICN Piteşti, 2007, 7997.
  14. Gyongyoşi, T.; Valeca, Ș.; Puiu, D.I.R. Influenţa mărimii orificiului de evacuare în procesul formării dopului de gheaţă în conducta orizontală cu Dn 200 mm în absenţa curgerii apei demineralizate. SCN Piteşti 2014, 10220.
  15. Du, J.L.; Xie, H.T. Application of ice plugging method on 600MW thermal power units. Sci. Technol. Innov. 2018, 32, 66–67. [Google Scholar]
  16. Liu, F.L.; Fan, S.K.S.; Ndi, E.; Tu, J.F. An Efficient no-shutdown pipe-fixing freezing design for water management system in hospitals during COVID-19: A case study. Water 2021, 13, 2725. [Google Scholar] [CrossRef]
  17. Gui, L.; Liu, J. Ice valve for a mini/micro flow channel. J. Micromech. Microeng. 2004, 14, 242–246. [Google Scholar] [CrossRef]
  18. Takefuj, Y.; Okubo, T. Double-ice-plug freezing using liquid nitrogen for water pipe repairs. Urban Water J. 2018, 15, 97–99. [Google Scholar] [CrossRef]
  19. You, Q.; Mo, N.; Liu, X.N.; Luo, H.; Shi, Z. Experiments on helium breakdown at high pressure and temperature in uniform field and its simulation using COMSOL Multiphysics and FD-FCT. Ann. Nucl. Energy 2020, 141, 107351. [Google Scholar] [CrossRef]
  20. Xu, P.; Xiao, Y.Y. Advances in Enhanced Heat Transfer Technologies for Shell-and-Tube Heat Exchangers. Mech. Electr. Equip. 2020, 37, 5. [Google Scholar] [CrossRef]
  21. Shi, M.Z.; Wang, Z.Z. Principles and Design of Heat Exchangers; Southeast University Press: Nanjing, China, 2009; p. 265. [Google Scholar]
  22. Hu, B. Study on the Impact of Baffle Structures on the Performance of Shell-and-Tube Heat Exchangers. Master’s Thesis, Jianghan University, Wuhan, China, 2022. [Google Scholar]
  23. Li, H.; Kottke, V. Effect of baffle spacing on pressure drop and local heat transfer in shell-and-tube heat exchangers for staggered tube arrangement. Int. J. Heat Mass Transf. 1998, 41, 1303–1311. [Google Scholar] [CrossRef]
  24. Russ, G.; Beer, H. Heat transfer and flow field in a pipe with sinusoidal wavy surface—I. Numerical investigation. Int. J. Heat Mass Transf. 1997, 40, 1061–1070. [Google Scholar] [CrossRef]
  25. Cui, H.T.; Yuan, X.G. Study on the Comprehensive Performance of Spiral Grooved Tubes. Petrochem. Equip. Technol. 2001, 22, 6–8. [Google Scholar]
  26. Xiao, J.H.; Qian, C.F.; Huang, Z.X.; An, W.Z. Study on Flow and Heat Transfer Enhancement in Corrugated Tubes. J. Beijing Univ. Chem. Technol. 2006, 3, 70–74. [Google Scholar]
  27. Jiang, X.; Peng, Z.M.; Hu, W.X. Experimental Study on Heat Transfer Performance of Fluid in Twisted Tri-Lobed Tubes. In Proceedings of the 2014 Annual Conference of the Chinese Society of Engineering Thermophysics, Xi’an, China, 31 October–3 November 2014. [Google Scholar]
  28. Zhang, F.; Li, Z.H.; Li, X.Y.; Ding, J.; Chen, L.; Tao, W.Q. Experimental Study on the Heat Exchanger Characteristics of Finned Tubes Made of Different Materials. J. Xi’an Jiaotong Univ. 2015, 5, 62–67. [Google Scholar]
  29. Qiu, G.T.; Feng, Y.C. Corrugated Tube Heat Exchangers (Part 1)—Origin, Current Status, and Development. Pipeline Technol. Equip. 1998, 1, 47–49. [Google Scholar]
  30. Liu, M.Q.; Mukhe, R. Double bow-shaped folded plate shell and tube heat exchanger. Petrochem. Equip. Technol. 1993, 14, 18–21. [Google Scholar]
  31. Li, Y.; Liu, Z.Y.; An, Y.R. Introduction to Fluent, a generalized software for computational fluid dynamics. Hydrodyn. Res. Prog. 2001, 2, 254–258. [Google Scholar]
  32. Guo, Y.K.; Meng, W.Y. Experimental study on the mechanical properties of ice. J. North China Univ. Water Conserv. Hydropower 2015, 36, 40–43. [Google Scholar]
  33. Ouyang, Q.A. Experimental Study on Mechanical Properties of Static and Dynamic Ice and Numerical Simulation of Particle Discrete Element Method. Ph.D. Thesis, Tianjin University, Tianjin, China, 2019. [Google Scholar]
Figure 1. Schematic diagram of the ice plug freezing technology [9].
Energies 17 04211 g001
Figure 2. Cross-sectional diagram of the jacket structure. (A) Standard jacket, (B) Center-offset jacket, (C) Helical jacket, (D) Helical fin jacket, (E) Labyrinth jacket.
Energies 17 04211 g002
Figure 3. Mesh division of the pipeline segment. (A) Mesh division of water inside the pipe in the X–Y plane, (B) Mesh division of water inside the pipe.
Energies 17 04211 g003
Figure 4. Mesh division of the ice plug jacket.
Energies 17 04211 g004
Figure 5. Mesh division of the jacket structure. (A) Mesh division of the standard jacket, (B) Mesh division of the center-offset jacket, (C) Mesh division of the helical jacket, (D) Mesh division of the helical fin jacket, (E) Mesh division of the labyrinth jacket.
Energies 17 04211 g005aEnergies 17 04211 g005b
Figure 6. Results of mesh calculation.
Energies 17 04211 g006
Figure 7. Contour map of internal temperature distribution when ice plugs form for five conditions with liquid nitrogen flow velocity of 0.1 m/s. (A) Standard jacket, (B) Center-offset jacket, (C) Helical jacket, (D) Helical fin jacket, (E) Labyrinth jacket.
Energies 17 04211 g007aEnergies 17 04211 g007b
Figure 8. Contour map of ice distribution inside the pipeline when ice plugs form for five conditions with a liquid nitrogen flow velocity of 0.1 m/s. (A) Standard jacket, (B) Center-offset jacket, (C) Helical jacket, (D) Helical fin jacket, (E) Labyrinth jacket.
Energies 17 04211 g008aEnergies 17 04211 g008b
Figure 9. Freezing times of ice plugs for five jacket structures under different liquid nitrogen flow rates.
Energies 17 04211 g009
Figure 10. Liquid nitrogen consumption of ice plug for five jacket structures under different liquid nitrogen flow rates.
Energies 17 04211 g010
Figure 11. Ice volumes formed inside the pipeline of ice plug for five jacket structures under different liquid nitrogen flow rates.
Energies 17 04211 g011
Figure 12. Ice volumes formed per kilogram of liquid nitrogen consumed for five jacket structures under different liquid nitrogen flow rates.
Energies 17 04211 g012
Figure 13. Ice plug freezing experimental setup.
Energies 17 04211 g013
Table 1. Physical parameters of the pipeline and jacket.
Physical ParametersValues
internal diameter of the pipeline50 mm
external diameter of the pipeline54 mm
pipeline wall thickness2 mm
external diameter of the jacket118 mm
internal diameter of the jacket114 mm
jacket thickness2 mm
jacket inlet diameter10 mm
jacket outlet diameter10 mm
pipeline length450 mm
distance between jacket ends and pipeline ends150 mm
helical pipeline diameter20 mm
pitch of helical fins23 mm
spacing between labyrinth baffles23 mm
Table 2. Boundary condition.
TypeMethod
Wall functionStandard wall function
Inlet typeVelocity inlet
Outlet typePressure outlet
Pressure typeStandard pressure type
Solution methodSIMPLEC
Table 3. Physical properties.
T (K)λ (W/(m⋅K))ρ (kg/m3)Cp (KJ/(kg⋅K))
Water313.150.631990.584.18
293.150.598997.984.184
273.150.552999.844.22
263.152.3916.792.1
213.152.949241.658
173.153.499281.389
Liquid nitrogen770.14581806.082.0415
Table 4. Comprehensive performance comparison of four jacket structures.
Helical JacketHelical Fin JacketLabyrinth JacketStandard Jacket
Nu number197.7229225.9943239.7979183.2073
P / l 1021.35835.69975.43712.23
J 0.9570381.1695341.1786291
Table 5. Experimental and simulation results.
TypeTest NumberFreezing Time
experimental results1584 s
experimental results2670 s
simulation results1559 s
simulation results2559 s
Disclaimer/Publisher’s Note: The statements, opinions and data contained in all publications are solely those of the individual author(s) and contributor(s) and not of MDPI and/or the editor(s). MDPI and/or the editor(s) disclaim responsibility for any injury to people or property resulting from any ideas, methods, instructions or products referred to in the content.

