1. Introduction
Petrol and diesel, which are traditional fuels derived from petroleum, continue to play a major role in transportation as a fuel source. Nevertheless, the emissions produced by these fuels, such as carbon monoxide (CO), hydrocarbons (HC), and nitrogen oxides (NO
x), are worrisome. In addition, hydrocarbon fuels emit greenhouse gases (GHG), such as carbon dioxide (CO2), which are recognised for their role in causing global warming and climate change. Consequently, regulatory authorities and governments worldwide have recently modified their targets for reducing carbon emissions. Consequently, strict pollution restrictions have been universally enforced for passenger and light commercial vehicles. As an illustration, the United States of America (USA) has enacted Executive Order 14037 to ensure that 50% of newly manufactured passenger automobiles and light-duty vehicles can operate without emitting any CO
2 by the year 2030. Similarly, the European Union has implemented Regulation (EU) 2023/851, which mandates that only cars with zero emissions (ZEV) will be available for purchase starting in 2035. The urgent need to decrease tailpipe emissions is propelling the advancement of alternate remedies [
1,
2].
NO
x, primarily generated from combustion processes, has substantial environmental effects and wide-ranging ramifications. NO
x emissions are a significant factor in air pollution, creating ground-level ozone and fine particulate matter. These pollutants have serious implications for human health, as highlighted by studies conducted by Huang et al. and Lelieveld et al. [
3,
4]. In addition to directly impacting air quality, NO
x emissions can cause nitrogen deposition in ecosystems, alter soil chemistry, and disturb nutrient cycles. Deposing acidic substances can result in soil acidification and cause changes in microbial communities, which can impact plant health and biodiversity [
5,
6]. In addition, NO
x emissions contribute to the accumulation of atmospheric nitrogen, which causes eutrophication in aquatic ecosystems and poses risks to water quality and aquatic biodiversity. The cumulative findings from these studies emphasise the diverse and wide-ranging effects of NO
x emissions on land- and water-based ecosystems, emphasising the necessity for efficient approaches to reduce their negative consequences [
7,
8].
Adopting zero-carbon fuels, like hydrogen, can significantly reduce environmental harm and pave the way for a decarbonised trajectory with zero carbon emissions. The hydrogen internal combustion engine (ICE) technology has demonstrated its potential and capacity to seamlessly integrate into the current ICE platform, originally designed for diesel and gasoline operation. The direct utilisation of pure hydrogen eradicates steady-state carbon dioxide and hydrocarbon emissions. It is important to highlight that efforts to comprehend and comprehensively tackle NOx emissions are still in progress.
The transition towards achieving zero-carbon emissions for internal combustion engine (ICE) technology necessitates a shift from fossil fuel-based to non-carbon fuels. Biofuels, which can be used as drop-in fuels, offer a promising solution with higher CO
2 life-cycle emission reduction rates. However, it is worth noting that the tailpipe emissions associated with biofuels are nearly on par with those of fossil fuels [
9,
10]. Premade fuel mixtures containing both alcohol and gasoline are recognised for their ability to effectively decrease overall vehicle emissions, leading to a reduction in particulate matter emissions. However, the NO
x emissions from spark-ignited (SI) engines have varying responses depending on the engine’s powertrain setup [
11,
12]. Research studies indicate that ethanol and methanol exhibit superior performance to gasoline engines in terms of thermal efficiency in various operating conditions. The improvement in thermal efficiency is more evident at higher loads and power outputs. The high knock resistance of ethanol and methanol enables more advanced combustion timing, eliminating the necessity for excessive fuelling under full load and power operations. This is due to the higher latent heat and lower air-fuel ratio of alcohol fuels, contributing to a higher knock resistance [
13,
14].
Prior solutions have made strides in reducing carbon emissions, but carbon-free fuels, such as ammonia (NH
3) and hydrogen (H
2), are necessary to eliminate emissions fully. These fuels lack carbon atoms in their chemical makeup and can ensure zero carbon emissions throughout their life cycle when sourced from renewable sources. This provides the opportunity to significantly reduce the generation of HC, CO, and CO
2 during the combustion process. However, partial burning of lubricating oil in the combustion chamber may still produce some of these emissions [
15,
16,
17].
Ammonia is a commonly used fertiliser that has been suggested as a carbon-free fuel option for internal combustion engines. However, the current ammonia production can have detrimental environmental impacts, so various green ammonia production methods are being explored. While ammonia use as a fuel has benefits, it also poses some drawbacks. Its utilisation in combustion systems necessitates a high boost pressure and compression ratio or a combination with hydrogen. Dual-fuel compression-ignition engines can use both diesel and ammonia. However, ammonia combustion produces exhaust NO
x and unburned NH
3, necessitating the implementation of after-treatment systems. Ammonia is a more viable option for stationary or maritime engine applications. Improving the quality of direct fuel replacement combustion would need more research and development [
18,
19,
20,
21].
Hydrogen usage in ICE offers several advantages besides eliminating carbon emissions. Minor modifications are sufficient to implement H
2 in ICEs, and its high-octane number (130 or higher) and high auto-ignition temperature provide high resistance to end-gas autoignition combustion. The combustion stability is improved due to the faster burning rate of hydrogen than gasoline. H
2’s high diffusion coefficient also promotes the homogeneous mixture of air and fuel. H
2’s broader flammability range allows for leaner operation without increased ignition energy, decreasing the probability of abnormal combustion such as backfire, pre-ignition, and surface ignition. The leaner operation also significantly reduces engine-out NO
x emissions with higher air–fuel equivalence ratio (λ) values above 2. Achieving the desired power density and higher engine load requires an ultra-lean mixture and a high level of intake-boosting air. However, leaner combustion could result in lower combustion efficiency by producing more unburned fuel, lowering thermal efficiency and exhaust gas temperature (EGT), negatively impacting the available enthalpy for driving turbochargers [
22,
23,
24,
25,
26,
27].
Hydrogen is a promising alternative fuel to replace gasoline in ICE due to its zero-carbon emissions and better performance. However, using hydrogen as fuel poses some challenges. One of the main challenges is the higher air-to-fuel ratio of 34 compared with 14.6 for gasoline, which means more air is needed to combust hydrogen, resulting in higher pumping mean effective pressure (PMEP). The higher flame speed of hydrogen leads to a fast burn rate, which causes a higher pressure rise rate and limits the engine’s load. Additionally, hydrogen combustion produces NO
x emissions, which are harmful to the environment. One of the main solutions to reduce NO
x emissions is to operate the engine on the lean side, which means running the engine at lambda 2.75 to 3.5 to lower the burn speed, which significantly drops the pressure rise rate and the NO
x. However, operating on the lean side presents a new challenge in control and calibration, and new boosting solutions may be necessary to adopt that. On the other hand, operating the engine at the stoichiometric region provides safety concerns, as H
2 port fuel injection (PFI) can backfire in the intake, which leaves the only way to operate at the stoichiometric combustion associated with H
2 direct injection (DI) [
25,
28,
29,
30,
31,
32].
The previous analyses of NO
x emissions have not included direct comparisons between hydrogen and gasoline combustion in the same engine and their values at various lambda values. Additionally, there has been little work reported on the direct comparison between the DI and PFI hydrogen engine operations. Furthermore, most previous studies have been conducted on time-averaged NO
x emissions. Therefore, a thorough NO
x emissions assessment was conducted in this study across three distinct phases. In the first part, the ensemble-averaged NO
x emissions over 300 cycles were determined and compared between H
2 DI and PFI operations and the DI gasoline operation. The analysis of instantaneous NO and NO
2 emissions was then extended to the crank domain with a resolution of 0.25 crank degrees. Finally, the cyclic variation of NO
x emissions was analysed for the PFI/DI hydrogen engine operations and the DI gasoline engine operation with correlations drawn of each exhaust stroke’s NO
x emissions vs. cylinder pressure parameters (similar to [
32]).
2. Experimental Setup
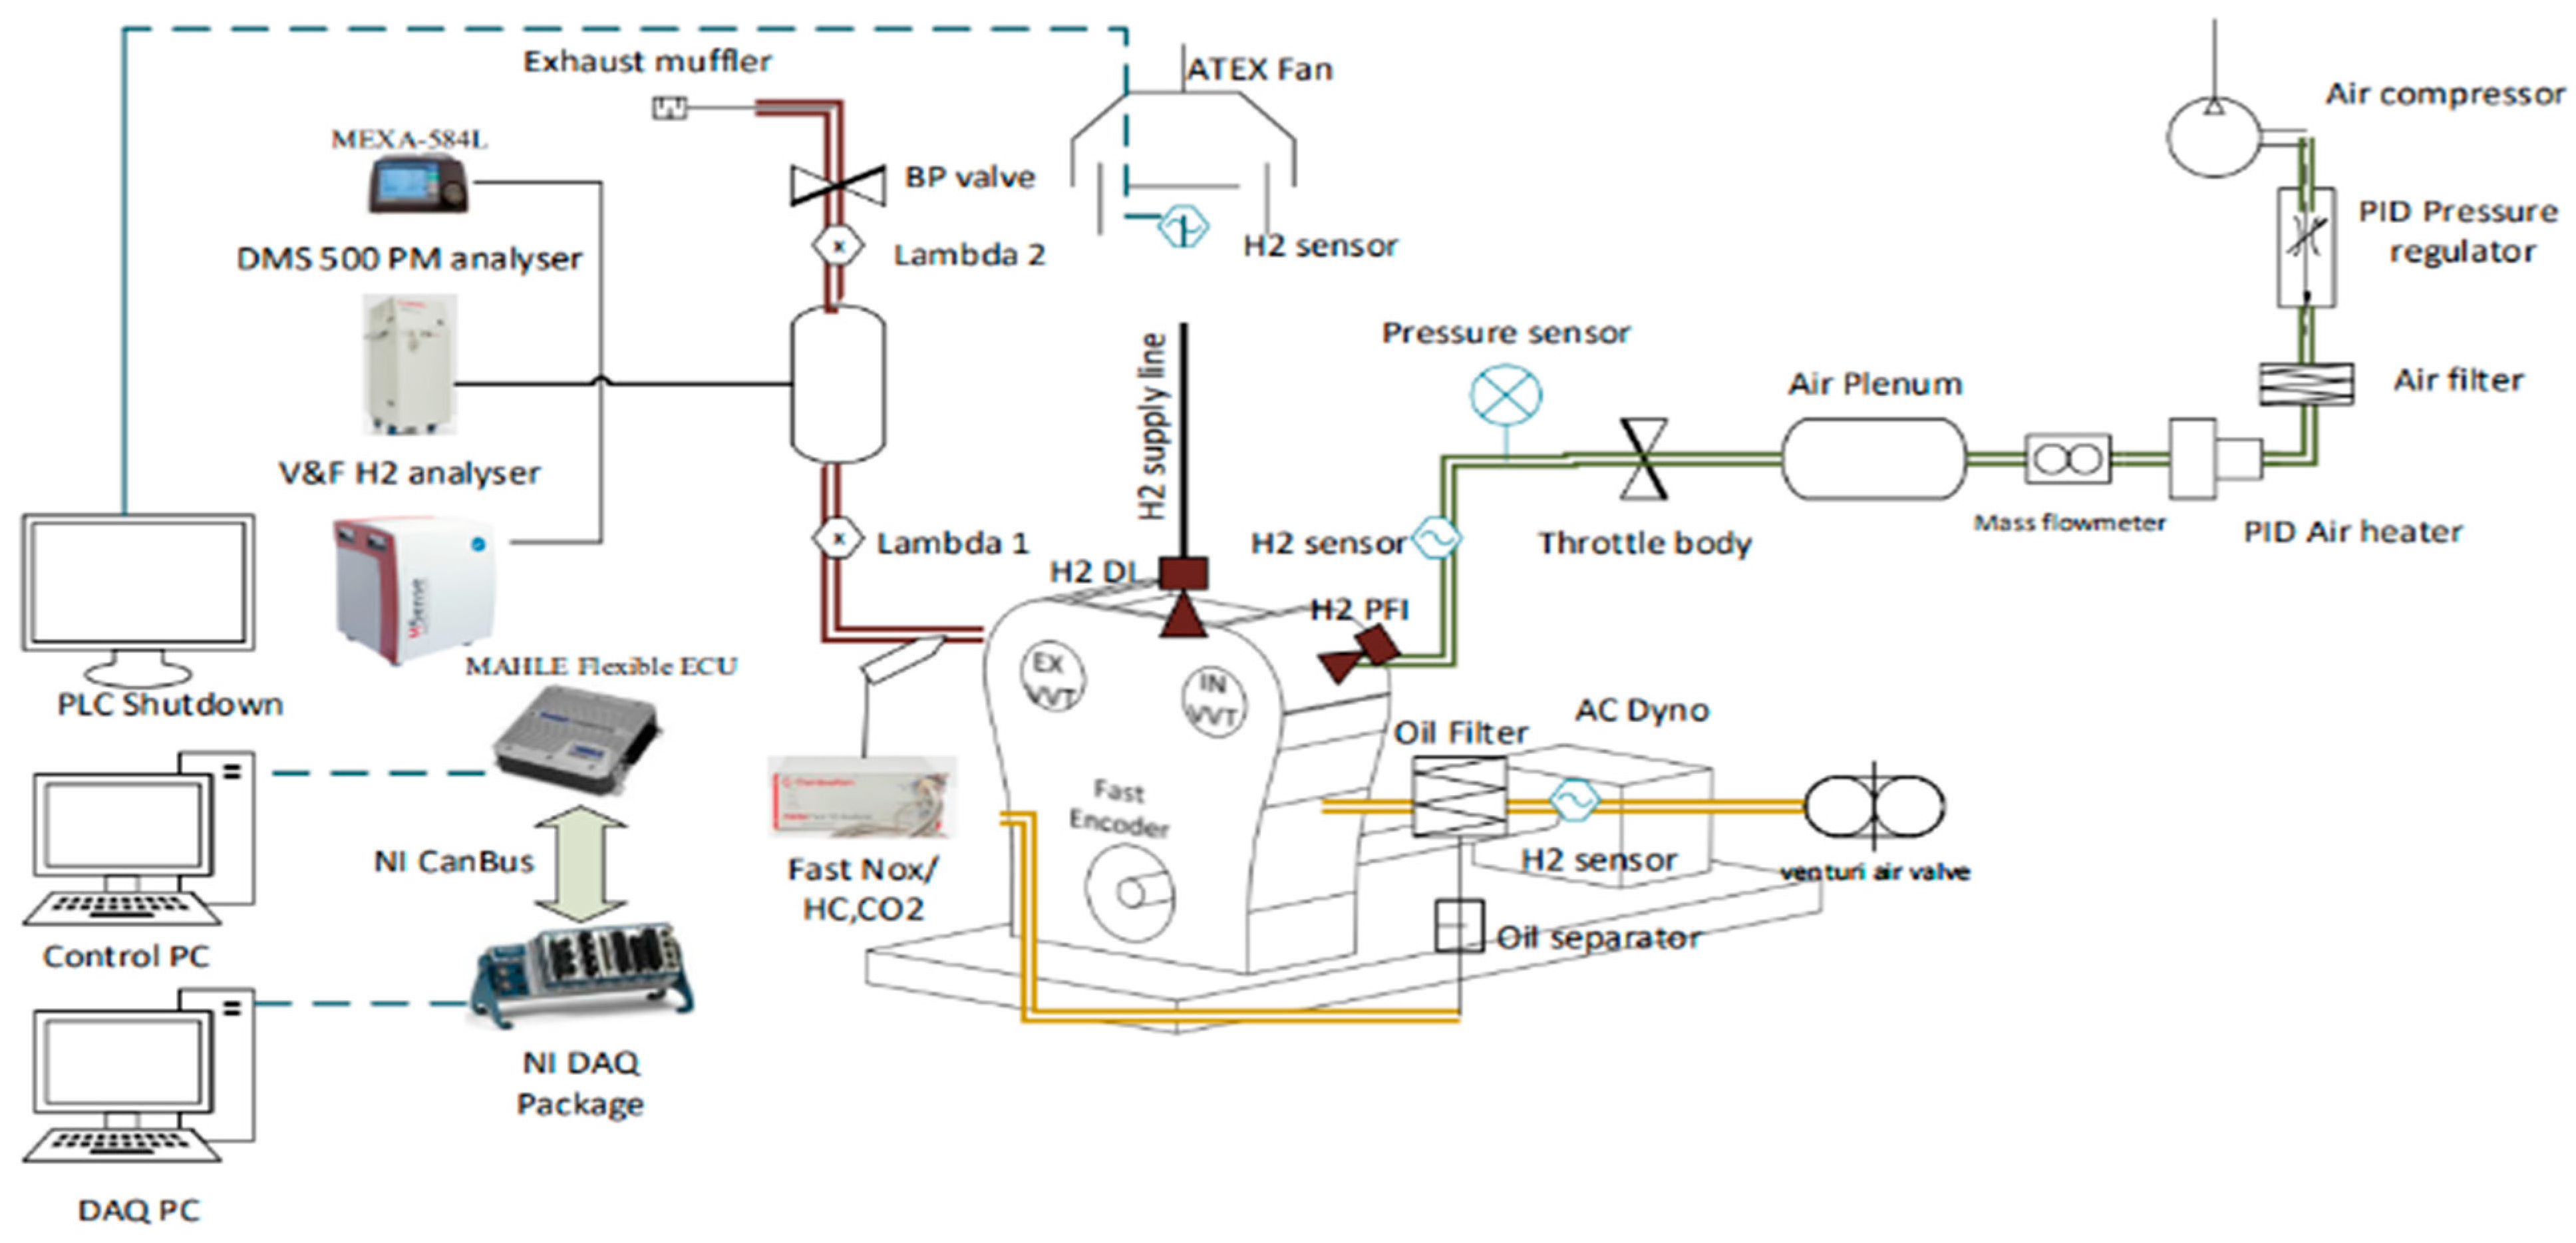
In this specific setup, incorporating a pressure hydrogen line into two separate injection positions while maintaining high safety standards posed a significant challenge. One of the most pressing issues with hydrogen lies in establishing a new risk assessment for the hydrogen supply line to determine the location of the hydrogen source. Unlike automotive and transportation applications, hydrogen use in the test cell requires a permanent and isolated location for safely storing hydrogen bottles without causing any leakage Risk. The test cell needed to address potential hazards, so the solution involved securely isolating and ventilating the bottles outside the test cell. To accomplish this, the bottles were placed in a partially enclosed space surrounded by fire shields without a ceiling. It was also beneficial to position all supply line accessories outside the test cell, including pressure regulators, sensors, flow meters, and shutdown valves. This practice reduced the risk of leaks within the test cell by limiting the number of connections. An additional ATEx ventilation system with a flexible hood was installed in the test cell to optimise air recirculation. The engine was equipped with a hydrogen sensor connected to an automated shutdown Programmable Logic Controller (PLC) system to respond automatically to hydrogen levels exceeding 3% v/v by interrupting the hydrogen supply line and purging it with nitrogen. The automated shutdown PLC system also activates in the event of backfire detection during Port Fuel Injection (PFI) usage and in the event of hydrogen leakage into the crankcase, triggering the crankcase ventilation system to prevent hydrogen accumulation. Implementing an automated PLC system, along with a double vacuum tubing system, addressed the issue of potential hydrogen pipeline leaks. The double vacuum tube connected to the pipeline ensures that any leaked hydrogen remains confined within the outer tube and is subsequently purged out by nitrogen. A pressure sensor on the double vacuum tube is linked to the PLC to activate the nitrogen purging system.
2.1. Engine Setup
In this study, a spark ignition (SI) single-cylinder engine provided by MAHLE Powertrains/(Northampton, UK) was utilised to evaluate the performance and emissions of hydrogen in two different injection configurations: central direct injection and port fuel injection. The engine is equipped with a MAHLE adaptable electronic control unit (ECU), which facilitates a seamless transition between hydrogen and gasoline operation on a single engine, requiring minimal adjustments to the control system. The engine utilised DI-CHG10 injectors manufactured by Phinia for both DI and PFI, enabling hydrogen injection ranging from 2 to 10 bar in the PFI system and 10 to 40 bar in the DI system. The crankcase ventilation system has been altered to address potential hydrogen-related risks. This modification involves implementing a forced ventilation system, which includes a hydrogen sensor in the feedback loop. If the hydrogen concentration in the crankcase exceeds 4%
v/
v, the system will automatically reduce the hydrogen supply, as per
Figure 1. The upgraded system has a built-in mechanism that keeps track of the piston rings’ condition. It features fully adjustable valve timing for both the intake and exhaust cams, allowing the freedom to pick the ideal overlap configuration for each injection system. Moreover, the engine control unit (ECU) permits the injection timing and pressure to be tweaked, facilitating the modification of the beginning or end of the injection process as required. The engine has a self-sufficient boosting system that can generate a maximum boost pressure of 4 bar and an externally controlled heater with a PID regulator that accurately controls the intake pressure and temperature. The main engine specifications are in
Table 1.
One of the primary obstacles that requires clarification pertains to the operational limitations of the engine. The single-cylinder engine can operate up to 5000 rpm and attain a maximum peak in-cylinder pressure of 120 bar. However, this restricts its operation at exceedingly high loads, with a pressure rise rate of six bars per crank degree, in order to prevent damage to the timing chain. Additionally, the maximum exhaust temperature is 750 degrees Celsius, and the hydrogen slip limit must not exceed 6000 parts per million (ppm) to prevent a hydrogen fire in the exhaust line, which the heated lambda sensors in the line could cause.
2.2. Fuel System and Proprieties
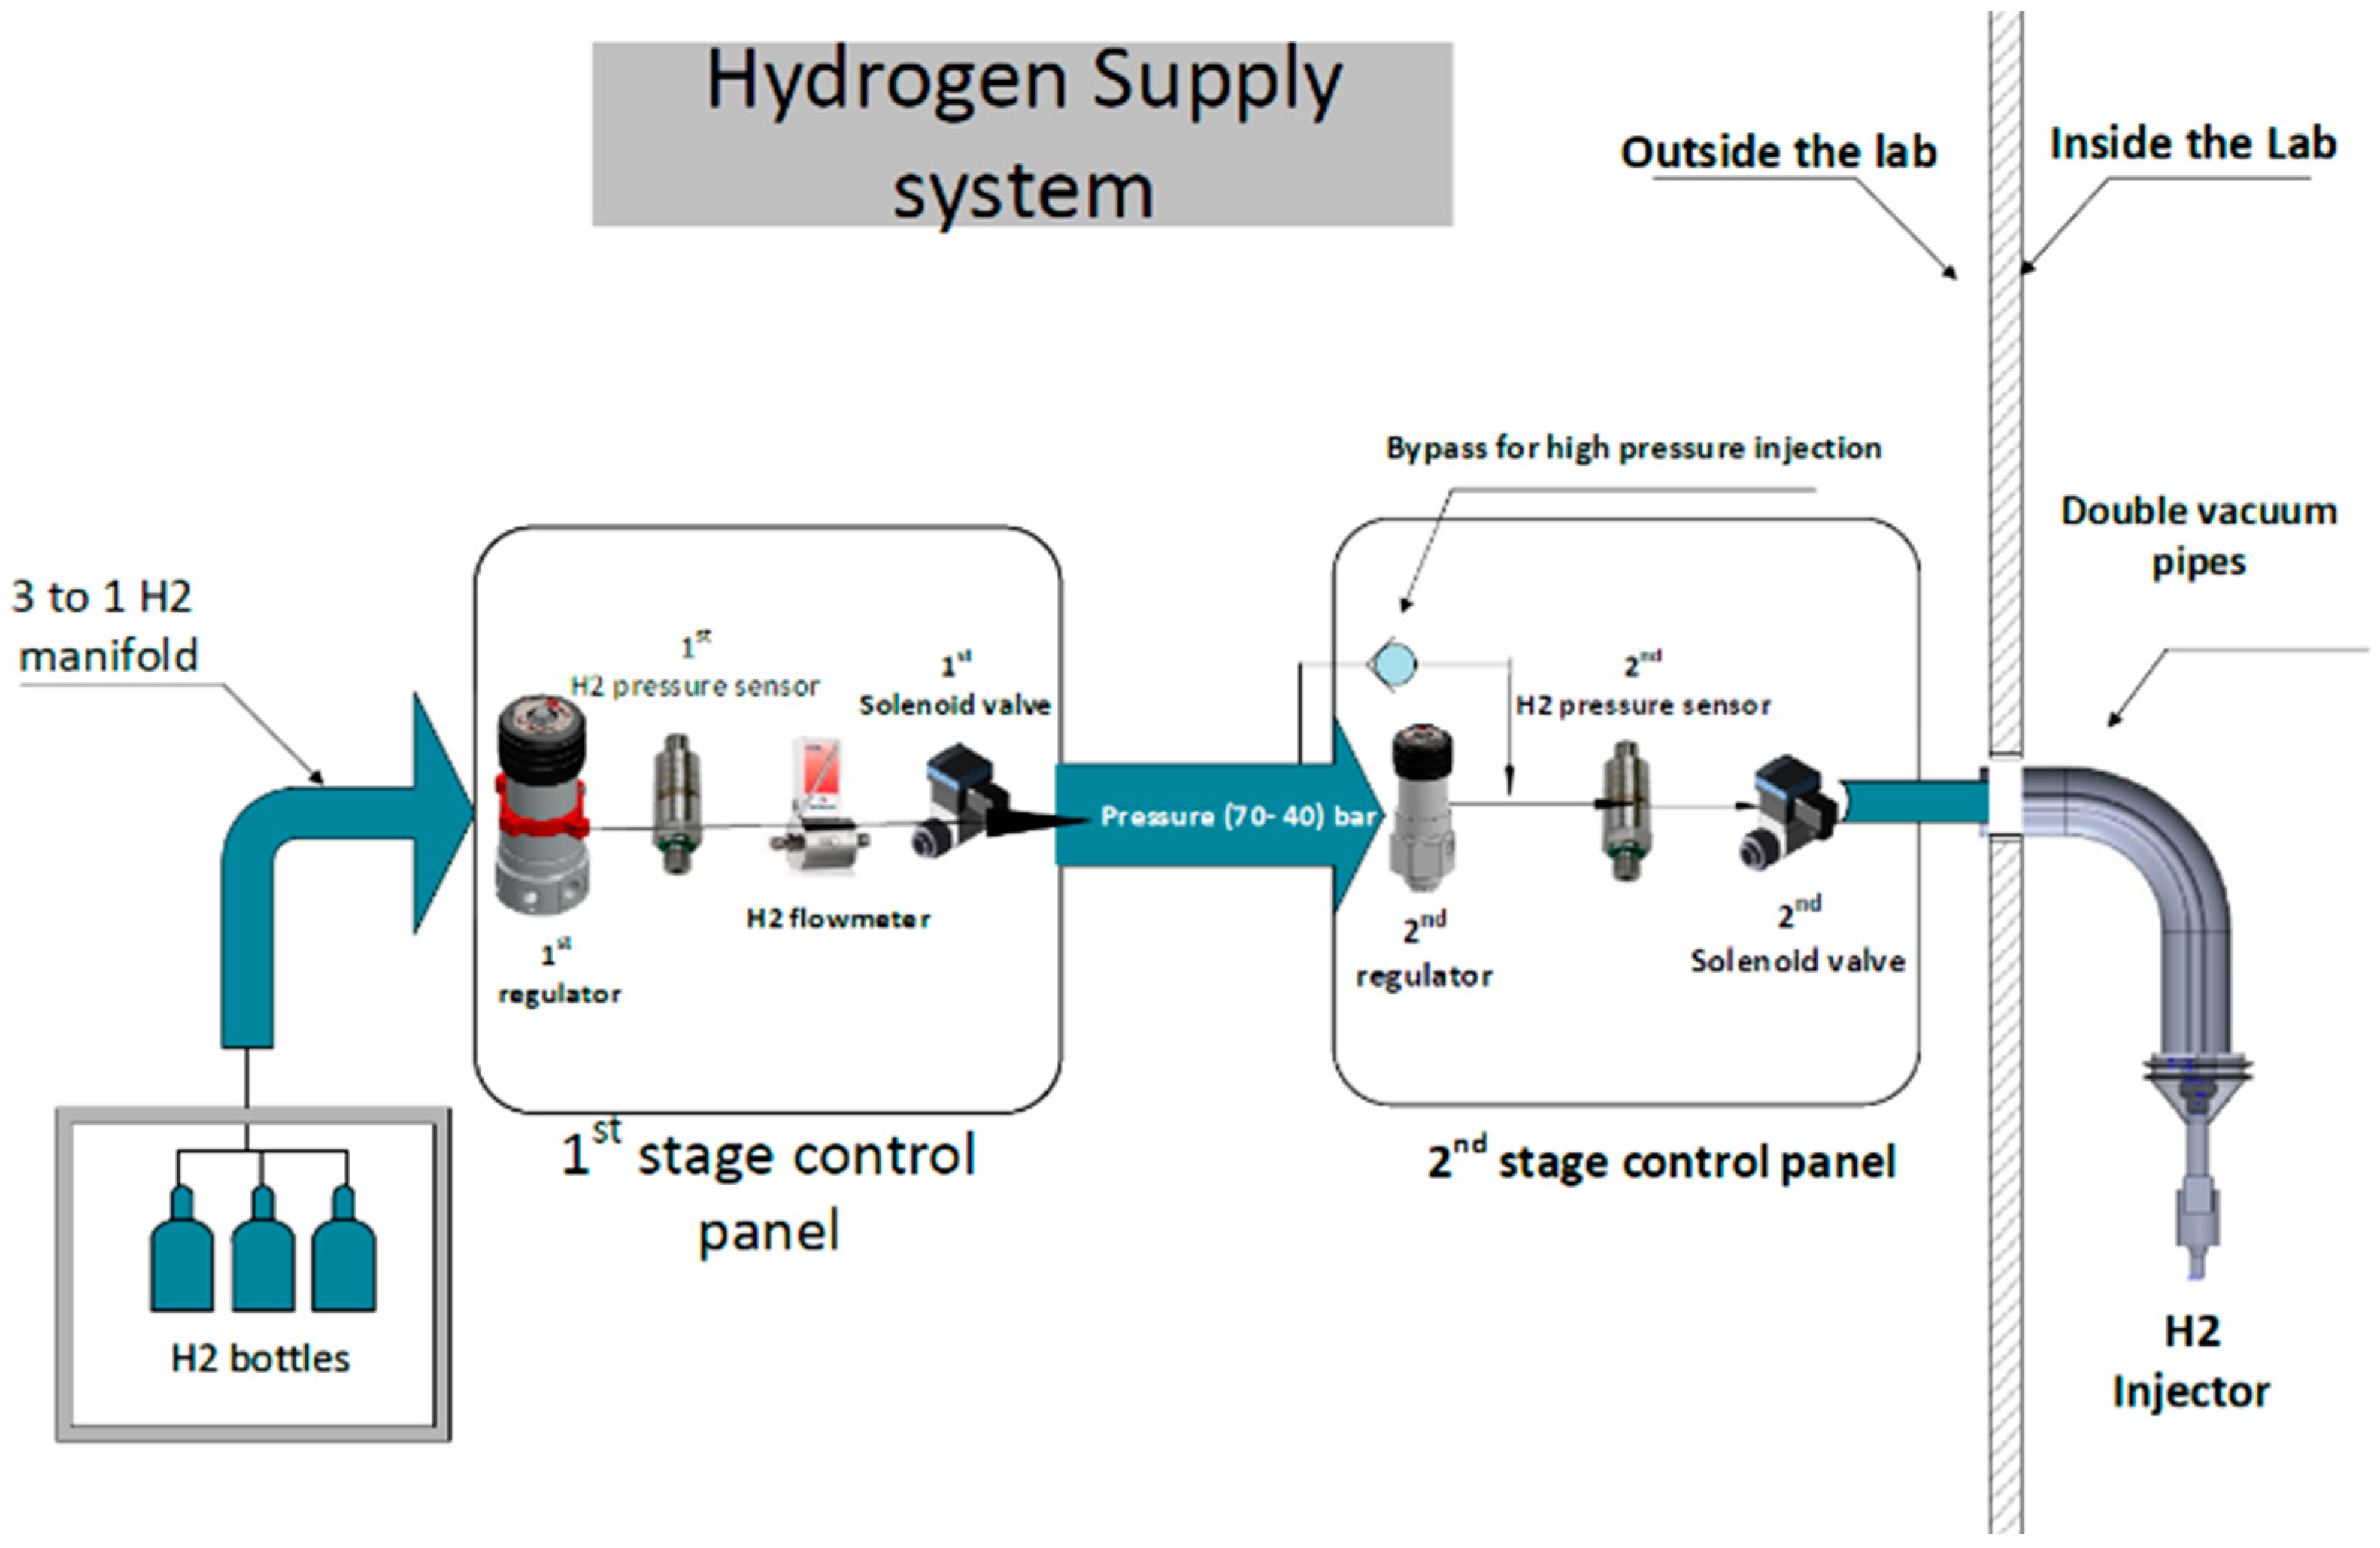
The hydrogen supply system starts at the hydrogen containers in the isolation chamber. It then passes through the initial control panel, which adjusts the hydrogen pressure from the bottle’s internal pressure to a standardised 40 bar. After that, it passes through a pressure sensor and a safety solenoid valve before reaching the hydrogen flowmeter. Placing the hydrogen flowmeter downstream of the initial stage mainly reduces any potential impact on the final pressure delivered to the injector caused by pressure drops induced by the flowmeter. In the next stage, the regulator lowers the pressure within the 2 to 30 bar range, improving accuracy. The second panel is equipped with an extra pressure sensor and a safety solenoid valve, which isolate the line and reduce hydrogen slips if there is hydrogen leakage. Upon entering the test cell, the hydrogen line is enclosed within an additional tube that maintains a vacuum to prevent any hydrogen leakage to the external environment. The entire tube includes a pressure sensor that activates an automatic nitrogen purge to ensure complete isolation of the hydrogen line. This setup is shown in
Figure 2.
2.3. Emission Analysers
An ultra-fast response NO
x analyser was used for these experiments (Cambustion CLD50 fast NO and NO
2 analyser). This instrument differs from standard analysers because it had a response time of approximately five milliseconds in the configuration deployed in these experiments and sensitivity to tens of parts per billion. It is, therefore, ideally suited for measuring transient NO and NO
2 in the exhaust of H
2 combustion engines where very low NO
x levels can be achieved but where transients between operating conditions can cause sudden high “spikes” of NO
x [
35].
Nitric oxide (NO) was measured with a chemiluminescence detector (CLD), and nitrogen dioxide (NO2) was measured with laser-induced fluorescence (LIF). This direct method of NO2 measurement differs from conventional NOx analysers, where the sample is usually passed through a converter, and the difference between direct NO and the resulting total NOx via the converter is calculated to assume the NO2, a much slower process.
The ultra-fast response time was particularly appropriate for the measurement of cycle-resolved data, where such measurement would not have been possible with conventional slower analysers. Finally, the exhaust pipe is connected to the V&F emission analyser for hydrogen slip measurements.
Table A1 in the appendix shows the full details of the equipment used, including the measurement range and error percentage.
2.4. DAQ System
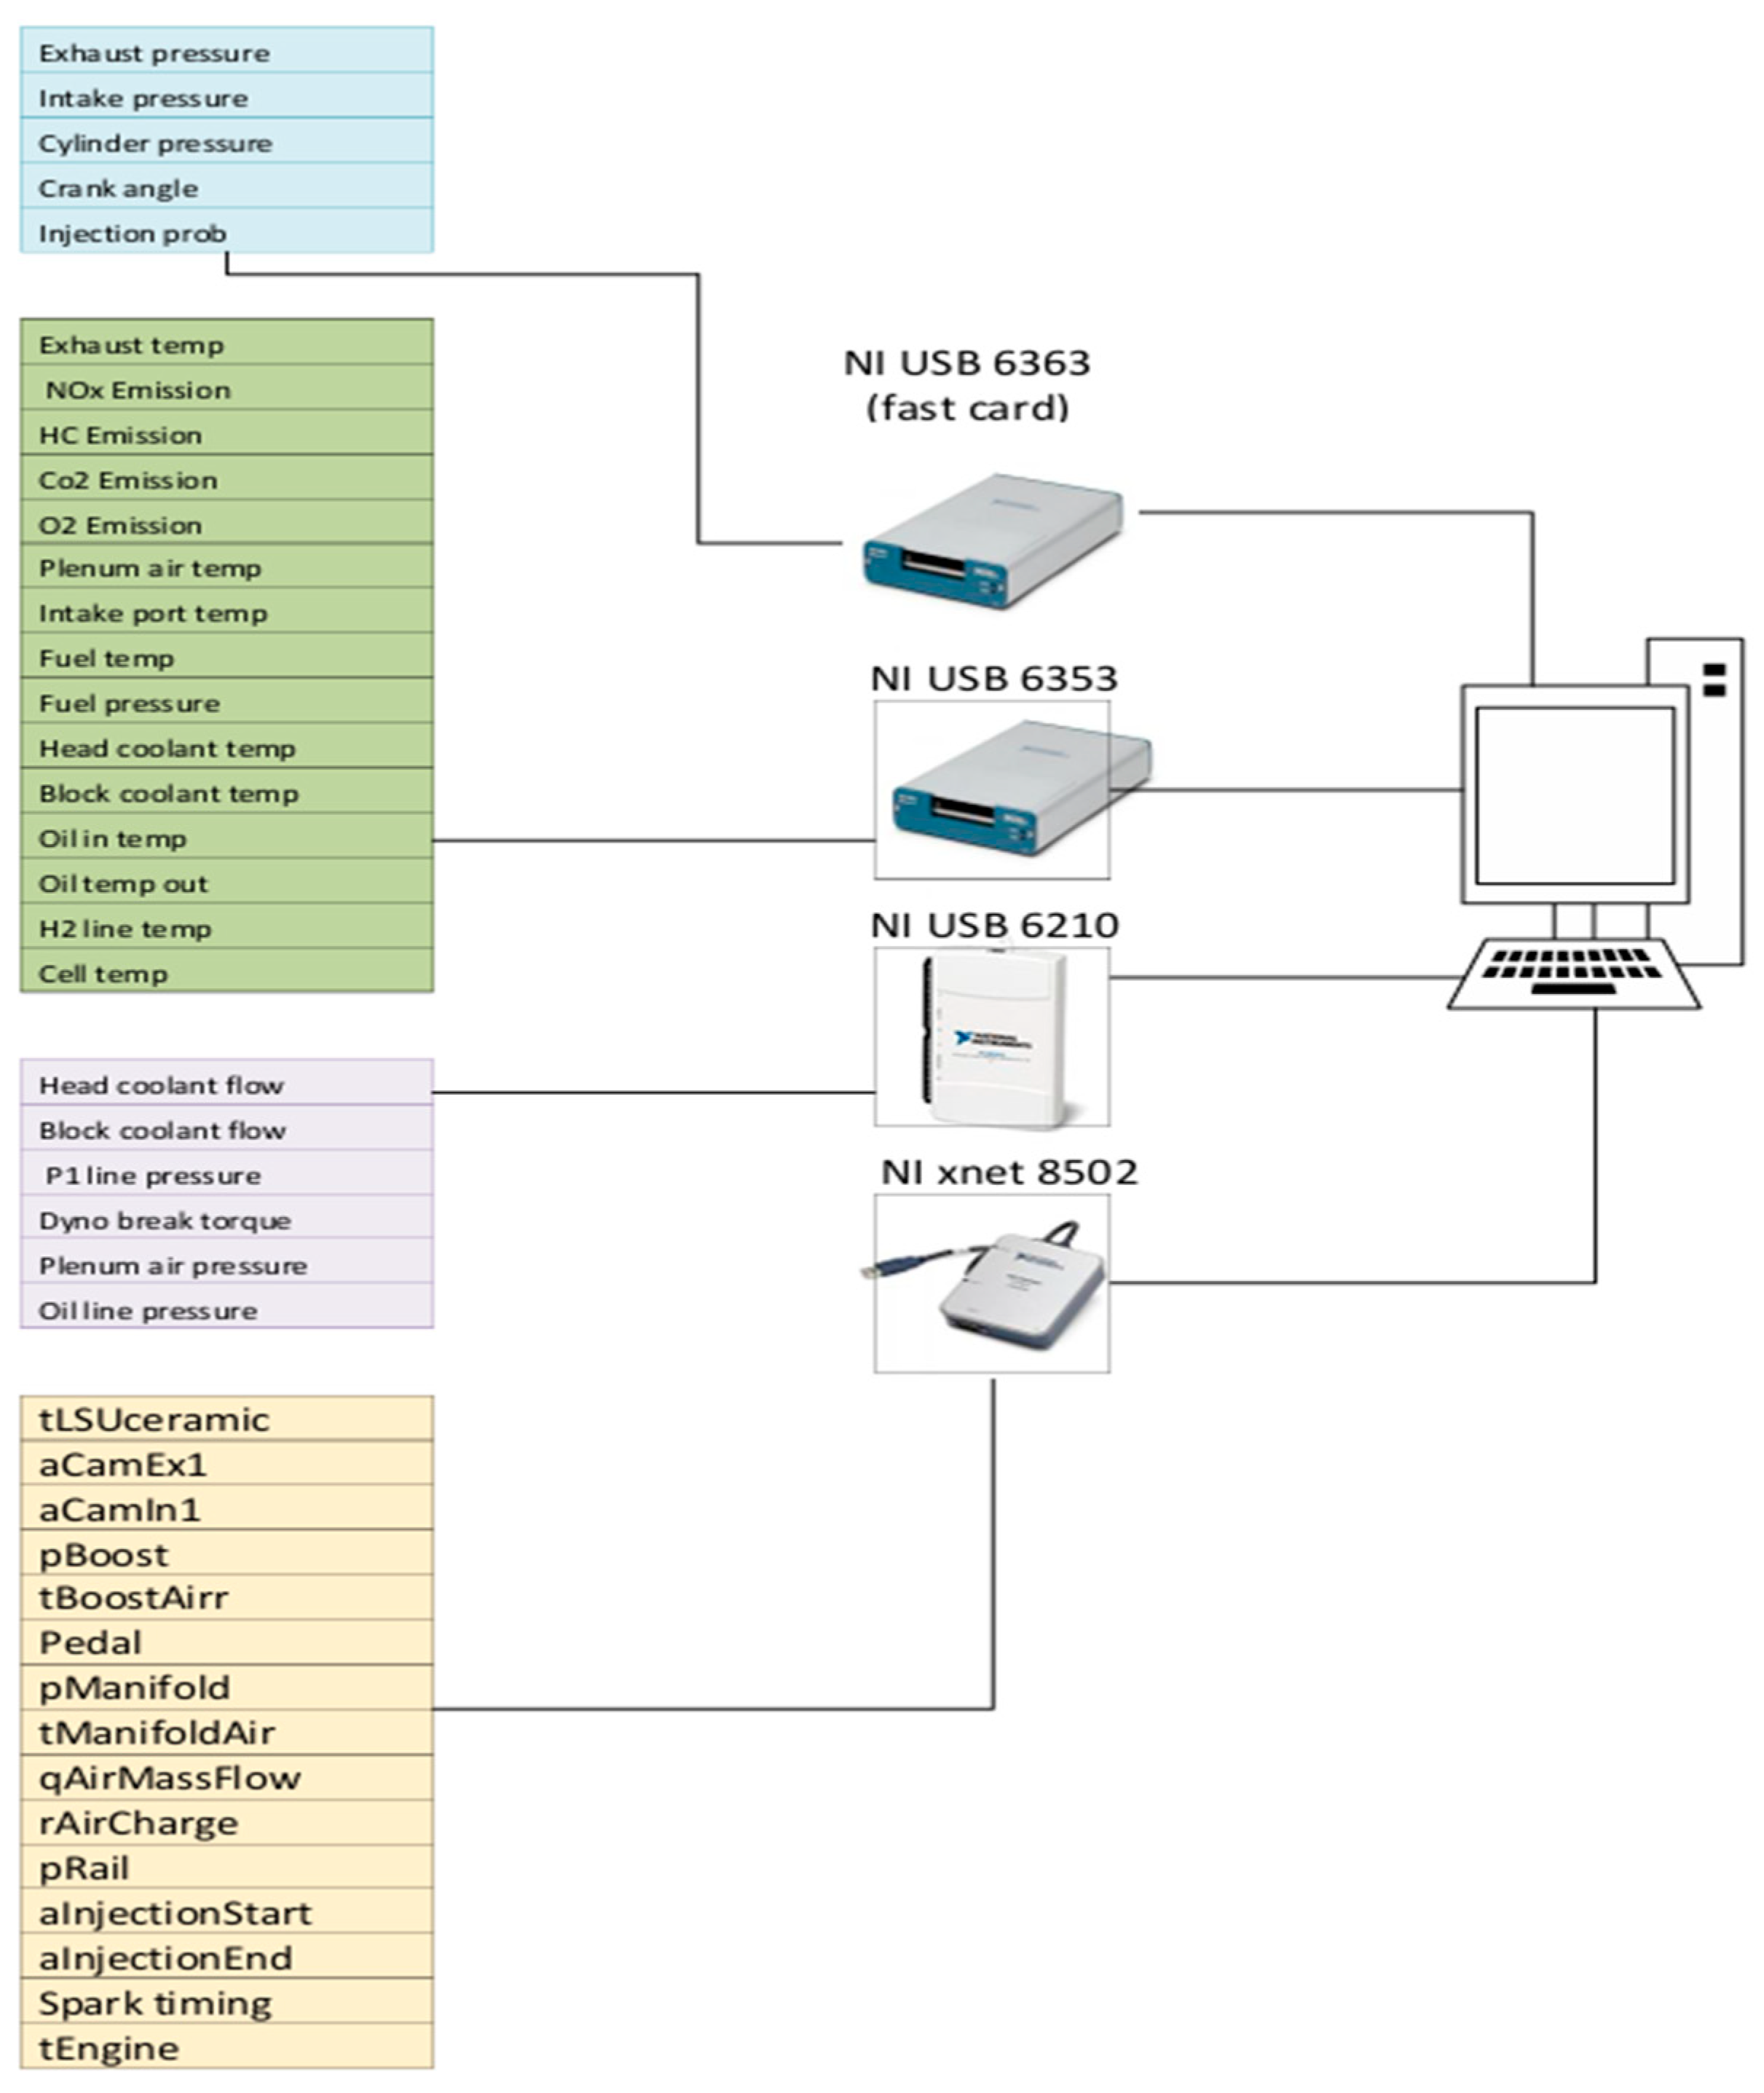
The number of the input channels is 138 signals from the test cell. However, the sampling rate required for each sensor depends on the sensor’s priority and the reading’s value. In-cylinder, intake, and exhaust pressure sensors are required to provide a sample in the crank angle domain compared to other sensors operating in the regular time domain. Based on that, the NI cards were a hybrid selection between fast and standard USB NI cards that can auto synchronise in the NI-based combustion analyser Valieteck. Also, the NI to canbus communication card transfers signals from the ECU, as shown in
Figure 3.
Cyclic variability in an internal combustion engine causes periodic torque production and emissions fluctuations. To assess the stability of combustion, the coefficient of variation of indicated mean effective pressure (COV
IMEP) is often used. Although the cyclic changes cannot be eliminated, they can be regulated to maintain steady engine performance using Equation (1).
4. Results and Discussion
The results are presented in two stages: first, we present the results associated with PFI and GDI fuelling during lambda sweeps, and second, the study evaluates NOx emissions within the average crank angle domain to demonstrate the average levels of NOx emissions observed across 300 cycles, including analysing NOx emissions using in-cylinder data in the time domain enables the observation of fluctuations in NOx levels over a specific period.
4.1. Impact of Lambda on Average NOx Emissions
This section presents a study exploring the performance and NO
x emission characteristics of H
2 ICE compared to baseline gasoline engines across a broad range of relative AFRs. All operation points at different relative AFRs were fixed at 50% burn of 8 degrees ATDCf to maintain MBT. With cam timing fixed for each fuel, the scavenging effect from the overlap was bypassed.
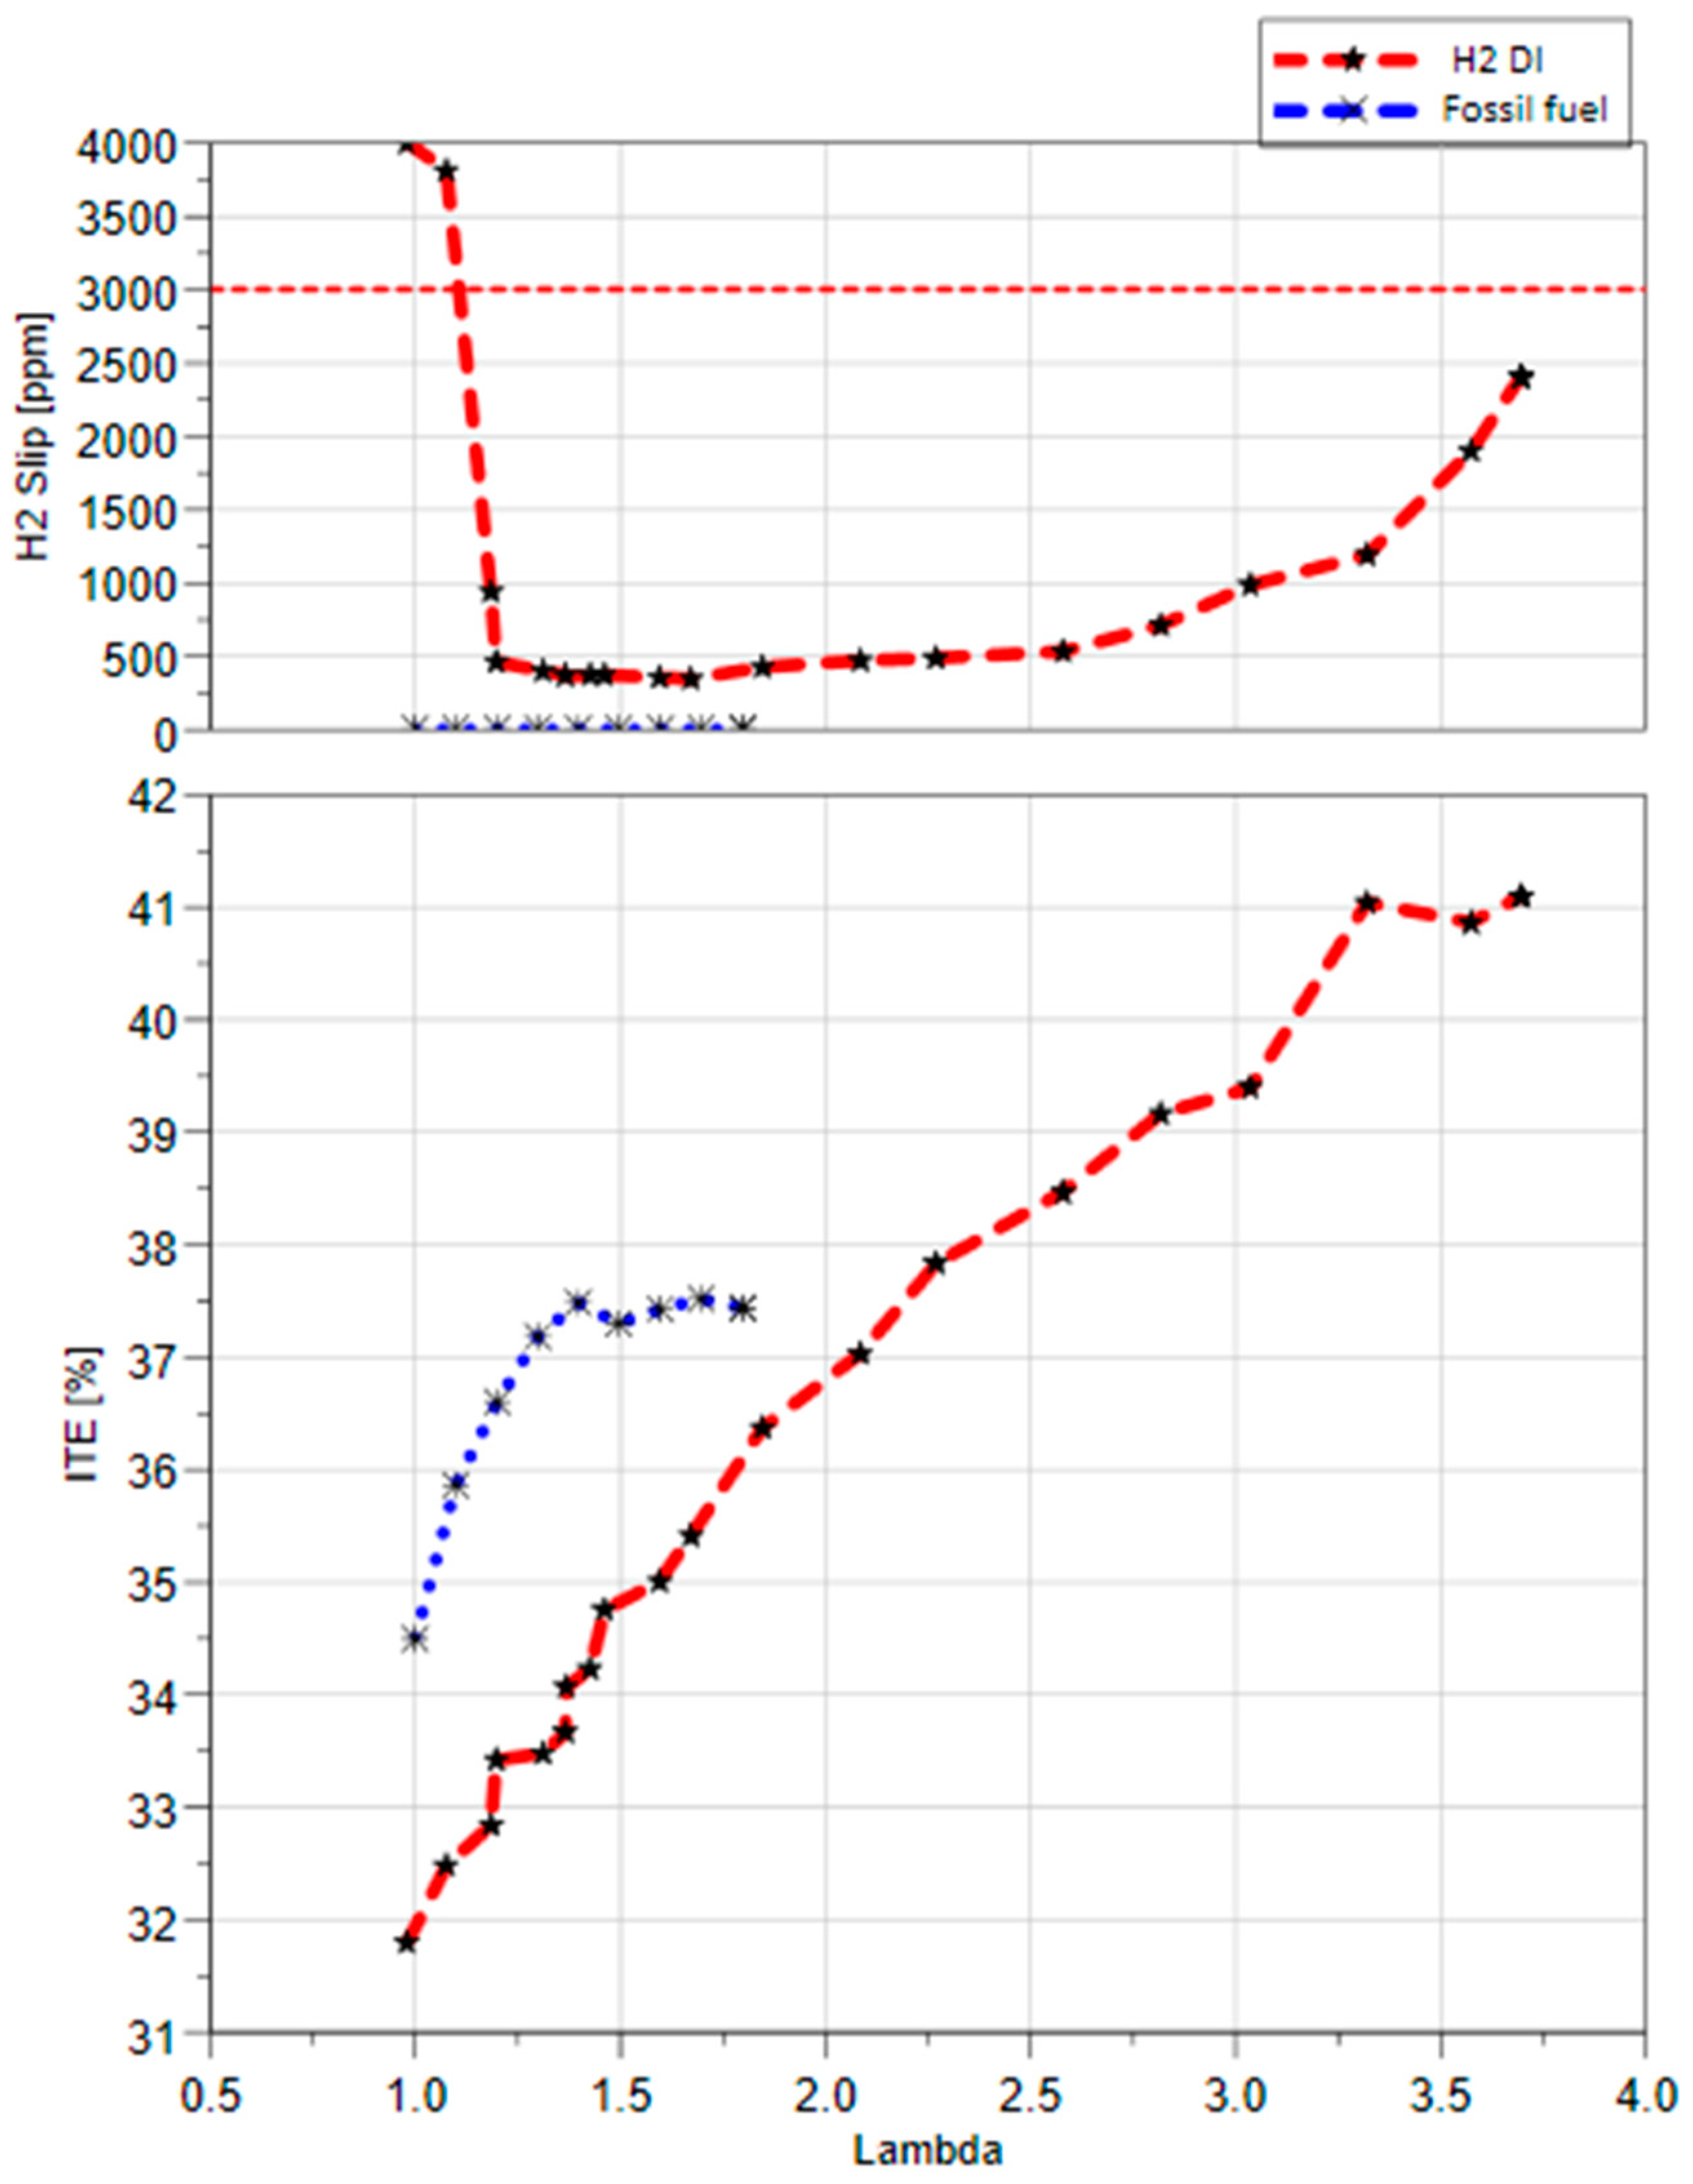
Figure 4 shows the Indicated Thermal Efficiency (ITE) of central DI H2 and gasoline fuel over various lambda values up to the limits of the COV
IMEP. The results demonstrate the vast relative λ map of hydrogen compared with the narrow range of gasoline operations. Hydrogen DI operates from stoichiometric combustion to a maximum relative AFR of 3.8, with COV
IMEP below 1.6%. On the other hand, gasoline DI managed to operate up to a lambda of 1.6 at 2% COV and a maximum lambda of 1.8 at 4.2% COV. The ITE results reveal that hydrogen has a higher ITE of 41% compared with gasoline’s 37.4% at the leanest operating points. The lower ITE of hydrogen at stoichiometric operations is due to a higher hydrogen slip from the exhaust system. Also, the burn characteristics of the hydrogen fuel as the hydrogen flams speed are much higher than the gasoline, with results in a massive pressure rise rate that forces the operator to retard the spark timing up to 11 CAD ATDCf, which results in a sudden drop of the ITE, as pre previous study [
36].
It should be noted that the engine was designed and built for gasoline fuel and adopted hydrogen without any modifications. Also, it was observed that the value of the H2 slip increased with leaner combustions. However, the H2 slip remained under the threshold.
The data in
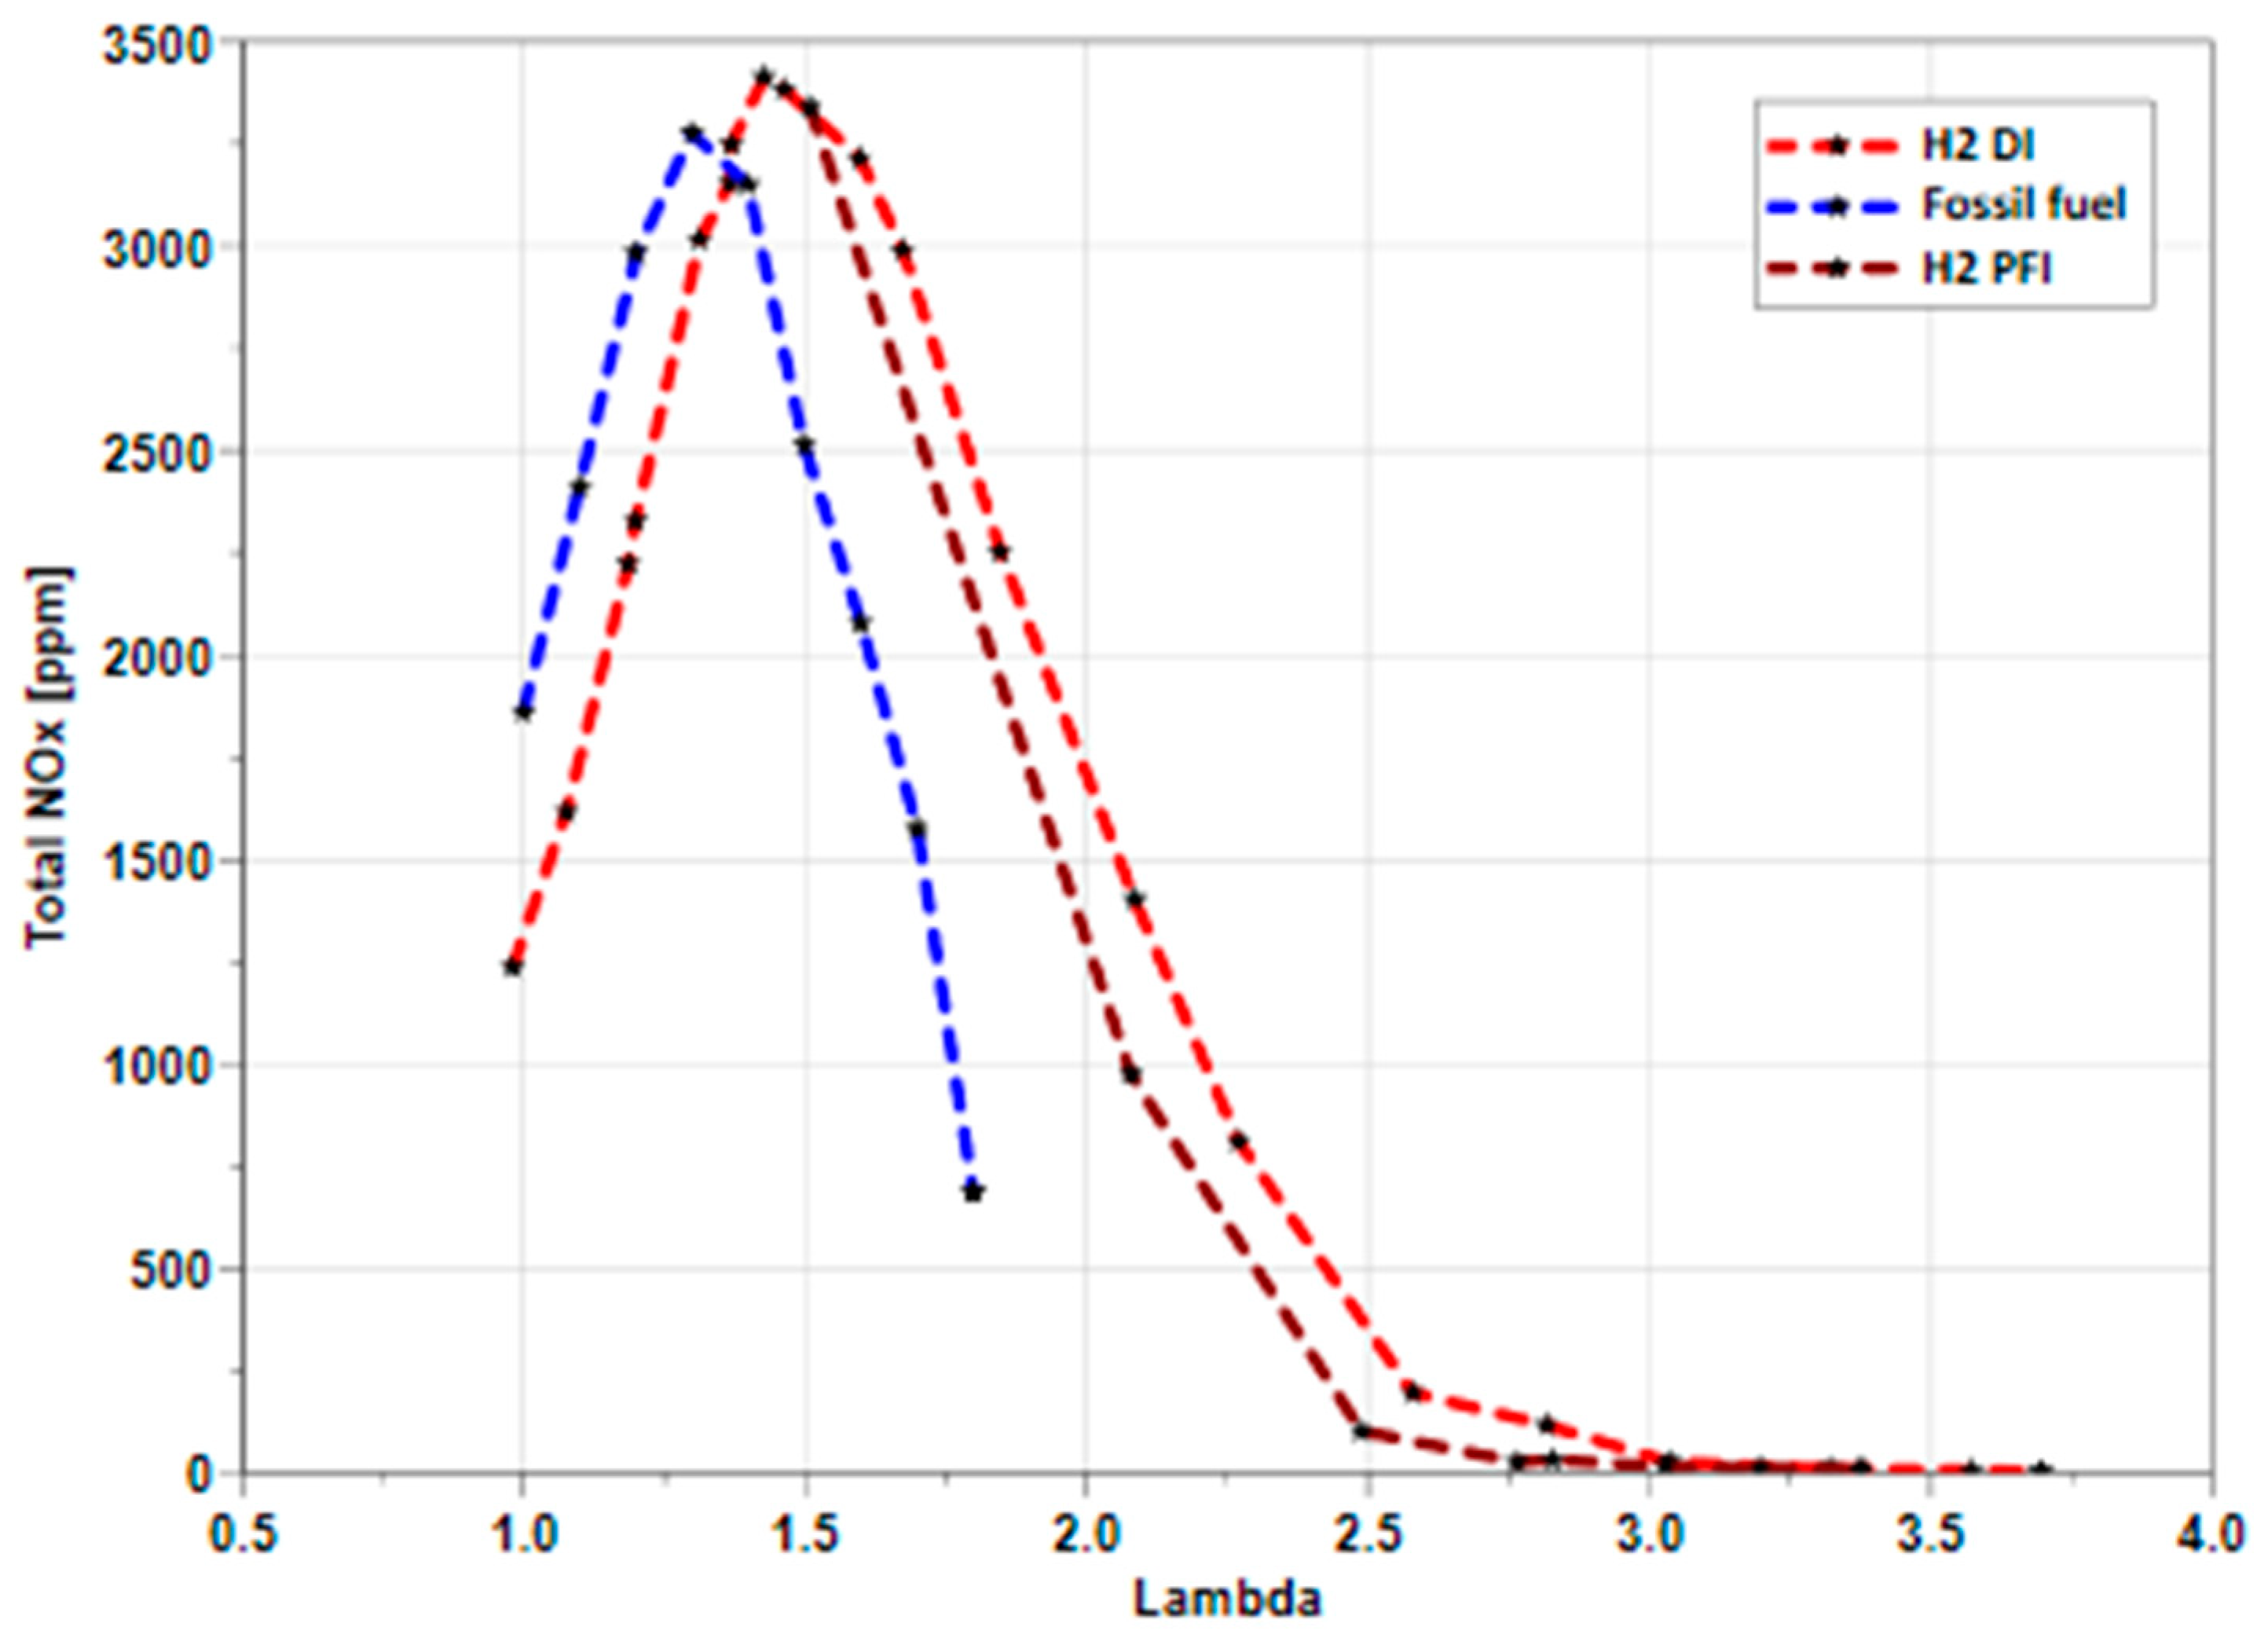
Figure 5 depict the mean NO
x emission captured from the fast NO
x emission analyser in the exhaust port while varying the relative λ for hydrogen DI and PFI compared to gasoline DI. The key finding indicates that hydrogen results in a negligible NO
x emission above lambda 3, with NO
x levels dropping below 50 ppm from lambda 2.75. As a result, an exponential increase in NO
x emission is observed when lambda reduces from 2.5 to 1.4 with peak NO
x emissions captured.
The graph displays a slightly lower NOx emission for the hydrogen PFI system compared with the hydrogen DI system due to the complete burn and the higher thermal efficiency of the DI system, which results in a higher in-cylinder gas temperature that causes higher NOx at the same load. However, at lambda 2.75, the difference is almost negligible, and at lambda 3, the NOx emissions fall below 10 ppm for both hydrogen injection systems. Additionally, the NOx emissions for the PFI system match those of the DI at a lambda of 1.5 where the backfire starts appearing in the intake line for the PFI.
Finally, a comparison of NOx emissions between the direct injection systems of hydrogen and gasoline reveals that at stoichiometric combustion operations, the NOx emission is lower in hydrogen than gasoline by almost 41% due to H2 slip at lambda 1, which results in less thermal efficiency and lower peak cylinder temperature. The study also observed that the lambda point of the peak NOx emissions of each fuel was different, with gasoline at lambda 1.3 and hydrogen at lambda 1.38, influenced by the fuel properties that directly affect the NOx formation mechanisms.
This section aimed to identify the NOx emissions characteristics and the ITE of both hydrogen and gasoline engines. The data presented indicate the average NOx emissions at each testing point.
4.2. Analysis of NOx Emissions in the Crank Angle Domain
This section presents the NOx emission data and in-cylinder pressure in the crank angle domain to illustrate the NOx emission characteristics and distribution. Additionally, the study breaks down the NOx emissions to analyse the distribution of NO and NO2 separately over the crank angle domain. Furthermore, the study directly compares the NOx emission and in-cylinder pressure under very lean operation conditions by comparing the hydrogen DI and PFI systems. The aim is to provide an in-depth understanding of NOx emission behaviour and distribution in the crank angle domain, which could help improve engine performance and develop emission control strategies. The presented results are the corrected results with the delay function as we built on the time delay function that consists of static delay, which represents the T90 response time of the equipment and the 1.2 m heated line length, plus the dynamic delay, which is calculated on the basis of the exhaust pressure and flowrate. This correlation shifts the start of the Nox generation with the exhaust valve opening to produce consistent NOx measurements in the crank domain.
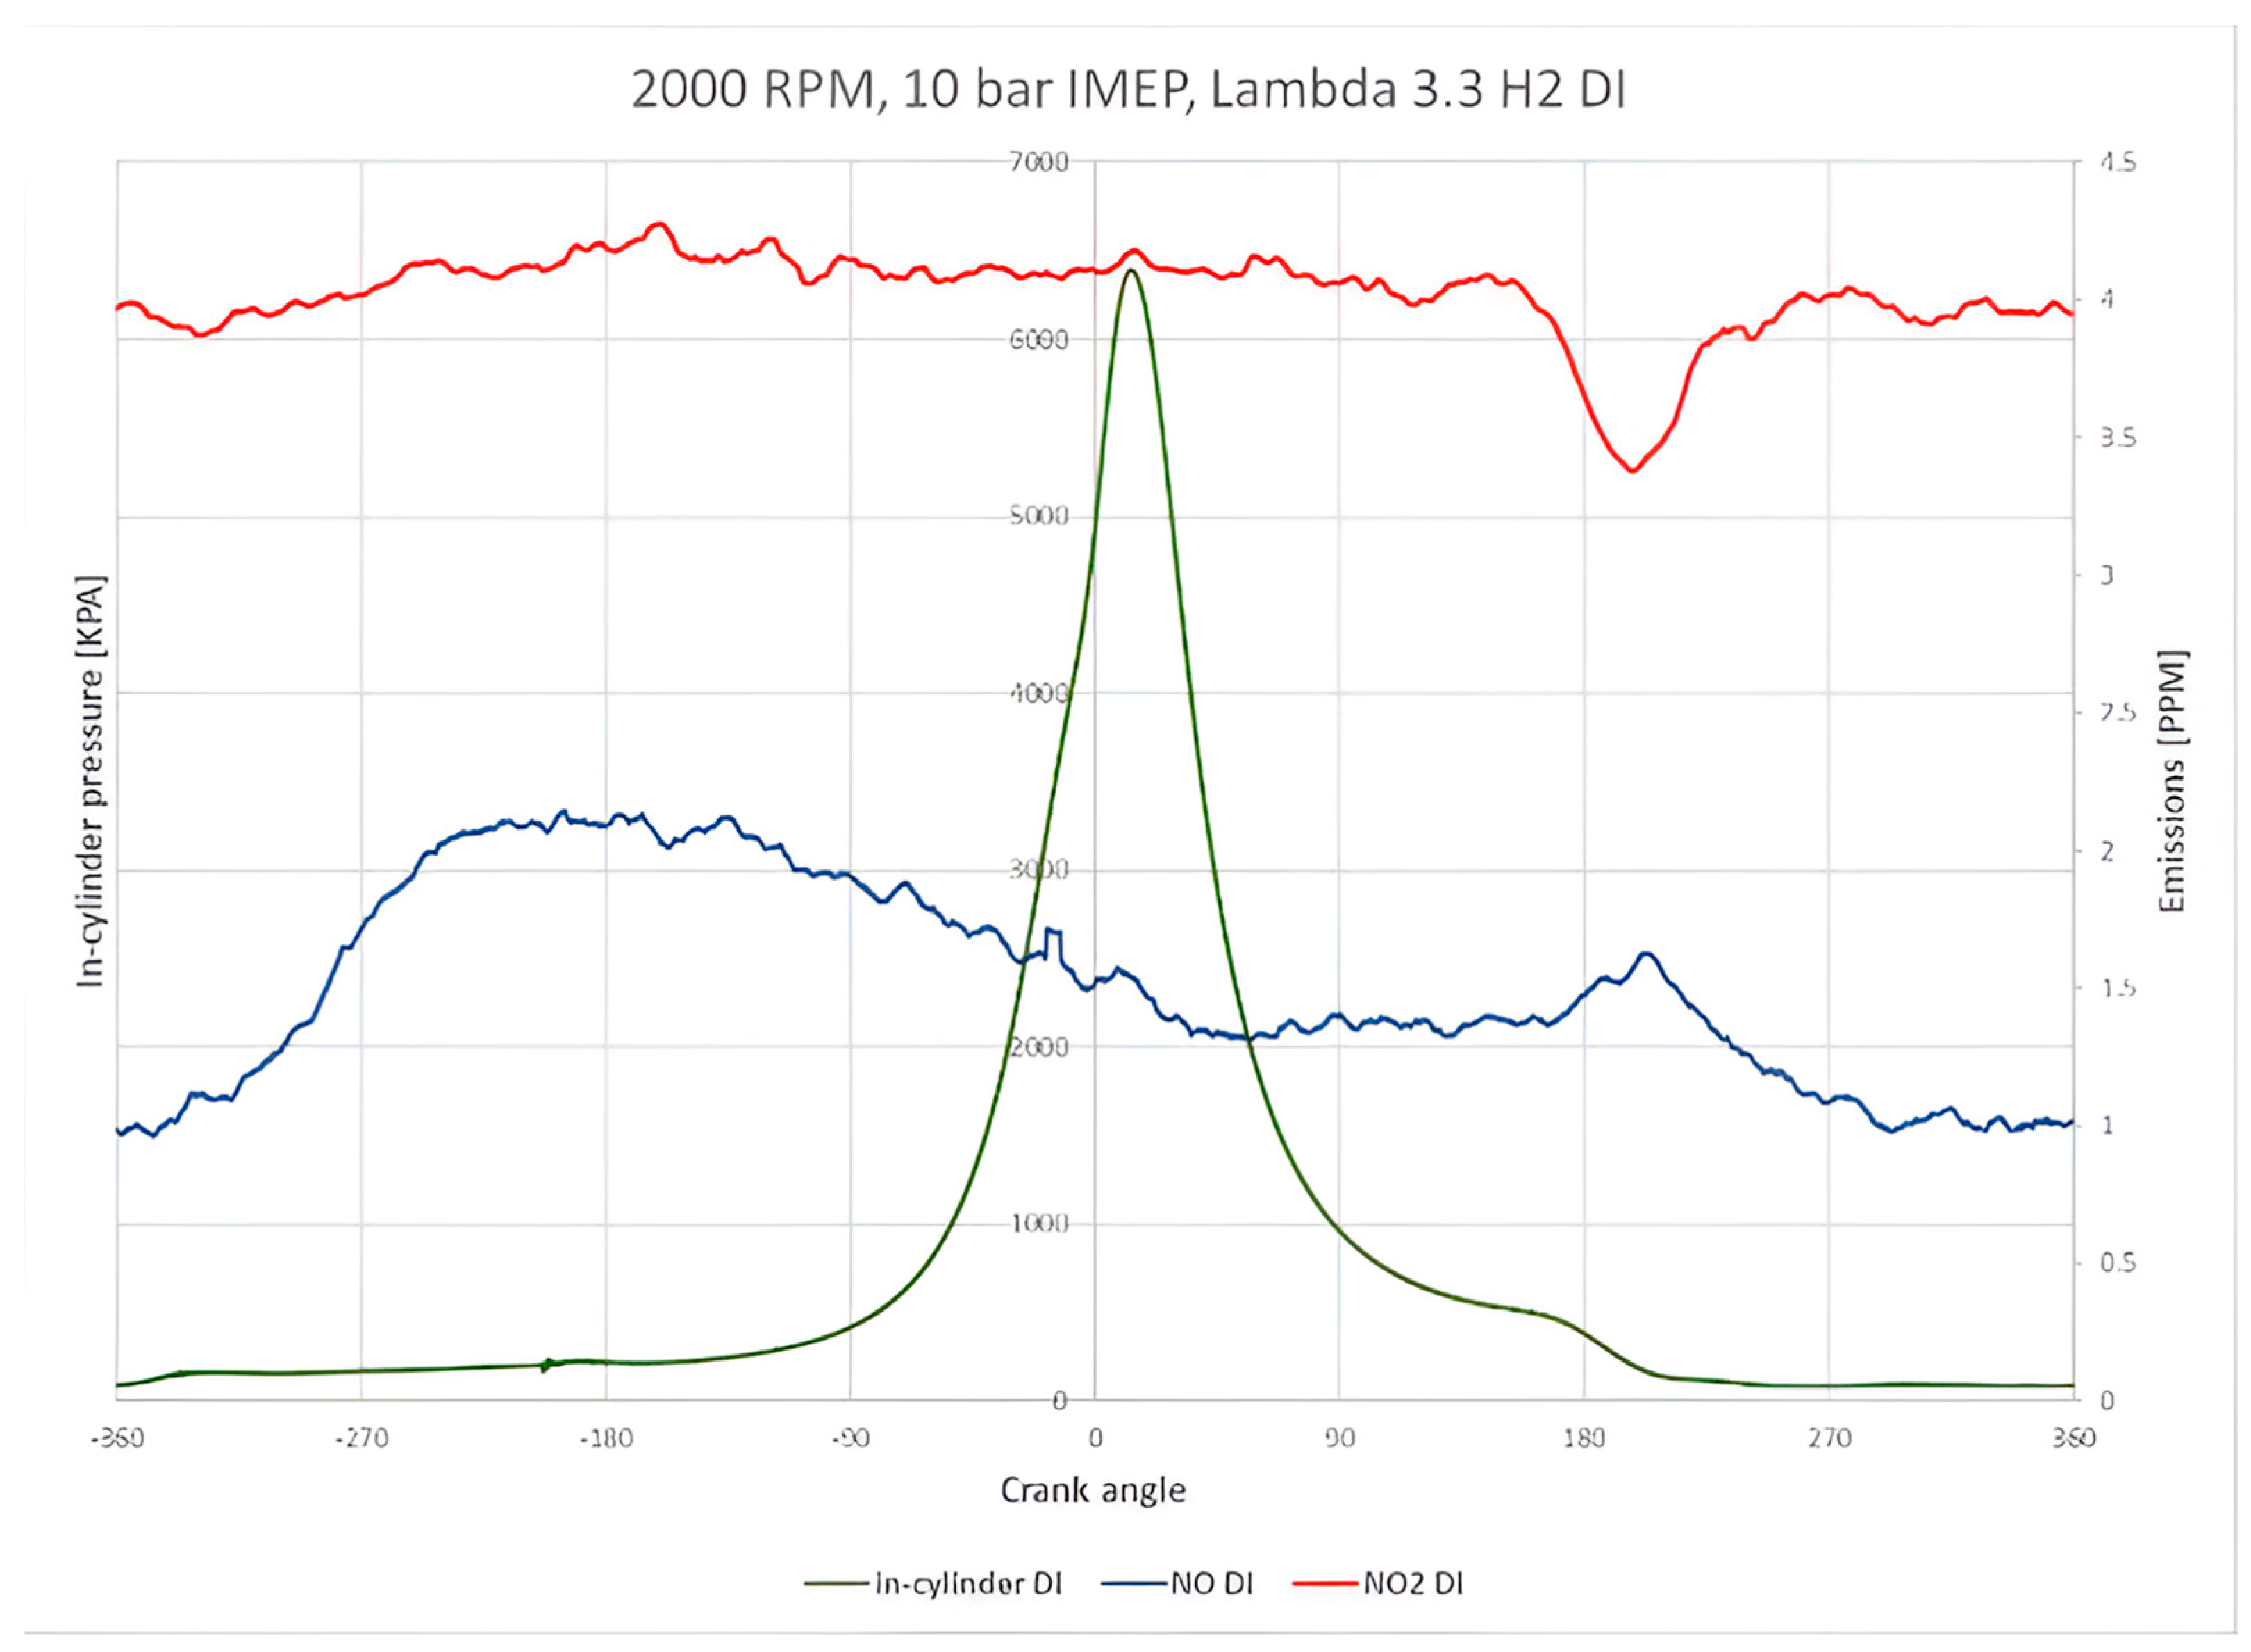
Figure 6 shows the NO and NO
2 emissions from the hydrogen DI system with a very lean combustion of lambda 3.3. The graph illustrates the distribution of NO and NO
2 in the crank angle domain and the averaged in-cylinder pressure over 300 cycles, representing the ensembled average. The results indicate that the NO
2 levels are approximately 4 particles per million (ppm). Meanwhile, NO emissions are below 2 ppm. The effect of the exhaust opening event is visible at around 170 degrees after the firing top dead centre (ATDCf), corresponding to the exhaust valve opening timing. At this operating point, the NO
2 emissions are higher than NO due to the higher error gain of NO
2. However, both NO and NO
2 values are within the measurement range, indicating that both emissions are negligible.
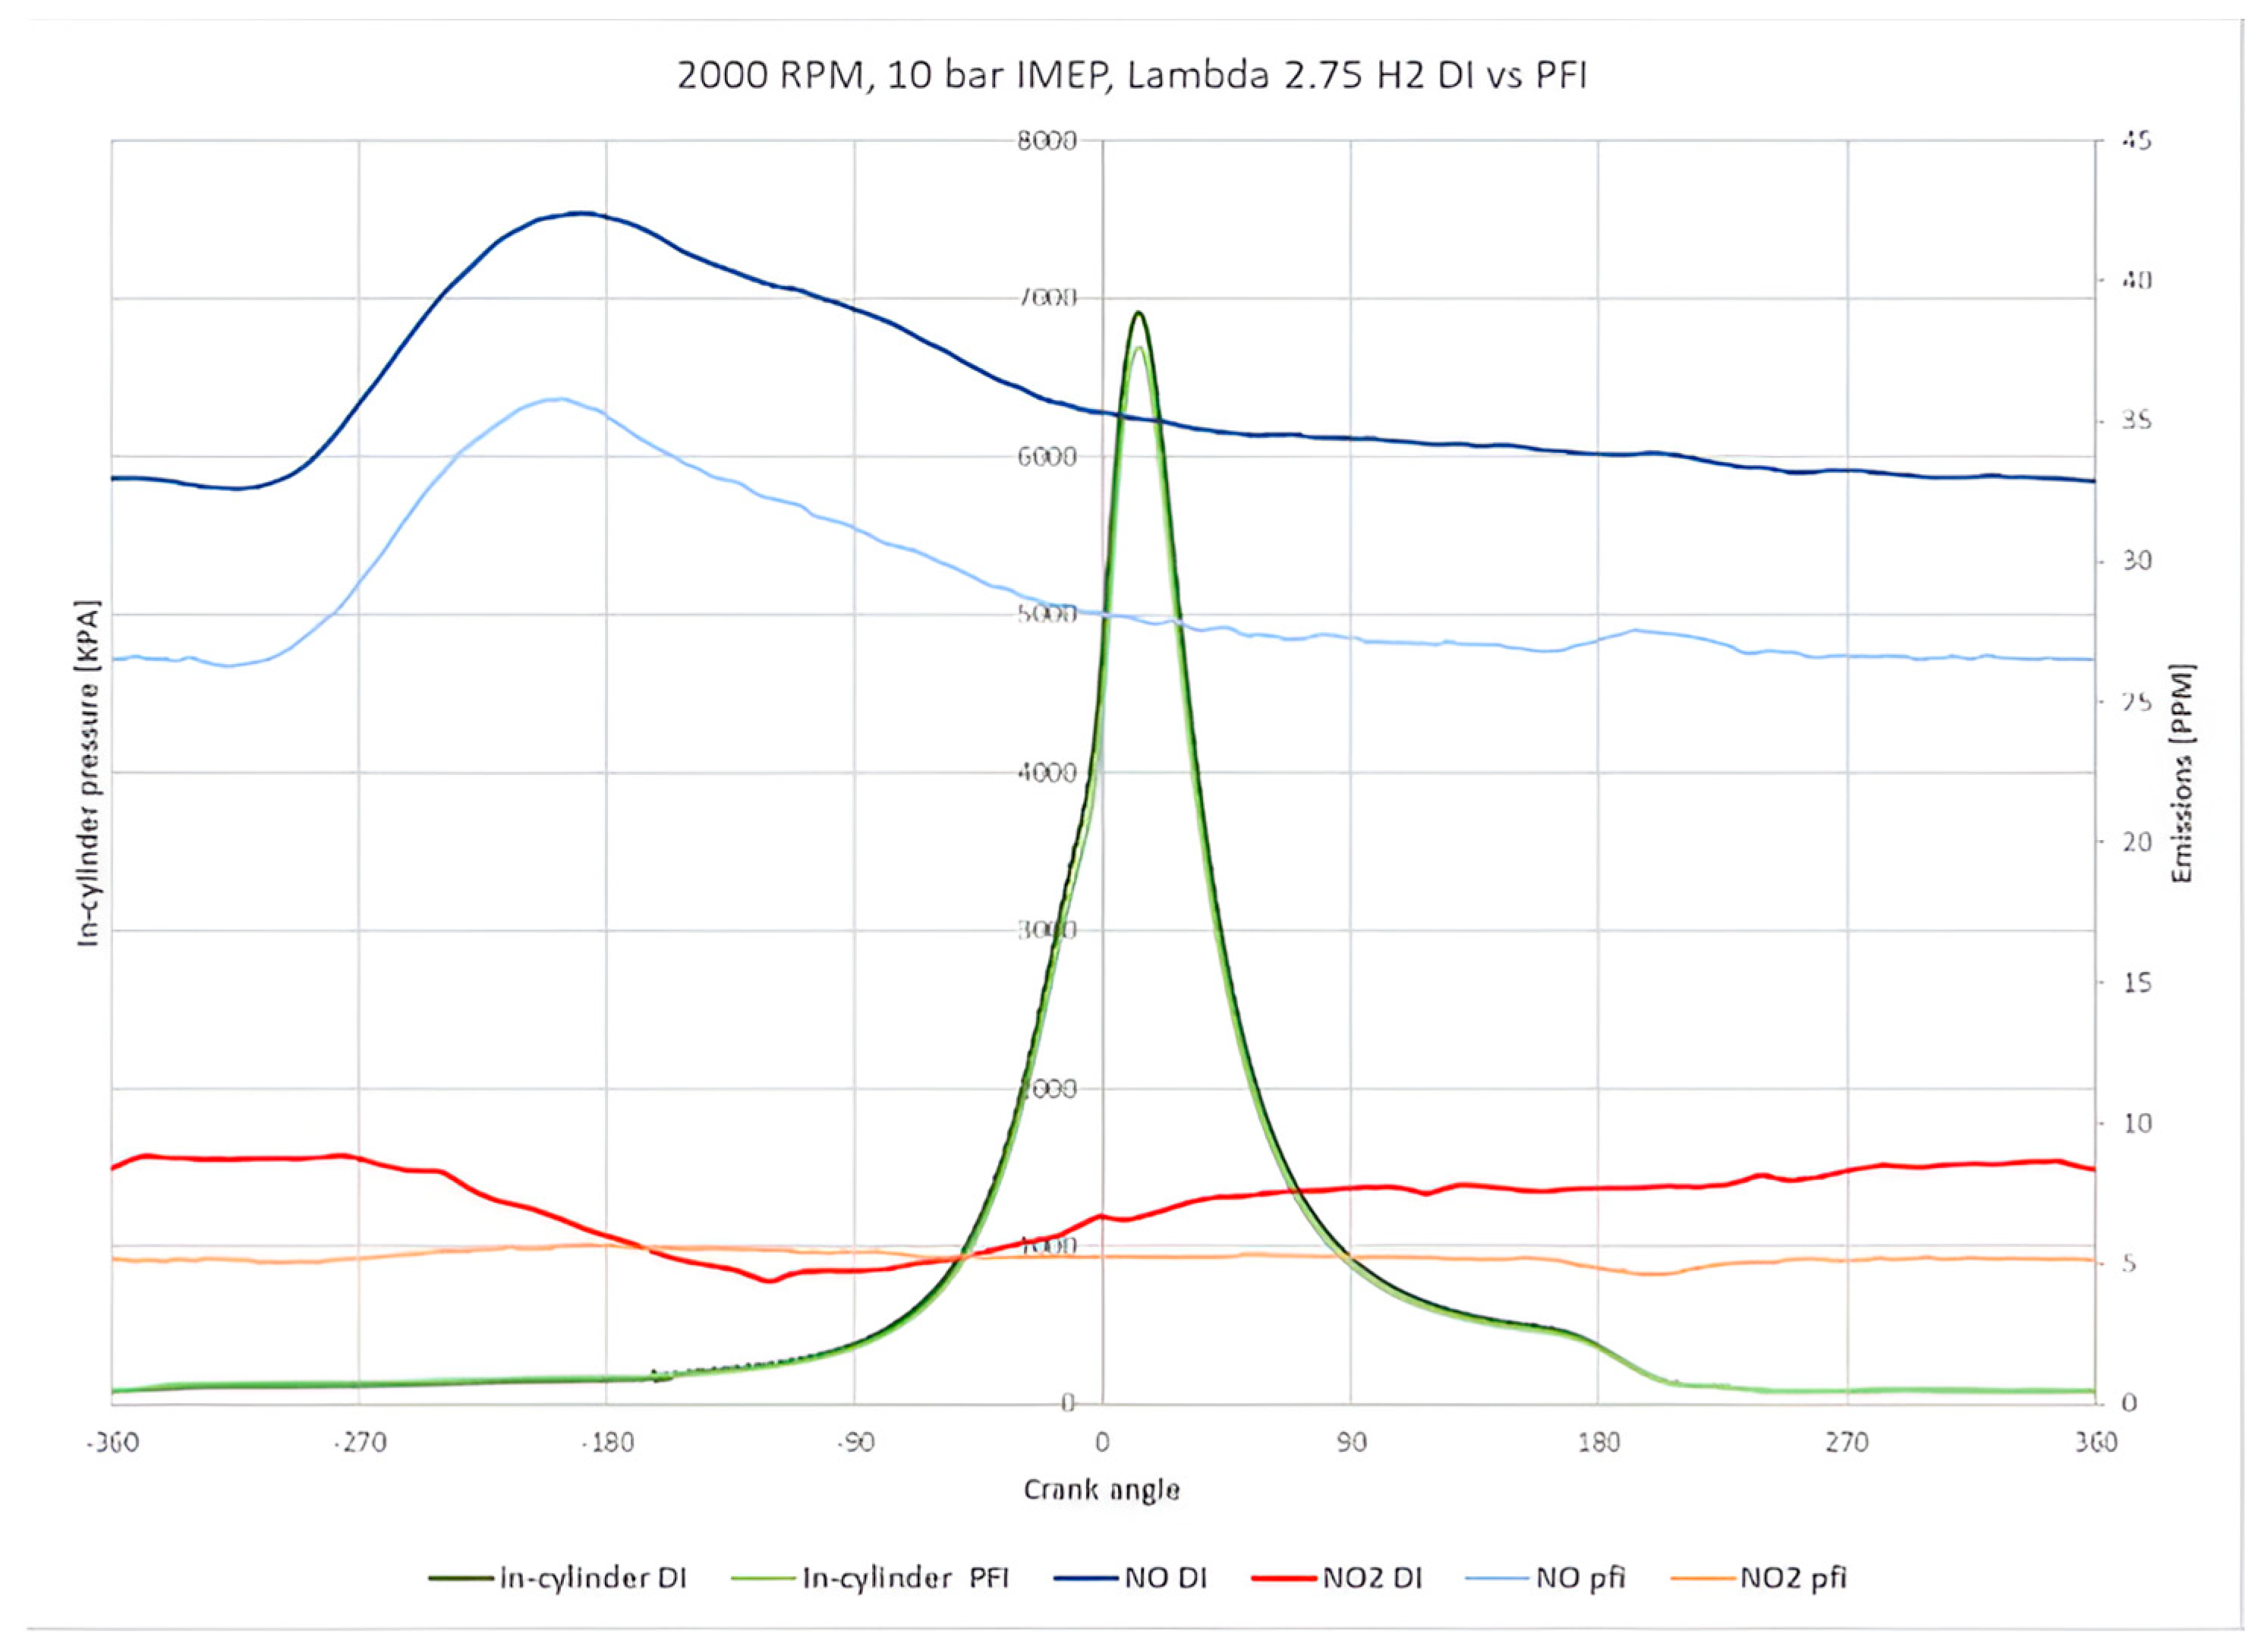
Figure 7 illustrates the relationship between these emissions and in-cylinder pressure at a lambda of 2.75, which is considered an optimum engine operating point due to a lower requirement of boosted air and minimum NO
x emission. The figure shows that hydrogen DI and PFI systems produced almost identical in-cylinder pressure. The location of the peak pressure of 6878 KPa is 6 degrees ATDCf. Notably, NO emissions account for 80% of the total NO
x emissions, while NO
2 only accounts for the remaining 20%.
Furthermore, the results indicate that the DI system generates higher NOx emissions than the PFI system by 14 ppm, suggesting a higher thermal efficiency. Interestingly, the distribution of NO across the crank angle domain shows a saturation on the exhaust opening side, and the peak of the NO is detected at the intake stroke. This delay occurred due to the overall low NO concentration.
Figure 8 illustrates the rapid NO and NO
2 emissions characteristics at a lambda of 1.5, which has the highest NO
x emissions, with the hydrogen DI system. The diagram depicts the significant NO spike occurring at 156 degrees ATDCf, which is a delay of around 5 degrees from the opening time of the exhaust valves. Additionally, it also shows that the location of the NO peak aligns with the exhaust valve opening peak as the measuring probe is mounted just behind the valve, which indicates that the delay function provides an accurate estimation of the system delay.
These findings demonstrate the importance of carefully monitoring and adjusting spark timing to ensure safe and efficient engine operation.
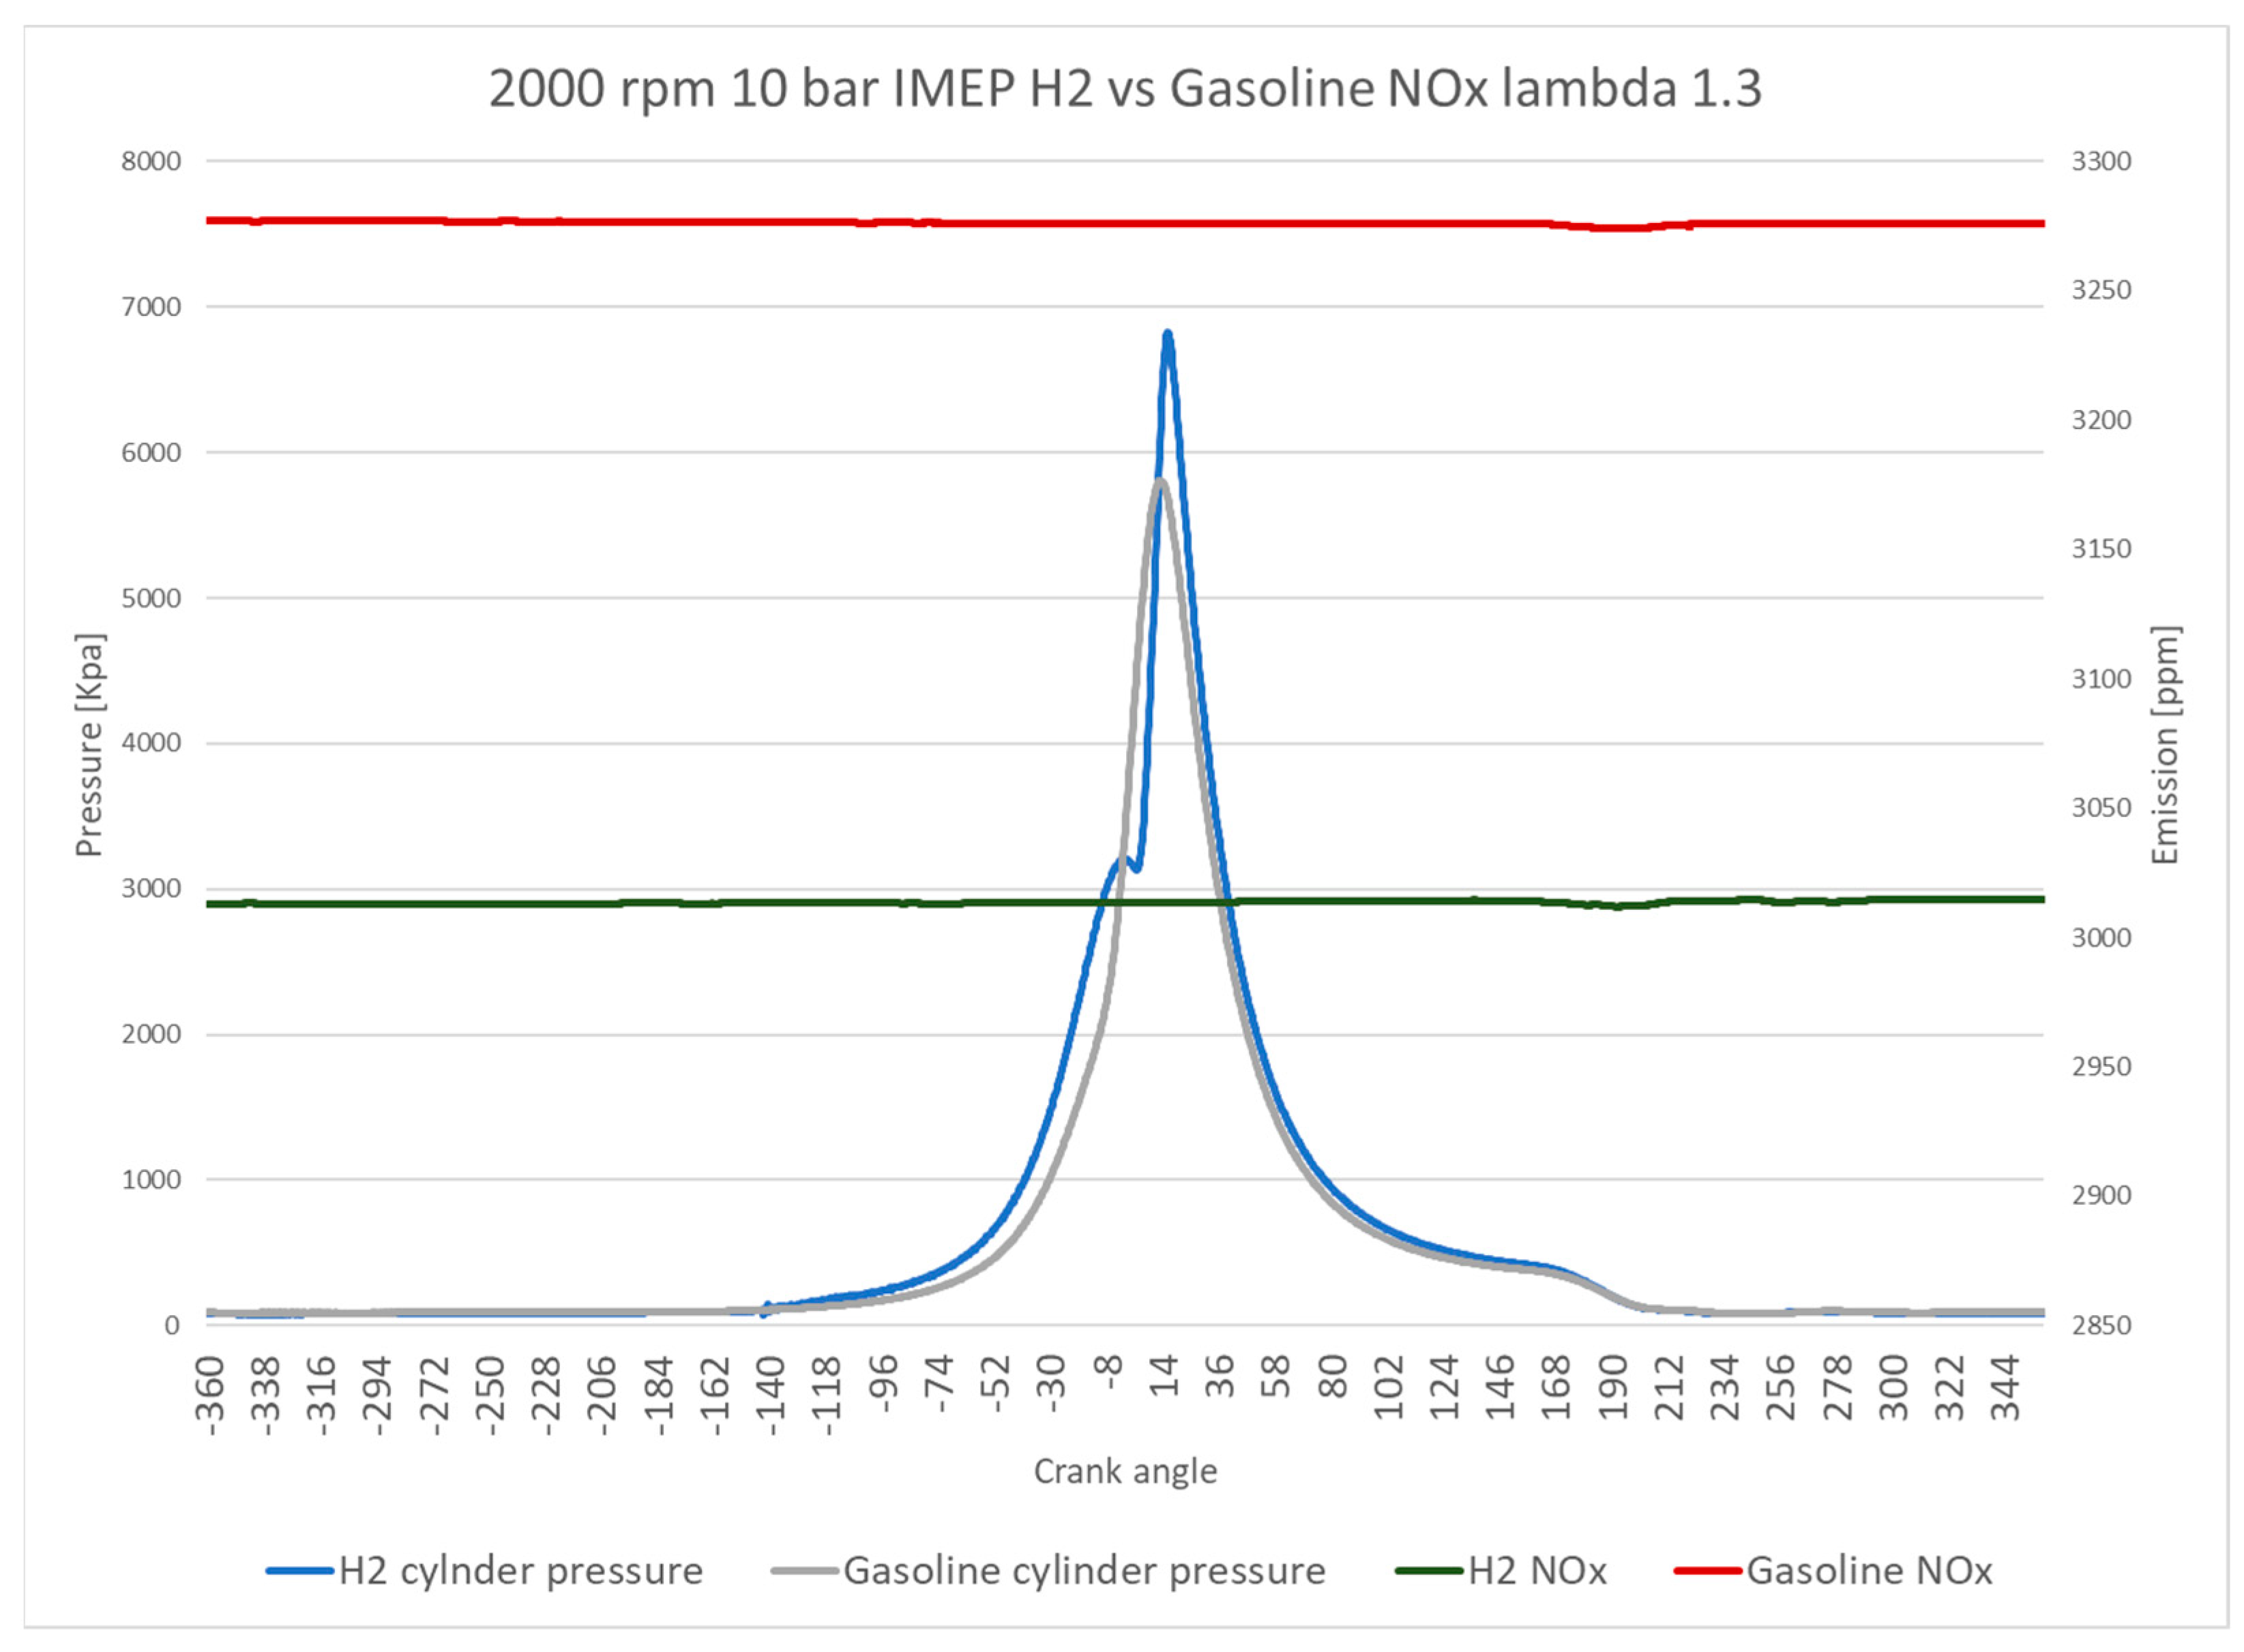
Figure 9 directly compares NO
x emissions over the crank angle domain for the hydrogen and gasoline DI systems at lambda 1.3, where a peak of NO
x emissions was observed for gasoline fuel. The NO
x emissions for both fuels exhibit low fluctuation levels of less than 10% over the cycle. However, the NO
x emissions of hydrogen are 9.3% lower compared with those for gasoline. The in-cylinder pressure data reveal the operational differences between the two fuels. Gasoline exhibits a lower in-cylinder pressure of almost 1000 kPa than hydrogen. Furthermore, the retarding of spark ignition timing of hydrogen operation is indicated by the location of peak in-cylinder pressure, which is around 13 crank angle degrees after that of peak in-cylinder pressure for gasoline. This feature significantly impacts the ITE of the hydrogen DI system when operating at this lambda configuration.
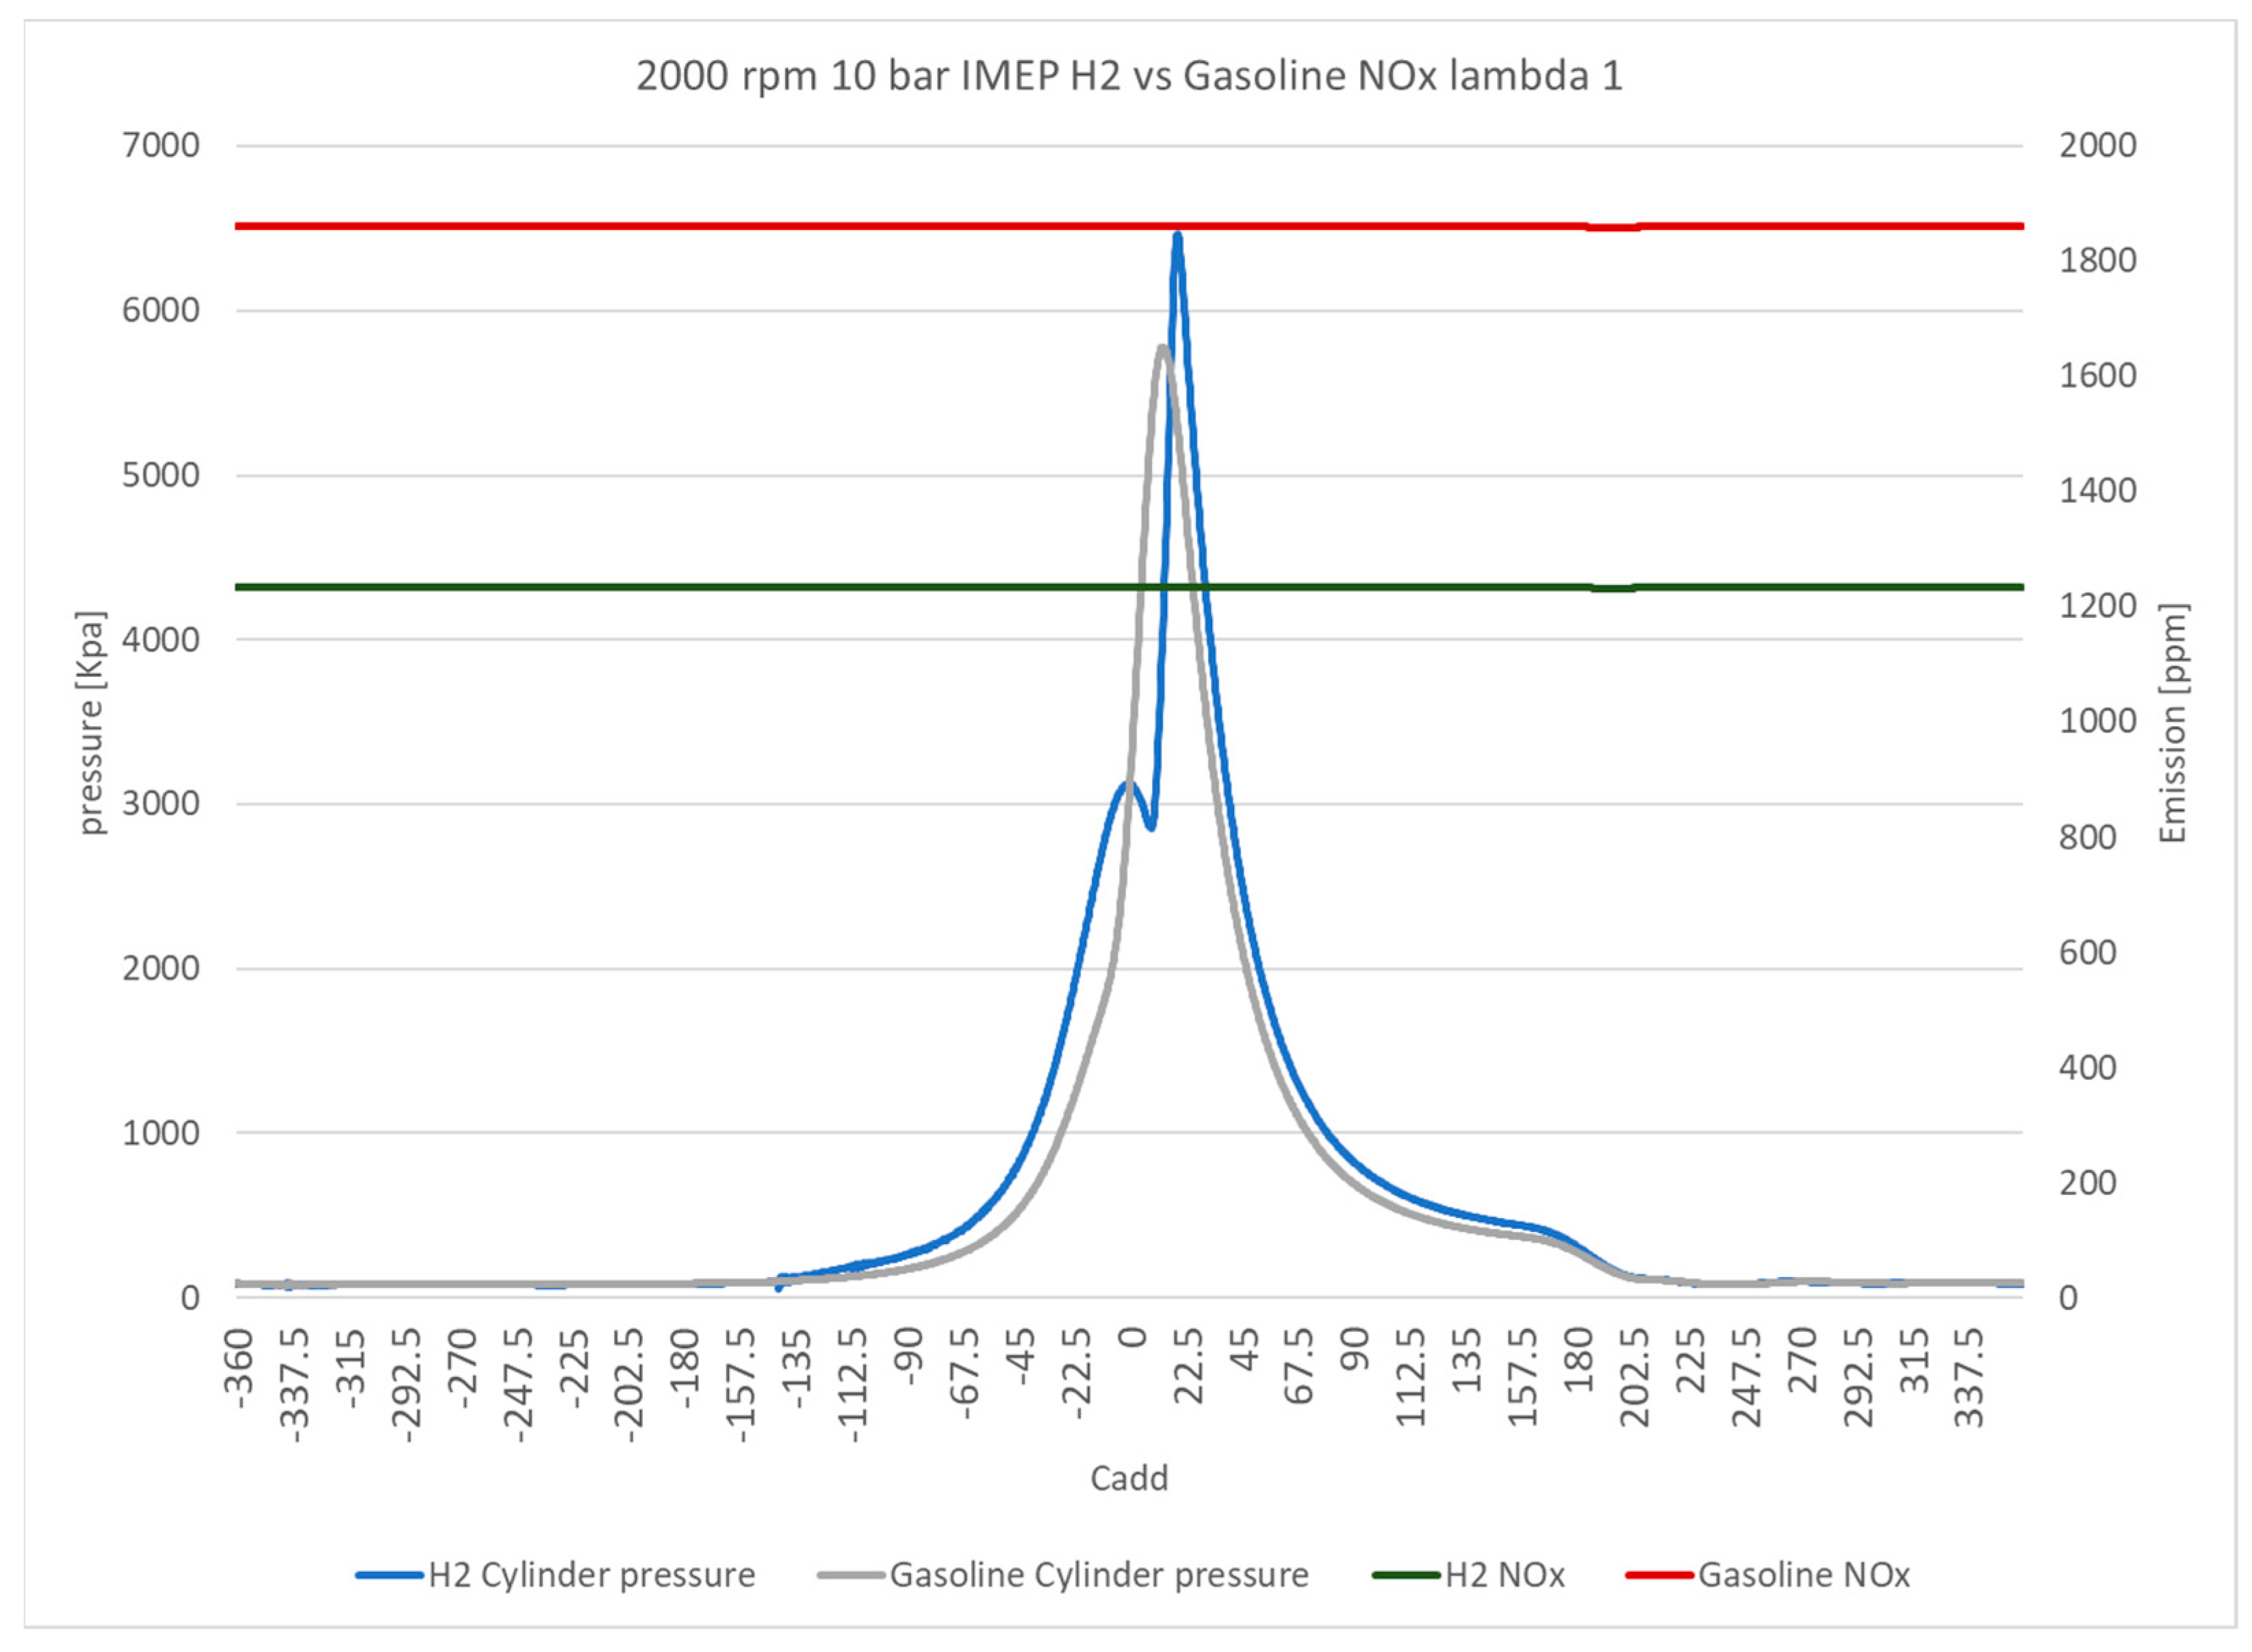
Figure 10 displays the NO
x emissions across the crank angle domain for the hydrogen and gasoline systems at lambda 1, the stoichiometric ratio. The in-cylinder pressure indicates a significant retarding of spark ignition to nearly 5 degrees ATDCf for hydrogen to maintain the maximum pressure rise rate within the allowable limits. It is noteworthy that the NO
x levels of hydrogen operation are lower by 370 ppm than those of gasoline. Furthermore, the in-cylinder pressure highlights the difference in combustion characteristics, as hydrogen exhibits much higher in-cylinder pressure with a retarded ignition to ensure the engine operates within limits. The study underscores the criticality of the ignition timing and the fuel characteristics in managing NO
x emissions, particularly with hydrogen fuel.
The analysis conducted in this study outlines NO and NO2 emissions distribution across the crank angle domain. Additionally, the in-cylinder pressure data are presented, highlighting the differences between hydrogen and gasoline at varying relative AFRs. The study further confirms the negligible NOx emissions at lambda 3.3 and a direct comparison between hydrogen DI and PFI at lambda 2.75 with NOx emissions around 50 ppm. Overall, the results demonstrate a comprehensive understanding of the NO and NO2 emissions distribution and provide useful insights into the differences between hydrogen and gasoline fuels under different conditions.
4.3. Analysis of NOx Emissions in the Time Domain
The performance and emissions of hydrogen and gasoline operations have been analysed in the previous sections by averaging 300 cycles. Additionally, the crank angle domain analysis shows the averaged data across 300 cycles. This section aims to analyse the cycle-to-cycle NOx emissions characteristics to fully comprehend and understand the dependency of NOx on other combustion parameters, such as the peak in-cylinder pressure and the engine cycle-to-cycle variations (CCVs).
In the time domain, the in-cylinder pressure and NO
2 emissions of 15 cycles at lambda 2.75 are shown in
Figure 11. The data indicate that high NO and NO2 fluctuations are observed, though the engine Coefficient of Variation (COV
IMEP) was less than 0.6%. The NO emission shows minimal variation of 20 ppm, as the overall NO
x emissions at lambda 2.75 are close to zero. The location of the peak NO
x varies on the basis of cycle-to-cycle dynamics.
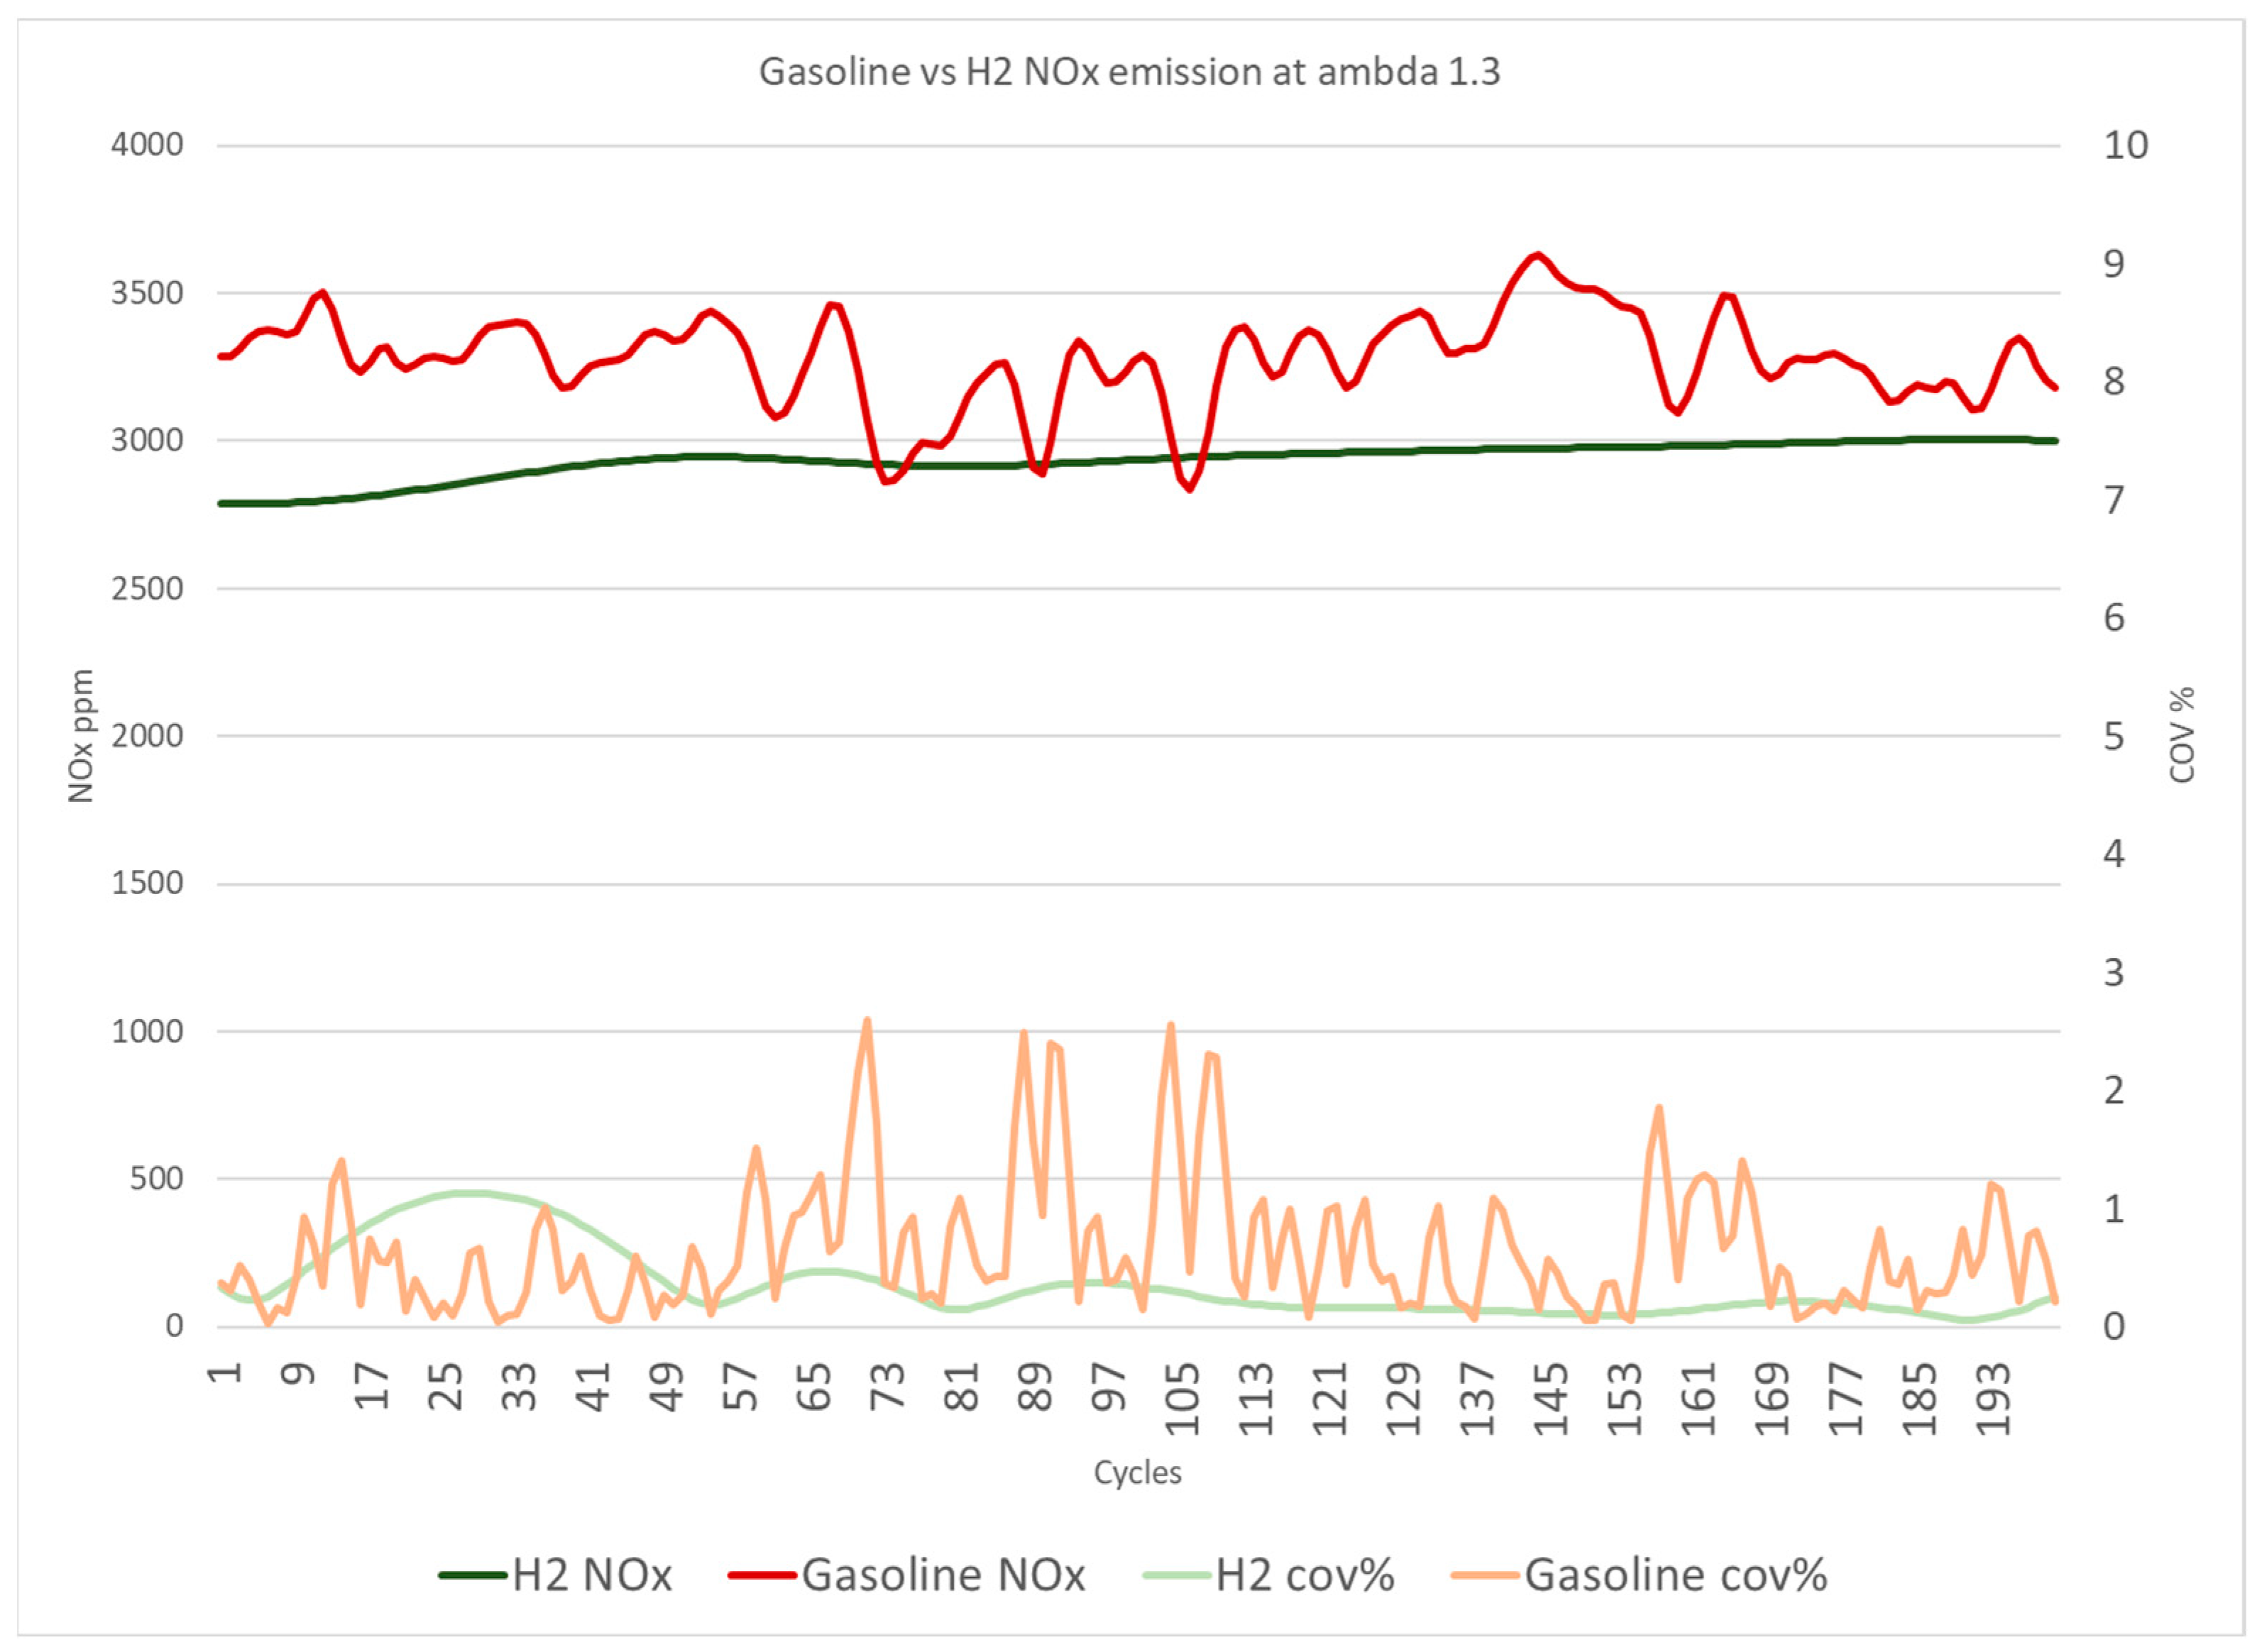
Figure 12 displays the average NO
x emissions over 200 cycles and the NO
x variations indicated by the COV
NOx. Furthermore, both gasoline and hydrogen DI systems at a lambda of 1.3 are directly compared in
Figure 12. The data demonstrate that hydrogen has constant NO
x emissions with minor oscillations of less than 0.5% on average. By contrast, gasoline has unstable NO
x emissions with higher levels of cycle-to-cycle variations, therefore greater COV
NOx, as shown in
Figure 12, and Equation (2) provides the COV
NOx calculation.
Figure 13 presents the peak in-cylinder pressure of each cycle against the NO
x emissions at a relative λ of 1.3. Though the COV
IMEP of both fuels is less than 1%, it is apparent that the variation of peak in-cylinder pressure in gasoline DI is significantly greater than that in hydrogen DI. This is evidenced by the wider peak in-cylinder pressure distribution observed in gasoline DI. The figure also illustrates that hydrogen produced higher peak in-cylinder pressure with lower NO
x emissions.
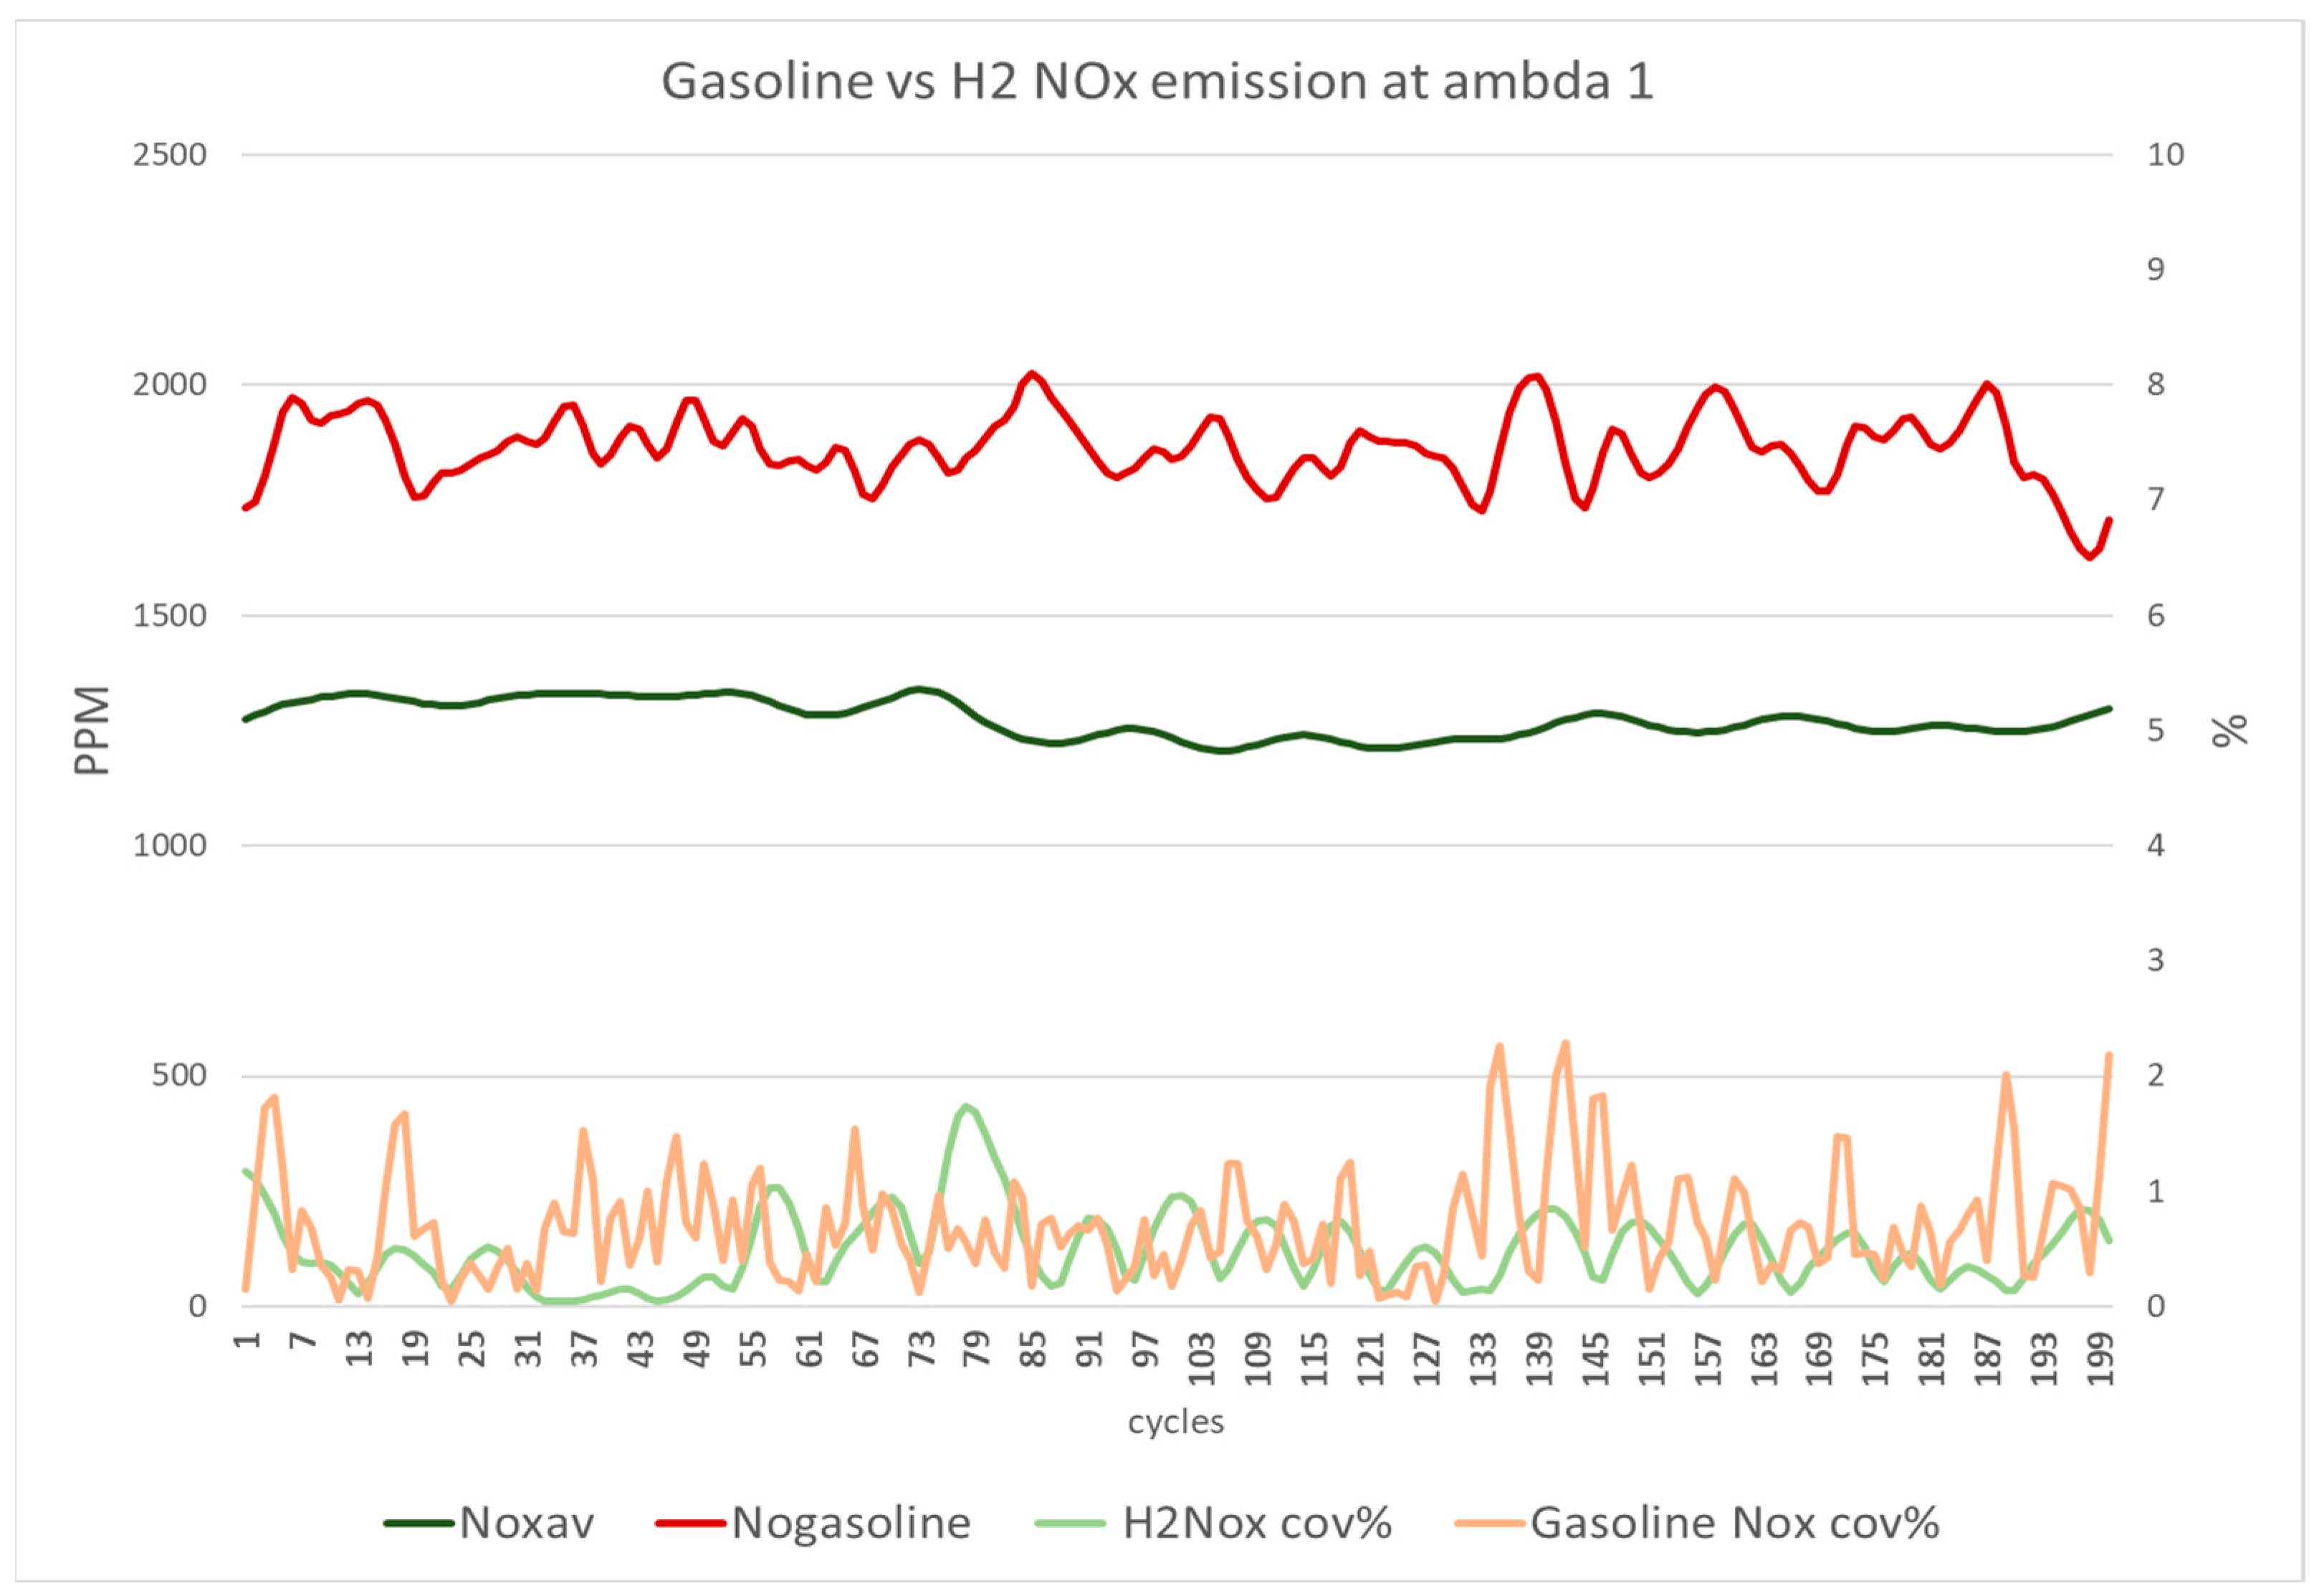
Figure 14 depicts the NO
x emissions of gasoline and hydrogen DI at a lambda of 1. The results indicate that gasoline produced higher NO
x emissions and oscillation levels than hydrogen. Although the engine is primarily designed and optimised to operate with gasoline as the primary fuel, hydrogen exhibits more stable NO
x emissions with less COV
NOx per cycle and lower average NO
x levels.
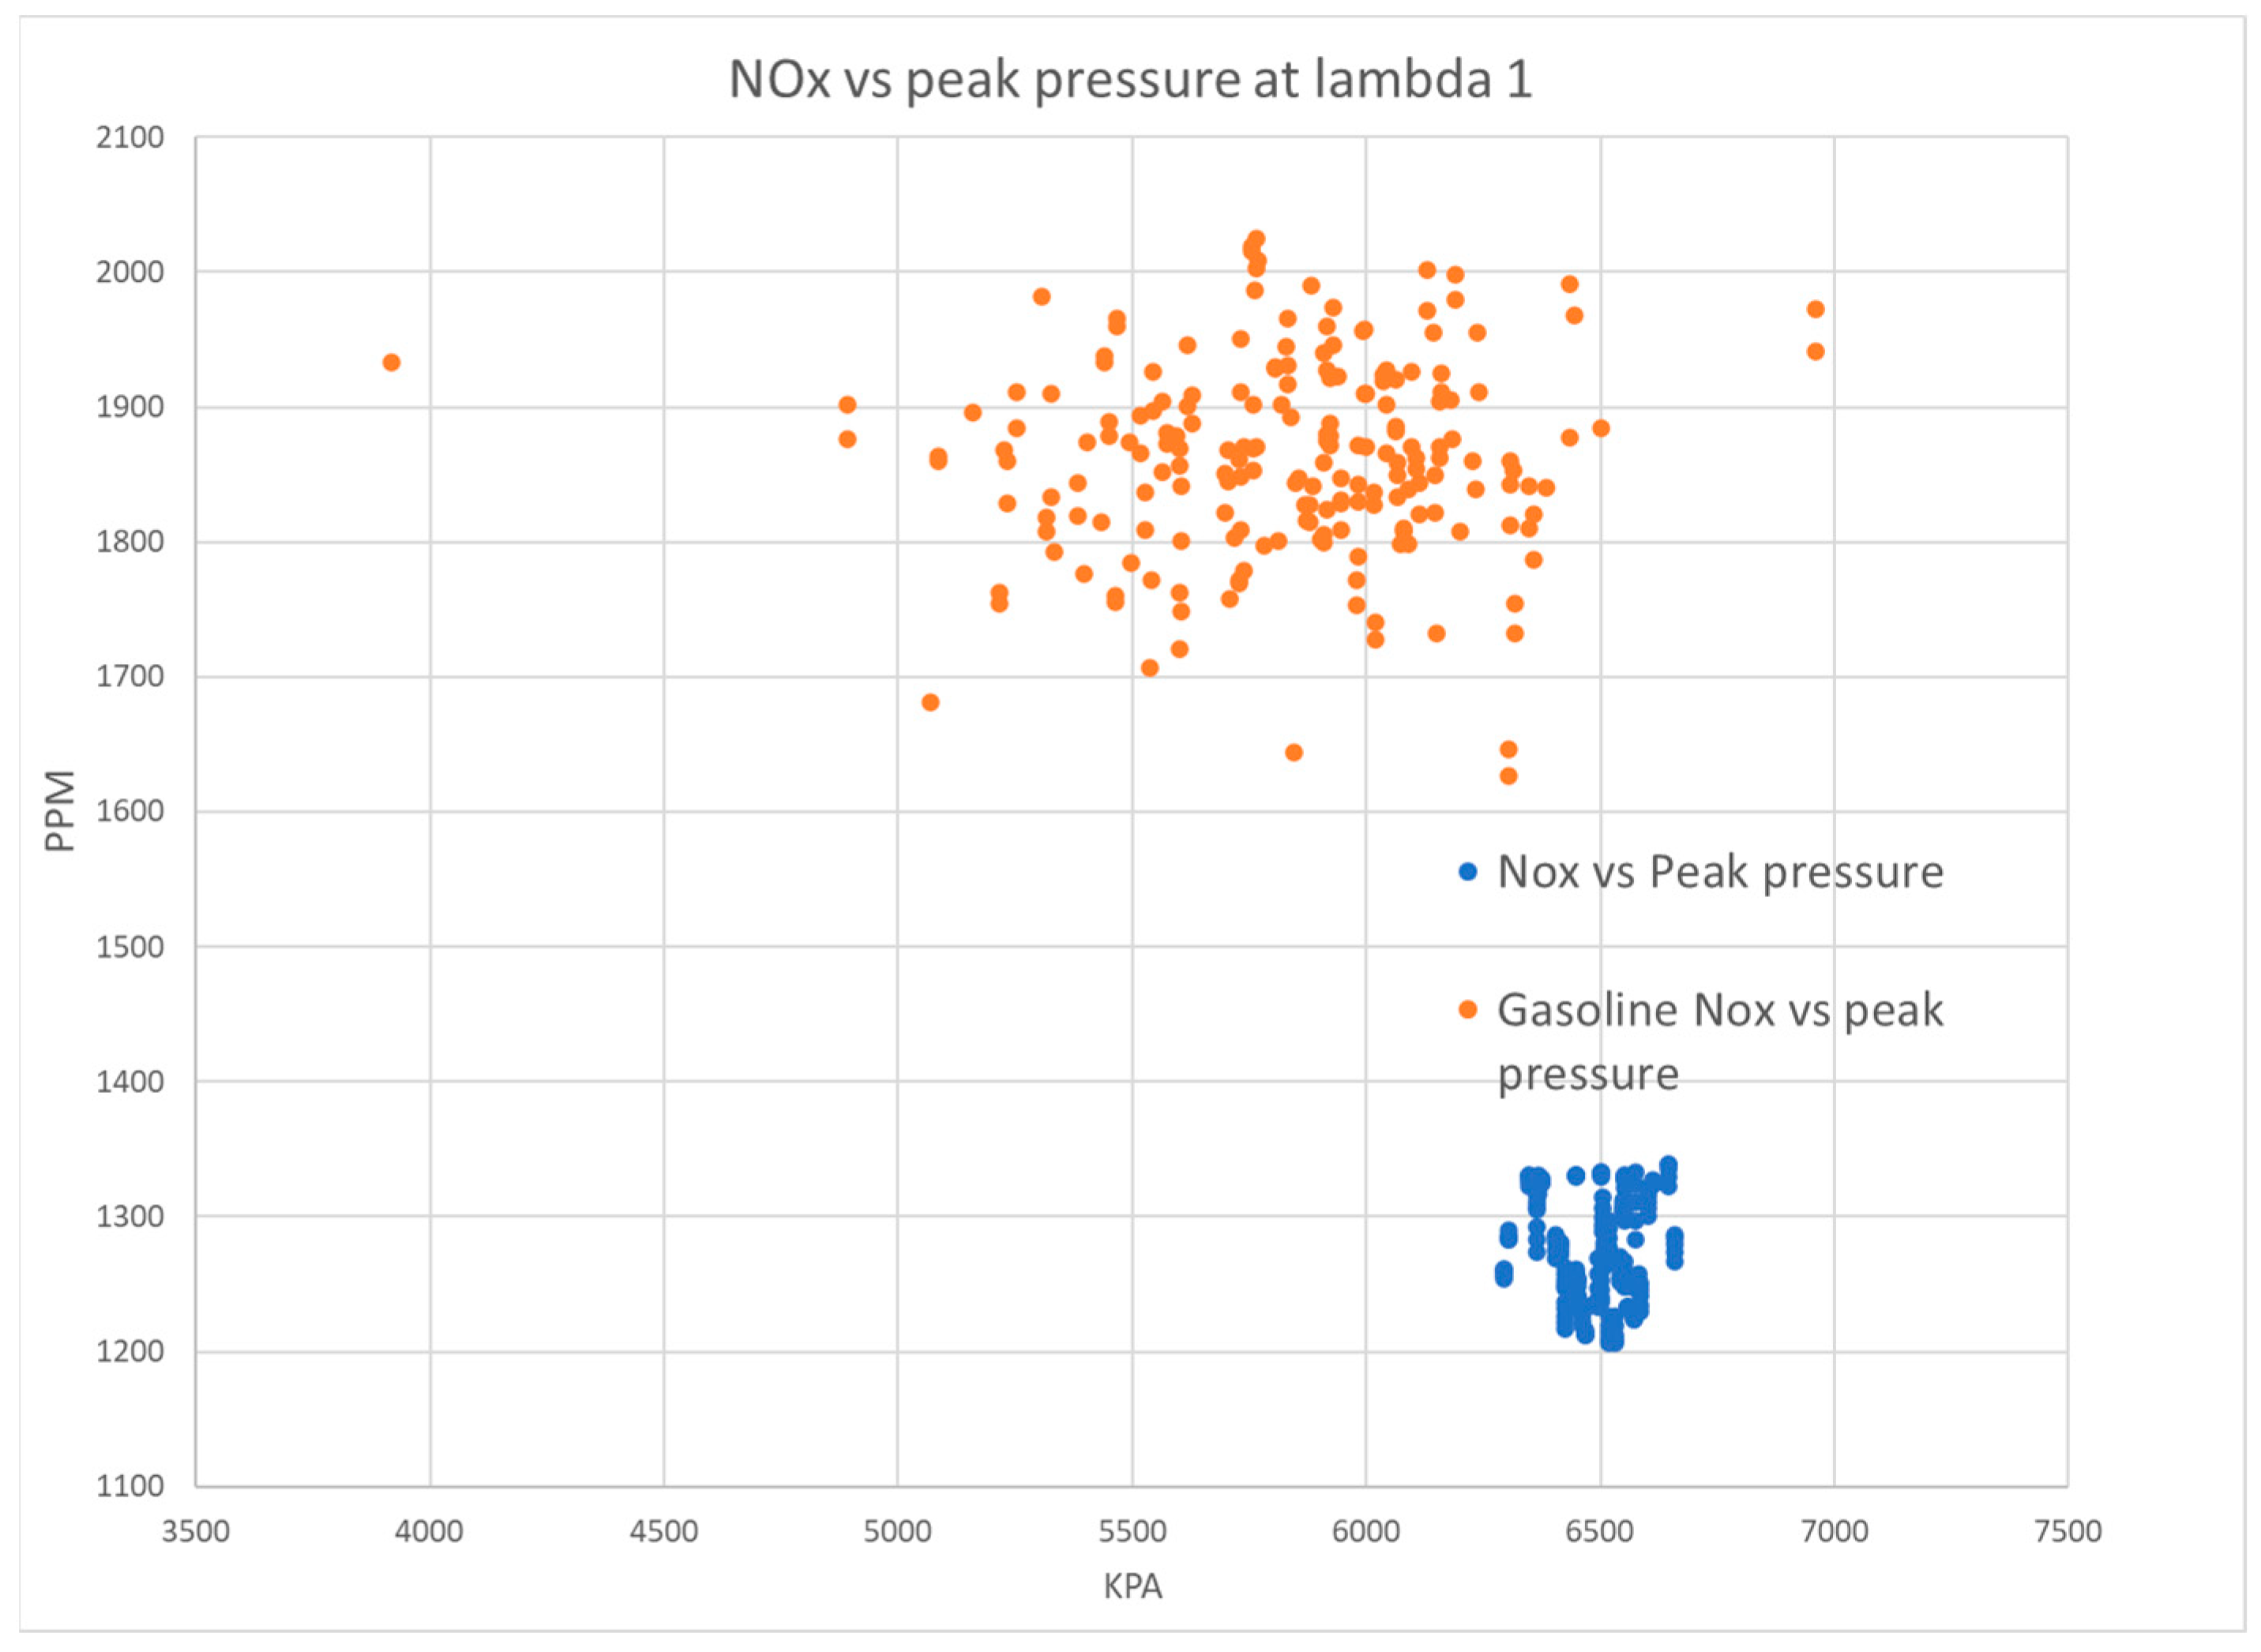
Figure 15 displays the in-cylinder peak pressure in relation to NO
x emissions for 200 cycles under stoichiometric conditions. The data indicate that gasoline exhibits higher in-cylinder pressure variation and a greater oscillation of NO
x emissions than hydrogen. Conversely, hydrogen demonstrates a stable peak in-cylinder pressure and lower NO
x emissions. The results provide clear evidence for the benefits of hydrogen fuel in reducing NO
x emissions as compared to gasoline.
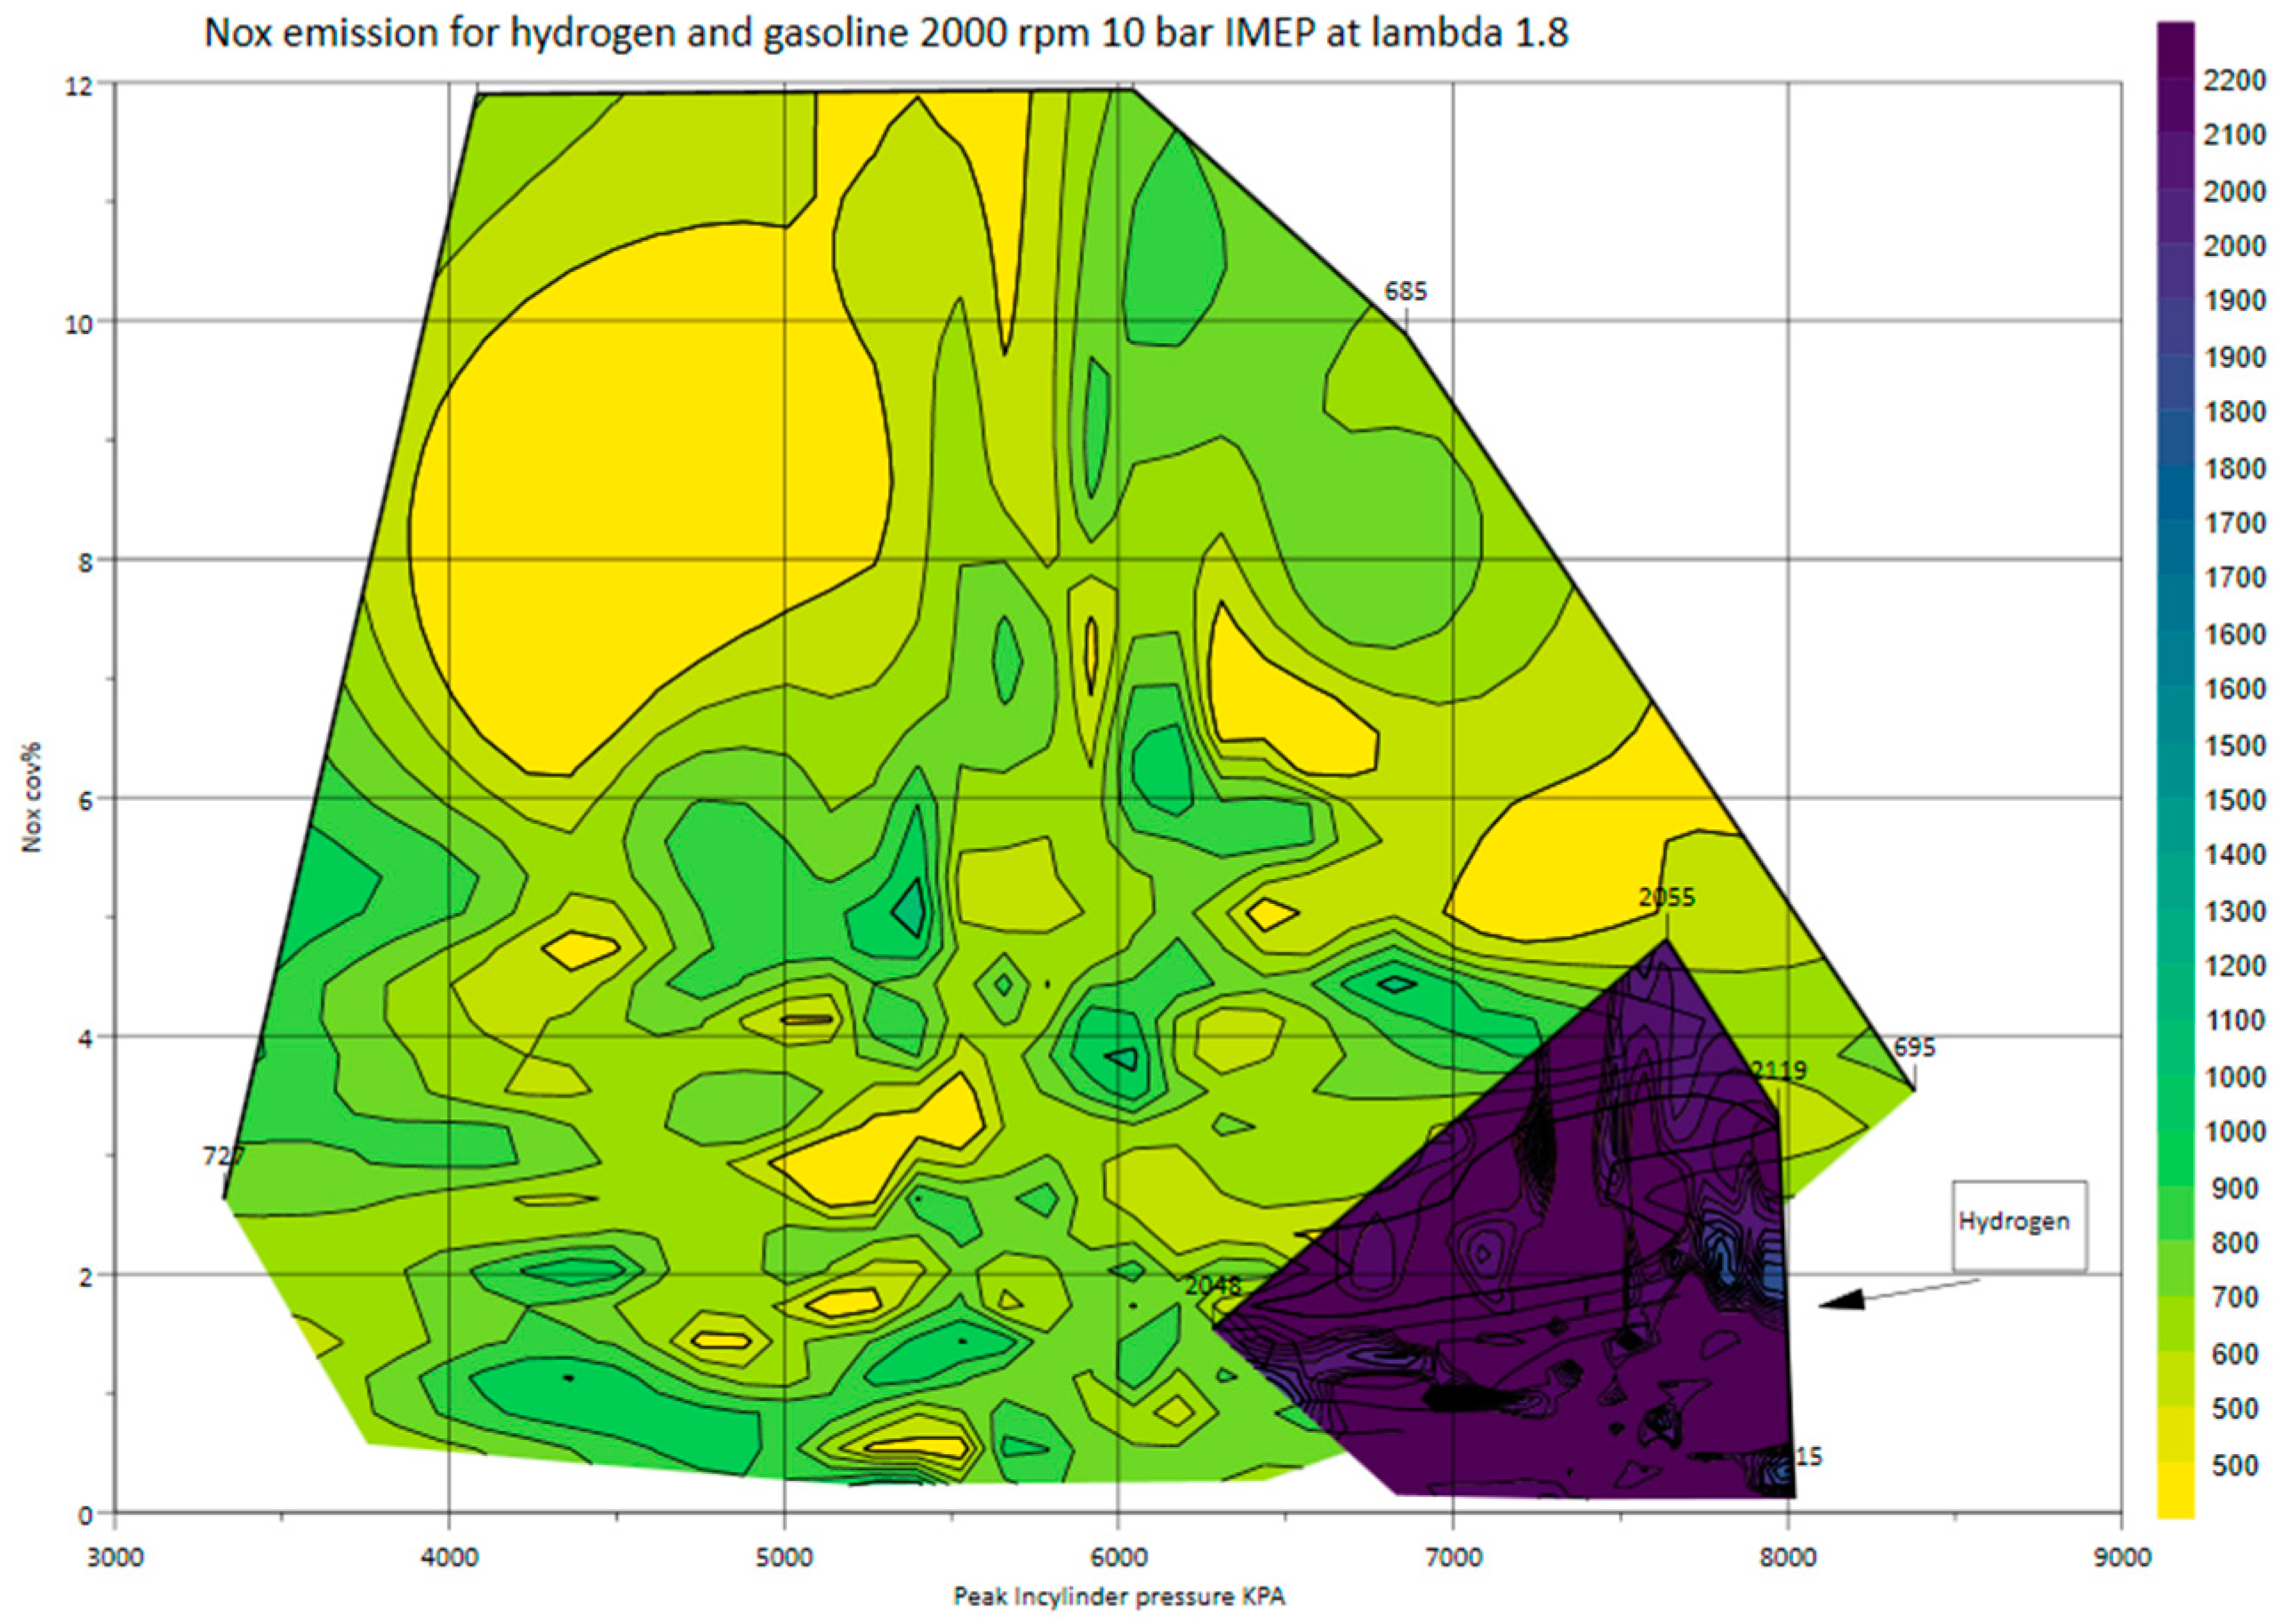
Figure 16 depicts NO
x emission at different cylinder pressures and COV
NOx at a lambda of 1.8, the maximum lambda achieved by gasoline. The graph indicates that at this lean condition, gasoline exhibits a higher variation in peak cylinder pressure compared with hydrogen, resulting in a higher COV
NOx.
Figure 17 shows the results under stoichiometric operating conditions. The data reveal that gasoline has a larger range than hydrogen and is characterised by significantly higher NO
x emissions and greater COV of NO
x at each cycle. Conversely, hydrogen exhibits consistent in-cylinder peak pressure and lower NO
x emissions, with COV of NO
x remaining below 1.7%. Moreover, the data show that higher in-cylinder peak pressure is associated with higher NO
x emissions and greater COV of NO
x, reaching 2.3%. These findings suggest that hydrogen offers considerable advantages over gasoline in terms of its lower NO
x emissions and consistent in-cylinder peak pressure.
The previous two diagrams directly compared the relationship between in-cylinder peak pressure, NO
x emissions and COV of NO
x for hydrogen and gasoline. These comparisons evaluated the primary NO
x characteristics at a lambda of 1.8 and 1. Given that lambda one is considered the optimal λ for gasoline, it is worthwhile to compare the results at the optimal lambda for hydrogen, which is 2.75.
Figure 18 shows the NO
x emission characteristics at lambda 1 for gasoline and lambda 2.75 for hydrogen. The data reveal a higher peak in-cylinder pressure for hydrogen, with nearly zero NO
x emissions. The average NO
x emissions for hydrogen are less than 55 ppm, compared with 1850 ppm for gasoline.
