1. Introduction
The optimal operation of water and energy networks is a relevant problem worldwide because it allows entities to plan better and ensure the reliability of both networks. For the water network, the operation consists of determining which water pumps will be turned on or off in each period, depending on the dynamics of electricity tariffs. Therefore, the goal is to minimise the total cost of the water supply system (WSS) while meeting the water constraints and water demands at each node. In areas with severe droughts, desalination has become a solution to supply water to communities and industries such as mining, with the optimal operation of the WSSs being crucial to provide water to the region at reasonable prices. This is particularly important if the water demand nodes are located at high altitudes, such as is the case of many mining companies around the world, and particularly in Chile [
1,
2], because the pumping process is energy-intensive, increasing by approximately USD 0.5/m
3 with every 500 m of altitude. Additionally, at an altitude of 4000 m, desalinated water costs USD 4/m
3 compared to spring water at USD 0.4/m
3 in some locations [
3].
Furthermore, energy costs are a significant operating expense for water utilities, with approximately 4% of the electricity used in the United States being attributed to the operation of potable water and wastewater networks [
4]. In California, 19% of the state’s electricity consumption is for pumping, treating, collecting, and discharging water and wastewater [
5]. Therefore, optimising the operation of water networks not only offers economic benefits but also helps to reduce unnecessary use of resources and minimise the ecological impact of pollution and greenhouse gas emissions [
6].
On the other hand, multiple countries have committed to achieving carbon neutrality by 2050 in the 2015 Paris Agreement for Climate Action, which means renewable energies will replace carbon-fuelled energies in the short term [
7]. However, renewable energies compromise the continuity and resilience of the electrical system due to their weather dependency, so planning has become a key element in preventing shortages. Furthermore, climate change has produced severe droughts in regions where it used to rain more frequently, weakening the water supply for hydropower, crops, industry, and human consumption.
We found inspiration in the pump scheduling problem for high-altitude WSSs, particularly the cases emerging from Chilean mining through its water supply systems that provide desalinated water to each mining site. Nowadays, this industry faces a severe drought [
8,
9], and the location of the mining operations accentuates this phenomenon since they are typically found at high altitudes, between 600 and 4000 m above sea level [
10]. In addition, due to legal and environmental restrictions that protect aquifers and national reserves, the option of extracting continental water is being increasingly reduced. In 2019, 16% of the water used in the mining industry came from the sea, and it is expected that by 2030 this will increase to 47%. Thus, according to [
1], the desalinated water pump would be the second most electricity-intensive process in copper mining, with 10% of the industry’s total. In addition, in the Escondida mining company’s case, the impulsion system’s energy requirement is four times greater than that of the desalination plant [
1].
The water pump scheduling problem is hard to solve due to its non-deterministic polynomial-time-hard (NP-Hard) nature [
11], leading to high computational times. This is mainly due to (i) the nonlinearities of the energy loss equations along pipes and pumps and the power used by pumps and (ii) many possible combinations of head pressure and flow [
12,
13]. Under this context, a challenge arises for finding a faster way to optimise the WSS scheduling while minimising the system’s total costs. Therefore, the main goal is in developing new optimisation models for the operations of water supply systems, finding optimal strategies to reduce systemic costs, and ensuring the water network’s reliability and resilience.
Since the 1970s, researchers have addressed various problems in water networks, including reliability [
14], network expansion [
15,
16], pipe sizing [
17], and network operations [
18,
19]. Optimal pump scheduling has gained attention in recent years due to the increasingly complex electricity tariff schemes and because the operating costs of pumps constitute the most significant expenditure for water organisations globally [
20]. Energy utilities are providing incentives by offering cheaper electricity at low demand periods. This problem has become particularly relevant due to the use of renewable energy sources, which are often weather-dependent and may not guarantee the continuity and resilience of the electrical system.
In the past, optimal operation techniques for water distribution systems (WDSs) primarily relied on deterministic methods such as dynamic programming (DP) [
21,
22,
23], hierarchical control methods [
24,
25,
26,
27], linear programming (LP) [
28,
29], and nonlinear programming (NLP) [
30]. However, since the 1990s, metaheuristic algorithms like genetic algorithms (GAs) and simulated annealing (SA) have gained popularity due to their ability to solve nonlinear, nonconvex, and discrete problems that are difficult for deterministic methods [
31,
32], but they do not ensure a global optimum since they are heuristics, i.e., not exact methods. Nevertheless, deterministic methods are now reemerging because they are more computationally efficient, making them more suitable for real-time control and other applications [
33]. There is also commercial software being used to optimise the water flows in water networks, like Derceto Aquadapt [
34] and EPANET [
35]; however, they do not integrate the switching of the water pump to minimise the total operational costs.
Refs. [
12,
36] summarise the mathematical model for designing and operating a water network described in
Section 2. The basic model is a nonlinear network flow problem with complicated hydraulic constraints. The goal is to operate pumps, which affect the flow and pressure of the water network. This problem is NP-hard due to its nonlinearities and nonconvexities. First, the nonlinearities are present in the relationship of the pump’s pressure head with the flow and in the relation between pressure head loss and flow in pipes. Second, the nonconvexities are present in the changing flow paths in pipes and tanks and in the different discrete choices of pumps to run at a given time of the day [
12,
37].
The water pump scheduling problem is typically planned over a day-ahead horizon, divided into 24 h periods. This discretisation of time is a practical approach to reduce the computational costs of the scheduling problem. Additionally, demand forecasts and electricity price tariffs are usually provided in discrete time rather than in continuous time, which further supports this approach [
38].
The water pump scheduling problem is a nonlinear global optimisation problem, and solving such problems is an NP-hard task [
39]. One way to do so is to use spatial branch and bound algorithms. Integrating spatial branching for NLPs and mixed integer branching techniques for mixed integer linear problems (MILPs) opens the possibility of developing general-purpose algorithms that can, in principle, solve nonconvex mixed integer nonlinear problems (MINLPs) to global optimality [
12,
40]. The basic idea of such an algorithm is to divide the problem into subproblems iteratively and to solve (usually linear) relaxations of these. Subproblems are divided by branching on integer variables and branching on continuous ones.
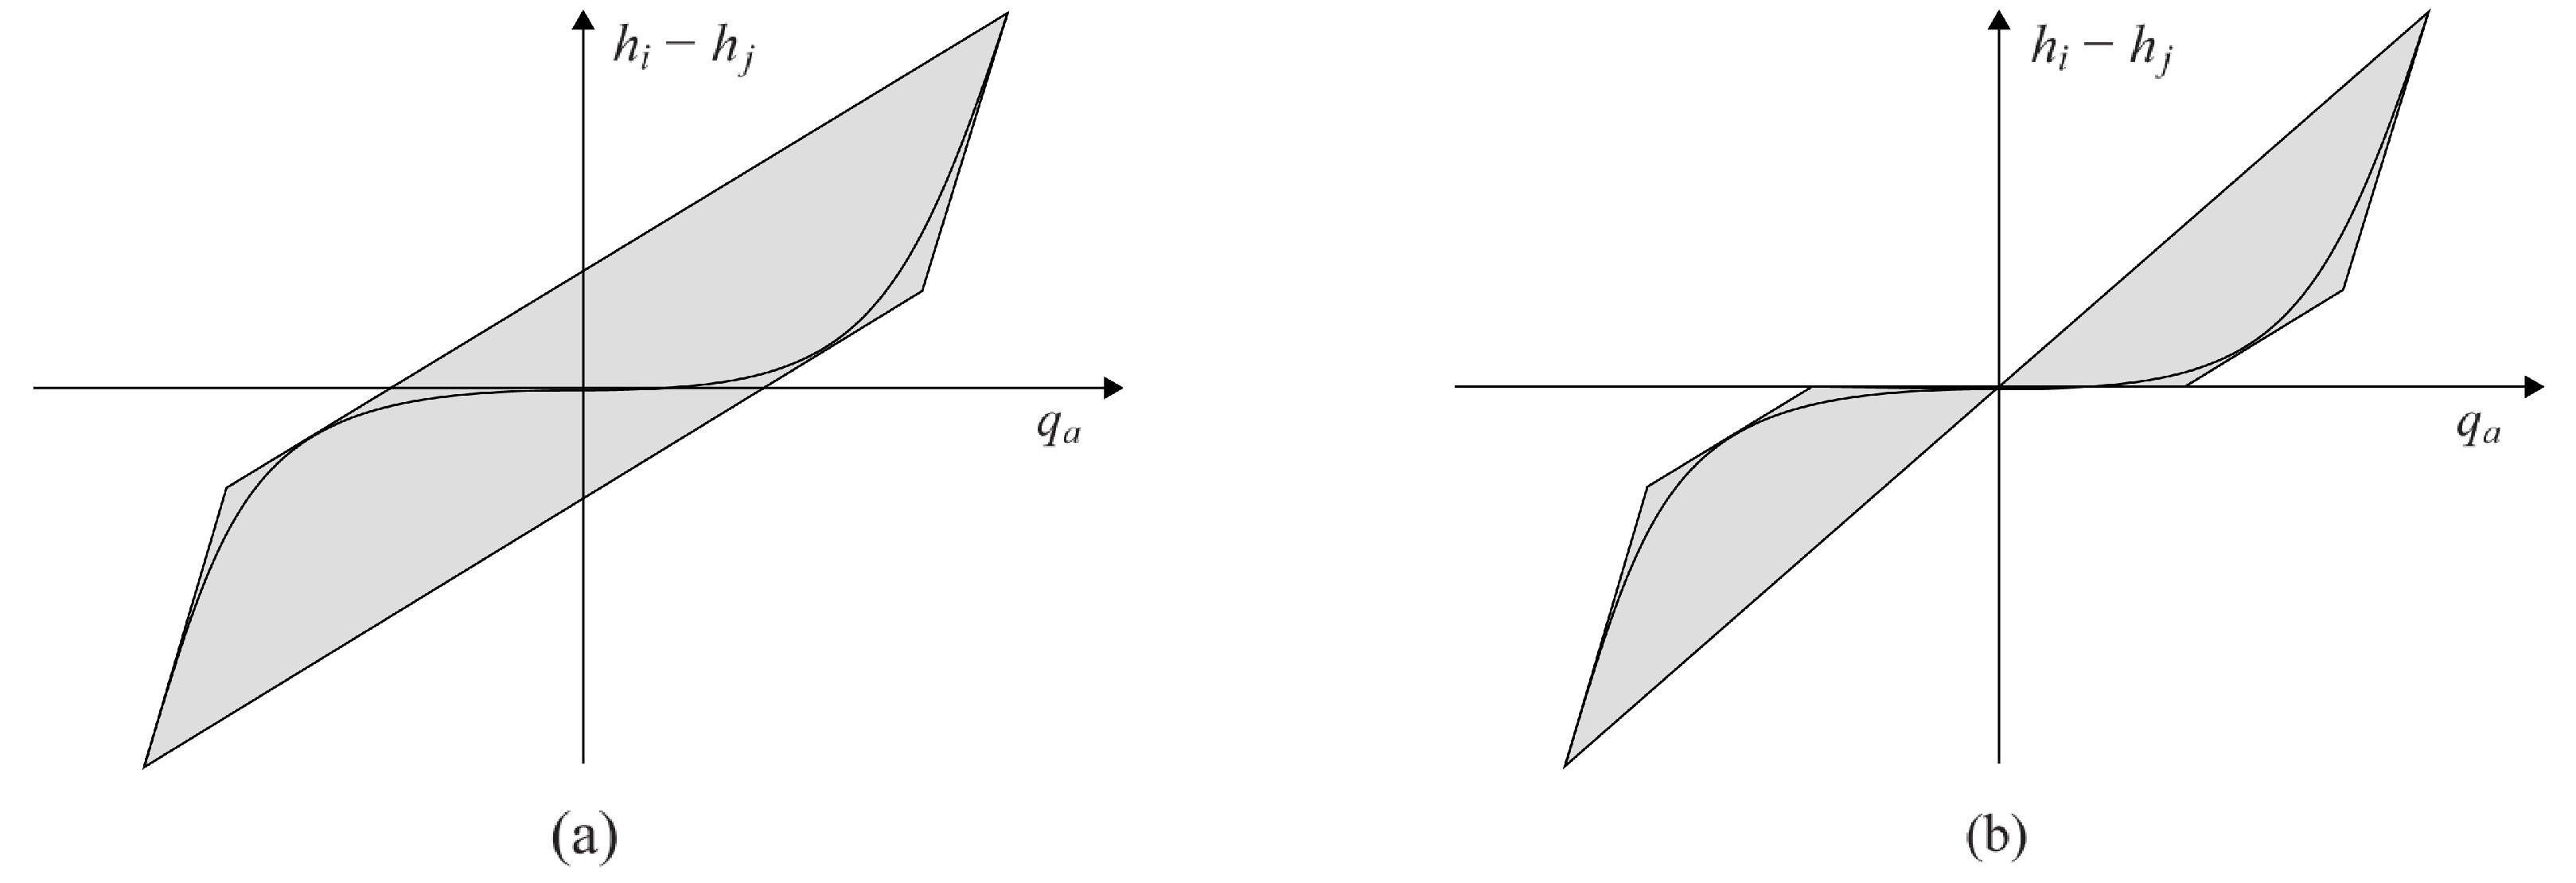
In a subproblem of the branching tree, the continuous domain of some nonlinear function is divided at a certain breakpoint into two smaller domains, thus creating two new subproblems. Provided the relaxation of a nonlinear constraint becomes tighter when the domain of the corresponding nonlinear function is reduced, spatial branching gradually refines the relaxations; see
Figure 1 [
12]. Branching is continued until, finally, the relaxations are tight enough to provide solutions that are
-feasible for the original problem.
Ref. [
12] explains that a way to obtain relaxations of subproblems is to use reformulation techniques to reform all nonlinear functions into some “basic” functions. For these basic functions, linear relaxations are then readily available. The tightness of the relaxations and, thus, the algorithm’s performance are highly dependent on the bounds of the domains of the nonlinearities. This fact makes efficient domain propagation between subproblems essential. Some solvers, like Gurobi, use this approach to solve nonlinear and nonconvex bilinear or quadratic problems [
41]. Other solvers like Ipopt and KKT also offer nonlinear solutions; however, they do not support mixed integer problems or do not ensure global optimality if the problem is non-convex. Therefore, they are not used in this case.
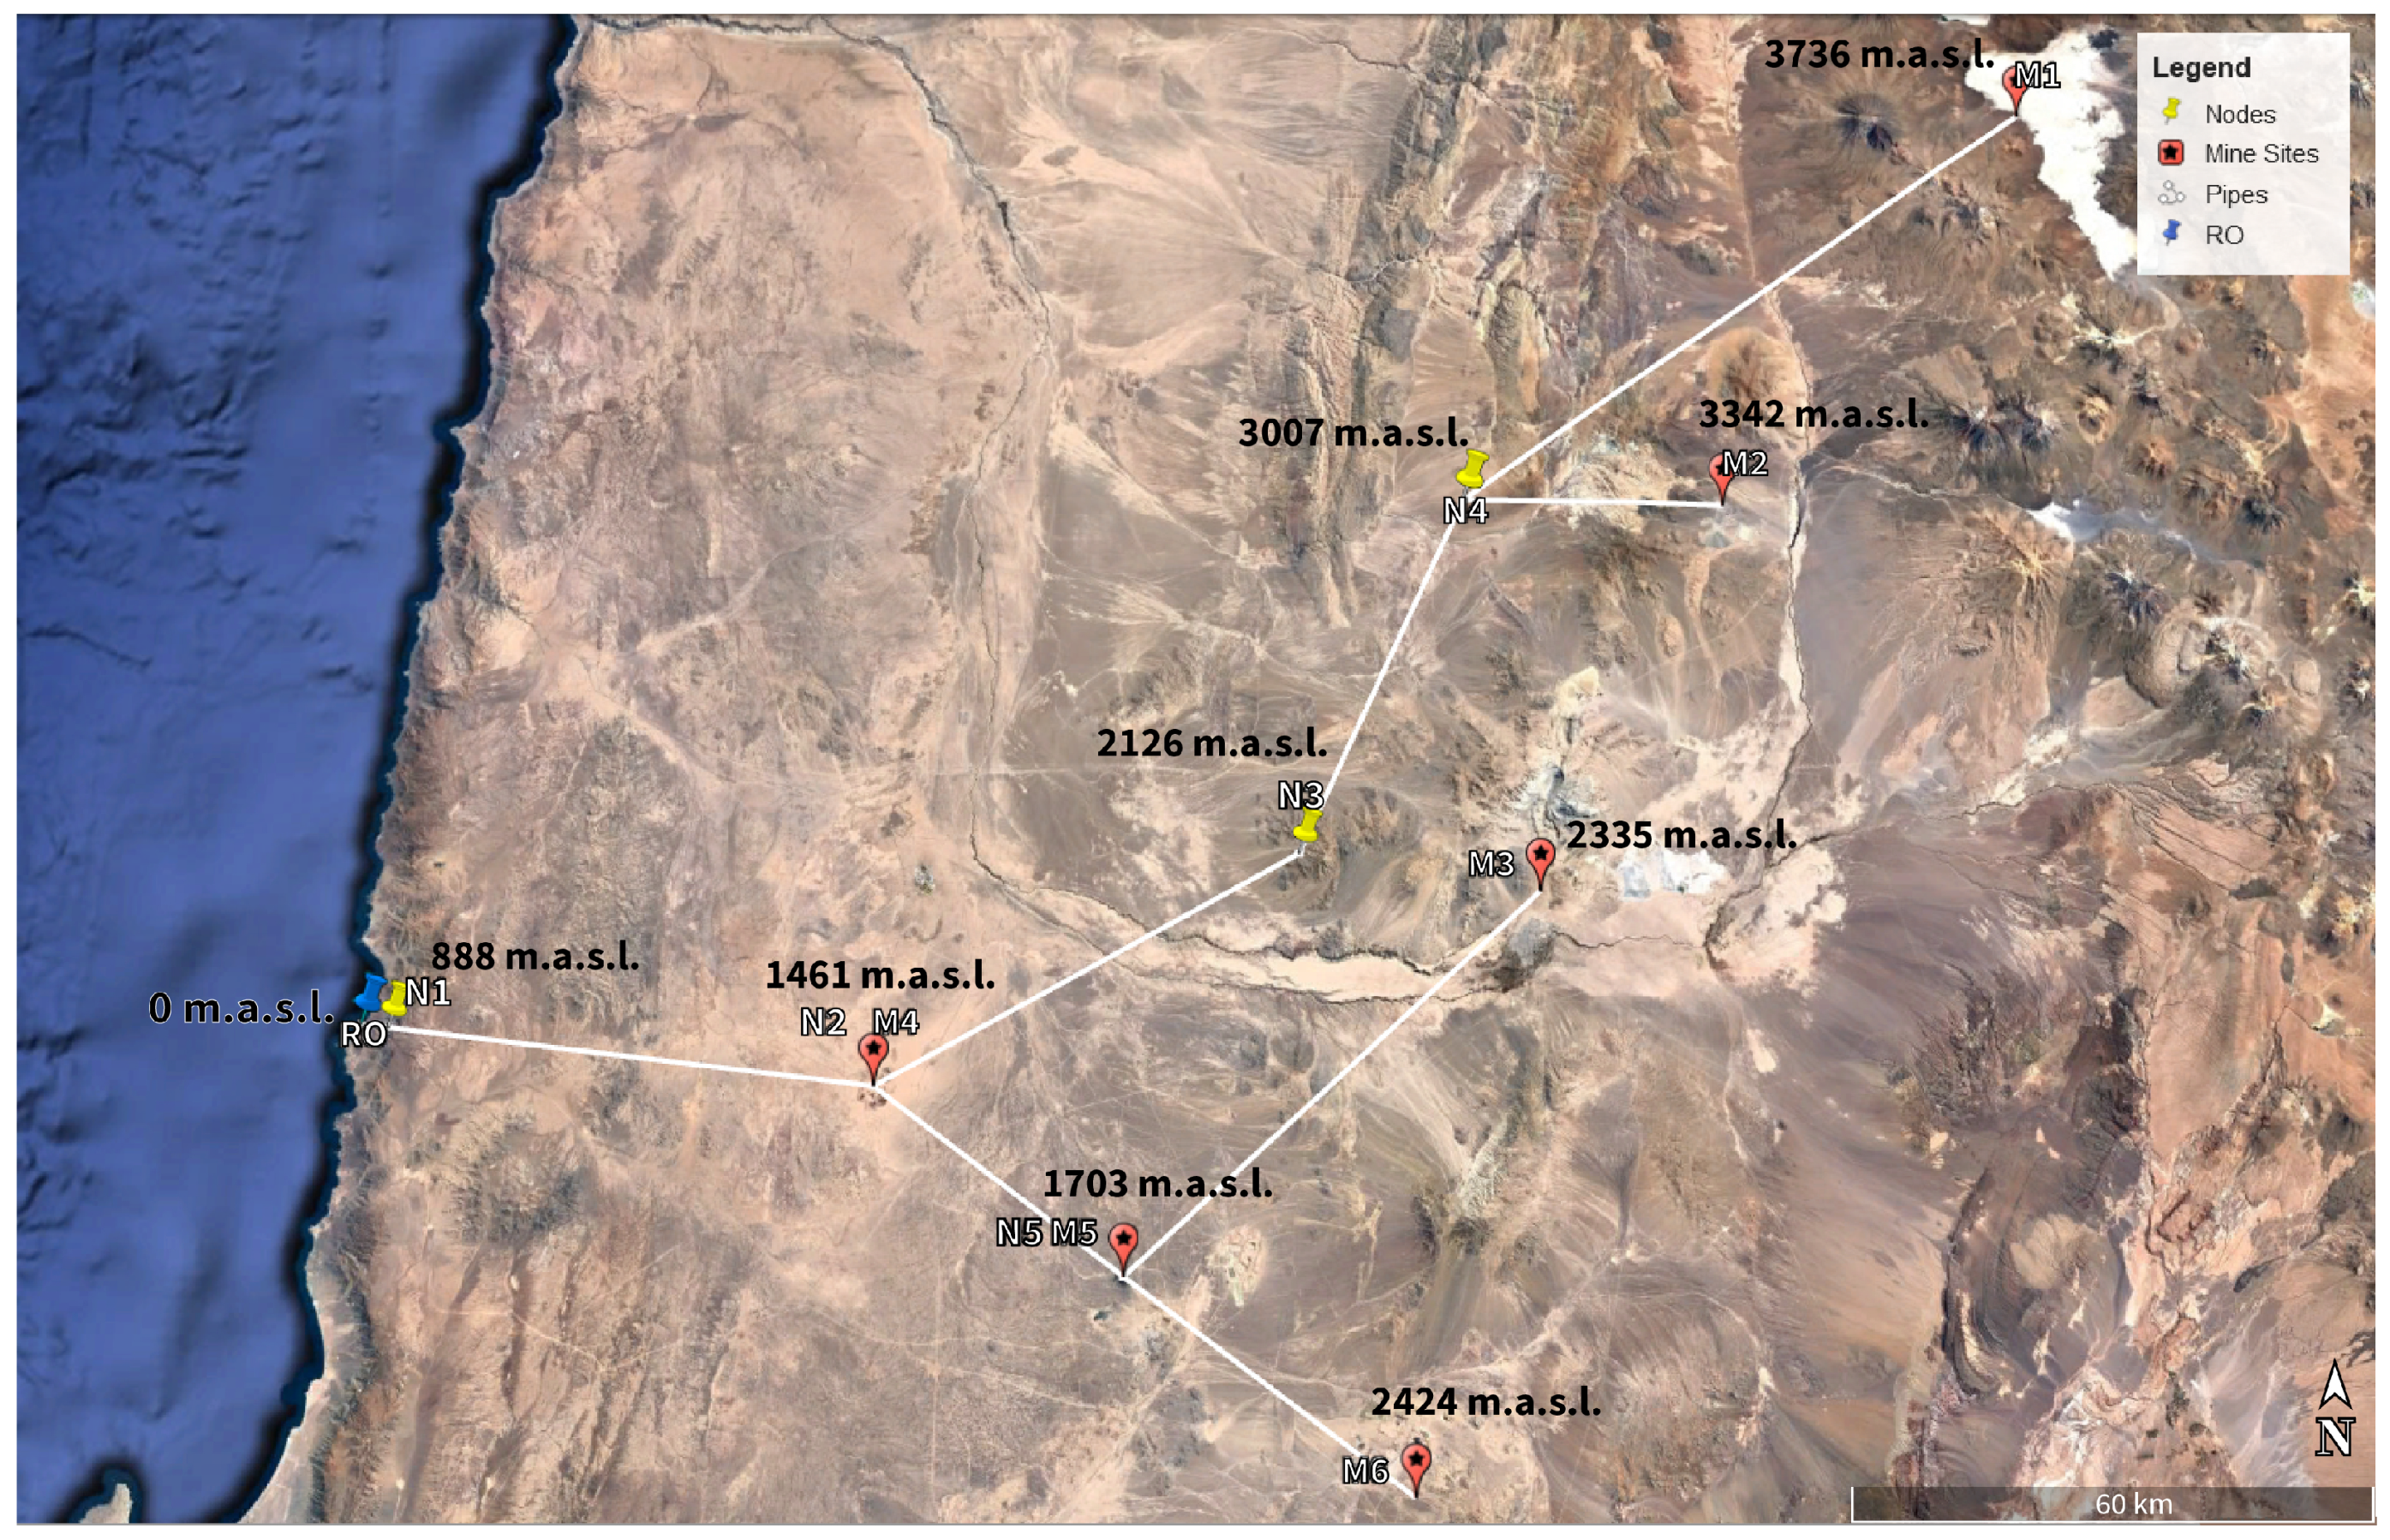
Other problems related to WSSs are the design and investment decisions to build them [
42] (see
Figure 2), analysis of the topological attributes of network resilience [
43], the design of water networks under future demand uncertainty [
44], demand response using a WSS [
45,
46,
47,
48], and operational models for the multi-product pump scheduling problem [
49].
Considering the literature reviewed above, this research identifies challenges that remain unsolved in the current state-of-the-art. The following questions summarise these challenges: How can the water pump scheduling problem for large and elevated WSSs be solved in a reasonable time? How can we efficiently represent the nonlinear nonconvex hydraulic equations in the water pump scheduling problem with desalination plants in the context of large and high-altitude water supply systems? How does a dynamic electricity tariff affect the water pump scheduling problem in high-altitude WSSs?
In this work, the main contributions are summarised as follows:
We optimised the water pump scheduling problem of high-altitude WSSs with multiple pumps and reservoirs using a discretised hourly time horizon and a dynamic electricity tariff. The high-altitude feature is crucial in our model since we are studying the optimal water pump scheduling for large and high-altitude water supply systems.
We propose a novel approach to improve the computational efficiency and allow the solutions of the water pump scheduling problem for high-altitude WSSs: the binary expansion approach. We applied this technique to the complicating hydraulic constraints of the model by partitioning some of their variables into pieces. The complicating constraints are nonlinear and nonconvex, thus making the problem hard to solve. With the binary expansion approach, we reduce computational times while keeping the optimality gap below 1% for large case studies.
We analysed the different models proposed in the literature to solve the water pump scheduling problem and compared them with the proposed approach in a 24 h time horizon. We also studied different WSS topologies and boundary conditions, such as the initial water level in tanks, the altitude of the nodes, the total pipe length, seasonal electricity prices, and comparison with the mining company’s energy and water policies, to study the economic and computational impact of using the binary expansion approach. The WSSs utilised have heights of over 3000 m, and the networks include up to 15 water pumps. Our results show the effectiveness of the proposed approach in solving the problem and further demonstrate how a specific representation of the complicating constraints impacts the computational time of the water network operational model.
The remainder of this paper is organised as follows.
Section 2 introduces the WSS operational model and its nonlinearities.
Section 3 presents three proposed models, including the binary expansion approach. Following this, in
Section 4 we evaluate the performance of the models using different WSS topologies based on the Chilean geography as a case study. Finally, concluding remarks are provided in
Section 5.
2. Operational Model for WSSs
This section presents the operational model for the water pump scheduling problem. We introduce the operational constraints for flow, pressure, pipes, pumps, and tanks. Some of the operational equations have a nonlinear and nonconvex nature, so in
Section 3 we propose different approaches to handle the computational challenge produced by these constraints.
The decisions of this problem are binary variables that determine the water pump status and continuous variables associated with the water flow in the WSS, the water pump power consumption, and the head pressure in each node. The uncertain nature of this problem is related to the stochastic hydro inflows. Therefore, the main goal of this problem is to find the optimal water pump scheduling as the power prices change over time while minimising the total operational cost of the WSS.
The WSS is formulated as a directed acyclic graph (DAG), , with nodes, N, and arcs, A. Nodes can be categorised as junctions, , reservoirs, , tanks, , or desalination plants, ; that is, . Arcs can be pipes, , or pumps, ; that is, .
This article’s main distinction between tanks and reservoirs is that tanks allow bidirectional flow, whereas reservoirs model the water supply source (i.e., mine water source). Tanks are normally modelled as nodes, like in this paper, but can also be treated as arcs [
36]. The WSS in this paper’s case study works as follows: First, the water is desalinated and then pumped into elevated tanks to continue its way up to meet the demand at different nodes. Taking into account the speed and design of these WSSs, the flow reaches a quasi-stationary status. This model also assumes that the pipes have a soft starter and finish or a frequency converter with a kind of slow slope to ensure a smooth transition of the flow; however, the design of the pipe is not considered in the modelling to simplify the calculation. Thus, there is no need to add partial differential equations to the model, and the following equations model the physical phenomena of the water pump scheduling model for a WSS.
The operational nature of the problem introduces time to the variables and parameters. In principle, time is continuous,
; however, for the model tractability it is discretised in
periods of length
. Refs [
12,
38] point out that the time discretisation has the practical motivation that electricity demand and prices forecast are usually given in discrete and not continuous time. In this paper, the planning horizon is one day, divided into 24 hourly periods.
We made the following assumptions for this model: (i) pump start/stop can be performed instantly without any time delay; (ii) the fluid is considered incompressible, and changes in volume due to flow through pumps and pipelines can be disregarded; (iii) the fluid’s physical properties remain constant, and variations in temperature and pressure are not taken into account. Pressure distribution along the pipeline is calculated assuming a steady-state process, and any effects of fluid transients in the pipeline are neglected.
2.1. Flow and Pressure
2.1.1. Conservation Equations
A positive flow,
, on an arc
means that it goes from
i to
j at time
, while a negative value of
stands for a flow of amount
from
j to
i. It is possible to allow only positive flow values and account for the directions with a binary variable. Since this is a network, the flow conservation constraint applies for each node
, the difference between the sum of the pipe flows entering and exiting is equal to the water demand
at the node at time
t. Assuming that the demand must be satisfied at every time, the linear conservation constraint for every node
i that is not a tank
S is:
Note that, for this problem, for the nodes where desalination plants are, the water flow demand is negative since it is a water input to the network. On the other hand, for mining site nodes, the demand is positive since it corresponds to the water output of the network. Finally, all the nodes in between that are not tanks have either a positive or a zero demand.
2.1.2. Flow Bounds
The absolute value of the flow is bounded due to the capacity of the arcs. This bound depends on the pipe’s cross-sectional area and the maximum linear velocity. Refs. [
12,
15,
42] emphasise that this parameter must not exceed a specific value to avoid a number of potential operating problems, for instance, the flow-assisted corrosion problem. Therefore, taking into account
, for the maximum linear velocity that is allowed in a pipe
at time
t, the maximum flow can be written [
42] as
Then, the flow bounds are:
where
is the diameter of the pipe
.
Note that, since we are working with a directed graph, the lower bound is zero:
2.1.3. Pressure
For the hydraulic head,
,
is the pressure value expressed dimensionally as a length in columns of water (m). In fluid dynamics, the hydraulic head is the total energy per unit weight of fluid and is the sum of the elevation head,
, which is the altitude of the node
i,
, the pressure in the terminal node,
j, and the pressure loss,
, in the pipeline or pump due to friction. The hydraulic head,
, and pressure loss,
, for pipes and pumps are explained in the following section. For the WSSs tested in this work, the pressure in the terminal node
is 0 m, under the assumption that every node receiving water has a storage tank exposed to the environment [
50].
The hydraulic head must stay between certain bounds to guarantee the nodes’ minimum and maximum pressure levels. Normally, the node potentials are fixed at source nodes, as in the desalination plants in this work, reflecting the fact that, at sources, water is not pressurised, but it exploits a fixed geographical height [
12]. For all the other nodes, the lower bounds for the hydraulic head are:
The bounds of the difference of the hydraulic head for pipes, pumps, and tanks are explained in the following sections.
2.2. Pipes
Energy Loss in Pipes
The arcs in a WSS represent pipes in which water is transported from one node to another. In models that do not have stationary status, the flow changes at the beginning and end of a pipe [
36]. However, the flow is constant throughout the pipe since we are working with a quasi-stationary network. The fundamental equation for a pipe
is the head-loss equation, also denominated potential-flow coupling constraint in [
40], that is regularly of the form
where
is a strictly increasing uneven function, concave on the negative half-axis of its domain and convex on the positive half-axis. The flow is not linear in arcs due to the friction modelling in the pipes. A positive flow as a function of the potential difference is strictly increasing but concave: higher flow values mean a higher influence of friction. The other way round, for the same reason, a positive potential loss as a function of the flow is strictly increasing and convex. Equation (
7) is also referred to as the potential-loss equation because it describes the pressure loss along a pipe.
Explicit forms of the head-loss equation are called the Darcy–Weisbach equation,
or the Hazen–Williams equation,
Both formulations include constants like the gravitational acceleration, g, the pipe length, , and the pipe material, , roughness coefficient. The friction factor depends on the Reynolds number , which in turn depends on the flow in a nonlinear and continuous manner.
The friction coefficient
in (
8) is determined by the nature of the flow, as characterised by the value of the non-dimensional Reynolds number:
where
denotes the kinematic viscosity of water (
m
2/s for 10 ºC, and
m
2/s for 20 ºC) and
is the average water velocity.
For laminar flow (
), the friction coefficient depends on the Reynolds number only, according to the law of Hagen–Poiseuille,
Note that the pressure loss, in this case, grows linearly with the flow rate,
Since the graph studied in this work is directed, i.e.,
, the
is set to 1:
where
f is the Darcy friction factor.
Note that if the final node j is a tank, then includes the tank height.
For future work, additional analysis could be incorporated, such as examining the impact of rust and deposits that may disrupt water flow. This effect could be investigated either as an energy loss due to turbulence within the constraints or by introducing a pipe maintenance cost penalty in the objective function.
2.3. Pumps
In pressurised networks, like the one we are working on in this paper, water flows from points of high to low pressure. Hence, increasing the pressure at certain parts of the network is necessary. For this purpose, pumps are used to raise the pressure inside a water supply network. To represent the status of the pumps, we introduce a binary variable,
, which indicates if pump
is active or shut down at time
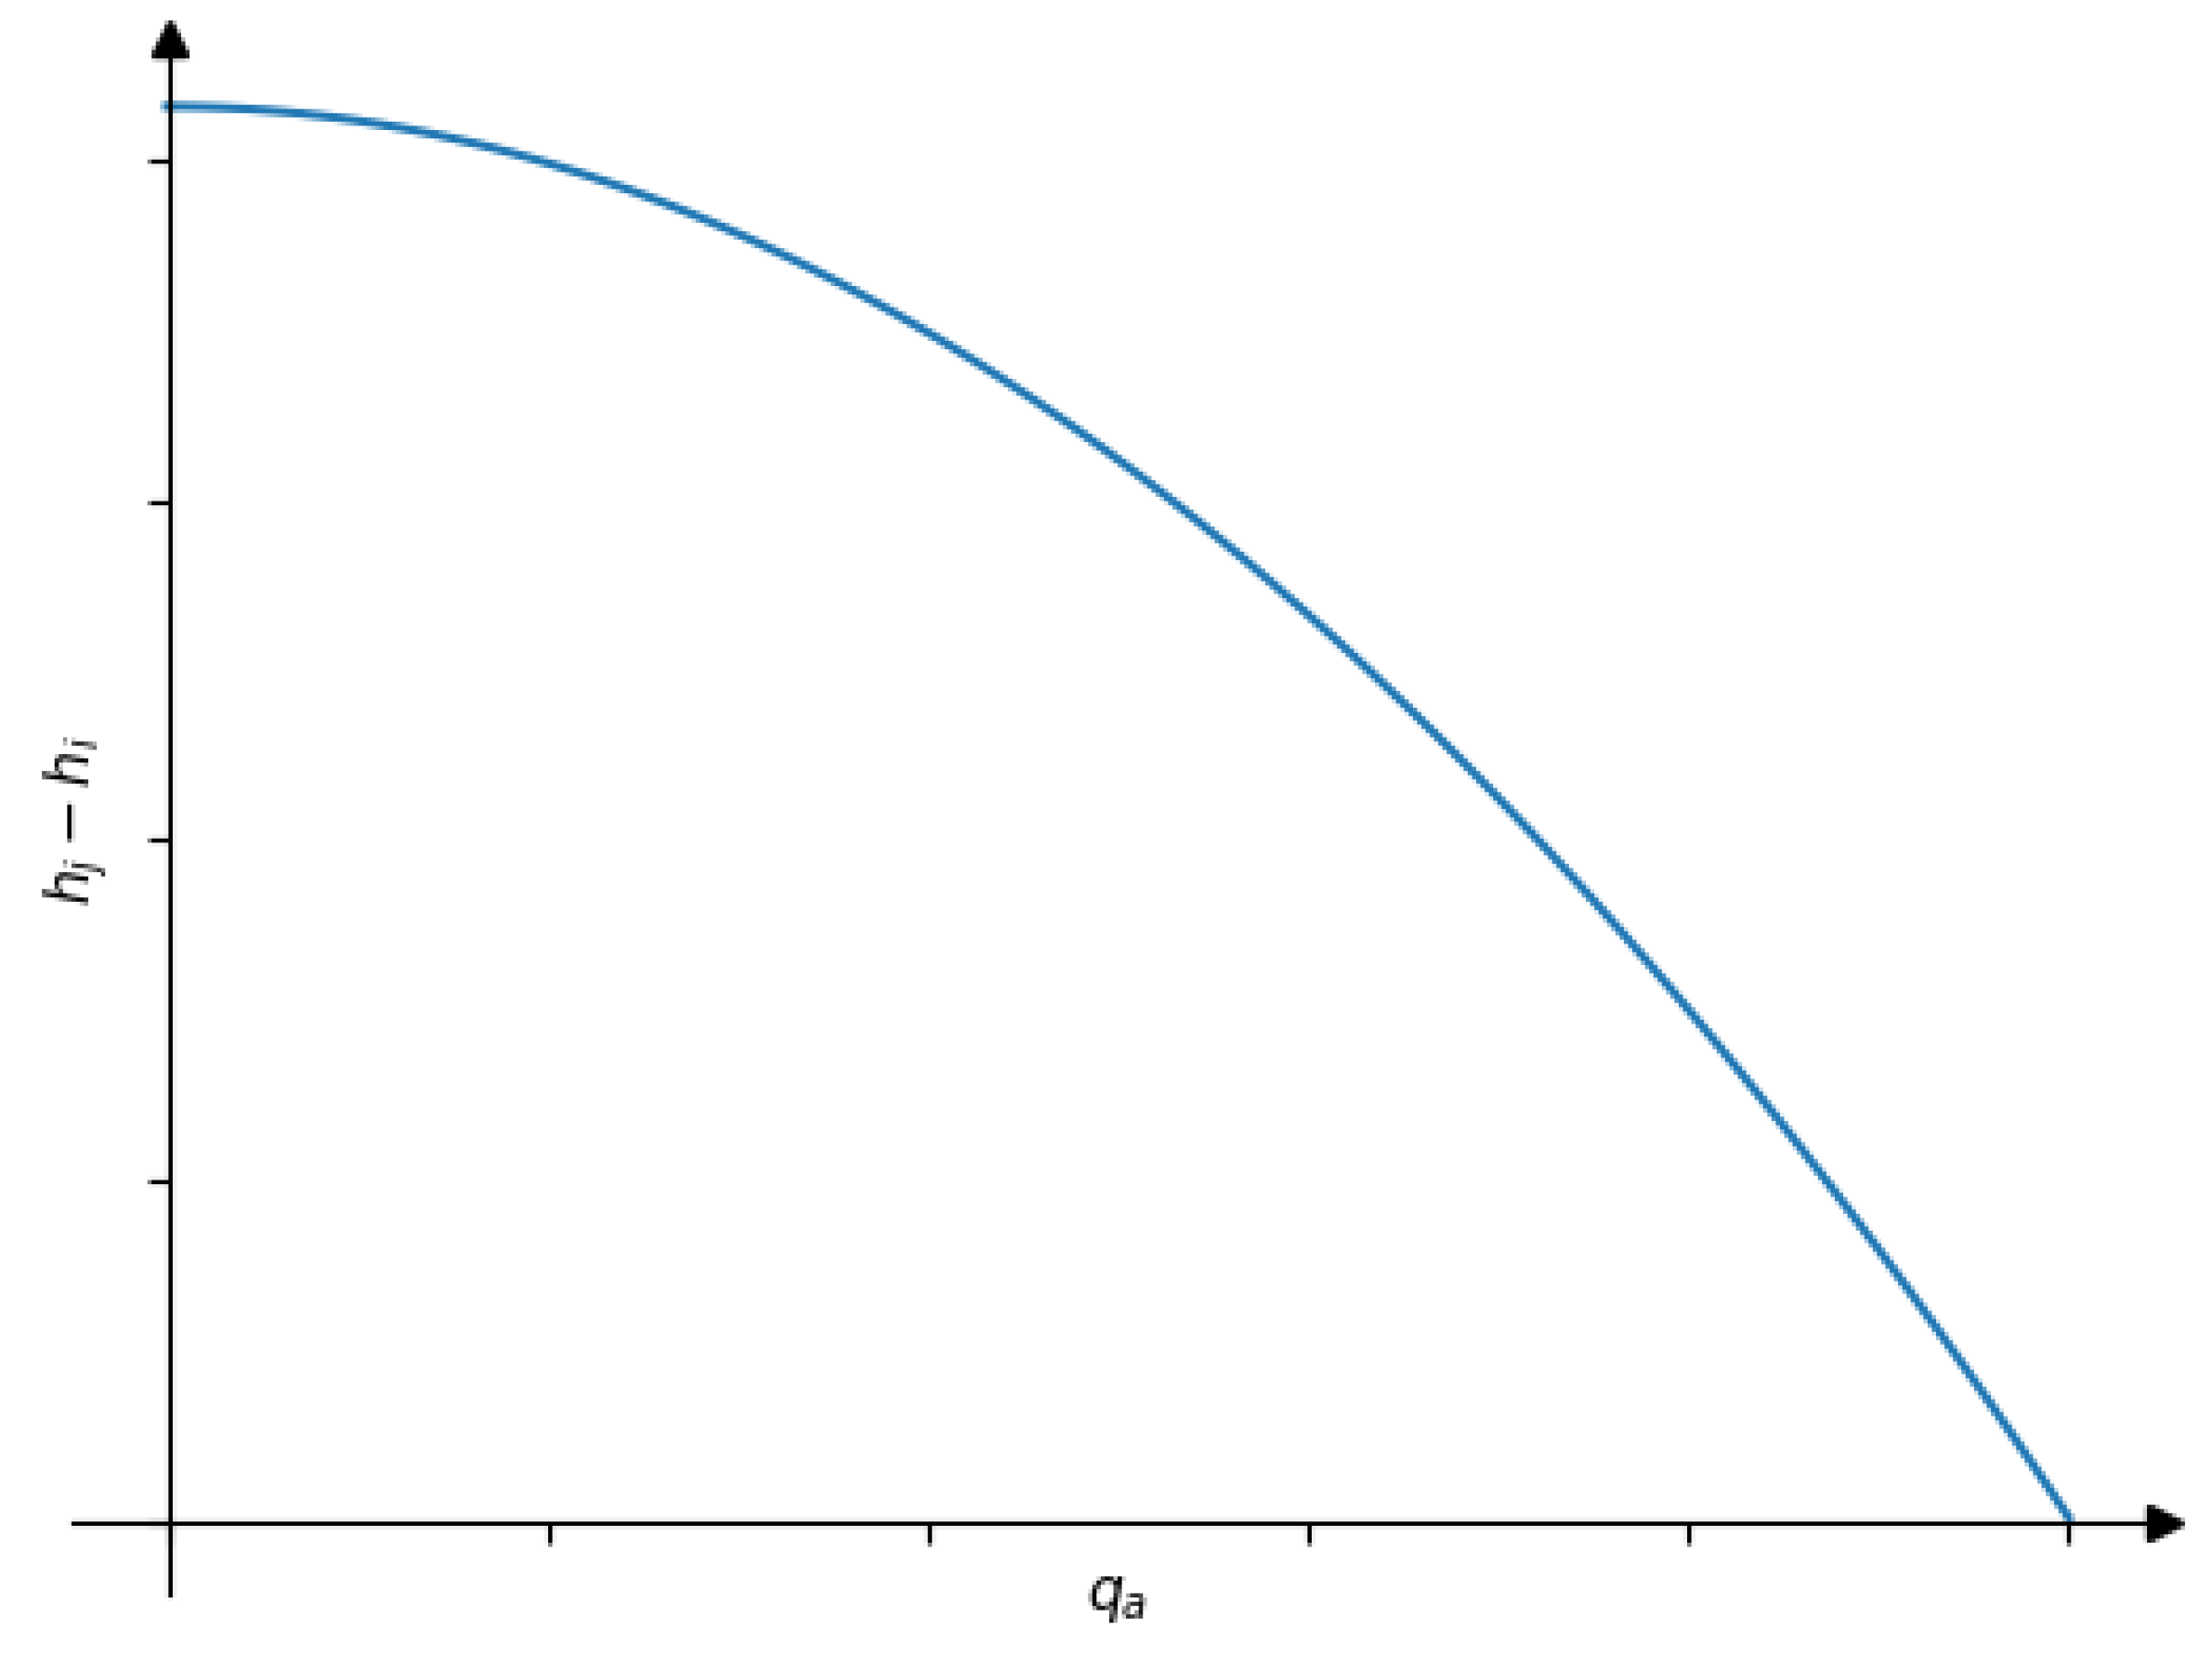
. Active pumps increase the hydraulic head by some controlled non-negative amount, as represented by the characteristic pump curve (
Figure 3):
where
is the maximum possible pressure increase of the pump (
), and
and
are pump-specific efficiency parameters [
36].
2.3.1. Energy Loss in Pumps
As pumps behave like pipes regarding the energy loss and since the graph studied in this work is a DAG, i.e.,
, and
indicates the state of the water pump, then the Darcy–Weisback equation and the linear Equation (
14) with
are:
where
f is the Darcy friction factor and
and
[
36].
Normally, Equation (15b) is one of the most common approaches used for the pump head loss. It is derived from (
14) with the quadratic term
. However, the coefficient in front of the quadratic term is usually small and negative [
51]. Therefore, as in [
48,
52], we neglect the quadratic term since its contribution is small compared to the linear term, and we approximate the pump hydraulic function with energy loss as described in (15b).
Note that (
16) is the linking constraint between the binary variable
and the flow
, where if the water pump is shut down, that is
and
, the pressure difference
is arbitrary. The value of
is the minimal relevant non-zero flow. Therefore, a flow of less than
implies that the pump is inactive (
), and a positive flow of more than
makes the pump active (
).
2.3.2. Pump Power
For a pump with
being the combined efficiency of the pump and prime mover and
being the water density, its power consumption (MINLP) is a function of its head gain and water flow rate in MW:
2.4. Tanks
Tanks can make the operation of the network more flexible. In a dynamic setting, where the demand at consumer nodes can vary over time, water can be stored in a tank during a period of low demand and extracted from it to satisfy peak demands.
with
denoting the variable volumetric tank inflow,
being the cross-sectional area of the tank,
is a time scalar,
is the tank height,
is the initial and final percentage of the water tank level, and
is the minimum water tank level percentage during the operation. Equations (
18) and (
19) represent the water flow balance in a tank, which depends on its volume. To bound the maximum pressure measure in the altitude of the tanks, and since they do not allow water overflow and they are open, we need Equation (
20). Usually, Equation (
21) is used to set the minimum water level of a tank or reservoir during the pump scheduling operation, especially if the water operator requires a conservative volume reserved in the tank or reservoir to supply the industry in case of an energy shortage or any event that would stop the water supply for a few hours or days. Industries normally require this constraint because the cost of stopping their operation due to water shortage can cost millions every hour. Finally, Equation (
22) is used to set the initial value equal to the previous day’s final.
2.5. Reservoirs
As we explained before, the main difference between tanks and reservoirs is that tanks allow bidirectional flow, whereas reservoirs model the water supply source. Without loss of generality, we assume that reservoirs are infinite sources of water and that the pressure head at each reservoir,
, is zero; in other words, the total head at the reservoir, r, only represents the elevation head [
39]. Normally, reservoirs are fed by natural sources, like rivers or glaciers; therefore, it is assumed that they have an infinite supply. In this work, the “reservoirs” are, in fact, big tanks since they are located next to the mining site and they are only supplied by the desalinated WSS. Hence, they allow bidirectional flow.
2.6. Objective Function
The objective function seeks to minimise the cost of operation and the on/off penalty of the water pumps. Let
X be the space of all the optimisation variables of the problem, and
h to adjust the 24 h cycle; therefore, the objective function is:
where
is the cost of electricity in having a pump on during time
t, and
is the penalty for a single pump switch. The value of
is based on recommendations by [
20], which consist of iterating over different values of
and picking one that is reasonable for the electricity prices and that allows the switching of the pumps. This is in case there is no data for the future pumping station maintenance costs.
Note that pump switching can negatively affect a system’s maintenance cost due to the changing loads contributing to fatigue-related failures [
45]. Hence, penalising pump switching often reduces this negative impact and accounts for maintenance costs [
53,
54].
Another way to represent the pump maintenance penalty is by using a quadratic term instead of the absolute value:
[
55]. Both approaches are equivalent and nonlinear; however, the absolute value has fewer added constraints in the exact reformulation, which we explain in the next section.
2.7. Water Pump Scheduling Problem
Therefore, the optimisation model for the water pump scheduling problem is the following:
4. Computational Experiments
The three alternative models defined in
Section 3 were tested on three different and realistic high-altitude WSSs using the Gurobi 10 solver [
58] via Julia [
59]; the experiments were done using long and steep networks that send desalinated water from the sea level up to the mountains (more than 3000 m above sea level). For this work, it is assumed that the water production at the desalination plant and the mine site’s water demand are constant.
Table 1 summarises the main characteristics of the WSSs tested.
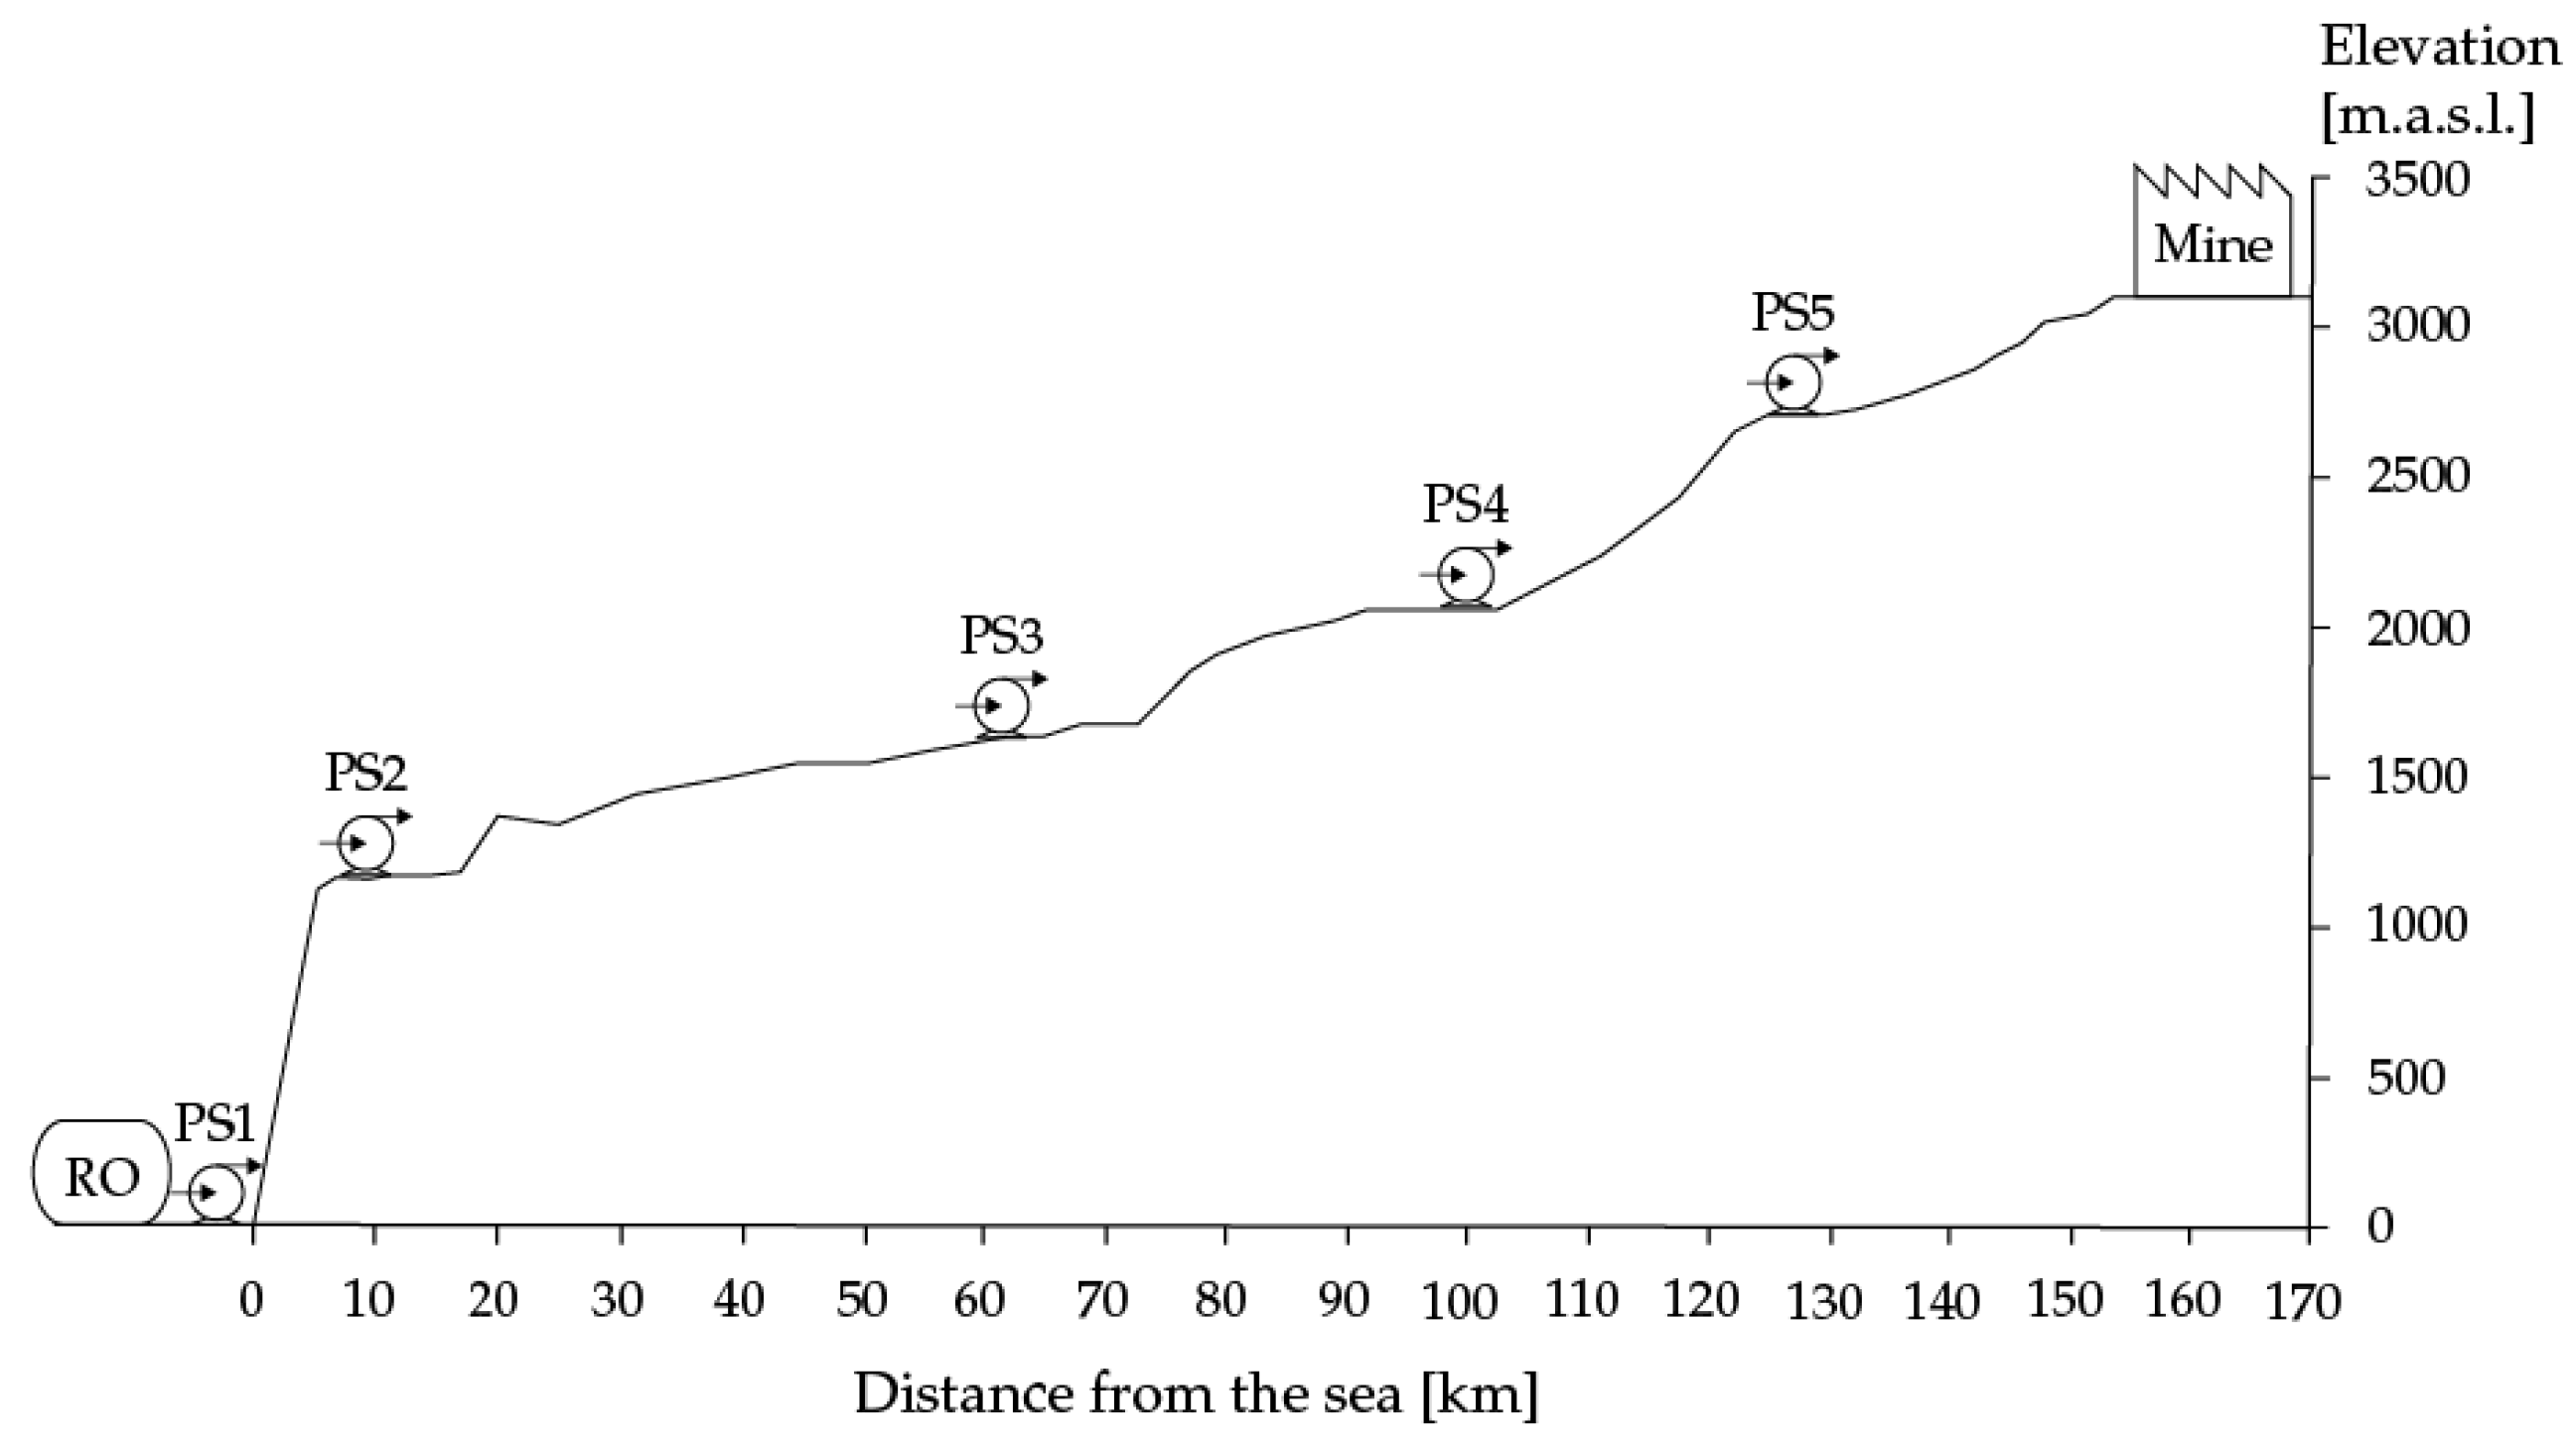
In
Figure 4, there is an example of a real WSS that pumps up desalinated water to a mine located at 3100 m.a.s.l. in the Chilean Atacama desert [
2]. This water network corresponds to the Small WSS tested, and it has one reverse osmosis desalination plant and five interconnected pumping stations, combined with a water pump and tank, one reservoir, and one mine, which has a water demand. The data for the nodes and arcs can be seen in
Table 2 and
Table 3.
Figure 2 shows a medium-size WSS proposed by [
50] to supply water to six mining sites. It has ten pumping stations and six reservoirs. The data for the nodes and arcs can be seen in
Table 4 and
Table 5.
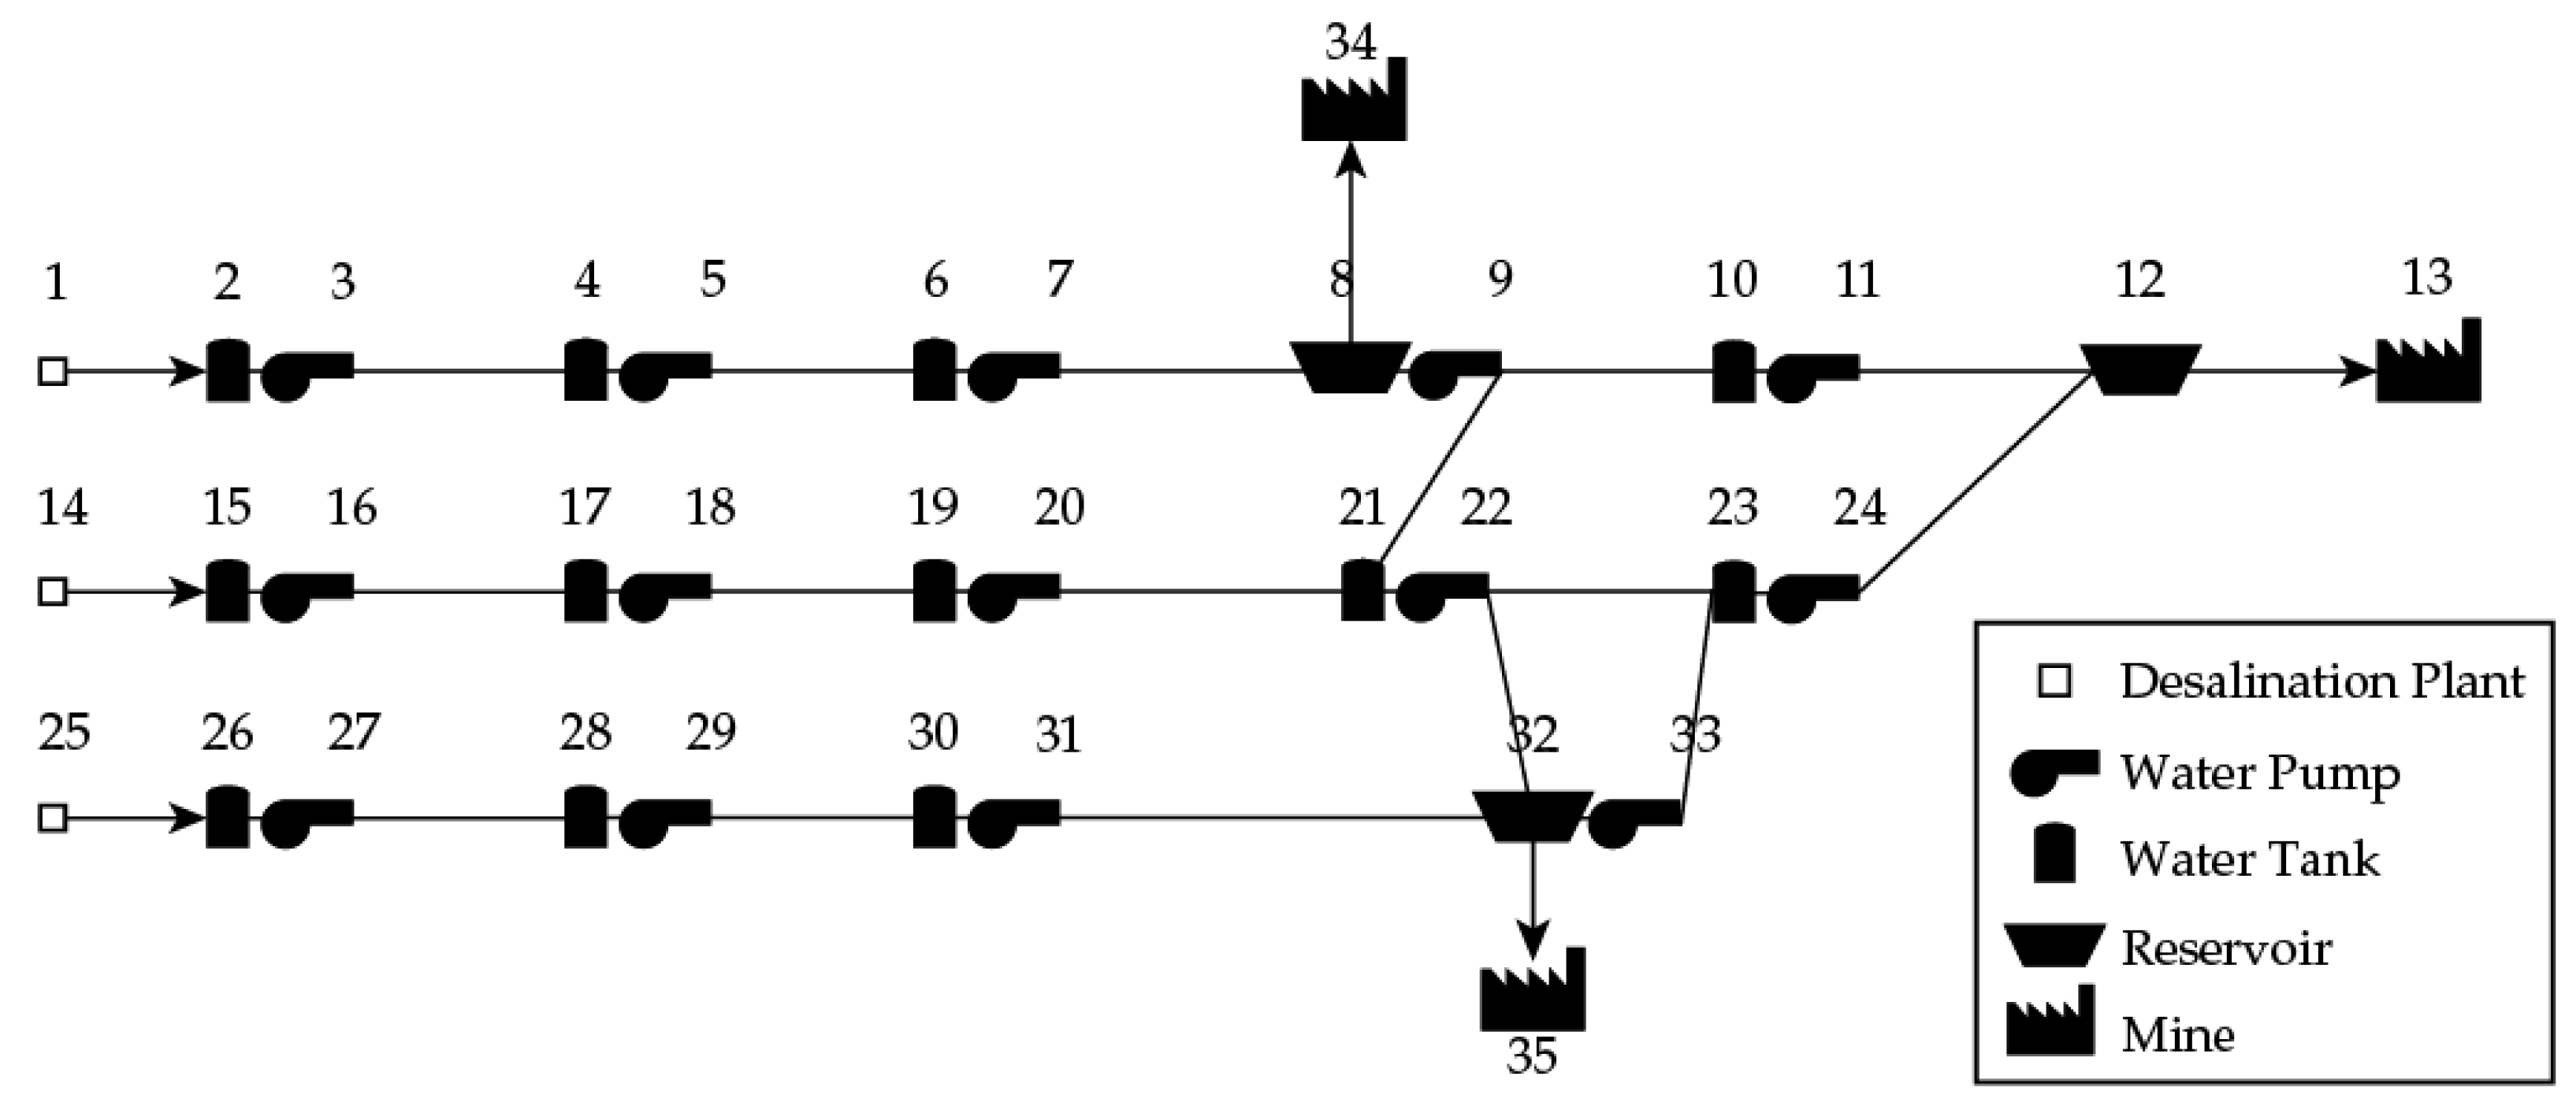
Finally, a bigger water network is considered using data from [
50], with fourteen pumping stations, one reservoir, and one mine, as seen in
Figure 5. The data for the Large WSS can be found in the
Table 6 and
Table 7.
The values of other parameters for the model were obtained from [
2]: water density,
{Kg/m
3, pump efficiency,
, pipe maximum speed,
m/s, pipe diameter,
m, Darcy friction factor,
, pump linear parameter,
, using the technique in [
48], and the minimum water tank level percentage,
, which depends on the industry; in this case,
from CODELCO, a copper mining company. Finally, the electricity prices were obtained from the Chilean national electrical operator.
For example,
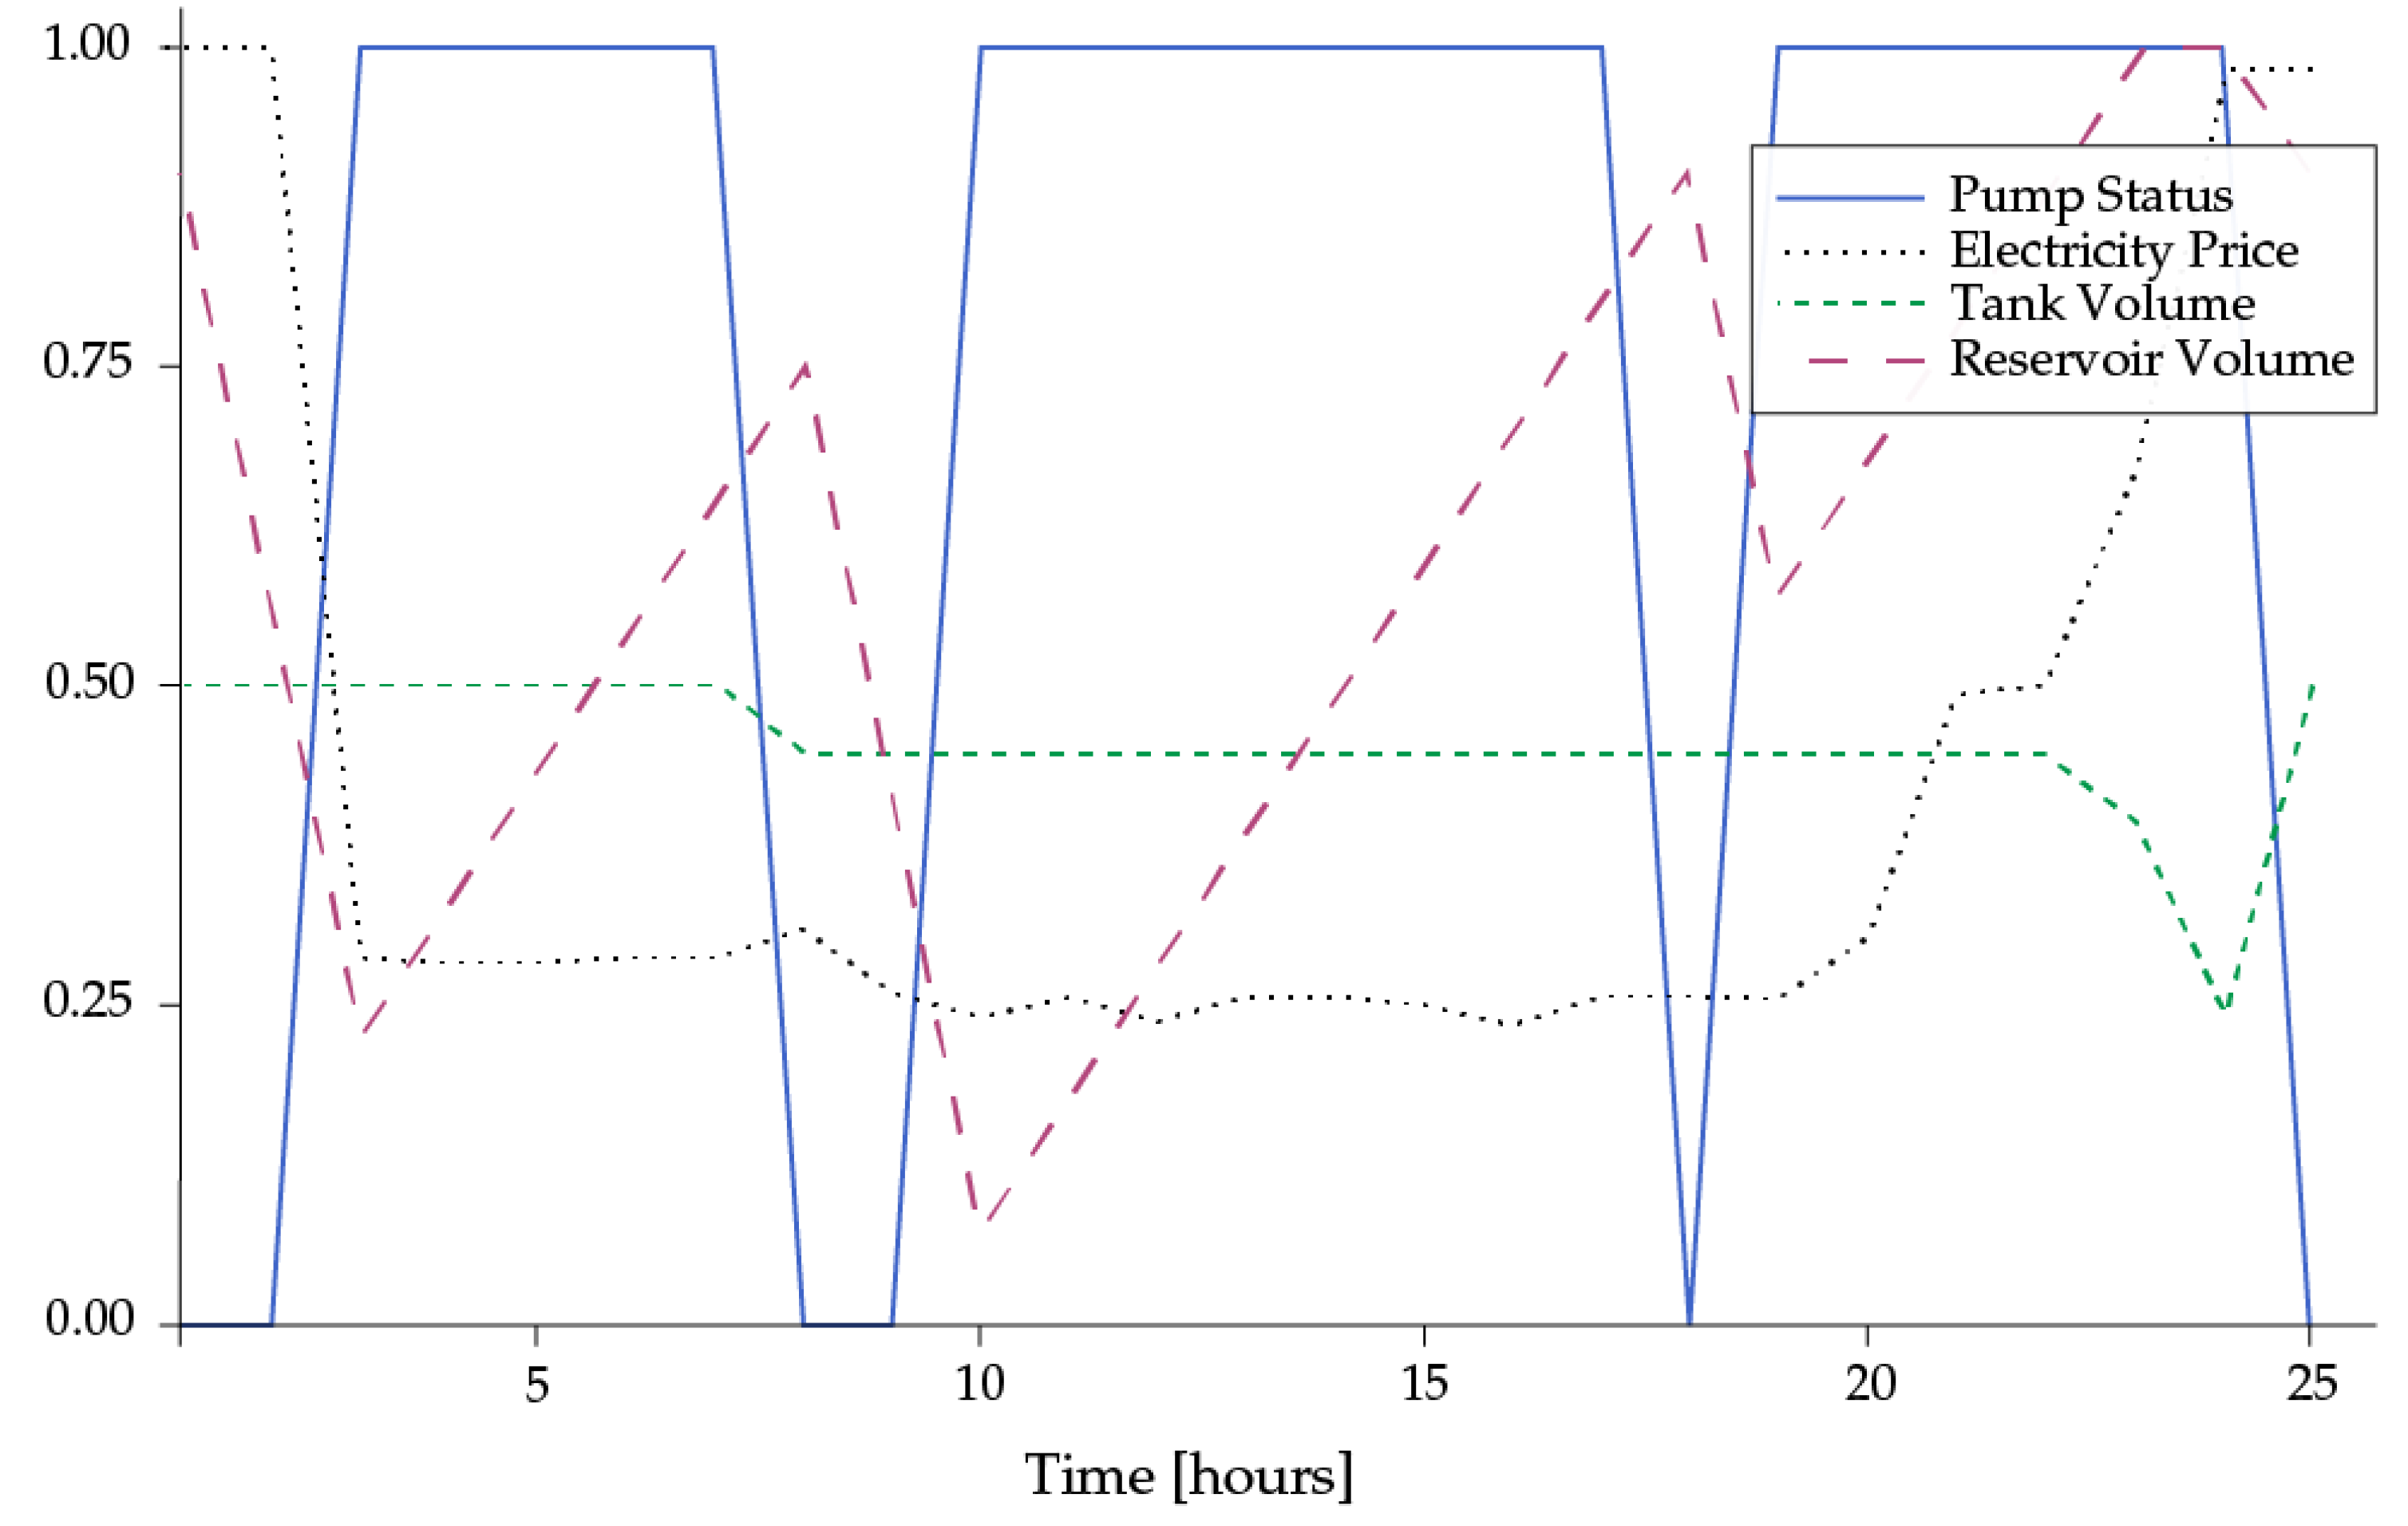
Figure 6 shows the expected normalised results for the water pump scheduling problem in a WSS with one pump. The operator of WSSs desires to know every hour which water pumps turn on or off, what the level of the water tanks is, how much energy is being used, and what the operation cost is. Additionally, if water demands change over time, the operator wants to know if hourly or daily water demand is being met; otherwise, the model information would have to be updated, and other policies would have to be taken in the following period. Note that the maximum number of time slots when the water pumps can be active is 125 for the Small WSS, 150 for the Medium WSS, and 325 for the Large WSS. It is 325 instead of 350 because there is one water pump that has never been activated due to the network design.
The following subsection presents the different computational experiments analysed to understand the efficiency of the proposed method and the key parameters and variables of the water pump scheduling problem.
4.1. Choosing the Appropriate Cost of Maintenance
As we explained in the section on the objective function, the pump switching can negatively affect the water system’s maintenance cost,
, due to the changing load contributing to fatigue-related failures [
45]. Following the recommendations of [
20], which consists of trying different values of
for a given vector of electricity prices,
, when the maintenance cost is unknown.
We analysed the
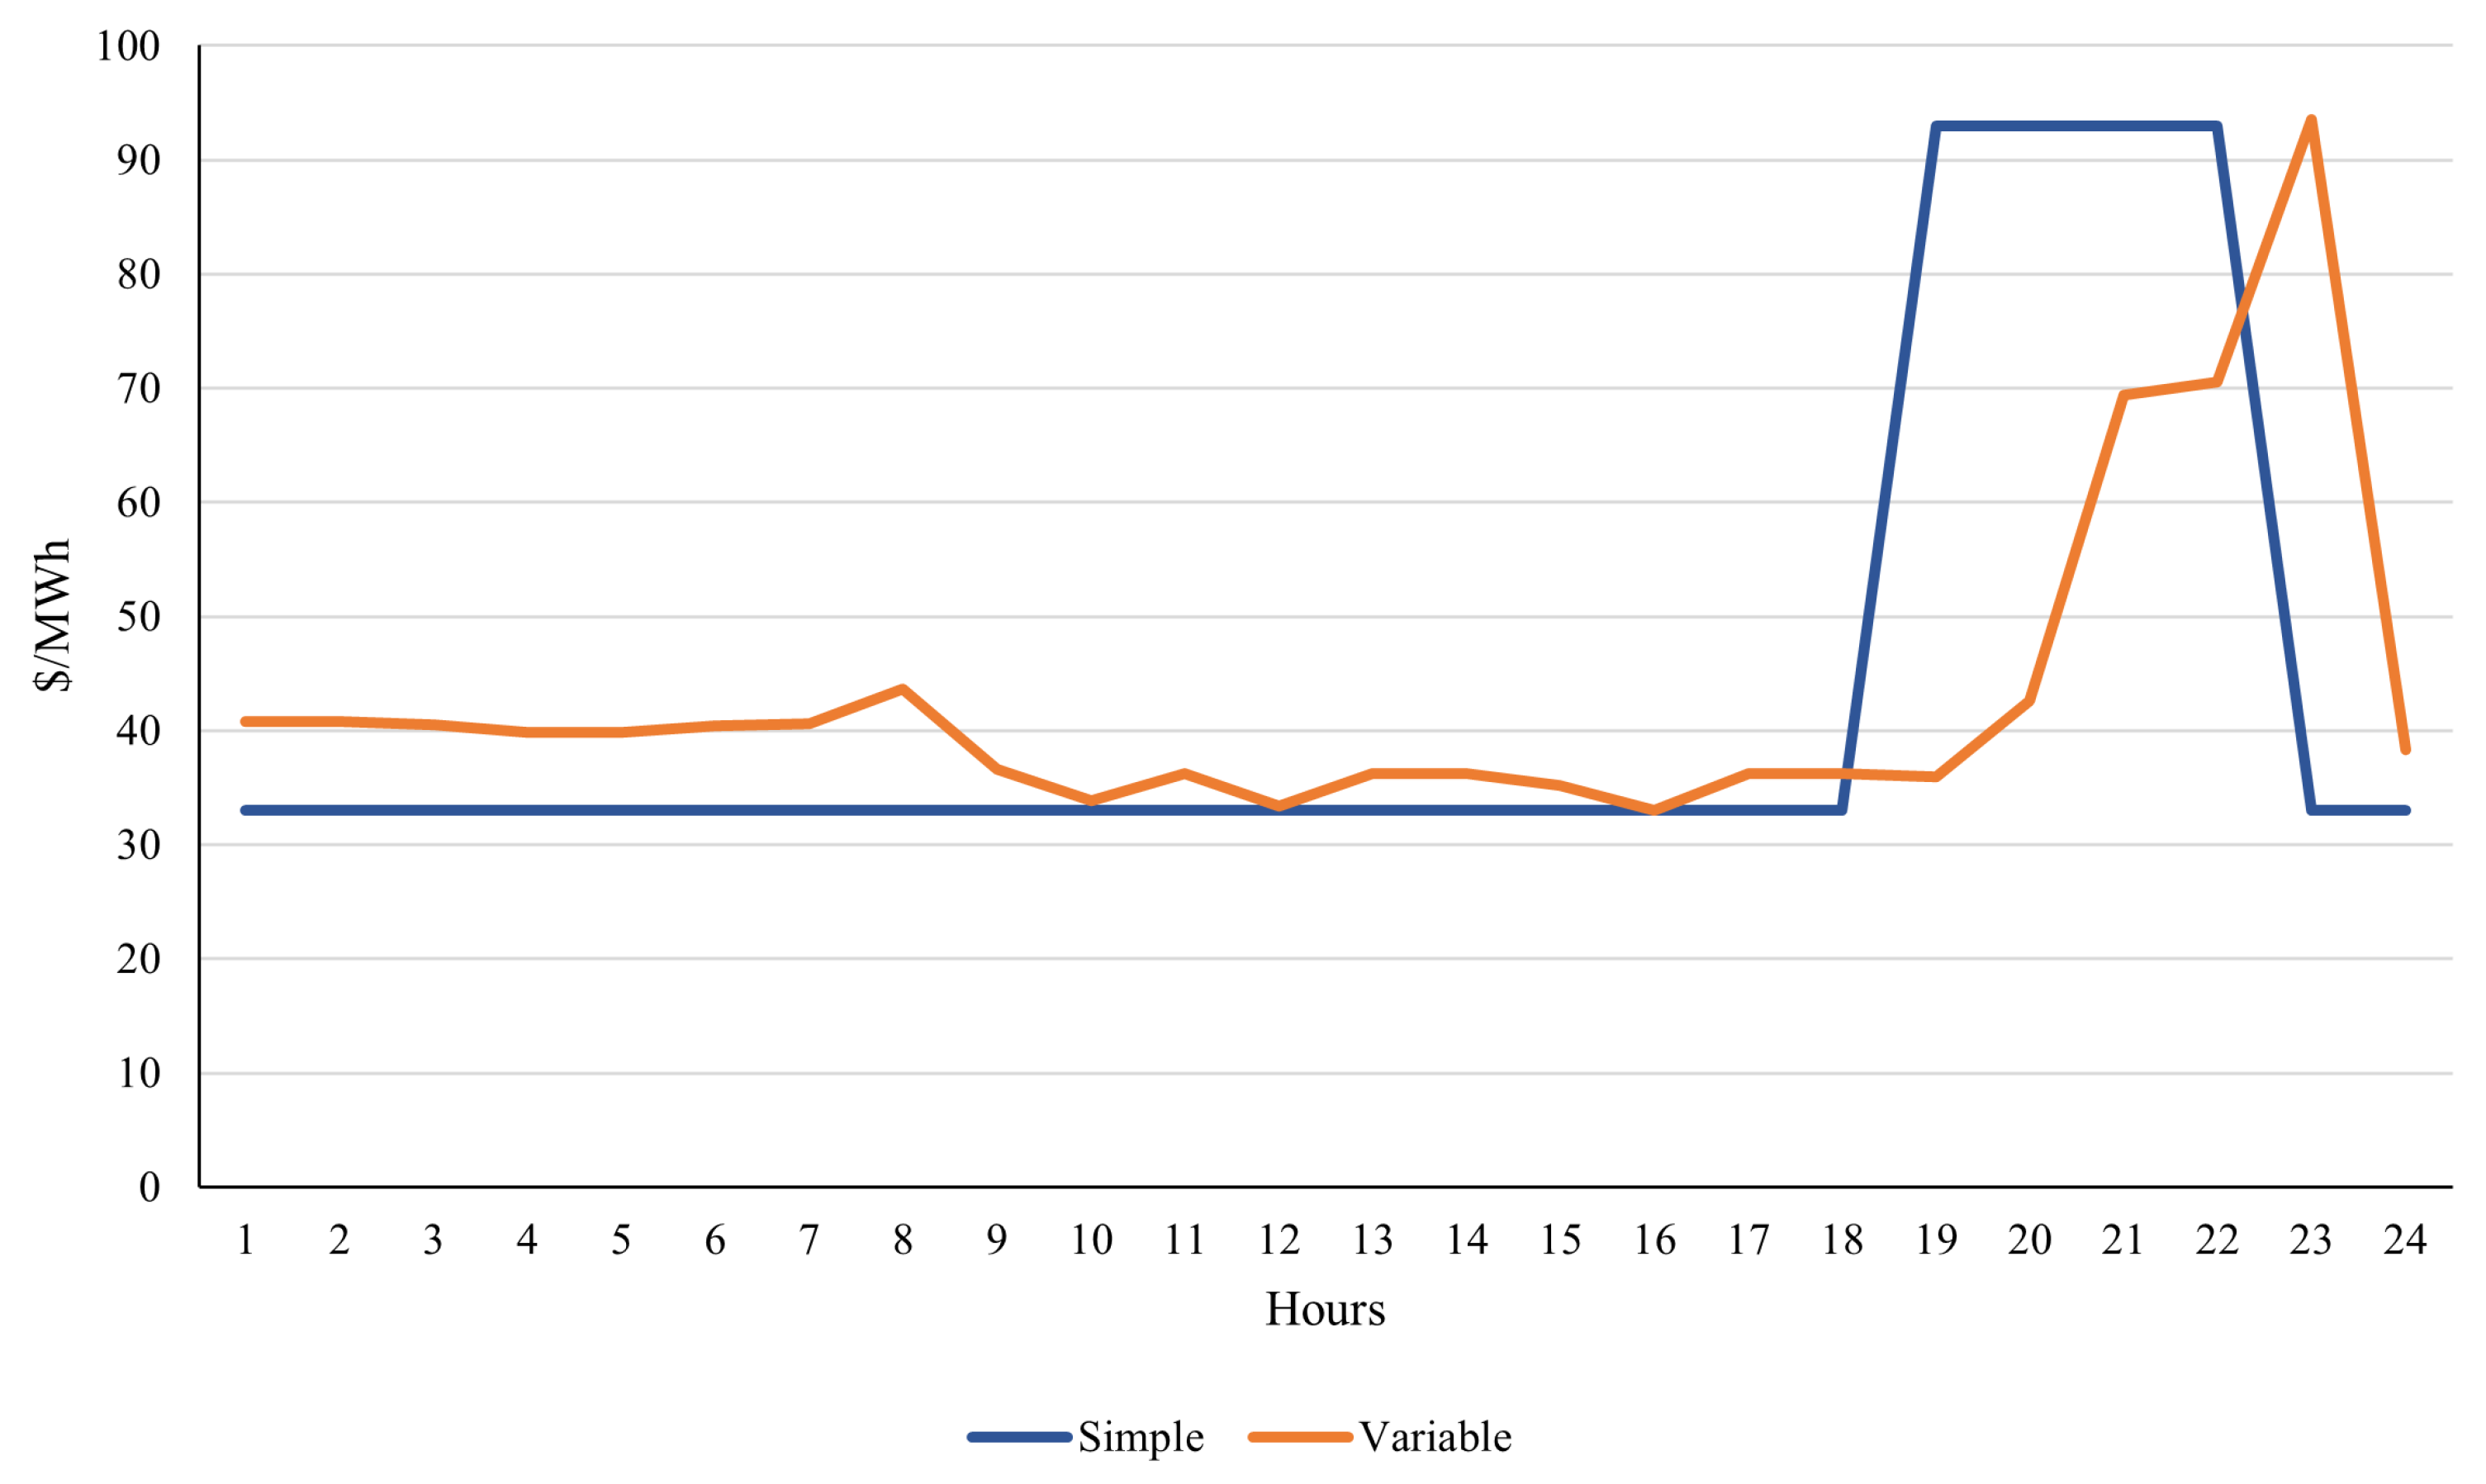
value for the Small, Medium, and Large WSSs using different electricity prices. For this purpose, we utilised two prices: the variable price was taken from the Chilean Electricity Coordinator from a summer day in 2021 in the Radomiro Tomic Electric Bus, and the simple price is a simplified representation of the previous cost, with only two values, one for peak and one for non-peak hours. We chose the values of the simple price, such that the mean and variance were similar to the variable price, and it is a reasonable structure since some markets work in a high/low price scheme. In
Figure 7 are shown the electricity prices for both the simple and the variable price.
Then, for each electricity price, we studied the impact of constraint (
21) using a 90% minimum water level of the reservoir in each hour. We chose this value because it provides enough flexibility to the water pumps to have more time slots to be off, but it is high enough so that the demand node is secured with a safe level of water. In the following sections, we analyse the study case for the Small WSS using a 95% minimum water level because the mining company is highly conservative with the amount of water they need. Otherwise, in a water pump supply failure scenario, the cost of loss for their mining operation is extremely expensive.
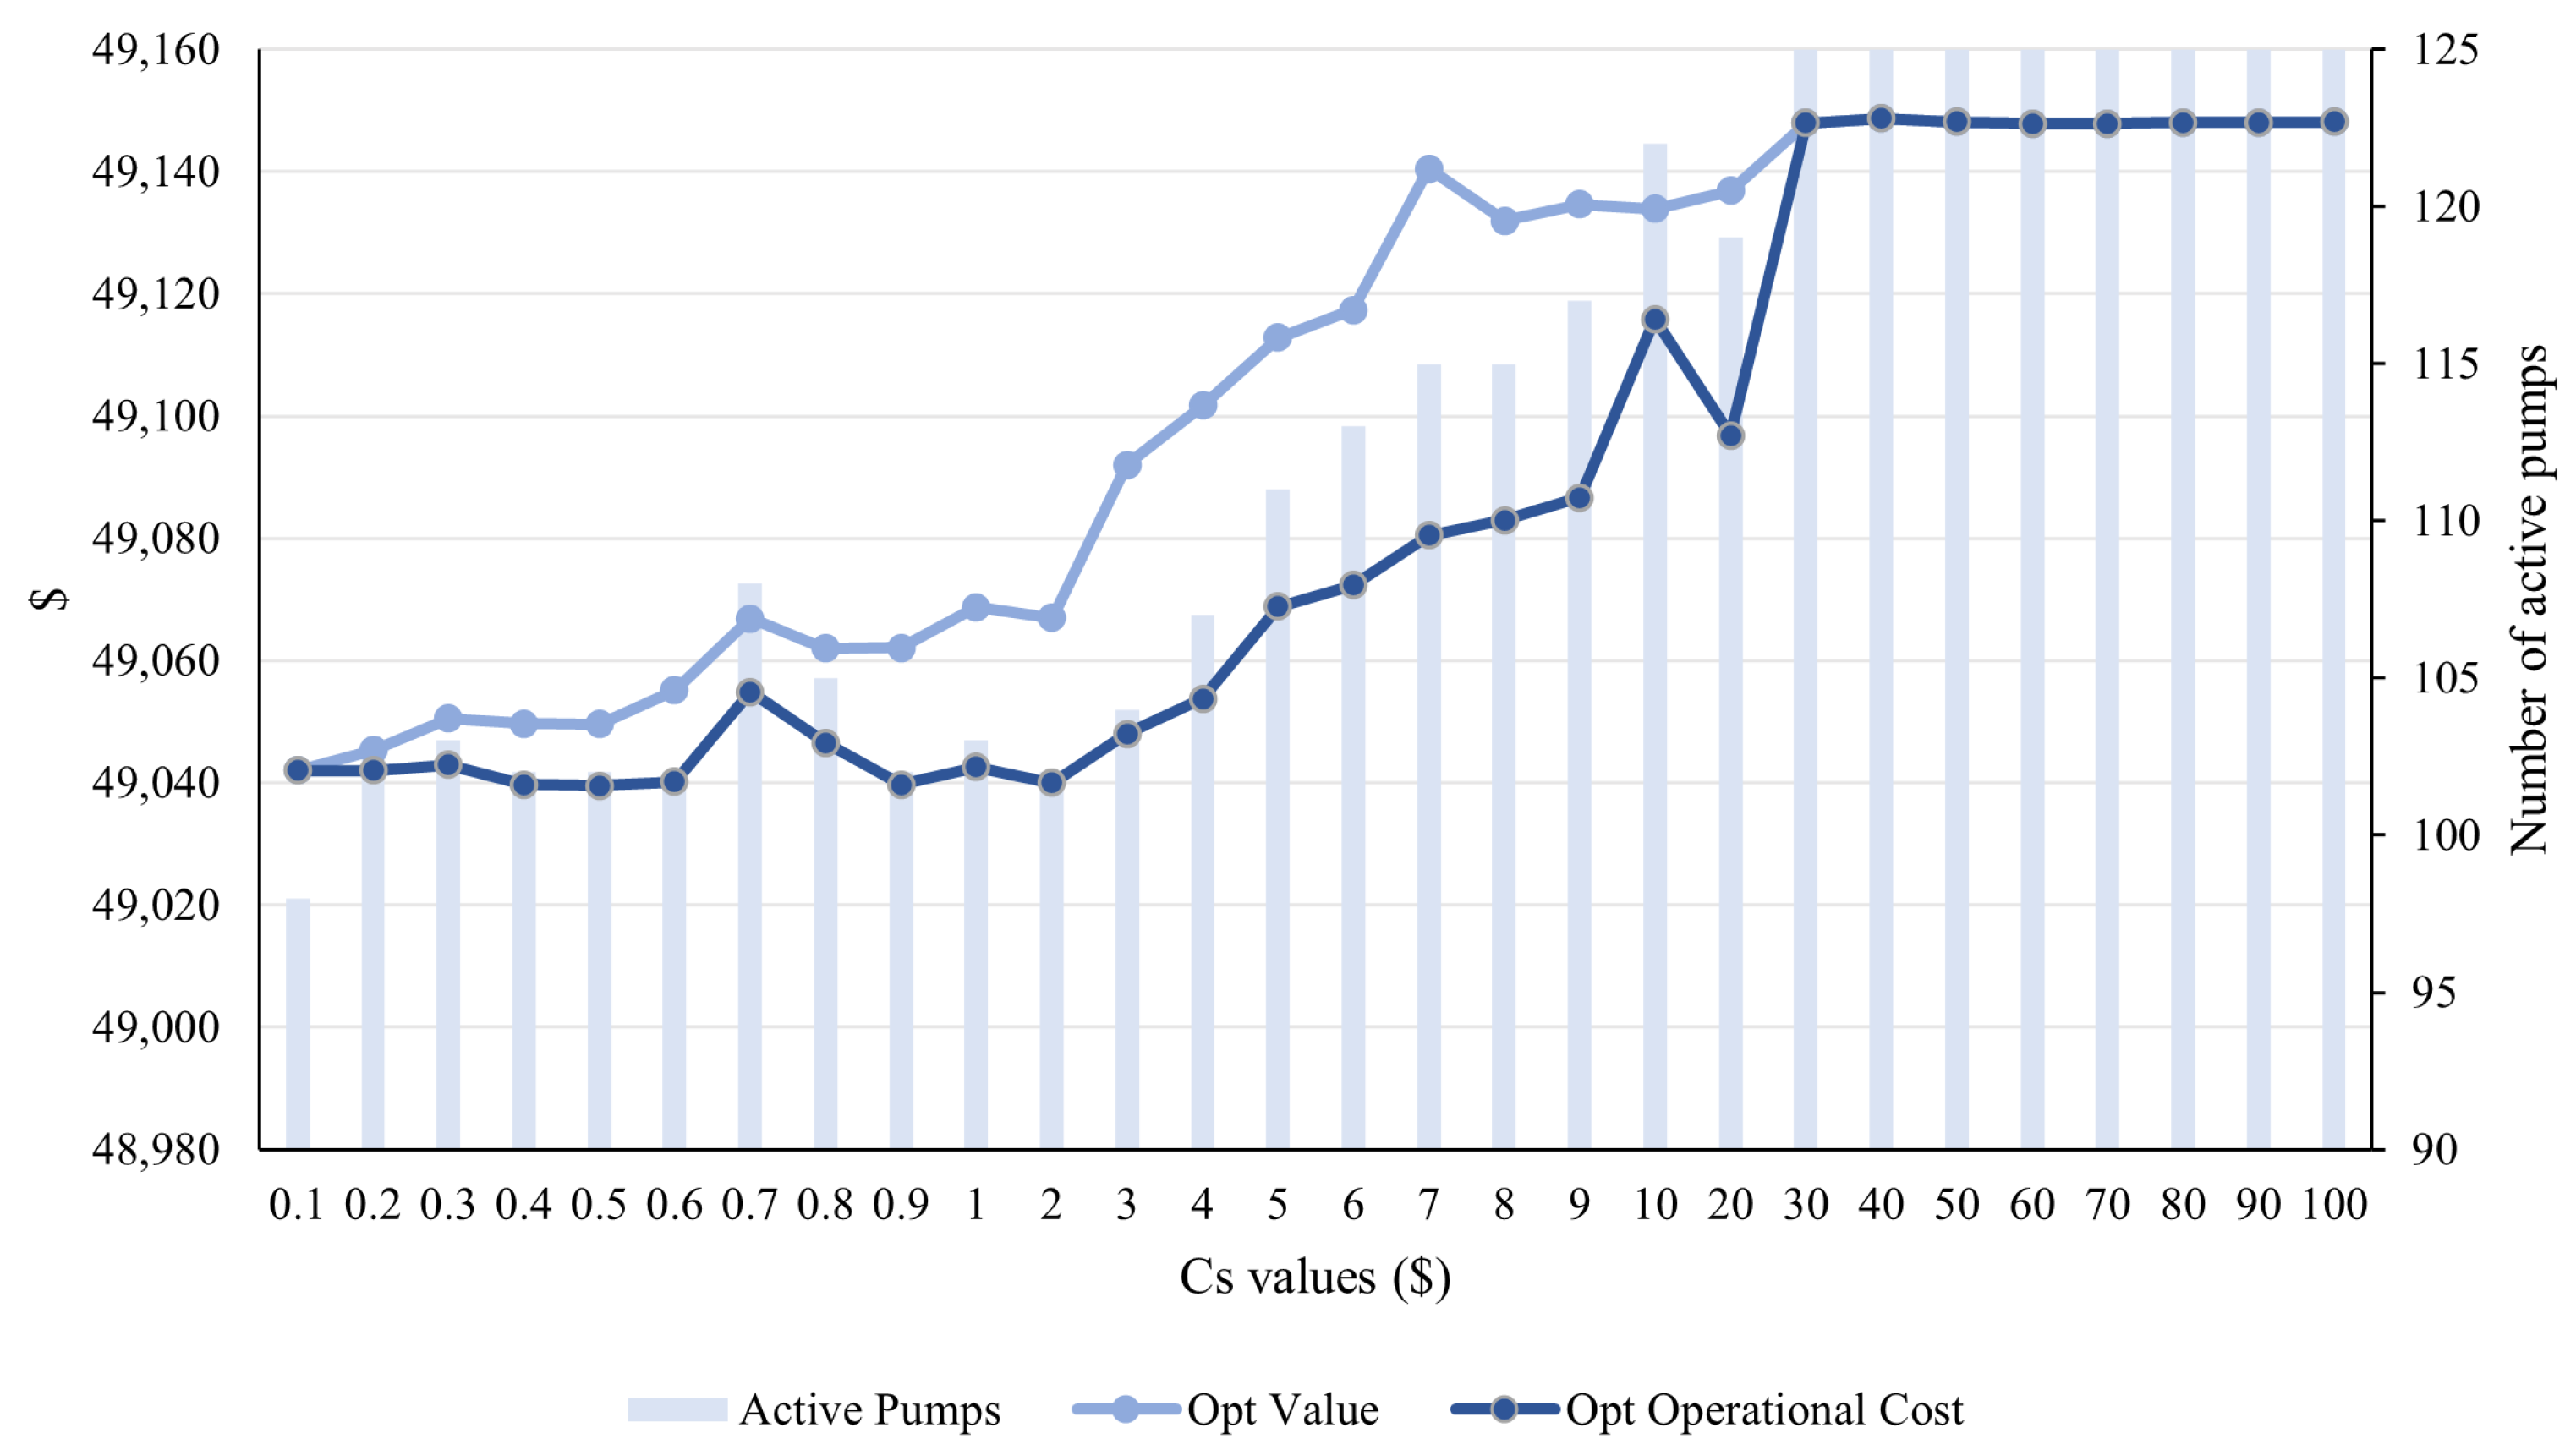
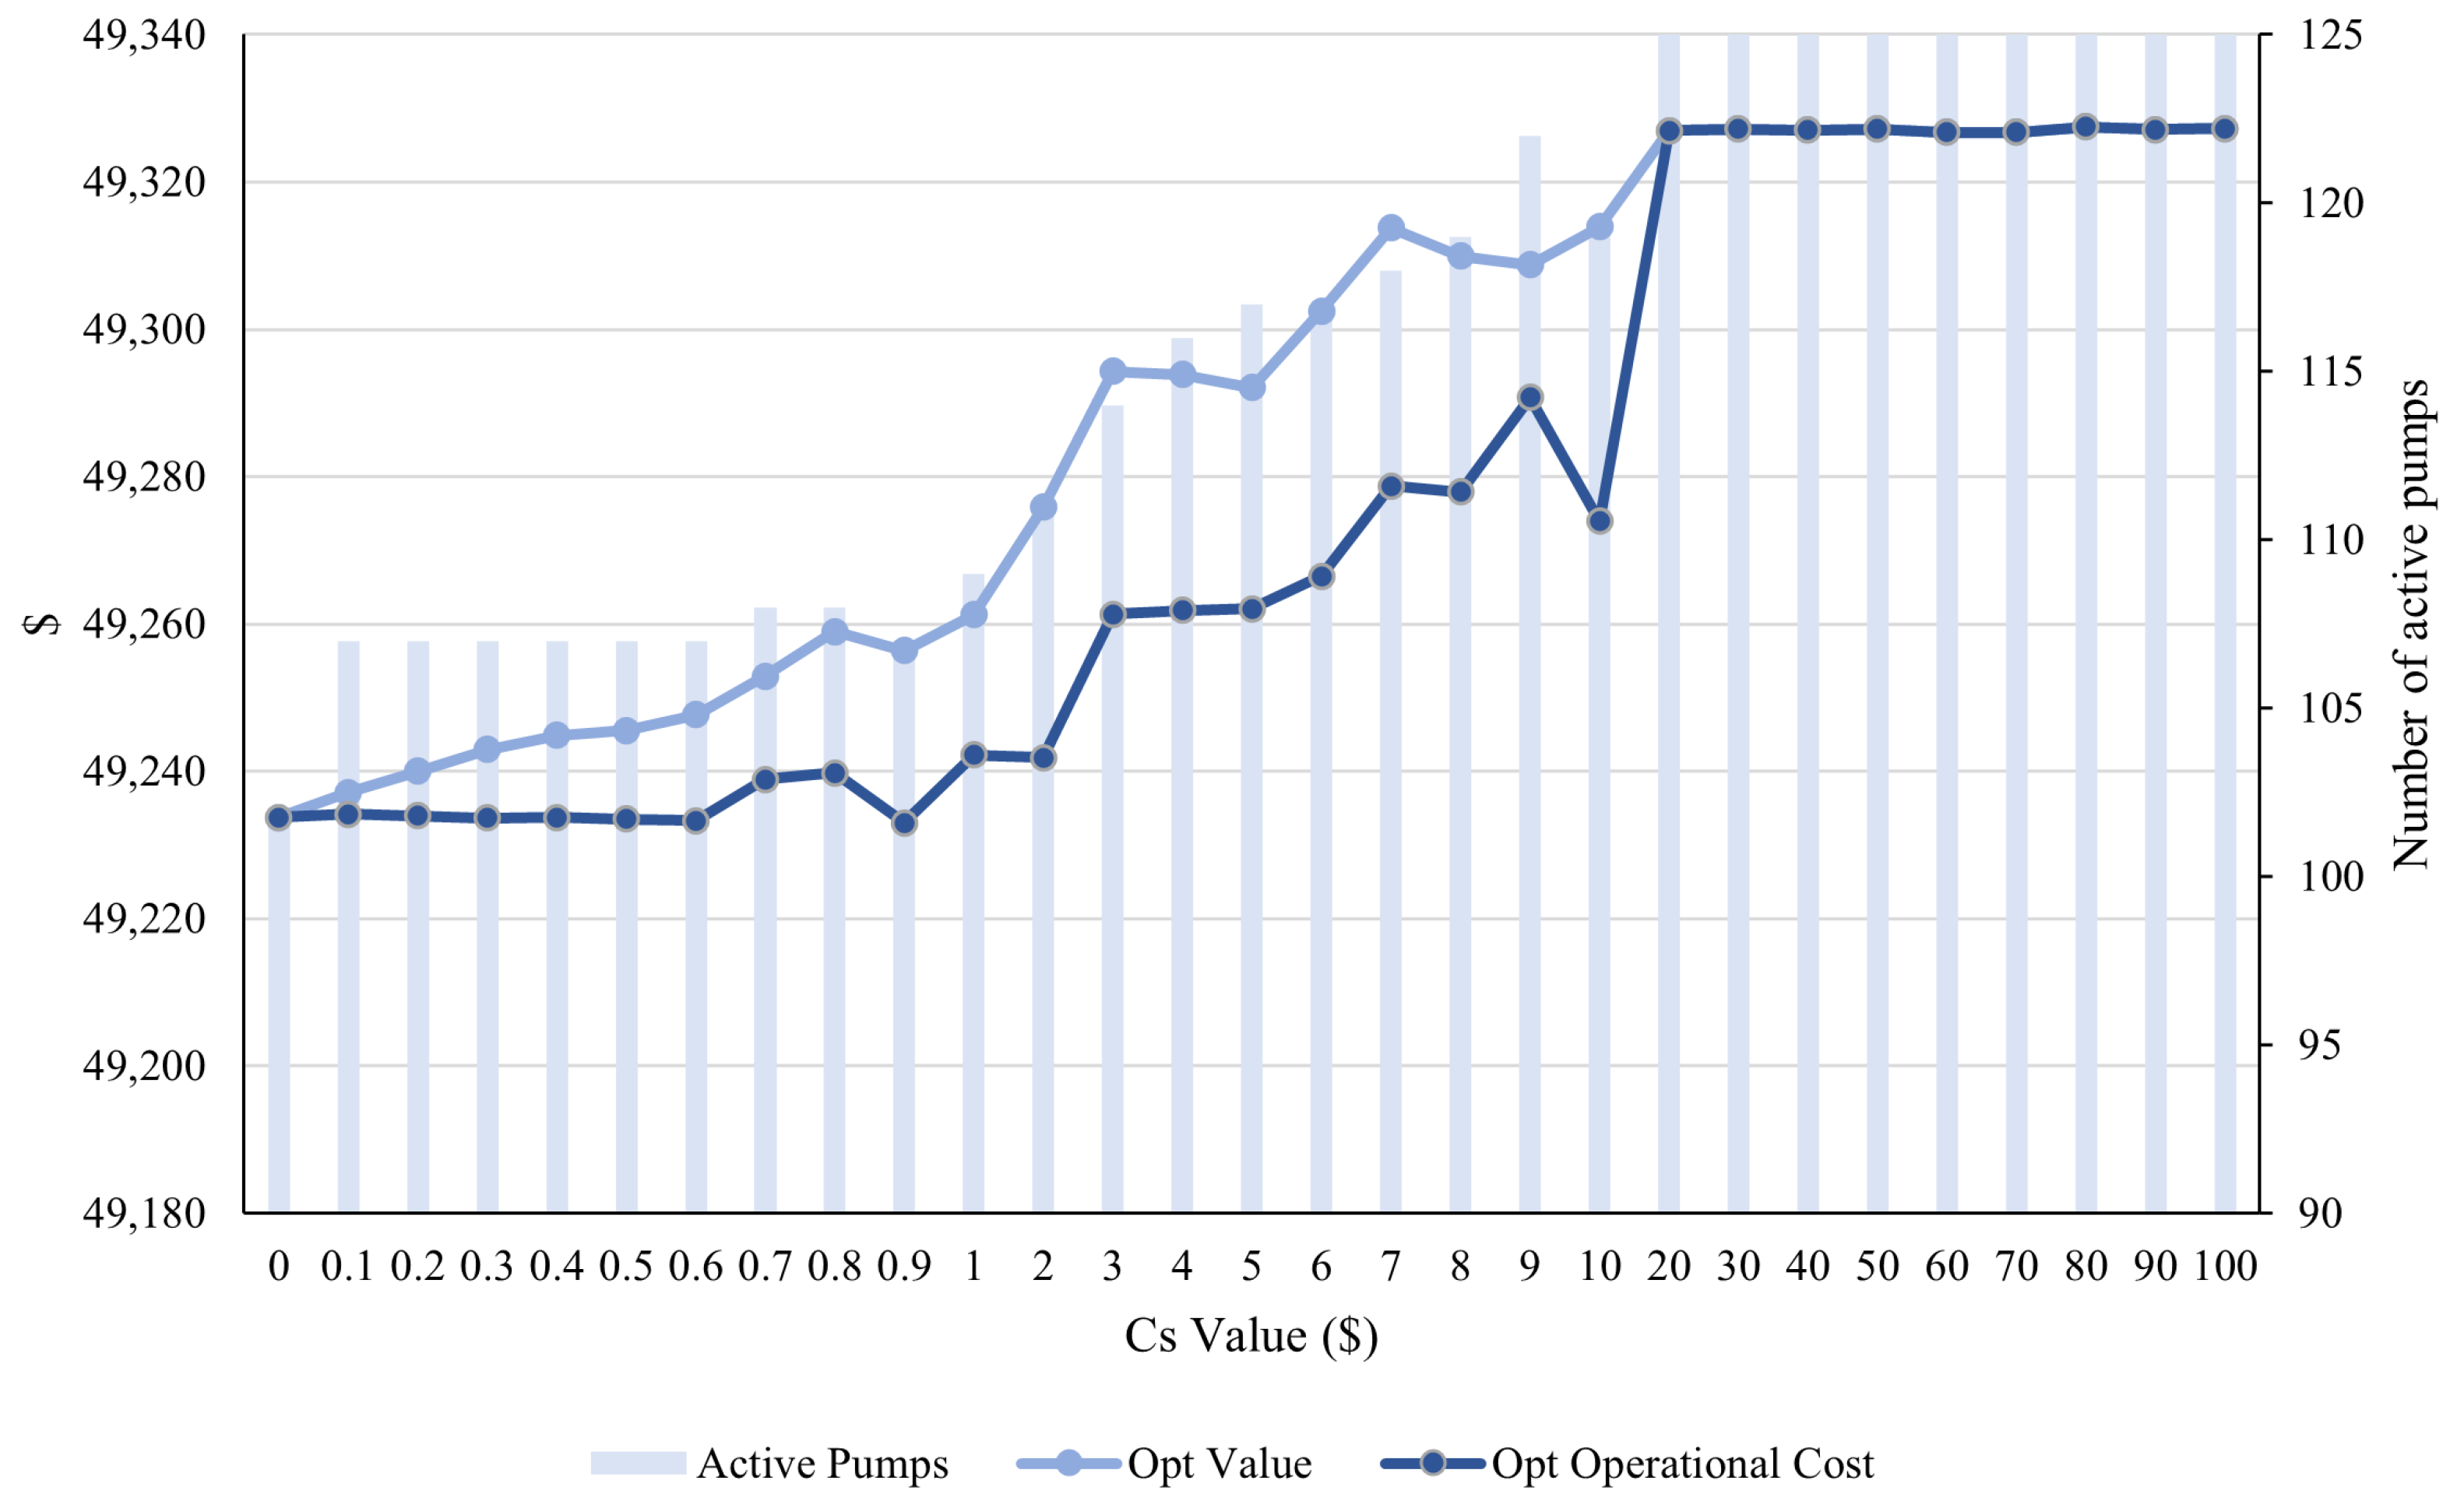
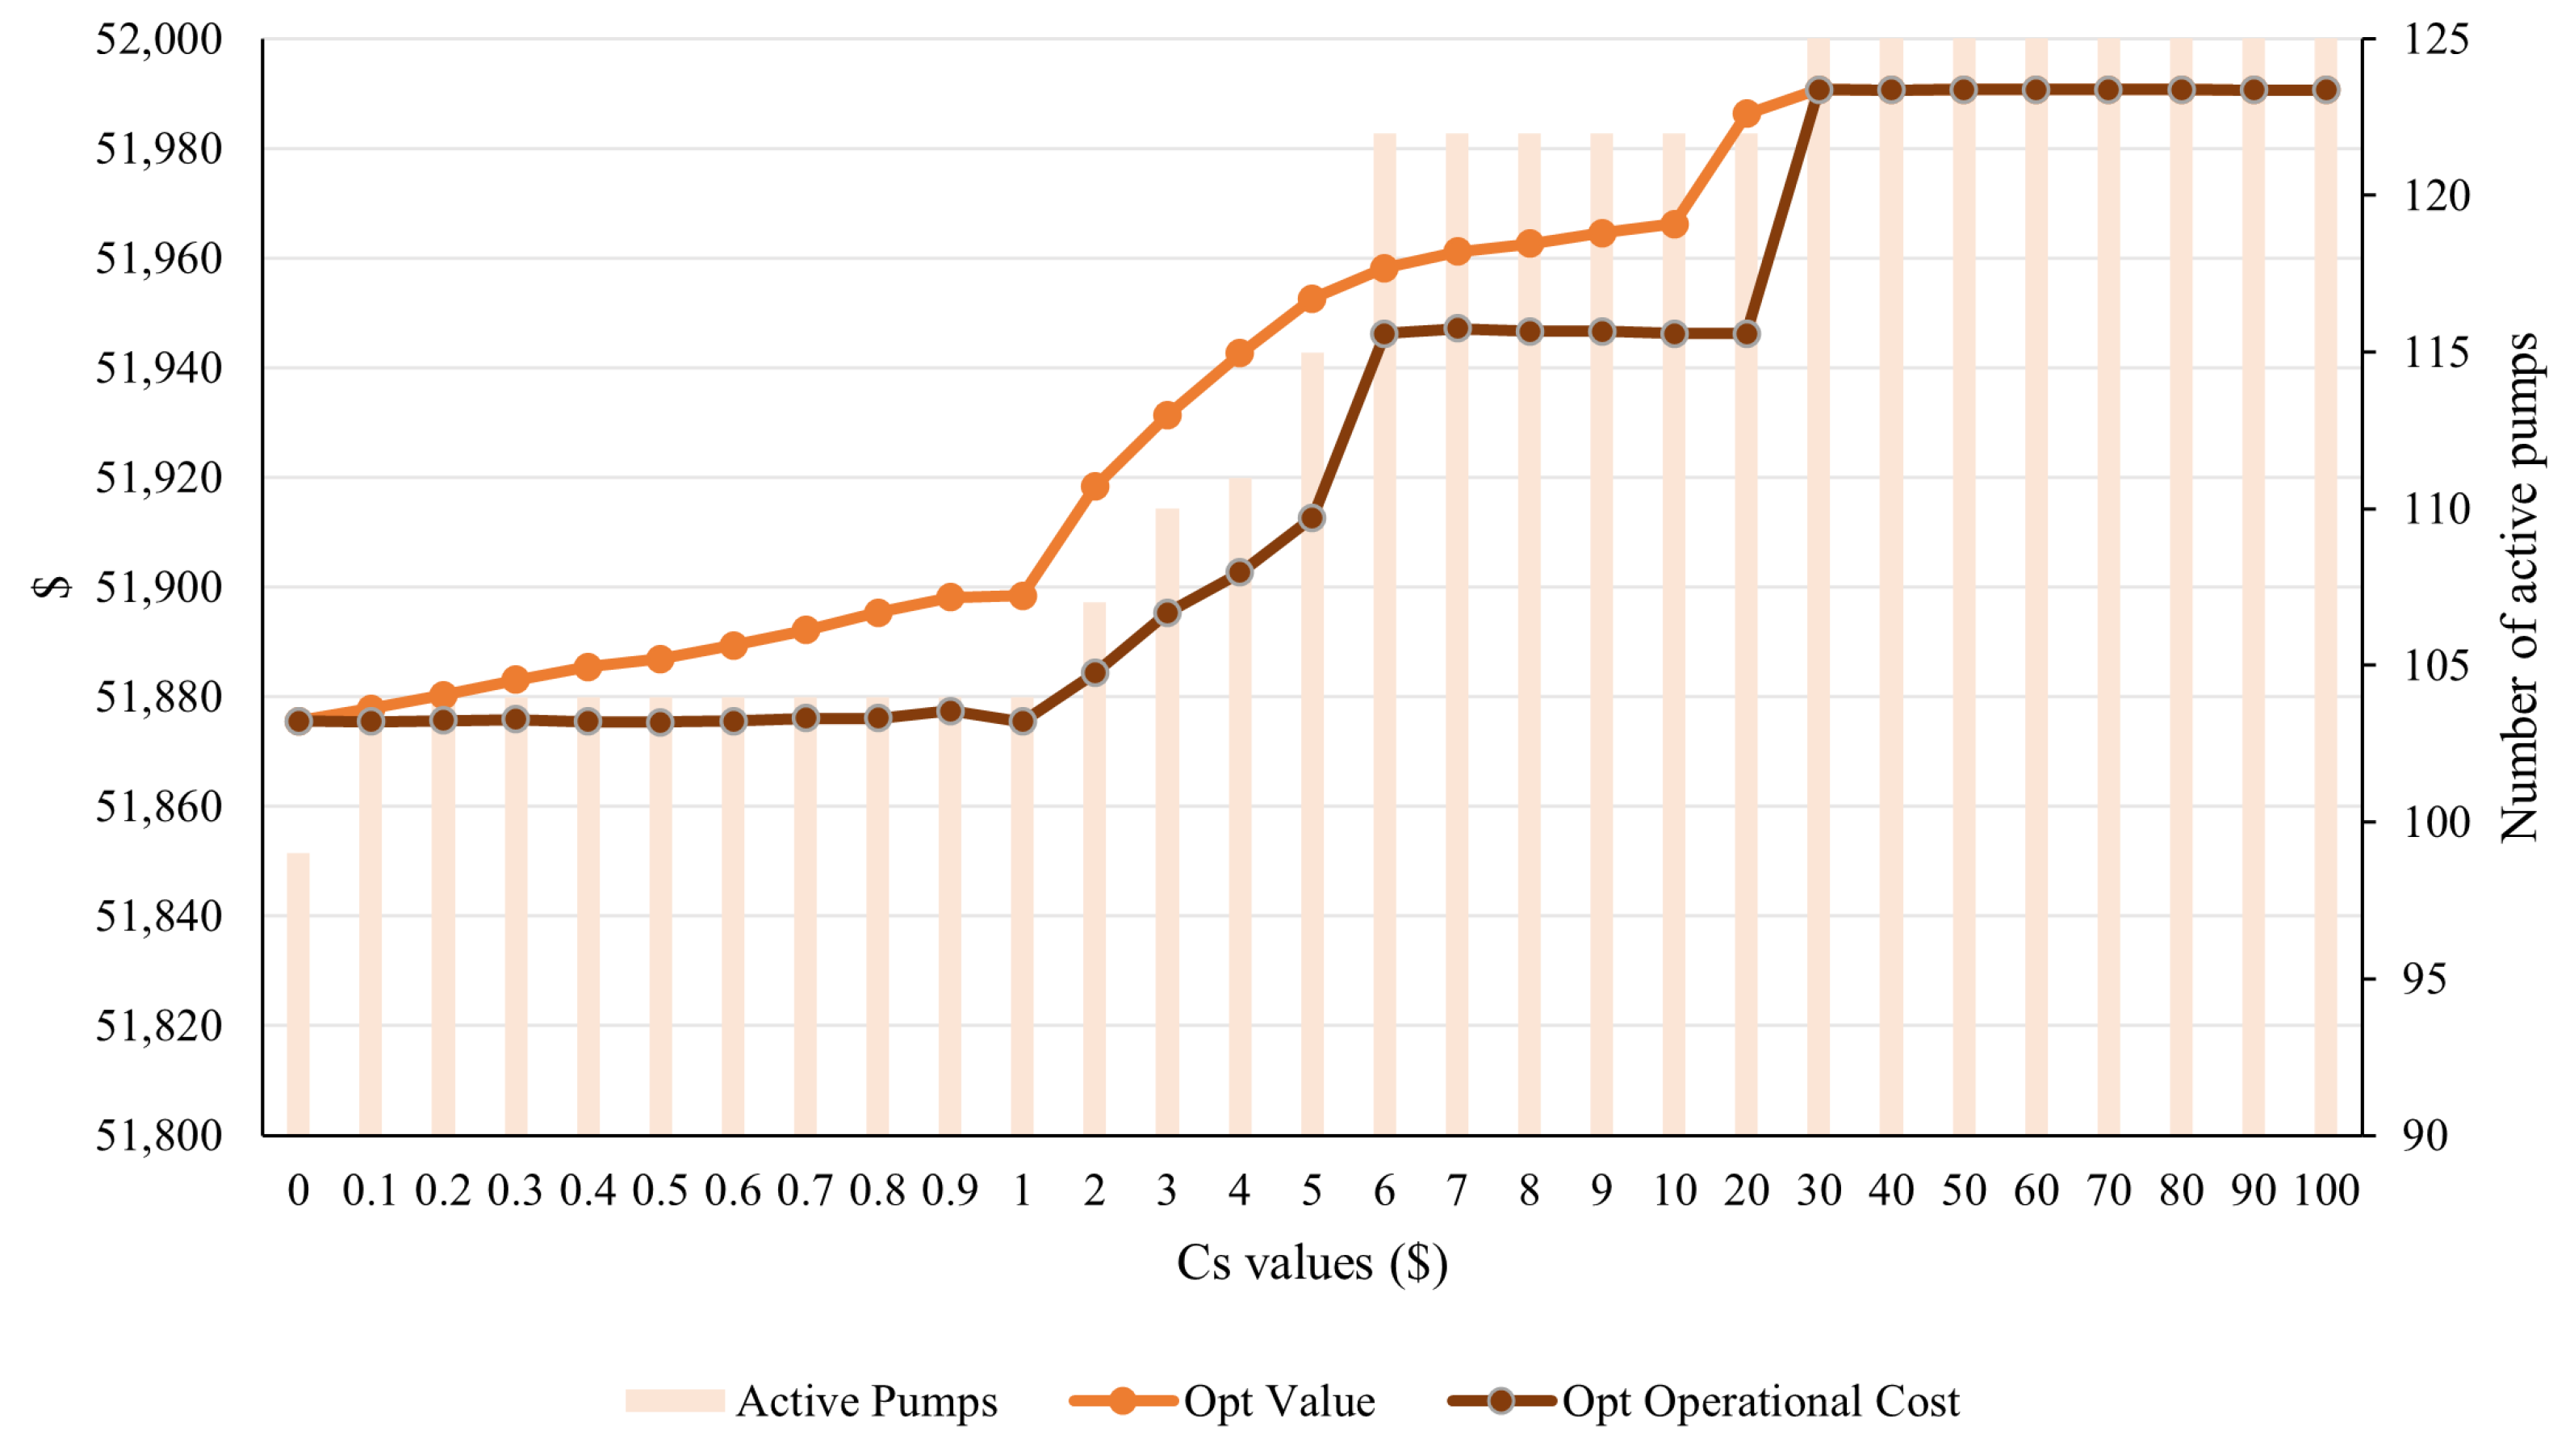
For example, for the Small WSS, with a simple electricity price, as we can see in
Figure 8 and
Figure 9, from
, the maintenance cost makes all the water pumps active; however, the same scenario occurs for the reservoir constrained case, with
. This result makes complete sense since the reservoir constraint increases the total cost, as it reduces the feasible region, and therefore the new global optimum can be excluded. Note that from those
values, the optimal value and the operational costs remain constant, even though the maintenance values increase. This is due to no switching being done; therefore,
, which makes the maintenance costs zero in the optimal value. This pattern is repeated in any electricity price analysis.
In order to select an appropriate value, we would like to have at least 15% of flexibility in the number of active pumps, i.e., for the Small WSS, around 15–18 slots of inactive pumps in total in a 24 h horizon. This is achieved with for the unconstrained case and with for the constrained case.
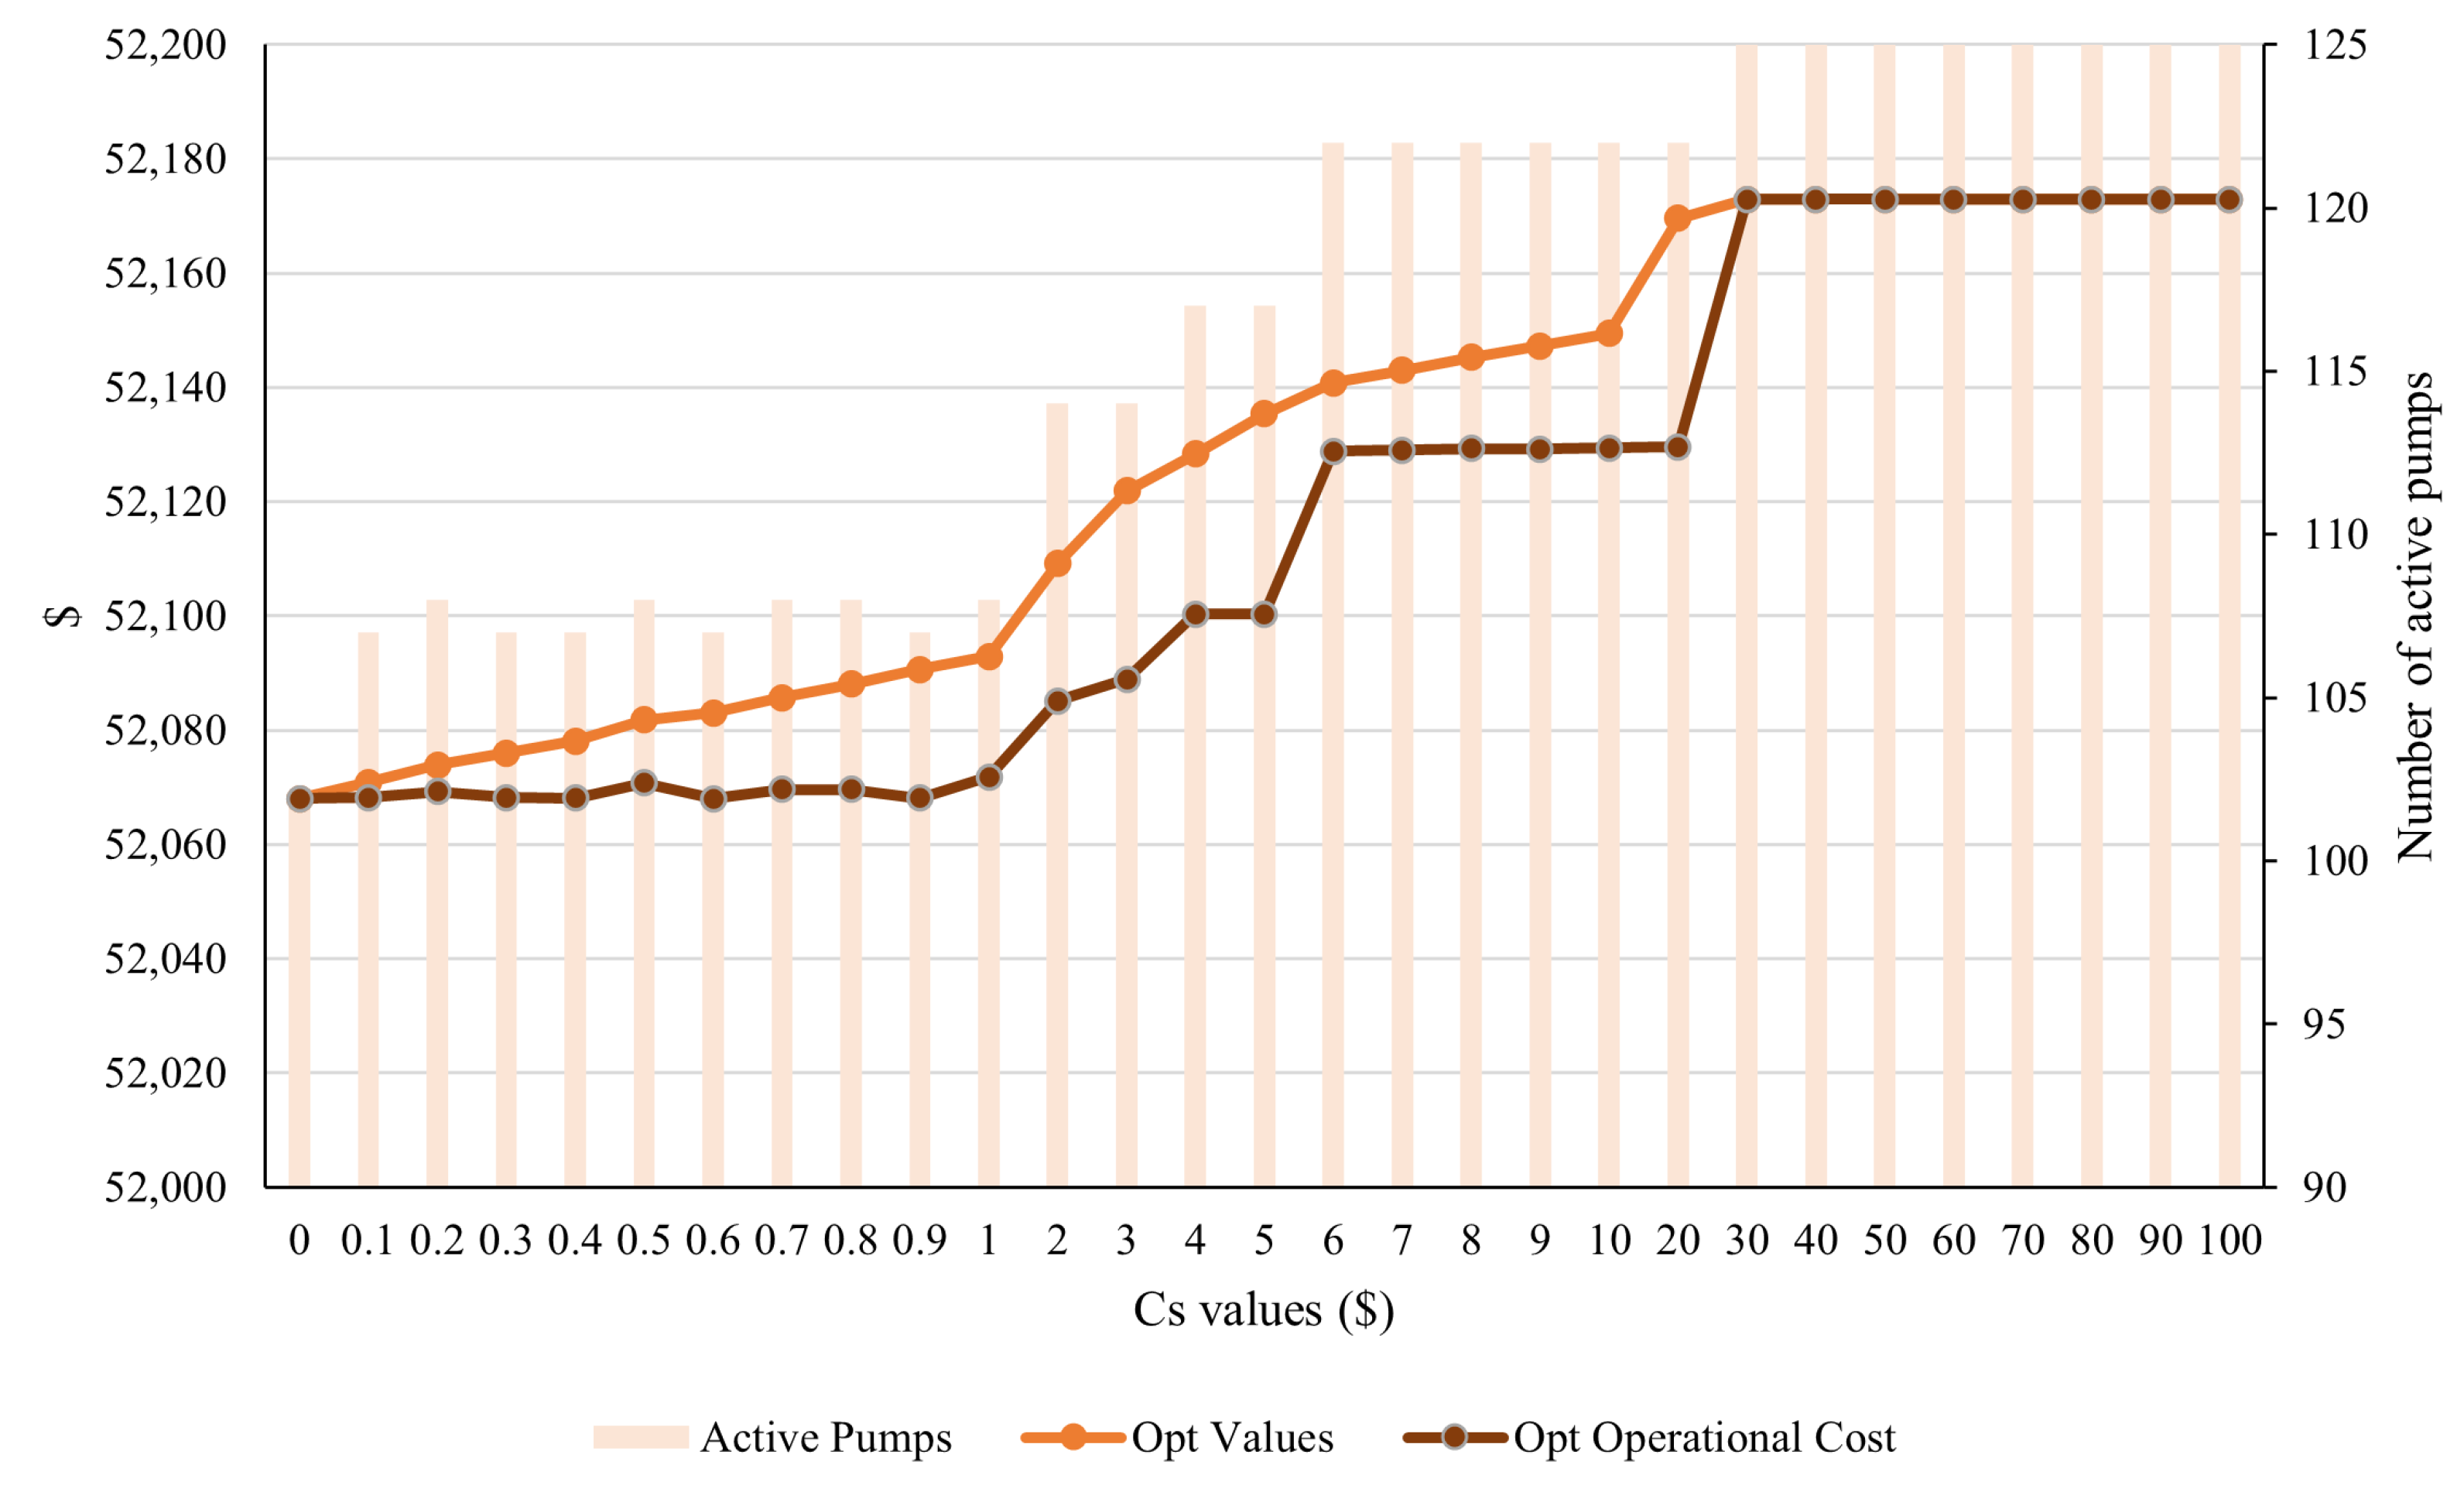
A similar study was done with the variable electricity price. Since it has a slightly higher variance than the simple electricity price, it is expected that the
needs to be smaller to compensate for the total cost, as we can observe in
Figure 10 and
Figure 11. For this case, the chosen value is
for the unconstrained case and
.
4.2. Comparison of Running Times
In
Table 8 are the significant results for the Small, Medium, and Large WSSs using the variable electricity price, not activating the reservoir constraint (
21) and the MINLP approaches: fixed flow (FF), semi-linear (SL), and the MILP binary expansion approach (BEA). The optimality gap of the MINLP methods is 0% in most of the cases. We ran the model using a Windows 11 computer with 11th Gen Intel(R) CORE(TM) i7-1165G7 @2.80GHz. It is worth mentioning that solving the original model (
24) and the FF model for more significant instances takes too long, so we had to set a 10 min time stop to the Gurobi solver in order to add those results to the table. Otherwise, it could have taken more than 7 h to complete. Also, for this work we consider that the SL model reaches the optimal value of this problem because the other approaches are either an upper bound (FF) or a binary approximation (BEA) of the original problem.
We performed different experiments using the binary expansion approach (N = 4 for M and L, and N = 3 for S) with Gurobi MILP, which reduces the computational time of the original MINLP while keeping the Gurobi Gap within 0.9%. Also, the BEA model slightly reduces the optimal value because it is an approximation of the original problem.
The main difference is seen in the Medium and Large WSSs because they not only have more pumps and tanks, but the Medium is higher, and the Large has a bigger water demand, which makes them computationally intensive to solve due to the higher number of possible combinations. In the following sections, we explain this phenomenon in more detail.
It is worth mentioning that solving this problem with Ipopt, a free nonlinear solver, is not possible due to the mixed integer nature of this problem, which it does not support. Also, it only ensures global optimality for convex problems, and this is non-convex. Therefore, we decided to use the Gurobi solver to obtain global optimum results in a reasonable time.
We included the power required in a day because it is a good indicator of the solution’s quality. As we can see in
Table 8, the optimal power needed for each WSS tested was similar for the three models: 1352 MW for the Small, 853 MW for the Medium, and 2343 MW for the Large. Note that even though the Medium WSS is the highest one, its water demand is 1 m
3/s, compared with 1.5 m
3/s for the Small and 4.05 m
3/s for the Large. Therefore, the power needed was less than for the other cases.
In all the tested cases, the BEA model runs faster than the other models; furthermore, the goal of BEA is to obtain feasible solutions quicker with a reasonable gap because the water operator needs to make its decisions on a day-ahead basis.
4.3. Computational Impact of Network Altitude and Length
As we mentioned before, the model’s most significant parameter is the highest node’s altitude. This is because, by increasing its maximum altitude, the model takes longer to solve due to the increase in total combinations it has to compute. We computed experiments using the Medium WSS by dividing its altitude and total pipe length by ten and comparing the results.
Table 9 shows the results for a medium-sized WSS using Model BEA (N = 4) and 0.5% Gurobi Gap.
When the altitude of a WSS decreases, the model has fewer possible combinations to choose from because it can send less water to the following nodes in each period of time and still meet the water demand compared to the high-altitude scenario. This becomes even more computationally intensive when the pipe length is shorter because, since the distances are smaller, there are more possibilities to send water in each period of time. The same pattern can be seen in
Table 8, since the Medium WSS is slower to compute because it is the highest of the three WSS tested.
Therefore, the altitude, meaning the maximum height difference between any two nodes in a water network, is the most relevant characteristic of the WSS operation because it augments the complexity of the model resolution. Hence, it becomes a relevant problem to be solved, especially in water networks that supply multimillion-dollar industries, which depend on those inflows.
4.4. Impact of the Number of Partitions in BEA
It is evident that the higher the number of partitions in the binary expansion approach, the closer the results will be to their actual value. However, when the N value increases, the computational time of the model increases (see
Table 10). Therefore, choosing a reasonable value for N is crucial to have a good balance between the computational time and the optimal solution.
To select the right N value, we used two Gaps to analyse and compare its performance: the Gurobi Gap and the SL Gap. By Gurobi Gap, we mean the MILP gap given by Gurobi, which uses the objective bounds: the incumbent and the best bound found so far. On the other hand, the SL Gap is the relative error between the optimal objective value of the BEA method in the n-th value and the optimal value of the SL model, assuming that that is the global optimum of the problem.
From these results, for the small-sized WSS, from N = 6 partitions, the Gurobi Gap and SL Gap do not improve much, while the computational time increases rapidly. It is interesting to mention that when the N value is too high, for example, N = 200, the computer cannot process the model, so it stops after a few seconds with a bad solution (around 30% Gurobi Gap). Note that we set a time stop in 600 s for the bigger N values; otherwise, the problem would take several minutes or hours to reach the 1% Gurobi Gap. It is relevant to mention that if the Gurobi Gap is too high or the time limit is too low, most of the time, the number of active pumps will be the maximum value, i.e., for the Small WSS it is 125; essentially, all the pumps are on in all the time periods.
Therefore, depending on the size of the WSS, the recommended number of partitions for the BEA model is between 3 and 5. This allows the model to be solved rapidly with reasonably small Gurobi and SL optimality gaps and a more accurate number of active pumps.
4.5. CODELCO Radomiro Tomic WSS Case Study
The optimal outcome in an optimisation model varies depending on the input data provided, and in this case the model should demonstrate sensitivity to the seasons of the year in regions where there is a clear differentiation in temperature, which consequently affects electricity prices. This section analyses the impact of the seasons of the year, the minimum reservoir level, the CODELCO energy policy, and the increase in water demand. We use as a case study for this work the Small WSS called “Aguas Horizonte,” which corresponds to the supply water network for the “Radomiro Tomic Mine” of the company CODELCO in the northern region of Chile.
The results studied from this section onwards include changes in the water tanks and reservoir capacities, the initial/final storage for the reservoir, and the water demand at the mine site of the Small WSS, obtained from the “Aguas Horizonte” environmental analysis report [
60] to ensure maximum realism for the energy and economic analyses. The new data for the nodes of the CODELCO Small WSS are displayed in
Table 11.
4.5.1. Impact of Seasonal Electricity Prices
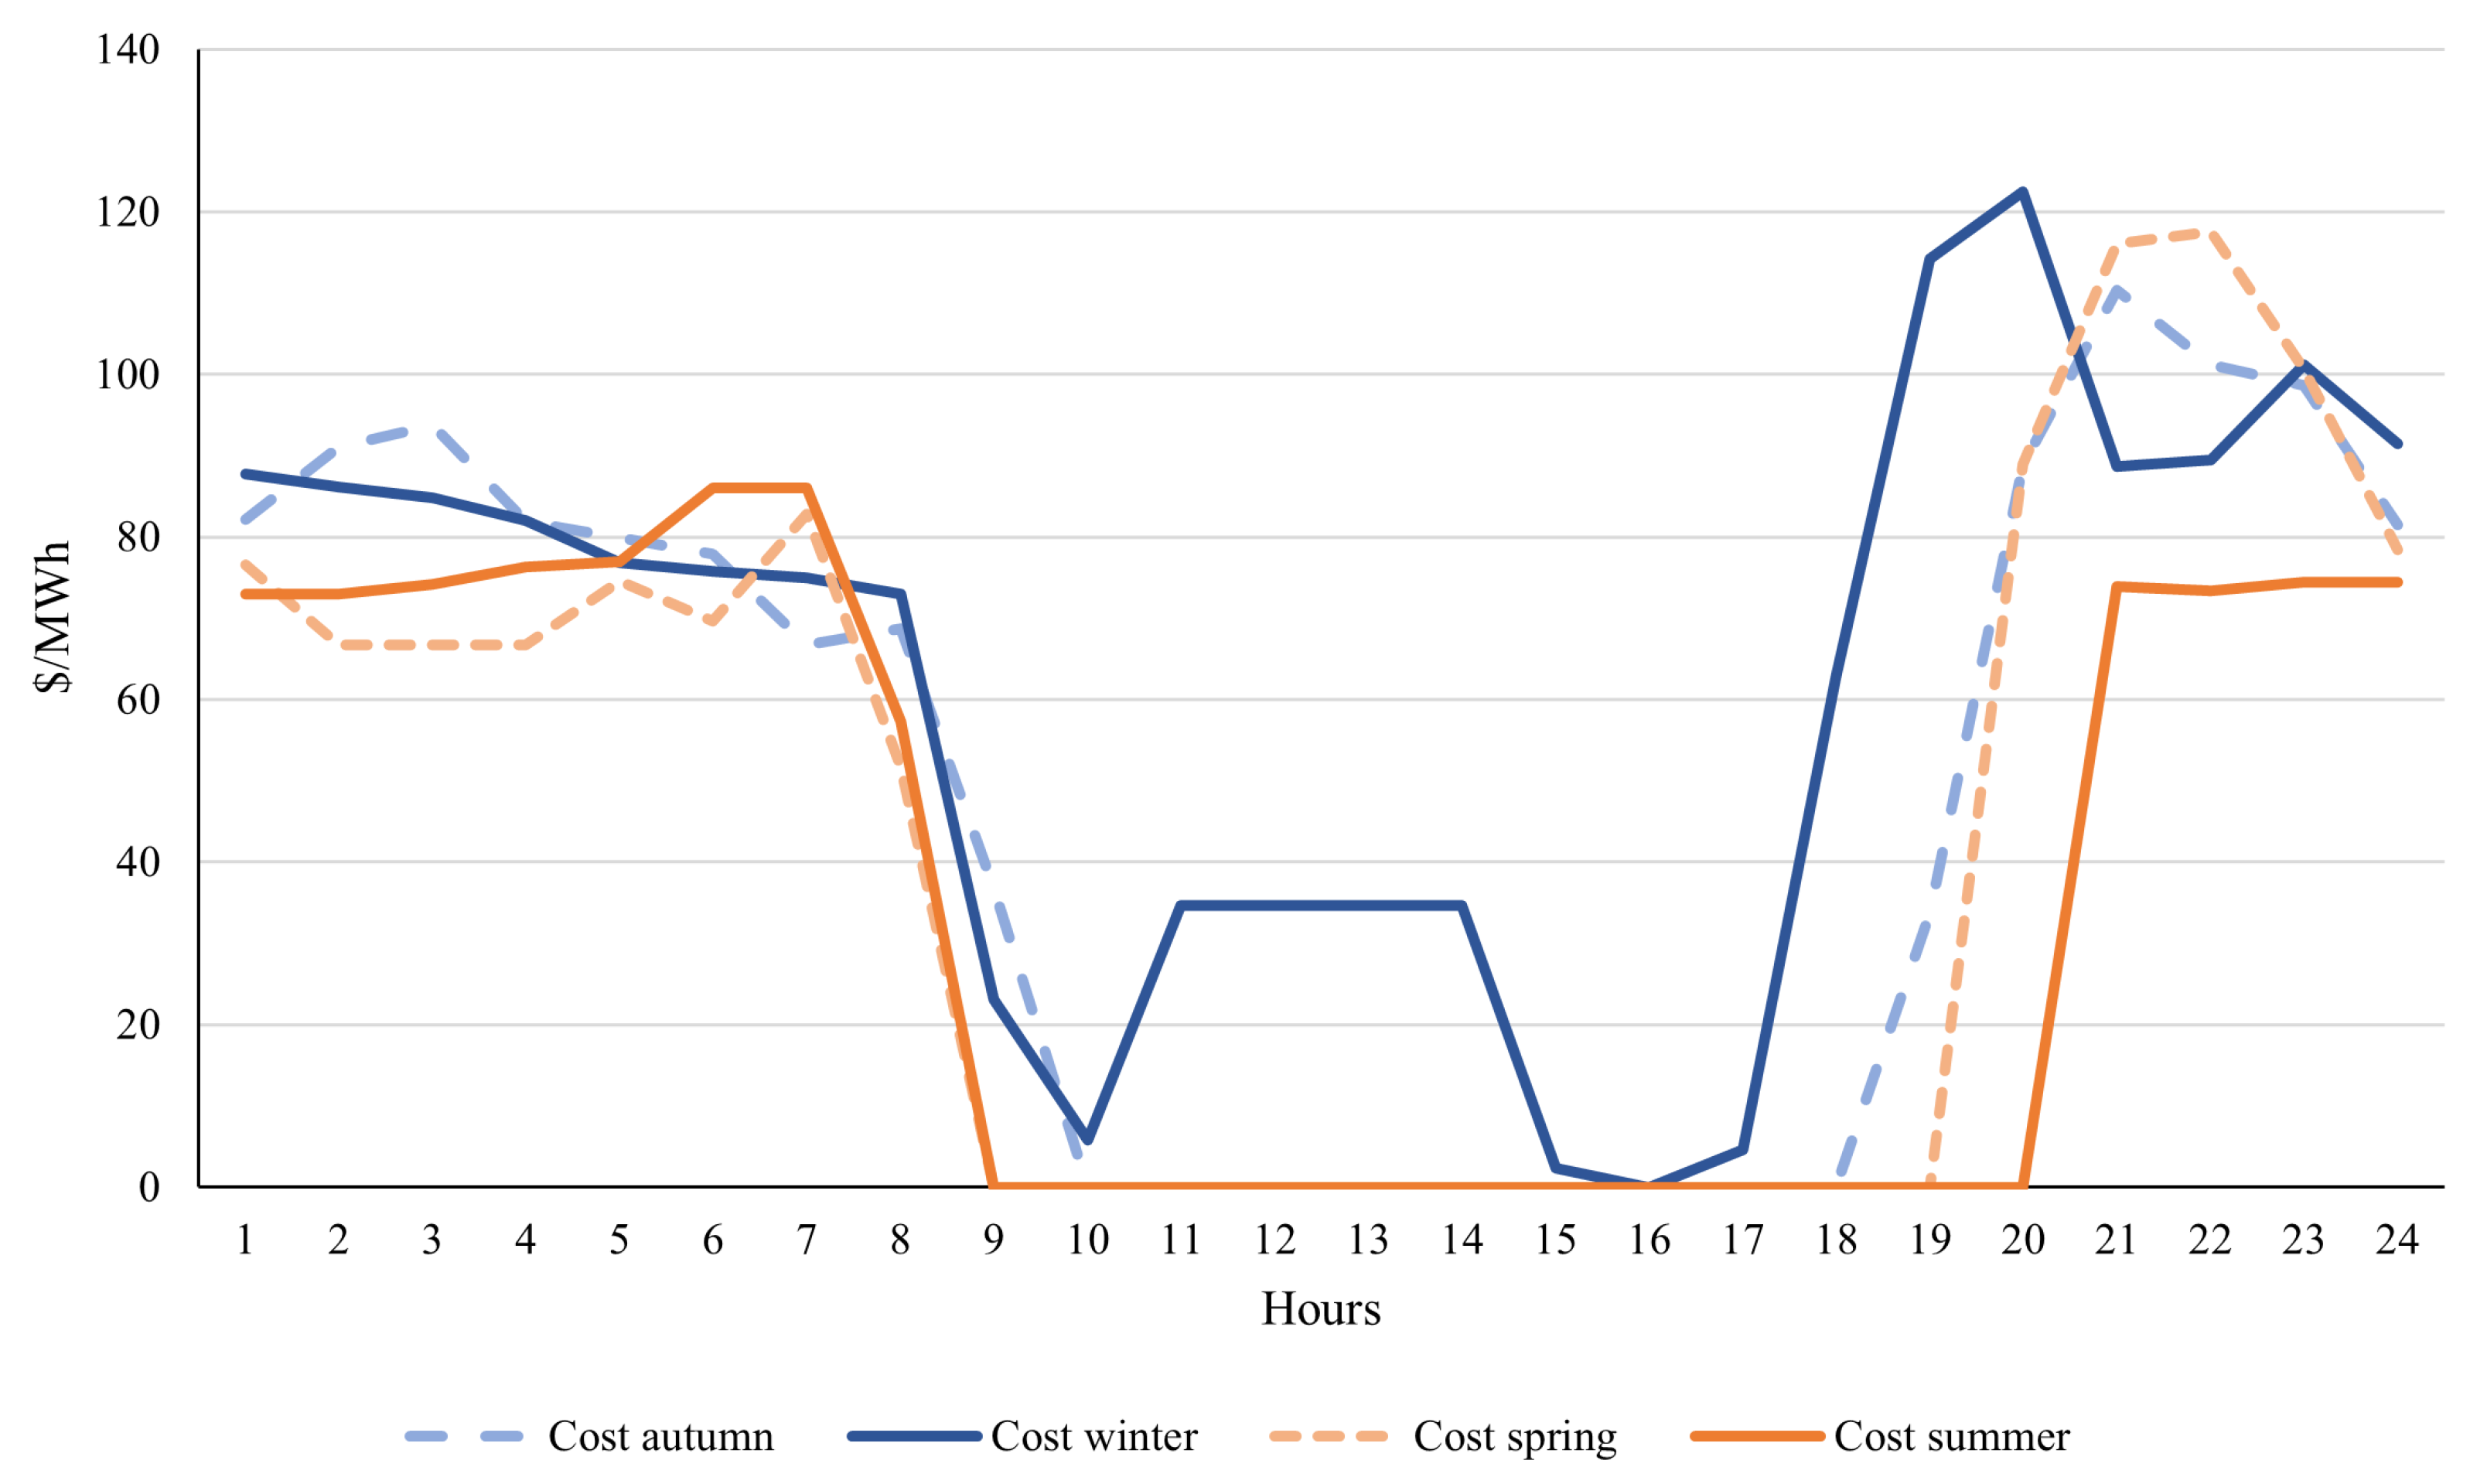
We selected random days from autumn, winter, spring, and summer for this analysis. The electricity prices for these days are depicted in
Figure 12, corresponding to the following dates: 31 March 2024 for autumn, 22 July 2023 for winter, 20 October 2023 for spring, and 19 January 2024 for summer.
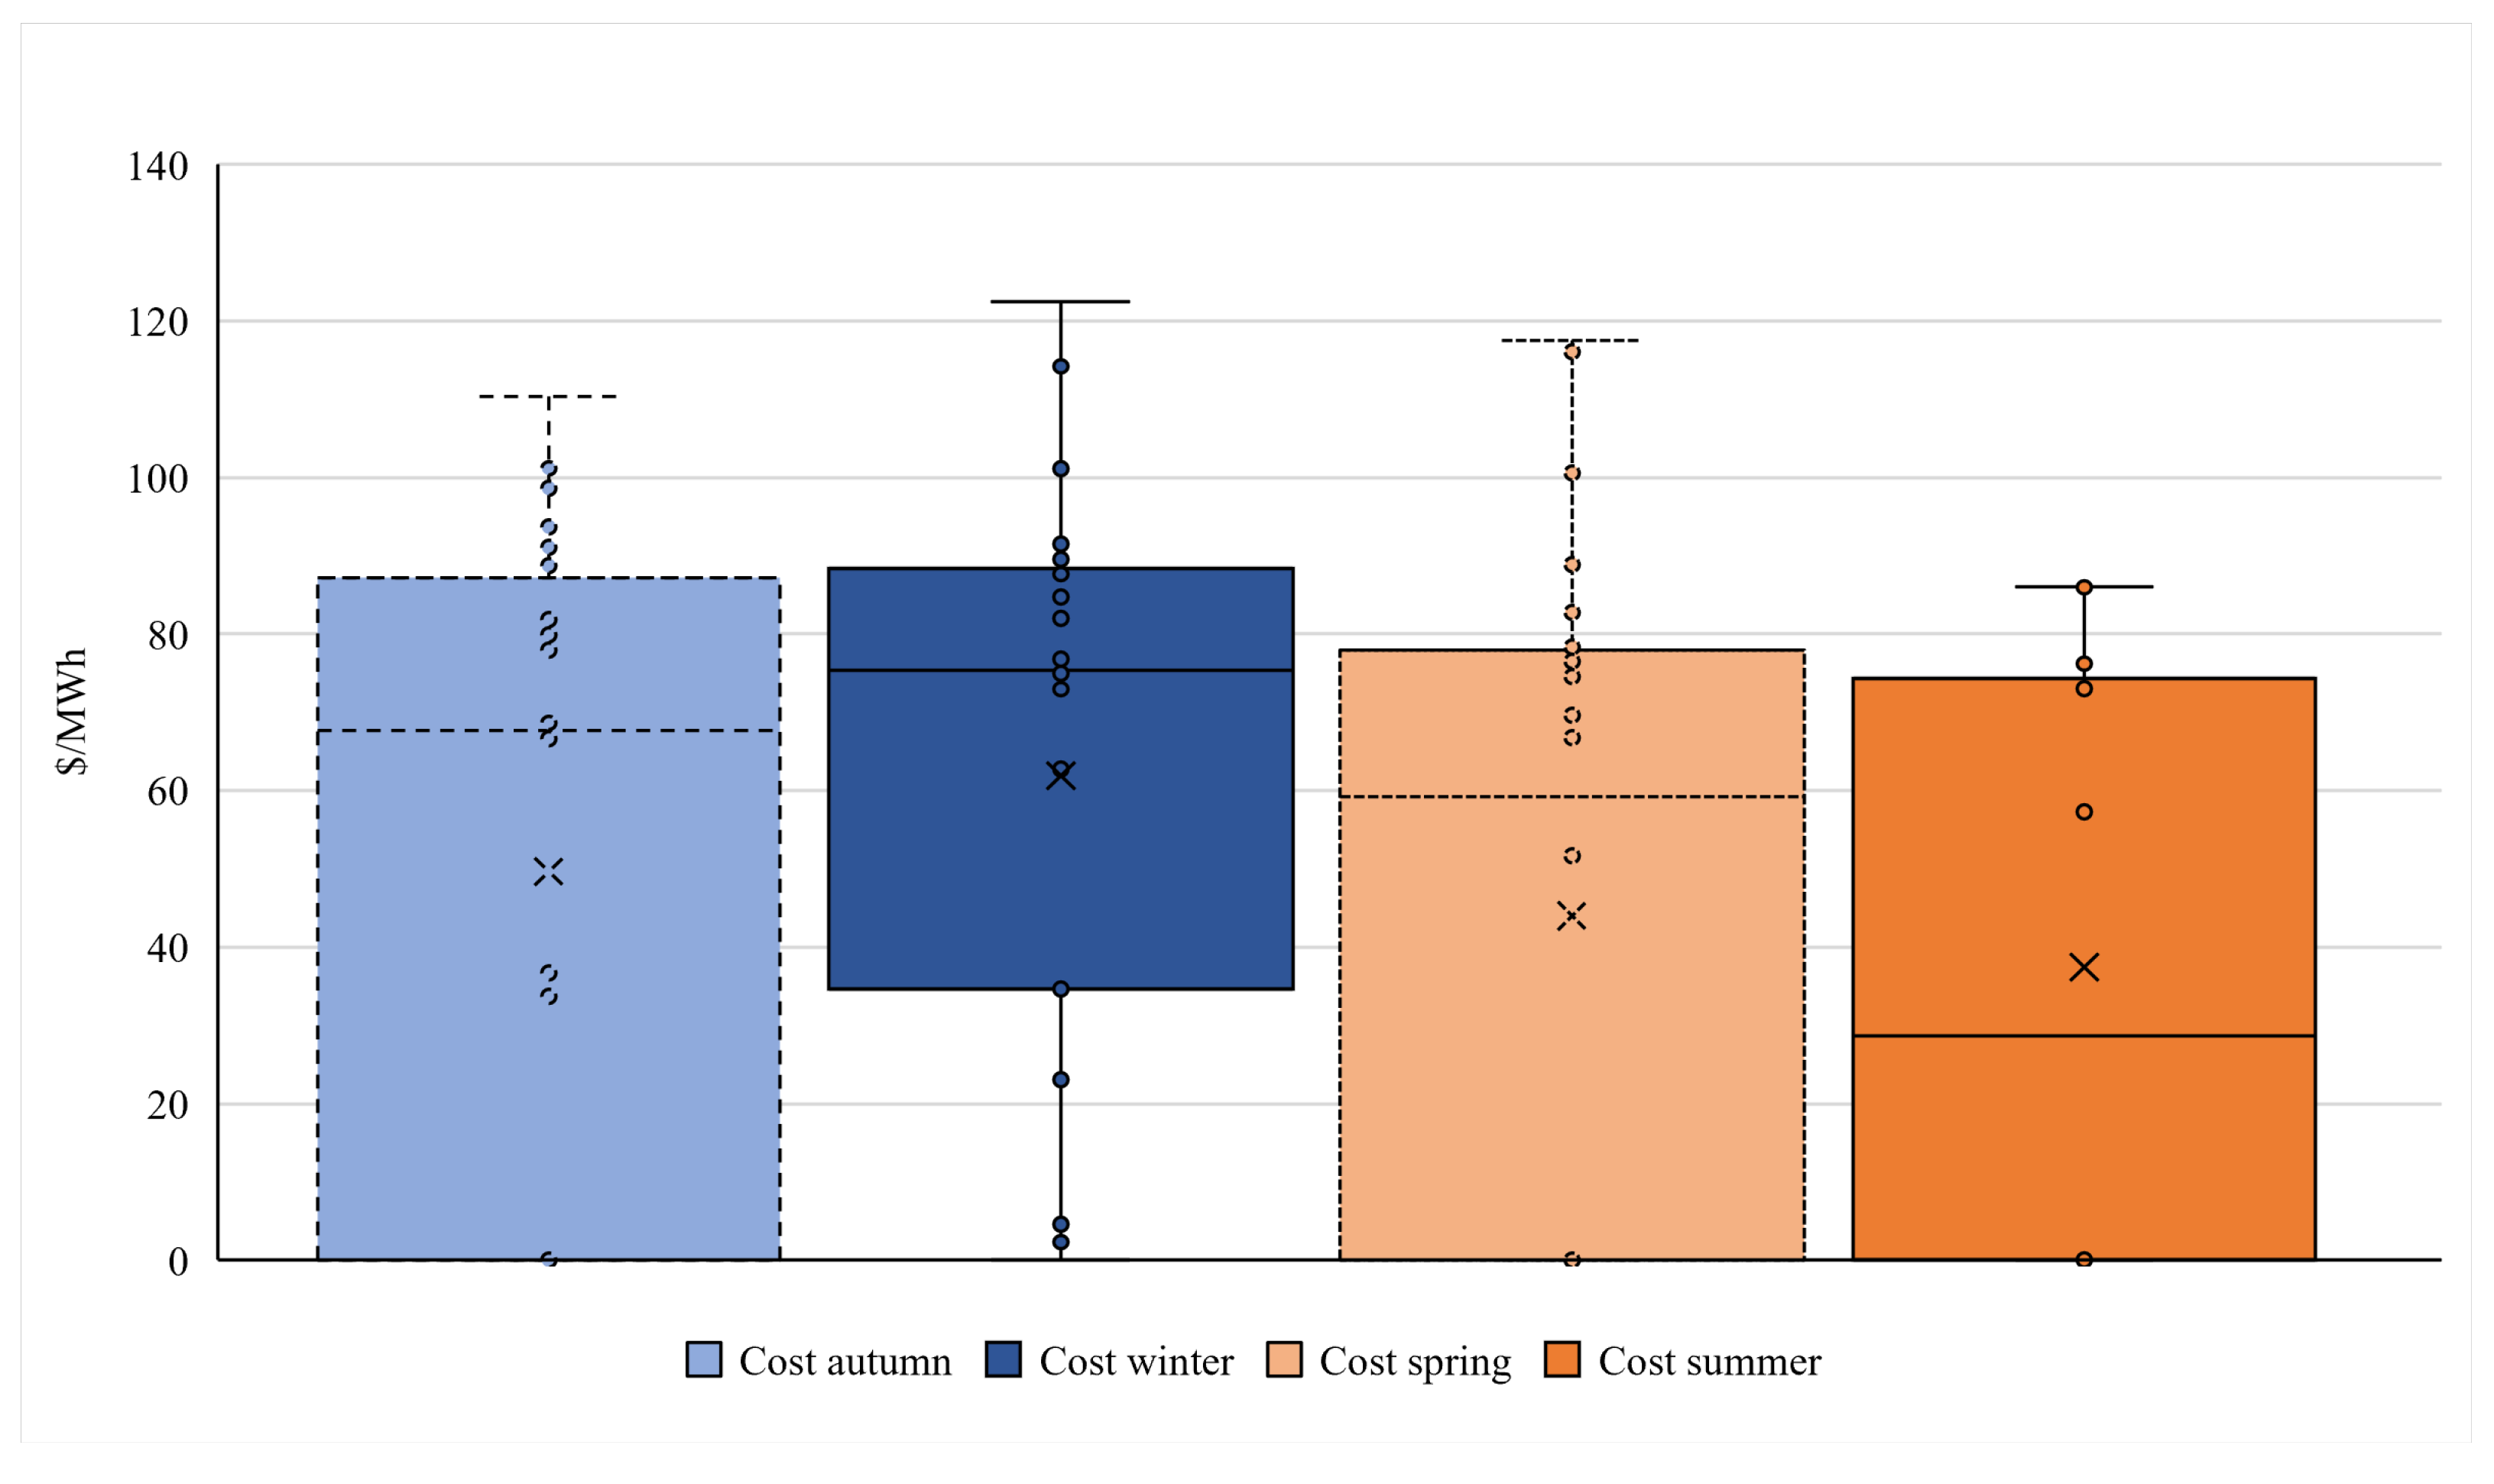
As anticipated, the warmer months exhibit lower prices compared to the colder months. Moreover, during wintertime, there are fewer hours with USD 0 MWh, possibly due to reduced solar generation. However, because winter experiences higher minimum prices, its dispersion is lower, as illustrated in
Figure 13.
Summertime records the lowest mean and median of the year, averaging around USD 30 MWh, in contrast to the USD 65 MWh observed during winter. Autumn and spring demonstrate similar behaviour, with a mean of approximately USD 50 MWh. Additionally, the median for summer is lower than its mean, indicating that there are more values below the mean, including USD 0 MWh, while the higher values contribute to its average.
Lastly, for each season, it was necessary to select an appropriate value for the maintenance cost, , to switch the water pumps between periods. Following the same methodology as in the preceding sections, we determined that for the Small WSS, for each season.
Using the seasonal electricity prices, we examined their impact on the water pump scheduling problem. In
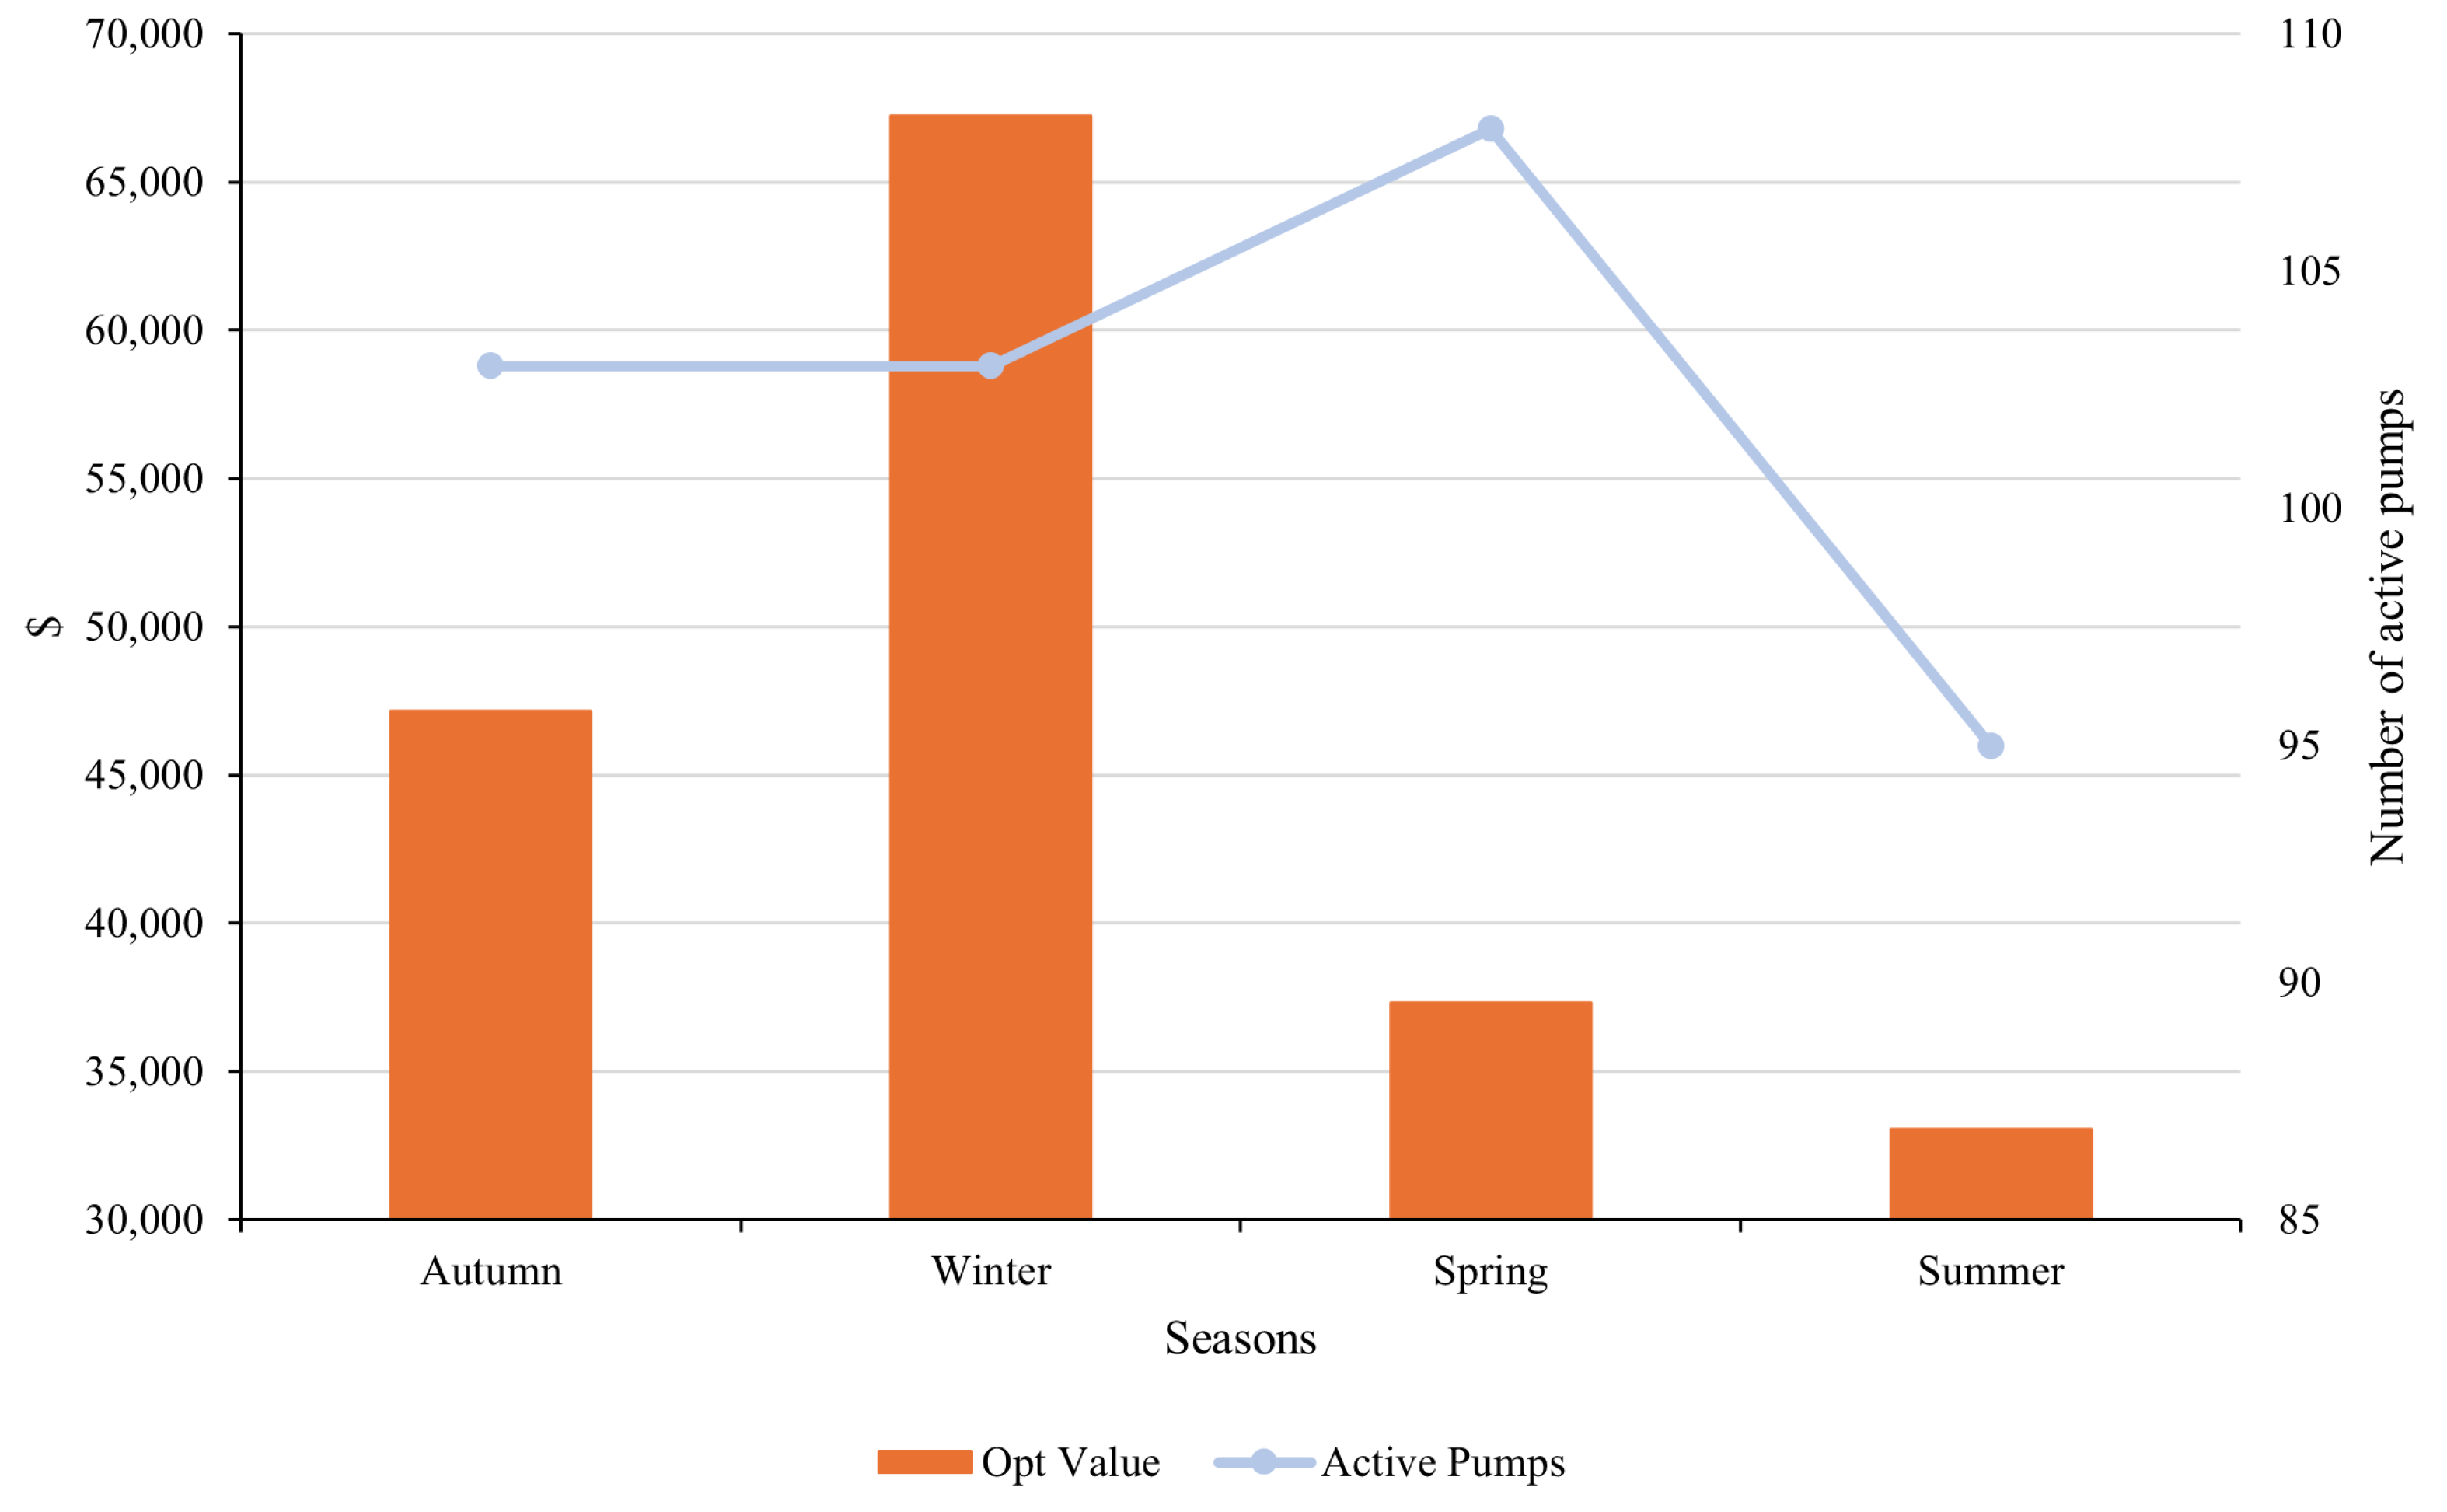
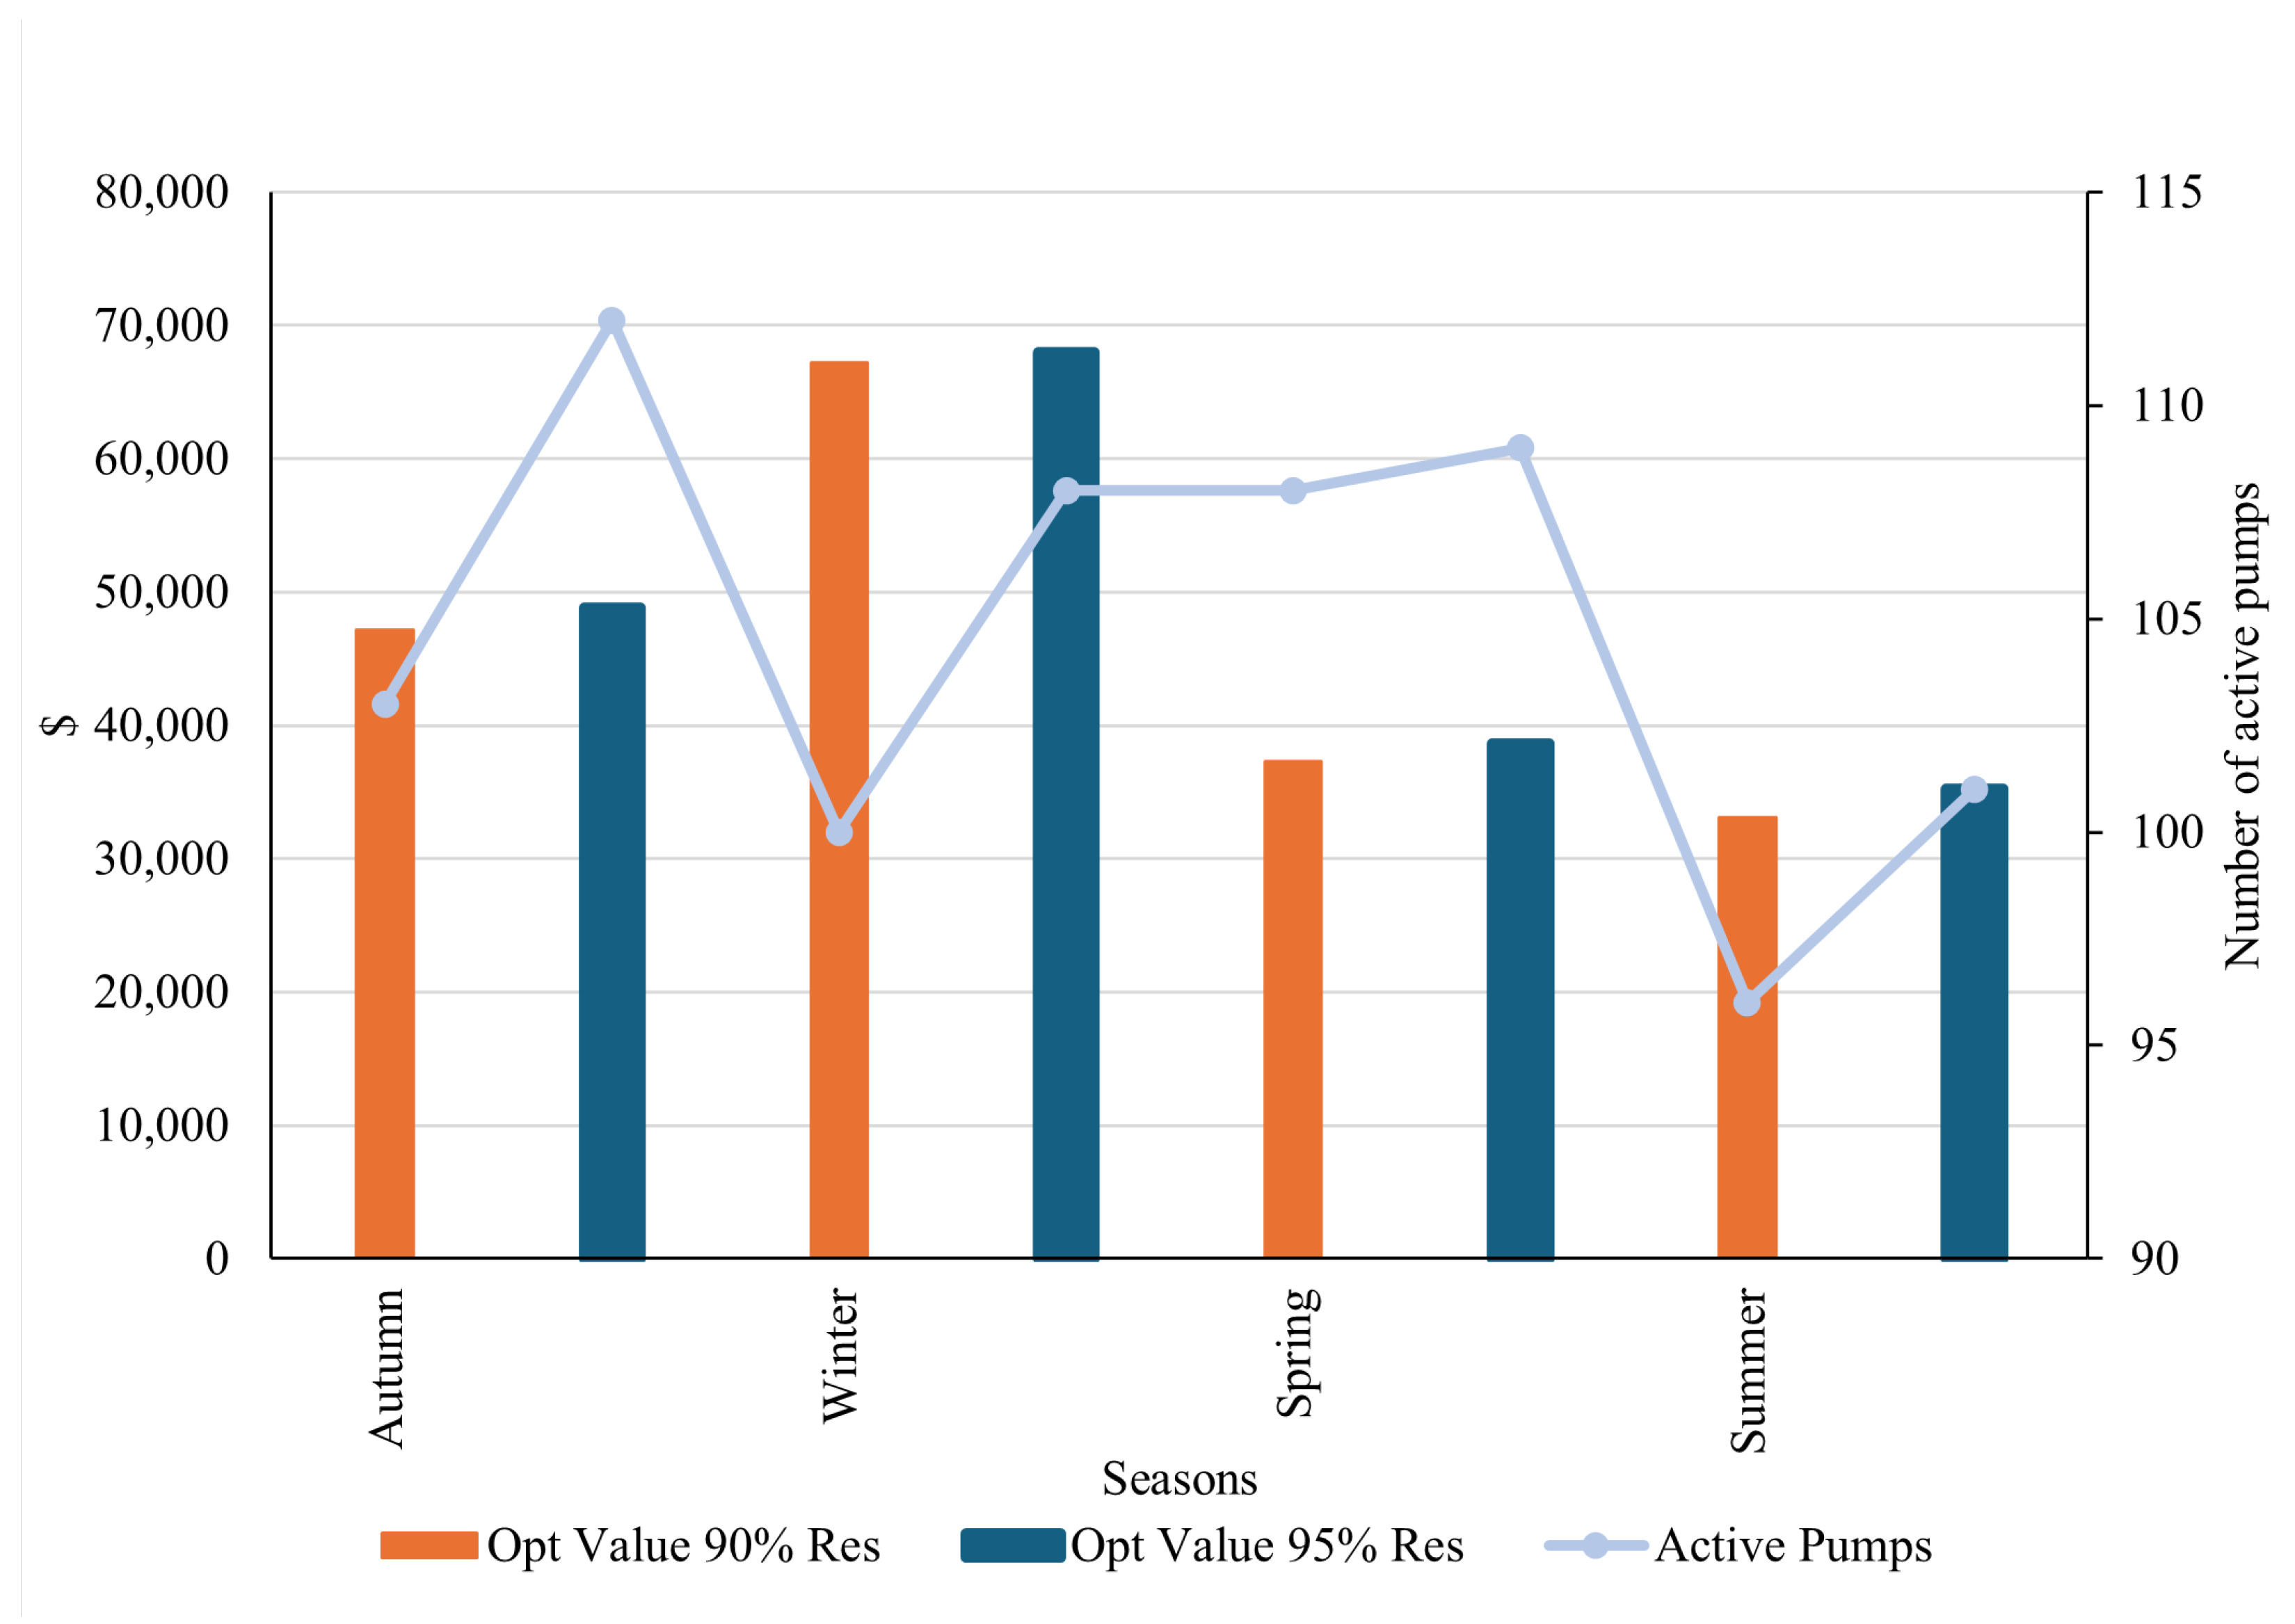
Figure 14, we can observe that the optimal objective value follows the same pattern as the mean and median of the electricity prices; namely, winter is the most expensive, followed by autumn, spring, and finally summer. This trend persists when implementing policies such as incorporating the minimum water level in the reservoir for each hourly constraint (
21) and restricting the number of active pumps during certain hours of the day, as elaborated in subsequent sections.
Moreover, from
Figure 14, it is noteworthy that, during spring, the number of active pumps increases, presumably because the problem aims to activate them during hours when electricity costs are USD 0 MWh.
4.5.2. Security and Energy Policies
For this case study, we examined two policies concerning the utilisation of reservoirs and water pumps throughout the day: firstly, the implementation of a minimum water level constraint for reservoirs for each hour (Res), as described in constraint (
21), and secondly, the imposition of a maximum limit on the number of active pumps within a specified time period (Pol). Detailed explanations of each policy are provided in the subsequent sections.
- 1.
Impact of minimum water tank and reservoir levels (Res)
As previously discussed, the degree of flexibility concerning the minimum water tank and reservoir parameters may vary depending on the industry. This variation is determined by the company’s opportunity cost in reducing its minimum water level to mitigate energy expenses and the potential risk of inadequate water supply should all systems fail, leading to a multimillion-dollar loss for each minute its operation stops.
Therefore, we use the constraint (
21):
and we analysed two cases for the
parameter: 90% and 95%. For the case of CODELCO, they need a 95%; however, we wanted to study how much they can save if they reduce to 90% the minimum level of water in their reservoirs.
- 2.
Cost Savings Relative to Current Policy (Pol)
Some industries manually optimise their processes, adhering to specific principles or rules based on their experience. However, such policies often lead to local optima. The energy policy under scrutiny in this section, pertaining to the CODELCO WSS, involves the cessation of water pump operations between 6 p.m. and 10 p.m. Initially, this may seem reasonable, considering that electricity demand typically peaks during the evening; nevertheless, the optimal results show otherwise.
For our analysis, we selected four days from each season of the year, using data from the Radomiro Tomic electric bus, as explained in the preceding section. We then compared this data with the company’s energy policy. However, upon running the model with the company’s energy policy, the problem results proved infeasible. Consequently, we opted to introduce the following constraint to the model, limiting the number of active pumps, denoted by
r, during the 6 p.m. to 10 p.m. timeframe:
First, for the minimum reservoir level , the minimum number of active pumps that made the problem feasible was ; however, when we increase to 95%, r becomes 4.
4.5.3. Comparison of Policies
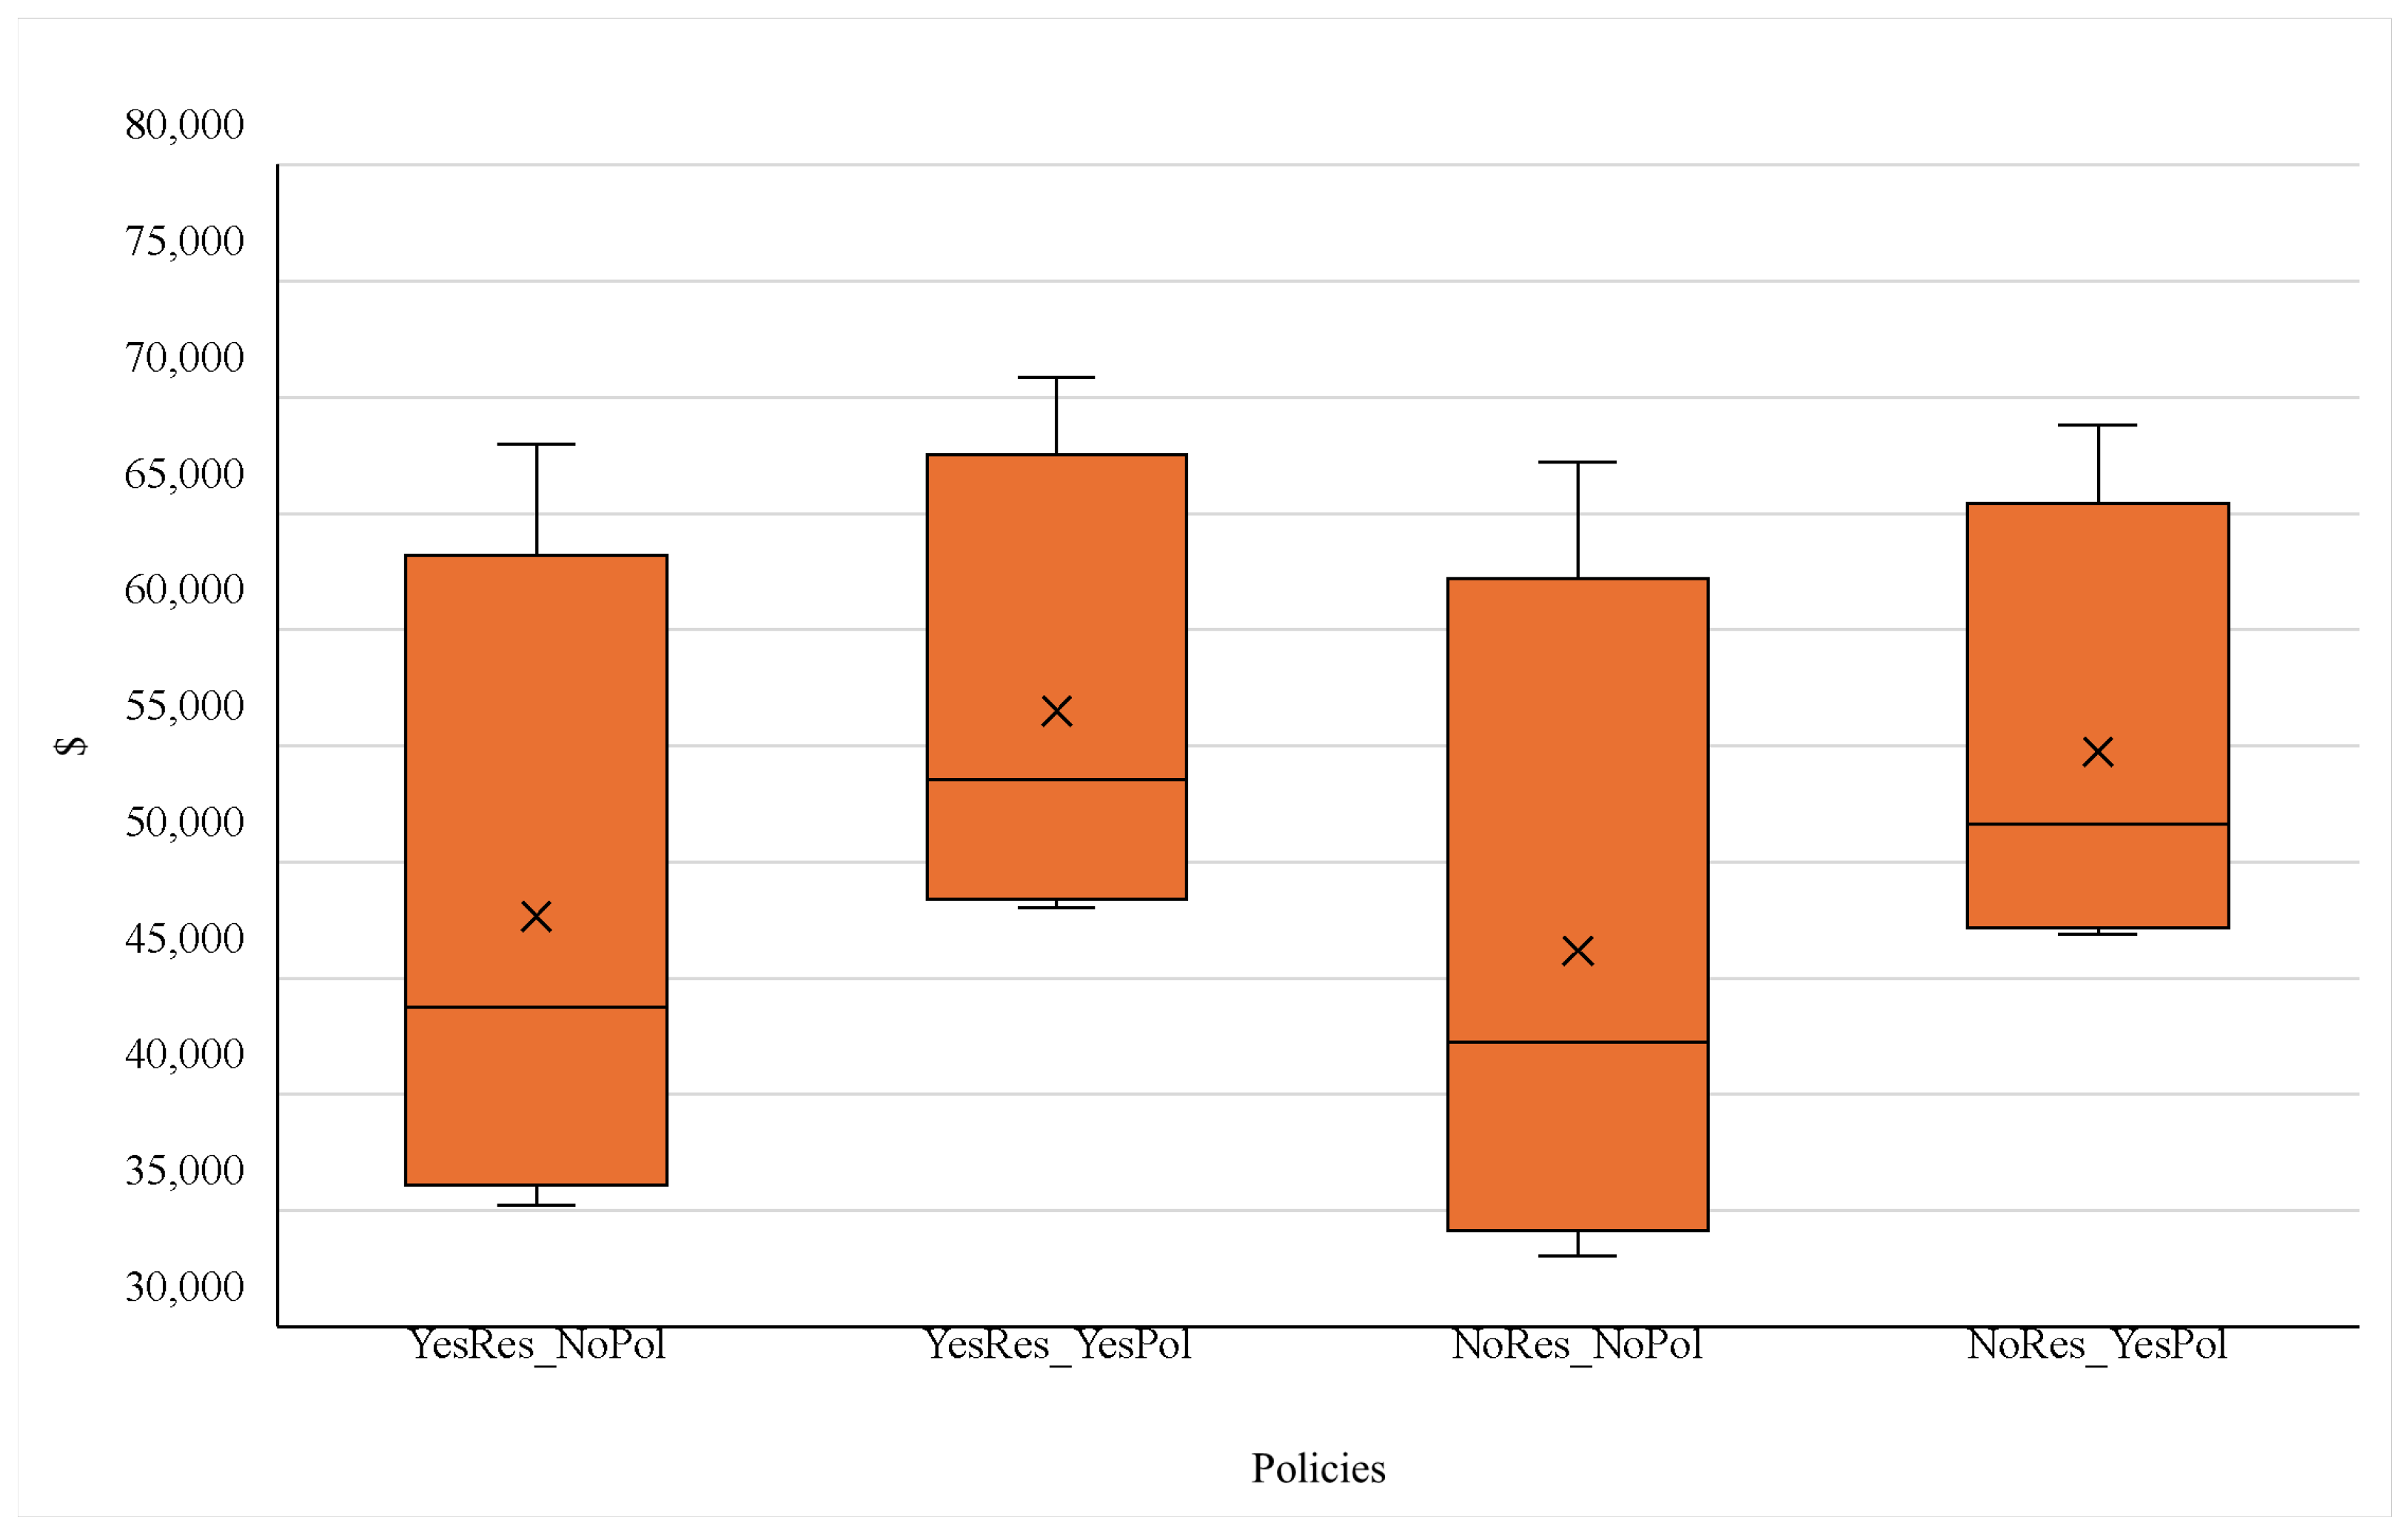
Before analysing all the possible policy combinations in detail,
Figure 15 shows us an insight into the most relevant policies for the water scheduling problem for the Radomiro Tomic WSS.
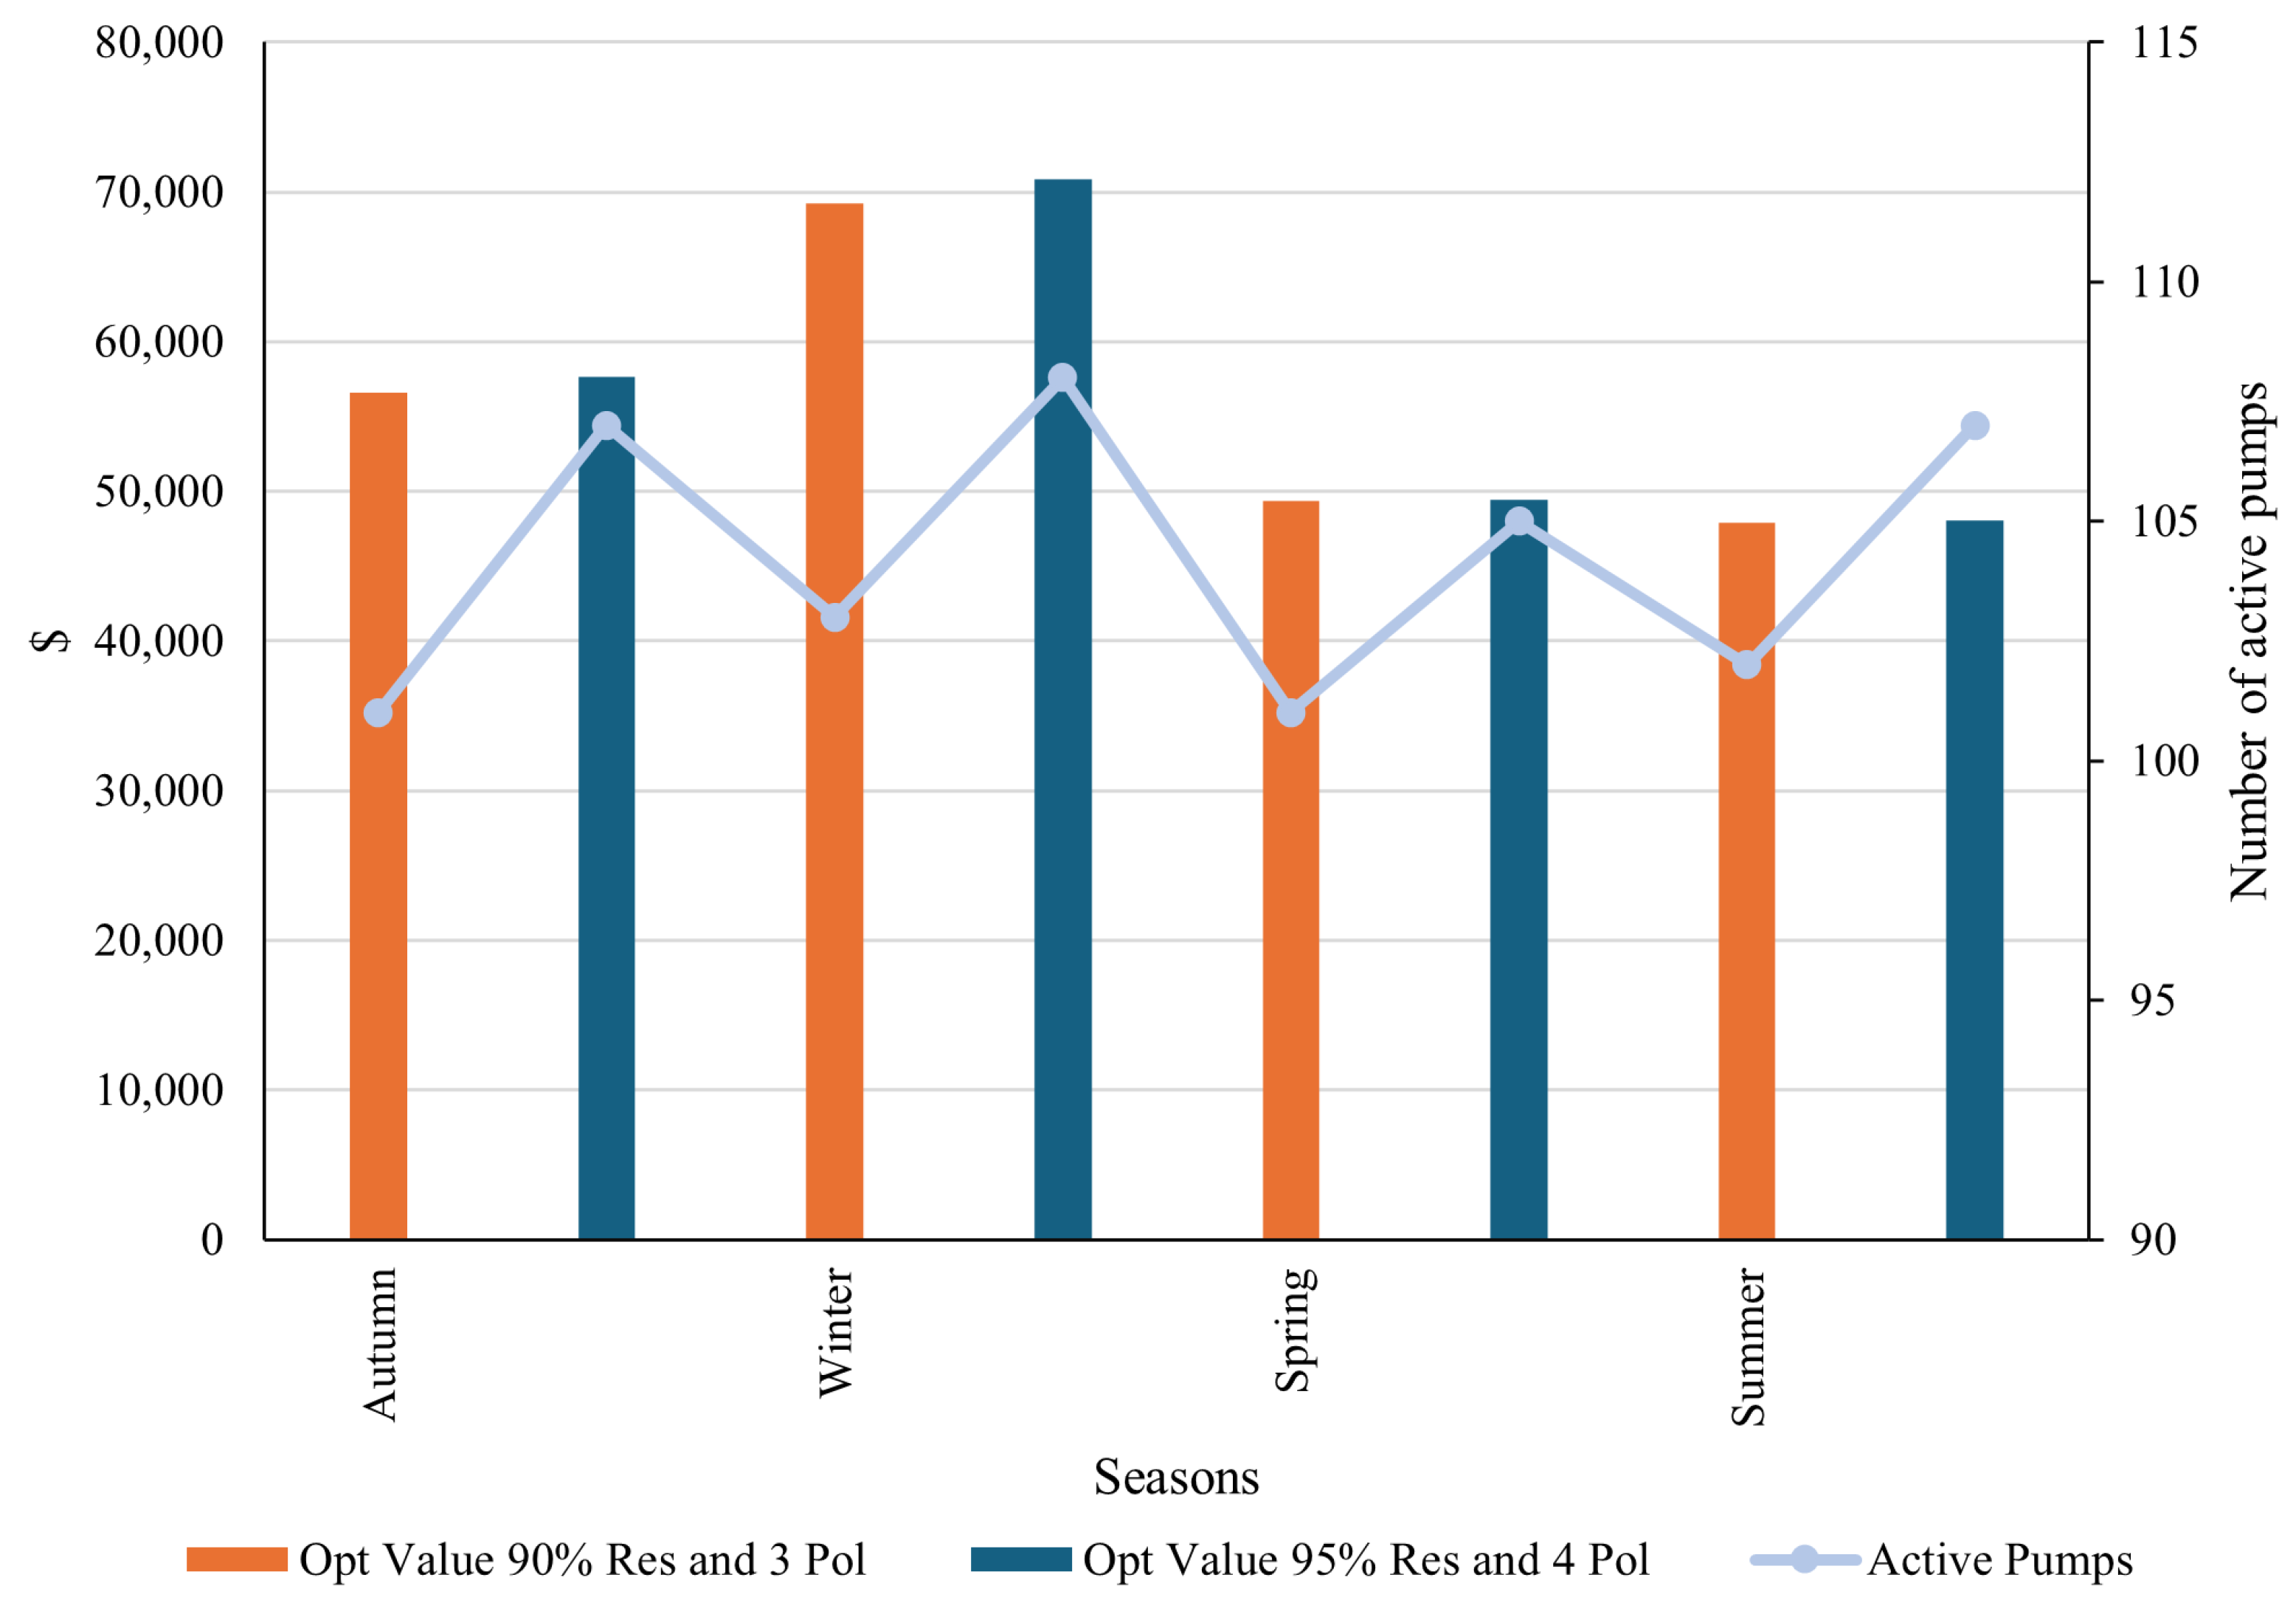
The policy combinations with the highest optimal values are the ones that use the CODELCO energy policy (Pol), especially in the warmer months, as we can see in
Figure 16 compared with
Figure 14 and
Figure 17. For the summertime, the cost without (Pol) policy goes from around USD 33,000 to USD 47,000 when the policy is applied. The same occurs in spring, going from around USD 37,000 to USD 50,000. Winter is the only season that remains almost the same when the policy is applied, and this is because the electricity prices throughout the day are higher than in other seasons; therefore, the savings are minor when turning off almost all the water pumps between 6 p.m. and 10 p.m.
Also, we can see a small difference in the objective value when changing the minimum reservoir level from 90% to 95%, as CODELCO mining company requires: with the 90% level, the optimal objective value is smaller than with a 95% level. This occurs both whether the CODELCO energy policy (Pol) is applied or not, as we can see in
Figure 16 and
Figure 17. The water pumps are activated less in the 90% case compared with the 95%, which gives more space to provide flexibility and ancillary services to the electrical grid as future work.
4.5.4. Impact of Higher Water Demand
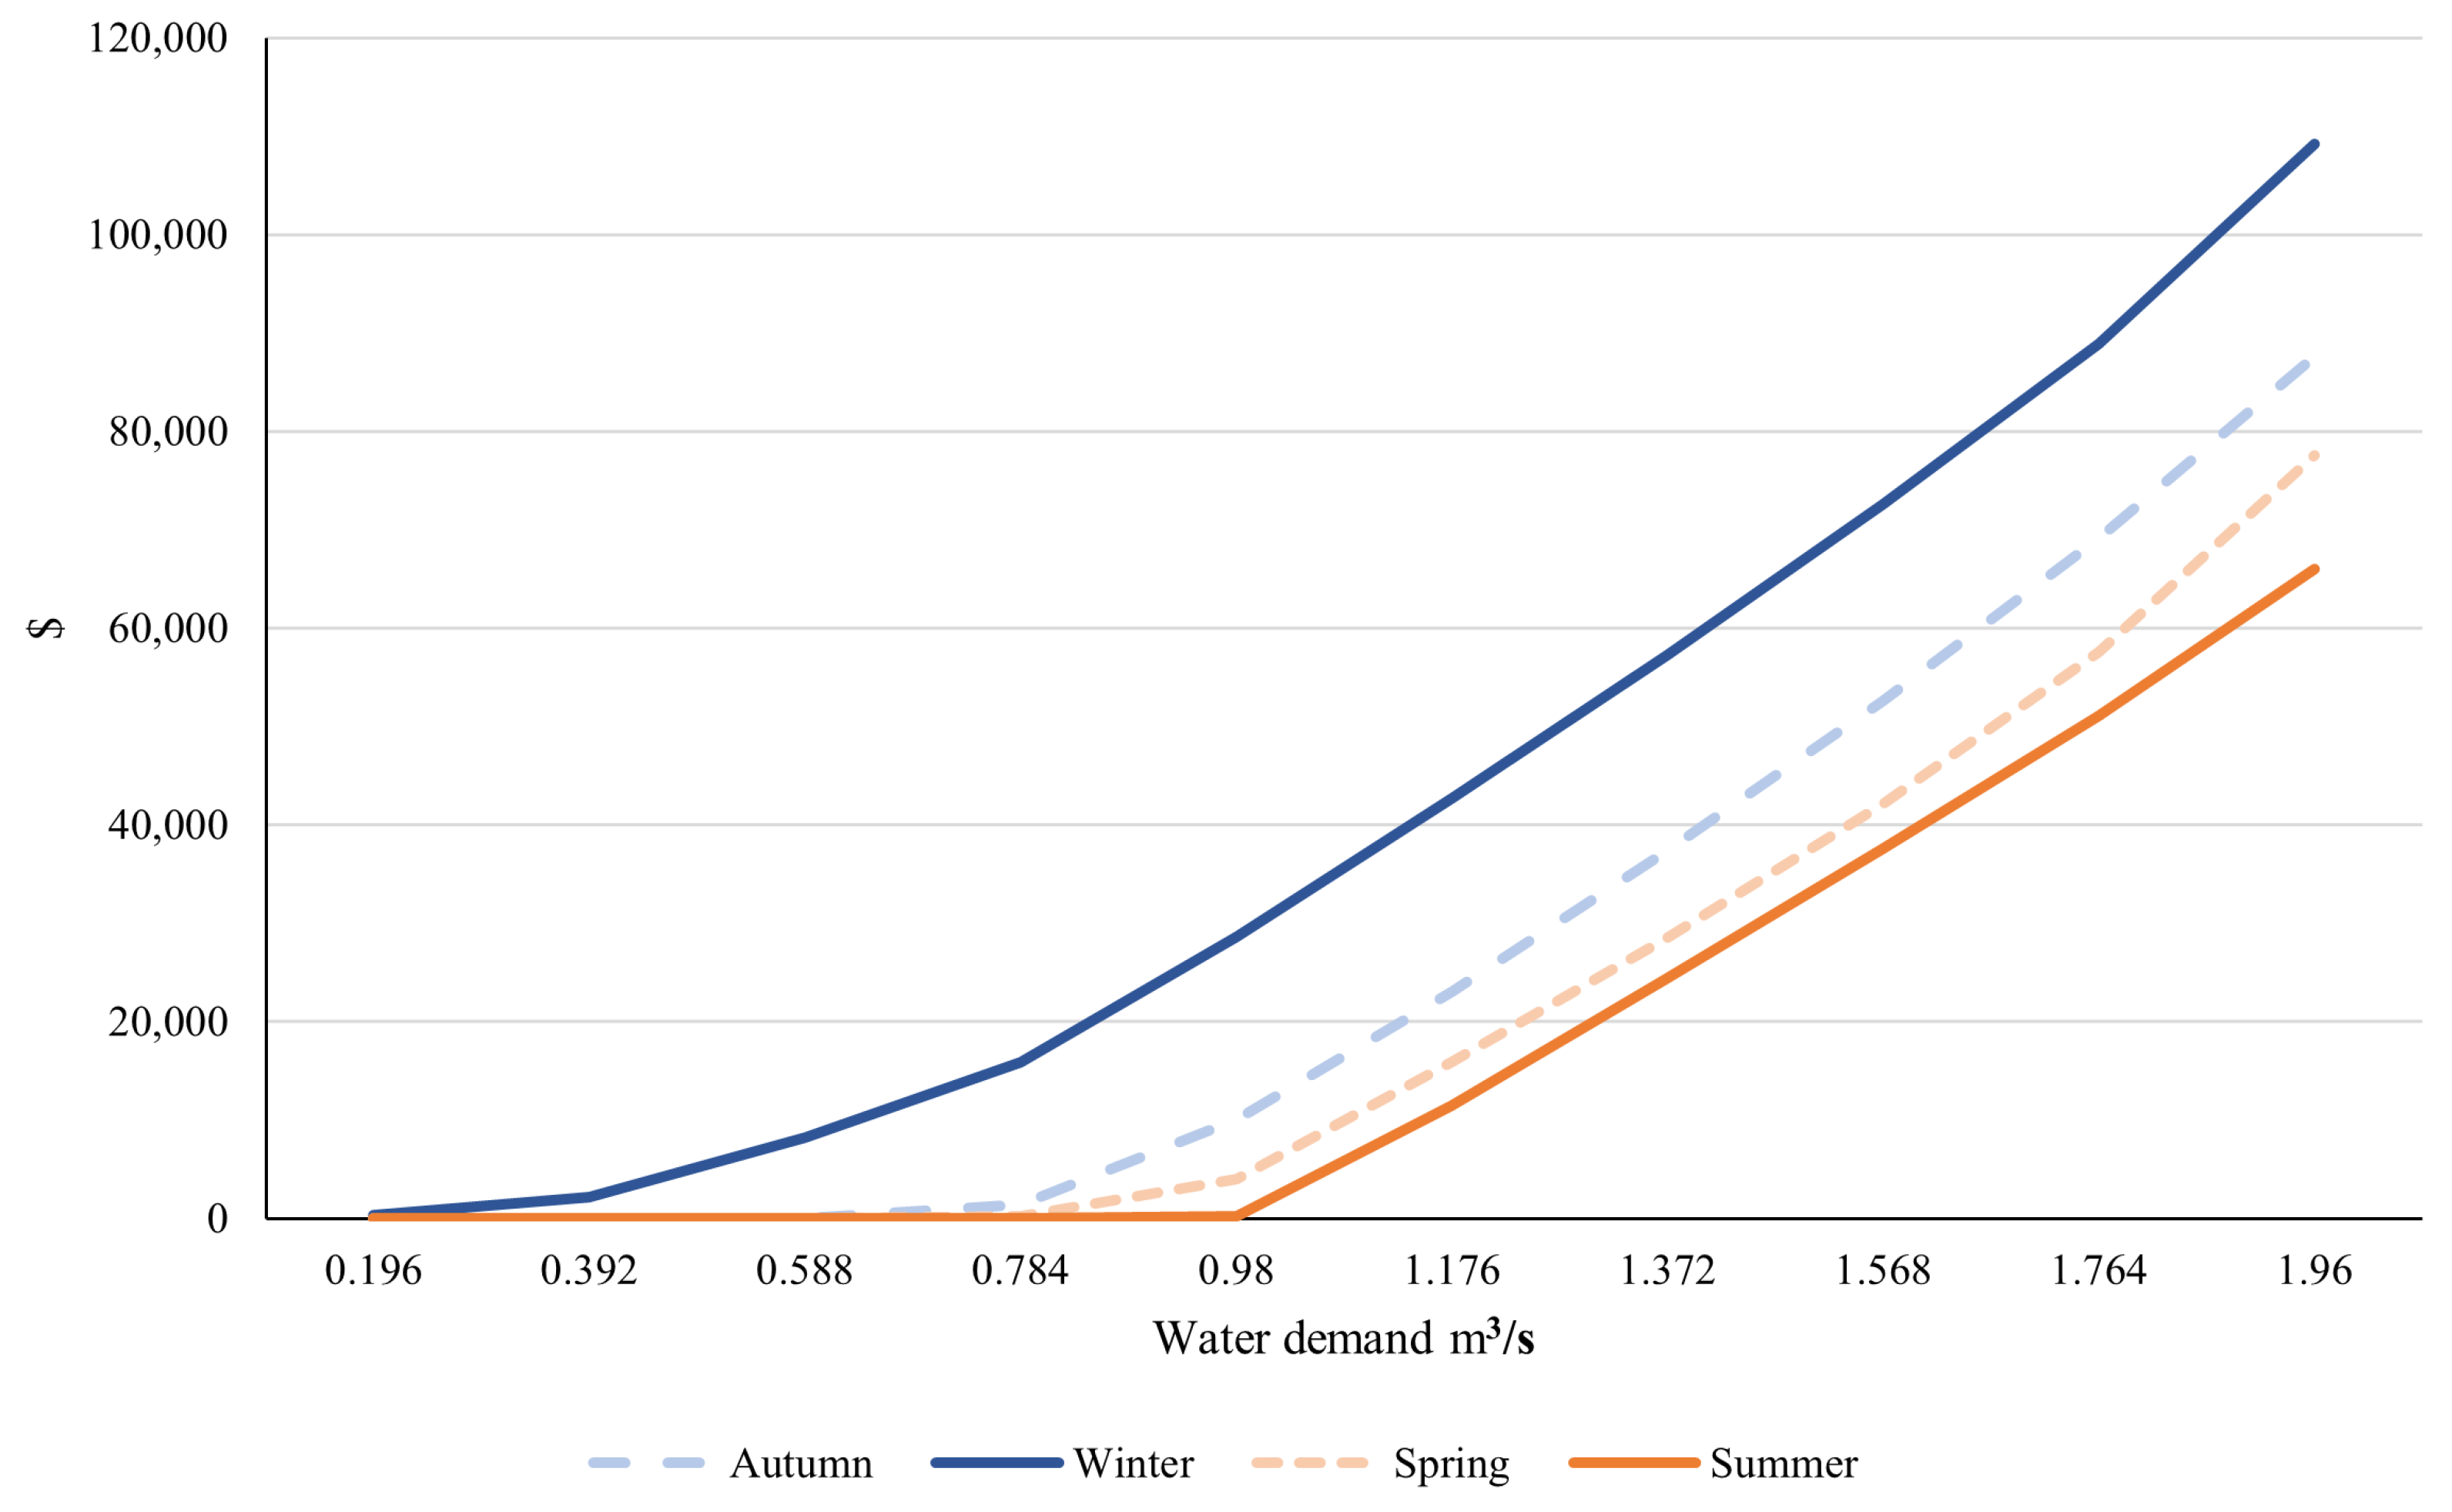
One of the concerns the water consumer may have regarding the water operation and supply is how much pumping costs would increase or decrease if the water demand varies. To study this, we solved the Small WSS of CODELCO (Radomiro Tomic Mine) using BEA (N = 3, = 3, Gurobi Gap = 0.5%) with no policies for each season and varied the mine water demand over a discretised range from 0.19 m3/s to 1.96 m3/s, which is the maximum water flow allowed by the water pipes.
The results are shown in
Figure 18, confirming the anticipated trend: greater water demand correlates with a higher optimal objective function. Specifically, augmenting the original water demand of 1.5 m
3/s by an additional 0.46 m
3/s results in a roughly 70% rise in costs across all seasons. Additionally, the seasonal patterns persist, with warmer days associated with lower costs.
It is noteworthy that achieving a comparable cost to that of winter requires a 0.5 m3/s increase in water flow during summer. In essence, while transporting approximately 1.6 m3/s at USD 40,000 in summer achieves the same cost efficiency as in winter; only 1.1 m3/s can be transported during the colder months.
4.6. Computational Performance for Checking Optimality
An alternative way to compare the computational efficiency of different models is to investigate how quickly each model proves optimality. There are two ways of doing this: using the optimal solution and the optimal value to test the model.
The first way of doing this is by evaluating the model’s speed when the optimal solution is given as the initial point. The first row of
Table 12 in each block represents the model without using this initial point. The binary expansion approach is set to stop with a 0.5% Gurobi Gap to obtain the optimal solution. Then, that optimal solution is given as a starting point for the solver, and it always returns the new optimal solution with a 0% Gurobi Gap. In this case, the BEA with N = 3 model verifies the optimal solution in less than 2 s, whereas the MINLP problem using the Gurobi MINLP solver takes almost double that time. As expected, the higher the N value is, the longer it takes to solve.
The second way to verify if the restrictive approach is reaching optimality is by adding a constraint that is a lower bound for the optimal value. Like in the first optimality check, the second time the model is run the Gurobi Gap is 0%. In this approach, the BEA model is faster in realising that the optimal value is the same as the given constraint (see
Table 13).
These results show us again, in computational terms, that the binary expansion approach is more efficient than the original formulation because it takes less time to verify that it is the optimal solution.
In summary, the BEA technique allows us to solve the optimal operation of a water network in a reasonable computational time with a small gap compared with other solvers. The latter is relevant because the water network operator needs to have a solution on a day-ahead basis. Also, the BEA approximation does not need to take a large number of partitions to obtain a good result. Henceforth, our recommendation is to use between three and five partitions, depending on the size of the water network.
