1. Introduction
The liberalization of the electricity sector was motivated by the benefits that competition brings, including an efficient allocation of production resources and investments from the private sector. Nevertheless, the presence of dominant agents, flaws in the regulatory framework, and demand inelasticity, among other factors, lead to the emergence of inefficiencies that are not typical of competitive markets. These inefficiencies distort the price, and with them, generate misleading signals for market agents to make decisions. For said reasons, any measure that improves the conditions of healthy competition in an electricity market is necessary.
The Colombian wholesale energy market is not invulnerable to market inefficiencies, and as an aggravating factor, regulated demand assumes the inefficiencies of the energy purchases made by the electricity retailers. The regulated demand corresponds to 70% of the country’s demand, and they are consumers that, in the last 6 months, had an average power demand of 0.1 MW, or 55 MWh of energy each month. This corresponds primarily to residential, commercial, and small industrial users. While these users have the option to switch their retailer, the practical barriers of technological requirements and associated costs often impede such changes. In practical terms, the regulated demand is captive to the retailer. The aggravating factor lies in the fact that the majority of energy users in Colombia are assuming, through tariffs, the inefficiencies of the electricity retailer in managing their energy purchasing portfolio along with certain risks—primarily market-related. These market-related risks are detailed in
Section 3 of this article.
This article shows and discusses the inefficiencies of the Colombian electricity market and how these are assumed by regulated users. For this purpose, an analysis is conducted of how the tariff structure established by the country’s regulators, the Energy and Gas Regulatory Commission (CREG by its acronym in Spanish), determines the way in which the costs of energy purchases along with market risk, among other things, are transferred to regulated users. Additionally, some market variables are analyzed that show the current difficulties that retailers face in managing their energy purchasing portfolio, which exacerbates the problem for regulated users.
To overcome these inefficiencies, this article proposes a new agent that fulfills the role of the market maker. This new agent serves as a facilitator in managing the risks of the retailers’ energy purchasing portfolio, thereby transferring efficient costs of the tariff to the end-user. And, though the electricity market requires a series of adjustments that have been addressed in other studies [
1], this article analyzes the functions and the impact of a market maker, as these aspects have not been studied in depth in previous works, to the best of our knowledge. While the impact of market makers is widely known in developed financial and energy markets, this proposal focuses on an electricity market that has not yet reached an important level of maturity in terms of the number of participants (energy supply) or active demand participation.
This study complements existing literature regarding risk management by incorporating market-maker mechanisms based on factual elements applied to a particular market, a situation not detailed in academic articles. Additionally, as an extra contribution, since Colombia is the first country in Latin America to have an electricity futures market, this proposal serves as a reference for countries with similar contexts and environments as Latin American countries, a situation that, to the best of our knowledge, is not detailed in the academic literature.
Specifically, this work contributes by (i) demonstrating the negative effects on electricity-regulated users in Colombia due to the lack of liquidity in the futures market, which forms the backdrop of the problem, and (ii) developing a conceptual model for the market maker that is tailored to Colombia’s current institutional framework to facilitate its integration and thus minimize the regulatory effort required for its implementation. This is crucial as market makers that do not align with the specifics of the existing institutional framework may not achieve the intended effects, (iii) numerically demonstrating the positive impact of incorporating the market maker, and (iv) proposing regulatory measures to support the market maker, aiming to enhance its overall impact.
This article is organized as follows:
Section 2 revises existing literature related to the inefficiencies of the energy markets, hedging mechanisms, and the effects of market makers.
Section 3 analyzes the tariff structure in Colombia and how it transfers inefficiencies to the end-user. It also illustrates the inefficiencies the current Colombian market faces.
Section 4 presents and discusses a new proposal to incorporate a new agent that dynamizes the standardized anonymous market as well as its principal product—energy futures. This new agent will inject liquidity into the energy futures, providing an instrument that allows for effective, active management of different types of risks that the electricity retailers face. A quantitative analysis of the market maker’s impact is also presented in
Section 4. Finally, the conclusions of this work are found in
Section 5.
2. A Review of Hedging Mechanisms for Market Risk and the Impact of Market Makers
The liberalization of the electricity sector brought challenges to creating an efficient market due to the presence of vertically integrated agents, demand inelasticity, energy price volatility, the presence of financial risk, and market power, among other factors. These factors have had a negative effect on market performance. For instance, in [
2], it is shown that the restructuring of the wholesale energy market in California resulted in market power abuse, causing energy price increases above competitive levels. In [
3], it is pointed out that the lack of regulation for generation companies to declare their costs leads to the introduction of asymmetry in information and market power. In [
4], it is argued that the lack of competition, the congestion of the transmission network, and the declaration of unavailability push up electrical energy prices. For said reasons in [
5,
6,
7], it is recommended to adopt measures to improve the efficiency of the electricity market. Among these measures, it is recommended to promote competition to invigorate the market and to oversee producers’ behavior to identify and rectify undesirable practices. Likewise, it is recommended to increase investments in electricity networks and implement regulatory changes when required, with the goal of adequately responding to the changing dynamics of the market and ensuring a competitive and efficient environment.
Conversely, the short-term market exposed agents to market risk due to the high volatility of energy costs, which can lead to economic loss [
8]. This volatility is because of many factors, such as electrical energy coming from different technologies, transmission network congestion, errors made in demand projection [
9], market design [
10], and the stochasticity of renewable energy resources [
11,
12,
13]. Because of the negative impacts of market risk, ref. [
14] suggests that diversifying the generation matrix, improving demand response, and improving regulations will reduce exposure to market volatility.
Traditionally, OTC contracts have been used in energy markets as a means to mitigate market and volume risk [
15]. Additionally, they allow for operational and financial planning of companies by managing long-term prices [
16]. One of the advantages of these kinds of contracts is that they adjust to the needs of the agents as well as are used to promote investments in the generation and diversification of the energy matrix [
17]. Ref. [
18] studies the interaction between bilateral contracting and the spot market, concluding that the spot market variance decreases with OTC contracting.
While bilateral contracting is a protection against market risk, it is also true that through it, inefficiencies can occur that affect short-term market prices. Ref. [
19] shows how bilateral contracts can be used to manipulate the market when there is an agent with a dominant position. Ref. [
16] creates a stochastic model to evaluate bilateral contracts and quantify the risk premium that emerges in this type of negotiation. Ref. [
17] quantifies the credit risk and its respective spread in Brazil. Ref. [
20] creates an indicator to measure credit risk considering government policies that affect retailers and the market share they serve.
Derivatives markets have emerged as an alternative to OTC contracting, specifically in electricity futures. This is because of the anonymity between purchasing and selling agents, which leads to an efficient price formation, avoiding the inefficiencies of direct negotiation that occur with the OTC [
21]. In [
22], it is notable that derivatives allow signaling that promotes competition and participation of new agents and investors.
A reliable spot market, one that allows for the precise, quick settlement of positions, must exist for a futures market to develop [
23]. Additionally, the commodity price should be volatile to attract speculators to inject liquidity. Nevertheless, energy futures are subject to specific considerations that are different than the majority of commodities. In [
24], the lack of storage is shown to prevent arbitrage from pushing the spot price and futures price to converge, causing basis risk. This type of risk can increase as the date of expiration approaches.
The efficiency of futures as a hedging mechanism has been addressed by several authors. Ref. [
25] estimates the hedging ratio to minimize the volatility of a portfolio composed of energy purchases in the spot and futures markets. They conclude that short-term futures hedging reduces the volatility of the portfolio. Ref. [
26] concludes that electricity futures reduce market risk more effectively than cross-hedging. That is, they are an effective tool for financial risk management in electricity markets. Ref. [
27] study the impact of two types of futures contracts (base load and peak load) as hedging tools for retailers. The authors conclude that both contracts allow hedging against market risk. Conversely, ref. [
28] illustrates that energy futures, under certain circumstances, show limited coverage. This is principally explained by the low covariance between the spot and futures price.
Market makers are specialized agents whose purpose is to improve the market in terms of liquidity, transparency, price discovery, volatility mitigation, and reducing the spread between bid and ask prices [
29]. Additionally, these market makers mitigate the risk associated with information asymmetry [
30]. The previous characteristics promote the participation of new agents, competition, and the development of new financial products that can be used for speculation or hedging [
31].
The impact of market makers in commodity financial markets, as well as their interactions with other agents, has been explored in academic literature. For instance, in [
29], empirical evidence is presented about how market makers increase liquidity and diminish volatility in an emerging market like the Shanghai stock exchange (STAR Market). Alternatively, ref. [
32] studies the relationship that market makers have with firms that are geographically close. This proximity allows for better access to formal and informal news, and with that, a better understanding of the local economy, providing more context and, in turn, more efficient price formation. Additionally, in [
33], it is studied how the entrance of market makers in places dominated by intermediaries drives a more efficient market structure. Nevertheless, it is important to recognize that, though market makers intend to maximize their utility, this approach can introduce inefficiencies that affect price stability, as is illustrated in [
34].
In electricity markets, the effect of the market makers has been addressed by [
35], in which the authors show that market makers enabled balancing buying and selling volumes. In [
36], it is shown that an increase in the number of market makers decreases the liquidity premium of energy futures. Finally, ref. [
37] proposes a decentralized market model through an autonomous market maker for prosumers in isolated geographical areas, guaranteeing the liquidity and formation of a fair price, which demonstrates the innovative and transformative potential of market makers in the electricity sector. While market makers aim to improve the efficiency of the markets, from liquidity to transparency, the effectiveness and the impact of these agents can vary due to a number of factors, including a flawed market design, the regulatory environment, the institutional framework, and the very implementation of the market maker itself [
38].
3. Market Risk and the Inefficiencies of the Hedging Mechanisms
In this section, it is evident how market risk currently transfers to regulated users (residential, commercial, and small-industry users) through tariffs and how the principal hedging instrument that is available for an electricity retailer (OTC contracts) presents inefficiencies to mitigate market risk. Though the transfer of market risk to the regulated user is not a problem in and of itself, as the consumer of any kind of good or service assumes the costs of service provision through tariffs, the difficulty lies in the inefficiencies of hedging instruments in fulfilling their objectives and the fact that different obstacles (technological and economic) exist, making it difficult to change the provider for these types of users in Colombia. Also, the inefficiencies of standardized contracting, which could be the other hedging instrument but today lacks liquidity, are evident.
3.1. Market Risk Transfer Via Tariffs
The regulated demand in Colombia is subject to a tariff regime established by the Energy and Gas Regulatory Commission (CREG, in Spanish). The CREG defines service provision costs assumed for this type of user. Specifically, the tariff formula, illustrated in Equation (1) and established in [
39], explicitly shows the causality of each one of the costs of the distinct activities. With this, the unitary cost (
CU, in Spanish) of energy is defined. This tariff is volumetric, though the regulation allows other schemes like demand charges, time of use, etc. However, these other schemes are not widespread in the country. The variables from left to right represent the cost of generation (
), cost of transmission and distribution (
and
), cost of retailing (
), cost of losses (
), and, finally, the cost of restrictions (
) that originate as a consequence of limited transport capacity and the fact that in the country, the price formation is at a single node. The subscripts denote the voltage level
n for which the
CU is calculated, month
m in which the components of the unitary cost are settled, and the subscripts
i and
j denote the electricity retailer and the market it served, respectively.
The mechanisms used by retailers to acquire energy and transfer these costs to regulated users are recognized in the
component of the
CU. Those of importance for the purpose of this study are illustrated in Equation (2a–d) [
40], in which the subscripts that are not required in the context of this article are omitted (see
Appendix A for detailed descriptions of the
).
Bilateral contracting has traditionally dominated electrical energy negotiations in Colombia, and most transactions are made through this mechanism. Energy purchases through bilaterial agreements are renumerated as described in (2a), in which the percentage of energy covered by the retailer through these contracts is recognized and denoted by the product . Equation (2a) weights the average price of acquired bilateral contracts by the retailer to meet the regulated demand, denoted as , and the average price of all contracts in the market, denoted as . The weighting is determined by the factor α.
In (2b), energy purchases acquired in auctions for long-term contracts for non-conventional renewable energy resources (principally wind and solar) are renumerated, which are used to promote these types of generation sources. The product, , determines the percentage of energy acquired for these kinds of contracts that are recognized by the price of auction, denoted as . In (2c), the purchases made through standardized contracting mechanisms, among them electricity futures, are transferred, and the sum total recognizes all the products traded in this market. The logic of (2c) is similar to the aforementioned components in that the percentage of energy acquired by a particular product, , is recognized at the price of the product, .
Finally, Equation (2d) transfers the percentage of energy not covered by contracting mechanisms and acquired in the spot market, indicated by (), and recognized at the spot market price, . Note that this last term exposes the regulated user to market risk, a situation that can be exacerbated when the supplier has low coverage levels because it brings the expression within the parenthesis closer to one. Also, note that market risk exposure is promoted by the weighting factor α in (2a), in that this value does not allow for a complete transfer of the full contract value.
3.2. Inefficiencies in Hedging Mechanisms
3.2.1. A Volatile Asset—The Spot Market Price
The price of electrical energy in the short-term market is highly volatile and explained, in Colombia, by the price of fuel for thermal resources, network transportation limitations, and mostly by the “El Niño” phenomenon, which significantly reduces rainfall and, consequently, reservoir levels in a country that is highly dependent on hydraulic resources.
Figure 1a illustrates this situation, in which the average daily spot price in the market in cents per kWh (in dollars) is shown (all monetary values in this paper are in US dollars, using an exchange rate of 3866 USD/COP, which corresponds to the average exchange rate of April 2024). The highest registered price coincides with the El Niño phenomenon, which occurred between 2014 and 2016. Likewise, notable increases are observed in 2010 and 2020. Note how these price changes are transferred to regulated demand, as explained in Equation (2d). While the market counts on a scarcity price that corresponds to the maximum value the demand can pay for electricity in the country, this is not a hedging instrument that provides protection from market spikes.
Figure 1b evidences the volatility of the price of energy in
Figure 1a with an asset that is considered highly volatile in Colombia, the exchange rate between the US Dollar (USD) and the Colombian Peso.
Figure 1b is determined as a logarithm of the ratio between the price of the asset (the exchange rates or energy) at two different points in time.
Figure 1b shows that the price of energy is much more volatile when it is compared with an asset that is considered high-risk in the country. Moreover, as is illustrated in
Section 3.1, this volatility is assumed by regulated users because the tariff structure allows the transfer of this market risk to the user. This volatility poses a risk to the system, particularly in situations of illiquidity and low coverage, such as those currently faced by retailers because of the tariff option (a temporary measure that enabled the freezing of tariff increases during the pandemic, and with that, the accumulation of liabilities that are currently recognized in the tariff). In such cases, a systematic risk event can emerge, endangering the electricity supply in the country.
3.2.2. Inefficiency of OTC Contracts
One mechanism widely used in the wholesale electricity market (MEM by its acronym in Spanish) is bilateral, or OTC, contracts as a hedging instrument to counteract the volatility discussed in the previous section. These negotiations are made through a centralized system of public calls to provide transparency to the negotiation process. Nevertheless, this type of contracting displays discriminatory behavior, like the ones shown in
Figure 2a, in which the average price of contracts directed to regulated users is consistently higher than that of non-regulated users. Reasons for this behavior have been a matter of discussion by the regulating agent without reaching any consensus [
40].
Figure 2b, the average market price of contracts, is compared with the price at which these contracts were acquired by five retailers. It is evident that some retailers negotiate OTC contracts at a higher-than-average price.
The price differences between retailers can be related to the risk perception that generating agents have towards certain retailers, possibly because of management problems, the delayed payment of their obligations, or non-compliance events in the past. These factors could increase the perceived risk of generators when negotiating bilateral contracts, which can translate to a greater risk premium. Although charging a risk premium that reflects the credit risk characteristics of retailers is a common practice, the inefficiency noted is that regulated users bear this premium without having the necessary tools to manage it effectively. In the worst-case scenario, the inability to secure contracts forces retailers to expose their users, particularly those regulated, to the spot market prices. Additionally, the price difference can be reflected by the lack of contracts. This is confirmed by the fact that in the last three years, on average, 40% of the public calls made through a centralized system of purchases (SICEP by its acronym in Spanish) have been declared unsuccessful. This means that a significant amount of energy has not been able to be covered through OTC contracts.
Finally, in the context of bilateral contracting, there is negotiation asymmetry between the electricity retailers and energy producers, which originates from the nature of their roles. This is because the latter have the option not to enter into contracts according to their expectations of the market price, leaving the retailer exposed.
3.2.3. Inefficiency of Standardized Contracts
The Colombian standardized anonymous market (MAE for its acronym in Spanish) is the first of its kind in Latin America. The principal instrument traded in the MAE is energy futures, which, like the bilateral contracts, allow the marketer to minimize exposure to the spot market. Futures involve an agreement on the future price for electrical energy to mitigate market risk. This price remains fixed until the maturity of the futures and will not be indexed to economic indicators such as inflation, as is the case for bilateral contracting.
Nevertheless, this market is characterized by its illiquidity and the lack of participation of agents in both the electricity and financial sectors.
Figure 3 shows the number of times a contract has been traded (left axis) and the percentage of energy covered (right axis), with the maturity indicated on the horizontal axis. For instance, the height of the bar on July 2024 on the left axis indicates that a futures contract has been traded six times and expires in July 2024. This contract covers less than 0.5% of the energy for regulated users, as shown on the right axis. A low volume of transactions and low energy coverage are observed, making it difficult to develop this market.
Conversely,
Figure 4 shows the average monthly price of electrical energy in the spot market and the most liquid futures reference. Both series exhibit a similar pattern, which is expected behavior in these instruments; nevertheless, the problem emerges with the basis risk, which is spread between the spot and the futures prices, caused by illiquidity. This basis risk is one of the causes that impedes the development of this market because the expectations of the futures price are not coherent with those of the spot price. In fact, both series should converge—in a liquid market—to the same value at maturity.
4. Design and Impact of a Market Maker
A liquid standardized market facilitates the transparent formation of the futures price and their trading because of product characteristics, like the size of the contract, settlement type, underlying asset, and maturity, among other aspects. Likewise, a liquid market generates enough information to understand the behavior of the underlying asset price and its volatility over time, which allows for better financial risk, market risk, and counterparty risk management. In
Section 4.1, the conceptual framework of a market maker is developed for the standardized anonymous market in Colombia (MAE by its acronym in Spanish) adapted to the current Colombian electricity market design. The goal is to increase liquidity in electricity futures and, thereby, counteract the situations described in
Section 3.
Section 4.2 demonstrates that futures protect regulated users from market risk, while
Section 4.3 shows how the market maker enhances efficiency and boosts liquidity.
4.1. A Market Maker Coupled with the Current Design of the Colombian Market
Due to the positive impacts a liquid standardized market would have on the Colombian energy market to mitigate market, credit, and systematic risks, this subsection proposes the implementation of a market maker that is compatible with the current design and governance of the standardized market in Colombia. Introducing new agents into a market demands robust regulatory and institutional capabilities. Therefore, any significant changes, like those proposed in this subsection, must align with the existing institutional framework.
In general terms, market makers are specialized financial agents responsible for purchasing and selling financial assets to foster adequate trading conditions. This capability promotes the matching of buyers and sellers. The quantity and price conditions (bid and ask) sent by the market maker in a trading system reflect the market conditions, promoting transparency and allowing all participants to make informed decisions. By ensuring the presence of bid and ask quotes, transactions are executed more quickly, contributing to price stability and liquidity, which is crucial for the market participants’ planning and risk management and favorably influencing their behavior.
To compensate for services rendered, the market maker buys from sellers at lower prices and sells to buyers at higher prices. The difference between these prices is known as the spread and represents their profit. The spread not only recognizes the effort, time, and costs associated with providing quotes and the willingness to trade [
31], so, too, does it compensate for the risk associated with maintaining an unbalanced portfolio, price fluctuations, and the risk of holding a position that does not close. This spread also allows for adverse selection risk management, which occurs when negotiating with a better-informed agent.
For these reasons, this paper proposes a market maker for the Colombian MAE, categorized within Tier 2 (brokers, investment funds, and other investors operating with their own liquidity). This market maker is distinct from a dealing desk-type broker as it does not represent clients’ buy and sell intentions but instead ensures buy and sell prices for the underlying asset over time. This market maker will issue buy and sell orders to Derivex, the current operator of the country’s standardized derivatives market.
The idea of using Derivex is to leverage the proposal with an existing agent in the management of derivatives because it already has the technological and financial infrastructure for managing these products. This new market maker will close positions by buying (or selling) futures contracts at a set price and by selling (or buying) them at a different price to close their position and, with that, materialize the spread. The market maker will take a profit because of their participation, which must be transferred into liquidity in the futures market. Additionally, and considering that the futures market settlement is financial and does not require physical delivery, this new agent does not require electrical generation assets to back up the product. This condition expands the possibilities of participation for parties interested in taking on this new role.
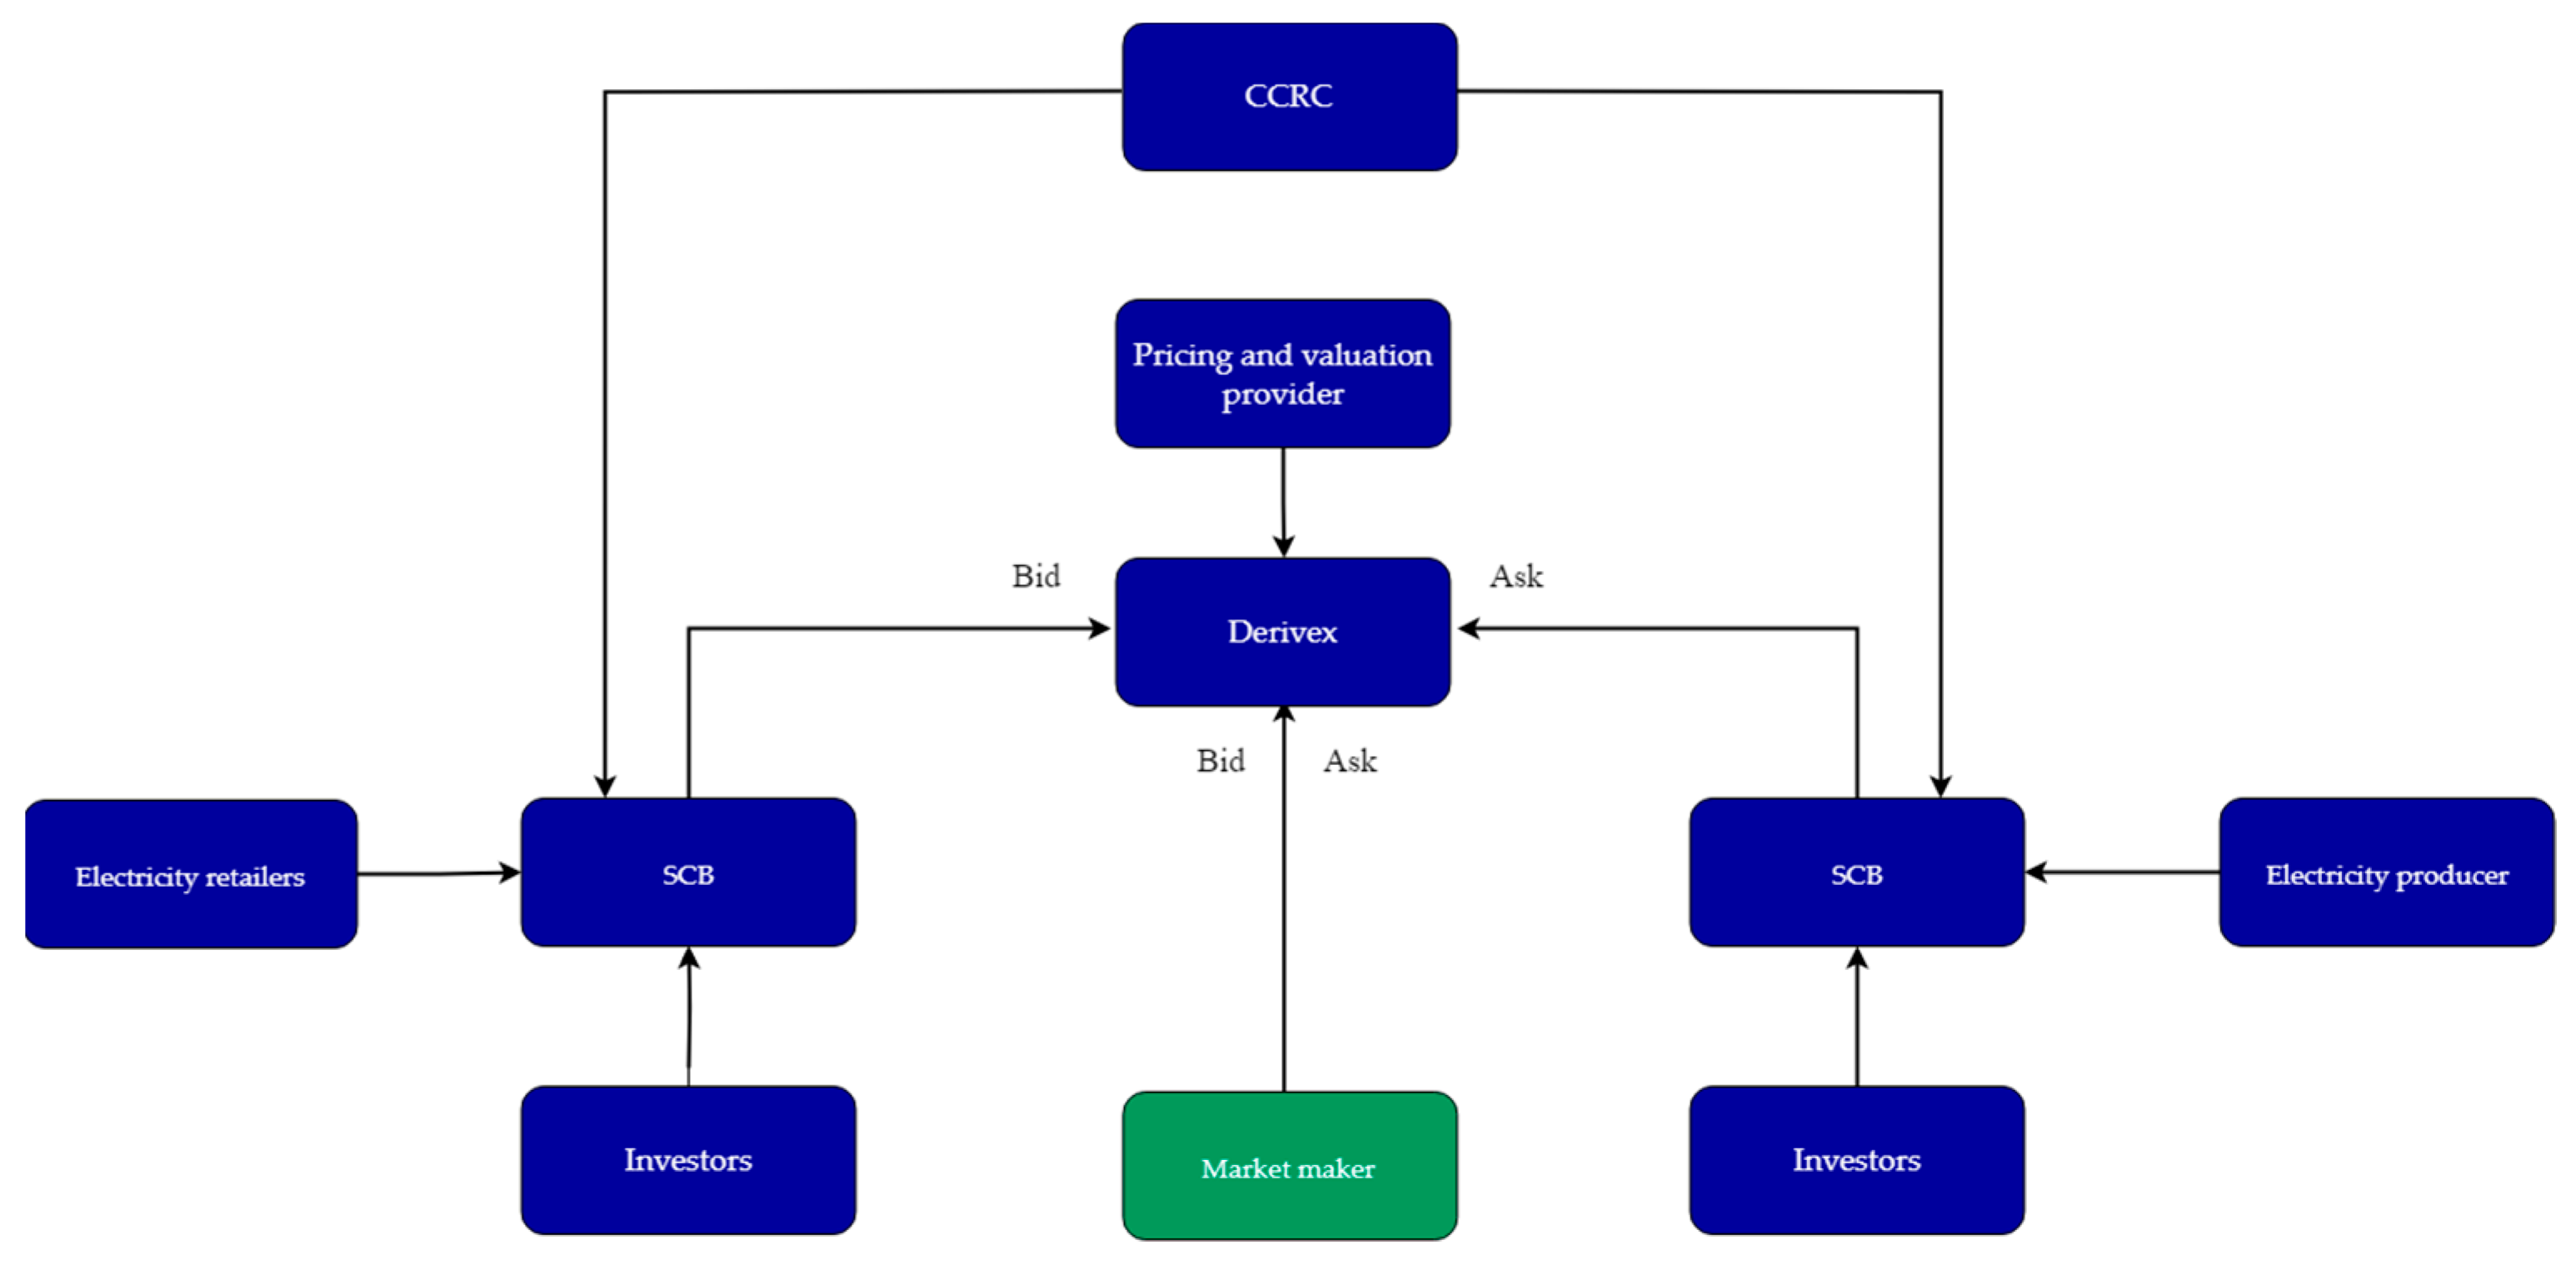
Figure 5 shows how the market maker is integrated into the institutional framework of the electrical energy derivatives market. The blue rectangles represent existing agents, and the arrows represent the flow of information between them. Derivex, as previously indicated, is the derivatives market operator and is the recipient of futures’ buy and sell orders sent by stock brokerage companies (SCB by its acronym in Spanish). Note that the participation in this market is not limited to agents in the electrical energy sector (generators or marketers of energy). Any investor can access this product through a stock brokerage firm. The Central Risk and Counterparty Chamber (CCRC by its acronym in Spanish) administers the guarantees to mitigate counterparty risk and potential defaults that may occur, and if these are insufficient, they make margin calls, demanding new collateral from the participants. Likewise, pricing and valuation providers responsible for supplying derivative valuation prices enable agents to make decisions based on the best valuation available.
Figure 5 shows the new market maker, represented in green. This market maker utilizes current information systems provided by Derivex to send buy and sell orders, with the goal of providing liquidity to the market. The essential criteria that this market maker must meet include the following:
Continuously and simultaneously quote bid and ask prices, both in the opening and closing auctions of the MAE. The opening auction is crucial for price discovery, as it reveals new information that emerges after the last close. Conversely, the closing auction is important because, in it, futures that can be transferred to regulated users are negotiated.
Manage liquidity risk by maintaining positions for long periods of time until finding suitable counterparties or developing alternative hedging strategies with instruments other than those provided by the electricity market. The second option is not available for electricity retailers in Colombia as they are not financial intermediaries. The market maker would have access to several hedging instruments because it is proposed that this new agent be linked to the financial sector.
Establish minimum trading volumes in exchange for a preferential contract price. For this, the creation of a negotiation round on Derivex is proposed, in which the market maker can negotiate directly with generators and other institutional participants.
Avoid speculative actions in the market, as this could lead to inefficiencies when acting like active investors [
34].
Allow the market maker to invest in corelated markets, like those of gas and carbon, to manage risk in an unbalanced portfolio. Likewise, comply with and demonstrate a minimum counterparty risk rating.
Have solid financial solvency that ensures the ability to execute operations within the market. This financial solvency is essential not only to comply with contractual obligations from market activities but also to maintain the trust of other market participants and regulatory entities. The capacity to withstand market fluctuations without compromising its operations is crucial, ensuring stable and continuous provisions of liquidity to the market. This also implies that the market maker must comply with and demonstrate the minimum technical equity requirement established by a competent authority.
Demonstrate effort as a market maker by increasing market liquidity through the continuous quoting of bid and ask prices.
Periodically prepare reports about the standardized Colombian futures energy market, its evolution, and prospects.
This market maker, a participant willing to buy and sell the asset at any time, facilitates the trading of contracts and encourages the participation of other market players. Conversely, implementing regulatory measures that are, to date, non-existent is necessary for the market maker to operate efficiently. The most notable regulatory measures include the following: (i) the establishment of regulatory incentives for minimum coverage levels, such as involving the retailer in the savings generated by hedging through futures; (ii) revise and adjust required guarantee levels for the participation in the MAE because excessively demanding requirements could dissuade the participation of agents and, thereby, increase systematic risk; (iii) establish the maximum spread that the market maker can offer; and (iv) develop new financial products in the local market aimed at effectively managing risk associated with an unbalanced portfolio. These products, such as options, contracts for differences, and swaps, must be designed specifically to equip the market maker with the necessary tools for comprehensive risk coverage, (v) incentivize the participation of speculators in the energy futures market so that investors perceive potential value in these instruments and, thereby, increase the market liquidity and efficiency, and (vi) change management actions by conducting awareness and training sessions on the derivatives market for participants.
It is important to note that setting a minimum coverage level would lead to more contracts being closed, thereby increasing transaction volumes, both with and without the market maker’s presence. However, if the regulatory coverage requirement solely affects the contract price, this price might not efficiently reflect the contract’s true value. Regulatory demands would shape participants’ expectations more than pure supply and demand dynamics. In contrast, a market maker seeks to enhance liquidity by increasing buying and selling activity, which reflects participants’ expectations about the traded asset’s price. This dynamic tends to reduce price variations due to higher liquidity in buy and sell prices. As proposed in the article, both measures—the establishment of minimum coverage levels with incentives and the implementation of a market maker—are complementary and necessary. While the first measure ensures a base volume of transactions, the second improves market efficiency and transparency, ensuring that prices better reflect real supply and demand conditions and participants’ expectations.
Lastly, a regulatory measure currently in effect in the Colombian market aims to implement the reduction in the electricity purchase threshold for retailers that are vertically integrated with generators. Ensuring a reduction in this value allows a portion of this energy to be traded through the MAE. Of equal importance is the recommendation to implement professional certifications in the industry that accredit the technical and professional capabilities of the people associated with the market maker. This can be with a competency validation suitability exam, elevating financial and market standards specific to the Colombian electricity market.
4.2. Impact of Market Maker on Market Risk
The numerical analysis of this subsection is constructed with multiple scenarios using the Bootstrap method, which is widely used in the literature for non-parametric studies. This is because there is little data to determine a distribution for the spot market price or for the futures price in Colombia.
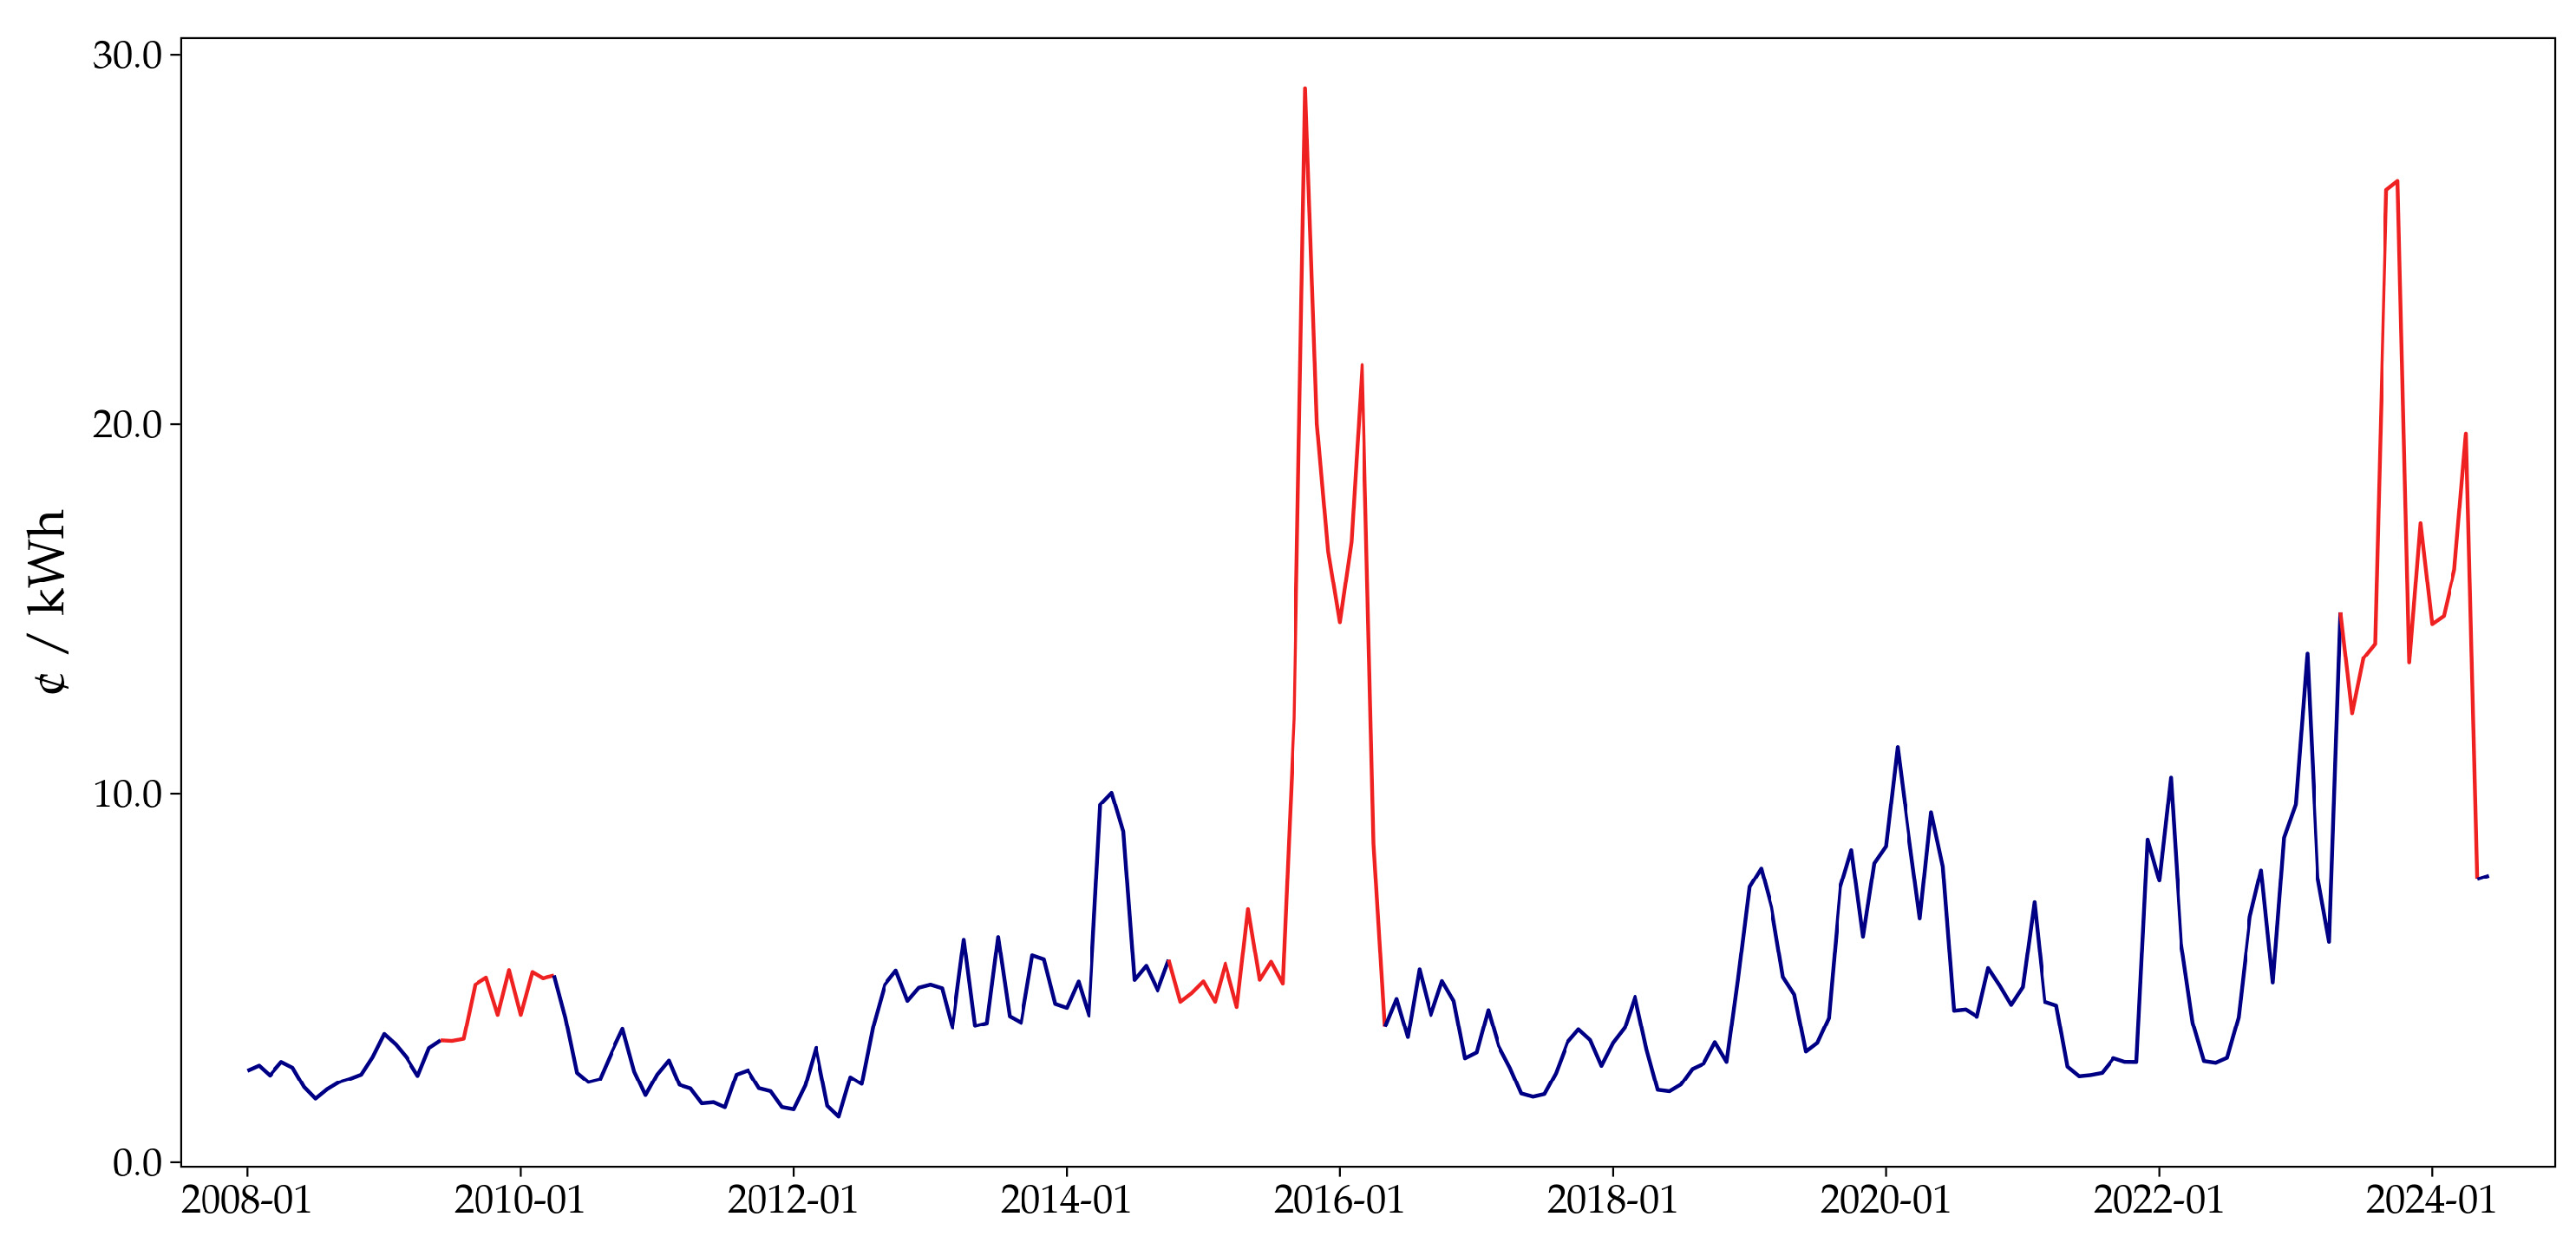
Figure 6 shows the average monthly prices observed in the spot market from January 2008 to June 2024, where prices during the El Niño phenomenon are highlighted in red. This phenomenon, characterized by low hydrology conditions, leads to price increases due to reduced hydropower supply (approximately 60% of the energy supply is hydro-dependent).
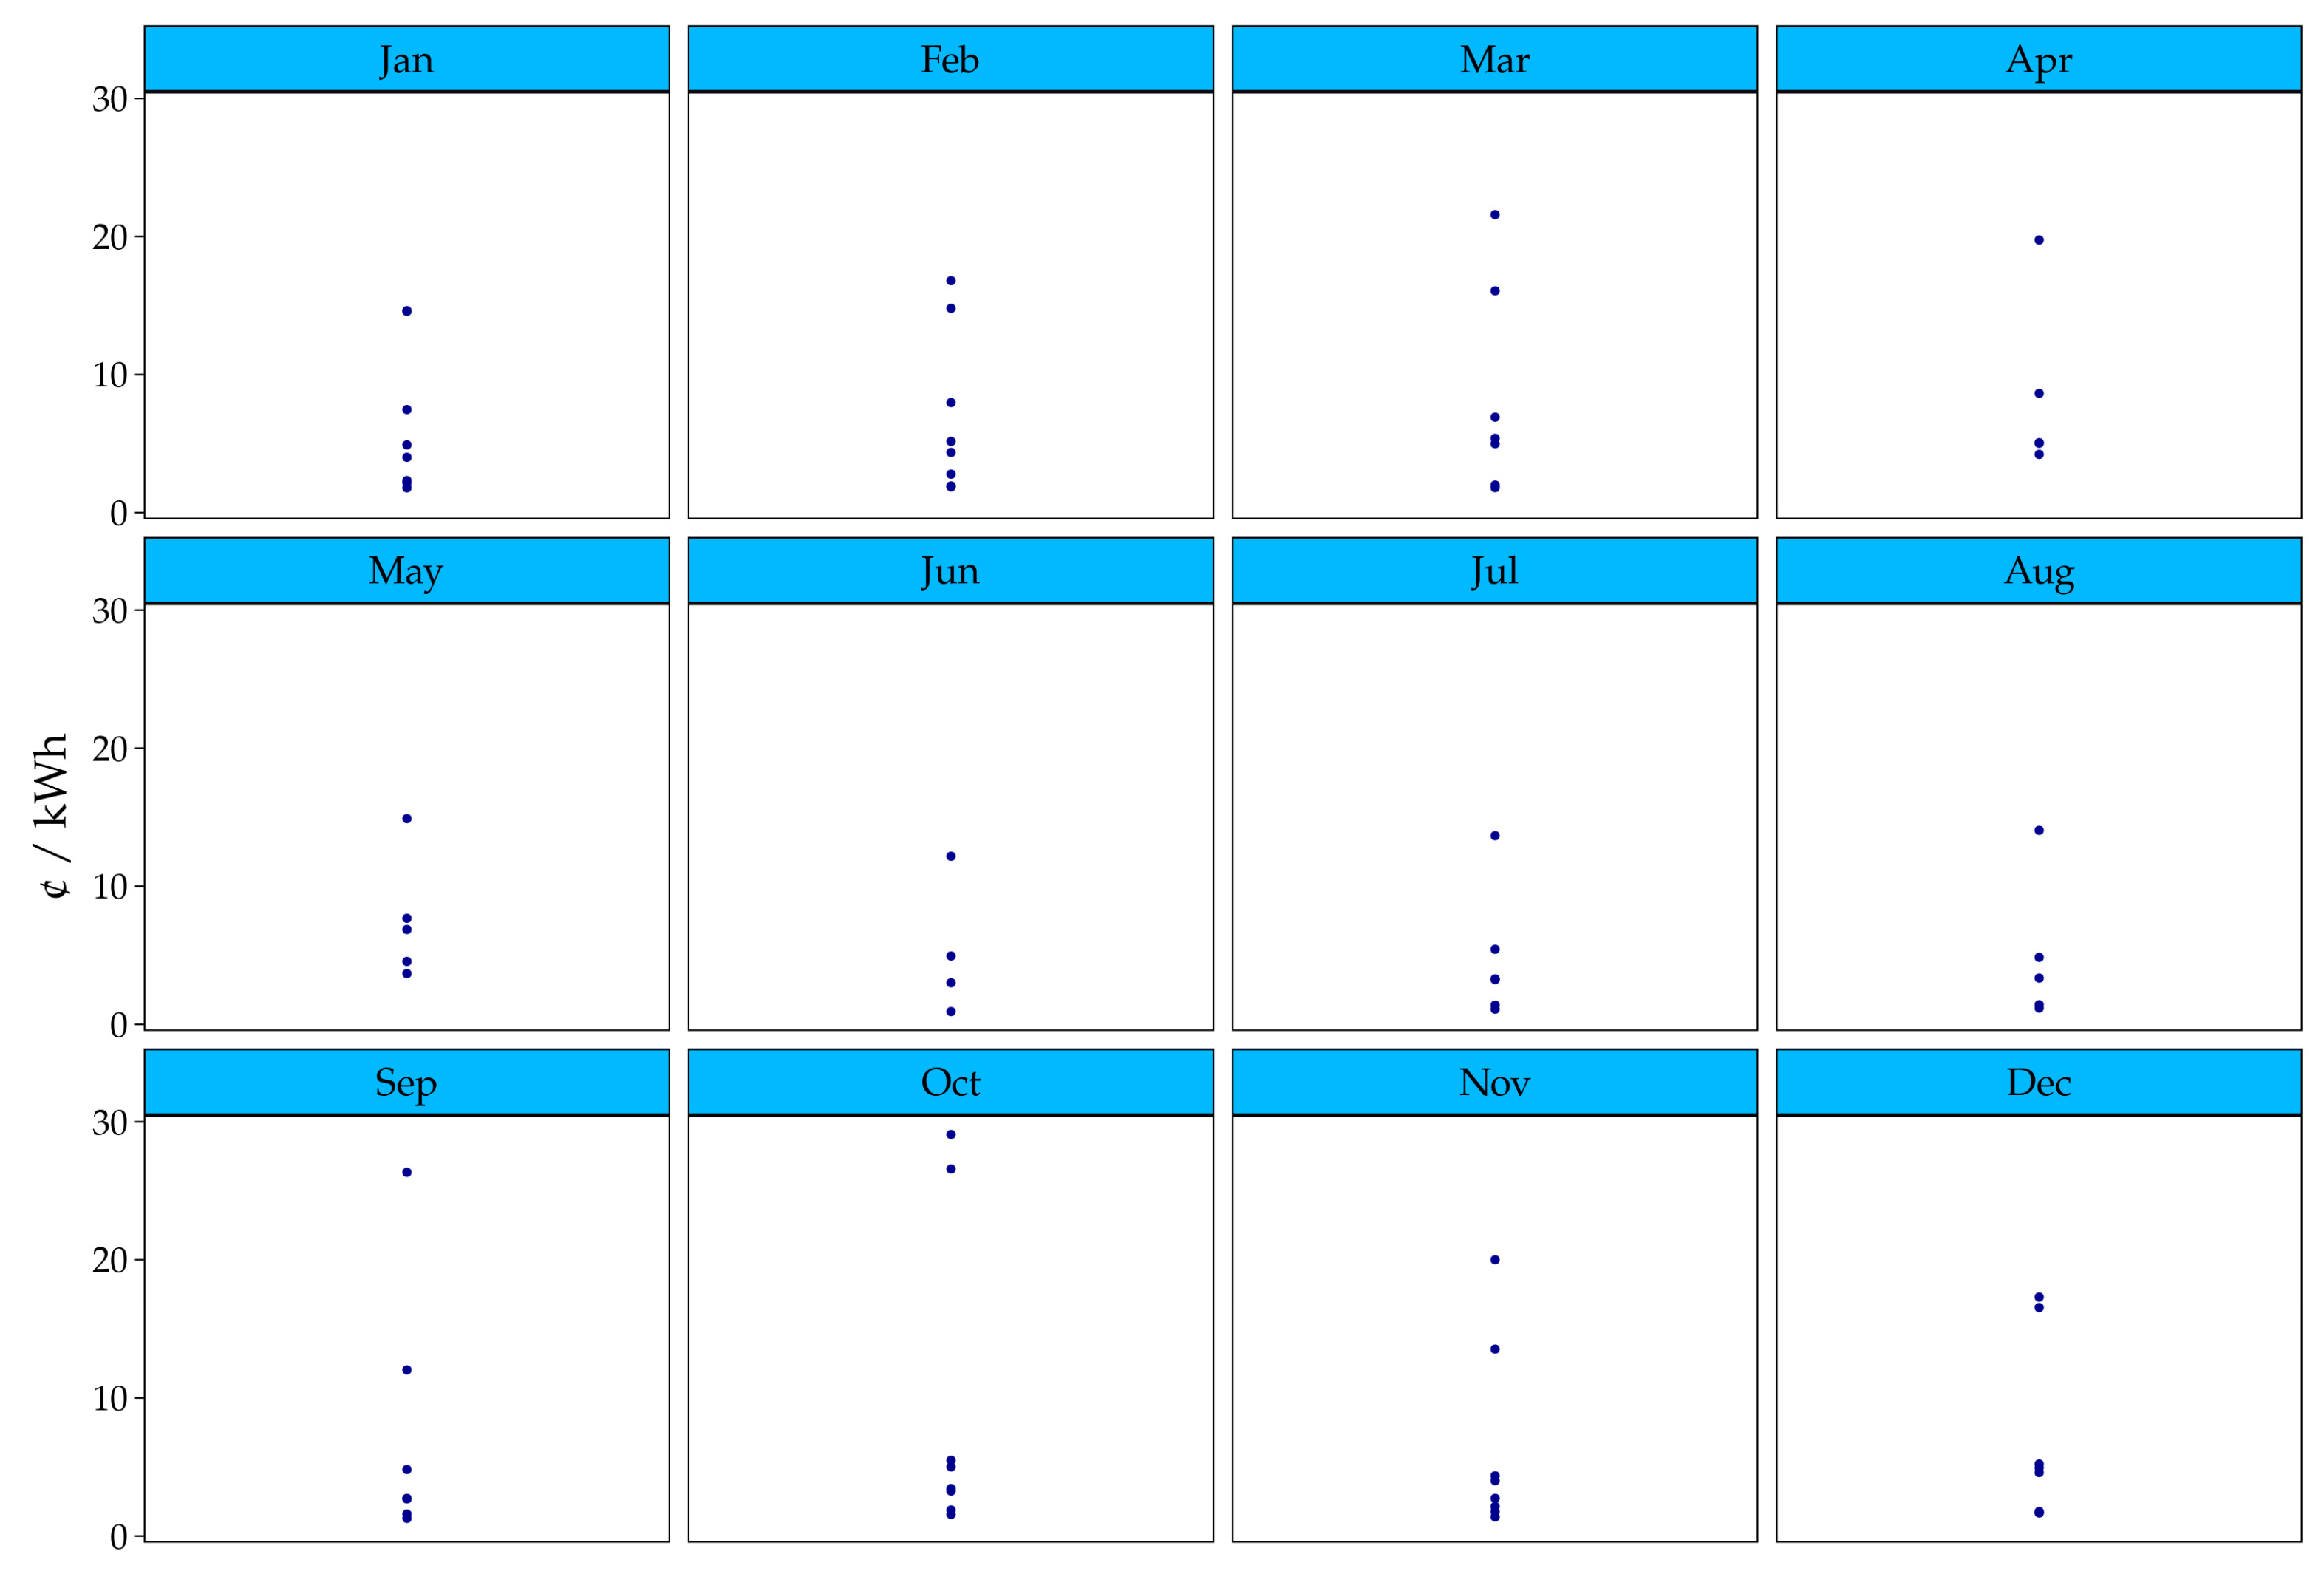
Figure 7 shows the prices from
Figure 6, separated by each month in which they materialized. For example, the top left box of
Figure 7 corresponds to all January prices from
Figure 6, the box to its right to February prices, and so on. This separation is performed for sampling purposes.
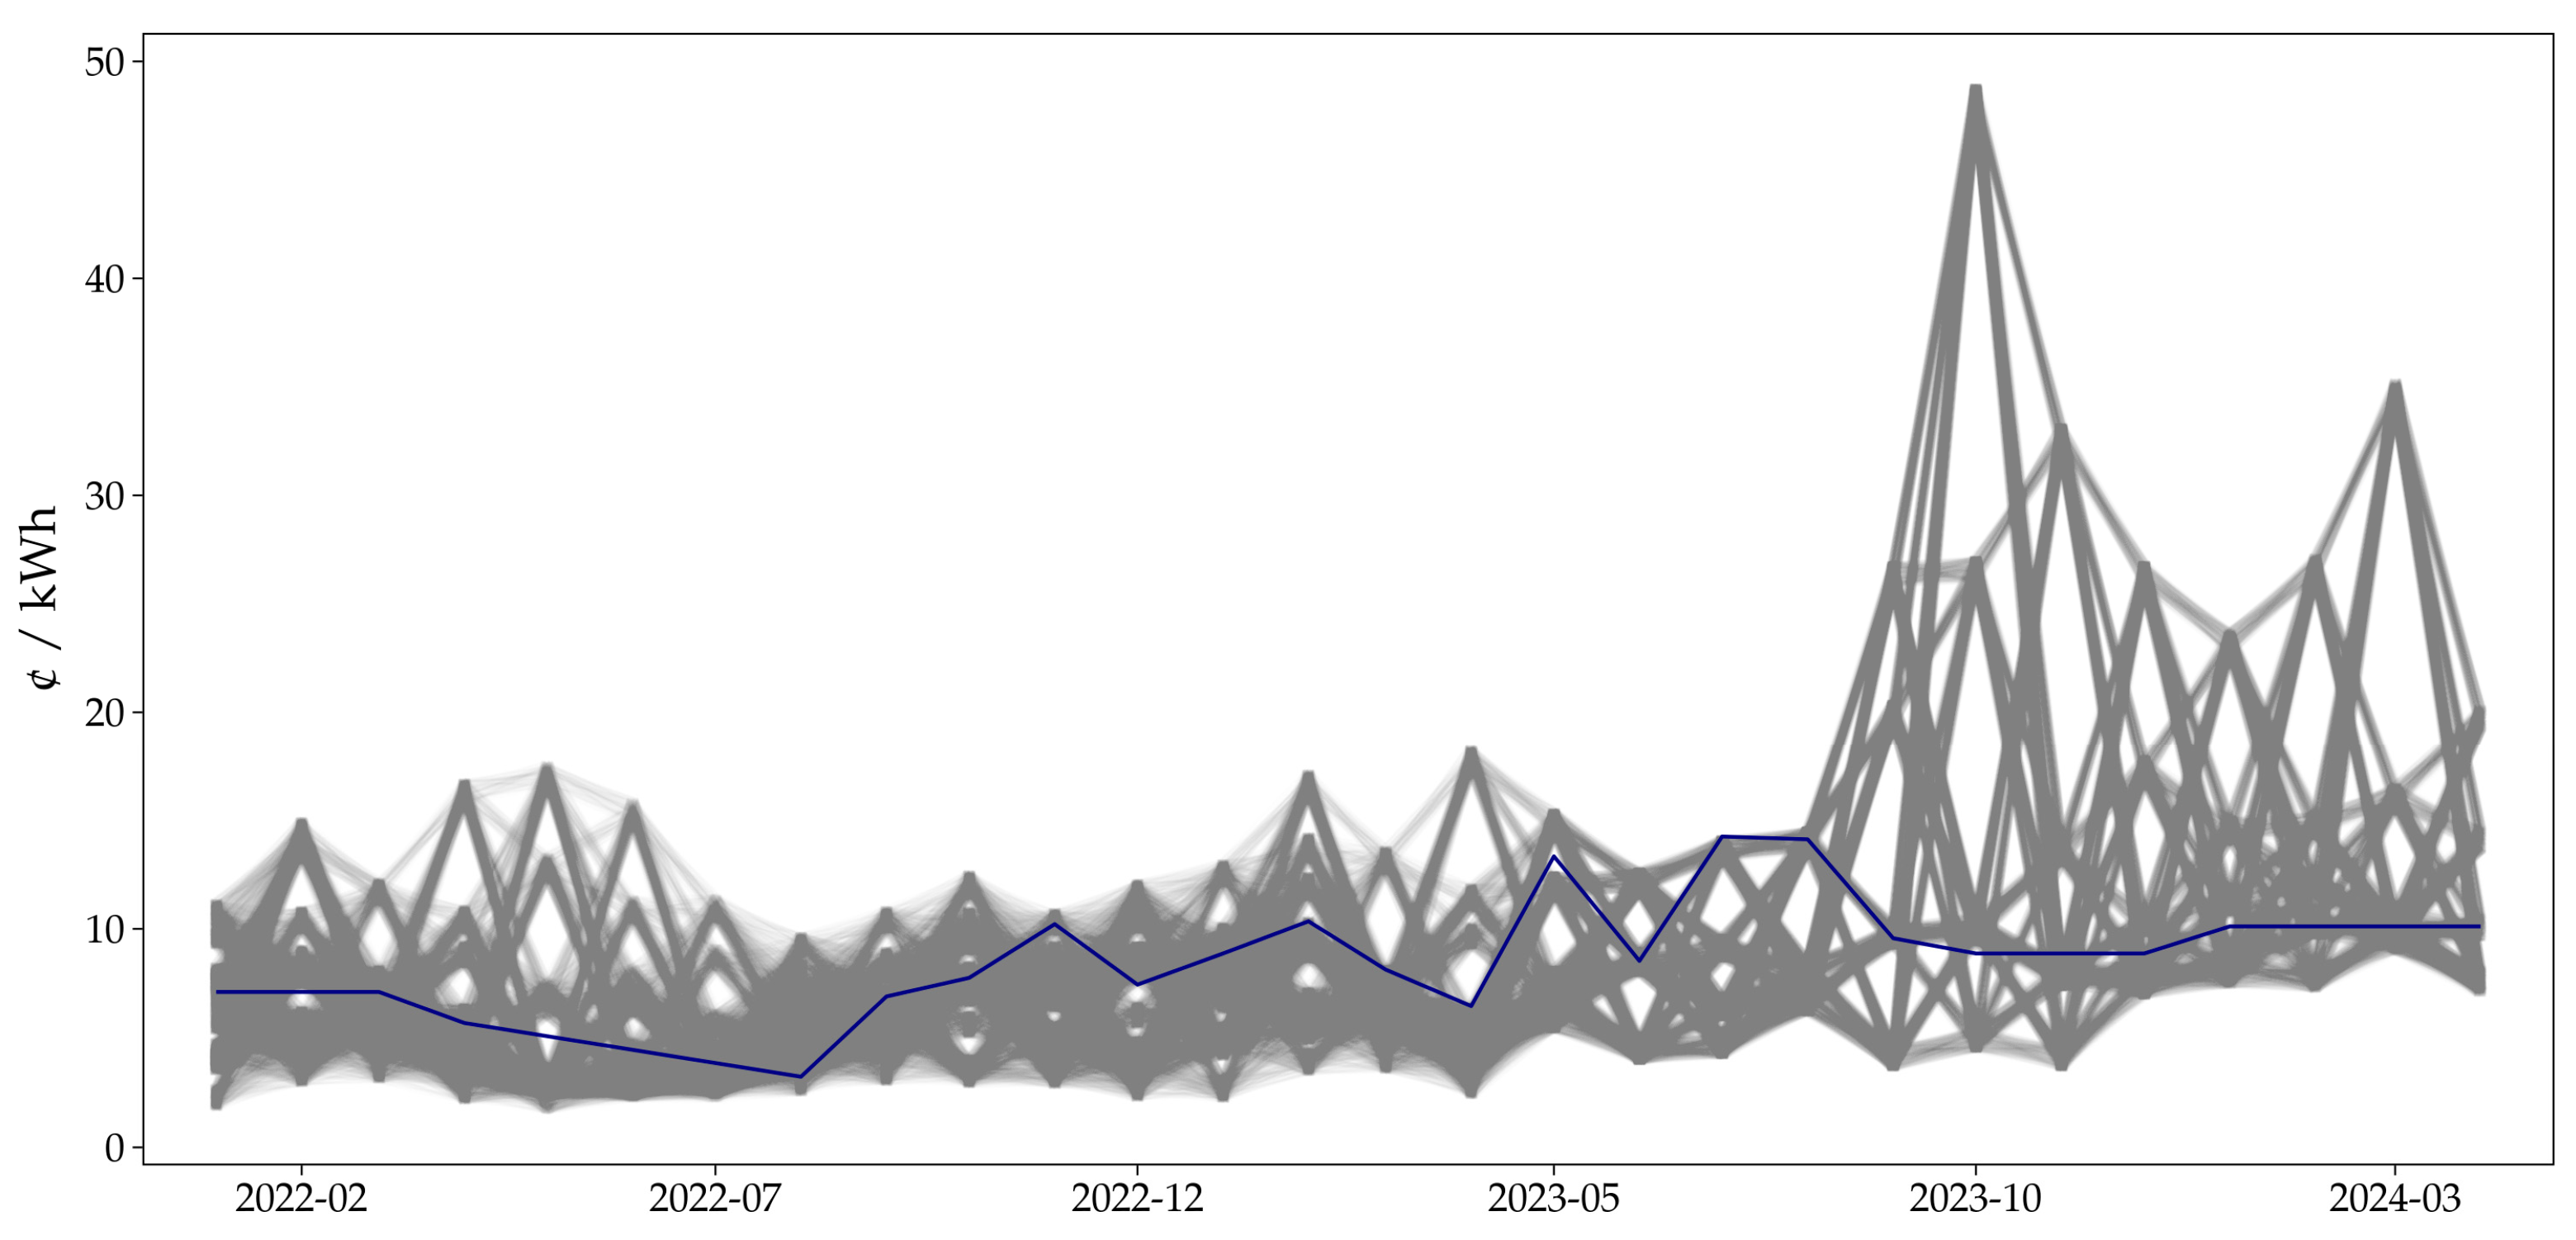
Figure 8 presents the results of 10,000 simulations of possible scenarios of average monthly spot prices resulting from sampling the values in
Figure 7. Each possible scenario—a gray line—is constructed by sampling a January value from the top left box of
Figure 7 adjusted to January 2022 using the Producer Price Index (PPI). Then, the February value is sampled and adjusted with its February 2022 PPI value, and so on, until the construction of a possible scenario within the window between January 2022 and January 2024 is complete. This window is selected because, from January 2022, it is possible to transfer purchases made through futures to regulated users, and the Colombian energy derivatives trading platform publishes futures price information from that period. The blue line in
Figure 8 represents the realization of futures prices between 2022 and 2024.
In
Figure 8, futures can hedge against market risk, particularly between January and July 2022 and between September 2023 and April 2024, because during these two periods, the simulation scenarios consistently show high prices. However, futures can sometimes be consistently above the average spot price. This is expected behavior for these instruments since hedging involves transferring risk to a counterparty who will not assume it without a premium; however, this strategy is preferable to exposure to extreme events.
With the possible simulation scenarios from
Figure 8, it is possible to evaluate the impact on costs transferred to regulated users from spot market purchases and futures, assuming the latter instruments have liquidity promoted by the market maker. The following three analysis strategies for an energy marketer are employed:
Strategy 1: Buy 5% of the energy in the spot market and 95% in futures.
Strategy 2: Buy 50% of the energy in the spot market and 50% in futures.
Strategy 3: Buy 95% of the energy in the spot market and 5% in futures.
The cost transferred to regulated users through these strategies is calculated with component G, detailed in
Section 3.1, specifically through expressions (2c) and (2d).
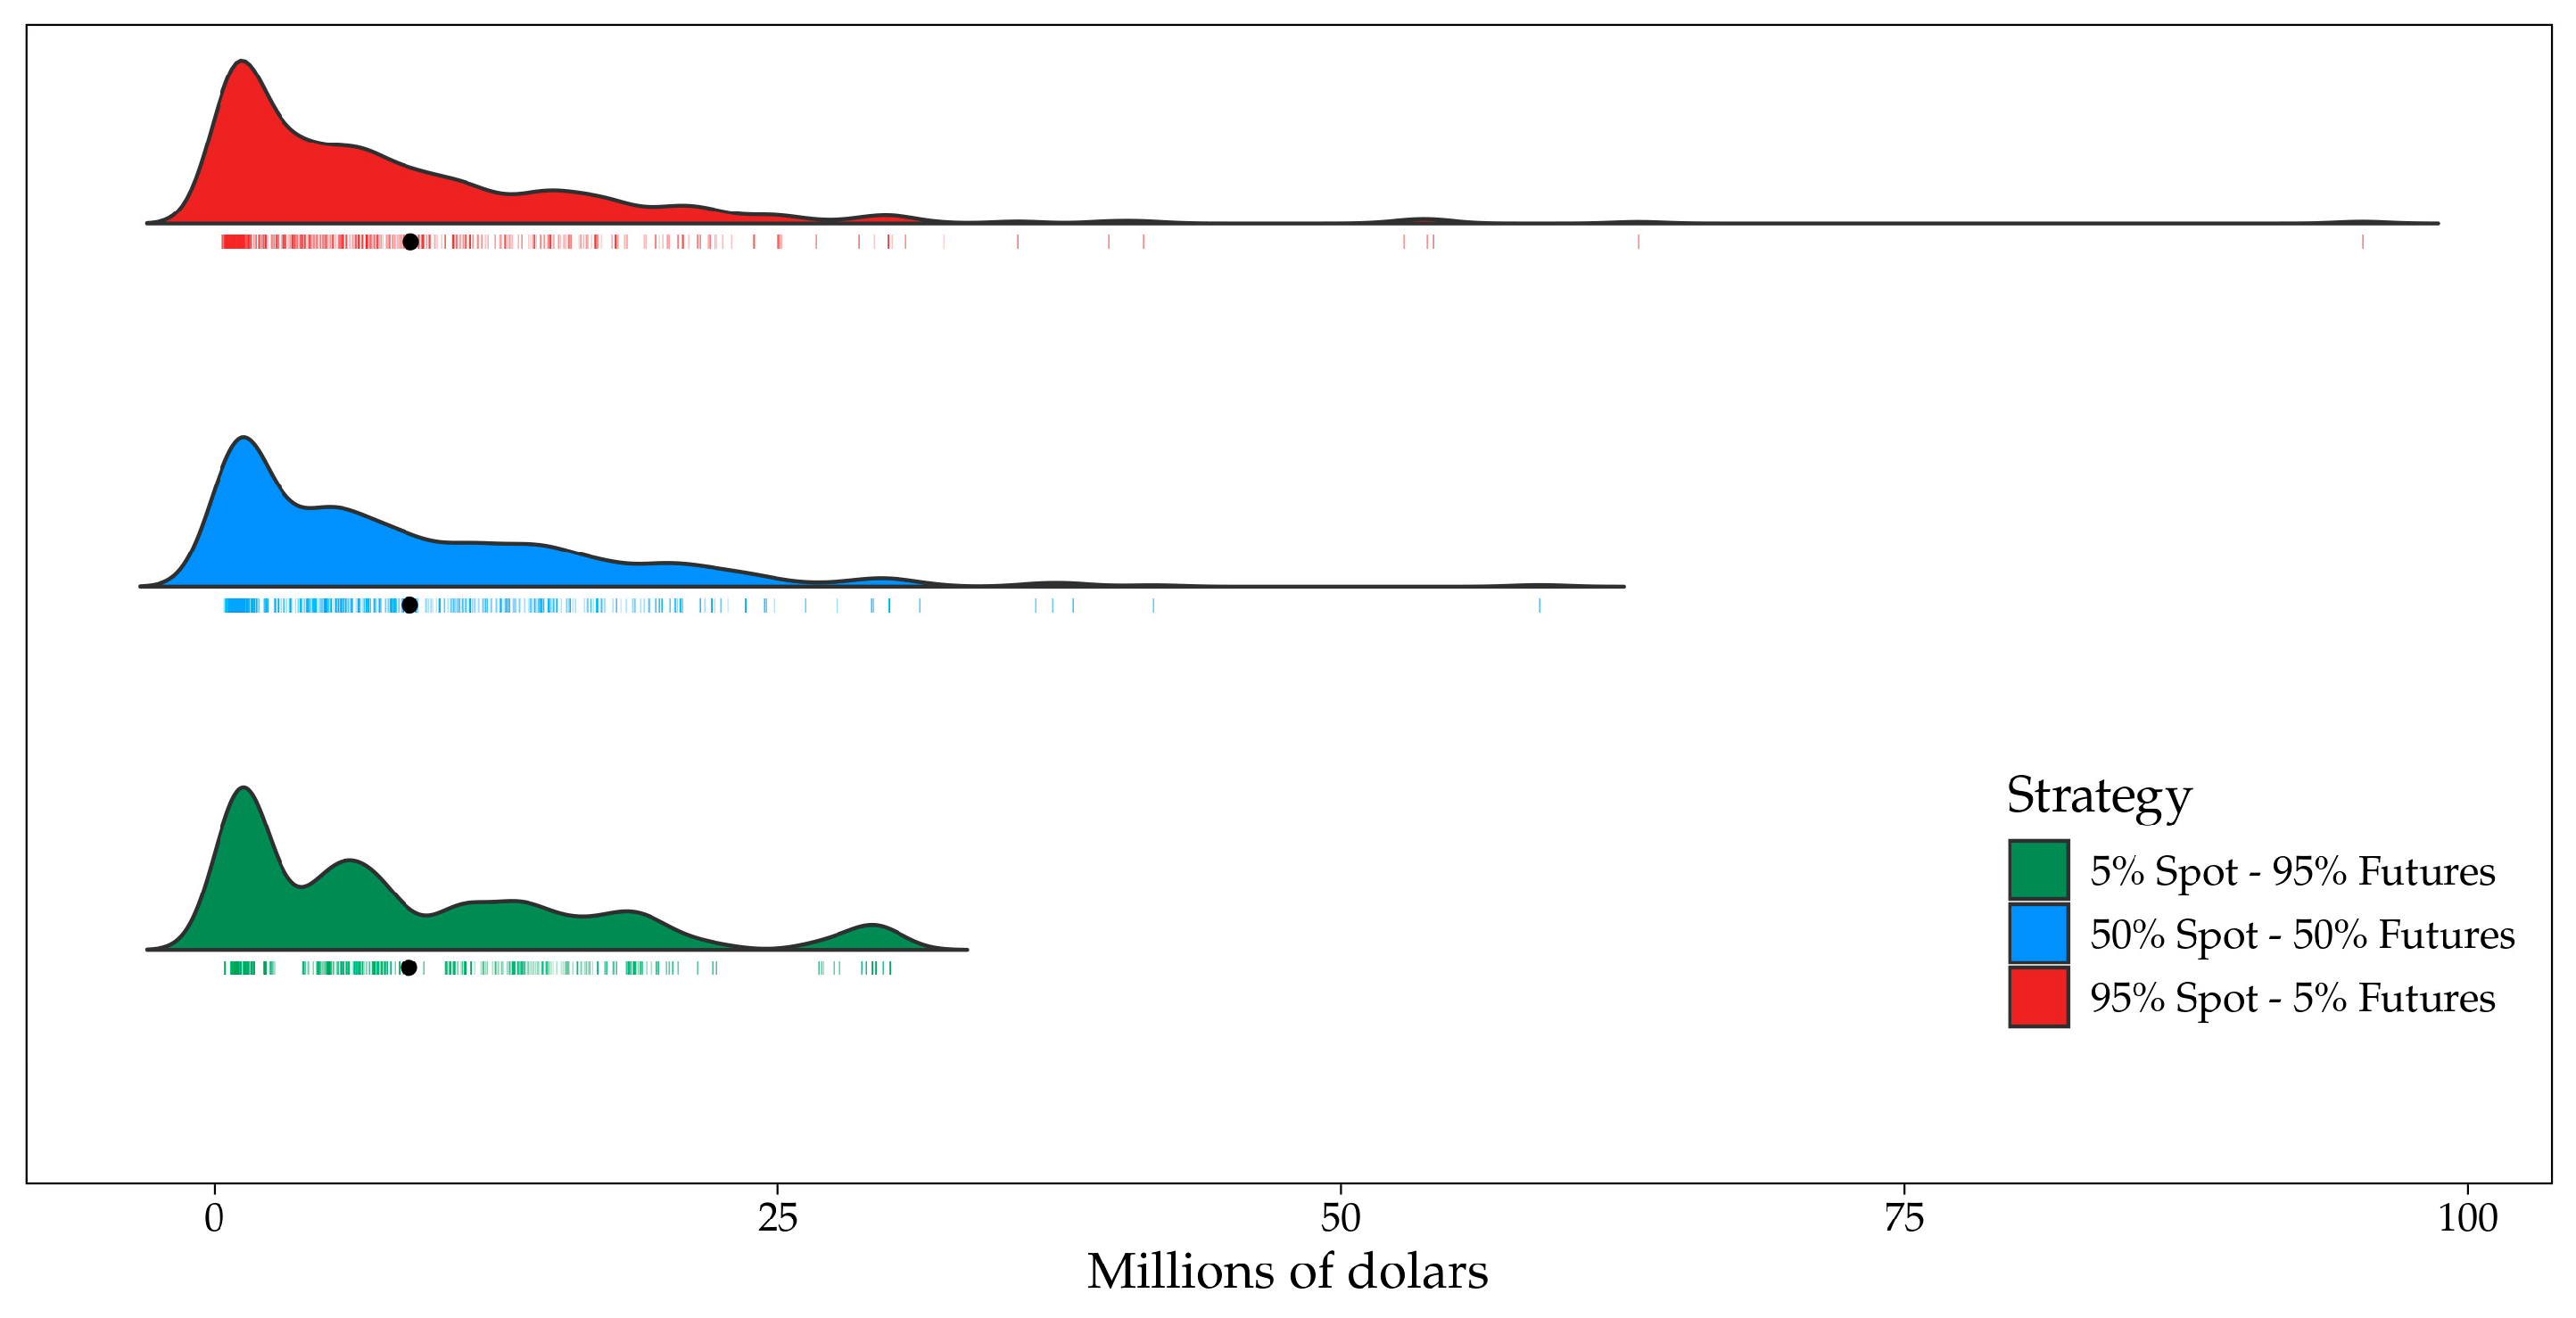
Figure 9 shows the density plots of the three employed strategies. In an extreme scenario, a 95% exposure to the spot market leads to users bearing a cost of nearly one hundred million dollars (the point on the far right). Cost dispersion decreases as coverage through futures increases. This dispersion represents the market risk assumed by regulated users, and according to the results, it is mitigated with the hedges that need to be promoted through a liquid futures market, which must be promoted by the market maker proposed in the article.
In
Figure 9, the black dot on each density plot represents the average value of the costs transferred to regulated users for each strategy. These averages are detailed in
Table 1. The 95% futures coverage transfers, on average, have a lower value for regulated users. Although these averages are similar for the three strategies, it is important to highlight that covering the regulated demand against extreme events does not increase costs in expected value for regulated users.
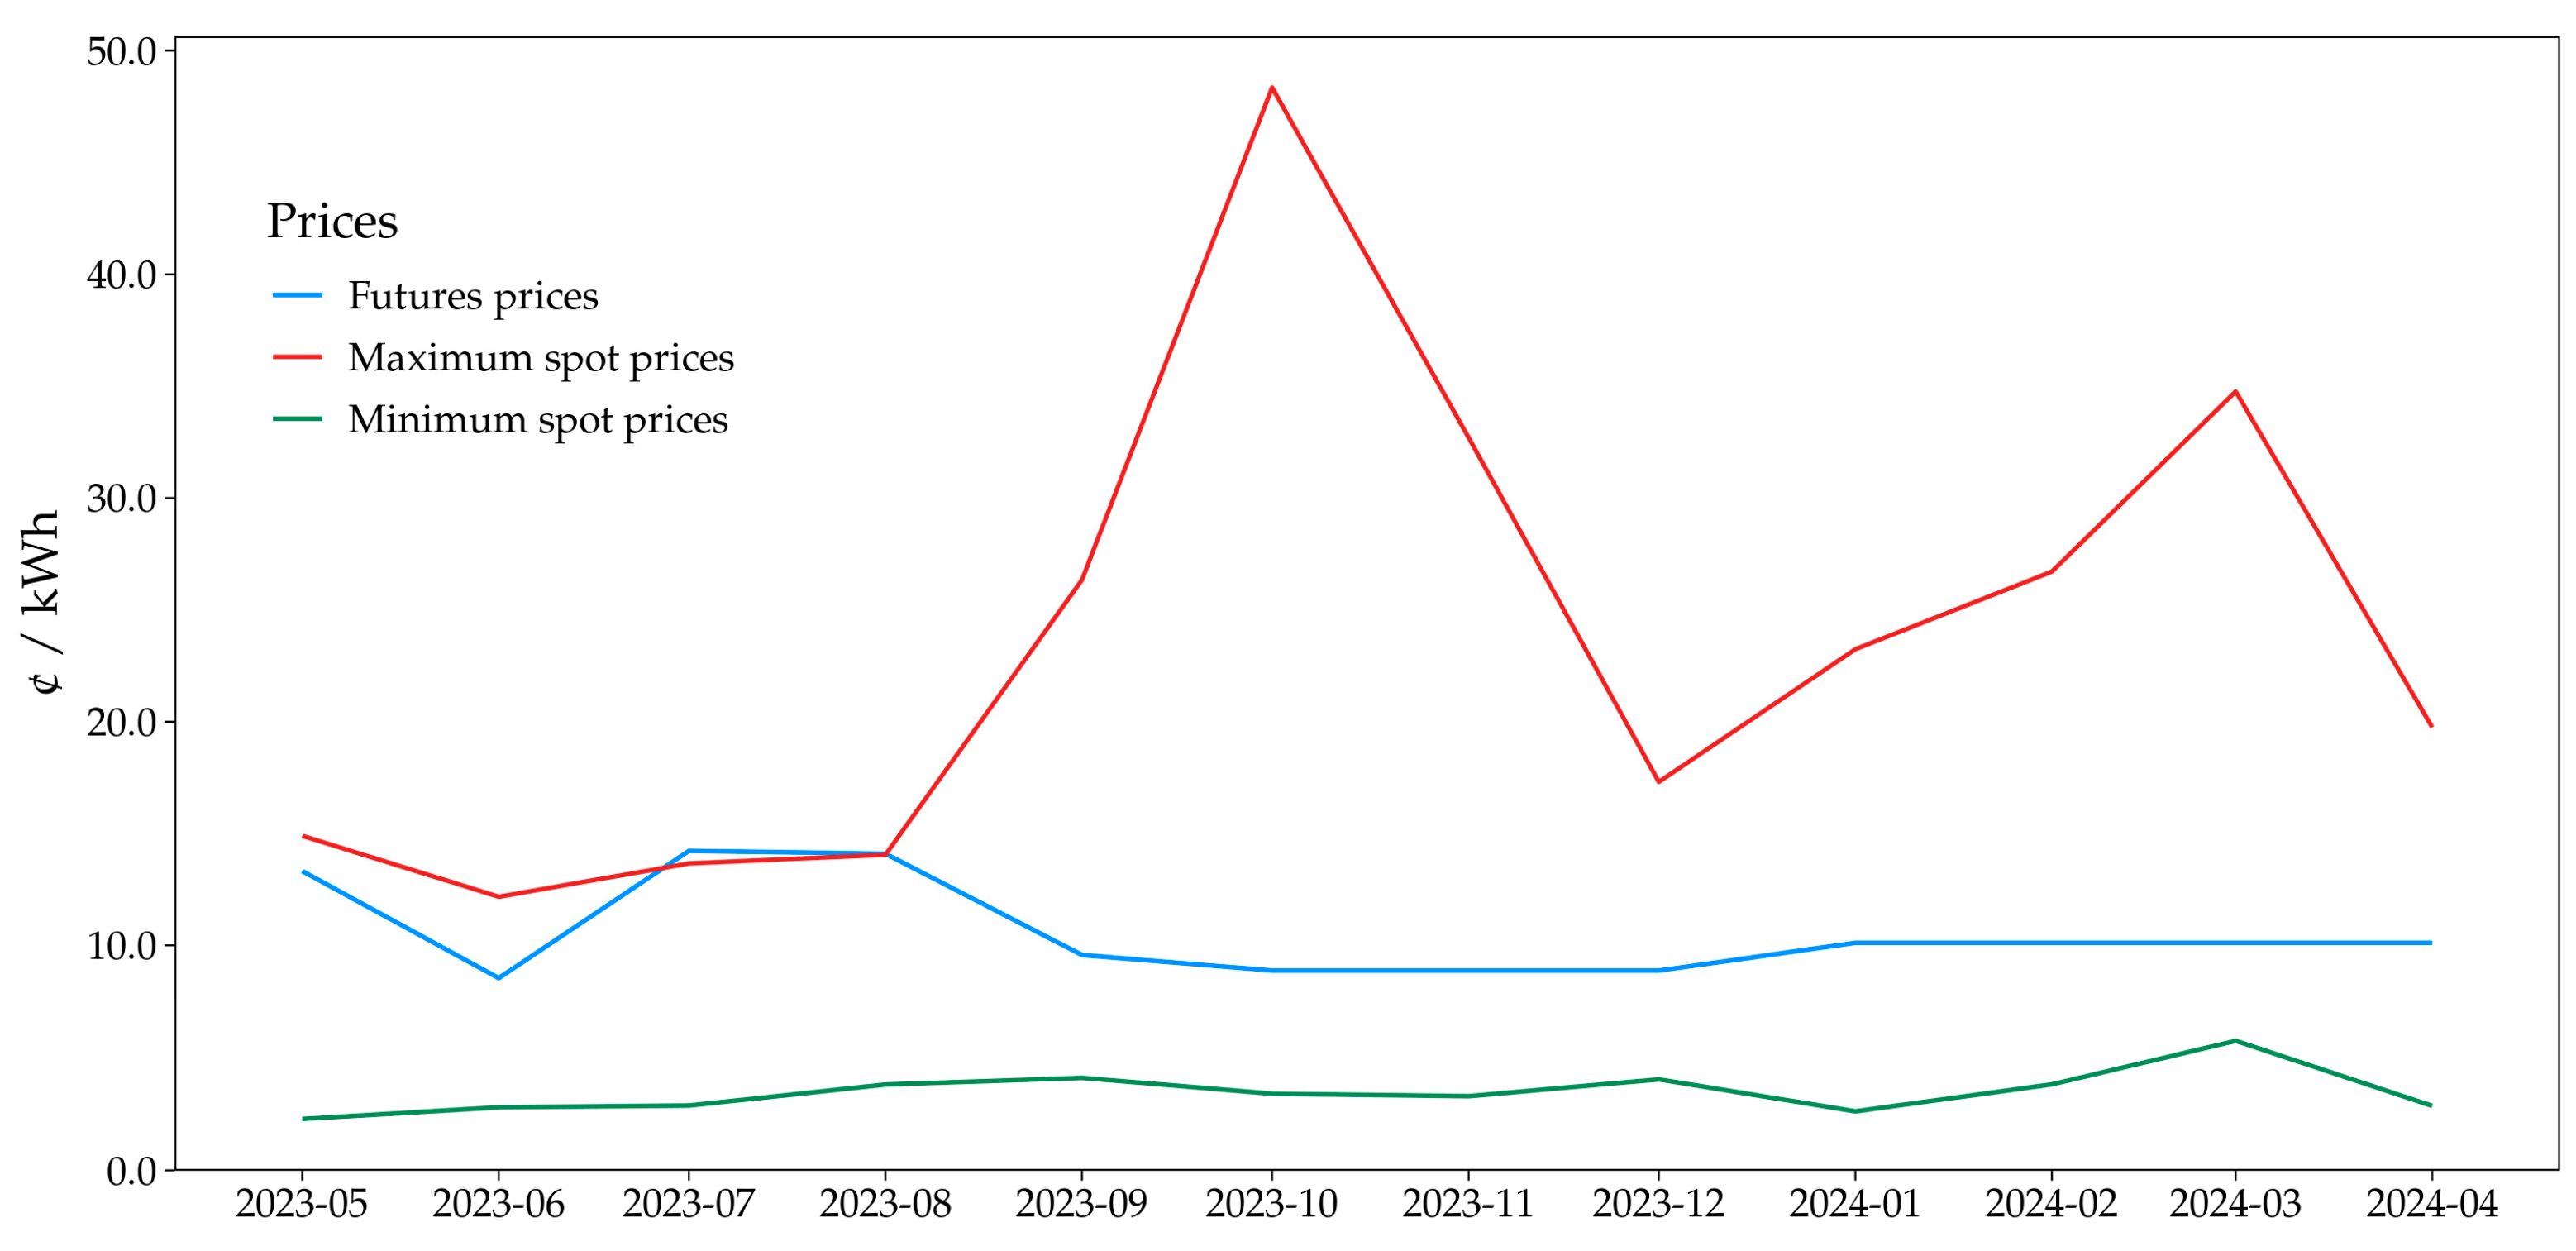
Finally, a stress test demonstrates the benefit in terms of economic savings under extreme conditions. This test is constructed with the observed maximum and minimum spot prices; the highest and lowest spot prices from
Figure 6 are taken and compared with the observed futures prices. This is shown in
Figure 10, where it is noted that futures are a better alternative since, in the analyzed time window, they present a smaller difference with minimum values than with maximum values.
Calculating the average price differences between the maximum values and futures yields a value of 13.1 cents per kWh. Performing the same calculation between futures and minimum values, the value is 7.1 cents per kWh. This means that, in an extreme scenario, as indicated by the red line, hedging with futures saves an average of 13.1 cents per kWh. A scenario with minimum values transfers an average of 7.1 cents per kWh more to regulated users. This represents efficiency from a benefit–cost perspective, as user savings are more significant than the costs they might bear.
In summary, the previous analysis clearly demonstrates the significant benefits of implementing futures hedging strategies for regulated users. Although the average costs are similar across the three strategies, it is important to note that hedging against extreme events does not increase the expected value of costs for regulated users. Additionally, a stress test shows that in extreme scenarios, hedging with futures can save an average of 13.1 cents per kWh, whereas minimum value scenarios transfer an additional 7.1 cents per kWh to regulated users. These findings highlight the efficiency and cost-effectiveness of futures hedging.
4.3. Impact of the Market Maker on Liquidity
The impact of the market maker can be approached from different perspectives. This subsection considers a retrospective analysis to establish the coverage effect of regulated demand—the majority of consumers in the country—that a market maker would have.
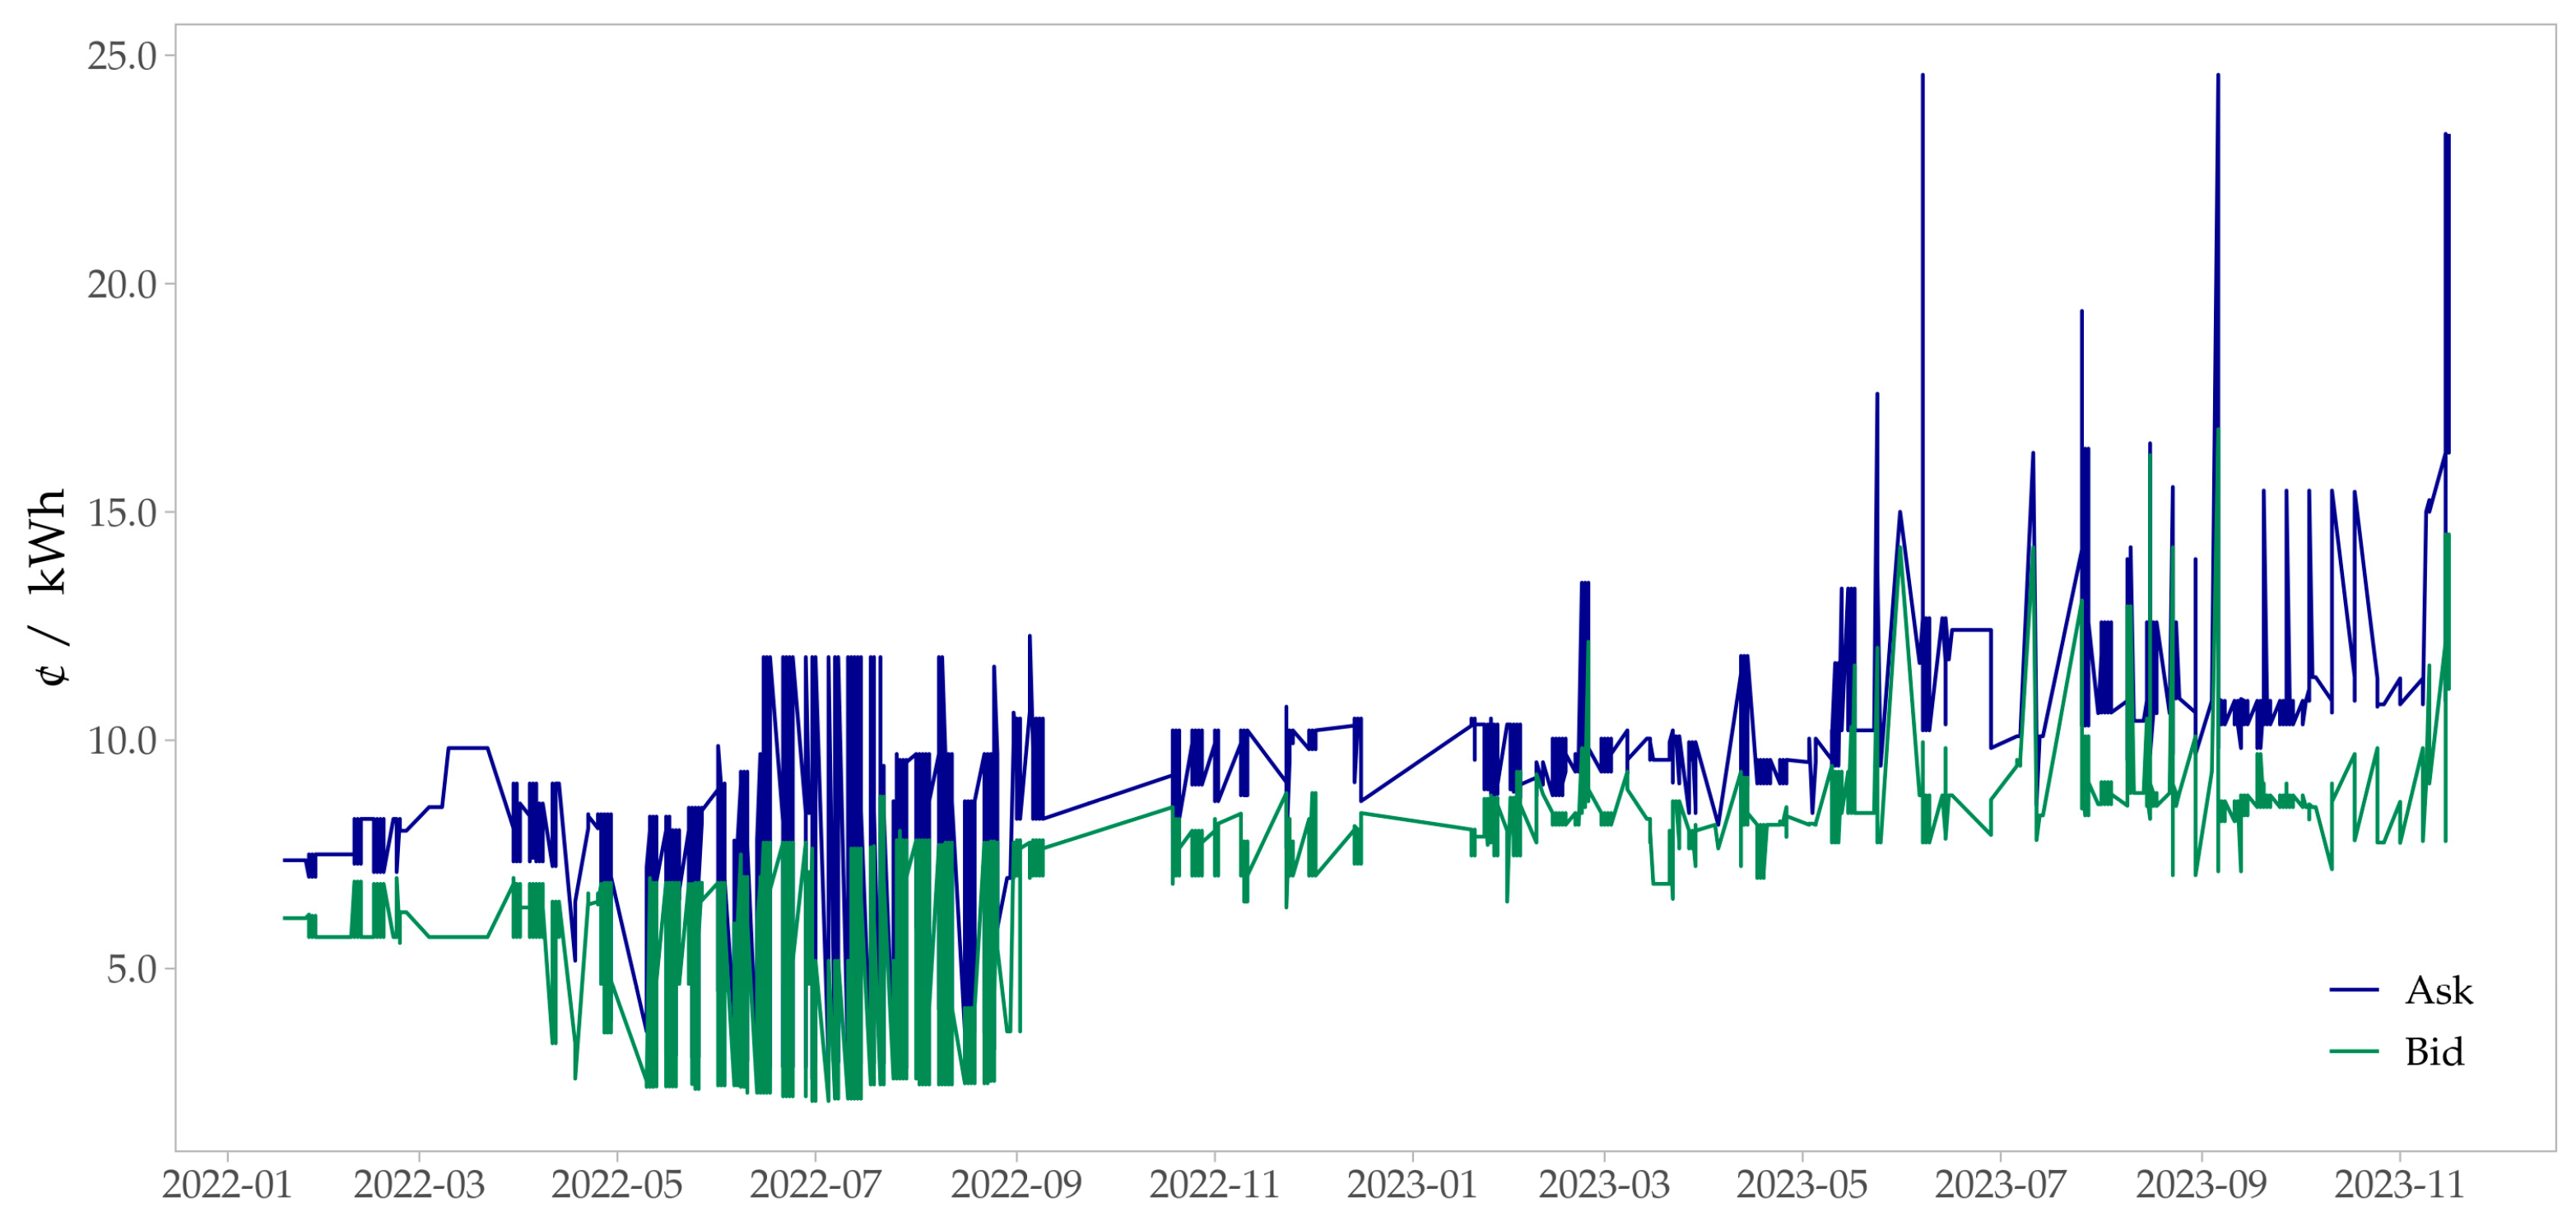
Figure 11 shows the spread from January 2022 to November 2023, with the best bid and ask prices registered on Derivex that did not manage to close. This corresponds to the closest spreads obtained on those trading days without closing. Note that in
Figure 11, on a significant number of days, futures contracts did not close. This demonstrates the lack of liquidity currently affecting this derivative, backing the need for a market maker. In fact, of the 626 trading days that correspond to the observation window, 64.22% did not manage to close.
To determine the number of contracts the market maker could close and its impact on liquidity. Data from the standardized market operator Derivex between January 2022 and May 2024 were used for this analysis. These data include variables from the best bid and ask quotes that agents are willing to trade and the price at which futures contracts are traded. For example, the ELMQ23F contract registered a bid of 7.8 cents per kWh and an ask of 9.1 cents per kWh on 25 October 2022. On that same day, the contract traded at 8.3 cents per kWh, indicating that the bid adjusted by 0.5 cents and the ask adjusted by 0.8 cents. Similar observations were made for the entire historical series within the analyzed window.
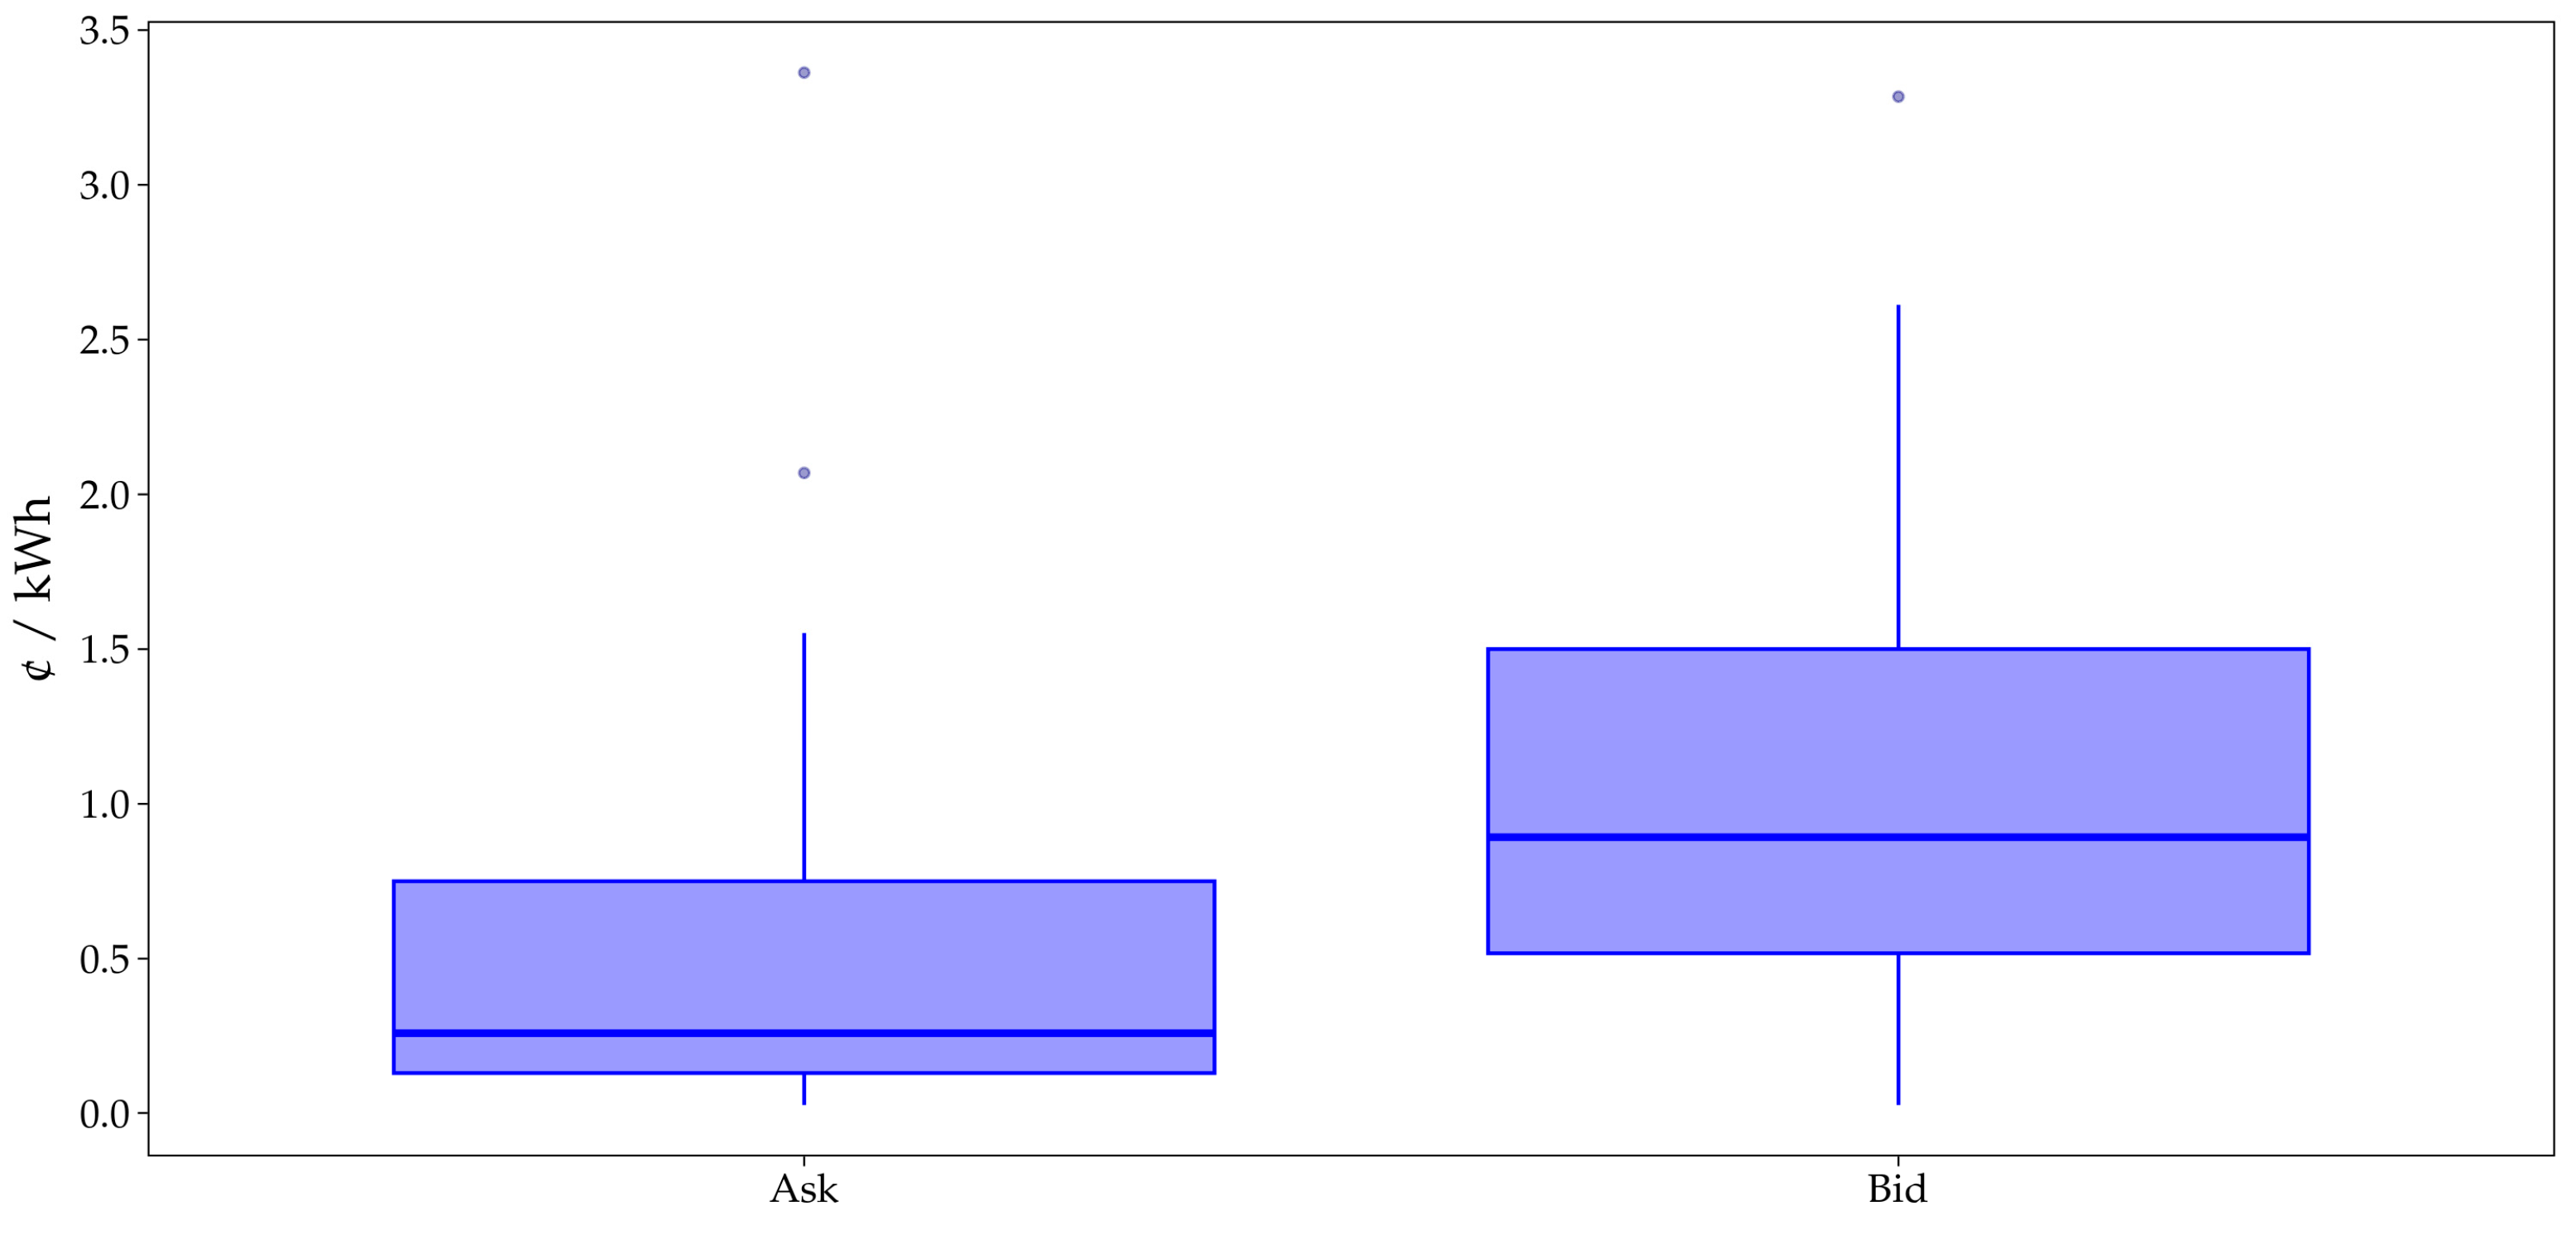
Figure 12 shows the distributions in cents per dollar of the adjustments made by both ends when trading futures contracts. It is observed that the bid makes larger adjustments than the ask to close the trade. On average, the bid gives up 1.1 cents per kWh, while the ask gives up only 0.52 cents per kWh. The 10th percentile, as a conservative scenario, is 0.16 cents per kWh for the bid and 0.052 cents per kWh for the ask, respectively. This percentile indicates the minimum value that the quotes (bid and ask) have adjusted 90% of the time based on the observed values. If, under the market maker proposed in this paper, these adjustments were maintained, it would increase the number of trades by at least 7% for the study period, resulting in 7% more liquidity. In terms of efficiency, this means that the suggested spread of 0.212 cents per kWh would generate an increase of at least 10% in additional monthly energy coverage for regulated users through the contracts managed by the market maker.
5. Conclusions
The need to develop efficient and liquid hedging instruments so that energy retailers do not expose their regulated demand—which faces technological and economic difficulties in changing their retailer—to market risk is a requirement in today’s electricity markets. That said, this study evidences some market inefficiencies of OTC (bilateral) contracts and the tariff structure that expose energy retailers in Colombia—and with them their regulated demand—to significant market risk, therefore requiring risk management instruments. As a result, this study establishes the importance of developing a market maker to increase the liquidity of the electricity futures so that the retailers have access to an agile risk management instrument.
The characteristics of the market maker and its incorporation into the current institutional framework of the Colombian electricity market are developed in this study. Likewise, regulatory changes that must be considered so that this new agent fulfills its purpose have been listed. A quantitative analysis supports the benefits of this proposal, as it demonstrates that a percentage of the demand could be covered through futures due to the liquidity provided by the market maker. An average of the impacts of energy purchase costs transferred to the demand by three marketers that, today, face difficulties in OTC contracting also establishes the coverage benefits provided by the market maker. This latter benefit is not a minor issue, as inflationary pressure caused by tariff increases compels regulators to look for measures to counteract these upward effects.
Future research must focus on understanding how market makers can influence the responses and investment strategies of agents from a micro-level perspective. To achieve this, methodologies such as agent-based simulation or game theory should be employed. This will allow for the analysis of the dynamics and interactions between the market maker and the agents, evaluating changes in the investment strategies of individual agents.
Finally, while the classification of the problem (market risk exacerbated by an imperfect OTC market coupled with tariff imperfections) is sustained with Colombian data and the characteristics of a market maker adapted to Colombia’s institutional framework, the conceptual framework developed in this study can serve as a reference for entities in other countries, especially those in emerging economies. These countries might have growing concerns about developing market tools to enable derivatives risk management amidst the high volatility of prices in the electric energy sector. The market maker and its impact can serve as a replicable reference in other contexts.


