2.1. Development of the Gas Generator Rotor R.P.M. Transfer Function Mathematical Model
Before developing a neuro-fuzzy controller for control of the helicopter TE’s gas generator rotor R.P.M., it is necessary, first of all, to obtain the system transfer function, since it is a mathematical model that the system’s dynamic behavior describes in response to input influences. The transfer function provides a detailed understanding of how a system responds to various changes and external disturbances, which is critical to the effective controller design. It provides a basis for the system stability and dynamic characteristic analysis, which is necessary for the neuro-fuzzy controller’s correct tuning. Without accurate knowledge of the transfer function, it is impossible to adequately account for the system dynamics in all aspects, which can lead to a suboptimal or even incorrect control.
In general, the gas generator rotor R.P.M.
nTC depends on the control signal
u(
t), which is a gas generator rotor R.P.M.
nTC parameter recorded on board the helicopter. In general, the control signal is the form linear model as follows:
where
nTC(
t) is the gas generator rotor R.P.M.,
u(
t) is the control signal,
k is the proportionality coefficient, which determines how much a change in the control signal leads to a change in gas generator rotor R.P.M., and
nTC 0 is the base gas generator rotor R.P.M. (for example, at minimum control signal level in helicopter TE’s idle mode).
The differential equation describing the gas generator rotor R.P.M.’s changing dynamics has the following form:
where
Tengine is the torque created by the engine (drive),
Tresistance is the torque created by the load (resistance),
J is the system inertia moment (rotating mass), and
is the gas generator rotor R.P.M. derivative for time (angular acceleration).
The control signal
u(
t) is related to the torque generated by the
Tengine engine (drive) by the following expression:
where
ku is the proportionality coefficient between the control signal and the drive torque.
Thus, the given differential Equation (2) determines the changes in dynamics in the gas generator rotor R.P.M., depending on the control signal and external loads.
The proportionality coefficient ku is determined based on the engine and control system characteristics. One of the ways to determine ku is to experimentally measure the drive torque under certain control signals.
Another approach is to determine
ku based on the engine and gas generator technical characteristics. For example, if the engine power
N and the gas generator rotor R.P.M.
nTC are known, then the drive torque can be expressed as follows:
Then, the proportionality coefficient can be defined as follows:
In general, the control signal is determined according to the following expression:
where
u(
t) is the control signal at time
t,
e(
t) is the control error at time
t (the difference between the gas generator rotor R.P.M. set value and the current value),
Kp,
Ki,
Kd are the proportional, integral, and differential components coefficients, respectively. The proportional component
Kp·
e(
t) provides an instant response to an error, and the integral component
takes into account accumulated errors over time, and the differential component
prevents overshoot by adaptation to error changes.
Analytical expression (6) is a tool for the gas generator rotor R.P.M.’s precise control, allowing the system to respond to load changes and maintain a given gas generator rotor R.P.M.
In [
23], a discrete form of the PID controller’s control signal of the form is proposed as follows:
A key advantage of the PID controller’s control signal’s discrete form over the standard one is more flexible control over the control system. The discrete PID controller allows you to more accurately configure control parameters by the particular process requirements and characteristics. This is achieved through the ability to adjust the discrete sampling time, which provides more precise control over a wide range of input signal frequency variations. In addition, the discrete format allows for the control algorithms to be easily integrated into digital systems such as microcontrollers, increasing the automation level and making the system easier to maintain. Thus, the PID control signal’s discrete form provides more efficient and accurate process control compared to the standard form.
To convert the control signal model into discrete form (6), the following can be used:
where
,
.
Applying the Laplace transform, denoting
u(
t) as
U(
s) and
e(
s) as
E(
s), we obtain the following:
Expressing
U(
s) relative to
E(
s), we obtain the following:
Then, the following equation is used:
Thus, the transfer function has the following form:
The transfer function’s general form contains the following elements: proportional component Kp and , integral component Ki and , differential term Kd and , exponential terms associated with the discretization control signal.
The resulting transfer function (12) with sampling and the different formulas used have several advantages over the classical analogue PID controller transfer functions, as presented in
Table 2.
In [
22], a PID controller’s discrete transfer function was proposed:
The discrete PID transfer function, represented as (12), has several critical advantages over the existing function (13) as follows:
The discrete PID transfer function (12) offers more accurate system modeling by taking into account time delays and signal sampling, which is especially important for real systems with discrete control elements.
The discrete transfer function of the PID controller (12) allows for the control and better consideration of the integral and differential aspects, which provides the system dynamics with more stable and accurate control.
Thanks to the more complex structure of the PID controller, the PID controller’s discrete transfer function (12) can adapt to a wider range of system conditions, providing control flexibility and efficiency in various scenarios.
To determine the PID controller’s proposed discrete transfer function (12) stability and dynamic characteristics, research of its poles and zeros was carried out since the transfer function zeros can affect the output signal shape, and the poles determine the system’s dynamic behavior. The function
N(
s) zeros are the
s values at which the numerator (12) is equal to zero, and the function
D(
s) poles are the
s values at which the denominator (12) is equal to zero, according to the following:
To equate (14) and (15) to zero, Newton’s iterative process is carried out as follows:
until the function
F(
sn) values become sufficiently close to zero, while
F(
sn) is the studied function
N(
s) and
D(
s) and, accordingly, their derivatives
N(
s) and
D(
s).
For the analysis of the proposed transfer function
G(
s) (12) stability, the work uses the Routh–Hurwitz criterion [
24] to calculate which form of characteristic equation should be used:
We carry on making a replacement
. Then
, after which we substitute these substitutions into (17) as follows:
Then, the following equation is formed:
By grouping the terms with
z and without
z, the characteristic Equation (17) is transformed to the following form:
on which basis the Routh table was compiled (
Table 3).
According to
Table 3, for a second-degree equation, the stability criterion (according to Routh) is reduced to checking the signs of all polynomial coefficients, i.e.,
A > 0,
B > 0,
C > 0. If all three conditions are met, the system is stable.
Thus, according to the Routh–Hurwitz criterion, one can assume the system’s stability, but one should also pay attention to the fact that violations of the conditions does not guarantee the instability of the system but only indicates potential problems.
At the next stage, the expression
u(
n) (7) is transformed through the resulting transfer function
G(
z). It is known that
U(
n + 1) =
z·
U(
n) from the shift operator
z definition. Next,
u(
n) is expressed in
z terms and the transfer function (12) is applied as follows:
Next,
u(
n) (19) is expressed as a
z function and error
e(
n) as follows:
After applying many mathematical transformations, the transfer function (12) takes the following form:
The resulting transfer function (21) is in the discrete Laplace transform (z-transform) form (discrete transfer function). Its numerator and denominator can be similarly interpreted as controller coefficients and parameters in the discrete control system context. The numerator represents the control signal influence (for example, error) and its derivatives (proportional Kp, integral si, and differential sd components). The denominator represents the system’s characteristic equation. In this case, Kp, si, and sd play the coefficients’ role in this characteristic equation, affecting the system dynamics. Thus, the transfer function (21) is a controller with proportional, integral, and differential control components (PID controller), and its coefficients Kp, si, and sd are adjusted to achieve the control system’s desired characteristics.
To research the discrete transfer function G(z) (21), the neuro-fuzzy controller use is proposed, which is justified by several advantages over the traditional PID controller as follows:
Neuro-fuzzy systems are capable of adapting to nonlinear and complex systems, which is often encountered in discrete transfer function dynamics. This allows for more flexible and precise control under a variety of operating conditions.
Neuro-fuzzy controllers can train from experience and real-world data, which allows them to optimize their performance and adapt to changing conditions.
Neuro-fuzzy systems can self-organize and adapt, which makes them more stable and effective in variable conditions and uncertain environmental factors.
Thus, using a neuro-fuzzy controller to analyze and control the discrete transfer function G(z) (21) is a reasonable approach to achieve higher efficiency and control accuracy.
The main difference between fuzzy and neuro-fuzzy PID controllers and the “classical” ones is their ability to adapt to changes in helicopter TE parameters and the external factors’ influence. This adaptability is achieved by changing the traditional PID controller coefficients (
Kp,
Ki and
Kd) depending on various engine operating conditions, such as flight altitude and speed, but this leads to additional errors in the system [
25]. The fuzzy controller takes the input system error values and their derivative and then converts these data into linguistic variables. Based on the rule base, the controller selects the appropriate output linguistic variables, after which these variables are converted into PID controller coefficients. A neuro-fuzzy controller, unlike a fuzzy one, includes a neural network component that adjusts membership functions based on a training algorithm to minimize error [
22]. To solve tasks associated with the discrepancy between the control object and the reference value characteristics, the following two approaches are used: robust and adaptive control, where the fuzzy controller uses linguistic variables to select output values, while the neuro-fuzzy controller, having a neural network component, adjusts the membership functions to minimize errors. In robust systems, the control device is tuned to optimize the control process under uncertain conditions; however, after tuning, its coefficients remain constant. Adaptive systems change the control device structure parameters depending on changes in the control object parameters or external influences, providing a more optimal transition process. Adaptive systems respond to uncertainties in real-time and often use soft computing techniques such as fuzzy logic or neural networks.
2.2. Development of the Gas Generator Rotor R.P.M. Automatic Control System Mathematical Model
In connection with the above, based on [
22], the work proposes the gas generator rotor R.P.M.
nTC automatic control adaptive system functional diagram (
Figure 1), consisting of a control object, a regulator, and an adaptation unit.
The input signal reaches the controller with pre-calculated parameters, after which the control signal is sent to the control object, which generates the output signal. This output signal is processed by the adaptation block, which allows you to create the control device’s new parameters. Test impacts are applied to the control object (helicopter TE) from the control side, while the controlled quantity change direction is analyzed, and then a control impact is carried out, aimed at achieving the extremum point. Another important task related to adaptation is to ensure the control system’s optimal operation, in which maximum speed is important. For this purpose, the time during which the system comes into compliance with a change in the setting influence serves as an extremum indicator. To successfully solve these tasks, a self-tuning unit is added to the system [
22,
26]. The task of the self-tuning block is to automatically configure the controller parameters based on information received from the adaptation block and the control object. After analyzing the control object’s (helicopter TE) output signal and information about its current state, the self-tuning unit will determine the controller’s optimal parameters to achieve the required system performance.
Based on the gas generator rotor R.P.M. automatic control adaptive system developed functional diagram (
Figure 1), based on [
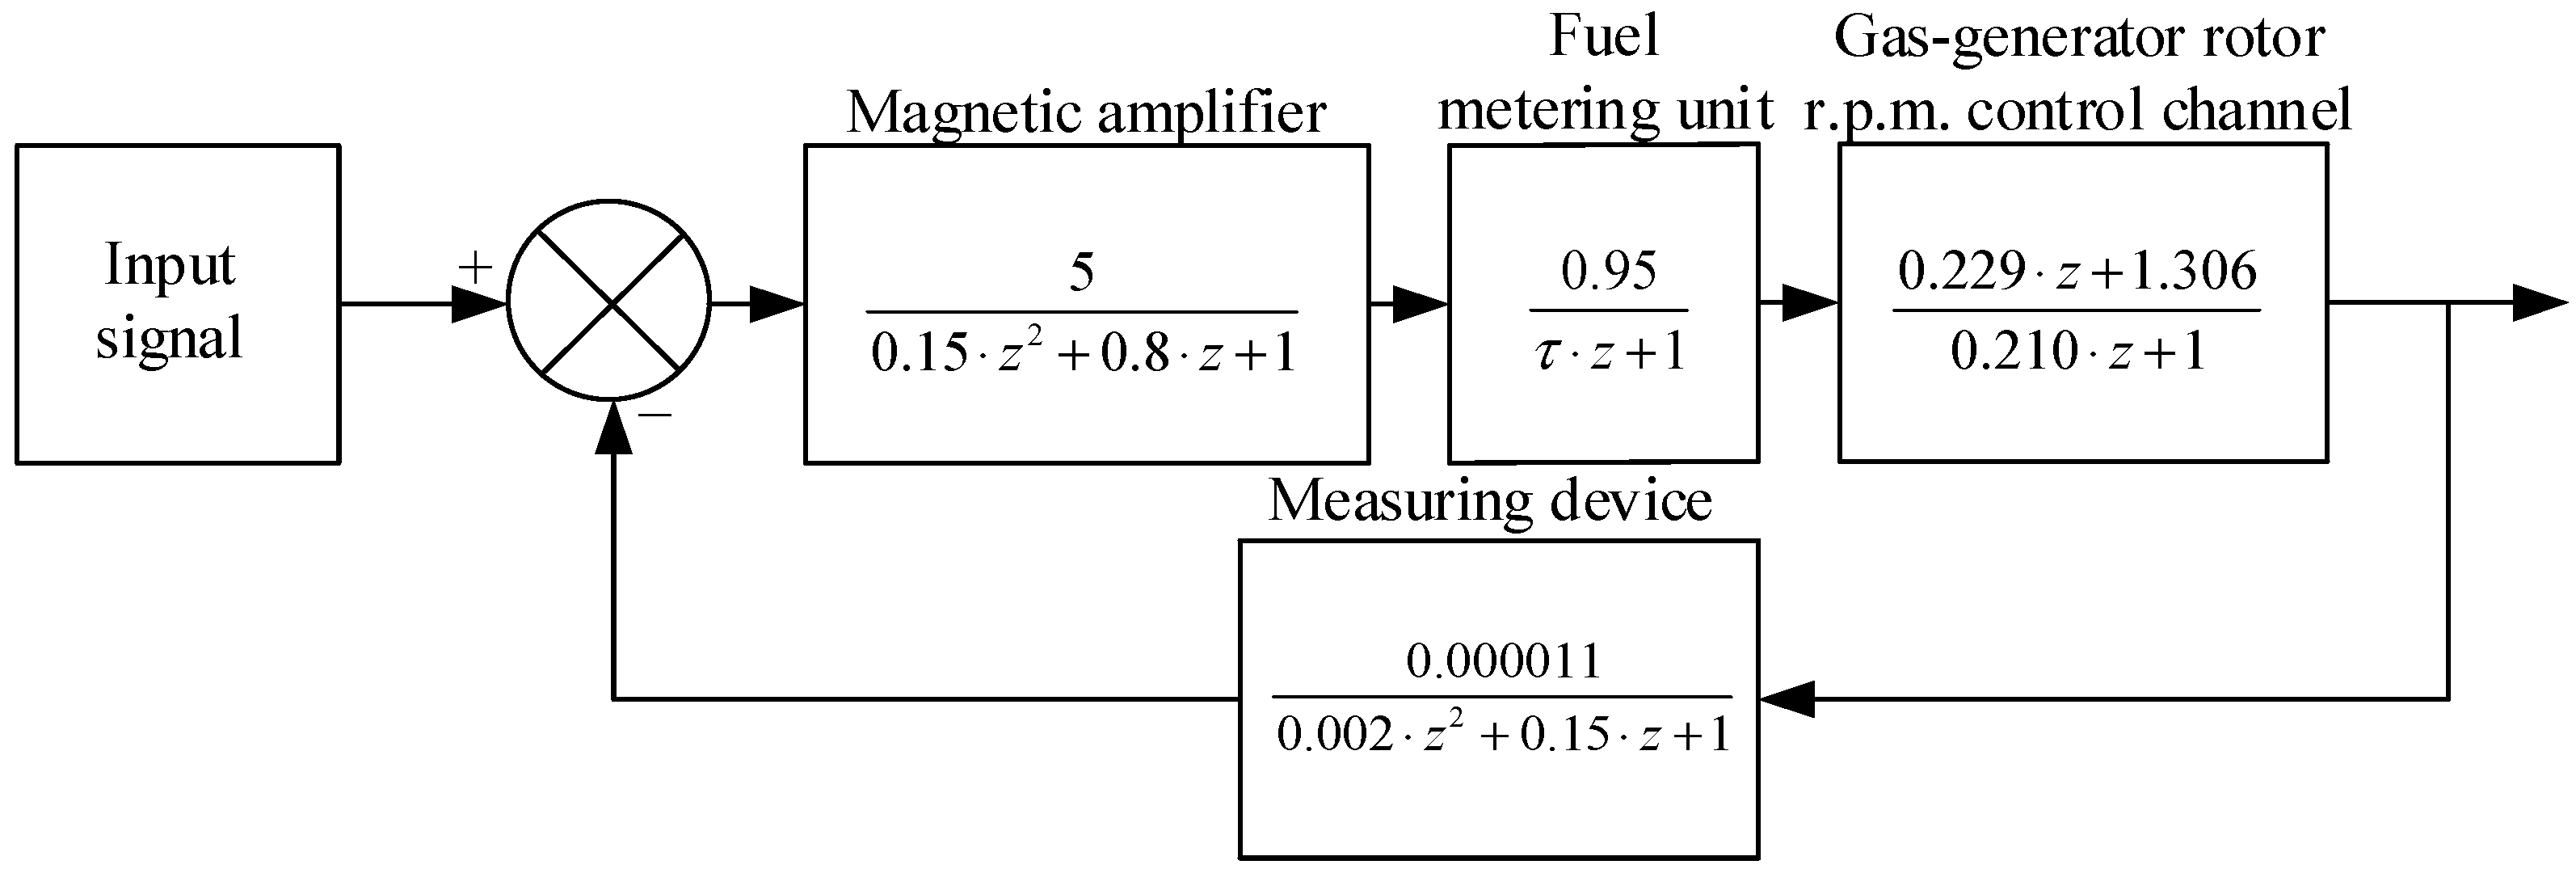
22], the gas generator rotor R.P.M. automatic control system (ACS) block diagram (
Figure 2) is proposed, in which the distinctive features from the traditional ones [
27,
28,
29] divide the object model, the helicopter TE, into two models—the fuel dispenser model and the helicopter TE model [
30,
31].
This makes it possible to more accurately and efficiently adapt control to changing operating conditions, improving the system’s overall performance and reliability, which is confirmed by the authors’ research results [
30,
31]. In the gas generator rotor R.P.M. proposed ACS (
Figure 2), the gas generator rotor R.P.M. transfer function control channel according to [
30] for twin-shaft helicopters TE (for example, TV3-117, Kremenchuk, Ukraine) is presented as follows:
The magnetic amplifier transfer function according to [
31] is presented as follows:
The fuel metering unit model [
32]
transfer function according to [
30] is presented as follows:
where
τ is the system time constant.
The helicopter TE fuel supply valve mathematical model is expressed in the gain coefficient KFMU form, which determines the change magnitude in the input signal (control signal is the gas generator rotor R.P.M.) to the output signal (fuel consumption), since the valve is usually modeled as part of the fuel supply control system, and its dynamics are taken into account in this coefficient. The work proposes to take the value KFMU = 0.95, because of the following reasons:
The KFMU value close to one ensures a stable and smooth fuel supply, which is important for reliable engine operation.
The KFMU = 0.95 provides fuel consumption moderate control while maintaining sufficient energy reserves and ensuring engine operation in a wide range of modes.
The KFMU = 0.95 value leaves some margin for control in case of operating condition changes, such as changes in flight altitude, ambient temperature, etc.
The KFMU = 0.95 value is optimal to ensure the engine’s optimal operation, taking into account its design features and requirements for efficiency and reliability.
Thus, the fuel dispenser transfer function is expressed as follows:
The presented transfer function type was chosen because it reflects the typical fuel dispenser behavior, which is characterized by a first-order dynamic response to control input. The coefficient 0.95 represents the valve gain or efficiency, which means that the fuel dispenser is at its maximum value releasing 95% for a given control signal. The time constant τ determines the dispenser response rate to changes in the input signal, which is critical for maintaining system stable operations under variable load conditions and helicopter TE dynamics.
The speed sensor model (measuring device) used in the helicopter TE gas generator rotor R.P.M. ACS, according to [
33], is presented in the following form:
where
TMD is the gas generator rotor R.P.M. time constant,
uMD is the speed sensor output signal, and
KMD is the speed sensor transmission coefficient.
In this case, the key factor in the speed sensor (measuring device) model is the proportional coefficient
KMD, which determines the relationship between the gas generator rotor R.P.M. input signal and the fuel consumption output signal [
33]. The work proposes to take
KMD = 0.05, because of the following reasons:
The KMD value = 0.05 allows the system to respond to small changes in the gas generator rotor R.P.M. and maintain stability.
Too large a KMD value may result in system instability, while too small a value may result in poor sensitivity; a KMD = 0.05 value strikes a balance between stability and sensitivity.
At the same time, in [
34], a speed sensor (measuring device) model was proposed in the following form:
Since the measuring device’s transfer function represents the relationship between the gas generator rotor R.P.M. nTC and some output signal uT, it can be assumed that the output signal of the speed sensor uMD serves as an input signal to the measuring device.
The speed sensor
uMD output about the gas generator rotor R.P.M.
nTC is described as follows:
The measuring device output signal
uT about the speed sensor output
uMD is described as follows:
Substituting
UMD(
z) from (28) into (29), we obtain the following:
Now, the transfer function
WMD(
p) will look like the following:
Substituting
KMD = 0.05 into (30), we obtain the following equation:
According to [
33,
34], the gas generator rotor R.P.M. time constant value for a twin-shaft helicopter’s TE (for example, TV3-117)
TMD = 0.1 s. Taking this into account, (31) takes the final form as follows:
Thus, the helicopter TE’s gas generator rotor R.P.M. ACS general transfer function has the following form
, i.e.:
Having carried out a mathematical transformations’ series in (34), we obtained the following equation:
By isolating the operator
z from the numerator and denominator (35), followed by dividing the numerator by the denominator and grouping by a term with the
z same powers, the transfer function (35) is transformed to the form (21)
, that is:
where, respectively,
Kp +
si +
sd = 5.86,
Kp + 2
sd = 94.781,
si −
sd = 6.614·10
3, which implies that
Kp = 6.703·10
3,
si = −42,
sd = −6.656·10
3.
Note. To go from the original transfer function (35) to the simplified form (21), the frequency analysis methods and discrete control systems synthesis were applied. First, the operator z was isolated in the numerator and denominator, then the numerator was divided by the denominator, and all terms were grouped by the same z powers. After this simplification, the transfer function took the form (36), which makes it more convenient for the analysis and synthesis of the control system, while preserving the key dynamic characteristics.
A positive proportional components’ Kp value in helicopter TE gas generator rotor R.P.M. ACS indicates that a change in the error between the specified and actual rotor speed will lead to a proportional change in the output control signal. For example, if the actual gas generator rotor R.P.M. exceeds a set value, the positive proportional components Kp will tend to reduce this excess, which should result in the gas generator rotor R.P.M. decreasing and thus restoring the desired level.
If the integral si and differential sd components are negative, this means that the integral component will reduce the accumulated error, and the differential component will act against sudden changes in the gas generator rotor R.P.M. This control makes it possible for the helicopter TE to maintain stability and operation accuracy in various operating conditions, compensating for both static deviations and dynamic fluctuations.
2.3. Development of the Gas Generator Rotor R.P.M. Neuro-Fuzzy Automatic Control System
As mentioned above, this work proposes the discrete transfer function G(z) implementation in the neuro-fuzzy controller form, in which input signals are the error e and its change rate de. The neuro-fuzzy controller output signal is the signal G(z) with adjustable controller coefficients Kp, Ki, and Kd.
To implement fuzzification and defuzzification procedures, membership functions are specified for each input and output variable. To select the membership function type in a neuro-fuzzy controller, it is important to take into account the system characteristics, the transfer function
G(
z), as well as the input and output signal types. In this case, taking into account that the input signals are the error
e and its change rate
de, and the output signals are the coefficients
Kp,
Ki, and
Kd [
30,
35], and taking into account [
22,
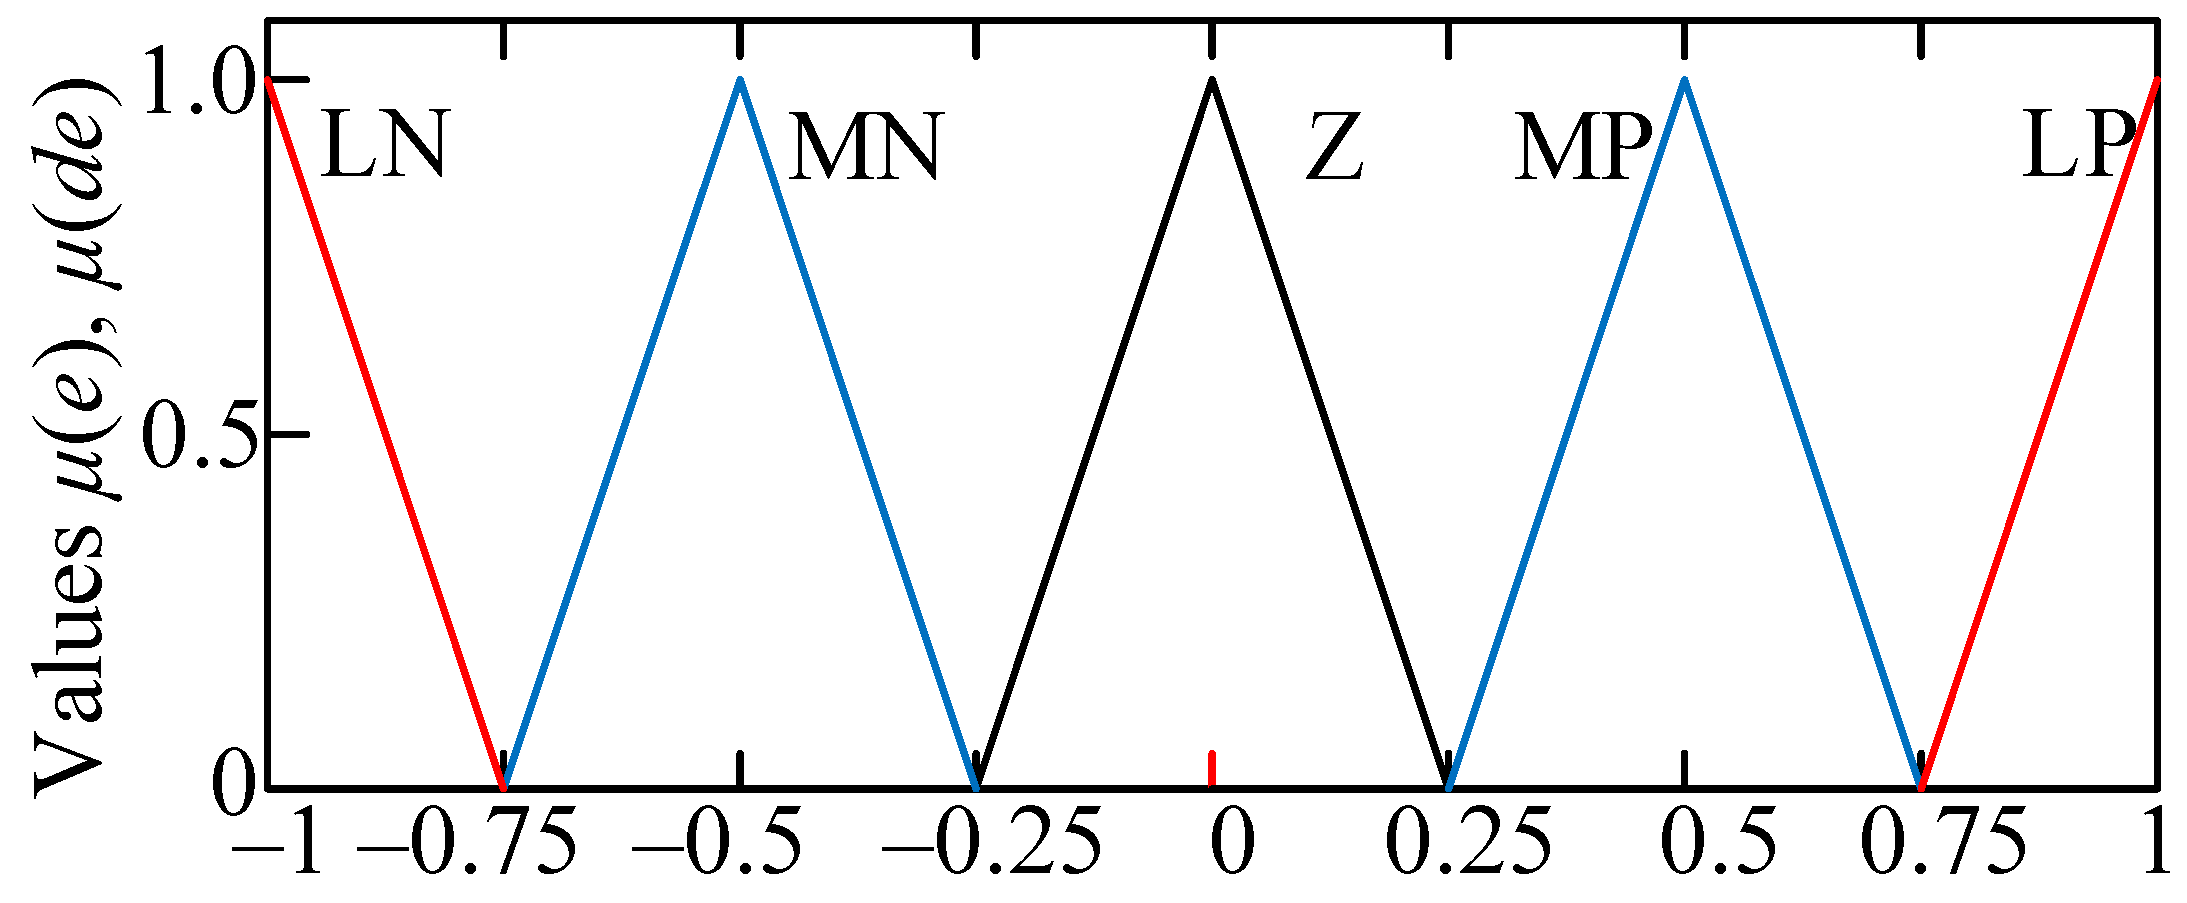
26], the optimal choice of membership function will be a triangular function type accessory, as shown in
Figure 3, which is characterized as follows: LN (Low Negative), MN (Medium Negative), Z (Zero), MP (Medium Positive), and LP (Low Positive).
Triangular membership functions are an optimal choice for developing a neuro-fuzzy controller since they provide computational simplicity and sufficient accuracy to approximate nonlinear system characteristics. These functions effectively capture system dynamics, given the input signals like error and its change rate as well as output coefficients Kp, Ki, and Kd thus simplifying the design and tuning process for the controller.
For each output coefficient
Kp,
Ki, and
Kd, a fuzzy rule base is compiled, as presented in
Table 4.
Rule 1 means if the error and its change rate are small and negative, then the system is in a stable state, so the derivative coefficient should be set at a high level to prevent sudden changes, and the integral and proportional coefficient ratio should also be set at a high level to provide sufficient gain to stabilize the system.
Rule 2 means that as the error and its change rate are moderate and negative, then both the average differential component coefficient values and the integral and proportional components coefficient ratio are necessary to achieve moderate stabilization.
Rule 3 means that if the error and its change rate are close to zero, then both the differential component coefficient and the integral and proportional components coefficient ratio should be close to zero to minimize the impact on the system.
Rule 4 means that the error and its change rate are moderate and positive, then the average differential component coefficient values and the integral and proportional components coefficients ratio are necessary to achieve moderate stabilization.
Rule 5 means that if the error and its change rate are large and positive, then the system is in a stable state, so the derivative coefficient should be set at a high level to prevent sudden changes, and the integral and proportional coefficient ratio should also be set at a high level to provide sufficient gain to stabilize the system.
Five rules are sufficient for effective system control, since each rule covers key error states and their change rate, ensuring the appropriate adjustment of the coefficients to achieve stability. These rules include the extreme and average error values and their changes, which allows them to cover the entire spectrum of possible system states. Supplementing each rule with the condition’s clear interpretation and the coefficients’ necessary adjustments makes the tuning process and the neuro-fuzzy controller optimization more transparent and convenient for engineering staff. Thus, using five rules instead of twenty-five minimizes the model complexity, while maintaining the system control adaptability in various operating modes. The possibility of expanding the fuzzy rule base to 25 will be considered in further research.
It is worth noting that in [
22], for the gas generator rotor R.P.M. neuro-fuzzy controller, it was also proposed to describe the input and output variables with a triangular membership function (
Figure 4), as well as a fuzzy rule base for each output coefficient
Kp,
Ki and
Kd, given in
Table 5.
The developed fuzzy rule base (
Table 4) provides a more flexible and adaptive approach to controlling a neuro-fuzzy controller in comparison with that developed in [
22]. In the developed fuzzy rule base (
Table 4), each rule describes changes in certain areas in error
e and its change rate
de, which makes it possible to more accurately adjust the coefficients
Kp,
Ki and
Kd depending on the system’s current conditions. In addition, the new rule base provides smoother and more consistent switching between different coefficient values, resulting in more accurate and efficient system control over a wide range of operating conditions.
An important advantage of the developed base of fuzzy rules (
Table 4) over that which was developed in [
22] (
Table 5) is its ability to take into account nonlinearities and uncertainties in the control system. Each rule in the base describes system operation-specific scenarios, taking into account not only the current error values and their change rate but also their relations in various situations. This allows for the coefficients
Kp,
Ki, and
Kd to be adapted more flexibly and efficiently to changing system operating conditions, providing more stable and accurate control even in the face of variable external influences and system parameters.
In addition, the developed fuzzy rule base (
Table 4) provides more intuitive and system-understandable control, since each rule has a direct interpretation in terms of the system’s current conditions. This makes the process of setting up and optimizing a neuro-fuzzy controller more transparent and convenient for engineering personnel, which can reduce development time and improve the system control quality as a whole.
It is known that a helicopter TE operates in various flight modes—takeoff, cruising flight, smooth descent, etc. In each of these modes, the engines experience different loads and external conditions, which can lead to changes in the system dynamics, and the neuro-fuzzy controller coefficients require different values for optimal control. Consider a takeoff situation where the engine is under high load and requires a fast and precise response. In this case, the fuzzy rule base rules can automatically increase the coefficient Kp to strengthen the proportional correction and ensure a fast response to changes. When entering cruise mode, when the engine loads stabilize, the rule base can automatically reduce the Ki coefficient and increase the Kd coefficient to more effectively control the integral and differential components and prevent overshoot and oscillation. Thus, thanks to the fuzzy rule base flexibility and adaptability, the neuro-fuzzy controller effectively responds to various system operating conditions and provides stable and accurate control in a wide range of operating scenarios.
After creating a base of fuzzy rules, the next step is to select the membership function
μj(
nTC) according to the following characteristics:
LN (Low Negative),
MN (Medium Negative),
Z (Zero),
MP (Medium Positive), and
LP (Low Positive). In this case, the triangular fuzzifier terms’ mathematical description, in which the bases are equal to the interval 0–1, is performed according to the following expression:
where
a is the function section beginning, where the function begins to increase, corresponding to the
LP category,
b is the function peak, where the function reaches its maximum value, corresponding to the
MP category,
c is the function section middle, where the function has a maximum value, corresponding to the
Z category,
d is the function section end, where the function begins to decrease, corresponding to the
MN category.
This activation function’s advantage over the min-function proposed in [
22] is that it allows for the element’s category membership to have more flexible control depending on its value. Unlike the min-function, which simply selects the minimum value between two categories, the triangular activation function provides a smooth transition between categories, allowing it to more accurately account for the item’s membership varying levels in each category.
Considering (37), the triangular membership function and its continuous nature, it is advisable to apply the gravity center (mass center) method for defuzzification, which calculates all points’ weighted average, weighing their significance by each point membership in its category. To improve the defuzzification accuracy and taking into account each category’s degree of significance during defuzzification, each fuzzy inference point is weighed while considering its belonging to the corresponding categories.
If
μj(
nTC) is the membership function for the fuzzy set
Aj, where
j is the category index, and
nTC is the input parameter, then the gravity method center’s modified equation, taking into account each fuzzy inference point weighting, will have the following form:
where
nTC j is the category
Aj,
the center is the sum of the category center’s weighted products and their membership degrees,
is the sum of the membership-weighted degrees.
In the gravity method center’s traditional equation , all fuzzy inference points are taken into account with the same weight, which can lead to underestimating or overestimating certain categories’ importance. For example, if one category’s importance is higher than another, this may bias the defuzzification result. Modified Equation (38) makes it possible to take into account each category’s degree of significance during defuzzification, which improves the inference accuracy and also takes into account the weighting coefficients’ influence on the result.
Example 1. In general, let there be a certain fuzzy variable x with the five membership categories, LN, MN, Z, MP, and LP, and their memberships are 0.1, 0.3, 0.5, 0.7 and 0.9, respectively. Each category has its output point xj of 1, 2, 3, 4 and 5. Then, when using the traditional gravity method center equation, the de-fuzzified value y for this fuzzy variable is calculated as , coupled with the modified gravity method center Equation (38) as as well, where w1, w2, w3, w4, and w5 are the weighting coefficients that can be selected depending on each membership category’s degree of importance. Thus, the advantage of the modified gravity method center with weight is that it allows each membership category’s degree of importance to be taken into account in defuzzification, which allows for the impact of each category on the final value to be more accurately reflected, which can be useful in situations where some categories have a greater influence or significance than others.
At the final data description stage, a mathematical expression is given to determine the gas generator rotor R.P.M. neuro-fuzzy controller input variables vector, which has the following form:
where
is the instantaneous value of the error,
is the instantaneous error change rate value.
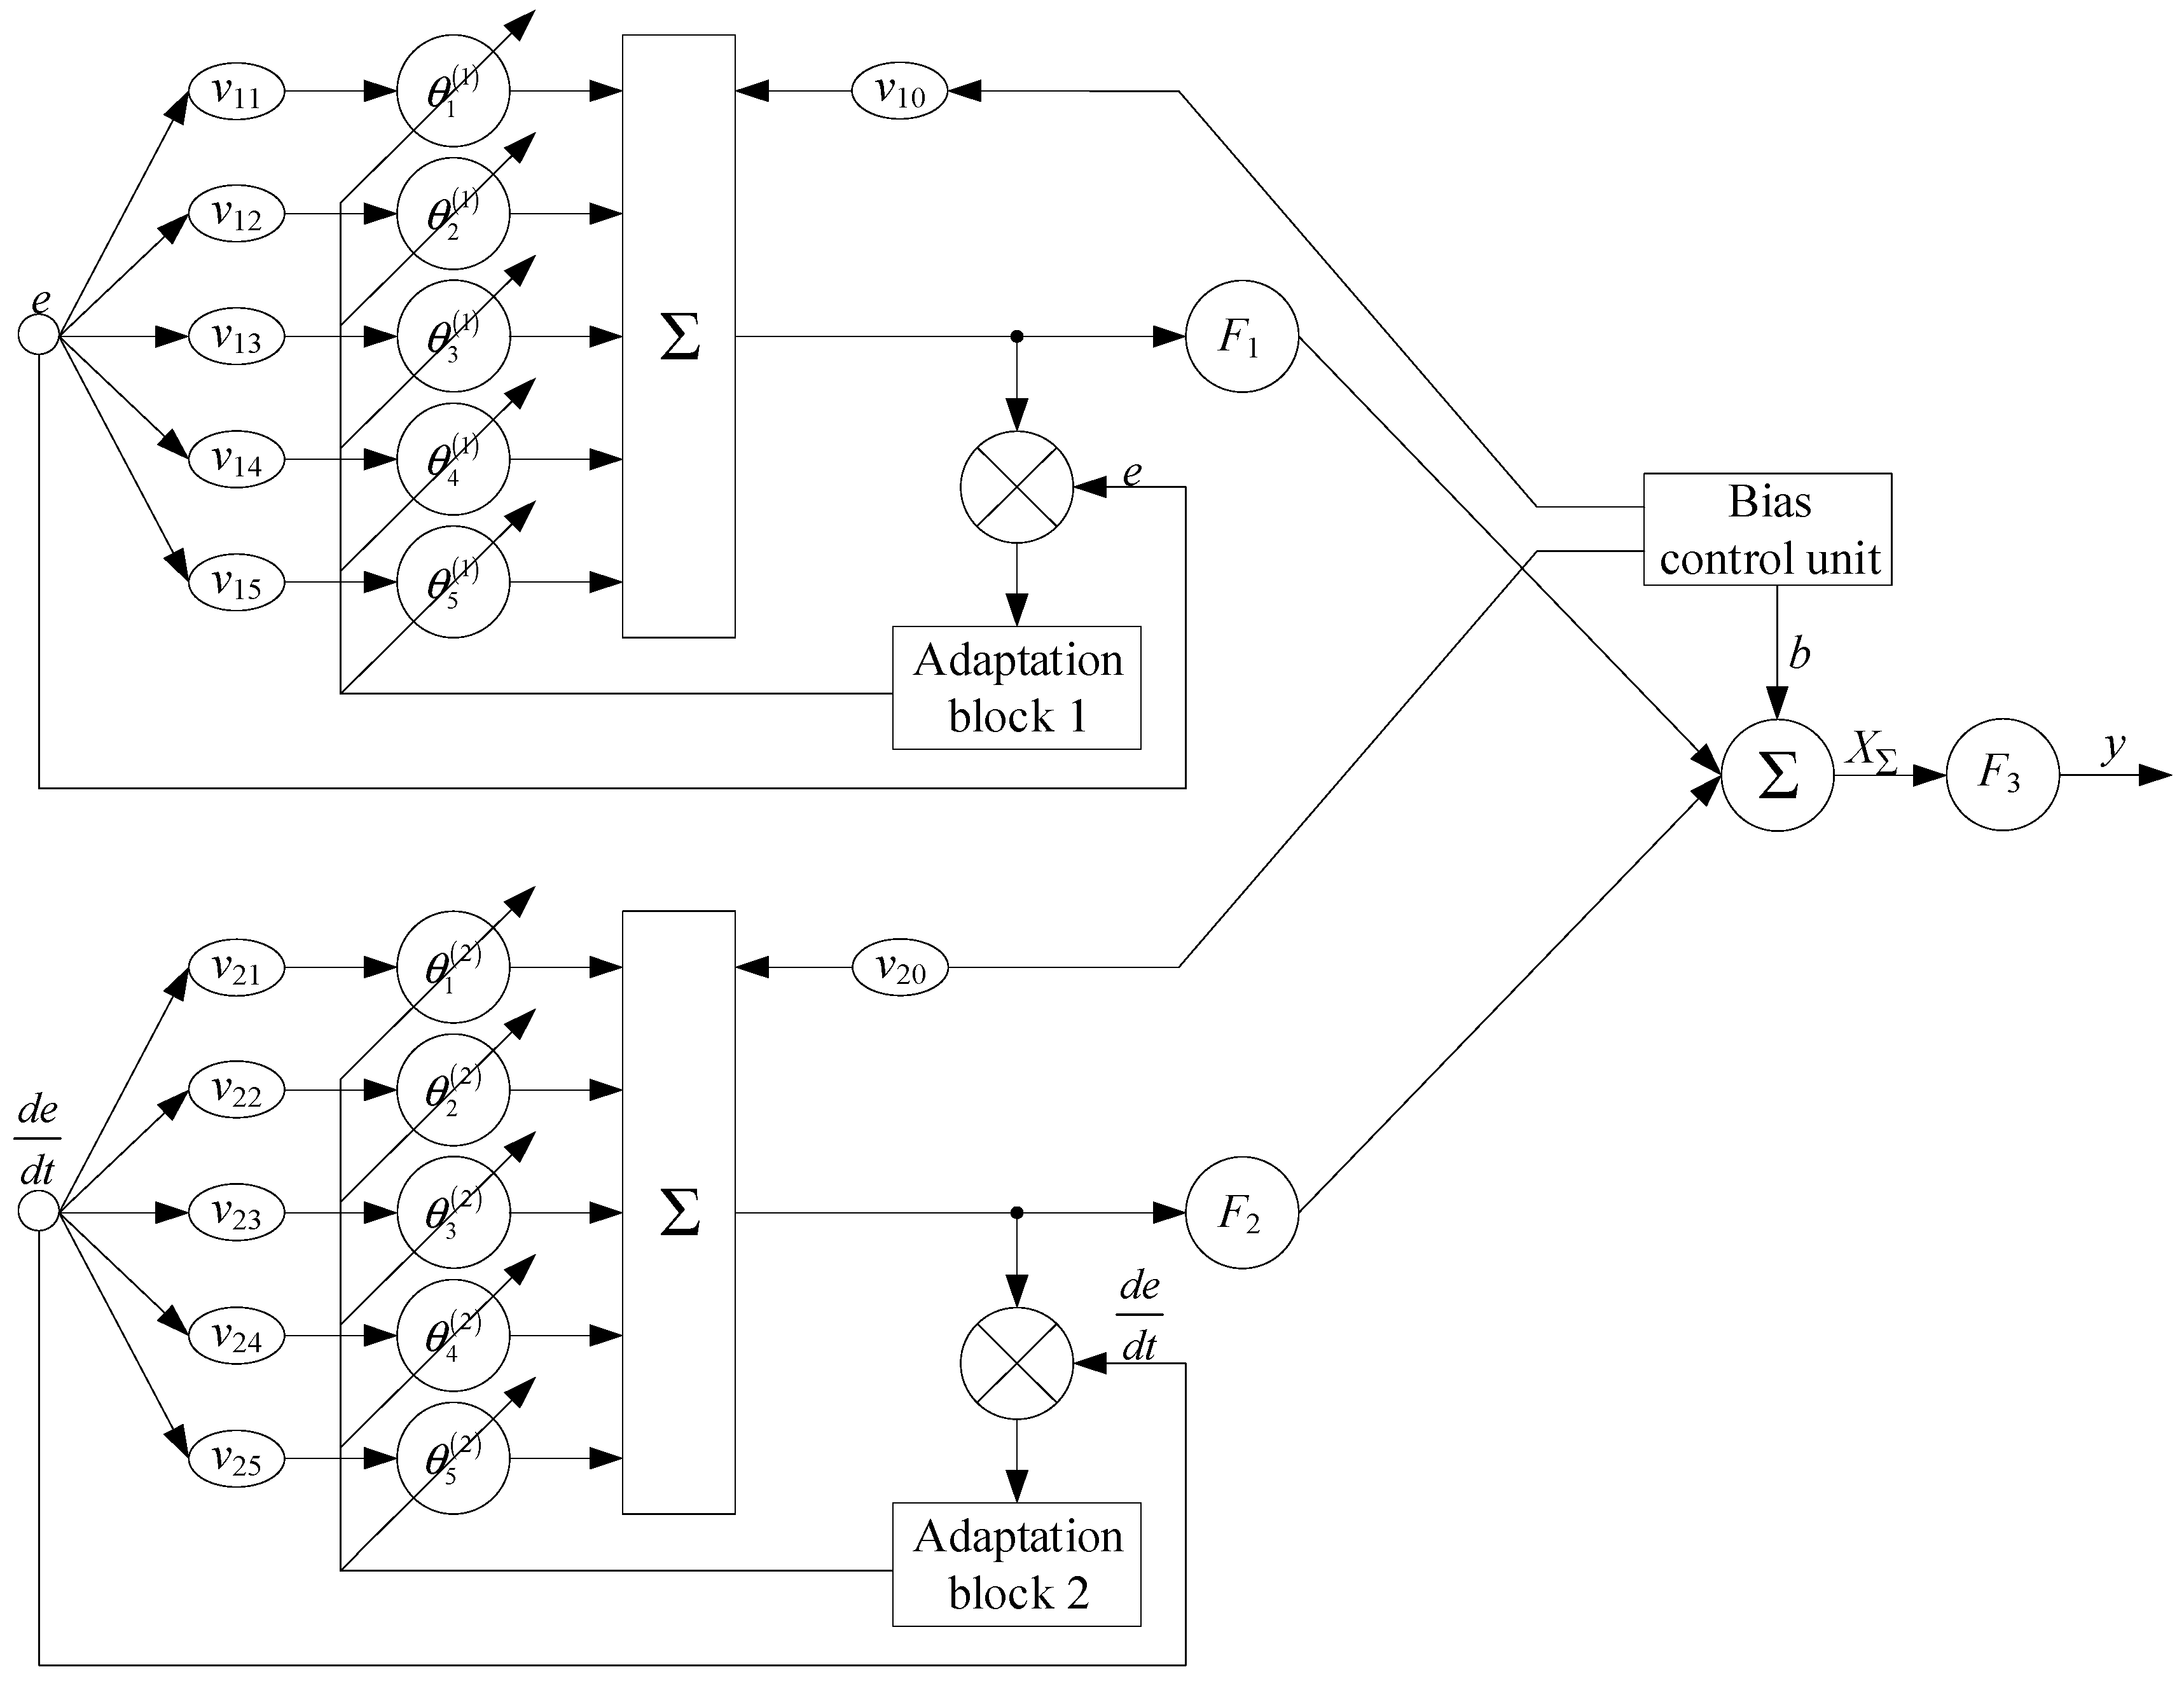
The article proposes the gas generator rotor R.P.M. neuro-fuzzy controller hybrid architecture implementation (
Figure 5), which implements the following fuzzy inference main stages:
Fuzzification (fuzzy logic)—in this stage, input data, such as the control error
e and its derivative
de, are fuzzified using membership functions (
Table 3), which convert numerical values into fuzzy values.
Neurons hidden layer—the second stage which includes the neurons’ hidden layer. Each neuron in the hidden layer processes the fuzzy values obtained in the previous stage. This layer is supplemented with feedback, which allows you to adjust the neurons’ output signals based on comparison with the desired values. The hidden layer
F1 and
F2 adaptive neurons’ activation functions are a hyperbolic tangent in the range from −1 to 1, which is appropriate in this regulation problem, where the membership function values (
Figure 3) are limited to this interval.
Aggregation (combination)—at this stage, the hidden layer output signals are aggregated by a fuzzy rule base by determining the degree of accuracy of the conditions defined in the rules and the neurons’ output signals combining to form an output signal.
Correction—at this stage of the neuro-fuzzy network operation, it includes the output signal correction based on comparison with the desired signal, a regulation error in an ACS or regulation error derivative, which allows you to configure the neuro-fuzzy controller parameters in such a way so as to minimize the regulation error or other system performance criteria.
Formation of a control action on the regulation object (helicopter TE) by applying the output layer neuron input through the nonlinear activation function of the neuron adder output signal and adjusting the neuro-fuzzy controller Kp, Ki and Kd coefficients is the neuro-fuzzy network (defuzzification) neurons’ fifth layer. The output layer neuron F3 activation function uses a hyperbolic tangent activation function, transforming input values nonlinearly within the range of −1 to 1, suitable for this control task with limited output intervals.
It is worth noting that the hidden layer consists of two neurons, which are supplemented with feedback. The comparison element in the feedback circuit compares the actual signal from the neuron adder output with the desired signal
d (control error or control error derivative). The adaptation algorithm (Widrow–Hoff algorithm [
36]) adjusts the input matrix coefficients to reduce the error
ε to zero. To select an adaptation algorithm,
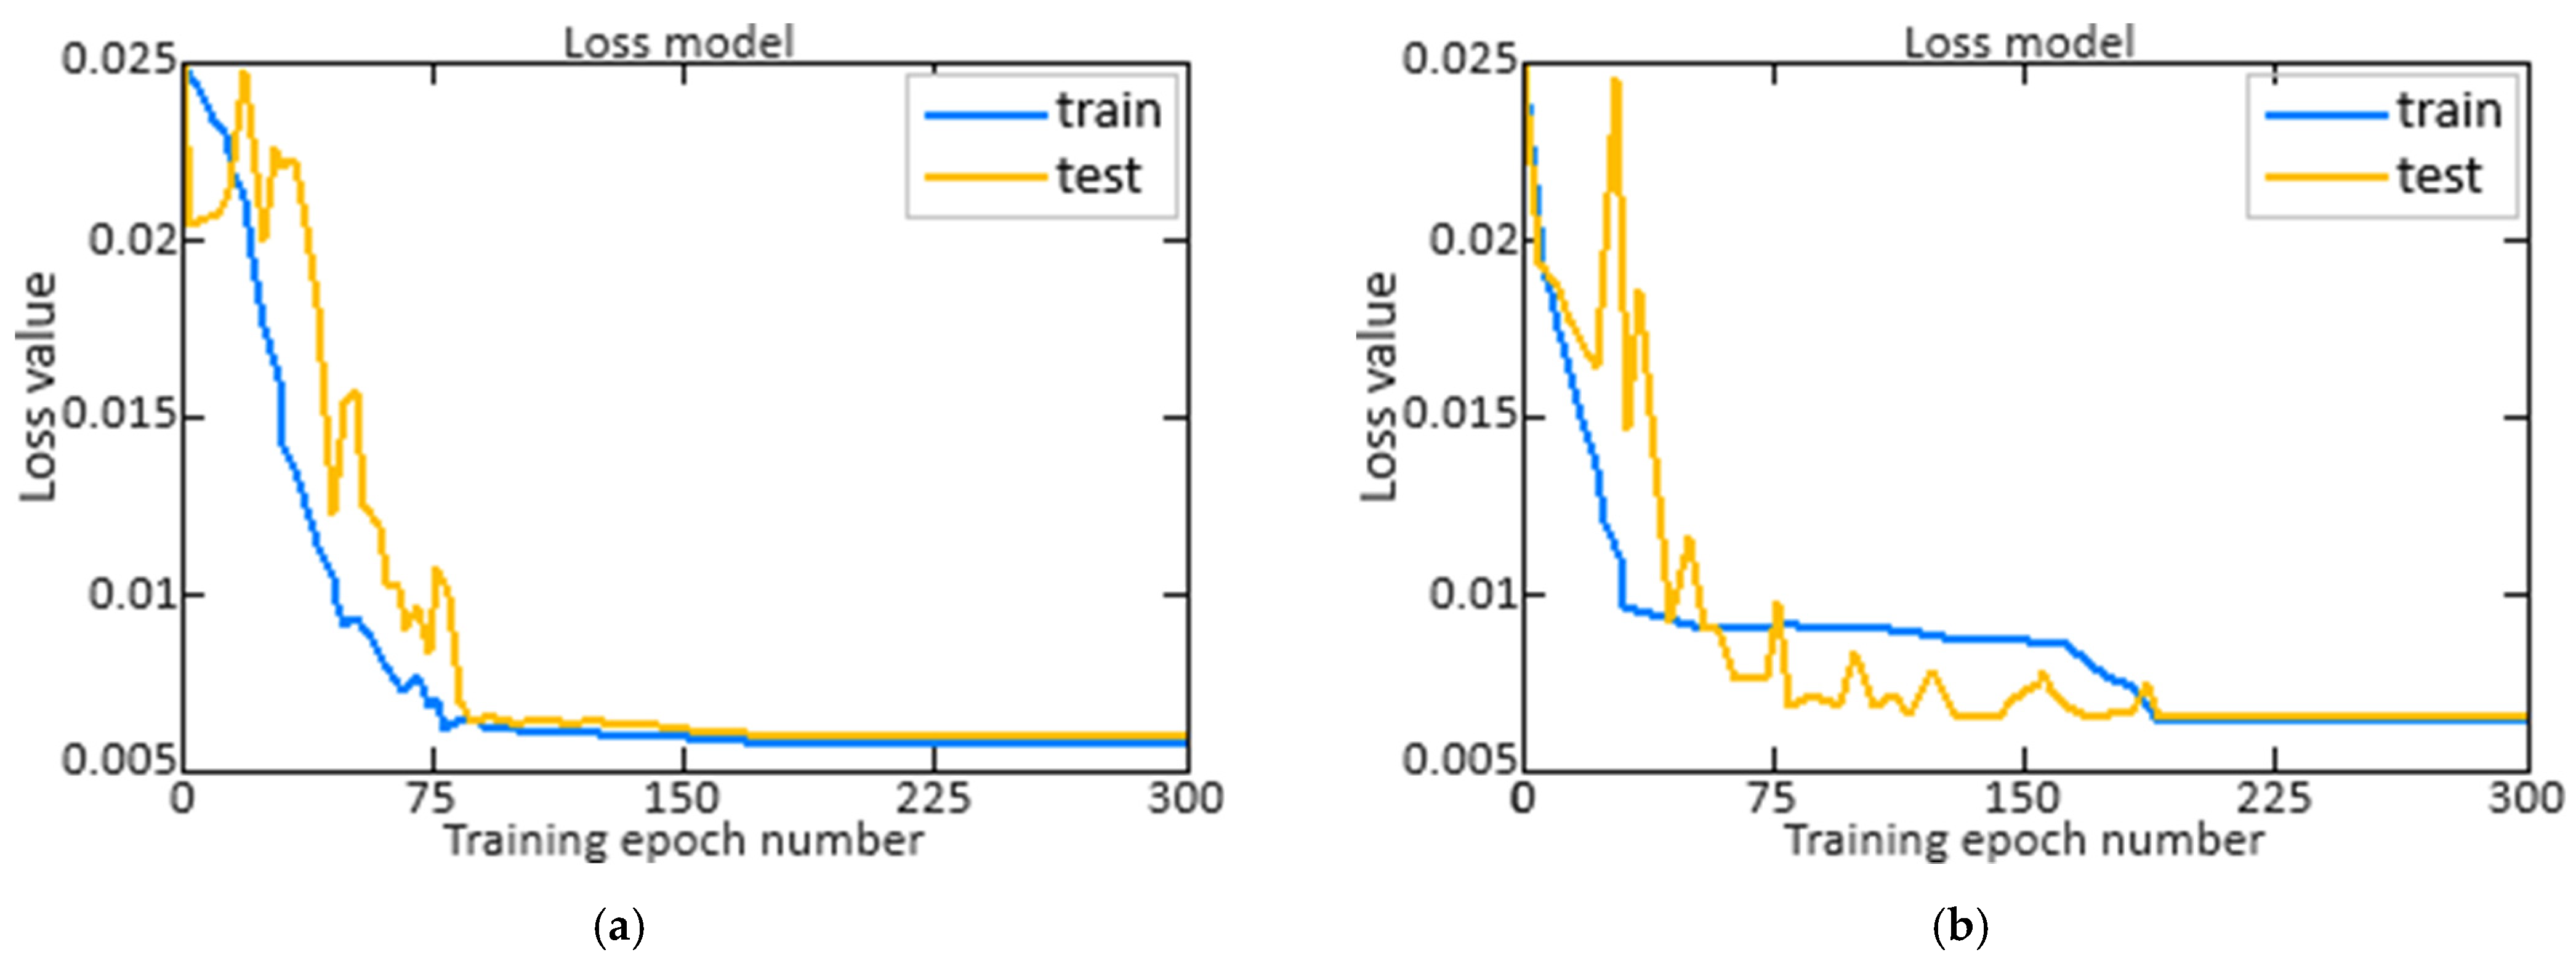
Table 6 compares the backpropagation algorithm and the Widrow–Hoff algorithm.
The analytical expression describing the Widrow–Hoff algorithm, in which the weights are updated not only proportionally to the input signal but also proportional to the neuron activation function gradient is as follows:
where
α = 0–1 is the training rate, ∇
f(
h) is the neuron activation function gradient along its input
h, and
δ is the prediction error.
The rationale for this modification is that it takes into account that the activation function gradient will lead to more stable and faster learning and will also allow for the neuron nonlinearity to be considered and for the weights to be updated more efficiently, especially when using nonlinear activation functions.
Let there be a neuron with one input that uses the hyperbolic tangent activation function th(h), where h = ω·x. For a numerical example, we arbitrarily set the following parameters: input signal u = 0.8, desired output d = 1.0, initial weight ω0 = 0.8, and learning rate α = 0.1. When using the traditional Widrow–Hoff algorithm, Δω = 0.016, and when using the modified Widrow–Hoff algorithm (40) Δω = 0.0343. This means that the weight update for the modified algorithm (40), taking into account the hyperbolic tangent activation function gradient in this case, will be more significant, which will allow the neuro-fuzzy network to quickly converge to the optimal solution.
The neuro-fuzzy network with the hyperbolic tangent activation function forms the output layer of a control action on the control object (helicopter TE), which is described by the following expression:
where
N = 5 (
LN,
MN,
Z,
MP and
LP) is the neuro-fuzzy network input vector term sets’ dimension,
v1 is the fuzzifier term sets’ membership degree based on the gas generator rotor R.P.M. deviation, while
,
,
,
,
,
v1 is the gas generator rotor R.P.M. deviation derivative fuzzifier term sets’ membership degree
,
,
,
,
.
To calculate the neuro-fuzzy controller input parameters’ bias neurons weights v10, v20, b, an approach similar to calculating the other neurons’ weights in the network is usually used. However, since biased neurons have no inputs and simply pass fixed values to bias the neurons’ activation in the next layer, their weights are usually fixed at one. Thus, the weights of the input bias neurons are usually given by ωb = 1.
To take into account dynamic changes in the system and ensure the helicopter TE’s gas generator rotor R.P.M. has more accurate and stable control over the proposed neuro-fuzzy controller (
Figure 5), the offset is dynamic. To dynamically change the weights of the neurons, the following differential equation is used that describes the change in weights
ωi(
t) with time
t:
where
ωi(
t) is the
i-th neuron weight at time
t,
α = 0–1 is the training rate,
ε(
t) is the error (the difference between the required and actual values), and
xi(
t) is the
i-th neuron input signal at time
t.
To find the weight value ω
i(
t) at time
t, set the initial value
ωi(0) with the further integration of the error
ε(
τ) product and the input signal
xi(
τ) over time from 0 to
t, that is as follows:
Taking into account the analytical expression describing the Widrow–Hoff algorithm, in which the weights are updated not only in proportion to the input signal but also in proportion to the neuron activation function gradient (40), the expression (43) will look like the following:
Expression (44) in the reduced form is obtained by combining (40) and (43). It is known that , where is the desired neuron output value, ωi(t) is the actual neuron output value. In this case, the input signals h weighted sum is defined as , the product ε(τ)·xi(τ) is expressed as . Using the δ definition, we obtained ε(τ)·xi(τ) = δ·xi(τ).
Thus, an analytical expression (44) is obtained, which determines the dynamic change in the neuron’s weights.
An error signal
is generated at the adaptation block 1 input. The adaptive neuron weight coefficients
new value calculation based on the gas generator rotor R.P.M. deviation is performed using the following recurrent formula:
where
are the adaptive neuron weight coefficients at time
k,
ε1(
k) is the error signal at the adaptation block input,
e is the gas generator rotor R.P.M. deviation,
is the adaptive neuron inputs activation degrees, defined as the gas generator rotor R.P.M. deviation neuron
i-th coefficient at
k-th iteration derivative [
22],
α1 = 0–1 is the training speed, a parameter where the neuron coefficient
adjustment speed is determined according to the gas generator rotor R.P.M. deviation, determined by the iterative optimization process convergence rate.
An error signal
is generated at the adaptation block 2 input. The adaptive neuron weight coefficients
new value calculation based on the gas generator rotor R.P.M. deviation is performed using the following recurrent formula:
where
are the adaptive neuron weight coefficients at time
k,
ε2(
k) is the error signal at the adaptation block input,
e is the gas generator rotor R.P.M. deviation,
is the adaptive neuron inputs’ activation degrees, defined as the gas generator rotor R.P.M. deviation neuron
i-th coefficient at
k-th iteration derivative [
22],
α1 = 0–1 is the training speed, a parameter where the neuron coefficient
adjustment speed is determined according to the gas generator rotor R.P.M. deviation, determined by the iterative optimization process’ convergence rate.
Then, expression (41), which describes the neuro-fuzzy network output layer with the activation function of the hyperbolic tangent, takes the following form:
where
r1 and
r2 are the hidden layer neuron adders’ outputs.
2.5. Description of the Analyzing and Preprocessing Input Data Methodology
The main parameter of the training sample is the gas generator rotor R.P.M.
nTC, recorded on board the helicopter, as well as the main atmospheric parameters as follows:
h is the flight altitude,
TN is the temperature,
PN is the pressure, and
ρ is the air density [
37,
38]. The training sample parameters are reduced to absolute values according to the gas-dynamic similarity theory [
39]. Also added to the training sample are the gas generator rotor R.P.M. parameter deviation values
from the reference value, which is equal to one, as well as the gas generator rotor R.P.M. parameter deviation change rate
from the reference value.
At the training sample preliminary processing stage, its homogeneity is assessed and divided into control and test samples, where the training and test samples’ representativeness is then assessed using cluster analysis. The training sample homogeneity is assessed by calculating the Fisher–Pearson criterion [
40] based on the observed frequencies and comparing with the
χ2 critical values with degrees of freedom
df and a significance level
α = 0.01, which indicate the need to accept statistical significance only if these are obtained, or if the more extreme results probability (assuming the null hypothesis is true) are less than 1%. The Fisher–Pearson criterion is determined according to the following expression:
where the sum is taken over all cells of the contingency table, while
Oij is the cell observed frequency (
i-th row,
j-th column),
Eij is the cell expected frequency, which is calculated as follows:
where
Ti is the
i-th row sum (observed frequencies sum),
Cj is the
j-th column sum (observed frequencies sum), and
N is the observations total number in the sample.
The degrees of freedom are defined as follows:
where
r is the contingency table row number, and
c is the contingency table column number.
To determine the results’ statistical significance, a
χ2-square distribution table is used to calculate the
p-value associated with the resulting
χ2 value and the degrees of freedom value
df. In this case, the
p-value is calculated as follows:
where
is the observed value of the
χ2-statistic. Expression (53) shows how to obtain a
χ2 value probability of equal to or greater than
, provided that the null hypothesis is true (that is, that the observed and expected frequencies coincide).
The decision about the training sample homogeneity is made based on the obtained p-value as follows:
If the p-value is less than the specified significance level (α), the null hypothesis is rejected, and a conclusion is drawn about the training sample heterogeneity.
If the p-value is greater than α, there is no reason to reject the null hypothesis, which indicates the training sample homogeneity.
According to [
37,
38], although the Fisher–Pearson test can be used to determine the adequacy of the training sample homogeneity, another similar test can be conducted—the Fisher–Snedecor test [
41]. The Fisher–Snedecor criterion is defined as follows:
where
n1 and
n2 are the first and second subsample sample sizes, respectively,
nTC1i and
nTC2j are individual observations in the first and second subsamples, and
and
are the first and second subsamples’ average values. The Fisher–Snedecor test has a Fisher distribution with (
n1 − 1,
n2 − 1) degrees of freedom.
Based on [
37,
38], a training set of 256 elements is divided into two subsamples of 128 elements each, that is,
n1 =
n2 = 128. Then the critical value of the Fisher–Snedecor criterion is 2.62.
To assess the training sample representativeness,
k-means clustering is used—a machine learning method used to divide a dataset into clusters, so that objects within one cluster are as similar to each other as possible, and objects from different clusters are as different as possible [
42,
43]. It is assumed that
is the gas generator rotor R.P.M. value set, while
,
K is the cluster number. At the initial stage, the centroids
μ(1),
μ(2), …,
μ(K) are initialized randomly.
For each of the gas generator rotor R.P.M. value
nTCi, which cluster it belongs to is determined by selecting the cluster with the closest centroid as follows:
where
c(i) is the clustered index to which each gas generator rotor R.P.M. value
nTCi relates.
Next, the centroids are updated as all the gas generator rotor R.P.M. arithmetic mean values are assigned to the corresponding cluster:
where
Sj is the gas generator rotor R.P.M. value set assigned to the
j-th cluster.
Calculations according to (55) and (56) are repeated until the centroids no longer change significantly. The algorithm stops when a convergence criterion is met, for example, when the change in centroids becomes insignificant (which can be ignored).
In this case, the
k-means algorithm seeks to minimize the sum of the squared distances from each data point to its cluster centroid, that is according to the following:
At the preprocessing stage of the helicopter TE’s gas generator rotor R.P.M. neuro-fuzzy controller input data, the transfer function frequency and time characteristics are analyzed to optimize the controller settings, which allows for more effective training and improved gas generator stability in various operating conditions.
According to (35), the helicopter TE gas generator rotor R.P.M. transfer function type is similar to the bandpass filter transfer function, that is as follows:
In this case, the analytical expression describing the complex transfer function has the following form:
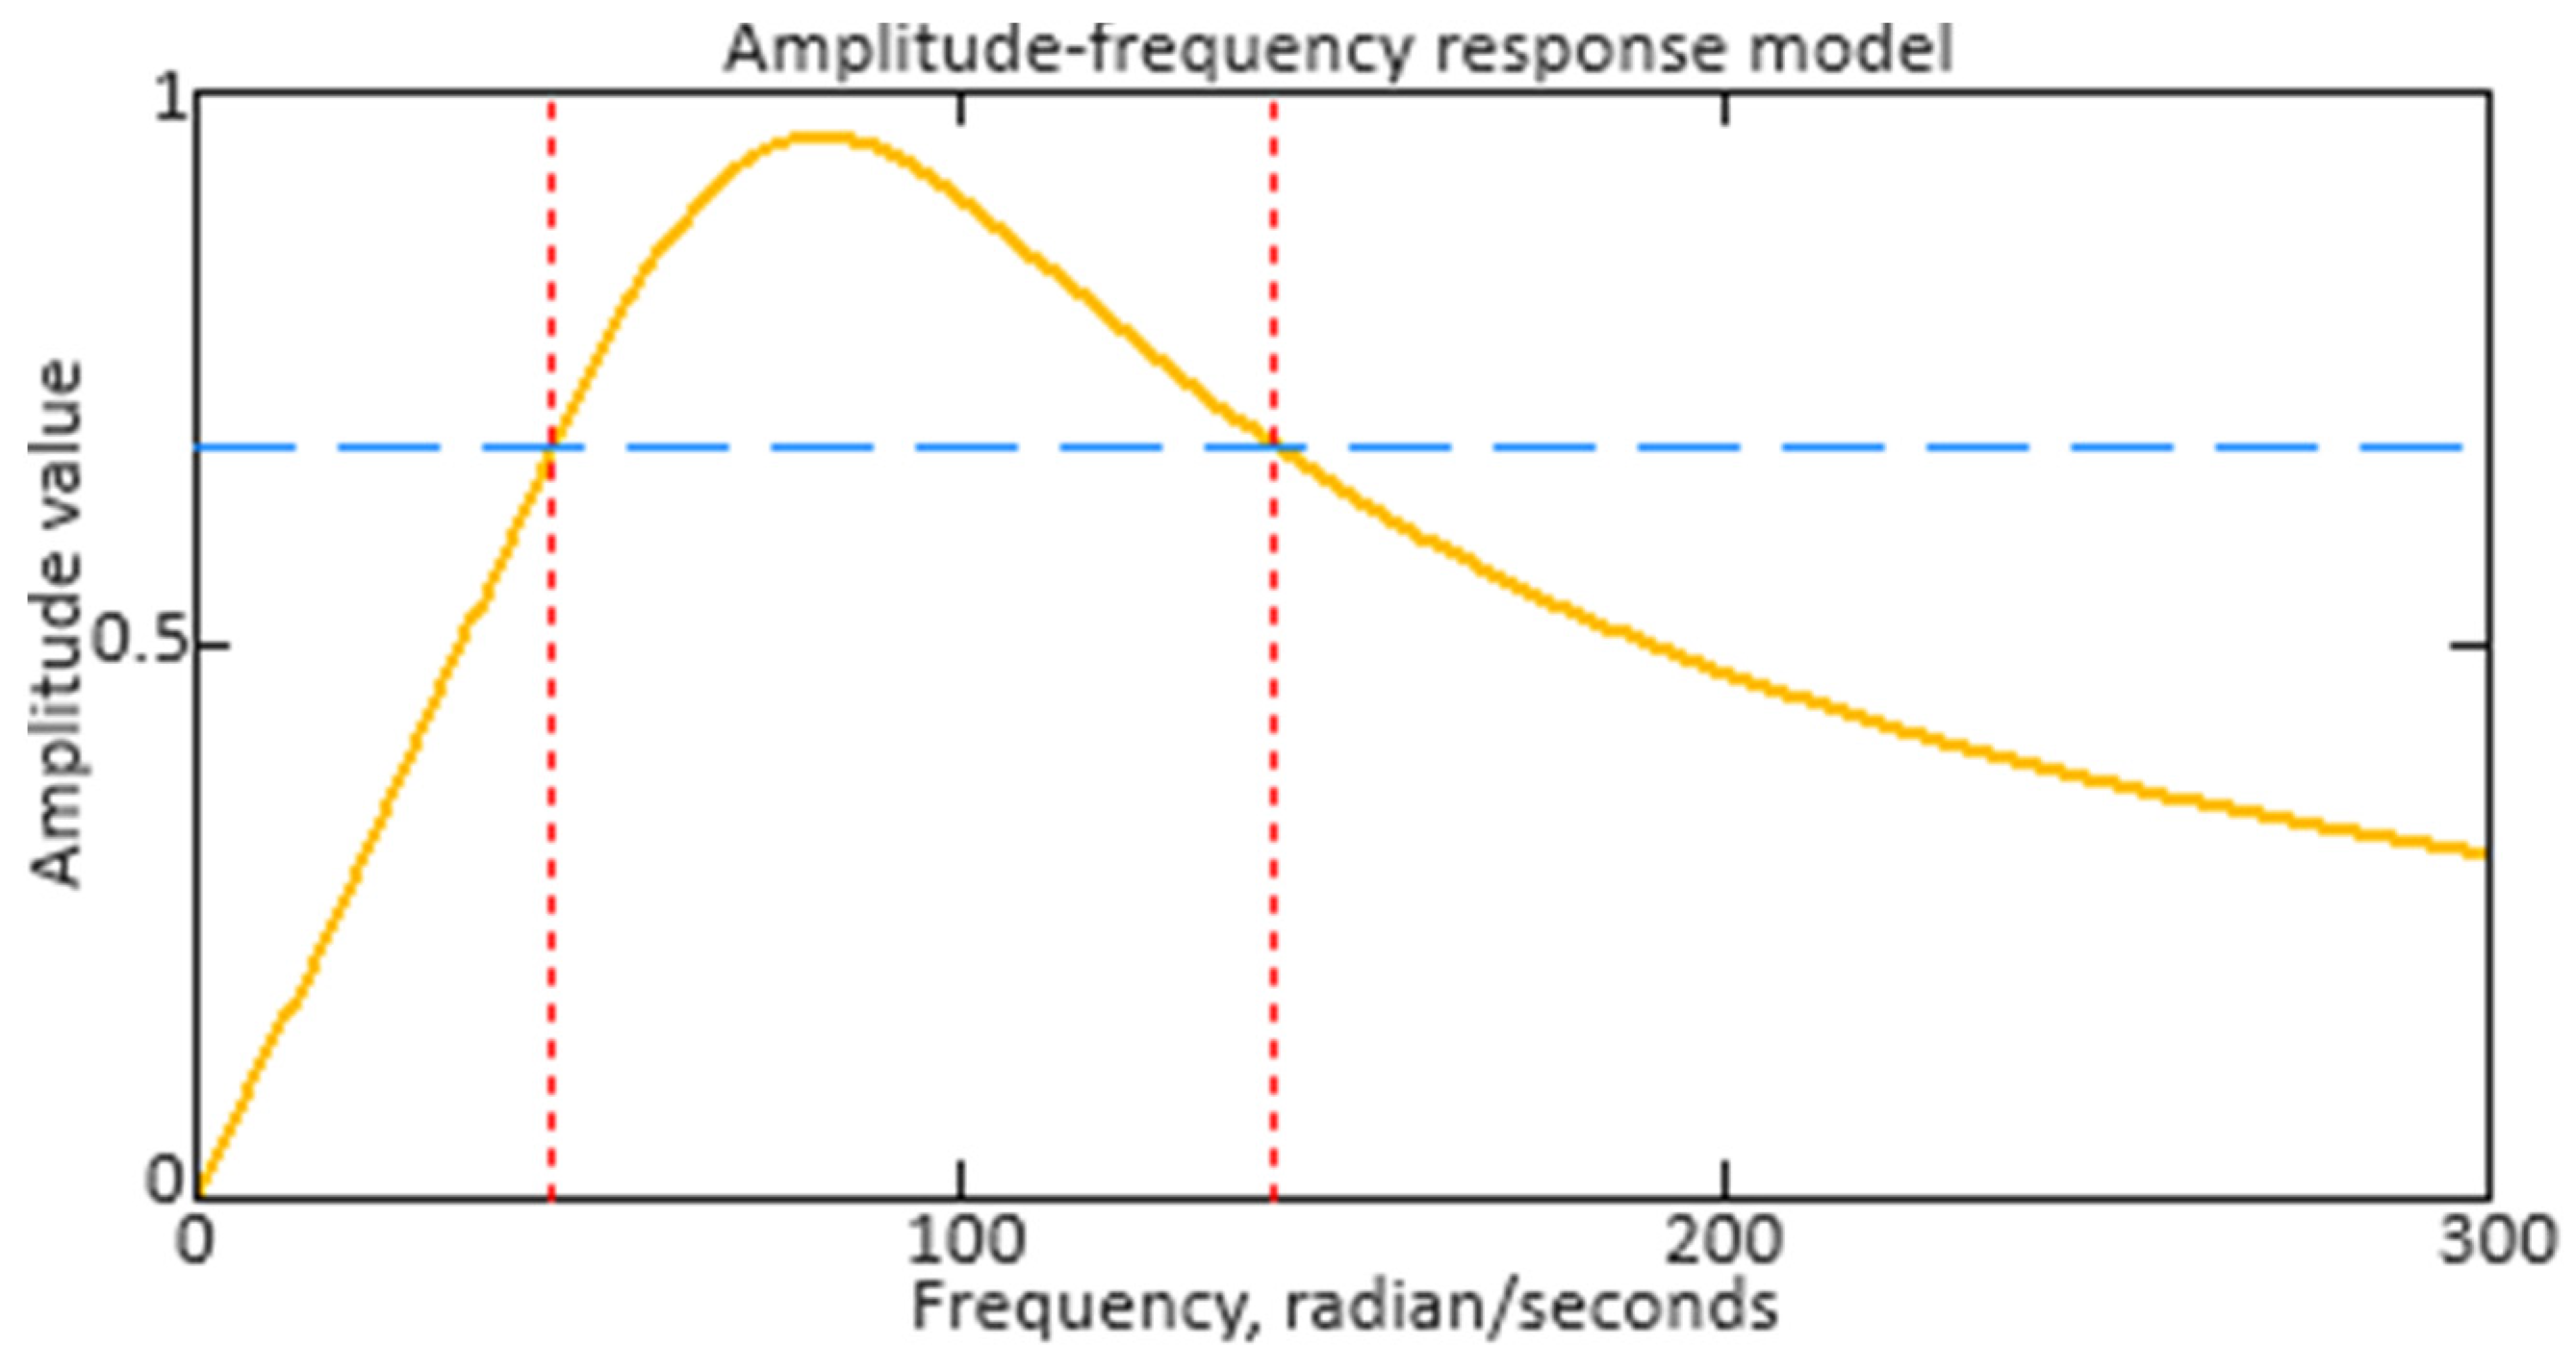
from which the analytical expression describing the amplitude–frequency response (AFR) has the following form:
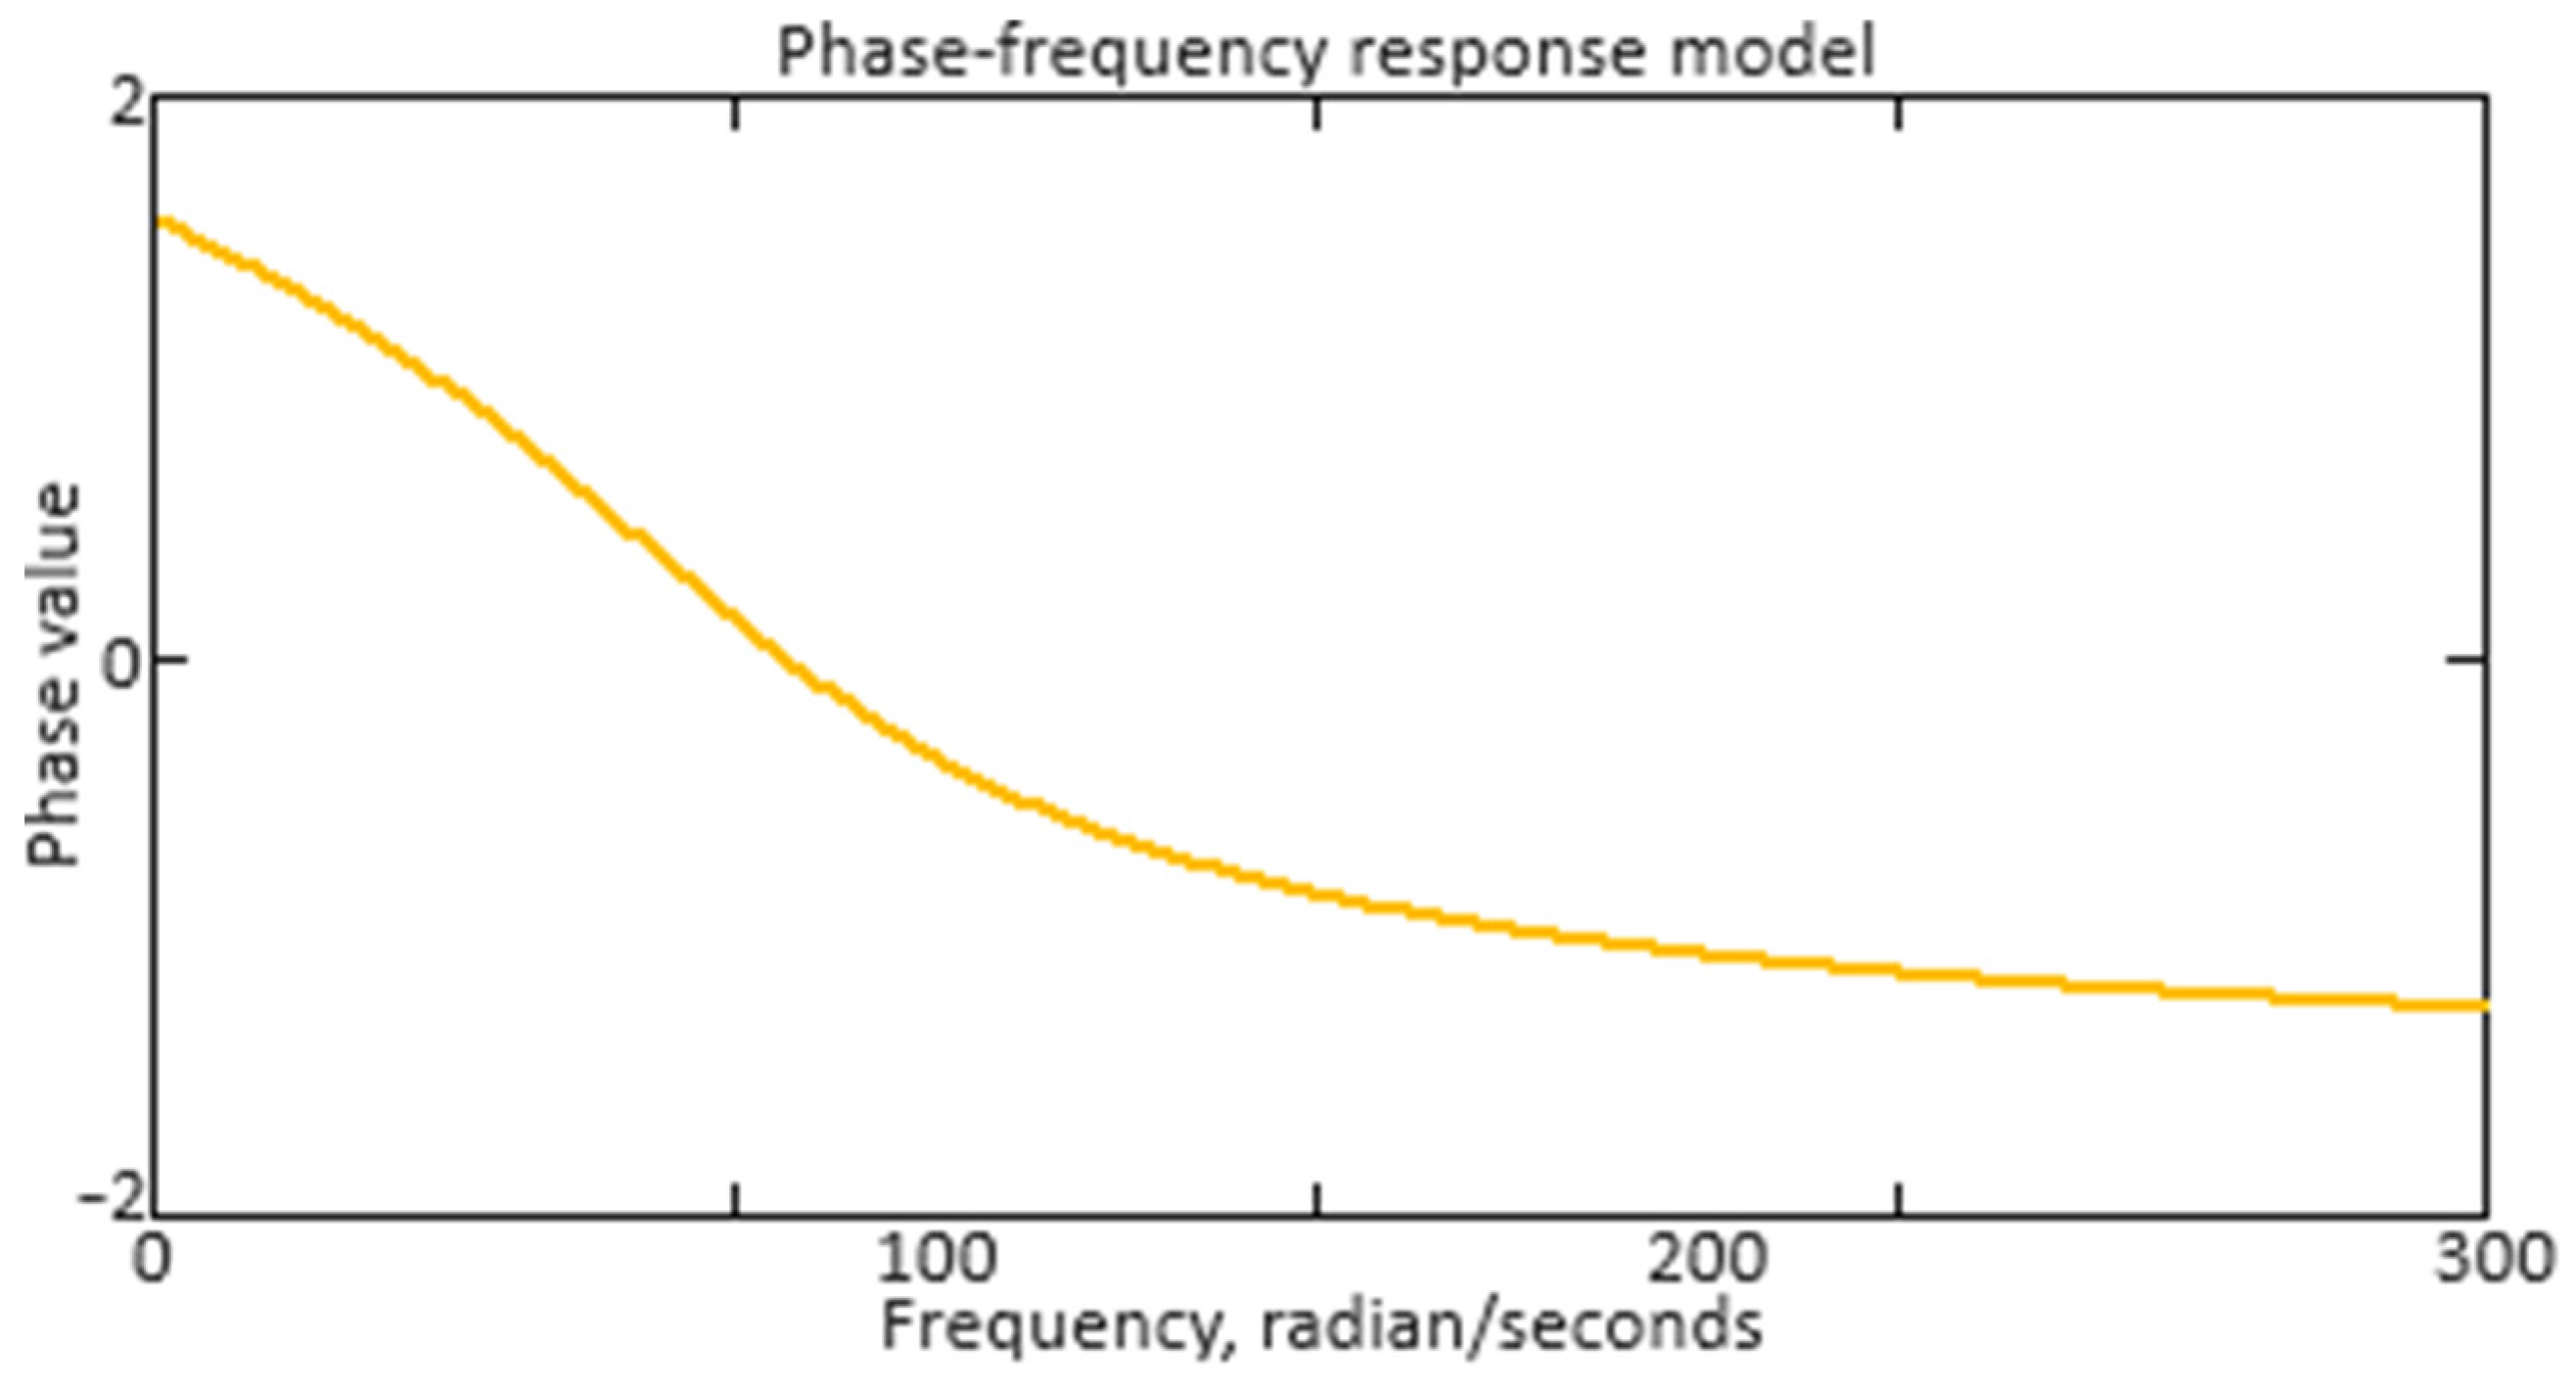
The phase–frequency response (PFR) research also plays an important role, especially for real-time systems, but their influence on the controller’s overall behavior can be interrelated with the amplitude characteristics. It is important to consider that the neuro-fuzzy controller PFR reflects its ability to provide stable and efficient control to the gas generator rotor R.P.M. over a wide range of operating conditions. From (59), the analytical expression describing the PFR has the following form:
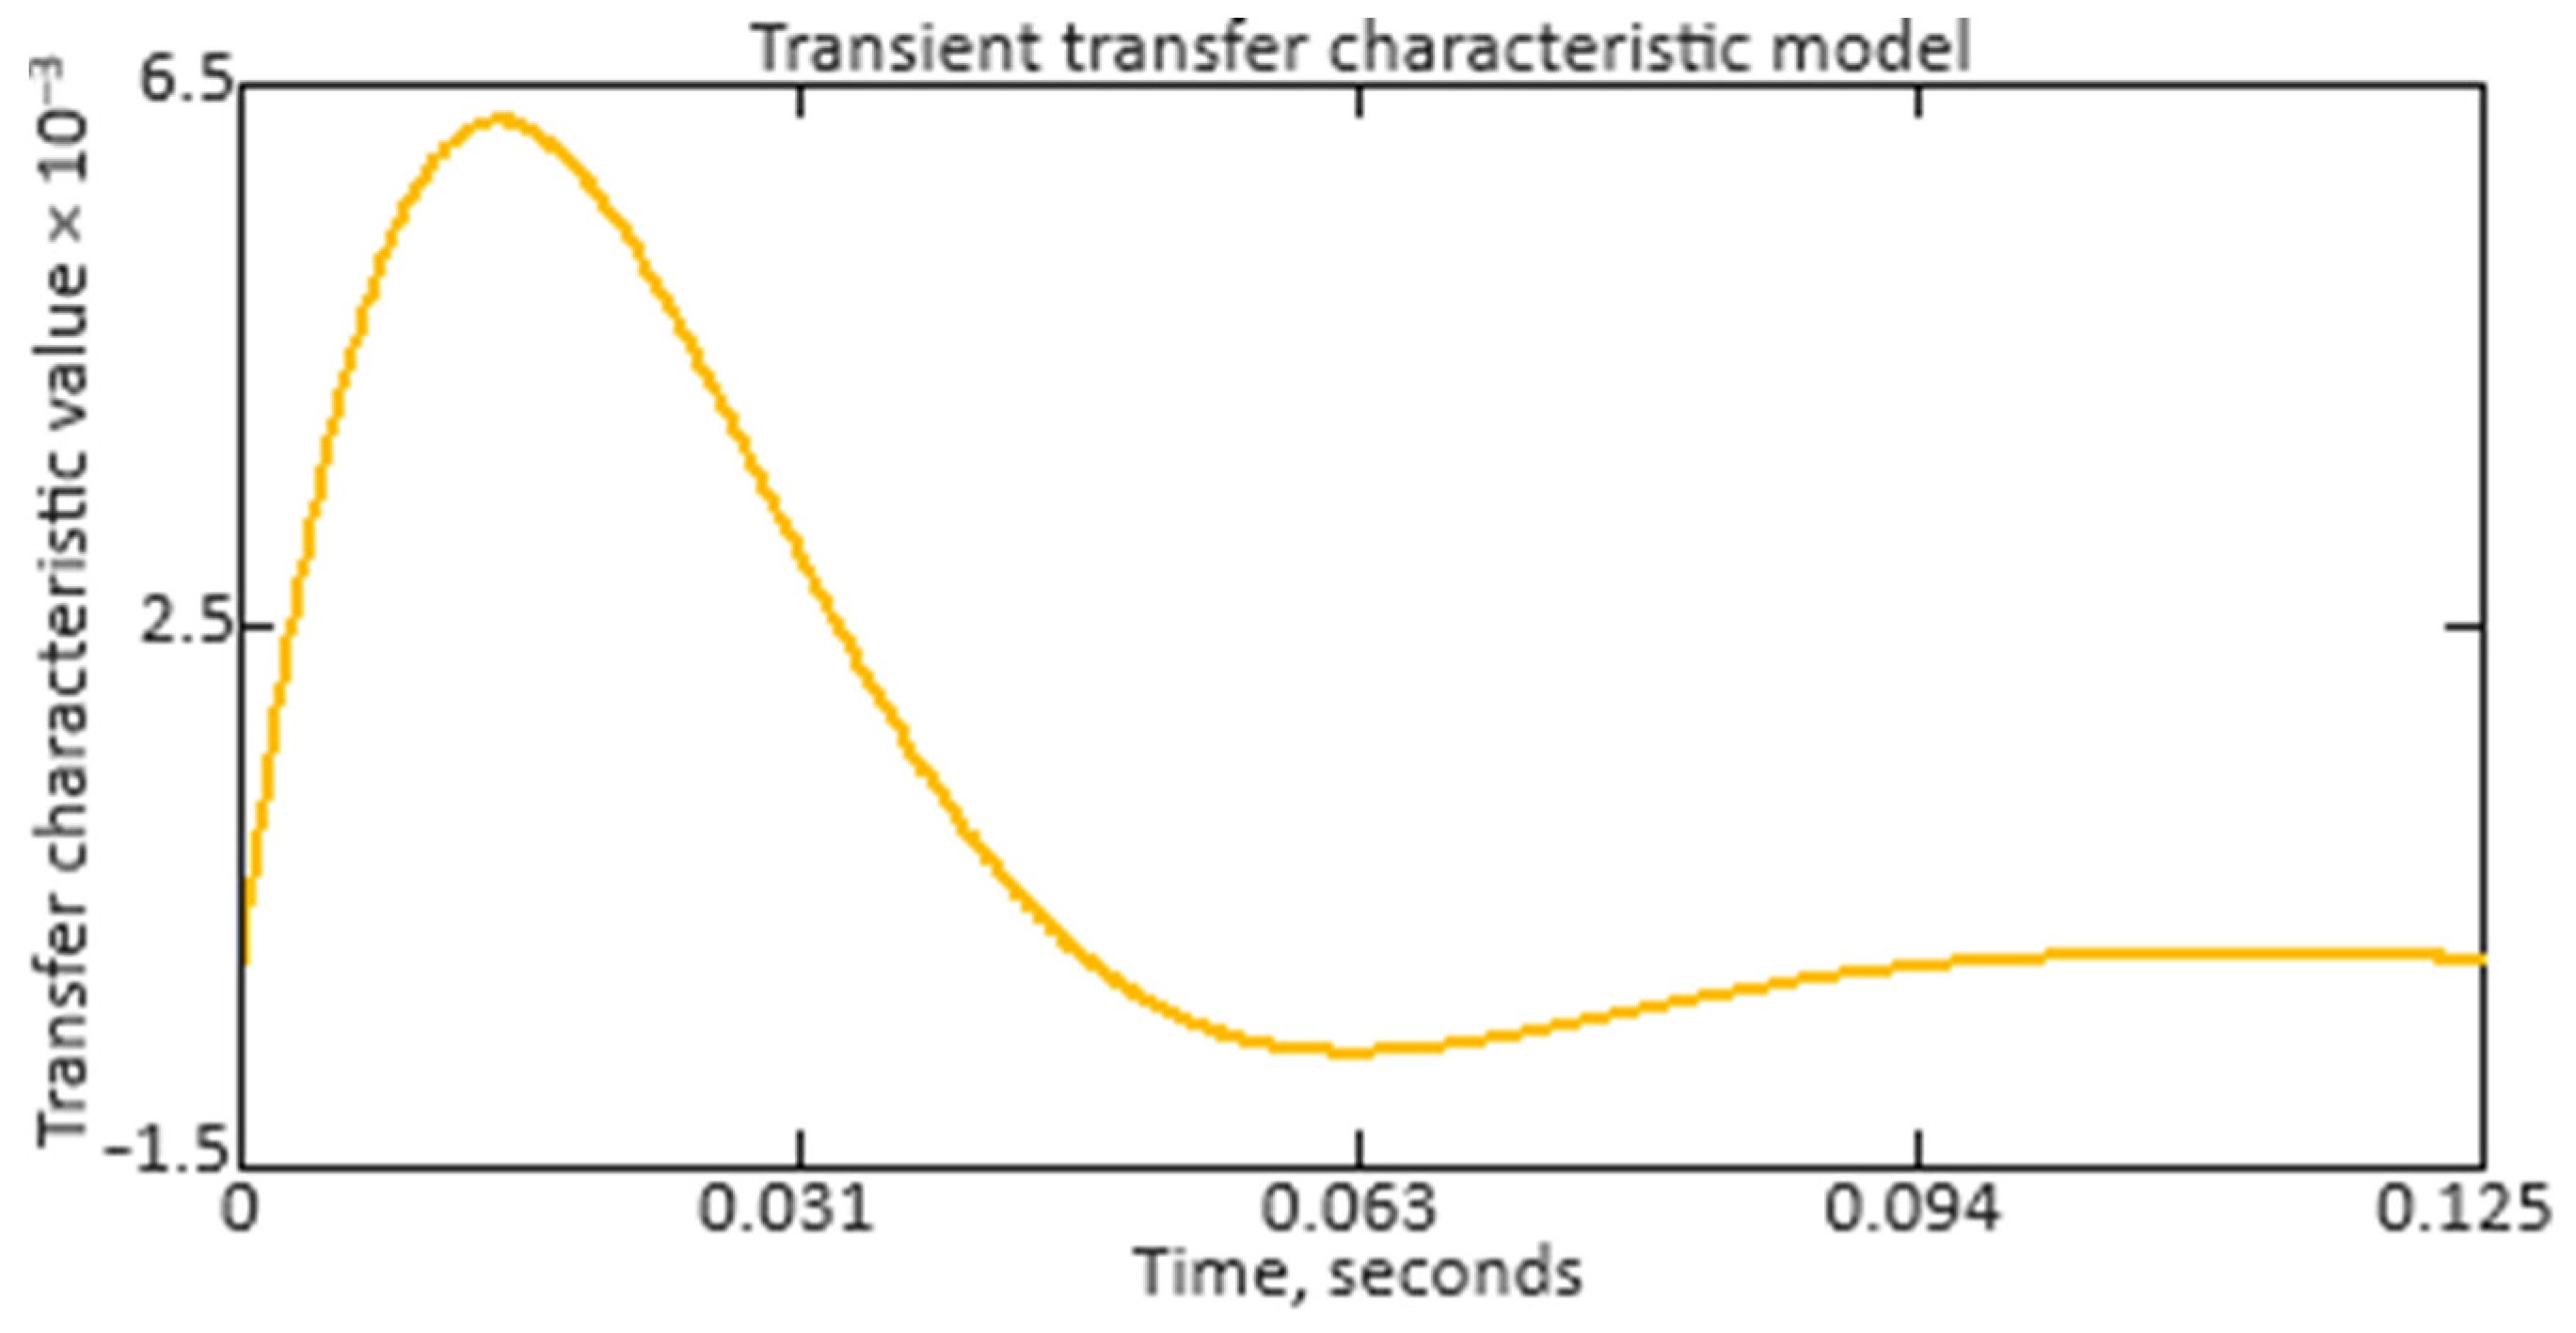
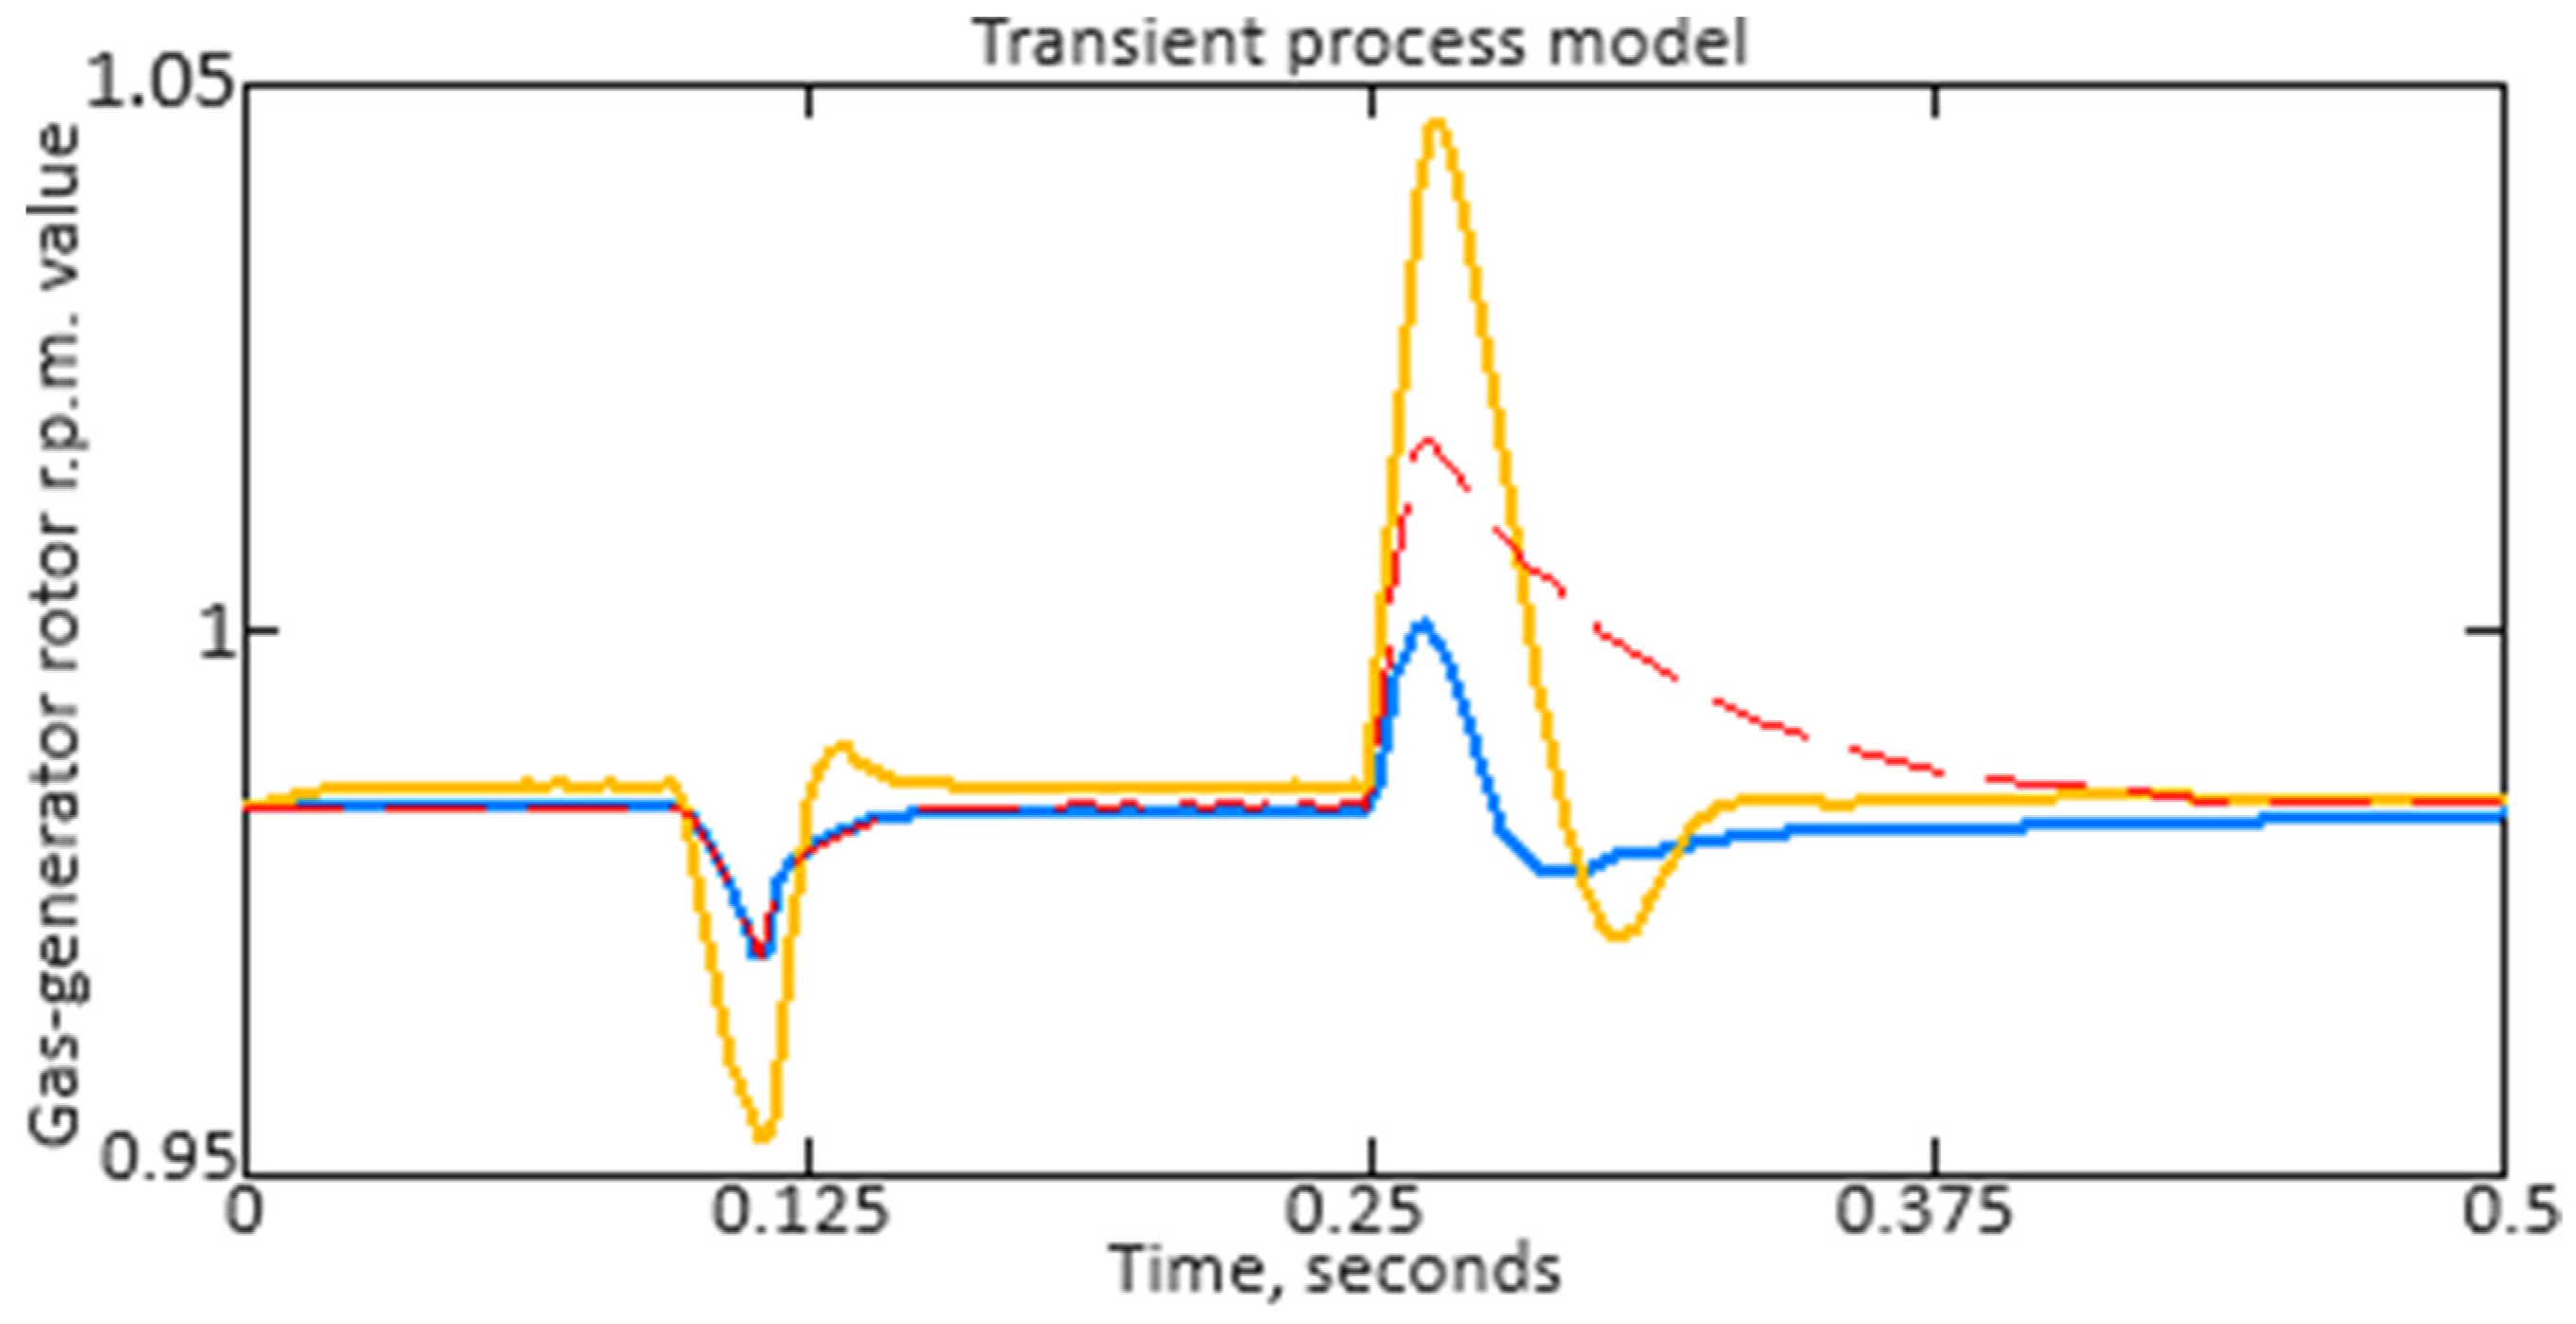
Next, the neuro-fuzzy controller’s transient transfer characteristics are constructed and analyzed to assess its dynamic properties and behavior in the time domain. Unlike frequency response, which describes the system behavior in the frequency domain, transient transfer response provides insight into how the system responds to changes in the input signal over time. The transient transfer characteristic analysis allows us to determine such important characteristics as settling time, overshoot, transient time, and other parameters that are important for assessing the controller efficiency under real operating conditions. The transient transfer characteristic construction and analysis allows the engineering staff to judge the controller stability, accuracy, and dynamics, which is important for ensuring the system’s reliable and effective control, such as the helicopter TE’s gas generator rotor R.P.M. In addition, the transient transfer response analysis can help in optimizing the neuro-fuzzy controller parameters and tuning them to achieve the required control characteristics. The neuro-fuzzy controller transient transfer characteristic is determined by the following form expression:
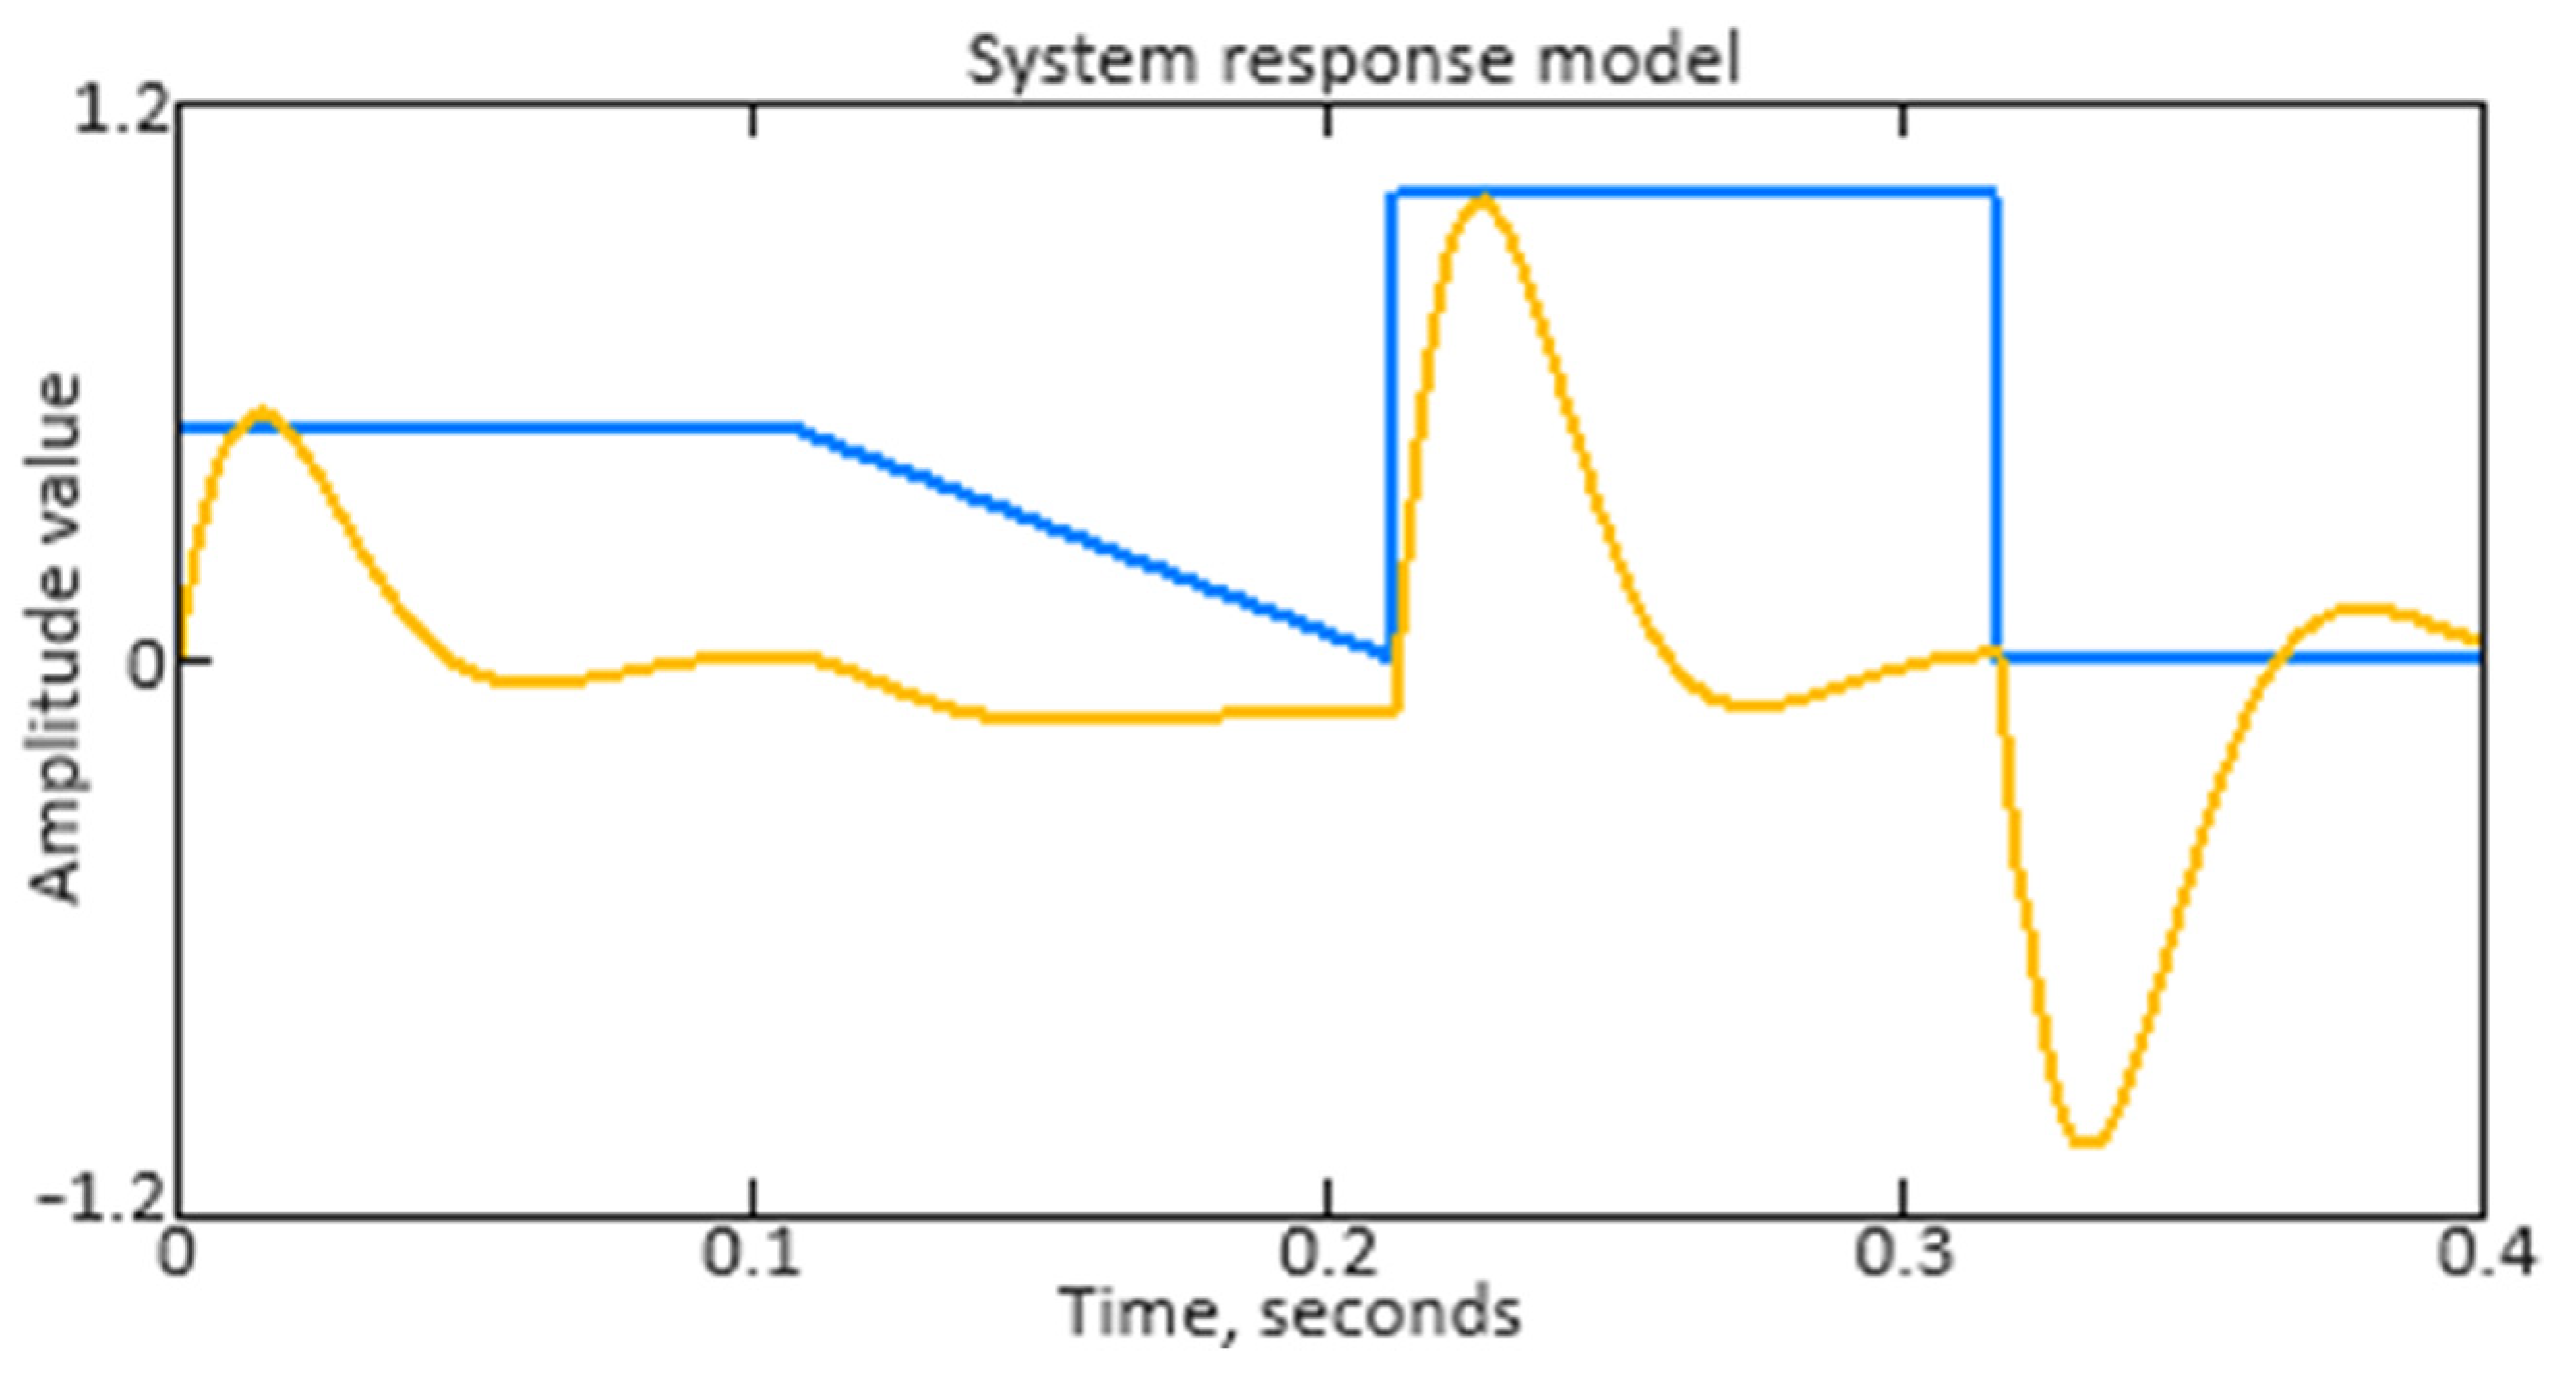
After studying the transient transfer characteristic, the neuro-fuzzy controller reaction to a non-periodic signal, which characterizes the helicopter TE gas generator rotor R.P.M., is researched. To determine the neuro-fuzzy controller response to a non-periodic input signal, the Duhamel integral is used, for which the
n-th interval has the following form:
where
tlimit is the time boundary value between the previous
n − 1 and the given
n-th intervals,
tup is the integration upper limit on the given
n-th interval, and
n is the interval number, also indicating the number of the section from the input function
uin(
t)
n;
t is a random moment in time that must be within the given
n-th interval.
2.6. Improving the Guaranteed Stability Margin Ensuring Method
Based on [
44,
45], to increase the calculated ACS stability, a new method for ensuring a guaranteed stability margin in magnitude and phase is proposed, based on the frequency oscillation index
M, which modifies the Nyquist criterion. This method provides the closed-loop control system with a guaranteed stability margin, based on the fact that the “dangerous” point with coordinates (−1,
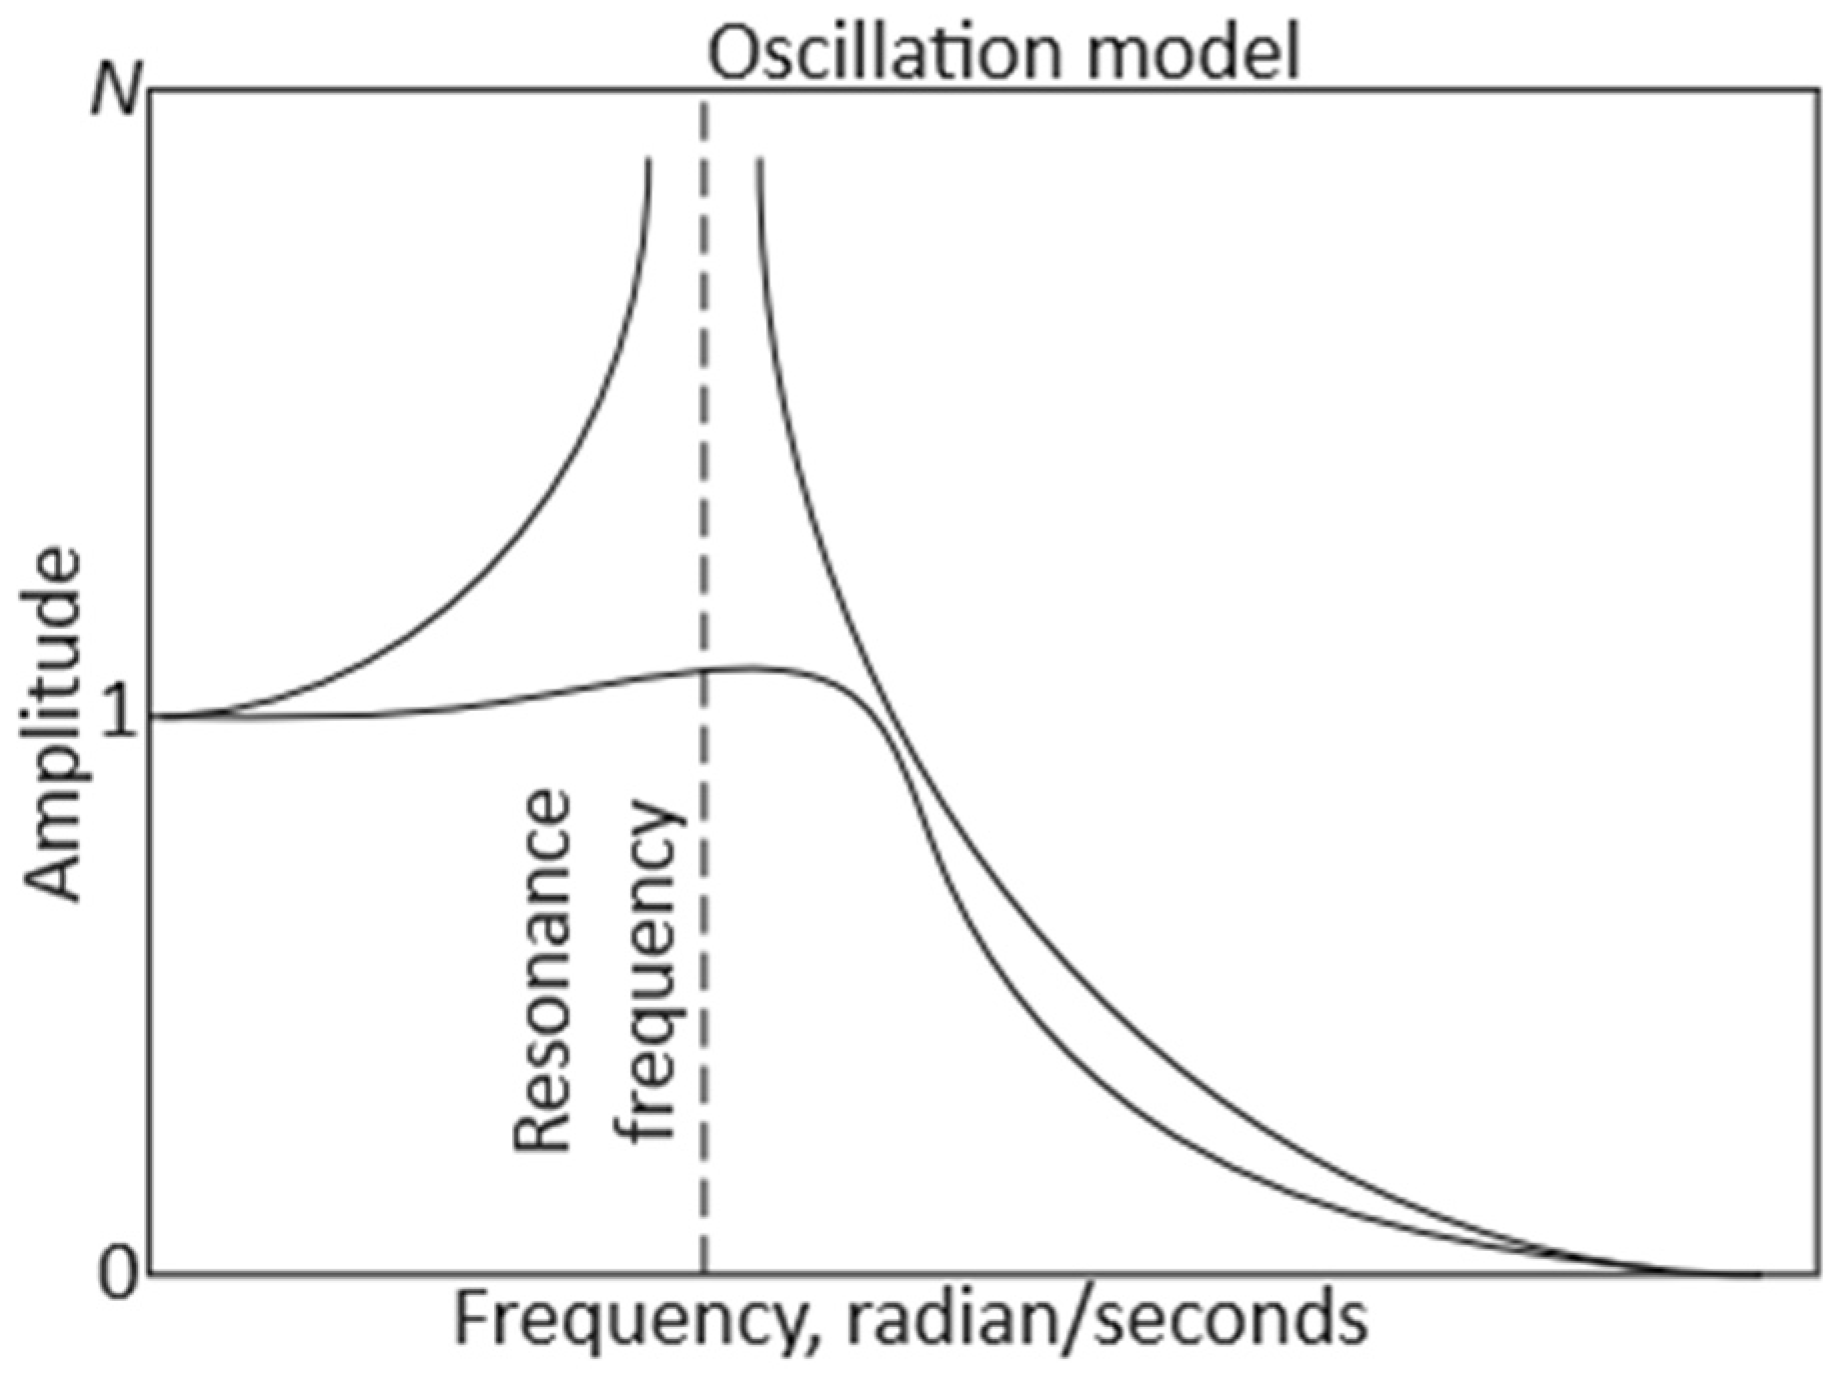
j0) belongs to the complex plane’s forbidden region. Taking into account the inaccuracy of the control object’s mathematical description due to its characteristics’ uncertainty and variability, the modified Nyquist criterion expands the stability boundary from a point to the complex plane region, prohibiting the gas generator rotor R.P.M. open-loop nonlinear ACS hodograph entry into it. The frequency indicator of oscillation (
Figure 6) according to [
44,
45,
46] is described by the following expression:
where
G(
ωp) is the closed-loop system frequency response at the resonant frequency (the frequency at which the closed-loop system is maximum oscillation amplitude), and G(0) is the closed-loop ACS frequency response at zero frequency.
The closed-loop system stability margin is determined by the hodograph distance degree WACS(j·ω) from the “dangerous” point with coordinates (−1, j0) and is quantitatively equal to the inverse value . The larger , the more the hodograph WACS(j·ω) approaches the “dangerous” point, and the smaller the system’s stability margin.
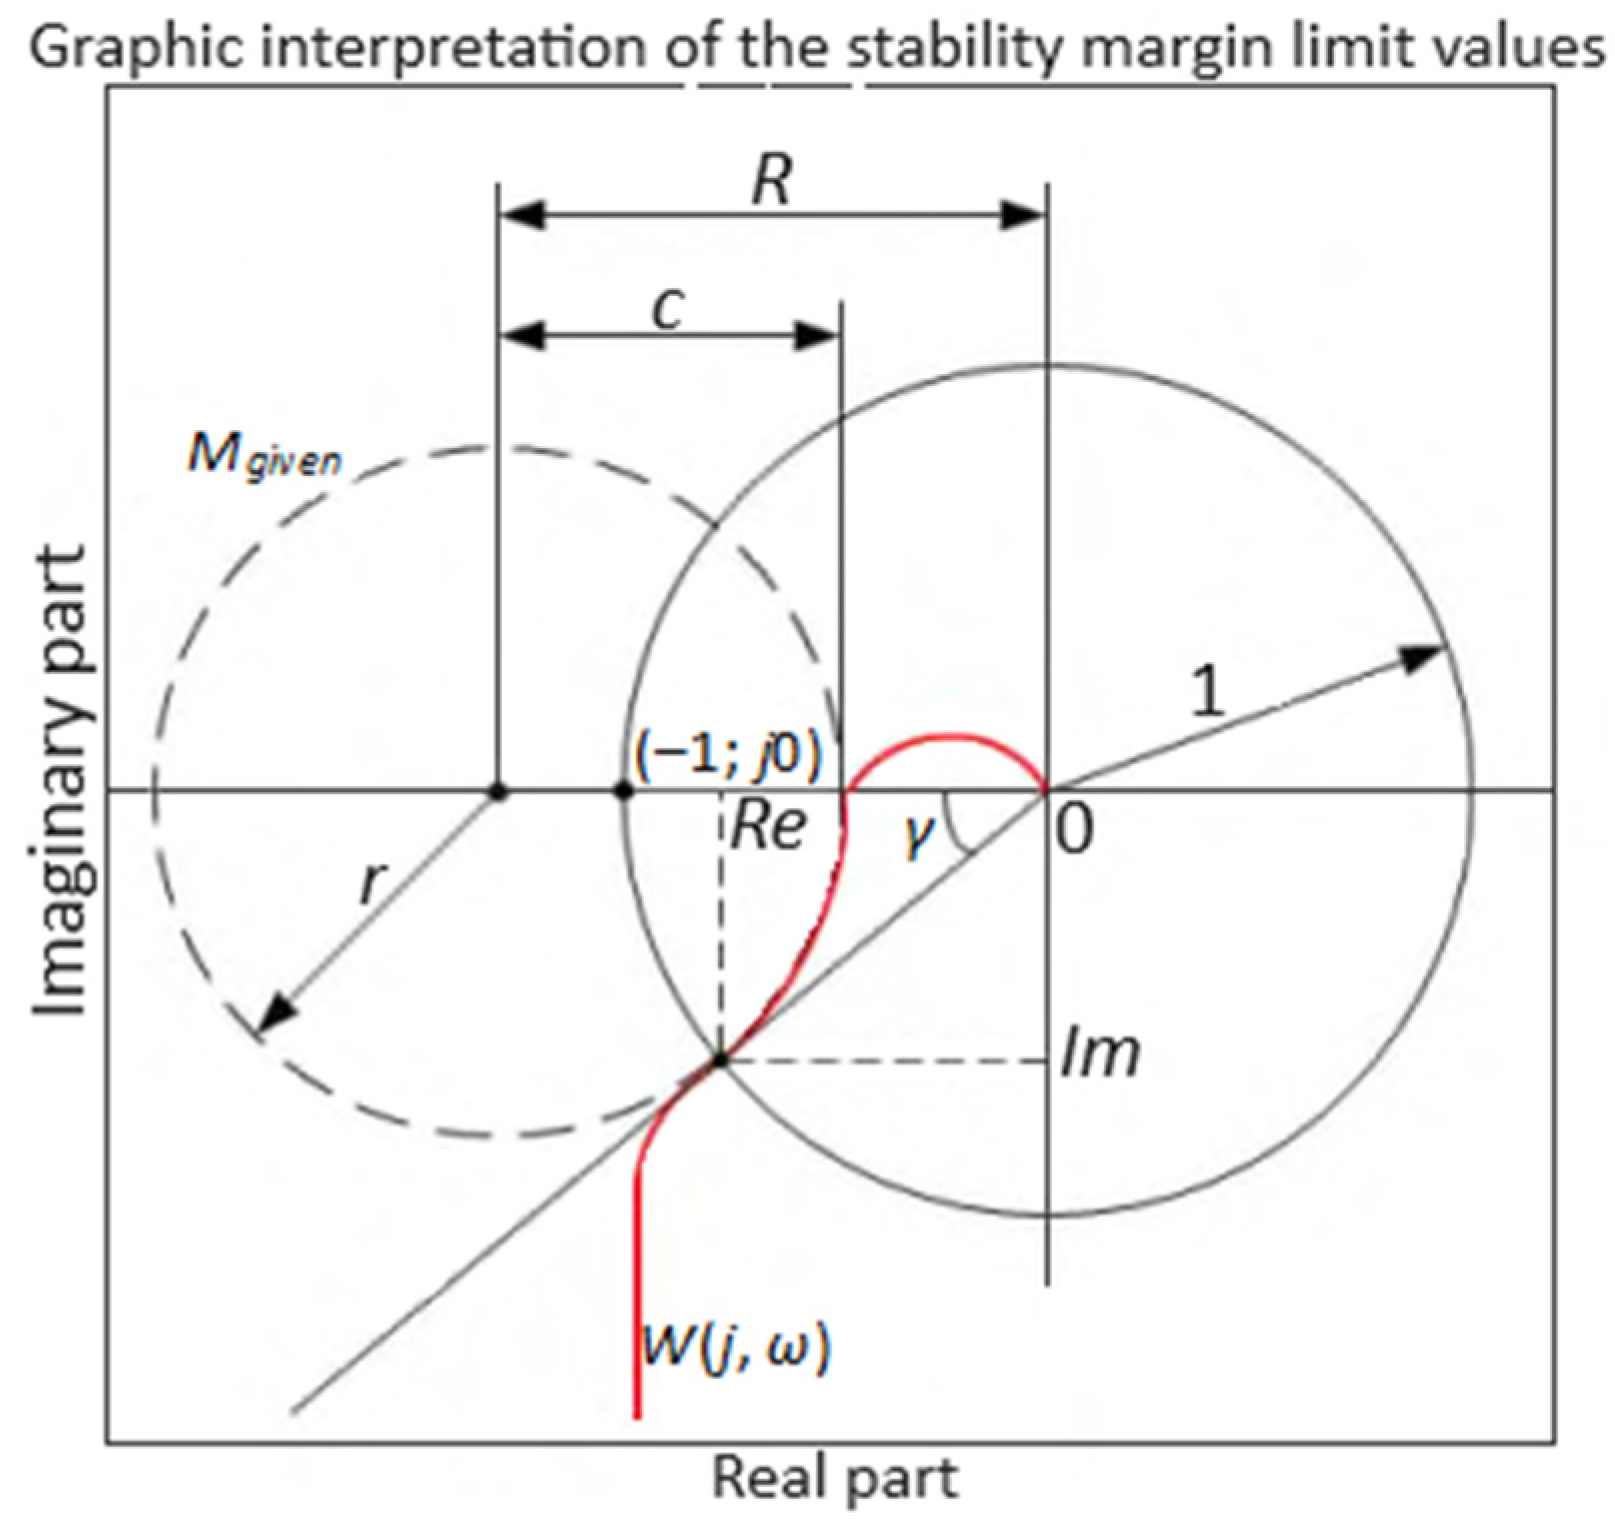
To determine the open-loop system hodograph points’ geometric locations on the complex plane (
Figure 7), under the condition
, according to [
44,
45], the segments 0A and BA are expressed through the coordinates of the complex plane.
Then, the following equation is used:
Guided by [
44,
45], according to (65), (66), a mathematical transformation number is made, according to which the following equations are obtained:
which can be easily reduced to form the following circle equation:
under the following restrictions:
where
is the circle center distance from the origin,
is the “dangerous” area circle radius.
At M = 1, U1 = 0.5, U2 = ∞ and the circle is transformed into a straight line. At M = ∞ r = 0, R = 1 and the circle is transformed into a point with coordinates (−1, j0).
The requirement that the maximum |
WACS(
j·
ω)| does not exceed a given value comes down to fulfilling the condition that the hodograph
WACS(
j·
ω) should not go inside the “dangerous” area limited by a circle with a given index, where
M = 1.1–1.6 [
47].
The maximum guaranteed stability margin modulo at
M = const is defined as follows:
where
C is the segment between the point with coordinates (−1,
j0) and the negative real axis intersection point with the hodograph
WACS(
j·
ω). The segment
C numerical value shows the change magnitude in the open-loop system frequency response |
WACS(
j·
ω)| at constant phase relations, necessary for the ACS to reach the stability limit shown in
Figure 8.
According to [
44,
45], the phase stability margin is the limiting angle
γ lying between the real negative axis and the ray drawn from the origin through the hodograph
WACS(
j·
ω) intersection point with the unit circle, with the center lying at the origin.
From the equations’ system solution, the following equations are derived:
defined as follows:
At the same time, according to
Figure 8 [
44,
45], the following equation is obtained:
The frequency indicator M numerical value shows how much phase lag is acceptable under the condition M = const so that the control system is on the stability boundary.

