Article

Identifying Weak Transmission Lines in Power Systems with Intermittent Energy Resources and DC Integration

1
College of Railway Locomotive and Rolling Stock, Wuhan Railway Vocational College of Technology, Wuhan 430205, China
2
Wuhan EMU Depot of China Railway Wuhan Group Co., Ltd., Wuhan 430061, China
3
State Grid Hubei Electric Power Co., Ltd., Wuhan Power Supply Company, Wuhan 430013, China
4
Central China Branch of State Grid Corporation of China, Wuhan 430072, China
*
Author to whom correspondence should be addressed.
Energies 2024, 17(16), 3918; https://doi.org/10.3390/en17163918
Submission received: 15 July 2024 / Revised: 2 August 2024 / Accepted: 6 August 2024 / Published: 8 August 2024
(This article belongs to the Topic Power System Dynamics and Stability)

Abstract

:
Nowadays, intermittent energy resources, such as wind turbines, and direct current (DC) transmission have been extensively integrated into power systems. This paper proposes an identifying method for weak lines of novel power systems with intermittent energy resources and DC lines integration, which aims to provide decision making for control strategies of novel power systems and prevent system blackouts. First, from the perspective of power system safety and stability, a series of risk indicators for the risk assessment of vulnerable lines is proposed. Then, lines in the system are tripped one by one. The calculation method for the proposed risk indicators is introduced. The impact of each line outage on system safety and stability can be fairly evaluated by these proposed risk indicators. On this basis, each risk assessment indicator is weighted to obtain a comprehensive risk assessment indicator, and then the risk caused by each line outage on the system can be quantified efficiently. Finally, the test system of a modified IEEE-39 bus system with wind farms and DC lines integration is used to verify the applicability of the proposed method, and the effectiveness of the proposed method is also demonstrated by comparing with existing methods.

1. Introduction

Recently, power system blackouts have occurred frequently around the world, causing huge economic losses and serious social impact [1,2,3]. Research shows that catastrophic blackouts are usually initiated by failure of one or several components [4,5,6]. These components can be called weak components or vulnerable components [7], including transmission lines, transformers, etc. Meanwhile, intermittent energy resources, such as wind turbines, and DC transmission have been extensively integrated into power systems, which makes the dynamic characteristics and operation mode of power systems more complex [8,9]. The safe and stable operation of novel power systems is facing severe challenges due to their own development [10]. In this case, once weak components of a novel power system fail, blackout accidents could be further exacerbated, and the system may face higher operation risk. To this end, identifying weak components of the novel power system with intermittent energy resources and DC integration is of great significance, which contributes to maintaining secure system operation and preventing system blackout.
Much research has been conducted on identifying the weak components of power systems. There are mainly two types of methods in the research field. The first type of research is based on complex network theory. This type of method uses the concept of degree and betweenness and combines with electrical characteristics to identify the weak components of power systems. The authors in [11] indicated that degree centrality methods inherently only take into account the local information of a power network, and the analysis results are not fully reliable. The concept of line electrical betweenness based on the physical characteristics of a power grid was proposed in [12] to identify weak components. The concept of extended betweenness based on the power transfer distribution factors was proposed in [13], which can consider the contribution of each transmission line. A maximum flow-based complex network approach was proposed in [14] to identify weak lines in power systems. The network is modeled as a graph. Then, an improved maximum flow-based complex network approach was used for topology analysis. The complex network theory for modern smart grid applications was investigated in [15], including structural vulnerability assessment, cascading blackouts, etc. A weak transmission lines identification method based on the depth of the K-shell decomposition was proposed in [16], which fully considers the dynamic characteristics of the power transfer and transmission capability after the power grid fault. The hybrid flow betweenness is defined in [17] to identify weak lines, which covers the direction of power flow and the maximum transmission capacity of lines with a more comprehensible physical background. An electrical betweenness method that can better balance the accuracy and efficiency of identifying vulnerable lines was proposed in [18]. The power percentage of the generator load is used as an indicator to evaluate the stability of a power grid, and the dynamic influence of generator and load node removal on a power grid is considered in the literature. A holomorphic embedding method was proposed in [19] to assess the vulnerable bus of power systems. The concept of an interaction graph was applied to model cascading outages in [20,21,22], and then vulnerable lines of power systems can be efficiently determined.
The second type of research method is based on power system operation condition, which aims to define several indexes reflecting system operation state. In [23], a reactive power loss index (RPLI) is proposed to identify the weak components of power systems. Then, this index is further used for determining the optimal locations for placement of reactive compensation devices. In [24,25], several security indexes, such as generator output capacity, line reactance, maximum line transfer capacity value, and power transfer characteristics of the power system were defined to identify the weak components of the system. Then, these indexes were weighted to form a comprehensive index. In [26], several indexes were proposed by jointly considering the topology structural vulnerability and the power flow transmission vulnerability, and then a clustering algorithm was proposed and employed to divide the lines to identify the vulnerable lines in the systems. A vulnerable lines identification method based on a weighted H-index was proposed in [27], which mainly reflected the correlation of the transmission branches on the active power transmission and constructed the correlation network. The authors in [28,29] used the concept of entropy to identify vulnerable components. Specifically, power flow entropy and improved power flow entropy were defined to discriminate line vulnerability in terms of system power flow calculation. In [30], several indexes concerning complex network and electrical characteristics of a power system were defined to identify the weak components of power systems, where the electrical characteristics are mainly based on the power transfer distribution factor. Then, an intercriteria correlation-based multi-index decision-making method was proposed to comprehensively identify the importance of components. The authors in [31] converted the power flow computation challenge into an optimization problem with constraints, wherein crucial components were discerned through a dynamic interplay between attackers and defenders. The authors in [32] introduced a vulnerability assessment method for transmission lines in power system incorporating network topology and system operational states, where the improved power transfer distribution factor and line outage distribution factor are used to build the line operational state vulnerability indices. In [33], a series of line vulnerability indexes were defined for vulnerable line identification, where these indexes incorporate line load rate, power flow fluctuation index, line failure probability, etc. Then, the combination weighting method was used to obtain a comprehensive vulnerability index.
The above research can fairly identify the vulnerable components of power systems but mainly focuses on traditional power systems. Nowadays, intermittent energy resources and DC transmission have been extensively integrated into novel power systems. The stochastic characteristic induced by intermittent energy output and the operational characteristic of DC transmission change the system operation mode overwhelmingly. The above vulnerable component identification method is not well applicable to novel power systems. Therefore, the integration of intermittent energy resources and their impact on vulnerable component identification has gradually become a hot topic. In [34], an electrical LeaderRank method is proposed to identify the important nodes in power grids, considering the renewable energy uncertainties and transmission power flow. In [35], a method for identifying vulnerable lines based on the theory of topological potential is proposed, which can consider wind power uncertainty. The proposed index comprehensively considers the in-degree and out-degree topological potentials of nodes and uses the entropy weight method for weight allocation.
In summary, the current weak component identification research of novel power systems with renewable energy and DC integration is relatively lacking. Moreover, rarely has the literature considered the impacts of renewable energy and DC on power system vulnerable component identification simultaneously. The stochastic characteristic of renewable energy output and the operational characteristic of DC transmission need to be considered synchronously. Furthermore, the current research method based on power system operation condition mainly uses the tool of power flow calculation to identify vulnerable components, which focuses on the steady state of the system. The dynamic characteristic of the system is less considered, which makes it hard to reflect the impacts of vulnerable components on power systems comprehensively.
Therefore, a novel identifying method for weak components of novel power systems with intermittent energy sources and DC integration is proposed in this paper, which aims to prevent novel power system blackouts. It is worth mentioning that references to vulnerable components in this paper mainly refer to vulnerable lines. Firstly, a series of risk assessment indexes consisting of power system security and stability is proposed, which can quantify the system risk due to vulnerable line outage in a comprehensive fashion. Then, a comprehensive weight method based on game theory is adopted. A comprehensive risk assessment indicator can be obtained by weighting each risk assessment indicator, which can determine the vulnerability of each line in power systems. Finally, the proposed method is tested in an improved IEEE 39 bus system with wind farms and AC/DC interconnection.
The rest of this paper is organized in the following manner. Section 2 proposes an overall risk assessment index system for the vulnerable lines. Section 3 details the calculation process of the proposed risk assessment index system. In Section 4, a comprehensive risk assessment index of vulnerable lines is proposed based on game theory. In Section 5, a modified IEEE 39 bus system which is integrated into wind farms and DC is used to test the proposed method. The software Matlab 2020b is used to test the proposed method. Section 6 concludes the whole paper.

2. Risk Assessment Index System of Vulnerable Lines

The security and stability of power systems are always the important indexes to evaluate the operation state of the system. Therefore, this paper proposes six risk indicators to evaluate the vulnerability of each line from the perspective of safety and stability of system operation for a novel power system. Among them, the safety indicators include the bus voltage violation index (VVI), line overload index (LOI), and static security index (SSI). The stability indexes consist of static frequency stability (SFS), static rotor angle stability (SRAS), and static voltage stability (SVS). These risk indexes are shown in Figure 1.
The security indicators defined in this paper are mainly used to evaluate whether the bus voltage and line transmission power of the system are within the security constraints after each line outage. If these security indicators exceed their security constraints, the system will be at high risk. Therefore, it is necessary to define such indicators to evaluate the impact of each line outage on system security. The stability indexes defined in this paper mainly focus on the static stability of the system, that is, the stable operation ability of the system under small disturbance after each line outage. The power system is constantly suffering from small disturbances. Therefore, ensuring the stable operation of the system under small disturbances is the most basic operating premise that the system should meet at all times. Once the system cannot achieve stable operation under small disturbances, the system will collapse and be difficult to recover. As for the stable operation ability under a large disturbance, it is not considered in this paper. The reason is that the system has basic stable operation ability when it meets stable operation under a small disturbance. If a large disturbance occurs, it can also be dealt with in time by stability control measures, such as generator/load shedding control [36] and DC modulation [37]. Therefore, although it is very meaningful to check the stable operation ability under a large disturbance, it is not an index that must be checked compared with the stability under a small disturbance. In order to comprehensively evaluate the influence of each line outage on the system stability, this paper establishes three small disturbance stability indexes, i.e., frequency stability, rotor angle stability, and voltage stability. With the access to a high proportion of renewable energy and DC, these three stability problems are more prominent. If any stability index does not meet stability constraints, the system will have a high risk of losing stability. Therefore, it is necessary to verify these three stability indexes at the same time to better apply them to the risk assessment of vulnerable lines for the novel power system.

3. Calculation Method for Risk Assessment Index

3.1. Bus Voltage Violation and Line Overload Index

The bus voltage violation and line overload risk of the novel power system with renewable energy and DC injection after a line outage can be obtained by power flow calculation. Therefore, it is necessary to study the power flow calculation method for the novel power system with renewable energy and DC access. The power flow equation of the AC/DC interconnected system needs to be augmented on the basis of the traditional power flow equation of the AC system [38]:
Δ S Δ d = J D Δ X Δ D = J A C F Δ X Δ D
where S is the power injection vector of each bus including the active and reactive power injection of each bus; X is the bus state vector, including the phase angle and voltage amplitude of each bus; d is the DC converter equation, DC network equation, and DC control equation; D = [Vd, Id, KT, cosθd, φd]T is the relevant parameters of the DC side, including DC voltage, DC current, control angle, converter transformer ratio, and converter power factor angle; JD is the Jacobian matrix of the AC/DC interconnected system; J is the Jacobian matrix of the traditional AC system; A, C, and F are the corresponding augmented Jacobian matrix elements after increasing the DC related variables. The calculation process of specific parameters in (1) is detailed in [38].
Then, the probabilistic AC/DC power flow calculation with renewable energy is studied. The most direct probabilistic power flow calculation method is the Monte Carlo method (MCS). This method has high accuracy, but the calculation is time-consuming [39]. The risk assessment method of vulnerable lines proposed in this paper aims to provide decision making for preventive control. The vulnerability of all lines in the system needs to be evaluated before the risk really occurs. Although the time required is relatively abundant, it still needs to ensure a certain rapidity in calculation efficiency. Therefore, this paper proposes an analytical-method-based probabilistic AC/DC power flow calculation method, which can greatly improve the computational efficiency of risk assessment while satisfying the calculation accuracy. One of the difficulties in probabilistic power flow calculation based on an analytical method is how to establish a probabilistic model that can accurately describe the randomness of renewable energy. In this paper, the Gaussian mixture model (GMM) is used to establish the probability model of renewable energy injection. GMM can accurately model the probability distribution of random variables through the convex combination of multiple Gaussian distributions:
f W = m = 1 M ω m N m W ,       m = 1 M ω m = 1
N m W = 1 2 π w / 2 det m 1 / 2 e 1 2 W μ m T m 1 W μ m
where W is the vector composed of the output power of w wind farms; f (W) is the probability density function of W; Nm (W) is the probability density function of the mth Gaussian component; M is the number of Gaussian components; ωm, μm, and Σm are the weight coefficient, mean vector, and covariance matrix of each Gaussian component, respectively, which are usually solved by the maximum expectation algorithm [40].
By linearizing the line power flow equation at the reference operating point, the linear expression between the line transmission power and the injected power of each bus can be obtained:
Z = Z 0 + Δ Z = Z 0 + Z / X X = X 0       J D 1 Δ S
where Z is the line power flow column vector, including the active and reactive power of a transmission line; the subscript 0 represents the base operating point. Equations (1) and (4) are linear expressions between bus state variables, line transmission power variables, and bus injection power, respectively. For ease of the following description, the two equations are simplified to a general linear expression:
Y = K 1 S + B 1
where the element in Y represents the bus state variable and branch power flow variable, which contains y variables; K1 and B1 represent the corresponding coefficient matrices. The output of wind farms in S has been modeled by GMM, which is weighted by multiple Gaussian distributions with a mean of μm and a variance of Σm. The random variables that obey the Gaussian distribution still obey the Gaussian distribution after linear transformation [40]. Thus, it can be obtained from linear Equation (5) that each Gaussian component of the variable Y obeys the Gaussian distribution with a mean of K1μm+ B1 and a variance of K1ΣmK1T. The cumulative distribution function of each Gaussian component of Y is expressed as follows:
F m Y = Y e 1 2 Y K 1 μ m B 1 T K 1 m K 1 1 Y K 1 μ m B 1 2 π y / 2 det K 1 m K 1 1 / 2   d Y
From the total probability in Equation (7), the cumulative probability distribution function of multiple subcomponents is weighted according to the weight calculated by (3). Finally, the probability distribution function of random variables in Y is obtained as follows:
P Y = m = 1 M P Y × ω m
F Y = m = 1 M ω m F m Y
where P(Y) is the probability of occurrence of the state variable corresponding to the mth subcomponent. For the novel power system with renewable energy and DC access, when there is a line outage, it may cause the bus voltage or line power to exceed their limits. In order to quantify these risks, the probability distribution of wind farm output can be obtained by GMM. Then, through the above process, the probability distribution function of each bus state variable and line power variable of the system after the line outage can be quickly solved. By setting the critical values of voltage violation and line overload, the probability of voltage violation of each bus and overload of each line after there is a line outage can be obtained by (8). Then, the severity of voltage violation and the severity of line overload are defined as follows:
S e v U i = U i min U i / U i min       U i > U i max 0       U i min U i U i max U i U i max / U i max       U i > U i max
S e v L i = P i j P i j , max / P i j , max
where U i max and U i min are the upper and lower limits of the voltage amplitude of bus i; Ui is the most serious value of bus i voltage amplitude during the fluctuation of renewable energy which can be calculated by probabilistic AC/DC power flow. Pij,max is the transmission power limit of line ij. Pij is the maximum value of the transmission power of the line ij with the fluctuation of the renewable energy output, which can also be calculated by the probabilistic AC/DC power flow. Both indicators take the most serious situation when defining the severity. Therefore, the risk of bus voltage violation and line overload caused by a line outage can be obtained as follows:
R V V = i = 1 n 1 P U i × S e v U i
R L O = i = 1 n 2 P L i × S e v L i
where n1 is the number of system buses; n2 is the number of rest lines after a line outage; P(Ui) is the probability of voltage exceeding limits; P(Li) is the probability of line overload.

3.2. Static Security Index

The static security analysis of power systems refers to the application of the N − 1 principle. Each line needs to be tripped one by one without fault to check whether line overload and voltage violation occur. Then, the structural strength and operation mode of power systems can be checked. In the risk assessment of vulnerable lines in this paper, when there is a line outage, the N − 1 principle is used to trip remaining lines one by one without fault. Equations (11) and (12) are used to solve the bus voltage violation risk and line overload risk, respectively. Finally, the two risk results are added, as there is a risk of losing the static security of the system after a line outage, shown as follows:
R S S A = R V V + R L O

3.3. Static Frequency Stability Index

The eigenvalue analysis method based on the power system linearization model and electromechanical transient simulation are two common tools for small signal frequency stability calculation [41]. In order to improve computational efficiency, this paper will use the eigenvalue analysis method and propose a calculation method of static frequency stability eigenvalues based on an analytical method.
There is a certain function between the eigenvalues of the power system and the output of renewable energy. However, the function is generally nonlinear and difficult to clarify. Because it is a small disturbance analysis, a linear expression can be used to approximately characterize the function [42]. It is assumed that there are K eigenvalues in the novel power system, and the kth eigenvalue is λk = ξk + k. The function between the system eigenvalue and the output power of the wind farm can be linearized at the reference operating point, and then the linear relationship is shown as follows:
Δ λ k = Δ ξ k + j Δ ω k = i = 1 w λ k / W i Δ W i = i = 1 w Re λ k / W i Δ W i + j i = 1 w Im λ k / W i Δ W i
where Wi denotes the output power of the ith wind farm; λ k / W i is the sensitivity of the kth eigenvalue of the system to the output power of the ith wind farm, which can be solved by numerical method:
λ k W i = λ k W i + Δ W i λ k W i Δ W i , i = 1 , 2 , w
The linear relationship between the eigenvalue of the system and the output power of the wind farms is established by (14) and (15). The probability distribution of the output power of wind farms has been modeled by GMM, which is weighted by multiple Gaussian distributions with a mean value of μm and a variance of Σm. Similar to the derivation in Section 3.1, since the Gaussian distribution still obeys the Gaussian distribution after linear transformation, each Gaussian subcomponent of the eigenvalue probability distribution should obey the Gaussian distribution with a mean value of K2μm+ B2 and a variance of K2ΣmK2T, where K2 and B2 are the coefficient matrices of the linear expression obtained by (15), respectively. Thus, the cumulative distribution function of the Gaussian subcomponent is shown in (16). Then, through the total probability in Equation (7), the probability distribution function expression of the novel power system eigenvalue can be obtained as follows:
F m λ = λ e 1 2 λ K 2 μ m B 2 T K 2 m K 2 1 λ K 2 μ m B 2 2 π K / 2 det K 2 m K 2 1 / 2   d λ
F λ = m = 1 M ω m F m λ
When the real part of the eigenvalue is greater than 0, the system’s static frequency will lose stability. Therefore, the probability P(SFS) of the static frequency instability can be obtained by (17). When static frequency instability occurs, the severity Sev(SFS) is defined as 1, and then the risk of static frequency instability of the system after a line outage can be defined as follows:
R S F S = P SFS × S e v SFS

3.4. Static Rotor Angle Stability Index

Similar to the analysis in Section 3.3, there is also a non-explicit function between the static stability power limit of any generator and the output power of wind farms. Because it is a small disturbance analysis, the function relationship can be linearized at the reference operating point, and the linear expression of the static stability power limit of any generator and the output power of a wind farm can be obtained:
Δ P max , i = k = 1 w P max , i / W k Δ W k
where Pmax,i is the static power limit of the ith generator; Wk represents the output power of the kth wind farm; P max , i / W k is the sensitivity of the static stability power limit of the ith generator to the output power of the kth wind farm. Similarly, the sensitivity can be calculated by numerical method:
P max , i W k = P max , i W k + Δ W k P max , i W k Δ W k
The linear relationship between the static stability power limit of generators and the output power of wind farms is established by (19) and (20). Similar to the derivation in Section 3.3, the probability distribution of the output power of wind farms has been modeled by GMM. After the linear transformation of (19), each Gaussian subcomponent of the probability distribution of the static stability power limit of the generator should obey the Gaussian distribution with a mean of K3μm+ B3 and a variance of K3ΣmK3T, where K3 and B3 are the coefficient matrices of the linear expression obtained by (20). Then, using the total probability in Equation (7), the final probability distribution of the static stability power limit of each generator can be obtained as follows:
F P max = m = 1 M ω m F m P max F m P max = P max e 1 2 P max K 3 μ m B 3 T K 3 m K 3 1 P max K 3 μ m B 3 2 π p / 2 det K 3 m K 3 1 / 2   d P max
The Chinese standard [41] stipulates that the static power angle stability reserve coefficient should not be less than 10% after fault. The equation is as follows:
K P , i = P max , i P 0 , i / P 0 , i
where P0,i is the output power of the ith generator under normal operation; KP,i is the static rotor angle stability reserve coefficient of the ith generator. Through Equation (22), the minimum value of the static stability power limit satisfying the standard can be obtained. Then, through the probability distribution function (21) of the static stability limit power, the probability P(KP,i) of the static rotor angle stability reserve coefficient of less than 10% can be obtained. The severity of static rotor angle instability is defined as follows:
S e v K P , i = 0.1 K P , i , min / 0.1
where KP,i,min is the minimum value that the static stability limit power of ith generator may reach during the power fluctuation of wind farms, i.e., the most serious situation is considered as the severity of static rotor angle instability. Therefore, when there is a line outage, the static rotor angle instability risk of the system is defined as follows:
R S R A S = i = 1 n 3 P K P , i × S e v K P , i
where n3 is the number of generators.

3.5. Static Voltage Stability Index

The static voltage stability calculation can be solved by gradually increasing loads to estimate the critical point of voltage instability of the current operating point. The static voltage stability reserve coefficient is shown as follows:
K U , i = U 0 , i U c r , i / U c r , i
where KU,i is the static voltage stability reserve coefficient of the ith bus; U0,i is the voltage amplitude of the ith bus under normal operation; Ucr,i is the critical point of voltage instability at the ith bus.
For the novel power system with renewable energy and DC access, when there is a line outage, this paper will gradually increase the load of each bus and calculate the probability distribution of the critical point of voltage instability of each bus through the probabilistic AC/DC power flow of (6)–(8). The Chinese standard stipulates that the static voltage stability reserve should not be less than 8% at the post-fault operation mode [41]. Through the probability distribution of the critical voltage of each bus and (25), the probability P(KU,i) that the static voltage stability reserve coefficient of the system does not meet the operation requirements can be solved. Then, the severity function of static voltage instability is defined as follows:
S e v K U , i = 0.08 K U , i , min / 0.08
where KU,i,min is the minimum value that the static voltage stability reserve coefficient may reach during the fluctuation of renewable energy output, i.e., the most serious situation deviating from the security constraint is used as the severity of the index. Therefore, the risk of static voltage instability caused by a line outage can be defined as follows:
R S V S = i = 1 n 1 P K U , i × S e v K U , i

4. Comprehensive Risk Assessment Index of Vulnerable Lines

In this paper, six risk assessment indexes are defined to identify vulnerable lines from the perspective of system security and stability for the novel power system. When there is a line outage, the vulnerability of the line is evaluated by calculating the six indicators, respectively. On this basis, in order to comprehensively evaluate the vulnerability of each line, it is necessary to integrate these assessment indicators. In this paper, the comprehensive weight method based on game theory is used to weight these risk indicators.
Firstly, the magnitude and dimension of the six indicators need to be unified, and then they need to be weighted. The comprehensive risk evaluation index Rc of vulnerable lines is obtained by weighting each index.
R c = α 1 R ¯ V V + α 2 R ¯ L O + α 3 R ¯ S S A + α 4 R ¯ S F S + α 5 R ¯ S R A S + α 6 R ¯ S V S
Here, α1 to α6 are the weights of each risk index; the upper line represents the normalized risk index. The weight calculation process using the comprehensive weighting method based on game theory is as follows [43]:
(1) The subjective weight B1 of each risk index is obtained based on the analytic hierarchy process, and the objective weight B2 of each risk index is obtained based on the entropy weight method. The weights of the two methods are linearly combined to obtain the weight B = β1B1 + β2B2 of the comprehensive weighting method, where β1 and β2 are the comprehensive weight combination coefficients.
(2) In order to minimize the deviation between the comprehensive weight and each basic weight, it is necessary to establish the corresponding optimization objective to optimize the coefficient β1 and β2.
min i = 1 2 β i B i T B j T 2
(3) According to the differential properties of matrices, Equation (29) can be transformed into:
B 1 T B 1 B 1 T B 2 B 2 T B 1 B 2 T B 2 β 1 β 2 = B 1 T B 1 B 2 T B 2
The comprehensive weights β1 and β2 can be obtained by substituting the solved weights B1 and B2 into (30), and then the comprehensive weight B obtained by the comprehensive weighting method based on game theory can be solved by the linear combination in step (1).
Based on the above analysis, for the novel power system, each line in the system is tripped one by one, and each risk assessment index defined is calculated separately. All risk indicators are weighted by the comprehensive weighting method to obtain a comprehensive risk assessment index. The vulnerability of each line is assessed according to the level of the comprehensive risk assessment index. When there is a line outage, the higher the comprehensive risk assessment index, the greater the system risk caused by the line outage, the more important the line in the system, and the more vulnerable the line.

5. Simulation Tests

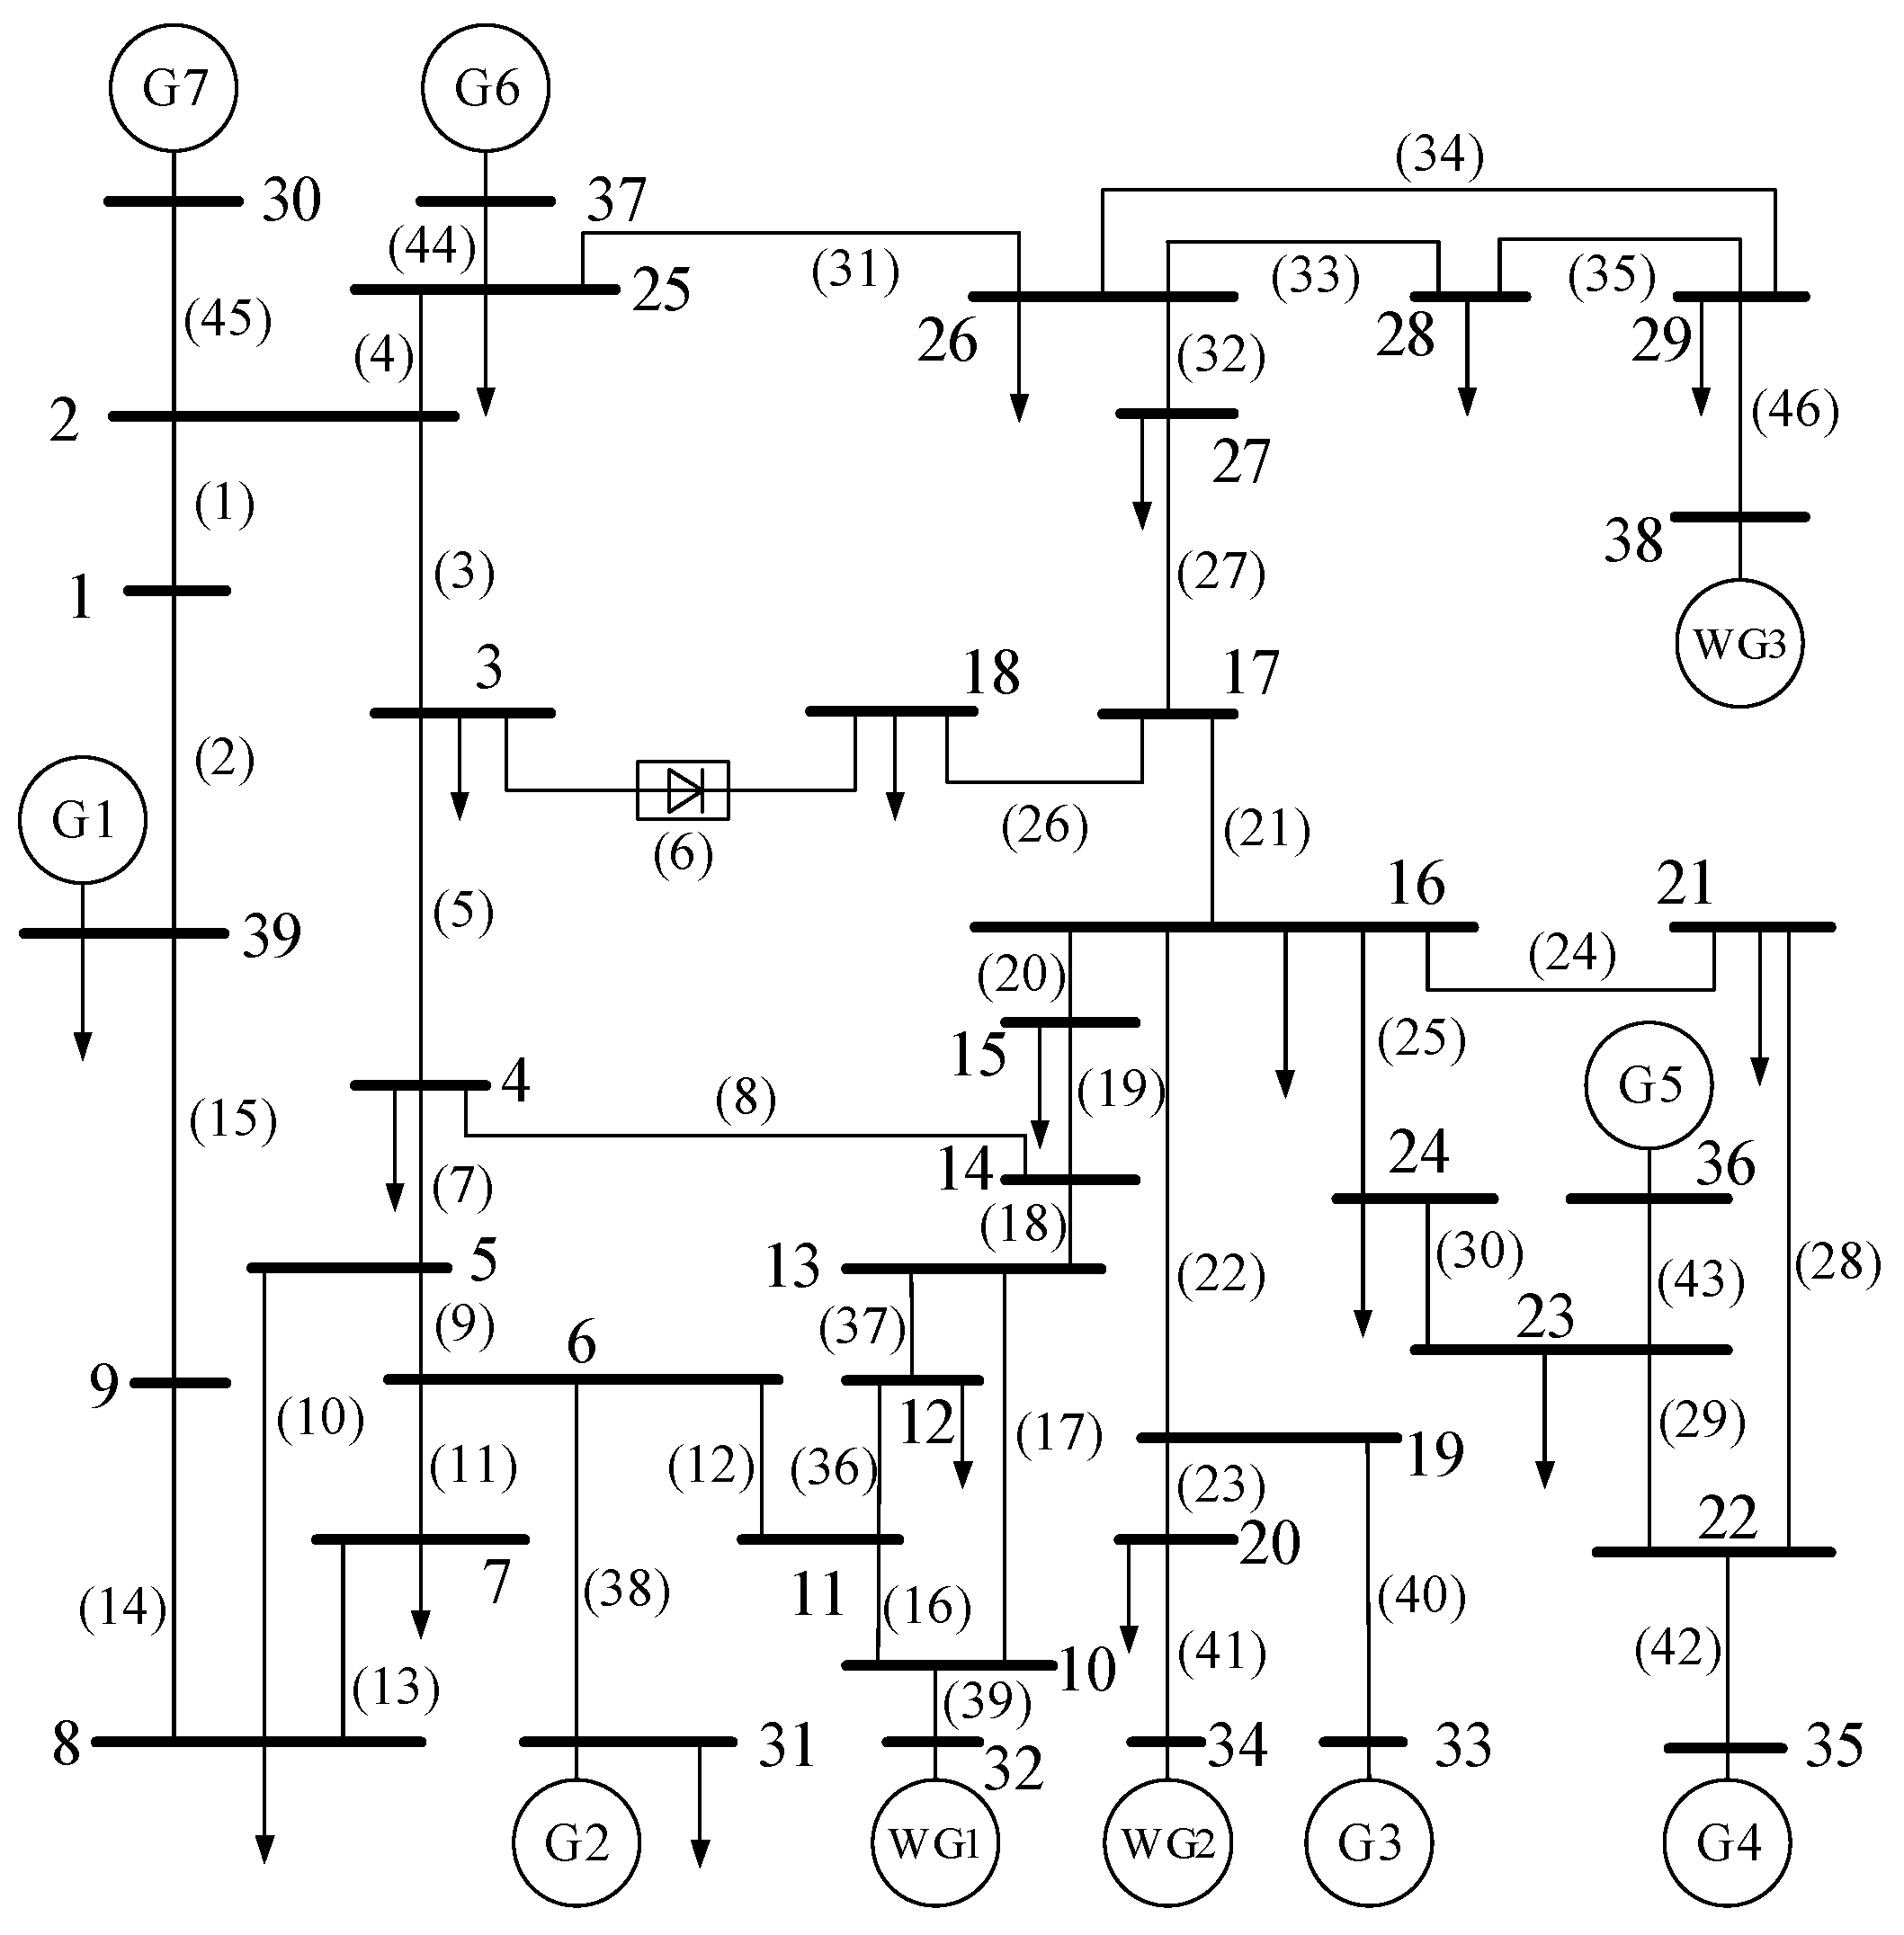
An improved IEEE 39 bus system with wind farms and DC access was used as a test system to verify the applicability of the method proposed in this paper. The system structure is shown in Figure 2. The original synchronous generators of busses 32, 34, and 38 are replaced by wind farms. It is assumed that the installed capacity of each wind farm is 650 MW, 500 MW, and 450 MW, respectively, and the total permeability of renewable energy is about 33%. The original AC line L3–18 is replaced by the LCC-HVDC line, in which bus 3 is the rectifier station and bus 18 is the inverter station. The constant ratio and constant current control are used for rectifiers, and the constant ratio and constant control angle are used as inverters. The constant power model is used in the simulation test, and the total load power of the system is 6150 MW. The wind turbine is regarded as a power source. All synchronous generators apply the classical model with a first-order governor model.
Firstly, the probabilistic AC/DC power flow calculation method based on the analytical method proposed in this paper is used to calculate the bus voltage violation and line overload risk after each line outage. Taking line L1–2 as an example, when it is tripped, the probability distribution of each bus voltage and each line power can be determined by using the probabilistic AC/DC power flow calculation method proposed in this paper. The probability distribution of the bus voltage amplitude of bus 22 and the probability distribution of the active power on line L16–19 are shown in Figure 3. At the same time, the probabilistic AC/DC power flow is also calculated by MCS to verify the accuracy of the proposed probabilistic power flow method.
In Figure 3, the red curve is the result obtained by MCS, and the blue curve is the result obtained by the analytical method proposed in this paper. It can be seen that the results obtained by the two methods are very close. In terms of calculation time, the proposed method takes 0.43 s and MCS takes 97 s, indicating that the proposed method greatly improves the calculation efficiency while satisfying the calculation accuracy.
Based on the probability distribution of the bus voltage and line power, the risk of system voltage violation and line overload after each line outage can be obtained by (9) to (12), as shown in Figure 4 and Figure 5.
In Figure 4, the risk of bus voltage violation and line overload occur after some lines are tripped. According to the risk level, the top 10 lines that cause voltage violation risk and line overload risk are selected, respectively, as shown in Table 1.
In Table 1, the risk of voltage violation caused by the outage of L15–16, L25–26, and L9–39 is 0.1556, 0.1371, and 0.1046, respectively, ranking the top three in all lines. If these lines are attacked and tripped, the system will have a high risk of voltage violation. In the line overload risk index, the outage of L25–26 and L20–34 is more likely to cause an overload of other lines in the system, indicating that these lines are more important and vulnerable in the line overload risk index. After there is an outage in some lines, such as L1–2 and L16–24, the risk of bus voltage violation and line overload is zero, indicating that these lines are not important lines in the system under these two indicators. Even if they are attacked, they will not cause the risk of voltage violation and line overload.
The static security of the system after each line outage is assessed. When there is an outage in each line, the remaining lines are tripped one by one by using the N − 1 principle. The static security risk of the system after each line outage is solved by (13), as shown in Figure 5.
In Figure 5, the outage of each line has impacts on the static security of the system. According to the risk level, the top 10 lines are ranked as shown in Table 2. Among them, L25–26, L9–39, and L8–9 are the top three lines, indicating that these lines have the greatest impact on the static security of the power system once there is an outage. They are the most vulnerable lines in the static security index.
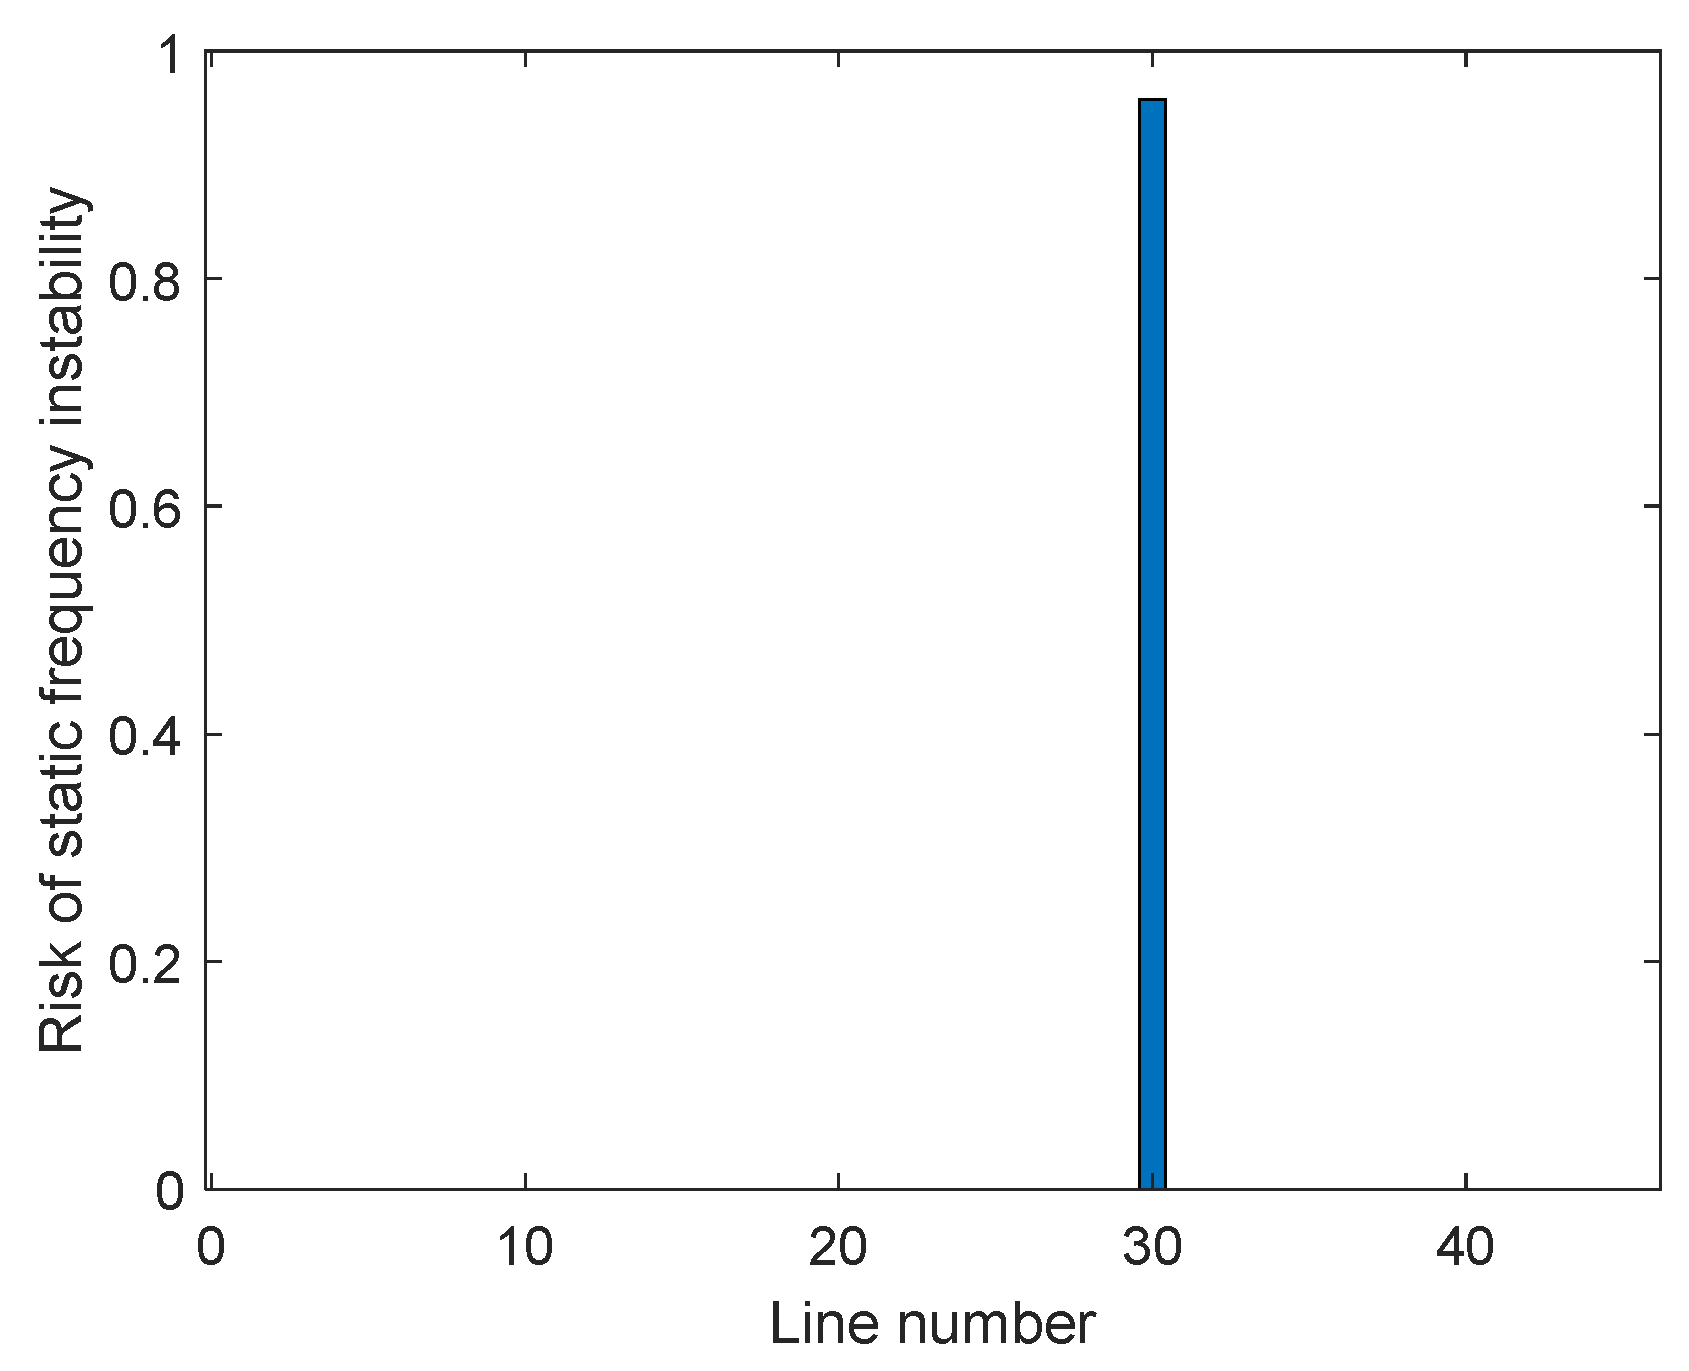
The risk of static frequency instability of the system after each line outage is assessed. Through (14)–(17), the probability distribution of system eigenvalues during the fluctuation of wind farm outputs can be obtained, respectively. Then, the static frequency instability risk of the system after each line outage can be obtained by (18), as shown in Figure 6.
From Figure 6, only when there is an outage in L25–26, the system will have the risk of static frequency instability, indicating that L25–26 is the most vulnerable line in the static frequency stability risk index. When the line is attacked, it is prone to causing static frequency instability of the system.
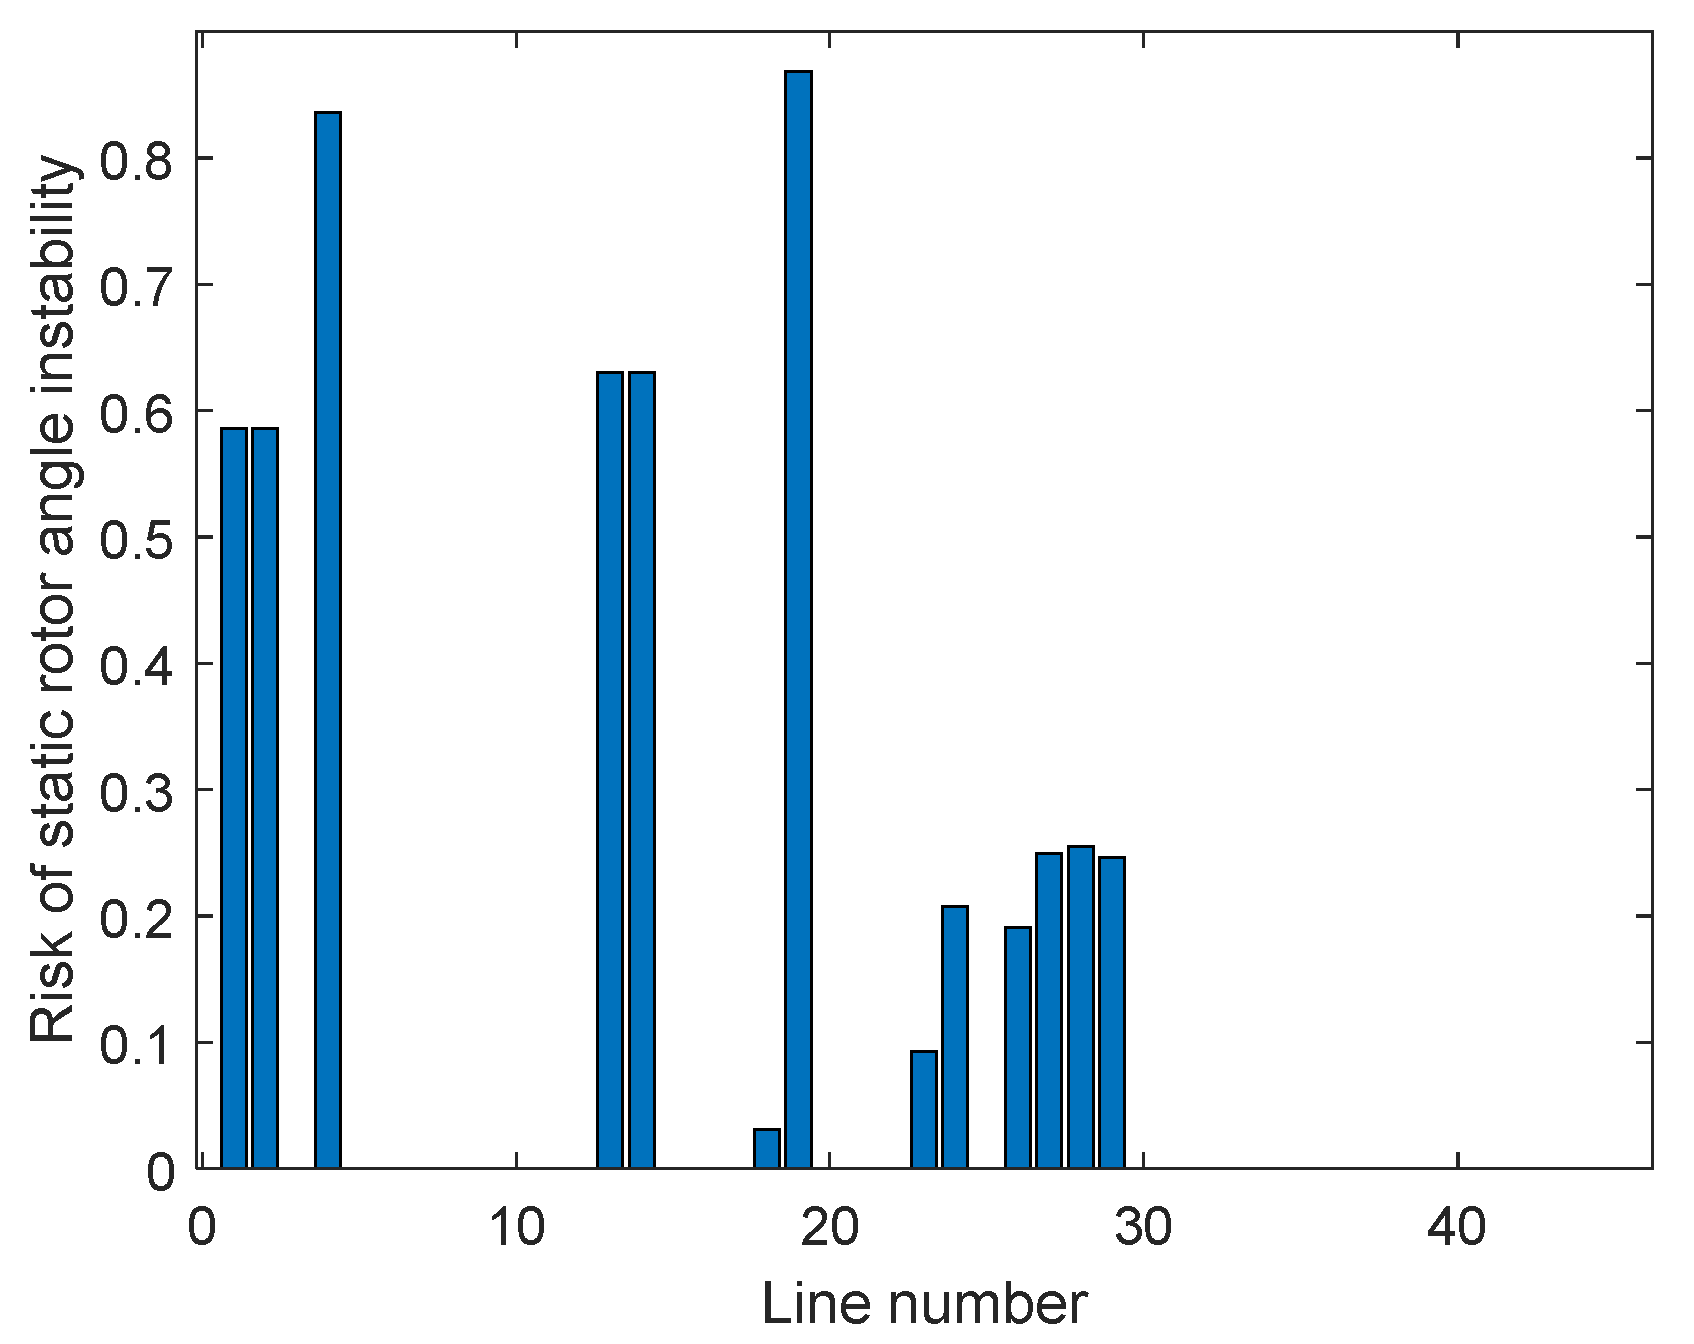
The risk of static rotor angle instability of the system after each line outage is evaluated. Through (19)–(21), the probability distribution of the static stability limit of each generator after each line outage can be obtained, and then through (22)–(24), the risk that the static rotor angle stability reserve coefficient of the system does not meet the operation requirements is determined, as shown in Figure 7.
In Figure 7, the outage of some lines leads to insufficient static rotor angle stability reserve in the system. The top 10 lines are shown in Table 3. Among them, lines such as L15–16, L2–25, and L9–39 are the most vulnerable lines in the static rotor angle stability index. When they are attacked, the system is prone to static rotor angle instability.
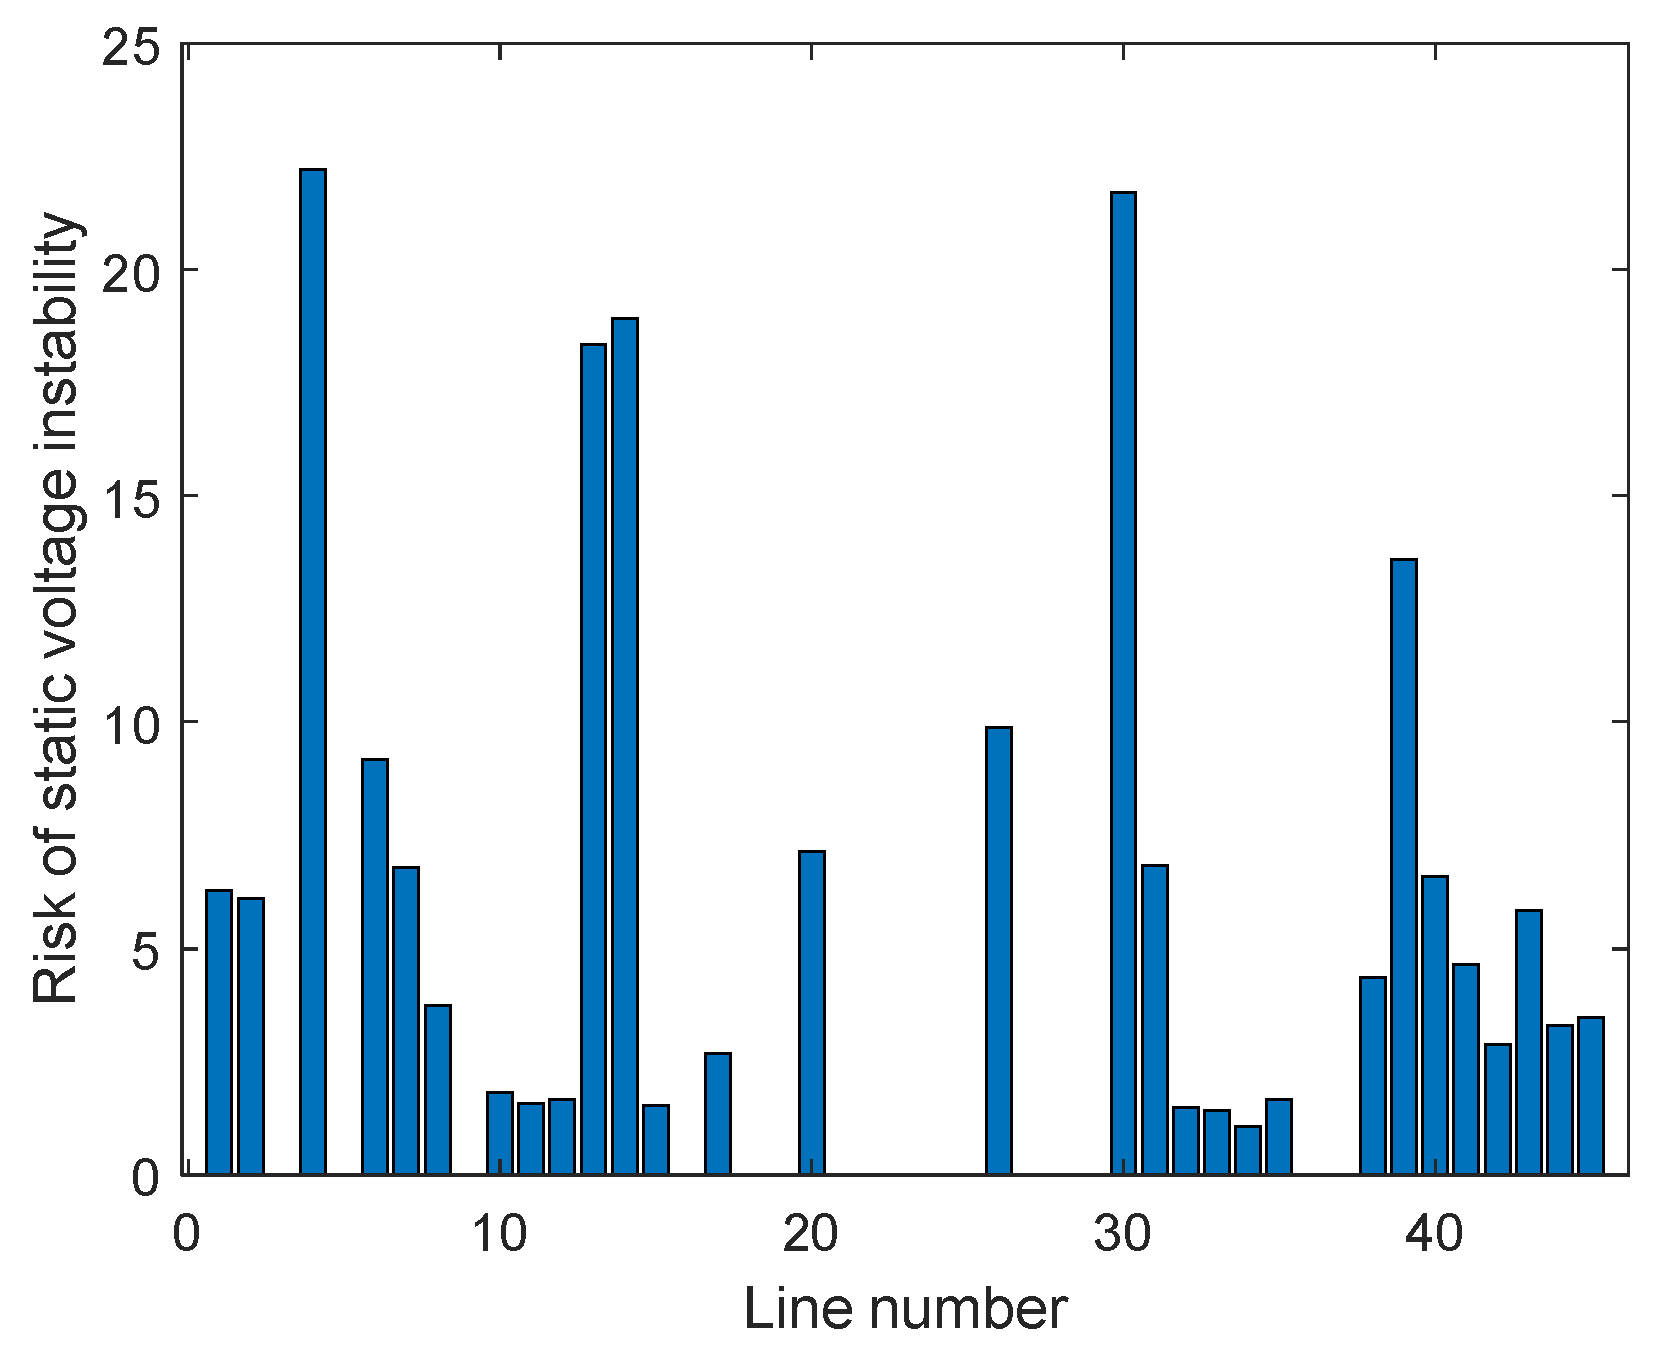
The risk of static voltage instability in the system after each line outage is evaluated. By tripping each line of the system one by one, the probability distribution of the critical value of voltage instability for each bus is assessed by probabilistic power flow. Then, the risk of static voltage instability is calculated by (25)–(27), as shown in Figure 8.
From Figure 8, the static voltage stability reserve of the system does not meet the operation requirements due to the outage of some lines, and there is a certain risk of static voltage instability. Taking the top 10 risk lines as shown in Table 4, the outages of L2–25, L25–26, and other lines have the greatest impact on static voltage stability. When they are attacked, they are very likely to cause static voltage instability in the system.
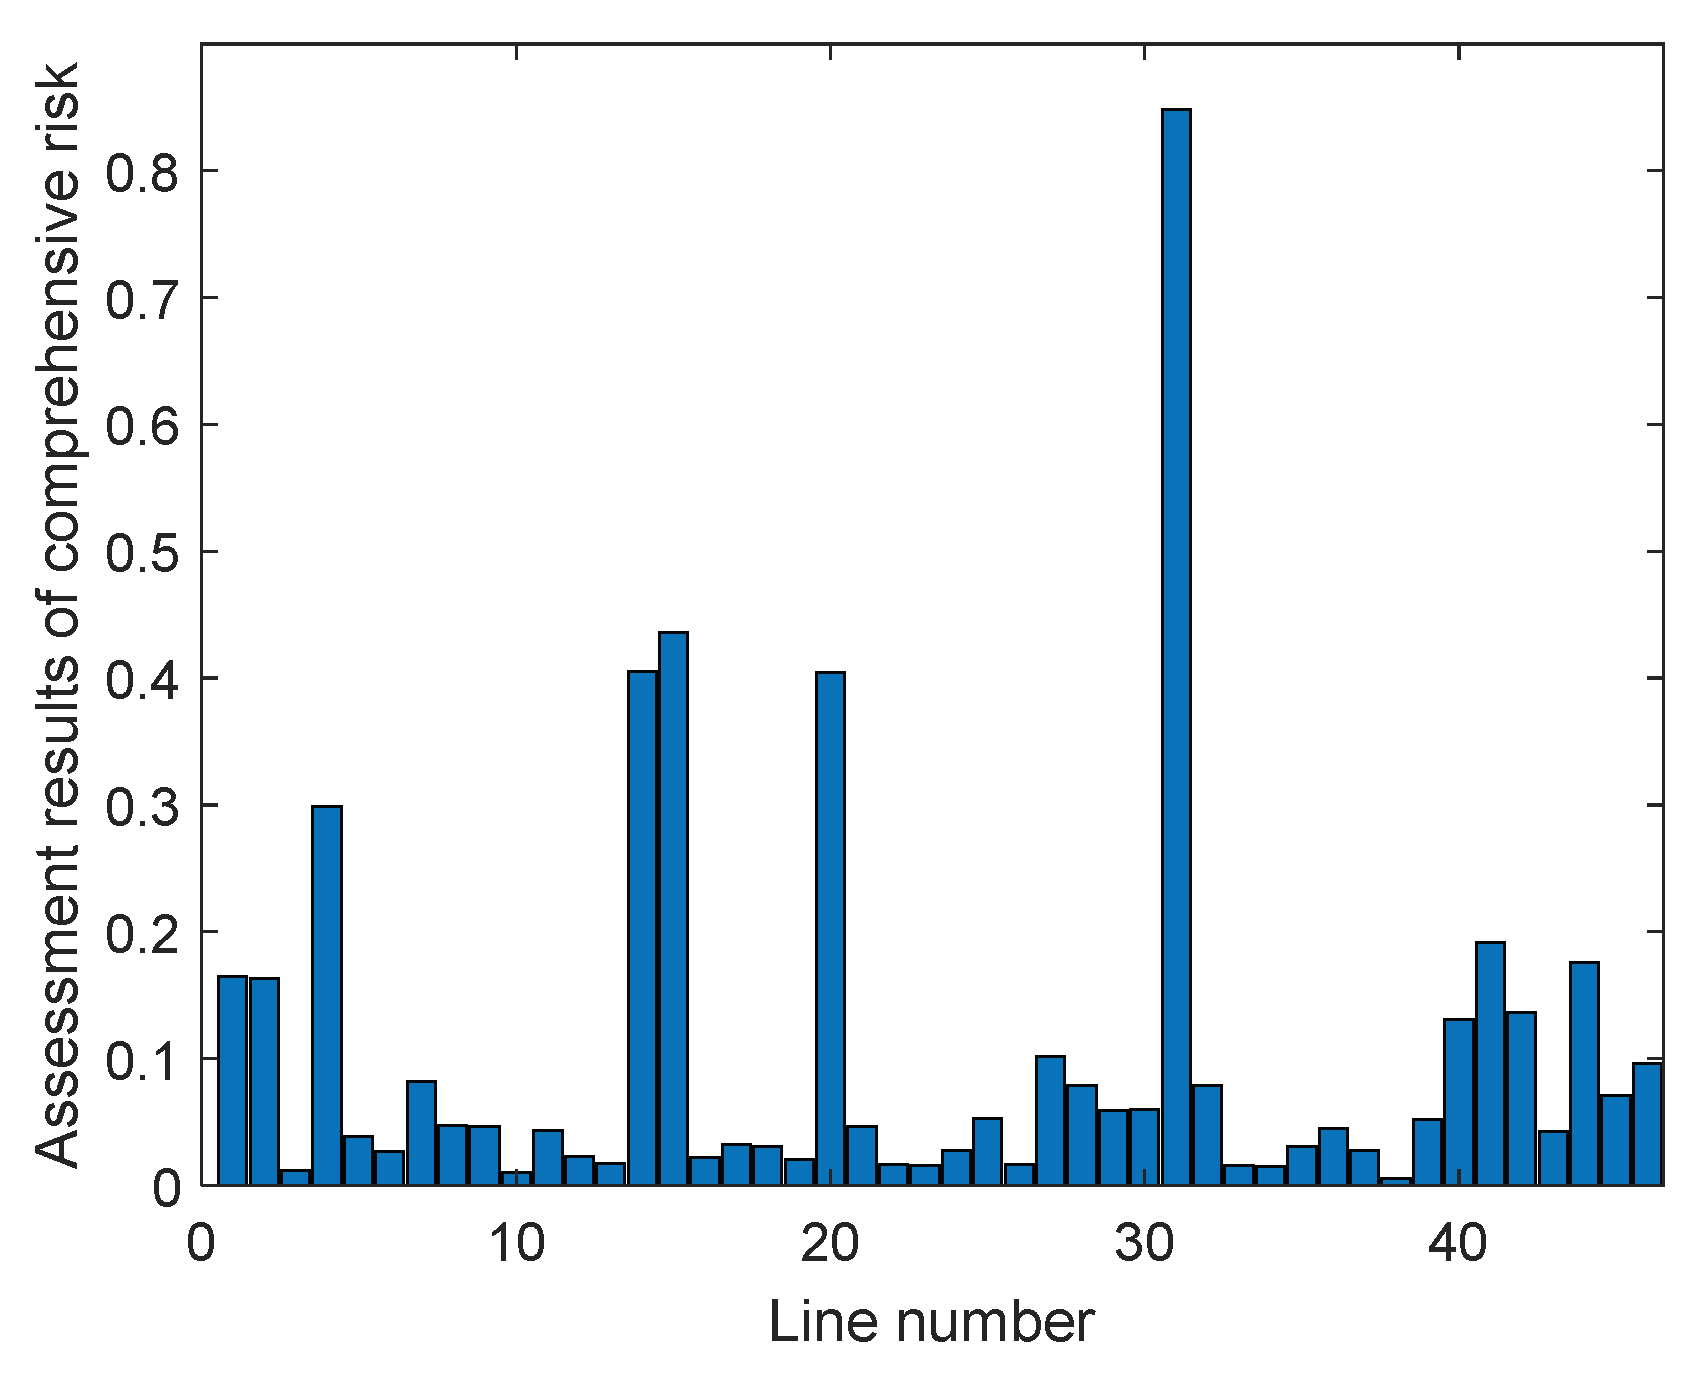
Through the above simulation results, the influence of line outage on system security and stability is evaluated. The vulnerability of each line under each risk assessment index is obtained. In order to finally obtain the vulnerability of each line, the game-theory-based comprehensive weighting method is used to weight multiple indicators to form a comprehensive risk index to evaluate the vulnerability of each line. Firstly, the results of each index are normalized, and the subjective weight B1 = [0.0859, 0.0650, 0.1508, 0.2790, 0.2097, 0.2097] of each index is solved by analytic hierarchy process. The objective weight B2 = [0.1823, 0.1657, 0.0430, 0.3637, 0.1603, 0.0849] of each index is obtained by entropy weight method, and β1 = 0.2945, β2 = 0.7597 is obtained by (30). Then, the comprehensive weight of each index is B = [0.1638, 0.1450, 0.0771, 0.3585, 0.1836, 0.1263]. The normalized risk assessment index results are weighted according to the comprehensive weight B. Finally, the comprehensive risk of each line outage on the system’s security and stability can be obtained as shown in Figure 9.
In Figure 9, the top 10 risk lines are shown; they are shown in Table 5 according to the risk ranking. From the perspective of system security and stability, L25–26 has the highest importance in the system. When there is an outage, it has the greatest impact on system security and stability, and it is the most important and vulnerable line in the system. Compared with L25–26, the importance of lines such as L9–39, L8–9, L15–16, and L2–25 is second, but they are also relatively vulnerable lines in the system. Once they experience an outage, it will also have a great impact on the security and stability of the system.
By assessing the vulnerable lines in the system, it can provide a decision-making basis for the control strategy that can prevent power systems from blackouts. For example, in the simulation test, the defense of vulnerable lines such as L25–26 and L9–39 can be strengthened. From the perspective of power system operation, corresponding control measures and contingency plans can be formulated and implemented according to these vulnerable lines, so that the system can still maintain safe operation even if these vulnerable lines experience an outage.
In order to further demonstrate the effectiveness of the proposed method, the method proposed in [25] is used to compare with the proposed method in this paper. The authors in [25] also identified the weak lines of the system by defining a variety of vulnerability indicators, such as topology indexes based on network structure and indexes based on power flow calculation. Moreover, these indexes proposed in [25] are also weighted to form a comprehensive index to identify vulnerable lines of power systems. Therefore, [25] could be regarded as representative enough to compare with the proposed method in this paper. The vulnerable lines that rank in the top 10 obtained by the proposed method in this paper and [25] are shown in Table 6.
From Table 6, the method in this paper is the same as the method proposed in [25] to identify a total of five lines in the set of vulnerable lines. The most vulnerable line obtained by [25] is L16–19, which is the same as the results obtained by the proposed method. The indexes proposed in [25] contain power transfer characteristics. Thus, lines that are prone to inducing line overload after an outage such as L25–26, L22–35, and L2–30 are more vulnerable than other lines. Meanwhile, the indexes proposed in [25] also contain topology connectivity. Some lines such as L2–30, L22–35, and L10–32 are more vulnerable than other lines since the outage of these lines will make some generators split from the system, which damages the topology connectivity of the system. This paper assumes that the generator on the swing bus has enough capacity. Although these line outages will unbalance the system power, the swing bus will regulate the power to keep the system power balanced. Therefore, in this paper, the outage of these lines does not cause severe problems (such as static rotor angle instability, etc.) other than triggering overloading of the lines connected to the swing bus. These lines are not the most vulnerable lines in this paper. Furthermore, for L9–39, its vulnerability ranks second in this paper but does not rank in the top 10 in [25], indicating that the line is not vulnerable after identification in [25]. However, although the impact of L9–39 outage on line overload is small, its outage will cause static rotor angle instability and static voltage instability in this paper, which will cause severe operation issues for power systems. However, it cannot be well reflected by [25]. In contrast, the indicators proposed in this paper can assess the security and stability of the system simultaneously. These indexes are always the most important indexes for power systems, which can give more comprehensive and effective identification for vulnerable lines than existing methods.

6. Conclusions

This paper proposes an identification method for weak transmission lines of power systems with intermittent energy resources and DC integration, which aims to provide a decision-making basis for control strategies and contingency plans. Firstly, this paper proposes a series of risk assessment index systems from the perspective of the security and stability of the novel power system. In terms of security, the influences of outages in each line on the electrical quantities such as bus voltage and line power are evaluated. In terms of stability, from the perspective of system static stability, three risk indicators of static rotor angle stability, static voltage stability, and static frequency stability are defined, respectively. The proposed risk assessment indicators aim at comprehensively quantifying the impact of each line outage on system stability. Then, the game-theory-based comprehensive weighting method is used to weight the results of each risk index to form a comprehensive risk evaluation index to evaluate the impact of each line outage on the system. Finally, the effectiveness of the proposed method is tested by the improved IEEE-39 bus system with renewable energy and DC lines integration. Meanwhile, the proposed method is compared with the current method. The simulation test results show that vulnerable lines of novel power systems can be evaluated effectively by the proposed method.

Author Contributions

Conceptualization, L.G. and J.H.; methodology, L.G., A.H. and M.Y.; software, A.H.; validation, A.H.; formal analysis, A.H.; investigation, A.H. and S.L.; resources, A.H. and J.C.; data curation, A.H.; writing—original draft preparation, A.H. and L.G.; writing—review and editing, A.H. and L.G.; visualization, J.C.; supervision, L.G., M.Y. and J.H.; project administration, L.G.; funding acquisition, L.G. All authors have read and agreed to the published version of the manuscript.

Funding

This research was supported by Hubei Provincial Natural Science Foundation of China (2022CFB301).

Data Availability Statement

The data that support the findings of this study are available upon request from the corresponding author. The data are not publicly available due to privacy or ethical restrictions.

Conflicts of Interest

Author Jijing Cao was employed by the company Wuhan EMU Depot of China Railway Wuhan Group Co., Ltd., Author Shangwen Li was employed by the Wuhan Power Supply Company, Author Jiawei Hu was employed by the Central China Branch of State Grid Corporation of China. The remaining authors declare that the research was conducted in the absence of any commercial or financial relationships that could be construed as a potential conflict of interest.

References

  1. Kumar, S.; Pandey, A.; Goswami, P.; Pentayya, P.; Kazi, F. Analysis of Mumbai Grid Failure Restoration on Oct 12, 2020: Challenges and Lessons Learnt. IEEE Trans. Power Syst. 2022, 37, 4555–4567. [Google Scholar] [CrossRef]
  2. Xiang, Y.; Wang, T.; Wang, Z. Risk Prediction Based Preventive Islanding Scheme for Power System Under Typhoon Involved with Rainstorm Events. IEEE Trans. Power Syst. 2023, 38, 4177–4190. [Google Scholar] [CrossRef]
  3. Liu, S.; Chen, C.; Jiang, Y.; Lin, Z.; Wang, H.; Waseem, M.; Wen, F. Bi-Level Coordinated Power System Restoration Model Considering the Support of Multiple Flexible Resources. IEEE Trans. Power Syst. 2023, 38, 1583–1595. [Google Scholar] [CrossRef]
  4. Dobson, I.; Newman, D.E. Cascading blackout overall structure and some implications for sampling and mitigation. Int. J. Elect. Power Energy Syst. 2017, 86, 29–32. [Google Scholar] [CrossRef]
  5. Li, M.J.; Tse, C.K.; Liu, D.; Zhang, X. Cascading Failure Propagation and Mitigation Strategies in Power Systems. IEEE Syst. J. 2023, 17, 3282–3293. [Google Scholar] [CrossRef]
  6. Rajkumar, V.S.; Ştefanov, A.; Torres, J.L.R.; Palensky, P. Dynamical Analysis of Power System Cascading Failures Caused by Cyber Attacks. IEEE Trans. Ind. Informat. 2024, 20, 8807–8817. [Google Scholar] [CrossRef]
  7. Gao, Q.; Wang, Y.; Cheng, X.; Yu, J.; Chen, X.; Jing, T. Identification of Vulnerable Lines in Smart Grid Systems Based on Affinity Propagation Clustering. IEEE Internet Things J. 2019, 6, 5163–5171. [Google Scholar] [CrossRef]
  8. Liu, Y.; Lai, X.; Xin, H.; Zhu, J.; Huang, L.; Xia, S. Generalized short-circuit ratio based distributed real-time stability assessment of renewable power systems. IEEE Trans. Power Syst. 2023, 38, 5953–5956. [Google Scholar] [CrossRef]
  9. Shu, Y.; Tang, Y. Analysis and recommendations for the adaptability of China’s power system security and stability relevant standards. CSEE J. Power Energy Syst. 2017, 3, 334–339. [Google Scholar] [CrossRef]
  10. Zhu, Y.; Zhou, Y.; Wei, W.; Zhang, L. Real-time cascading failure risk evaluation with high penetration of renewable energy based on a graph convolutional network. IEEE Trans. Power Syst. 2023, 38, 4122–4133. [Google Scholar] [CrossRef]
  11. Kitsak, M.; Gallos, L.K.; Havlin, S.; Liljeros, F.; Muchnik, L.; Stanley, H.E.; Makse, H.A. Identification of influential spreaders in complex networks. Nat. Phys. 2010, 6, 888–893. [Google Scholar] [CrossRef]
  12. Xu, L.; Wang, X.L.; Wang, X.F. Electric betweenness and its application in vulnerable line identification in power system. Chin. Soc. Electr. Eng. 2010, 30, 33–39. [Google Scholar]
  13. Bompard, E.; Pons, E.; Wu, D. Extended topological metrics for the analysis of power grid vulnerability. IEEE Syst. J. 2012, 6, 481–487. [Google Scholar] [CrossRef]
  14. Fang, J.; Su, C.; Chen, Z.; Sun, H.; Lund, P. Power system structural vulnerability assessment based on an improved maximum flow approach. IEEE Trans. Smart Grid 2018, 9, 777–785. [Google Scholar] [CrossRef]
  15. Chu, C.C.; Lu, H.H.C. Complex networks theory for modern smart grid applications: A survey. IEEE J. Emerg. Sel. Top. Circuits Syst. 2017, 7, 177–191. [Google Scholar] [CrossRef]
  16. Fan, W.; Zhang, X.; Mei, S. Vulnerable transmission line identification considering depth of K-shell decomposition in complex grids. IET Gener. Trans. Distrib. 2018, 12, 1137–1144. [Google Scholar] [CrossRef]
  17. Bai, H.; Miao, S. Hybrid flow betweenness approach for identification of vulnerable line in power system. IET Gener. Trans. Distrib. 2015, 9, 1324–1331. [Google Scholar] [CrossRef]
  18. Chen, C.Y.; Zhou, Y.; Wang, Y.; Ding, L.; Huang, T. Vulnerable Line Identification of Cascading Failure in Power Grid Based on New Electrical Betweenness. IEEE Trans. Circuits Syst. II Express Briefs 2023, 70, 665–669. [Google Scholar] [CrossRef]
  19. Rao, S.; Tylavsky, D.; Vittal, V.; Yi, W.; Shi, D.; Wang, Z. Fast weak-bus and bifurcation point determination using holomorphic embedding method. In Proceedings of the IEEE Power & Energy Society General Meeting (PESGM), Portland, OR, USA, 5–10 August 2018; pp. 1–5. [Google Scholar]
  20. Ma, Z.; Shen, C.; Liu, F.; Mei, S. Fast screening of vulnerable transmission lines in power grids: A pagerank-based approach. IEEE Trans. Smart Grid 2019, 10, 1982–1991. [Google Scholar] [CrossRef]
  21. Wei, X.; Zhao, J.; Huang, T.; Bompard, E. A novel cascading faults graph based transmission network vulnerability assessment method. IEEE Trans. Power Syst. 2018, 33, 2995–3000. [Google Scholar] [CrossRef]
  22. Zhang, S.; Yu, M.; Hu, J.; Sun, J.; Wei, J.; Wu, Y. Research on vulnerable line identification based on PMU data and graph theory. In Proceedings of the 2022 Power System and Green Energy Conference (PSGEC), Shanghai, China, 25–27 August 2022; pp. 853–858. [Google Scholar]
  23. Moger, T.; Dhadbanjan, T. A novel index for identification of weak nodes for reactive compensation to improve voltage stability. IET Gener. Trans. Distrib. 2015, 9, 1826–1834. [Google Scholar] [CrossRef]
  24. Zhu, D.; Wang, R.; Duan, J.; Chen, L.; Xue, B.; Cheng, W. Identification of critical transmission lines considering multiple influencing factors. Proc. CSEE 2019, 39, 5938–5947. [Google Scholar]
  25. Zhu, D.; Wang, R.; Duan, J.; Cheng, W. Comprehensive weight method based on game theory for identify critical transmission lines in power system. Int. J. Electr. Power Energy Syst. 2021, 124, 106362. [Google Scholar] [CrossRef]
  26. Yang, L.; Li, C. Identification of vulnerable lines in smart grid systems based on improved agglomerative hierarchical clustering. IEEE Access 2023, 11, 13554–13563. [Google Scholar] [CrossRef]
  27. Fan, W.; He, X.; Xiao, Y.; Li, Q. Vulnerability analysis of power system by modified H-index method on cascading failure state transition graph. Electr. Power Syst. Res. 2022, 209, 107986. [Google Scholar] [CrossRef]
  28. Li, Y.; Liu, J.; Liu, X.; Jiang, L.; Wei, Z.; Xu, W. Vulnerability assessment in power grid cascading failures based on entropy of power flow. Auto. Elect. Power Syst. 2012, 36, 11–16. [Google Scholar]
  29. Liu, W.; Wang, J.; Xie, C.; Wang, W. Brittleness source identification model for cascading failure of complex power grid based on brittle risk entropy. Pro. CSEE 2014, 32, 142–149. [Google Scholar]
  30. Lin, Z.; Wen, F.; Wang, H.; Lin, G.; Mo, T.; Ye, X. CRITIC-based node importance evaluation in skeleton-network reconfiguration of power grids. IEEE Trans. Circuits Syst. II Express Briefs 2018, 65, 206–210. [Google Scholar] [CrossRef]
  31. Cheng, M.X.; Crow, M.; Ye, Q. A game theory approach to vulnerability analysis: Integrating power flows with topological analysis. Int. J. Electr. Power Energy Syst. 2016, 82, 29–36. [Google Scholar] [CrossRef]
  32. Zhu, B.; Zhang, L.; Li, G. Identification of vulnerable transmission lines in power system based on game theory. IEEE Access 2024, 12, 29607–29616. [Google Scholar] [CrossRef]
  33. Sun, J.; Liu, J.; Li, C.; Zhi, N. An identification method for vulnerable lines based on combination weighting method and GraphSAGE algorithm. Int. J. Electr. Power Energy Syst. 2023, 149, 109035. [Google Scholar] [CrossRef]
  34. Zhou, B.; Lei, Y.; Li, C.; Fang, B.; Wu, Q.; Li, L.; Li, Z. Electrical LeaderRank method for node importance evaluation of power grids considering uncertainties of renewable energy. Int. J. Electr. Power Energy Syst. 2019, 106, 45–55. [Google Scholar] [CrossRef]
  35. Zhang, L.; Zhu, B.; Wang, Y. Identification of vulnerable lines in power grids with wind power integration based on topological potential. Electr. Power Syst. Res. 2024, 234, 110593. [Google Scholar] [CrossRef]
  36. Zhu, S.; Wang, T.; Wang, Z. Bi-level optimized emergency load/generator shedding strategy for AC/DC hybrid system following DC blocking. IET Gener. Trans. Distrib. 2020, 14, 1491–1499. [Google Scholar] [CrossRef]
  37. Wang, T.; Li, C.; Mi, D.; Wang, Z.; Xiang, Y. Coordinated modulation strategy considering multi-HVDC emergency for enhancing transient stability of hybrid AC/DC power systems. CSEE J. Power Energy Syst. 2020, 6, 806–815. [Google Scholar]
  38. Kundur, P. Power System Stability and Control; McGraw-Hill: New York, NY, USA, 1994. [Google Scholar]
  39. Wang, Z.; Shen, C.; Liu, F.; Gao, F. Analytical expressions for joint distributions in probabilistic load flow. IEEE Trans. Power Syst. 2017, 32, 2473–2474. [Google Scholar] [CrossRef]
  40. Xiang, Y.; Wang, T.; Wang, Z. Improved Gaussian mixture model based probabilistic power flow of wind integrated power system. In Proceedings of the IEEE Power & Energy Society General Meeting (PESGM), Atlanta, GA, USA, 4–8 August 2019; pp. 1–5. [Google Scholar]
  41. GB 38755-2019; Code on Security and Stability for Power System. Standardization Administration of China: Beijing, China, 2019.
  42. Bu, S.; Du, W.; Wang, H.; Chen, Z.; Xiao, L.; Li, H. Probabilistic analysis of small-signal stability of large-scale power systems as affected by penetration of wind generation. IEEE Trans. Power Syst. 2012, 27, 762–770. [Google Scholar] [CrossRef]
  43. Han, X.; Zhao, S.; Wei, Z.; Bai, W. Planning and overall economic evaluation of photovoltaic-energy storage station based on game theory and analytic hierarchy process. IEEE Access 2019, 7, 110972–110981. [Google Scholar] [CrossRef]
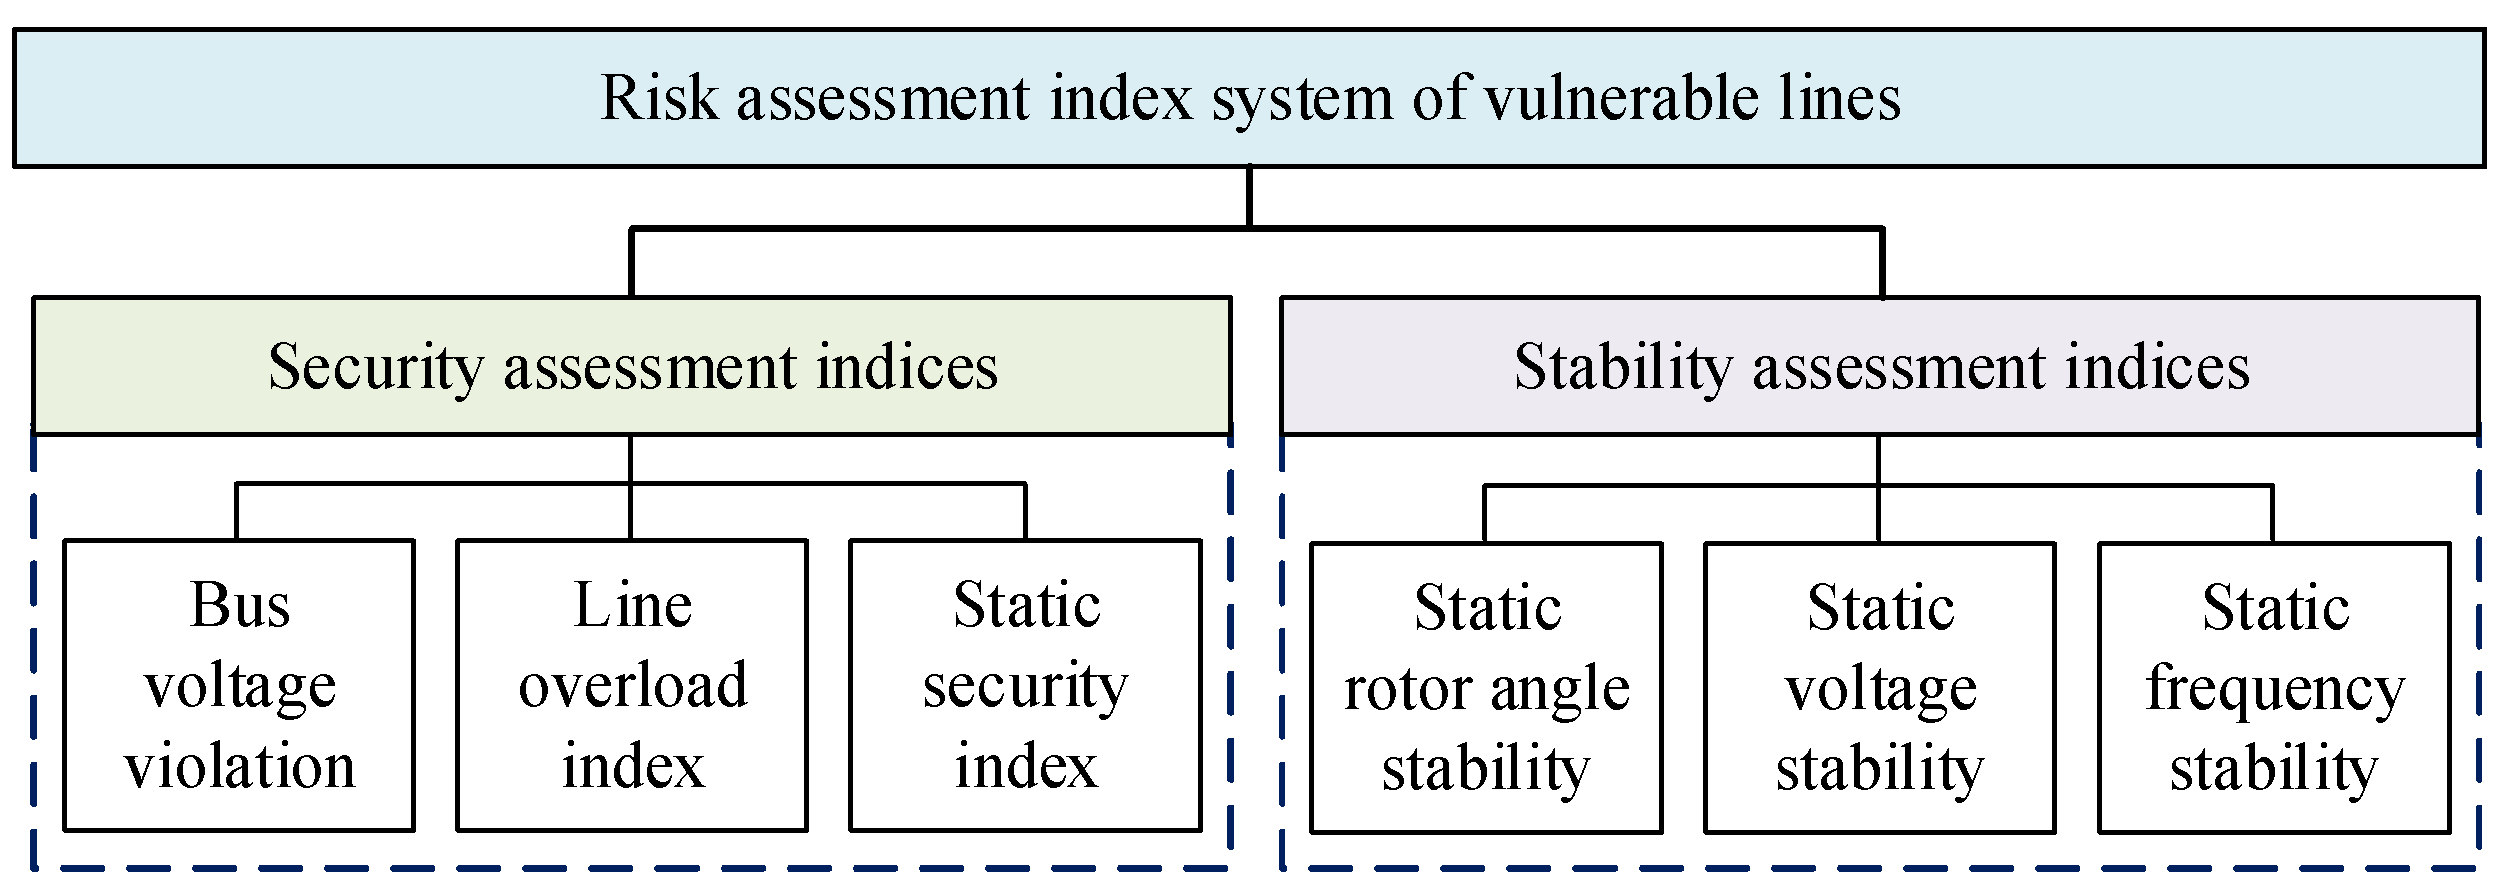
Figure 1. Risk assessment index system.
Energies 17 03918 g001
Figure 2. Improved IEEE 39 bus system.
Energies 17 03918 g002
Figure 3. Probability AC/DC power flow results: (a) bus voltage; (b) line transmission power.
Energies 17 03918 g003
Figure 4. Risk of voltage violation and line overload after each line outage: (a) bus voltage violation risk; (b) line overload risk.
Energies 17 03918 g004
Figure 5. Static security after each line outage.
Energies 17 03918 g005
Figure 6. Static frequency stability after each line outage.
Energies 17 03918 g006
Figure 7. Static rotor angle stability after each line outage.
Energies 17 03918 g007
Figure 8. Static voltage stability after each line outage.
Energies 17 03918 g008
Figure 9. Comprehensive index after each line outage.
Energies 17 03918 g009
Table 1. Risk sorting for voltage violation and line overload.
RankVoltage Violation RiskLine Overload Risk
Line NumberRisk ValueLine NumberRisk Value
1L15–160.1556L25–265.2697
2L25–260.1371L20–342.7717
3L9–390.1046L22–352.4761
4L8–90.0860L25–372.2993
5L25–370.0254L2–301.5992
6L20–340.0232L29–381.0576
7L12–110.0189L19–330.9878
8L4–50.0139L9–390.9322
9L12–130.0137L8–90.9322
10L6–70.0106L10–320.6455
Table 2. Risk sorting for static security.
RankLine NumberRisk ValueRankLine NumberRisk Value
1L25–267.99966L25–375.0127
2L9–396.09737L29–384.4849
3L8–95.24848L22–353.7451
4L15–165.20999L3–43.2632
5L20–345.140310L26–272.8230
Table 3. Risk sorting for static rotor angle stability.
RankLine NumberRisk ValueRankLine NumberRisk Value
1L15–160.86806L1–20.5855
2L2–250.83367L22–230.2524
3L9–390.63048L21–220.2491
4L8–90.63049L23–240.2460
5L1–390.585510L16–240.2075
Table 4. Risk sorting for static voltage stability.
RankLine NumberRisk ValueRankLine NumberRisk Value
1L2–2522.226L17–279.71
2L25–2621.717L4–59.18
3L9–3918.928L16–176.88
4L8–918.229L26–276.82
5L19–3313.5910L4–146.78
Table 5. Sorting for comprehensive assessment index.
RankLine NumberRisk ValueRankLine NumberRisk Value
1L25–260.84696L20–340.1897
2L9–390.43617L25–370.1738
3L8–90.40668L1–20.1691
4L15–160.39979L1–390.1671
5L2–250.307610L22–350.1360
Table 6. Sorting results comparison.
RankThe Proposed MethodThe Method of [25]
1L25–26L25–26
2L9–39L2–30
3L8–9L22–35
4L15–16L10–32
5L2–25L20–34
6L20–34L29–38
7L25–37L15–16
8L1–2L25–37
9L1–39L19–33
10L22–35L6–7
Disclaimer/Publisher’s Note: The statements, opinions and data contained in all publications are solely those of the individual author(s) and contributor(s) and not of MDPI and/or the editor(s). MDPI and/or the editor(s) disclaim responsibility for any injury to people or property resulting from any ideas, methods, instructions or products referred to in the content.