1. Introduction
Energy storage in electrochemical batteries currently plays a vital role in both stationary renewable energy production and electric vehicle systems. Various technologies exist, including lead–acid, nickel–cadmium, nickel–metal hydrides, lithium-ion, etc., and the differences mainly lie in the materials used for the electrodes and the electrolyte, which determine energy density and other desired features. Over the past few decades, these systems have been the subject of significant enhancements in order to meet more and more challenging requirements. In this scenario, the lithium-ion batteries have demonstrated important advantages over other technologies due to their high density, low self-discharge and long life [
1] and have been, therefore, the focus of an increasing number of scientific investigations aimed at improving performance and durability, as well as understanding the relevant underlying physical and chemical phenomena.
Within energy storage systems, the Li-ion battery is typically monitored and controlled by an energy management system (EMS), which ensures efficient and reliable operation. This is achieved by continuously assessing the current battery’s conditions during operation, particularly by estimating key parameters such as the battery state of charge (
), state of health (
) and remaining useful life (
) [
2]. In particular, the
is a measure of how much energy is available in the battery at any given moment and, therefore, plays a crucial role in the EMS, where it helps prevent over-charging and over-discharging, enhances user experience by providing information on available energy and improves the battery cycle life [
3].
Since the
is a quantity that cannot be easily measured, and due to its crucial importance in real applications, many authors have developed various methods to estimate the
, each characterized by distinct levels of accuracy, complexity and the number of parameters involved [
3,
4]. Such methods can be classified in different groups [
5]. Experiment-based methods involve an assessment of the cell dynamics and may include ampere integration methods, electrochemical impedance spectroscopy, etc. [
6]. The data-driven methods involve compiling the available data on battery behavior and fitting them against measurements through various machine learning algorithms that rely on neural networks, regression or fuzzy logic approaches [
7]. The multiple fusion methods are defined as the combination of model-based, experimental and data-driven methods, which helps improve the accuracy, as well as reduce computational time by learning from each other [
8]. Finally, the model-based estimation methods typically consist of electrochemical models (EM), equivalent circuit models (ECM) or electrochemical impedance models (EIM) [
9,
10]. They rely on state equations and adaptive filters to estimate the internal behavior of the battery. In more detail, EM methods try to describe on a very microscopic level the relevant phenomena (charge transfer, reaction kinetics, etc.) and the spatial and temporal distribution of the related physical quantities (concentrations, potential, current, temperature, etc.) [
11,
12]. However, even after many simplifications, these models remain very complex and the parameters involved are numerous and difficult to quantify. The EIM models involve a deep analysis of the dynamic behavior of the battery through harmonic small-signal excitation, which allows for direct measurement of the voltage response at any operating point. They usually require high computational power, and the results are difficult to obtain in a short time. The ECM models have been widely used to describe the battery dynamics [
13,
14,
15,
16,
17,
18]. They represent the battery as an equivalent electrical circuit with resistors, capacitors and voltage sources suitably connected together in order to produce the actual terminal voltage of the battery [
19]. This approach appears to be a good compromise between complexity and accuracy and typically allows for a quick estimation of the battery response under different loads, charging and discharging conditions, temperature, etc. [
20,
21]. Therefore, the modeling approach in this paper is based on the ECM concept, which requires, however, a good estimation of quantities such as the open circuit voltage and a proper description of the sources of energy dissipation.
During the recent decades, many authors have addressed the problem of accurately predicting the open circuit voltage of a Li-ion battery, and a number of different solutions have been proposed. Some of them rely on the complete knowledge of the composition and chemistry of the materials in the cell, which can be then described by thermodynamic equilibrium relationships, continuously adjusted to take into account the transfer of charges between cathode and anode. Very often, however, in the lack of a full characterization effort for the materials involved, the level of information available does not allow for such a detailed description. Alternatively, it is possible to resort to fully empirical correlations based on the observed voltage measurements, as in the example in [
22], where a polynomial, an exponential, a sum of sin functions and a Gaussian model are tested in order to describe the open circuit voltage of a high-capacity Li-ion battery. These models, however, fail to explain the nature of the physical phenomena occurring inside the battery and, therefore, suffer from difficulties in generalization. As a good compromise, semi-empirical approaches, which try to some extent to keep a connection between model formulation and real phenomena, seem to have received particular attention. These mostly date back to the early work of C.M. Shepherd [
23] on Li-ion batteries, with significant improvements achieved later by other authors in physical and numerical accuracy. In particular, this model has been further improved in [
24,
25] with the introduction of an additional non-linear term and a filtered current to address algebraic loop numerical issues and to better describe the battery fast dynamics. Due to its simplicity and the possibility to extract model parameters directly from the manufacturer’s discharge curves without the need to apply non-linear optimization methods, one version of this approach has been also implemented and made publicly available in the Matlab/Simulink library [
26], contributing further to its popularity and widespread use in the scientific community [
27,
28]. The main idea behind Shepherd-like approaches is to build the voltage curve around a constant value, and these are, therefore, particularly suitable for modeling batteries with a main central voltage plateau, as is typical for LFP electrodes. Preliminary investigations by the authors and conclusions drawn from similar studies [
29,
30] indicate that these models are often less suitable for describing batteries that lack a clear main plateau, exhibiting instead a number of smaller plateaus or a smooth, gradually decreasing curve.
This paper tries to fill this gap by proposing an alternative model to address batteries without a clear voltage plateau, avoiding, at the same time, the over-complexity of a detailed description of solid state chemistry. The simplifications introduced allow us to resort to the classical Nernst equation to account for the continuous or quasi-continuous change in equilibrium potentials by means of a continuous function of the activities of the lithiated phases. The model presents a limited number of unknown parameters that can be easily estimated in the light of the typical discharging curves made available by battery manufacturers or from direct voltage measurements. The model is successfully applied to describe the voltage curves versus for popular commercial batteries with cobalt-containing electrodes.
3. Results and Discussion
The accuracy of the proposed model is evaluated by predicting the voltage in two commercial batteries of the 18,650 type (18 mm in diameter, 65 mm in length, cylindrical), each characterized by distinct cathode materials and capacity. This battery format is particularly widespread as most battery packs in both stationary and mobile applications are assembled from individual cells of this type. The first battery considered in this work is the Panasonic CGR18650AF, with a cathode made of lithium nickel cobalt manganese oxide (LiCoNiMnO
2 or NMC) and a maximum standard capacity (evaluated at specific conditions defined by the manufacturer) of 2050 mAh. The second battery is the Panasonic NCR18650B, with a cathode made of lithium cobalt nickel aluminum oxide (LiCoNiAlO
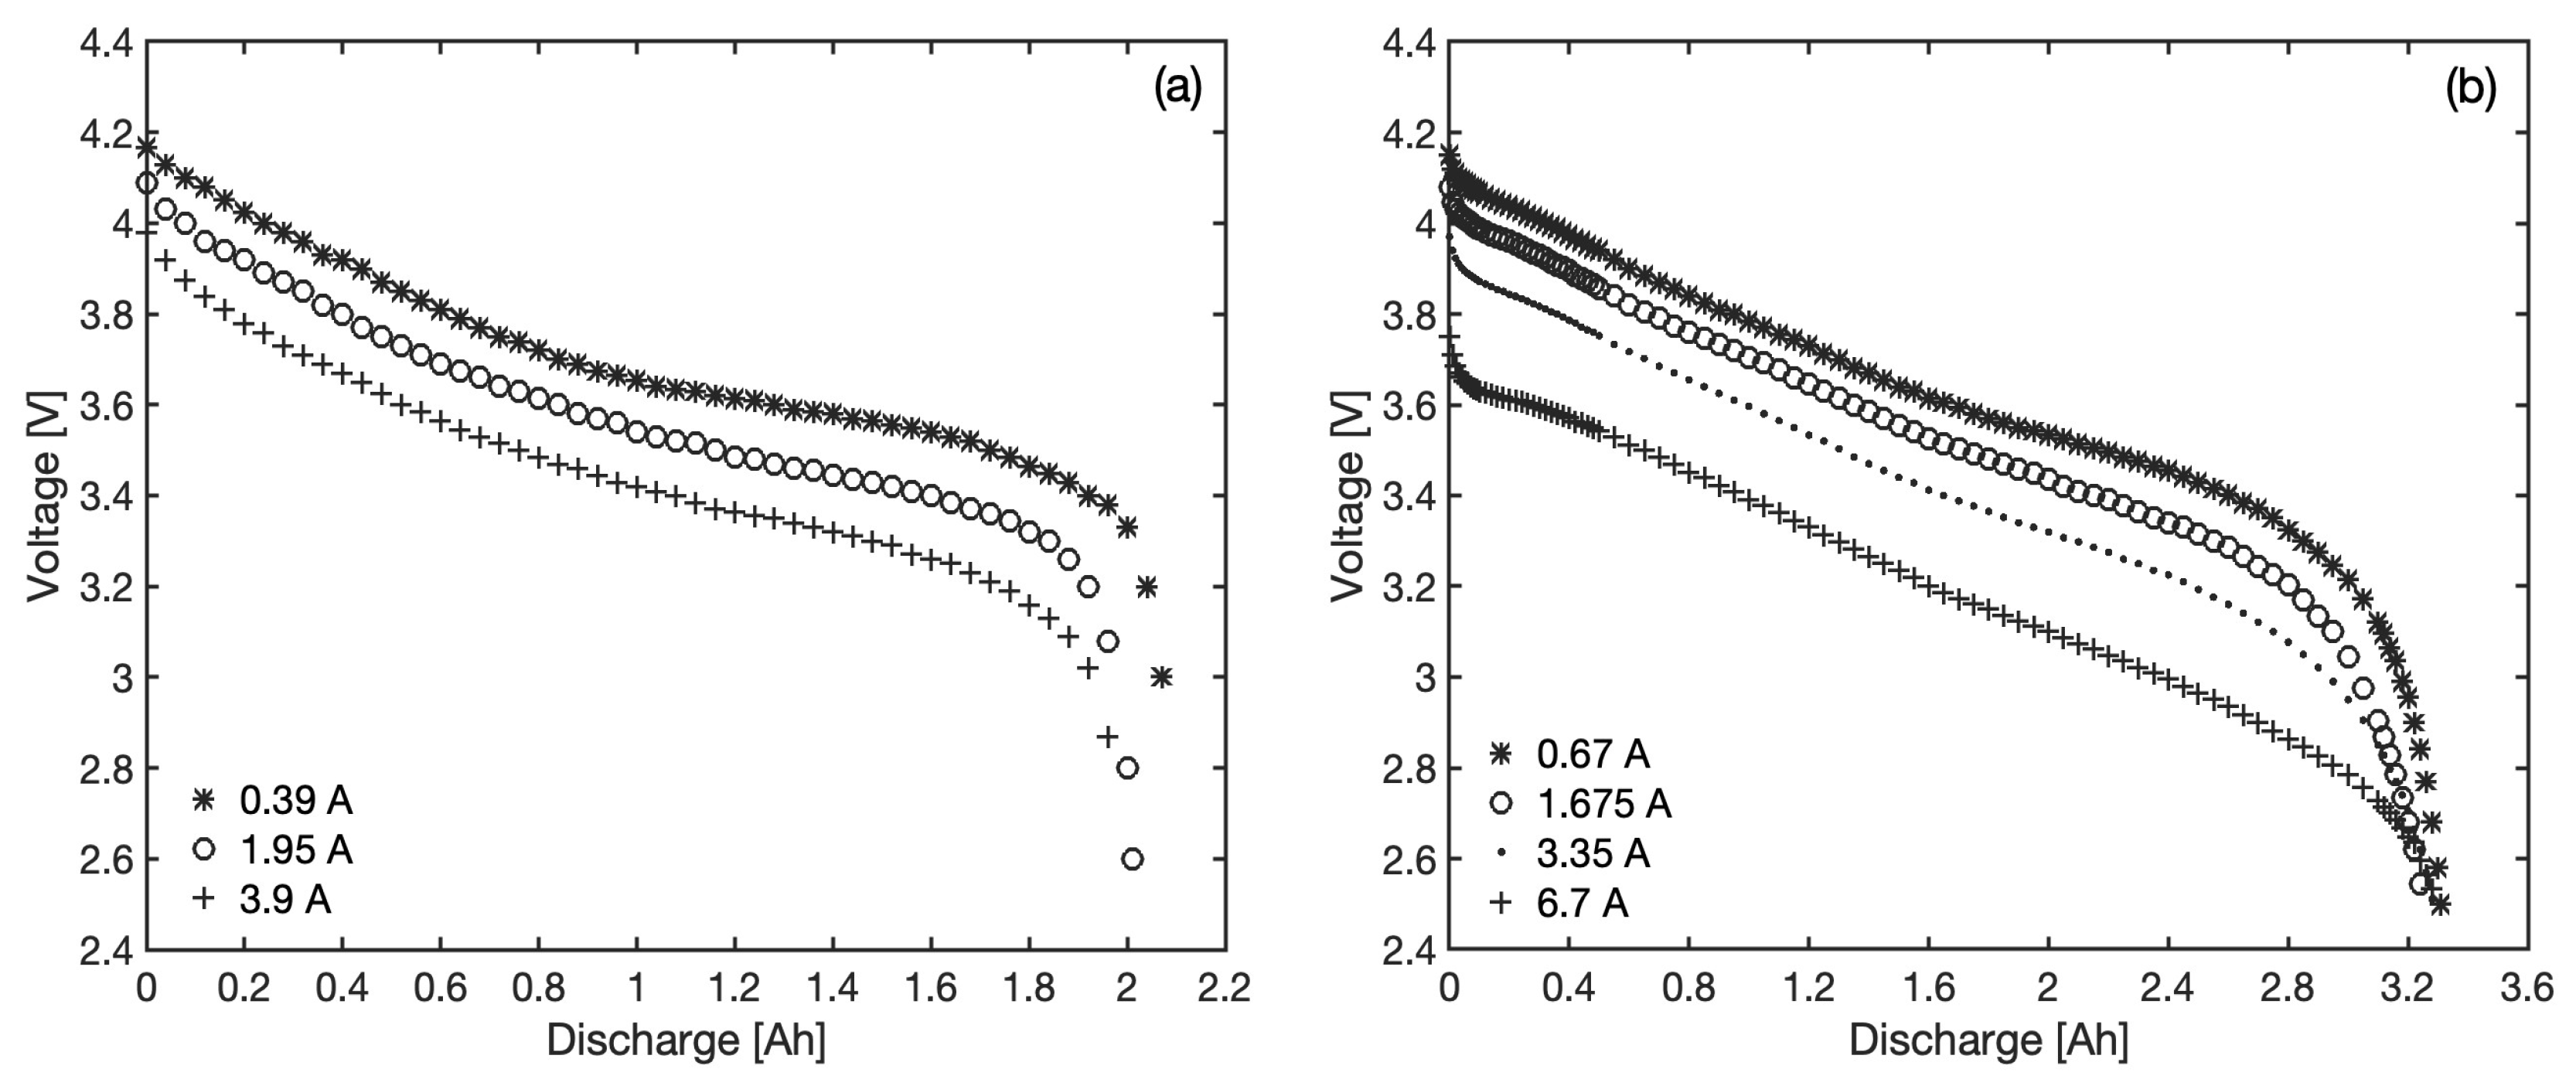
2 or NCA) and a standard maximum capacity of 3350 mAh. The relevant discharge curves at various constant currents are reproduced in
Figure 2, as extracted from the manufacturer’s datasheets [
33,
34]. Three different sets of data are available for the first battery at three different currents (0.39, 1.95 and 3.9 A, corresponding to 0.2 C, 1 C and 2 C, respectively), while voltage curves for the second battery refer to four different constant currents (0.67, 1.675, 3.35 and 6.7 A, or 0.2 C, 0.5 C, 1 C and 2 C, respectively). The maximum available capacity of the batteries under real operational conditions, to be used to determine the
in Equation (
8), has been considered as dependent on the current and has been read from the available discharge curves; the relevant values are reported in
Table 1 and correspond to the energy extracted when going from fully charged conditions to the cut-off voltage of 2.5 V for both batteries. According to the Peukert effect, this maximum capacity decreases when the discharge current increases, although other effects could also influence its value, such as the conditions under which the last charging and the discharging were carried out or the age of the battery (maximum capacity usually decreases with age but an increase may also be observed during early cycling [
35]). As a consequence, discharge curves crossing at low
is not rare, as observed in
Figure 2b in the case of NCR18650B.
3.1. Equivalent Internal Resistance
With reference to the general form of the model as in Equation (
10), the effect of the current is actually isolated in one linear term,
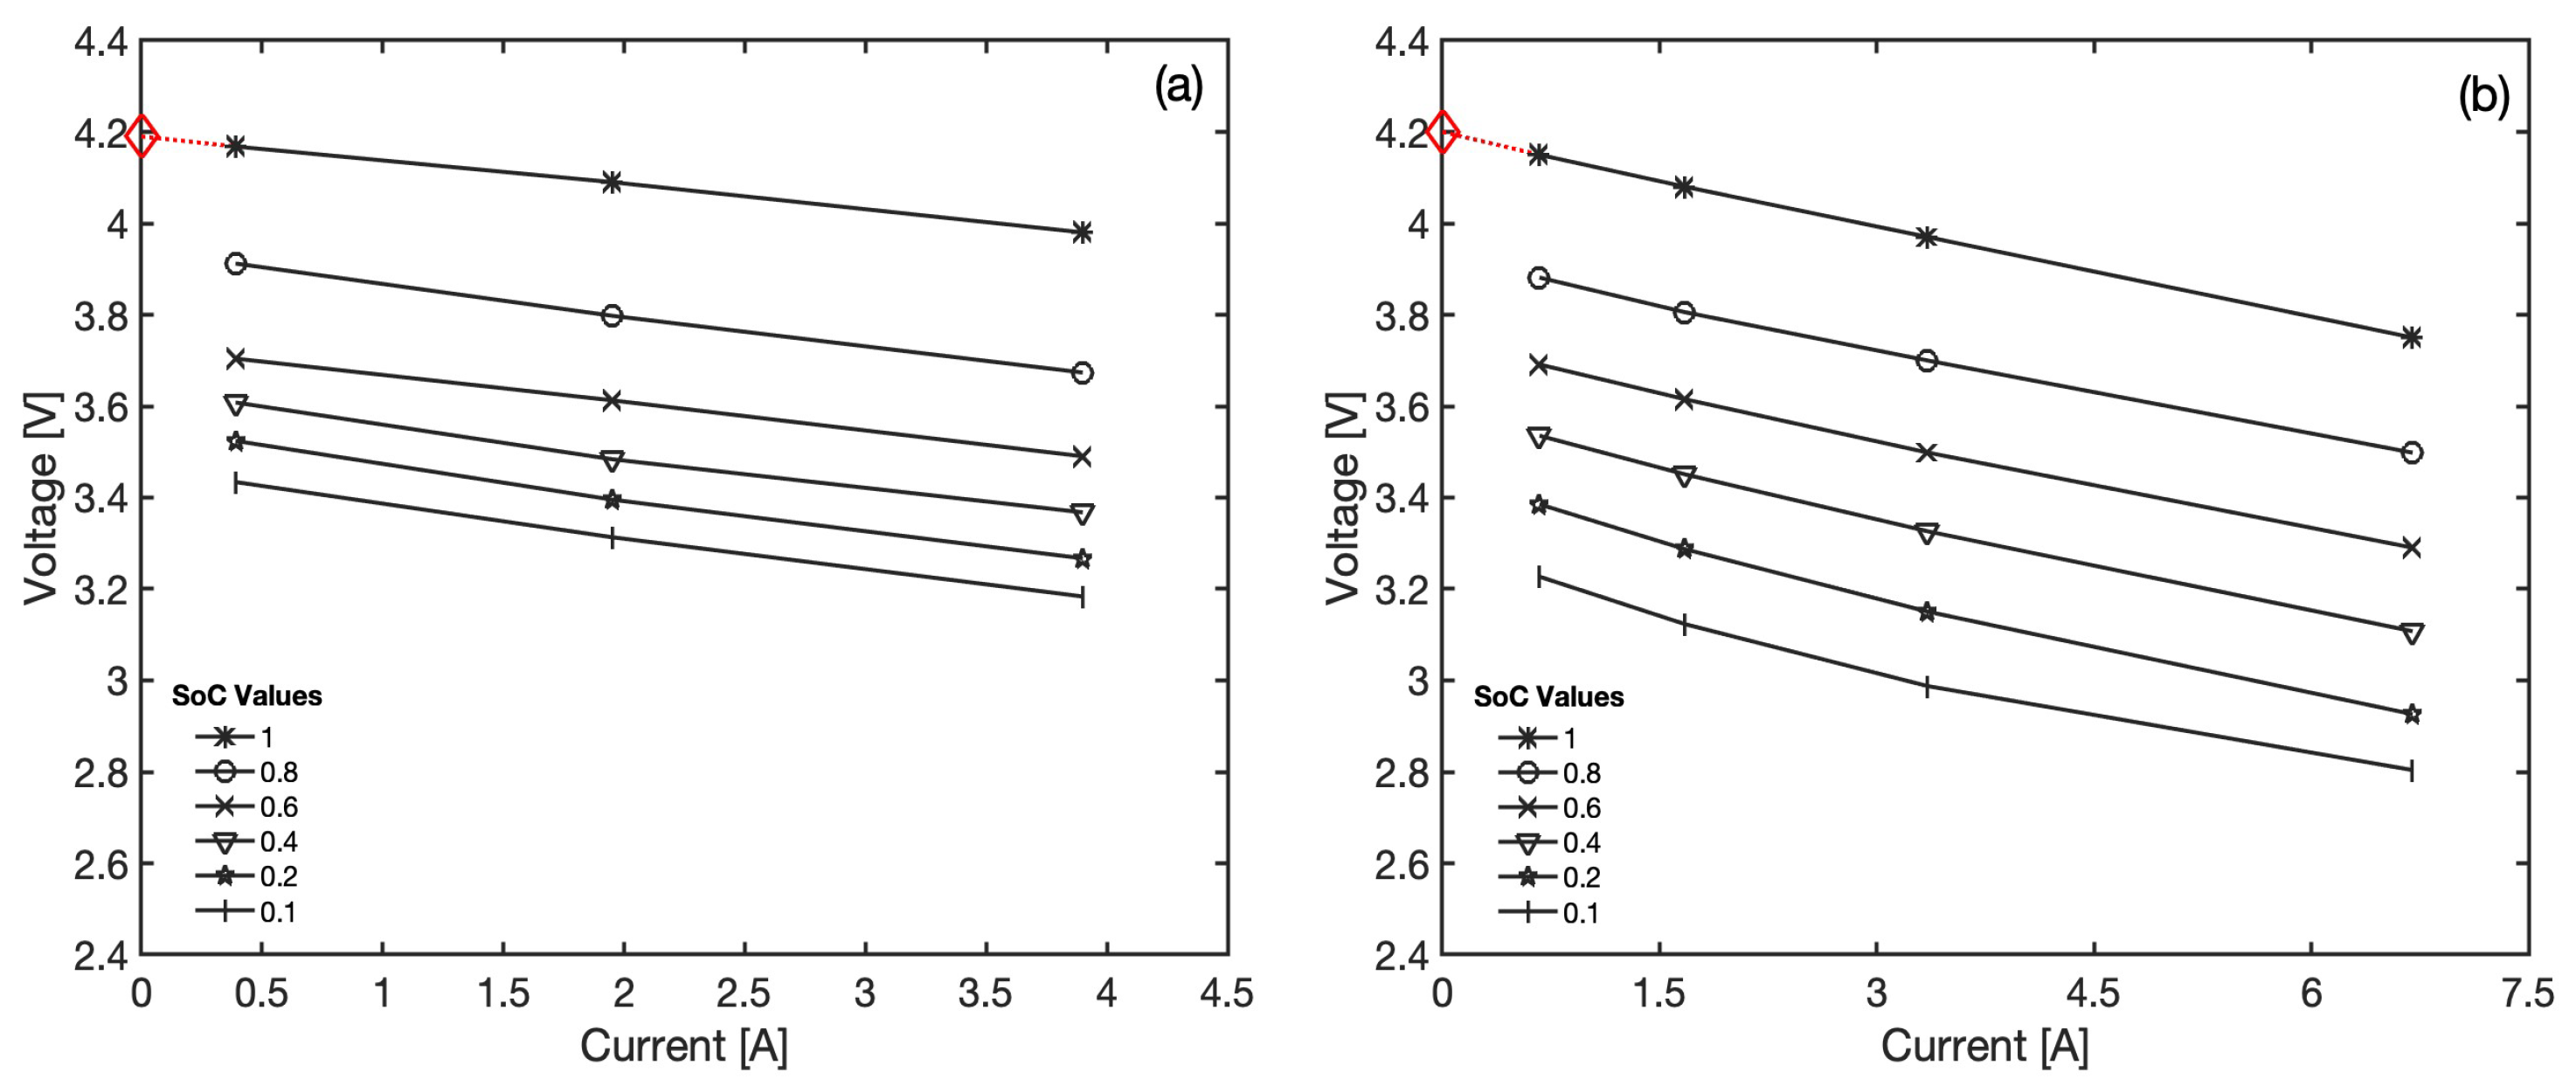
. A plot of the battery voltage versus the current can be extracted from the available discharge curves at constant
values, as reported in
Figure 3, which confirms that any deviation from linearity in the voltage versus current relationships is modest and mostly limited to very low
values of the second battery. In particular, the observed linearity suggests that ohmic-like losses dominate over the considered current range and that typical causes of non-linearity, such as the overpotential produced by mass transfer limitations at high currents, do not onset at the considered C-rates. Moreover, these plots also allow a direct estimation of the equivalent resistance as the slope of the best fitting lines. The estimates of
at different states of charge are plotted in
Figure 4, revealing values in the range 60–75 m
. These values show a slight and fairly linear decreasing trend when moving towards fully charged conditions. This effect, even if modest, has been taken into account in the model in particular to improve the accuracy of the voltage predictions at very low
, where the sensitivity to the model parameters is highest. To this goal, the equivalent resistance is expressed as
and the corresponding best fit parameters are given in
Table 1.
3.2. Fully Charged Open Circuit Voltage
From
Figure 3, it is possible to obtain a reasonable estimation of the open circuit voltage in fully charged conditions by linearly extrapolating the voltage at
until it intercepts the vertical axis at zero current. The extracted values, 4.19 V and 4.20 V, respectively, are similar and in line with what should be expected from classic Li-ion based electrode pairs. In the lack of direct observations, this approach assumes that the linear trends shown in
Figure 3 hold until zero currents, hence, neglecting possible non-linear phenomena and voltage gaps reported at near zero currents [
36].
3.3. Model Fitting Results
After extracting the values of the internal equivalent resistance
and of the open circuit voltage in fully charged conditions directly from the discharge curves, the model presents four more adjustable parameters: the stoichiometric coefficients
and
and the parameters
and
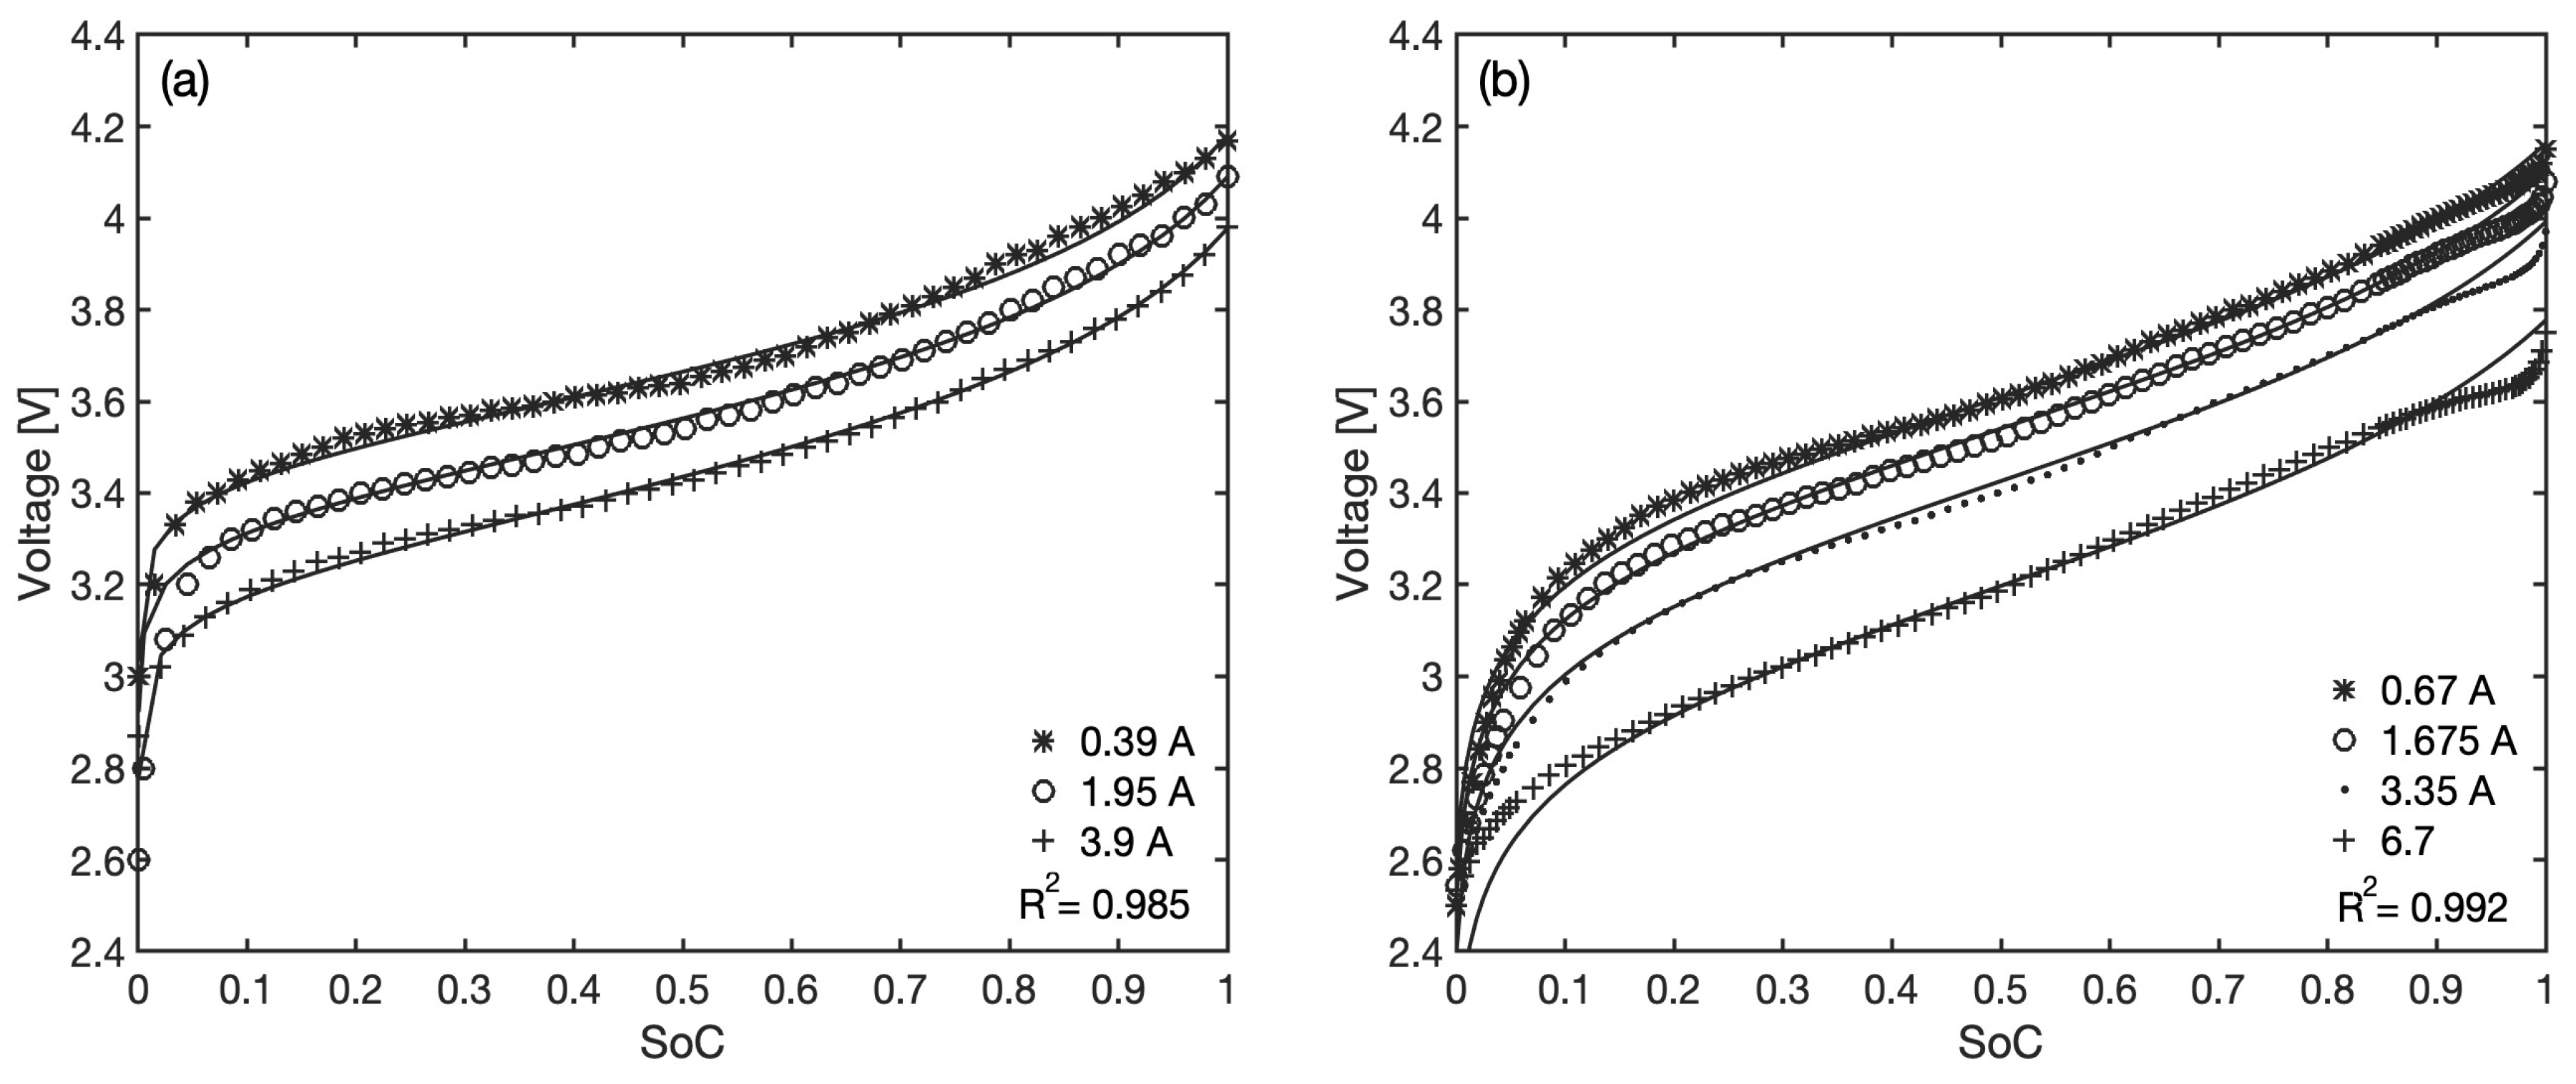
, accounting for the relationships among the maximum amounts of lithium at the electrodes and the battery total capacity. These are estimated through an optimization process that minimizes, for each battery, the sum of all absolute errors between model predictions and measured voltage by means of a non-linear generalized reduced gradient algorithm. The comparison between the actual discharge curves and the best-fit model predictions is shown in
Figure 5 for both batteries and all available constant current datasets, as a function of the
.
The model generally shows a good level of accuracy over the entire discharging range, with overall coefficients of determination
equal to 0.985 and 0.992, respectively. The values of the best-fit parameters for each battery are reported in
Table 1. The two stoichiometric coefficients are both positive, confirming that the type of effect of the anode and cathode potential change during discharging is correctly predicted by Equation (
9), and since
, the potential variation at the anode tends to dominate the shape of the overall voltage drop. The values of
and
are always close to one, and this is also consistent with their definitions; in particular, since
, the maximum amount of virtual lithiated compound at the anode is estimated to be slightly less than at the cathode.
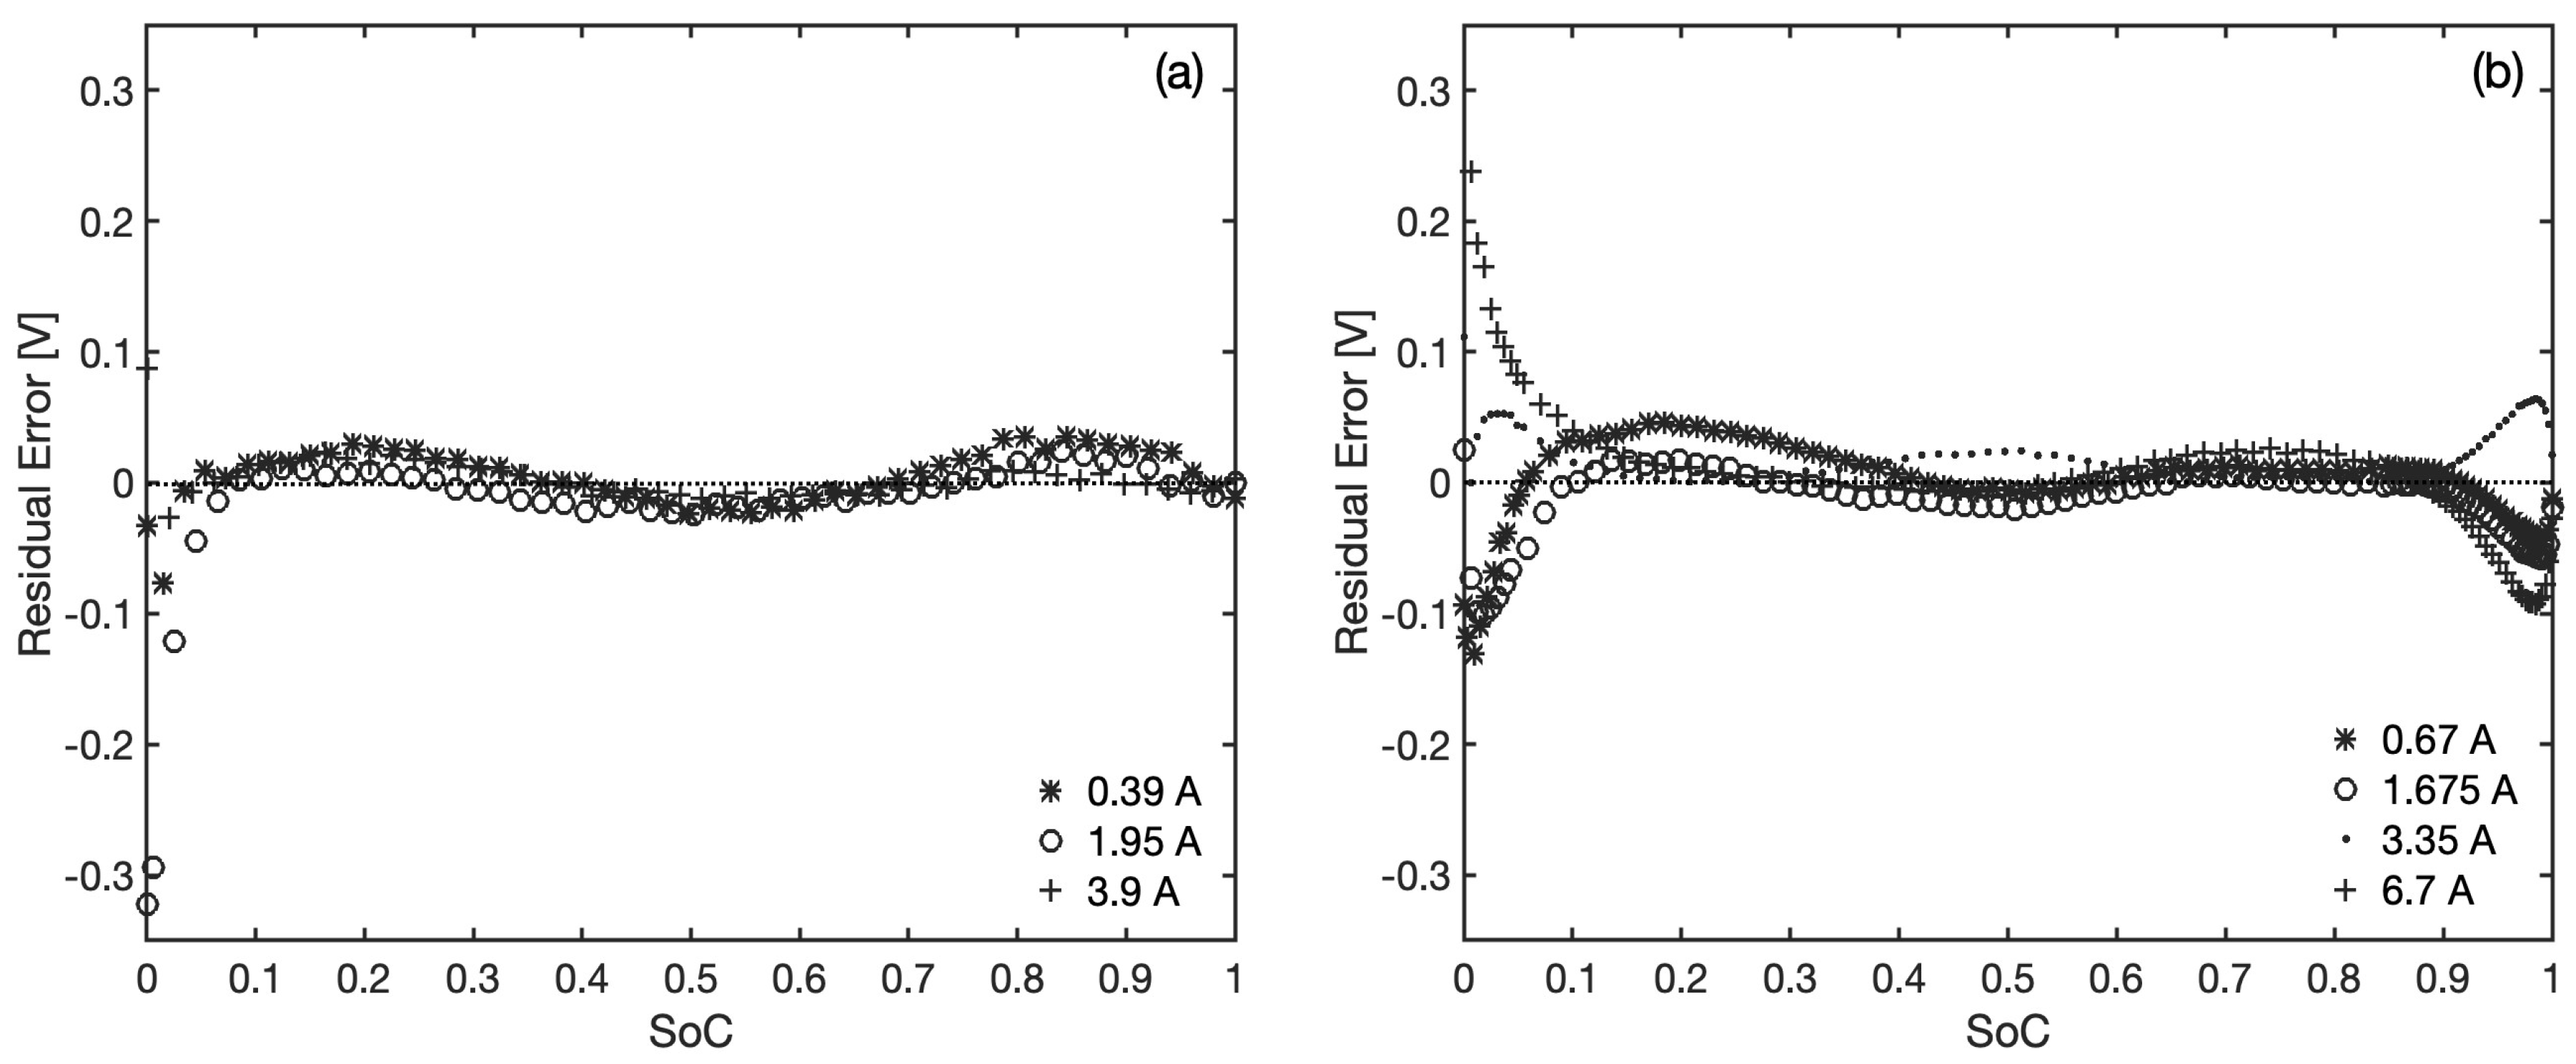
The region revealing the highest discrepancies between the observed voltage and predictions is the one at low
values, and this is particularly evident when referring to the residual errors in
Figure 6, reported separately for each set of data. Two main reasons could be behind this. On one hand, there are difficulties in extracting an accurate estimation of the maximum available capacity for each current, due to some of the discharge curves of the second battery crossing each other near full depletion conditions. Such uncertainties produce a larger relative error at low
values in the light of Equation (
8). On the other hand, the linear increase adopted for the internal resistance of these two batteries may not be sufficient to take into account the dissipative phenomena taking place near battery depletion, suggesting that non linear correlations for
may benefit (at least numerically) the model accuracy in this region; this aspect is addressed in more detail in
Section 3.5. For the rest of the
range, clear patterns can be observed in the residuals, which fluctuate in a rather predictable way around zero (overall mean residual error is
V and
V, respectively). This is certainly a reflection of the discrete jumps in the chemical activities of the electrode materials in real batteries due to phase transitions, whereby the nature of the proposed model denies such discontinuities and provides for a smoothing of the voltage curves. The largest errors caused by these simplifications are found in the initial discharge stages of the NCR18650B battery (see residuals at low
in
Figure 6b), and in particular, this can be attributed to the solid phase activity in the anodic lithiated graphite at the start of the discharging process [
35].
3.4. Model Reduction
Based on the best-fit parameter values reported in
Table 1, it can be observed that for both batteries, it is
or
, indicating that the anode is the limiting electrode for the total capacity so that there is nearly no lithium left at the anode at the end of the discharging phase. This is not necessarily a general result and does not necessarily reflect what happens in real batteries, and lacking external information on the quantitative composition of the electrodes, it is considered here merely as a numerical outcome. Based on this result, however, a useful simplification can be introduced in Equation (
9) without a significant loss in model accuracy:
which corresponds to reducing the actual number of parameters from 4 to 3.
This model reduction introduces a minor theoretical inconsistency, i.e., the activity at the anode becomes zero already at the cut-off voltage, as can be verified in Equation (
6) by putting
(from
) and
(from
), causing the battery voltage to approach negative infinity. This is a consequence of the nearly infinite slope of the voltage curves near battery depletion and the consequent difficulty for the model to discriminate between cut-off capacity and zero voltage capacity. This inconsistency is not expected to have practical consequences, since the battery operation beyond the cut-off voltage is usually irrelevant but requires the exclusion of the cut-off voltage condition during the non-linear optimization of the reduced model, as this would otherwise produce an infinite error.
3.5. Charging and Discharging Cycle
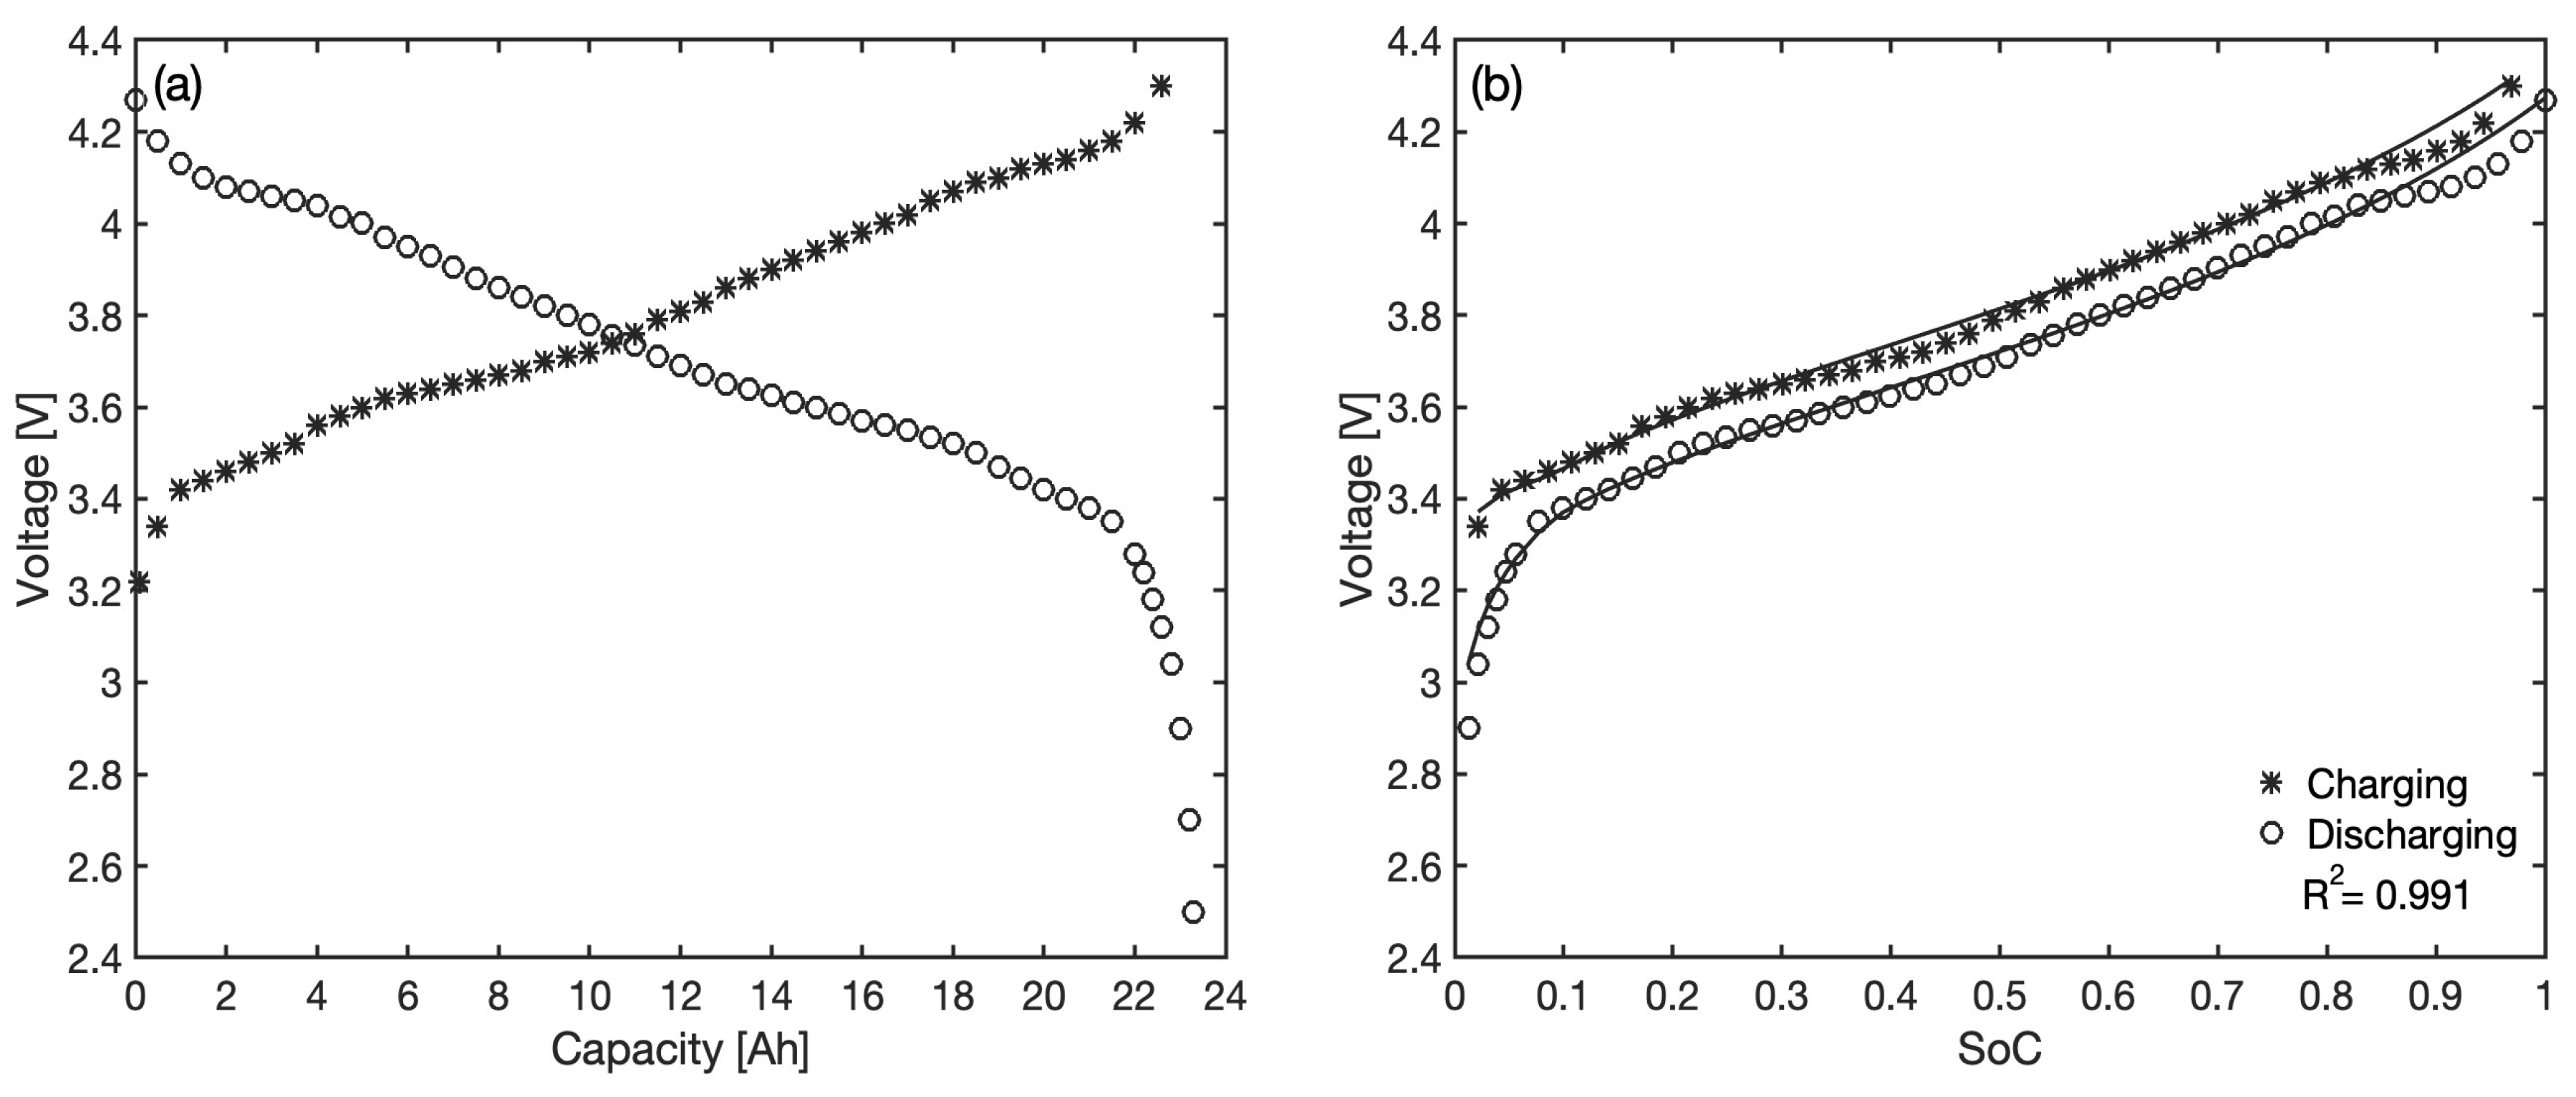
To test the model performance through a full charge–discharge cycle, the Tesla 4680 battery cell was considered. Designed by Tesla for use in their own electric vehicles and stationary energy storage systems, this cell has a total capacity of 23.35 Ah and is at the forefront of the current technological developments in the Li-ion battery sector. The materials used for the electrodes are lithiated graphite at the anode and nickel manganese cobalt (NMC) oxide at the cathode [
37]. For the voltage characteristic curves during charging and discharging as a function of the battery charge, the ones obtained at a constant current of 2.5 A at the Laboratory for Energy Storage and Conversion, University of California San Diego, and made available in [
38] have been used; these are shown in
Figure 7a.
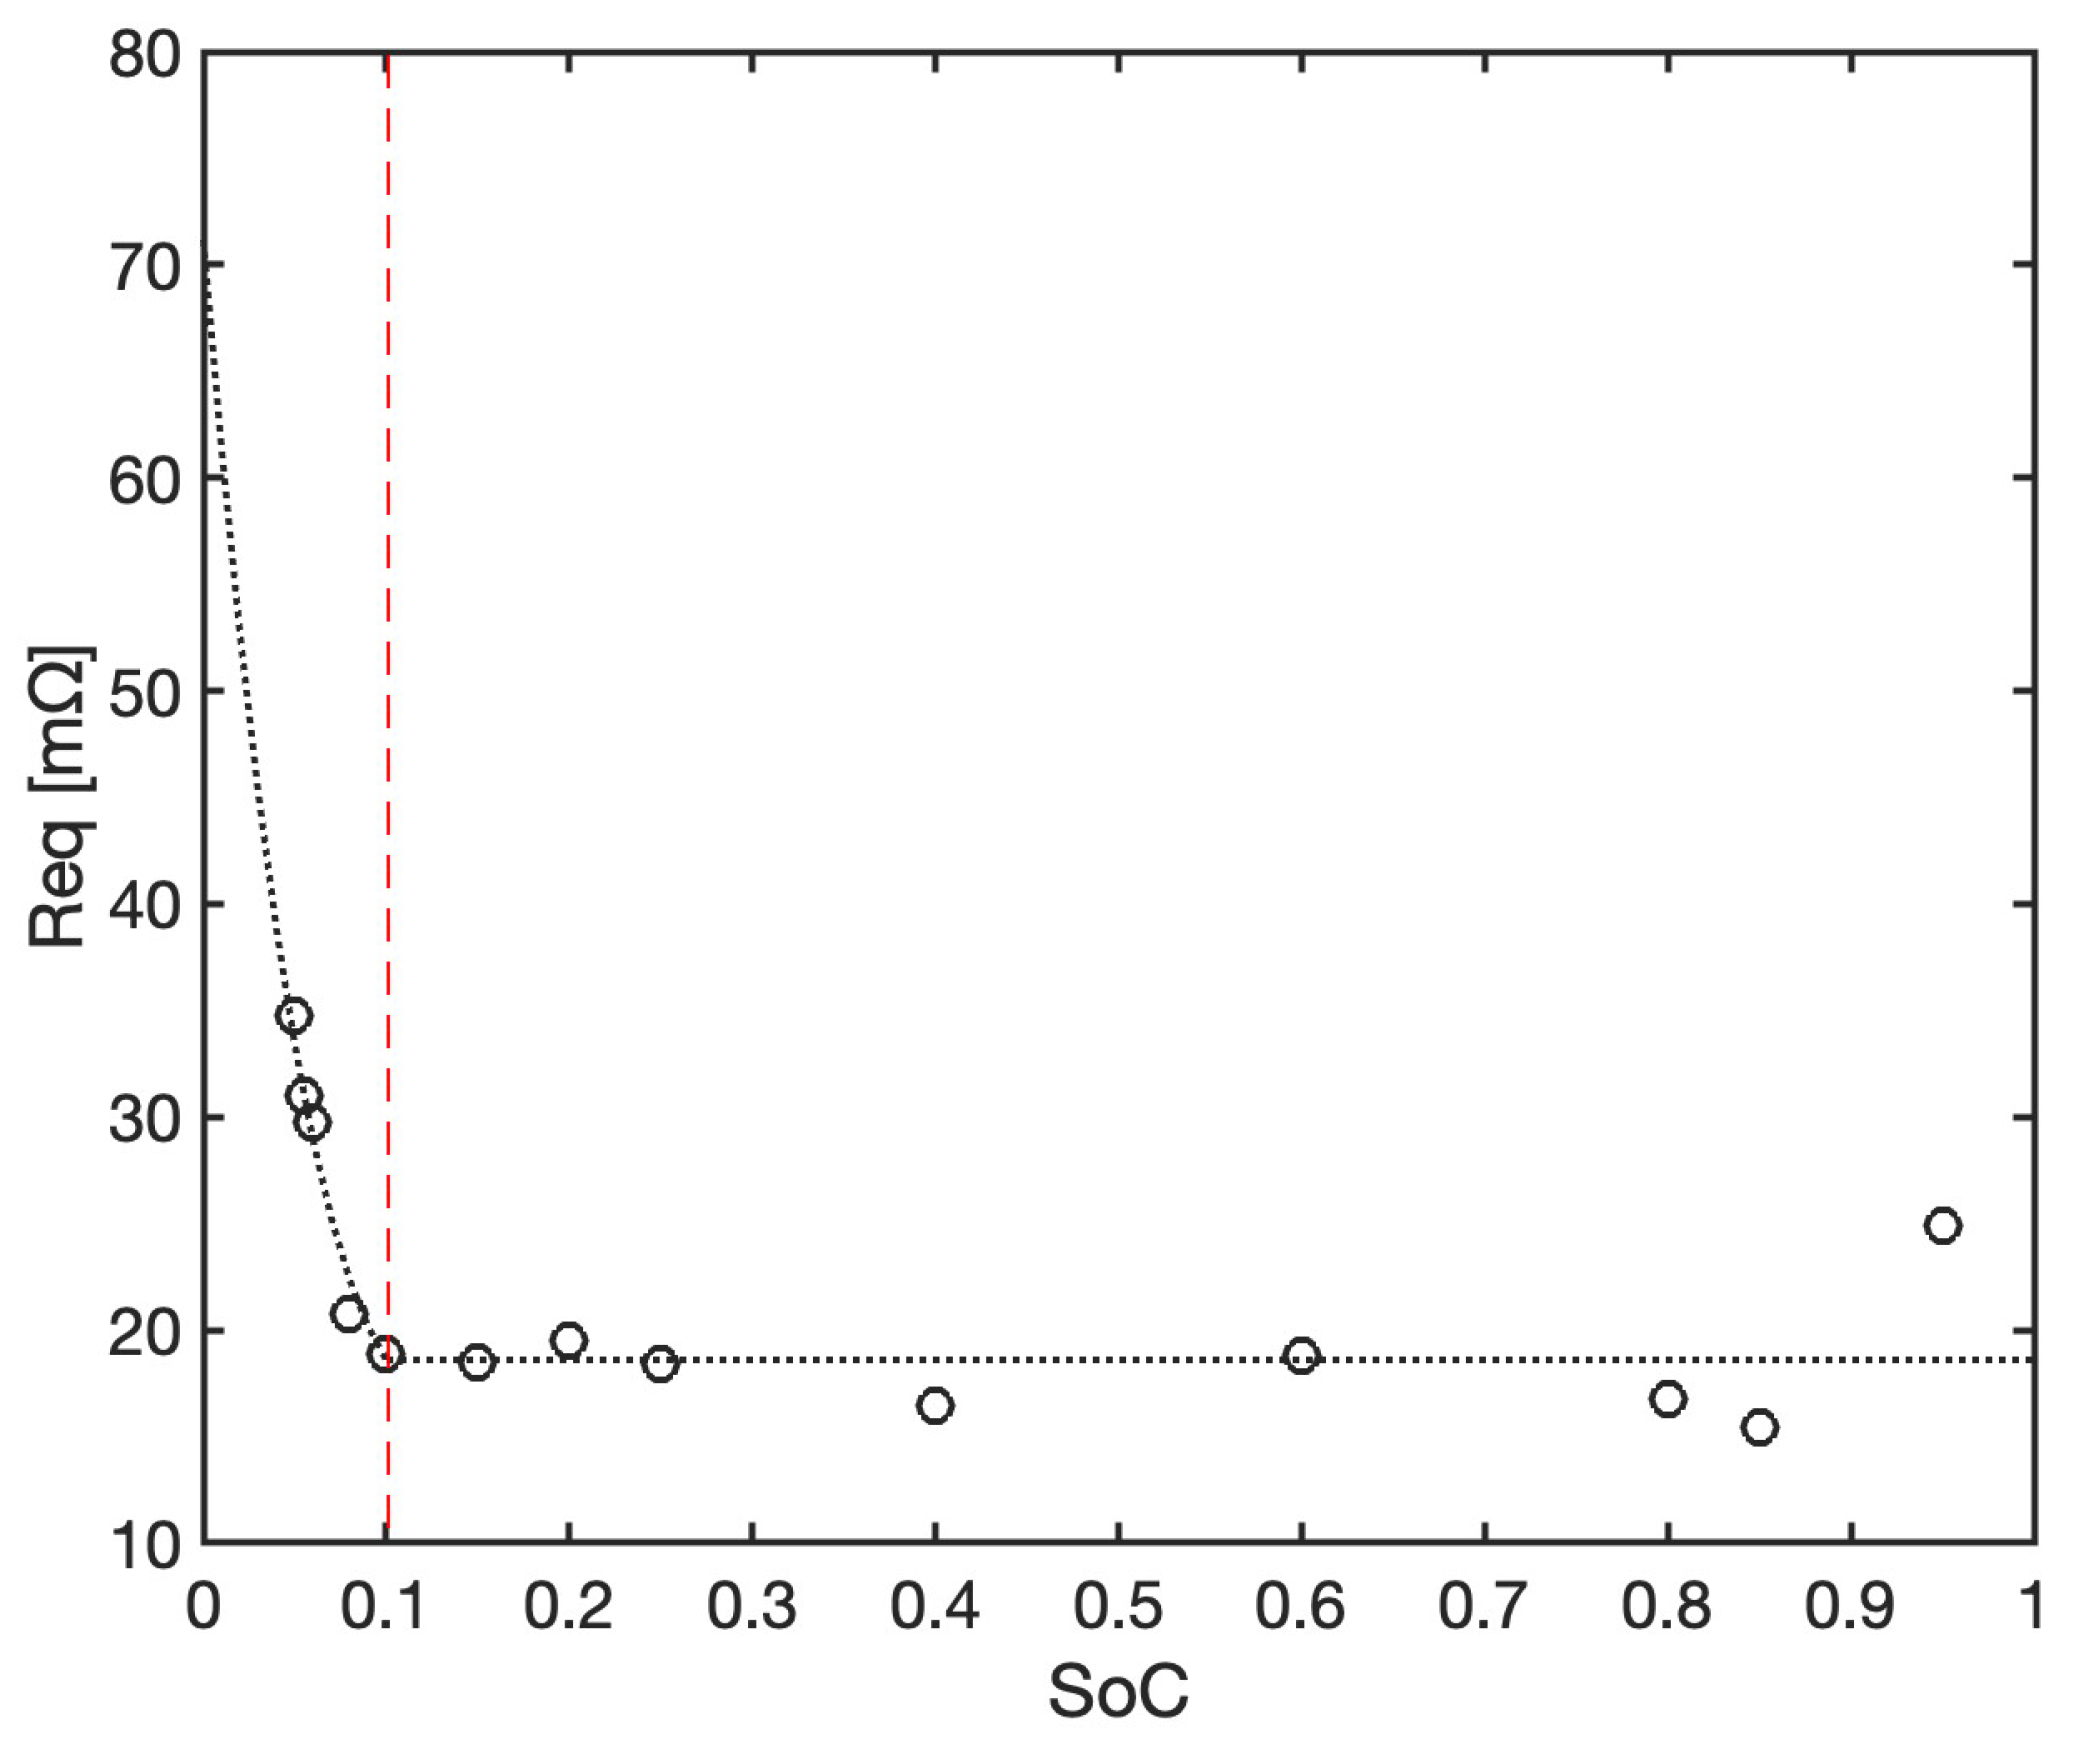
This allows for an estimation of the internal resistance at different
values as a function of the measured voltage difference
between charging and discharging, considering that
is invariant to the current, and, by means of Equation (
10), we obtain
where the absolute value of
I must be used. The resulting
is shown in
Figure 8, where it oscillates in most of the
range without a clear trend, so that the average value of 18.6 m
can be considered to be representative. However, the abrupt increase at
is not to be neglected if good model accuracy is also required in that range (such range is often avoided by real battery operation in order to preserve battery life, but its accurate prediction still significantly contributes to the effectiveness of the EMS). Therefore, the internal equivalent resistance will be expressed here as
The plateau value of 18.6 m
is on the lower end of the typical impedance values expected for a Li-ion battery, but the general trend is consistent with what has been found experimentally in direct measurement campaigns of the internal pulse resistance carried out on the Tesla 4680 cell [
37], where a sharp increase is also observed near fully discharged conditions.
The open circuit voltage at fully charged conditions,
, can be estimated in the light of Equation (
10) and of the plateau value of the equivalent resistance found earlier:
where
V is the voltage at
during discharge, and
A is the applied current.
The open circuit voltage has been described by applying the reduced version of the model (Equation (
12)), following preliminary tests that also revealed, in this case, no significant loss in accuracy compared to the full model (Equation (
9)). To this goal, and as discussed in
Section 3.4, the voltage data at
have been disregarded during the optimization procedure, both during charging and discharging.
The comparison between observed voltage and model predictions is reported as a function of the
in
Figure 7b for both charging and discharging phases. A very good level of overall accuracy is reached (
) by using the following best-fit parameters:
= 18.31,
= 3.69 and
= 1.28. The parameter values are reasonably aligned with the two previous batteries; however, no straightforward conclusions can be drawn from their comparison since they mostly reflect intensive electrode properties (
and
are stoichiometric ratios, and
is a capacity ratio) and are, therefore, affected in a way difficult to predict by differences in the materials used and the overall technologies employed (the Tesla battery, for example, benefits from much more recent developments in the sector compared to the Panasonic batteries).
The overall mean residual error is V and the large prediction errors observed at low for the Panasonic batteries are now absent, confirming that the choice of a non-linear correlation for adequately absorbs the model limitations in this range and greatly improves the local accuracy. On the other side, the error at approaching one due to material phase transitions in the electrodes remains evident for both the discharging and the charging curves. This is expected as it mostly stems from the inability of the proposed model to describe individual phase transformations in the electrodes.
4. Conclusions
This paper presents a novel approach for estimating the voltage versus the state of charge of a Li-ion battery, primarily intended for batteries with second order phase transformations where other popular semi-empirical approaches for open circuit voltage modeling may not be easily applicable. The general aim of this investigation is to contribute to the enhancement of energy management systems in mobility and stationary energy storage systems, as in residential microgrids with energy production from renewable sources. The accurate prediction of the battery based on voltage measurements is considered a crucial feature in these systems.
The proposed model is based on the classical Nernst equation to describe the continuous change in the open circuit voltage during charging and discharging. All remaining effects and uncertainties are lumped into one linear term representing energy dissipations under load conditions. The model calibration is based on data usually made available from the manufacturer’s datasheets or from voltage measurements, without the need for material characterization efforts.
The model has been applied to describe two Panasonic cylindrical cells in order to test its ability to correctly predict the voltage under different current loads and to the Tesla 4680 battery cell to describe a full charge–discharge cycle. All tested batteries have cobalt-containing cathodes, although with different compositions and capacities. In all three cases, the fit appears to be good quality with values above 0.98, and the model is able to catch and correctly reproduce all main features of the voltage curves. Considerations on the values of the best fit parameters suggest a possible reduction in the complexity of the model, with the number of unknown parameters reduced from 4 to 3.
Major deviations between model predictions and observed values only onset at very high and very low values. These are mostly due to the model not accounting for individual phase transformations in the electrodes (in the first case) and uncertainties in the estimation of the equivalent internal resistance at a very low charging state (in the second case), although other unaccounted for phenomena may contribute as well.
Furthermore, the applicability of the proposed model to batteries with cathodic materials not containing cobalt, particularly LFP type batteries and all those characterized by a main voltage plateau, remains unexplored at the time of writing and may require specific adjustments to take into account the different solid phase thermodynamics.

