Article

Impact of Energy-Related Properties of Cities on Optimal Urban Energy System Design

Department of Space, Earth and Environment, Energy Technology, Chalmers University of Technology, 41296 Gothenburg, Sweden
*
Author to whom correspondence should be addressed.
Energies 2024, 17(15), 3813; https://doi.org/10.3390/en17153813
Submission received: 8 May 2024 / Revised: 19 July 2024 / Accepted: 26 July 2024 / Published: 2 August 2024

Abstract

:
This study investigates how differences in energy-related properties of cities influence the composition of a cost-efficient urban energy system, assuming electrification of the transport and industry sectors and zero-emission of CO2. These differences are evaluated for two scenarios regarding the capacities of the modeled cities to import electricity. A linear optimization model that encompasses the electricity, heating, industry, and transport sectors, using measured data from six cities in Sweden, is applied. Results show that when strict constraints on electricity imports are enforced, cities with a lower ratio of annual electricity demand for heat encourage the implementation of power-to-heat solutions in the heating sector. This study also reveals that under such stringent electricity import conditions, cities with a high level of flexibility in electricity demand favor a combination of batteries and solar photovoltaics as opposed to biomass-based electricity production. Conversely, when electricity importation is less restricted and biomass prices surpass 20 EUR/MWh, local electricity generation is outcompeted by imports, and large-scale heat pumps working in tandem with thermal energy storage dominate the heating sector in all modeled cities. This assertion holds true when the maximum electricity import capacity is utilized up to 5000 h annually.

1. Introduction

Cities have an important role to play in addressing climate change, as urban areas contribute to over 70% of annual global greenhouse gas emissions [1]. Many cities worldwide have therefore committed to reducing fossil emissions and becoming carbon-neutral [2]. Electrification, the process through which electricity replaces fossil fuels, has been identified as one of the main potential mitigation options, in particular for the industry and transport sector [3]. It is expected that a significant portion of the required electricity will be supplied by volatile renewable electricity (VRE) generation [4], given the declining costs of wind power and solar power in particular. However, the intermittent nature of VRE, together with the anticipated surge in demand for electricity from the envisioned electrification, presents new challenges for traditionally inflexible urban energy systems. Sector coupling, which entails connecting energy flows across various sectors to enhance flexibility, can play an important role in facilitating the integration of large shares of VRE [5,6,7]. The spatial proximity of economic activities, the concentration of knowledge, and the existence of an energy infrastructure have highlighted urban areas as being especially suitable for sector coupling [1]. As examples, coupling the electric and heating sectors can facilitate local wind power production [8], flexible hydrogen production can utilize electricity generated from wind during periods of high production [9,10], flexible loads in residential buildings can reduce electricity demand peaks [11,12], and the availability of electric vehicles (EVs) can promote the penetration of photovoltaics (PVs) in cities [13]. Wang et al. [14] presented a comprehensive review of technological advancements and theoretical frameworks explored in the literature pertaining to sector coupling. Their analysis encompasses 27 different models deployed for investigating sector coupling dynamics, with particular attention to the electricity, heat, cooling, transport, and hydrogen sectors. Additionally, Ramsebner et al. [15] offer an in-depth exploration of sector coupling as a concept, accompanied by a comprehensive survey of scholarly endeavors within the field.
The coupling of the heating and electricity sectors has garnered increasing interest in the literature, for example, as seen in [16,17,18,19,20]. Arabzadeh et al. [16] have investigated decarbonization strategies that incorporate a high share of renewables in the greater Helsinki area. They concluded that the flexibility measures offered by closer connections between the heating and electricity sectors enable a higher share of VRE, although the trading of electricity between regions is also necessary for a complete transition away from fossil fuels. In another study, De Chalendar et al. [17] examined the potential benefits of developing closer ties between heating, cooling, and electricity in an urban setting. They modeled a fully electrified district heating and cooling network with large-scale thermal energy storage (TES) and quantified the climate-related benefits that could be achieved. Their study demonstrates that tightly coupling the electricity and heating sectors, together with smart scheduling of energy usage, can result in a 65% reduction in CO2 emissions compared to a gas-based energy system. Similarly, Pensini et al. [18] have shown that electricity generated from VREs, together with heat pumps (HPs) and TES, can provide a highly cost-efficient alternative to conventional district heating systems. Eguiarte et al. [19] instead provided a comparison between heat pumps and nonelectric heating systems to decarbonize the building sector. Their study indicates that for areas with high fossil electricity mixes, heat pumps are not necessarily the most efficient choice of technology. Bloess et al. [20] provided an exhaustive review of technologies and modeling approaches and identified flexibility potential as obtained from research endeavors concentrating on the possible synergies between the heating and electricity sectors. Their study concludes that heat pumps and thermal energy storage appear particularly important when combining these two sectors.
Benefits associated with integrating EV charging into the city energy system are another aspect of sector coupling that has been extensively researched, for example, as demonstrated in [16,17,18,19,20]. Heinisch et al. [21] and Huang et al. [22] both demonstrate that EV smart charging control measures are an important factor in utilizing the potential system benefits of EVs in cities. Bartolini et al. [13] studied the potential for self-consumption of electricity in areas with a high penetration of solar power in combination with EVs. The results indicate that an EV penetration of 10% participating in vehicle-to-grid discharge in the studied city is sufficient to eliminate the need for exporting electricity surplus. In a similar study, Pastore [23] investigated the impact of combining strategies for EV charging with power-to-heat on solar PV self-consumption, district self-sufficiency, system cost, and CO2 emissions in an urban setting. They concluded that the combined implementation of smart EV charging and power-to-heat could benefit the system both economically and environmentally and could provide a cost-efficient alternative to stationary batteries.
Other studies have focused on the exchange between local and national energy systems and how this relationship impacts the possibilities for sector coupling [24,25,26]. Pilpola et al. [24] concluded that a stronger connection between local and national levels is more important in a zero-carbon scenario compared to scenarios where CO2 is allowed to be emitted. In another work, Thellufsen and Lund [25] investigated the connection between city and national energy systems and suggested a methodology to quantify how well these systems are integrated. The methodology, based on how efficiently excess electricity is exchanged between the two systems, was applied to two different cities in Denmark. They concluded that the method “can potentially be applied in designing energy plans that can utilize the benefits of local action and national coordination”. Heinisch et al. [26] explored the potential for increased local electricity production through coupling of the electricity, heating, and transport sectors in a Swedish city for four different levels of electricity connection capacities between the city and the regional electricity supply. The results indicate that reducing the electricity import capacity to 50% of peak demand has only a minor impact on the total system cost, whereas higher connection capacities are required for the city to support the integration of regional wind power. Sneum et al. [27] applied a similar approach, but instead focused on how a limited biomass supply impacts sector coupling between heat and electricity. Their work reveals that the diminishing availability of biomass prompts a transition away from combustion-based methods toward power-to-heat technologies. However, their findings suggest that this shift may not invariably translate into diminished CO2 emissions or reduced prices for the heat consumer.
Although extensively explored, prior investigations of urban sector coupling often overlook a critical aspect: the impact of divergent city characteristics on study outcomes. Even when situated in similar geographical regions, cities can manifest substantial disparities in their energy related properties, such as varying levels of industrial energy requirements, accessibility of industrial waste heat, overall heat demand, and potential for VRE within and around the city. Differences in these properties can influence the makeup of the optimal portfolio of electricity and heat generation technologies in the city and may provide important insights for future city planning. Lund et al. [28] have addressed some aspects of this issue in their work on large-scale urban VRE implementation, but they only chose to consider two cities with markedly different characteristics: Helsinki and Shanghai. In another study, Liu et al. [29] categorized 28 cities in China based on their structure and energy intensity and suggested different pathways toward zero emissions for each category based on the LEAP-modeling framework. Other work elucidating the potential for sector coupling in cities with different characteristics includes [30], comparing sector coupling in China and Costa Rica using the IRENA flex tool, as well as [31], comparing the potential for sector coupling through solar PV and electric vehicles for three different cities in France.
The current study adds to the existing literature by incorporating a novel emphasis on variations in energy-related city characteristics and their implications for sector coupling across electricity, heating, transport, and industry sectors within a unified model. Notably, prior research has largely overlooked this relationship. The study utilizes empirical data from multiple cities and the implementation of a linear optimization model with high temporal resolution. Furthermore, the study explores two distinct assumptions regarding electricity import capacity into the city, further enriching the analysis. Thus, the main research question addressed in this work is as follows:
What are the main energy-related properties of cities that influence the cost-efficient composition of an urban energy system under strict carbon constraints, for different electricity import capacity levels?
Answering this question enhances our understanding of the roles of different technologies and decarbonization strategies for different types of cities without the need to model the energy system of each individual city. In addition, the answer can be applied to reduce the size and complexity of the problem for energy system modelers who are investigating the impacts of cities on the national energy transition.
The model input is based on data from Sweden, although the conclusions drawn should not be seen as limited to this geographic context. Instead, the study aims to represent any urban environment with an existing district heating network and a seasonal heat demand, such as Northern and Eastern Europe and parts of North America.

2. Materials and Methods

2.1. Model Description

The applied linear optimization model is based on the developmental work of Heinisch et al. [8]. The model was later refined [21] to include different charging strategies for EVs. For the purpose of this work, the model has been further extended to include industrial processes, such as electrolyzers and electric arc furnaces (EAFs), so as to capture the dynamics of industrial electricity demand.
The applied model minimizes the total system cost in a Year 2050 fossil-free city energy system and adopts a greenfield approach. Thus, no pre-existing production technologies or storage systems for heat and electricity are assumed to be in place, and all investment decisions are made based on the energy demands of the modeled year. The optimization is carried out for one full year with an hourly resolution. Figure 1 provides a schematic representation of the model, including the required demand input as well as the available production and storage technologies. All the demand input is provided exogenously, for which the model finds the most cost-efficient solution based on available technologies and electricity imports.
The objective function in the model aims to minimize the total system cost and can be written as:
M I N   :   C t o t = i I C i i n v + C i O M f i x s i + t T C i r u n ( p i , t + q i , t ) + c i , t s t a r t + c i , t p a r t l o a d + t T C t i m p w t i m p  
In this expression, C t o t is the total system cost that is to be minimized, C i i n v represents investment costs, and C i O M f i x is the fixed operational costs for all technologies (i). The sum of these factors is multiplied by the installed capacity ( s i ) of each technology. The running cost ( C i r u n ) is multiplied by the sum of the produced electricity ( p i , t ) and heat ( q i , t ) at each timestep (t) for each technology. The starting cost ( c i , t s t a r t ) is the cost associated with starting additional power plants, while the part-load cost ( c i , t p a r t l o a d ) is calculated based on the difference between the power plant capacity currently in operation and the actual production level for each timestep. These two costs are included as variables in the model. The cost of imported electricity ( C t i m p ) is multiplied by the import level ( w t i m p ) for each timestep.
At all time steps, the produced electricity and heat must match the demand. For electricity, this can be written as:
D t e l + b t c h + E V t c h + i I P t H q i , t η i + D c o n s t + H 2 t e l + E A F t e l i I e l p i , t + b t d c h + w t i m p + E V t V 2 G  
The left-hand side of this equation is the sum of the assumed demand inputs: hourly city electricity demand ( D t e l ) ; charging of stationary batteries ( b t c h ) and EVs ( E V t c h ) ; and the electricity for power-to-heat (calculated as the heat produced divided by the technology efficiency, ( q i , t η i ). In addition, three types of industrial electricity loads, chosen to represent different levels of demand flexibility, were included: electricity at a constant level from new industrial establishments ( D c o n s t ); electricity to the electrolyzers ( H 2 t e l ) ; and electricity to the EAFs ( E A F t e l ) . The sum of the electricity demands is, for each timestep, less than or equal to the sum of the produced electricity ( p i , t ) plus the discharge from stationary batteries ( b t d c h ) , imported electricity ( w t i m p ) , which can have a negative value to allow for export), and the discharge from EVs through vehicle-to-grid ( E V t V 2 G ) .
Similarly, for heat:
D t h e a t + i I T E S h i , t c h i I H q i , t + i I T E S h i , t d c h + W H t i n d
Here, the fixed hourly heat demand ( D t h e a t ) plus the charging of TES ( h i , t c h ) is always less than or equal to the sum of the produced heat ( q i , t ), discharge from TES ( h i , t d c h ) , and the industrial waste heat ( W H t i n d ) , for each timestep. Table 1 includes all other constraints implemented in the model and their mathematical formulation. Table 2 provides an explanation of all the symbols used in the equations.
A full mathematical formulation of the applied model is available at: https://bitbucket.org/chalmersenergysystems/city_model_public/src/main/, accessed on 1 July 2024.

2.2. Modeled Cities

The modeled cities, based on data sourced from various urban areas in Sweden, were chosen to represent a wide range of characteristics in terms of levels of industrialization, population size, heating demand, and the projected establishment of new industries. These attributes, together with the amount of available data, provided the basis for the selection of suitable cities. Table 3 offers a description of the main energy-related properties of the cities pertinent to the results of this study, with more detailed information provided in Supplementary Table S2. It is important to emphasize that the primary objective of this research was not to provide precise predictions for the future trajectories of specific cities. Instead, the focus was on examining how the energy properties of cities impact the electrification of urban energy systems in a broader sense.

2.3. Demand Input Data

As indicated in Figure 1, the demand input data for the six modeled cities consists of five different elements: the current type of electricity demand as of 2019 together with new demand from EVs, industry, hydrogen, and heat. The resulting annual electricity demands are displayed in Figure 2.
The current type of electricity demand, consisting of the demand from the current type of end-users, is assumed to increase by 20% for all cities until the year 2050, relative to the levels in the year 2019. This is largely an effect of the projected population growth. The hourly electricity demand profiles, obtained from the Swedish TSO Svenska Kraftnät for each city, are thus multiplied by a factor of 1.2 in the model. This additional electricity demand is referred to as city growth in Figure 2.
For EVs, it is assumed that the entire car fleet in the year 2050 will be identical in size to that in the year 2019 for each city, albeit consisting exclusively of EVs. In the year 2050, 30% of the cars are assumed to participate in vehicle-to-grid discharging, with this percentage being deliberately chosen as conservative so as to avoid overestimating the role of flexibility in the transport sector. For computational reasons, the EV fleet is modeled as an aggregated battery, with charging patterns and availability based on Taljegård et al. [33].
The electricity demands from the electrification of industry and planned new industrial establishments are estimated from existing predictions [34,35]. For certain cities, as indicated in Table 3, part of this electricity demand is added in the form of hydrogen demand or EAF operation, enabling industrial flexibility. Electricity demand from data centers, battery factories, and the electrification of the current industry is included as an exogenously determined constant hourly value, thus offering no demand flexibility.
The heat demand for the cities is based on measured hourly production data from local district heating companies for the year 2019 currently operating in the modeled cities. The heat demand in 2050 is modeled to be the same as the level in 2019, based on the assumption that the effects of energy efficiency measures, climate change, and population growth will result in a relatively stable heat demand over time. As the measured input data is based on actual heat production, it also includes losses in the district heating network.

2.4. Technology Data and Electricity Import Price

The techno-economic values for the available production and storage technologies are taken from the Danish Energy Agency [36], as it provides investment costs similar to those of the IEA [4], whereas it provides more detailed descriptions of the technologies that are suitable for an urban environment. The projected investment costs and technical lifetimes for the year 2050 have been used, as seen in Table 4 and with further details in Supplementary Table S1. The investment costs for HPs and TES have intentionally been assigned values corresponding to the upper uncertainty for the year 2050, as predicted [36], so as not to overestimate the penetration levels of these technologies in the modeled cities.
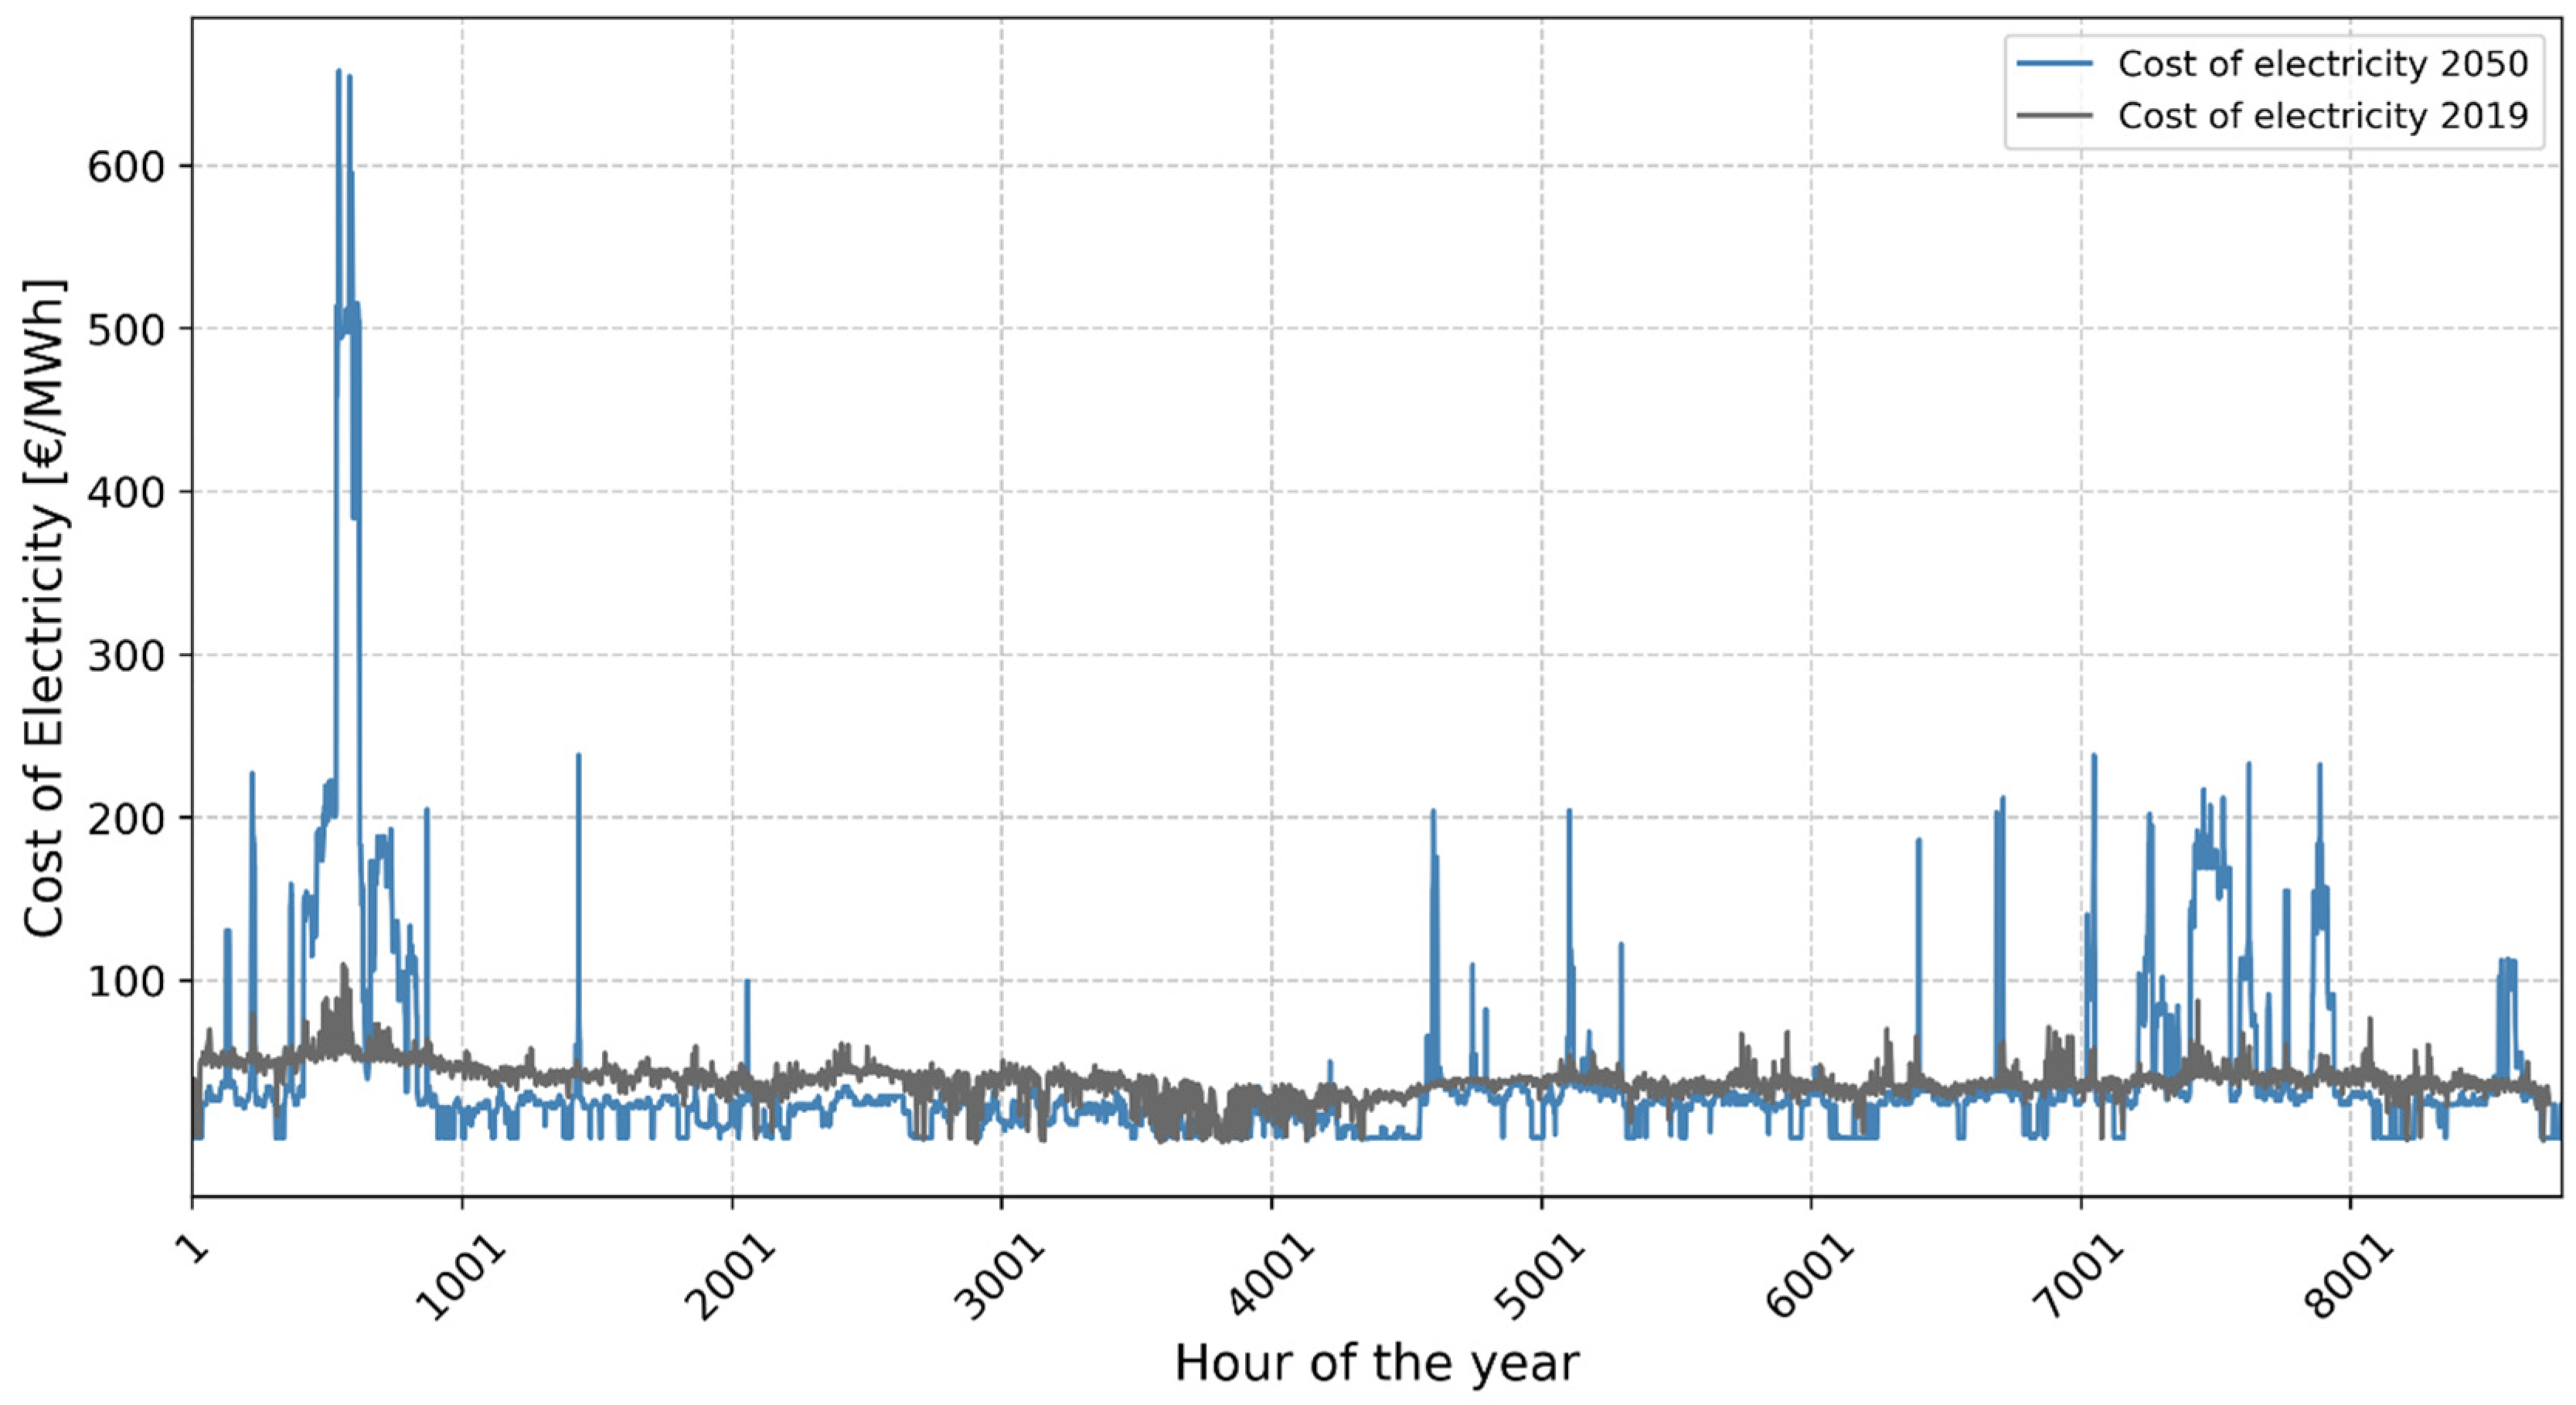
The cost of electricity imported into the city, as illustrated in Figure 3, is based on a model of northern Europe that was originally formulated by Göransson et al. [32], and subsequently developed further by Öberg et al. [37] to include future projections for industrial electrification and a higher share of power-to-heat within the heating sector compared to 2019. This linear investment optimization model applies a greenfield approach (similar to the city modeling in the present work) to the year 2050’s energy system for northern Europe, assuming no CO2 emissions. The model includes the projected future electricity, heat, and transportation demands and has been run based on weather data for the year 2019 to match the demand patterns implemented in the present work. The resulting long-term marginal cost of electricity, as illustrated in Figure 3, is the result of a production mix that is largely dominated by wind power and hydropower, with nuclear power and solar PV in neighboring regions. This marginal cost of electricity from the external model has been used as the import cost of electricity for the modeled cities in this study. As a reference, Figure 3 also includes 2019 spot market prices. The spikes in 2050 prices result from periods of high net load when electricity is generated using technologies with high marginal costs, such as gas turbines in single and combined cycles. This was not necessary to the same extent in 2019 due to the lower overall electricity demand compared to 2050. Taxes and other fees associated with the electricity grid are not included.

2.5. Modeling Scenarios

As the present study aims to investigate the impacts of the energy-related properties of cities with varying electricity import capacities, two main scenarios have been implemented: low and high electricity import capacities. The only difference between these scenarios is the restriction on maximum import and export levels. In the scenario with high import capacity, we assume that the electricity import capacity is the sum of the electricity peak demand recorded in the year 2019 (adjusted for projected city growth) and the additional average load from EVs and new industrial establishments. The high import capacity scenario is intended to mirror a future scenario in which the import capacities of cities are increased through continuous grid expansion to a level similar to that existing today, excluding the electricity demand for heating determined by the model. In the low import capacity scenario, the import capacity is limited to 60% of the value in the high import capacity scenario, and represents a future scenario with limited additional grid expansion. We selected these two scenarios to encompass a broad, plausible range of future electricity import capacities, recognizing the considerable uncertainty surrounding the expansion of grid capacity.

2.6. Result Clustering

To facilitate the grouping of modeled cities based on optimization results, a k-means clustering algorithm was employed. This algorithm was applied to normalized output data from the optimization model, comprising installed capacities and production volumes of cost-optimal heat, power generation, and storage technologies within each city. The clustering process aimed to minimize the squared distance between each city data point and the centroid of the cluster to which it was assigned. The number of clusters was determined exogenously.

3. Results

The modeling results are presented in four sections. First, cities are categorized into clusters according to their optimal way of supplying heat as given by the model, followed by a similar grouping based on the optimal electricity supply in the modeled cities. Thereafter, the connections between the energy-related properties of the city and the modeled results are explored, before the Results section concludes by presenting the impact of the biomass price on the modeled results in a sensitivity analysis.

3.1. Cost-Efficient Heat-Supply Technology Combinations

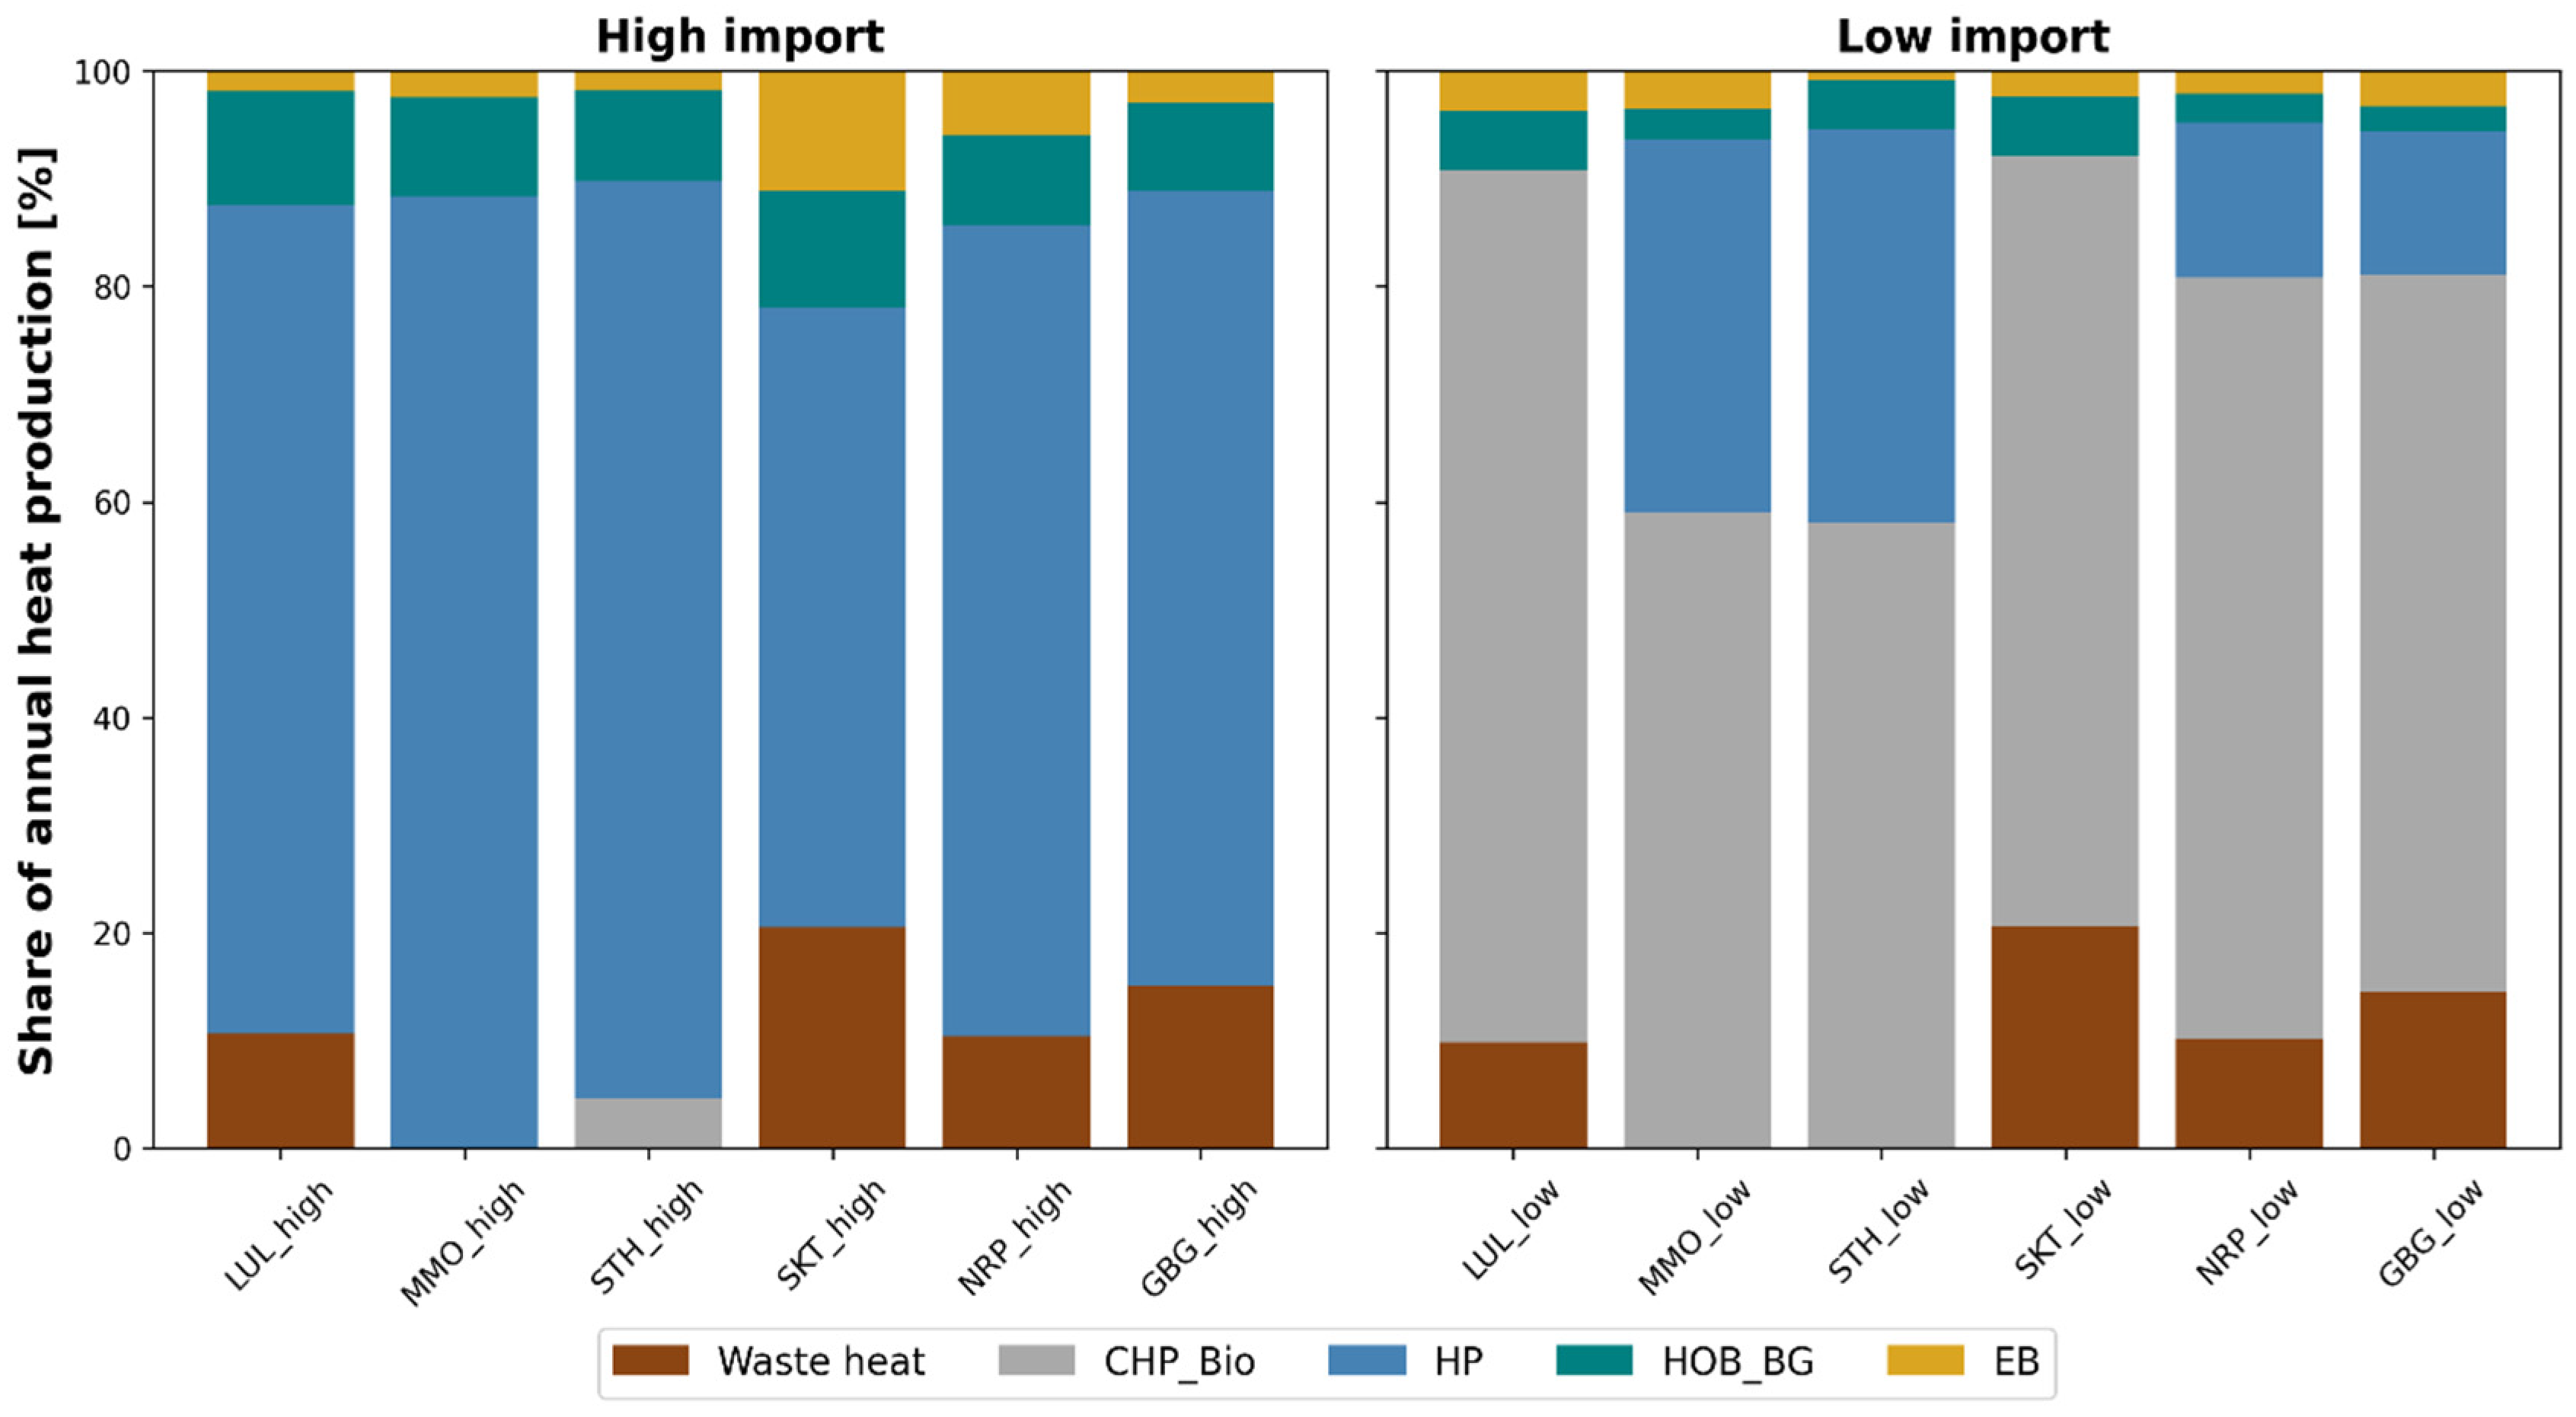
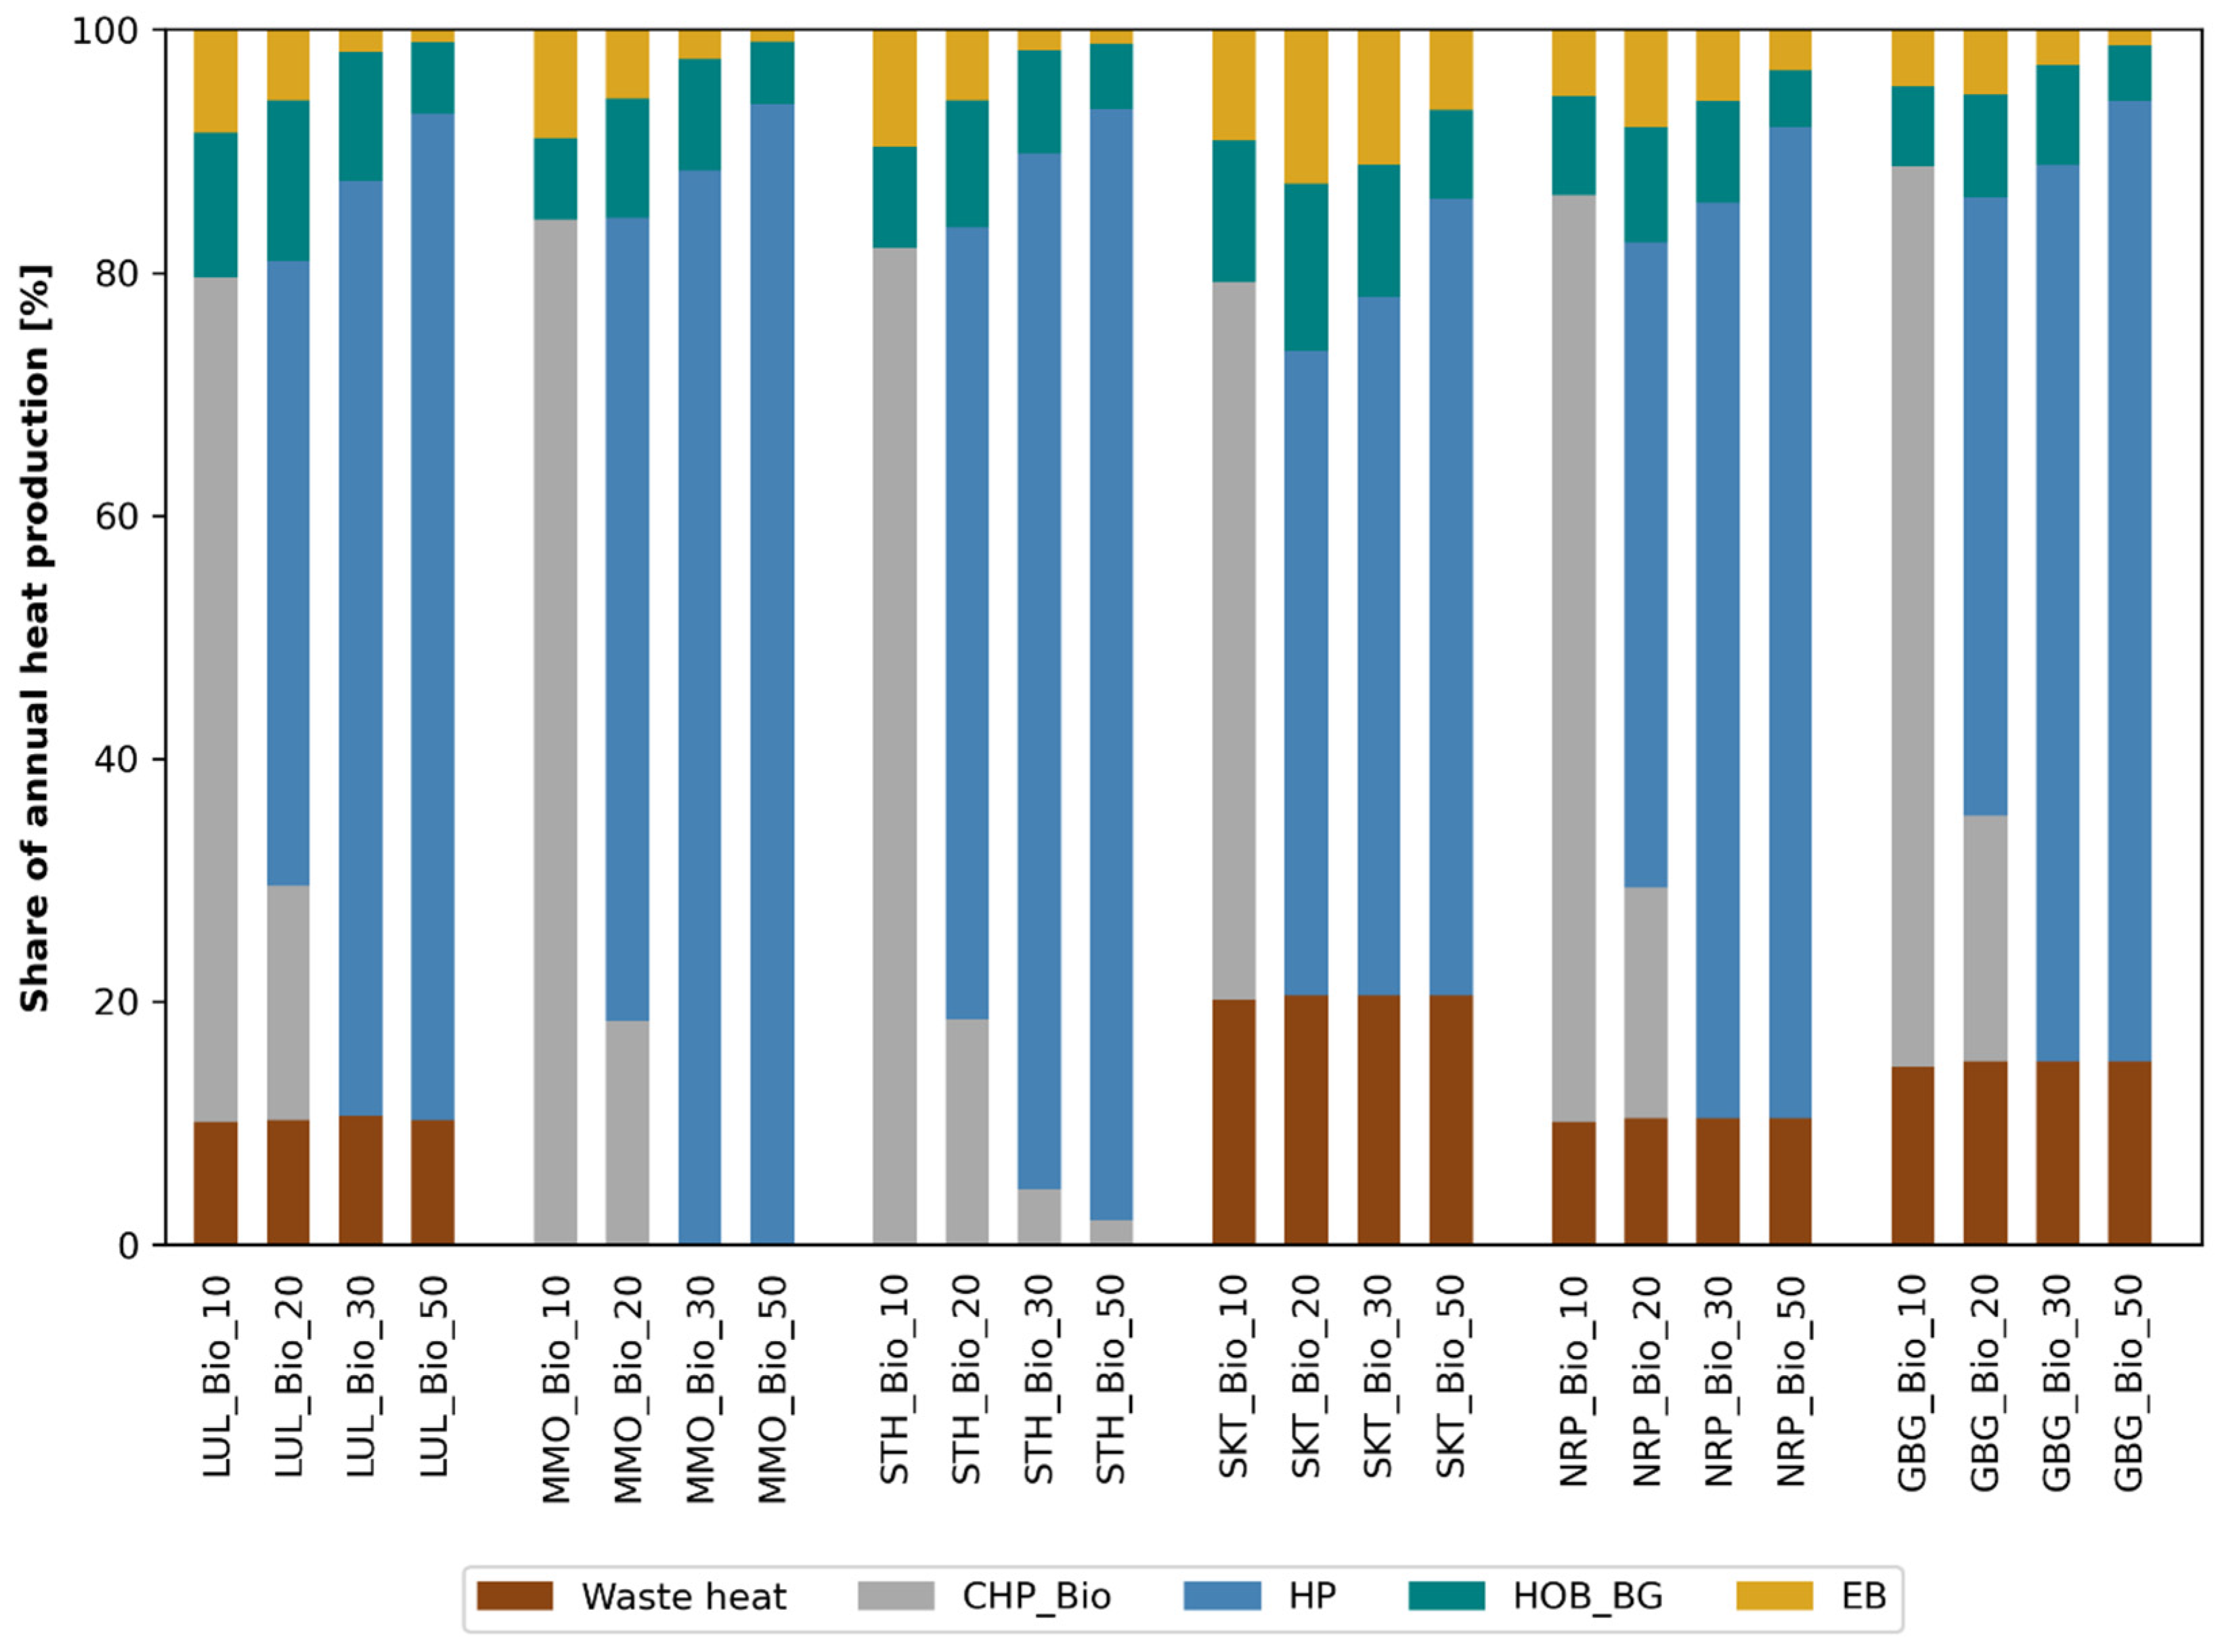
Figure 4 illustrates the supply of heat in the district heating systems of the 12 modeled cases (six cities and two import capacity scenarios). As can be seen in the figure, when the import capacity is high, large-scale HPs coupled with the district heating network dominate the heat supply. The tendency to favor a heating system based on power-to-heat is considered an effect of the availability of electricity generation at low marginal costs, especially from wind and hydropower, in the surrounding electricity system. In contrast, when the import capacity is limited (low import), bio-based combined heat and power (CHP_bio) is the main source of the heat supply, complemented by HPs in some cities.
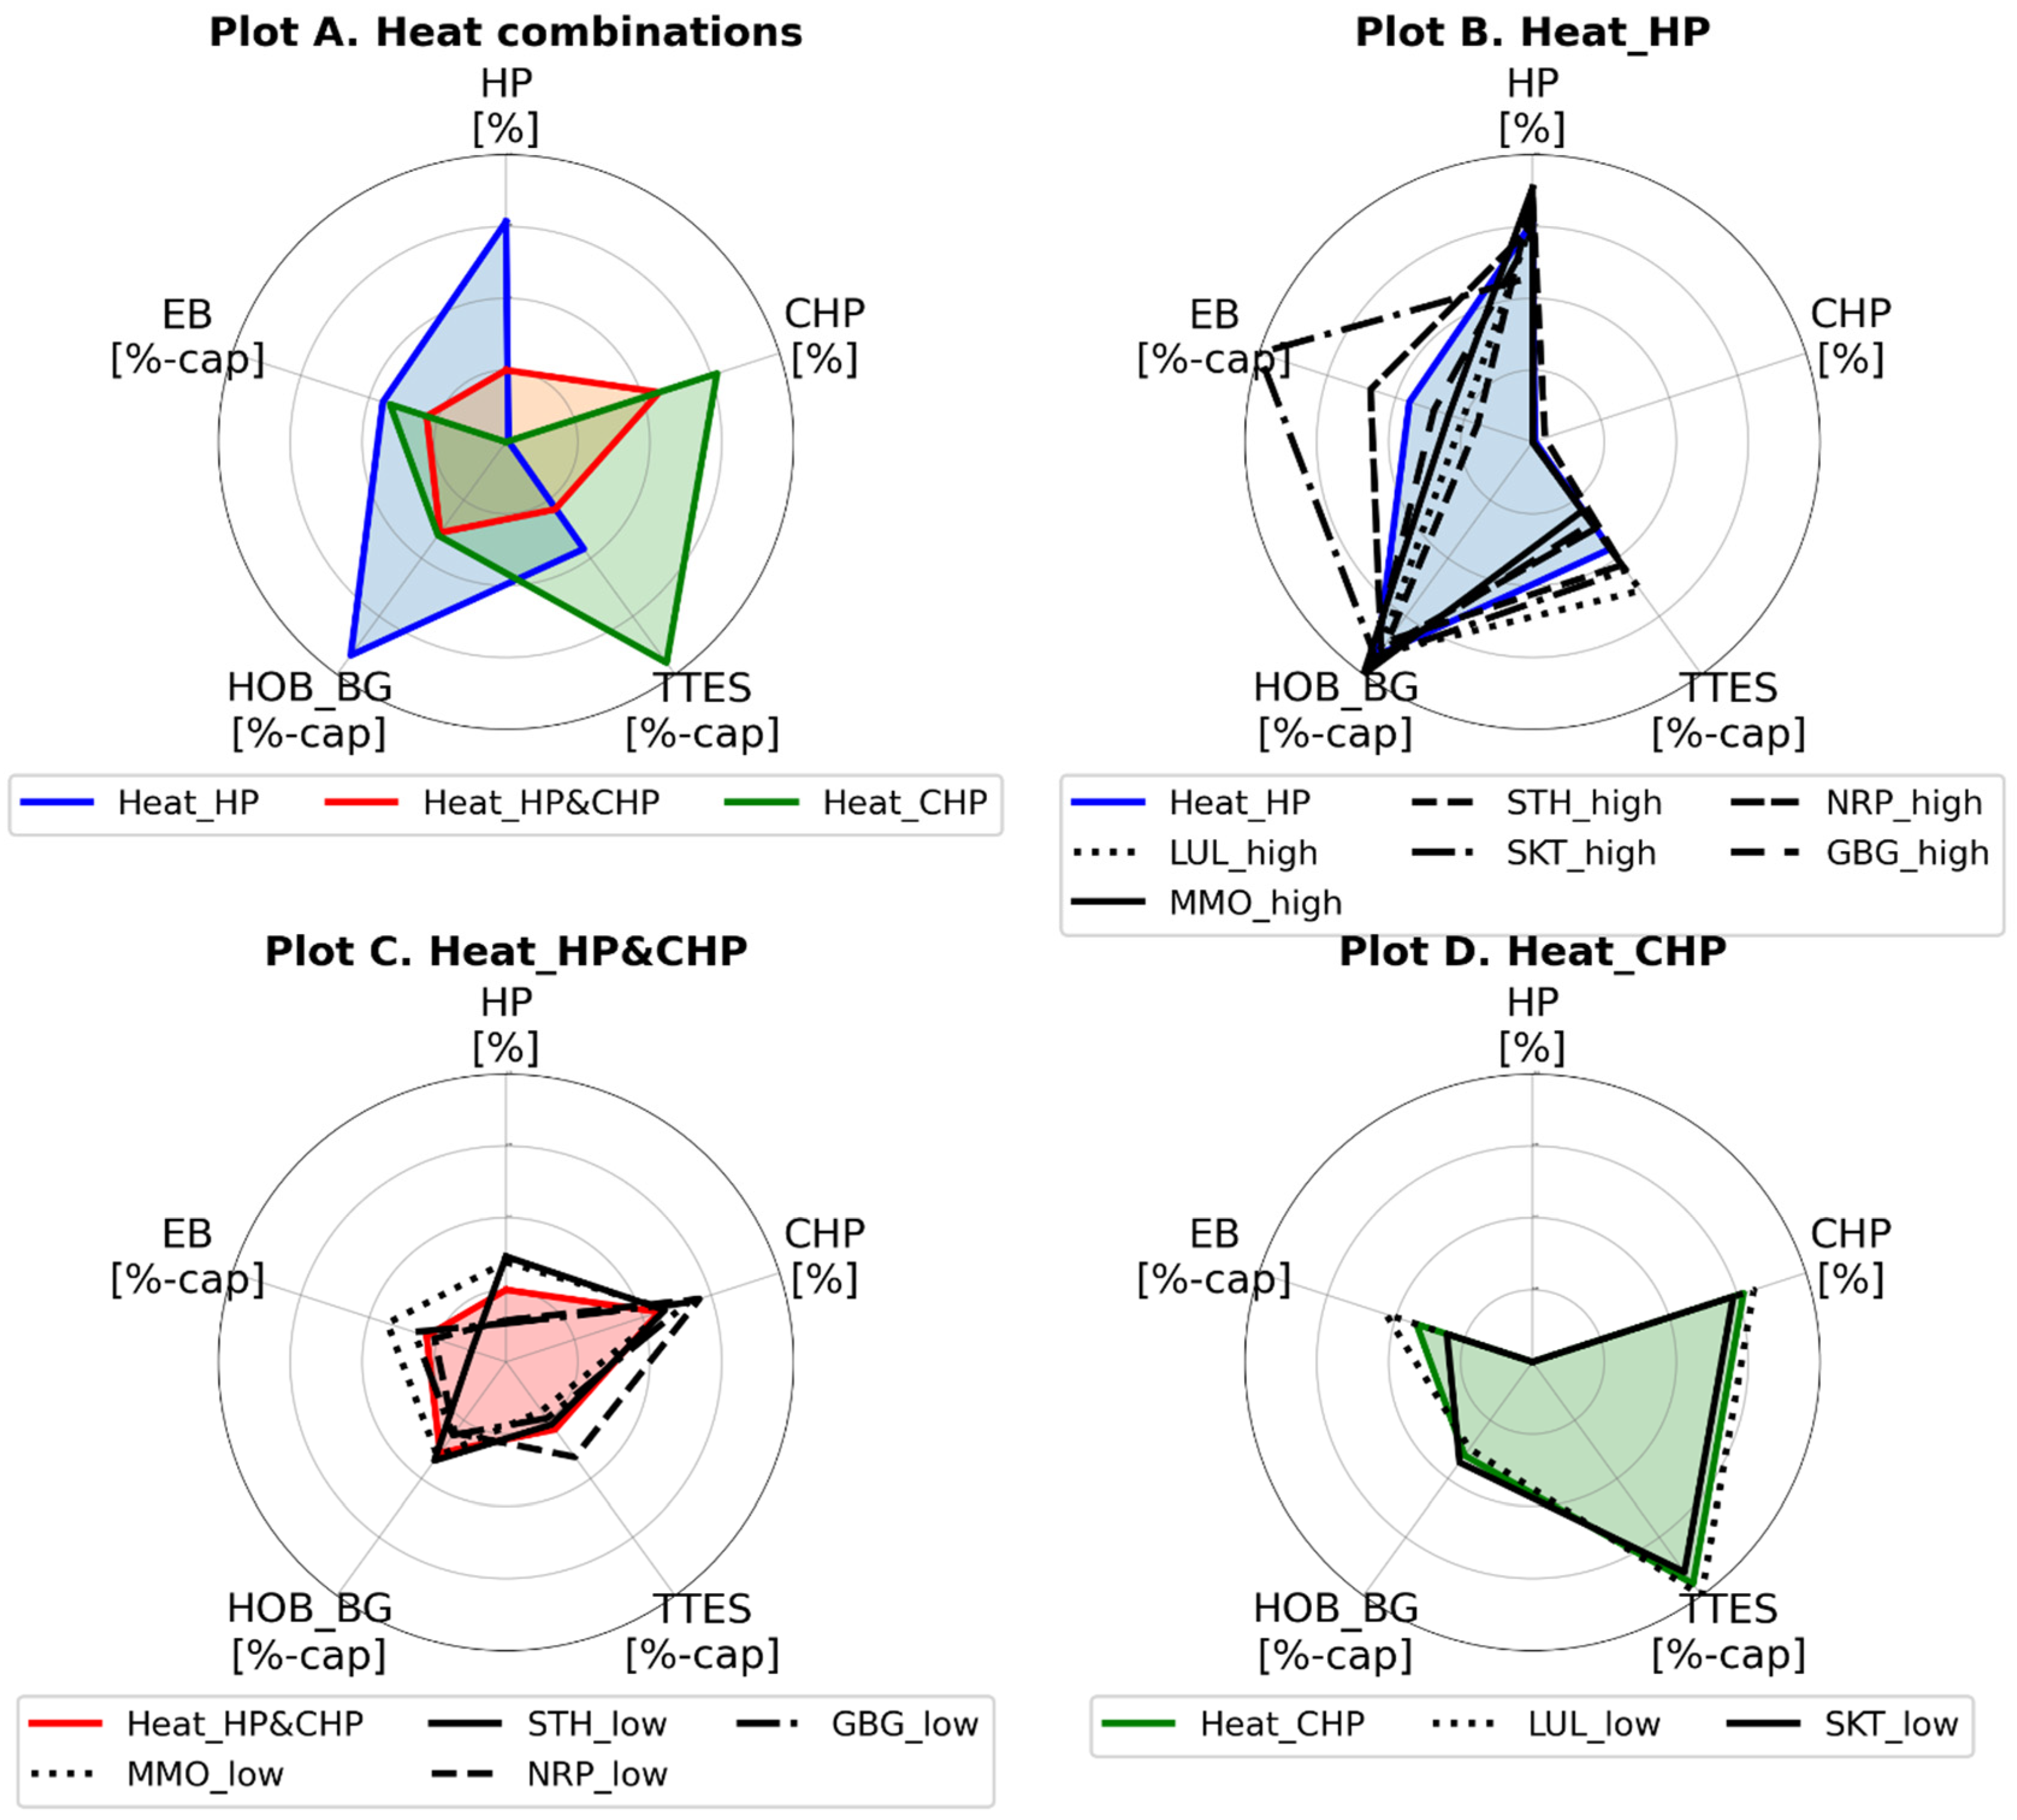
To group the 12 modeled cases based on their outputs, a centroid-based clustering algorithm was implemented, resulting in the radar plots presented in Figure 5. The clustering was based on the penetration in each city of five technologies considered key in characterizing the heating sector: HPs, electric boilers (EB), bio-based CHP (CHP_Bio), biogas heat-only boilers (HOB_BG), and TES. Given the different roles of these technologies within the district heating system, the radar plot incorporates dual scales. Specifically, for HP and CHP_Bio, which serve as the principal sources of bulk heat, the values presented on the radar plot denote the proportionate contributions to the overall annual heat production, expressed as percentages. The remaining technologies in the plot (EB, HOB_BG, and TTES) instead indicate the normalized installed capacity of each technology, indicated by %-cap in Figure 5. This enables the results for different modeling cases and technologies to be presented in the same radar plot.
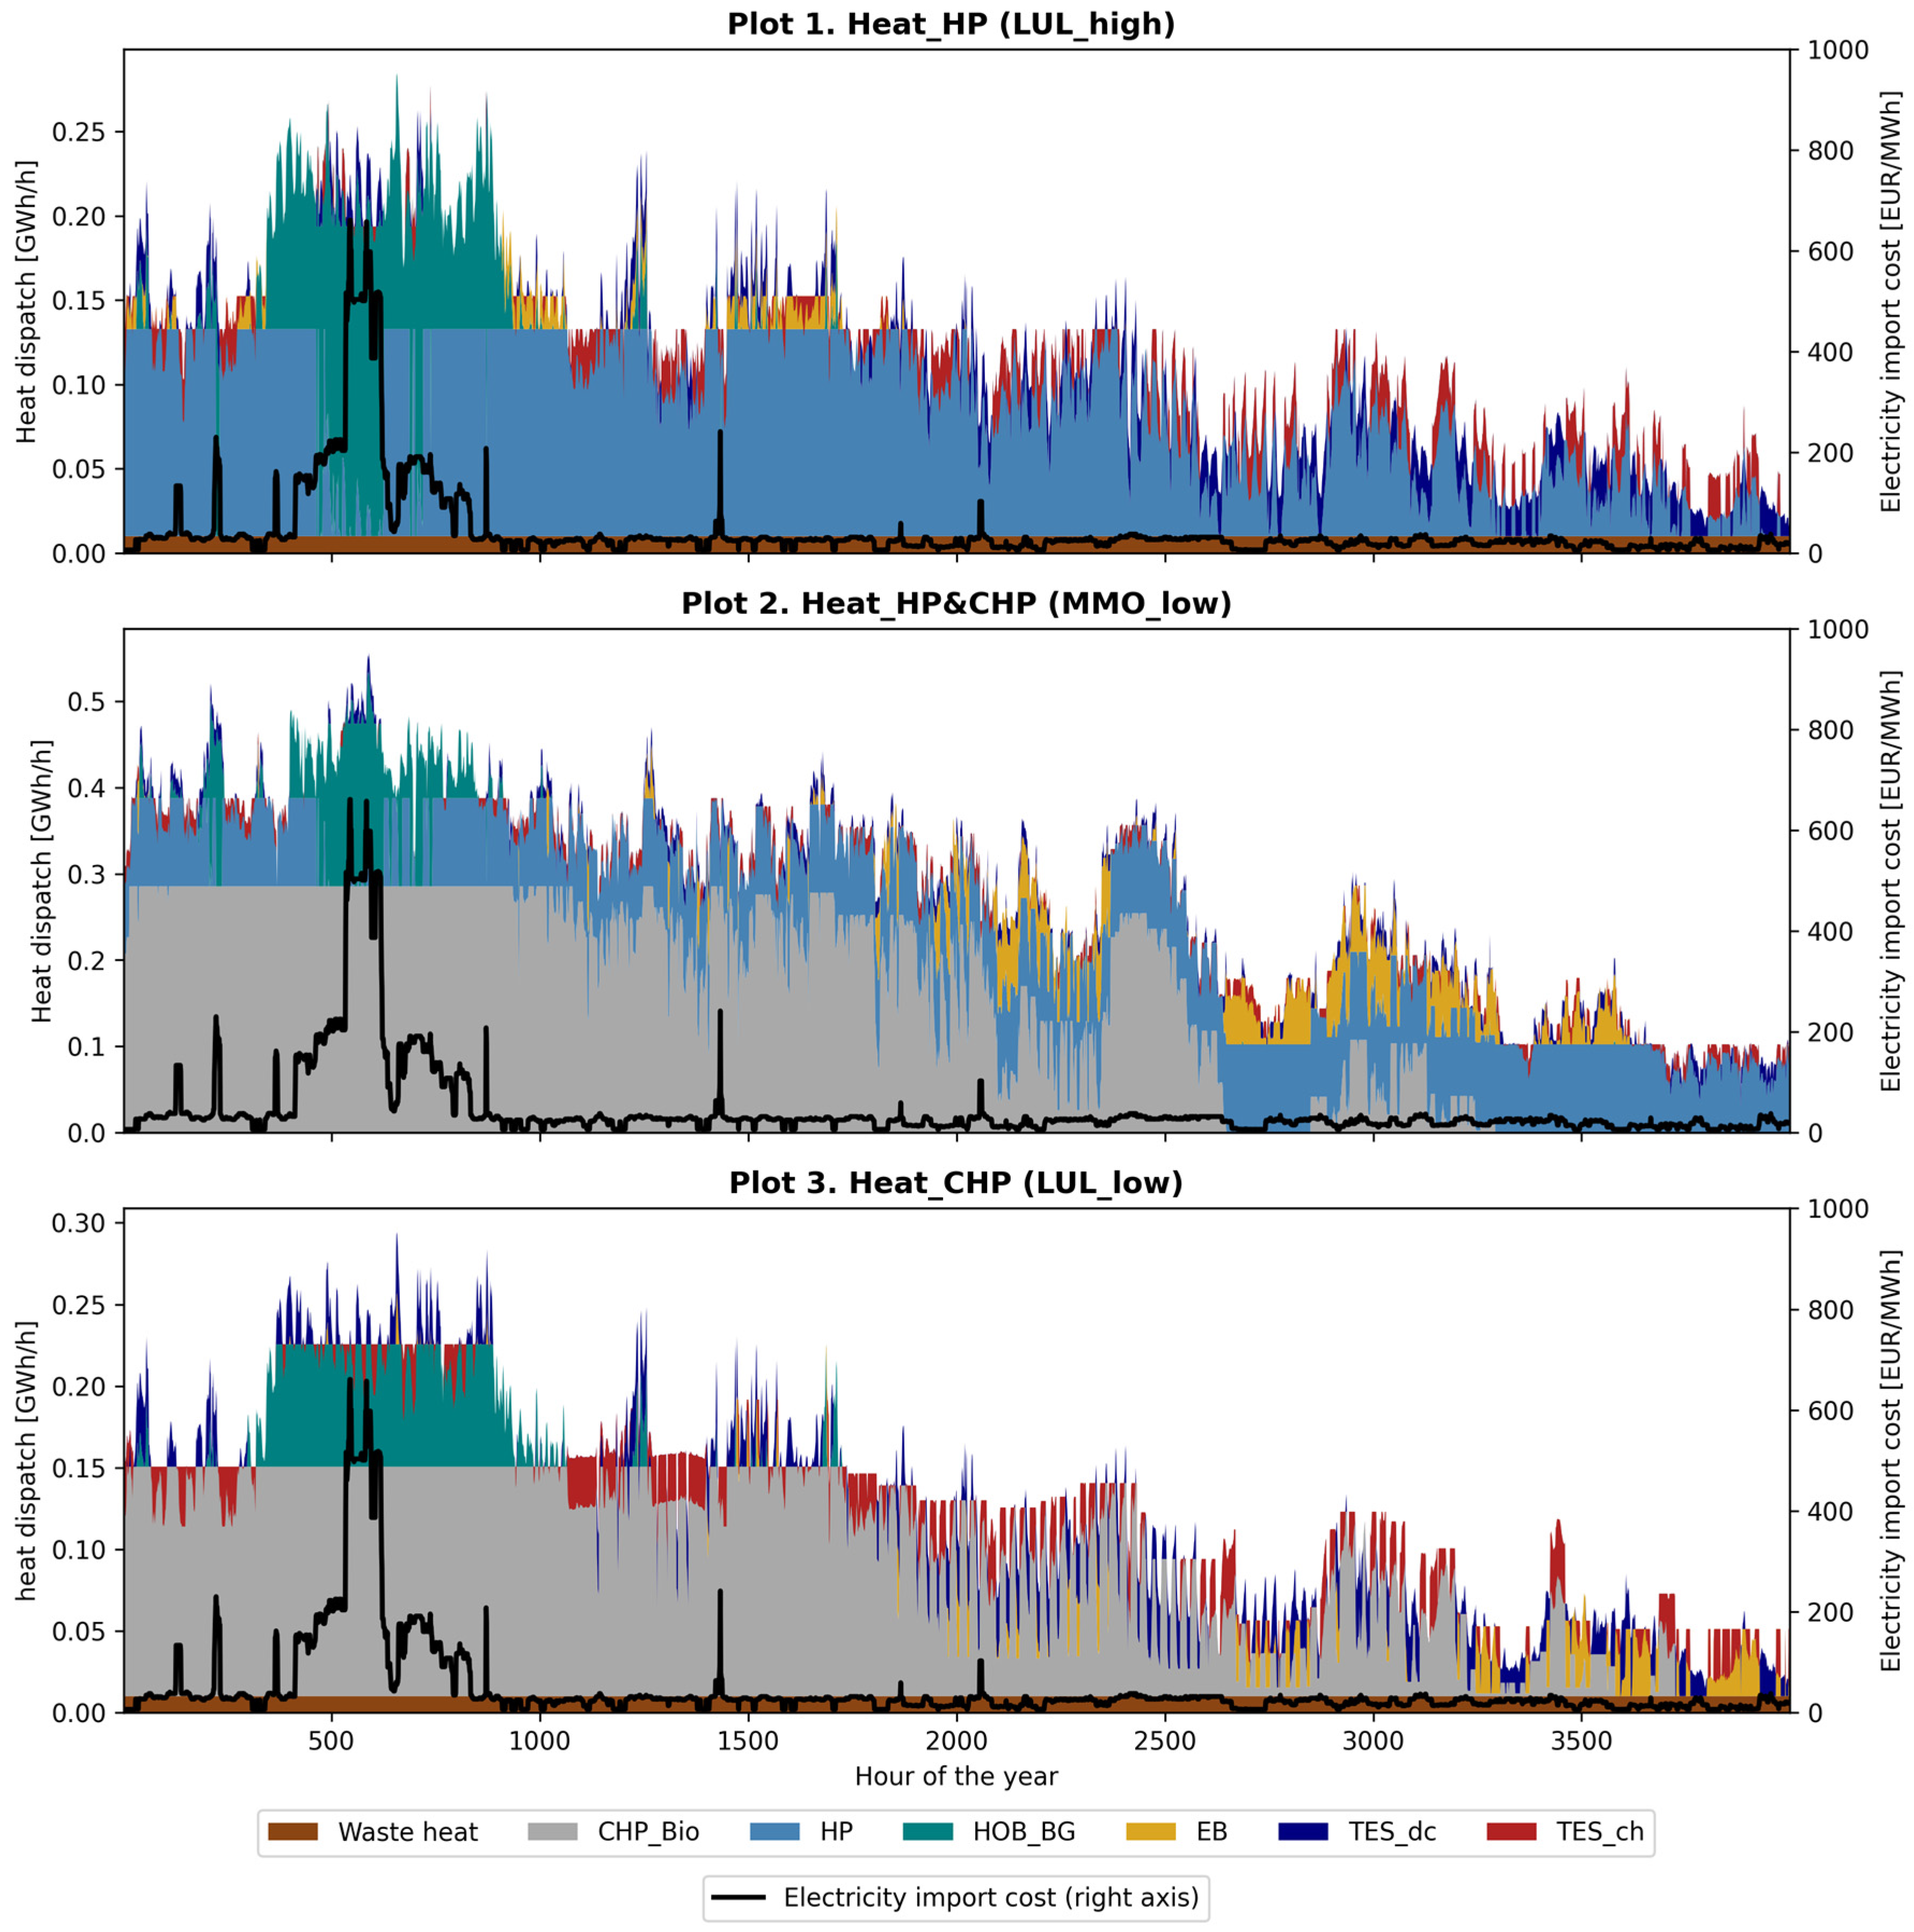
Figure 5 shows that from the 12 cases (six cities with high and low import capacities), three clusters were identified, with each cluster representing a technology combination that is characteristic of the cities within that cluster. Plot A displays the centroids of each identified cluster, while Plots B–D provide an overview of the results for all 12 modeled cases grouped according to their respective clusters. Figure 6 illustrates the dispatch of heat over 6 months of the year for three cases, each exemplifying one of the technology combinations in Plot A of Figure 5.
All the cities in the high electricity import capacity scenario can be associated with the heat technology combination Heat_HP, as depicted in Plot B in Figure 5. Here, the HPs act as the primary source of bulk heat during the year, with TES providing supplementary support to achieve a high number of full-load hours. This technology interplay is further illustrated in Plot 1 in Figure 6, which shows the dispatch of heat during a period of 6 months for one of the modeled cities (LUL_high) within this cluster. In this plot, it is evident that TES plays an important role as a flexibility measure, working in tandem with EBs and HPs to efficiently handle the heat demand fluctuations and to enable the absorption of low electricity prices from imports. Furthermore, Plot 1 in Figure 6 indicates that an increased capacity of biogas-HOB is required to cover the heat demand during longer periods of high electricity import costs (approximately Hour 500 in Plot 1), given that the other technologies are ill-suited to efficiently cover such a requirement. Drawing on observations from the same plot, it should also be highlighted that the cost-optimized operation of the heating sector does not contribute to an increased net electricity load during high electricity import cost events, despite the majority of the annual heat demand being based on power-to-heat.
The plot referred to as Heat_HP&CHP in Plot C in Figure 5 shows a technology mix that is characterized by a combination of both HPs and bio-based CHP, which together meet the bulk heat demand. This combination enables flexible reactions to fluctuations in electricity prices. This can also be seen in Plot 2 in Figure 6, which shows the heat dispatch of one of the cities (MMO_low) in this cluster. During periods characterized by low electricity import prices and low heat demand, HPs can effectively accommodate the bulk of the heat requirements. When electricity import prices and heat demand are high, on the other hand, the CHP plant can be operated at maximum capacity to meet most of the bulk heat requirements.
As can be seen in Figure 5, the cities in the Heat_HP&CHP cluster are further typified by a low optimal capacity of TES. There are two main reasons for this. First, the synergistic relationship between HPs and CHP systems affords enhanced flexibility, thereby diminishing the value of TES in terms of handling demand fluctuations. Second, the limited capacity of power-to-heat technologies constrains the potential for absorbing electricity at low import costs and storing this energy as heat.
The third technology mix, referred to as Heat_CHP in Figure 5, is distinguished by a large share of CHP providing the bulk of the thermal energy over the year. This is also illustrated in Plot 3 in Figure 6, which shows the heat dispatch for one of the cities (LUL_low) in this cluster. As can be seen in this plot, TES takes an active role in the system over the entire plotted period. However, the function of TES varies with the season. In the summertime, acting together with EBs, it enables the absorption of low electricity prices from imports, while during the wintertime, the storage technology instead adds peaking capacity to the system. In contrast, during the spring and fall, TES enables the CHP production to react to variations in the electricity import price decoupled from the hourly heat demand. Consequently, as indicated in Figure 5, the installed capacity of TES in this technology setup is high.

3.2. Cost-Efficient Electricity-Supply Technology Combinations

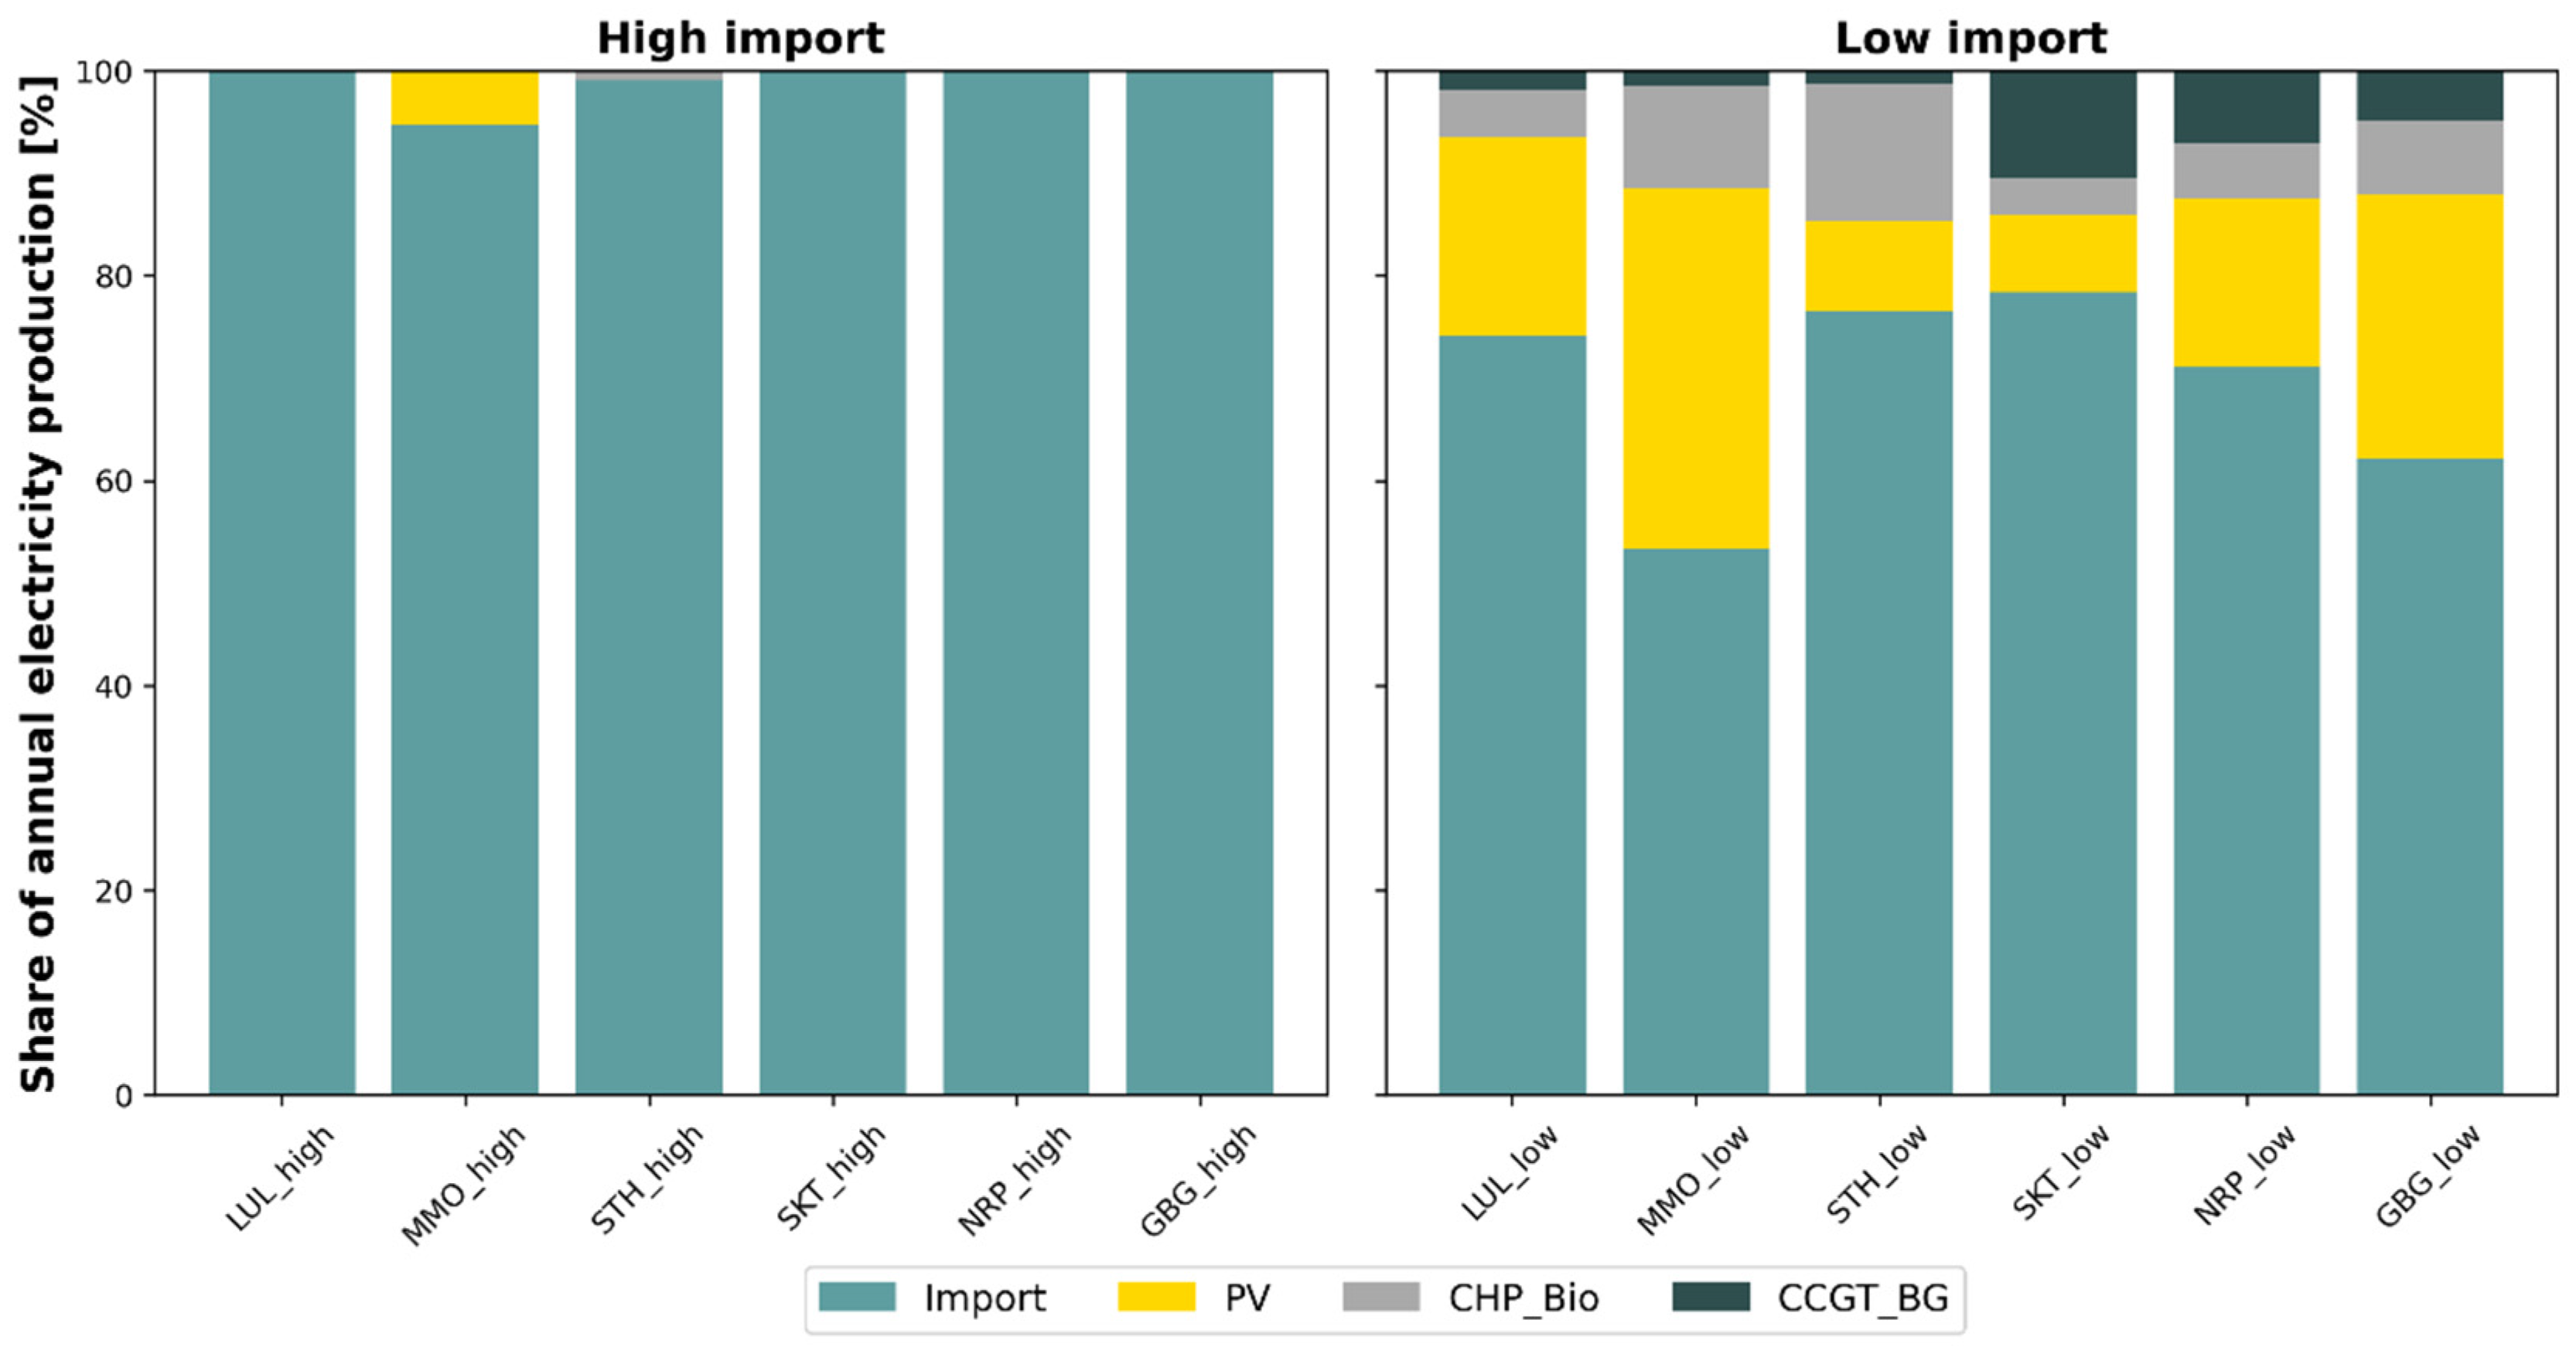
Figure 7 depicts the annual production levels of electricity in the modeled cities, divided between the installed production sources and imports. Notably, in cities in the high import capacity scenario, the supplied electricity almost exclusively stems from imports. When the import capacity is restricted, the remaining demand that cannot be met by imports is instead supplied by introducing a combination of PV, bio-based CHP (CHP_Bio), and combined cycle gas turbines (CCGT_BG).
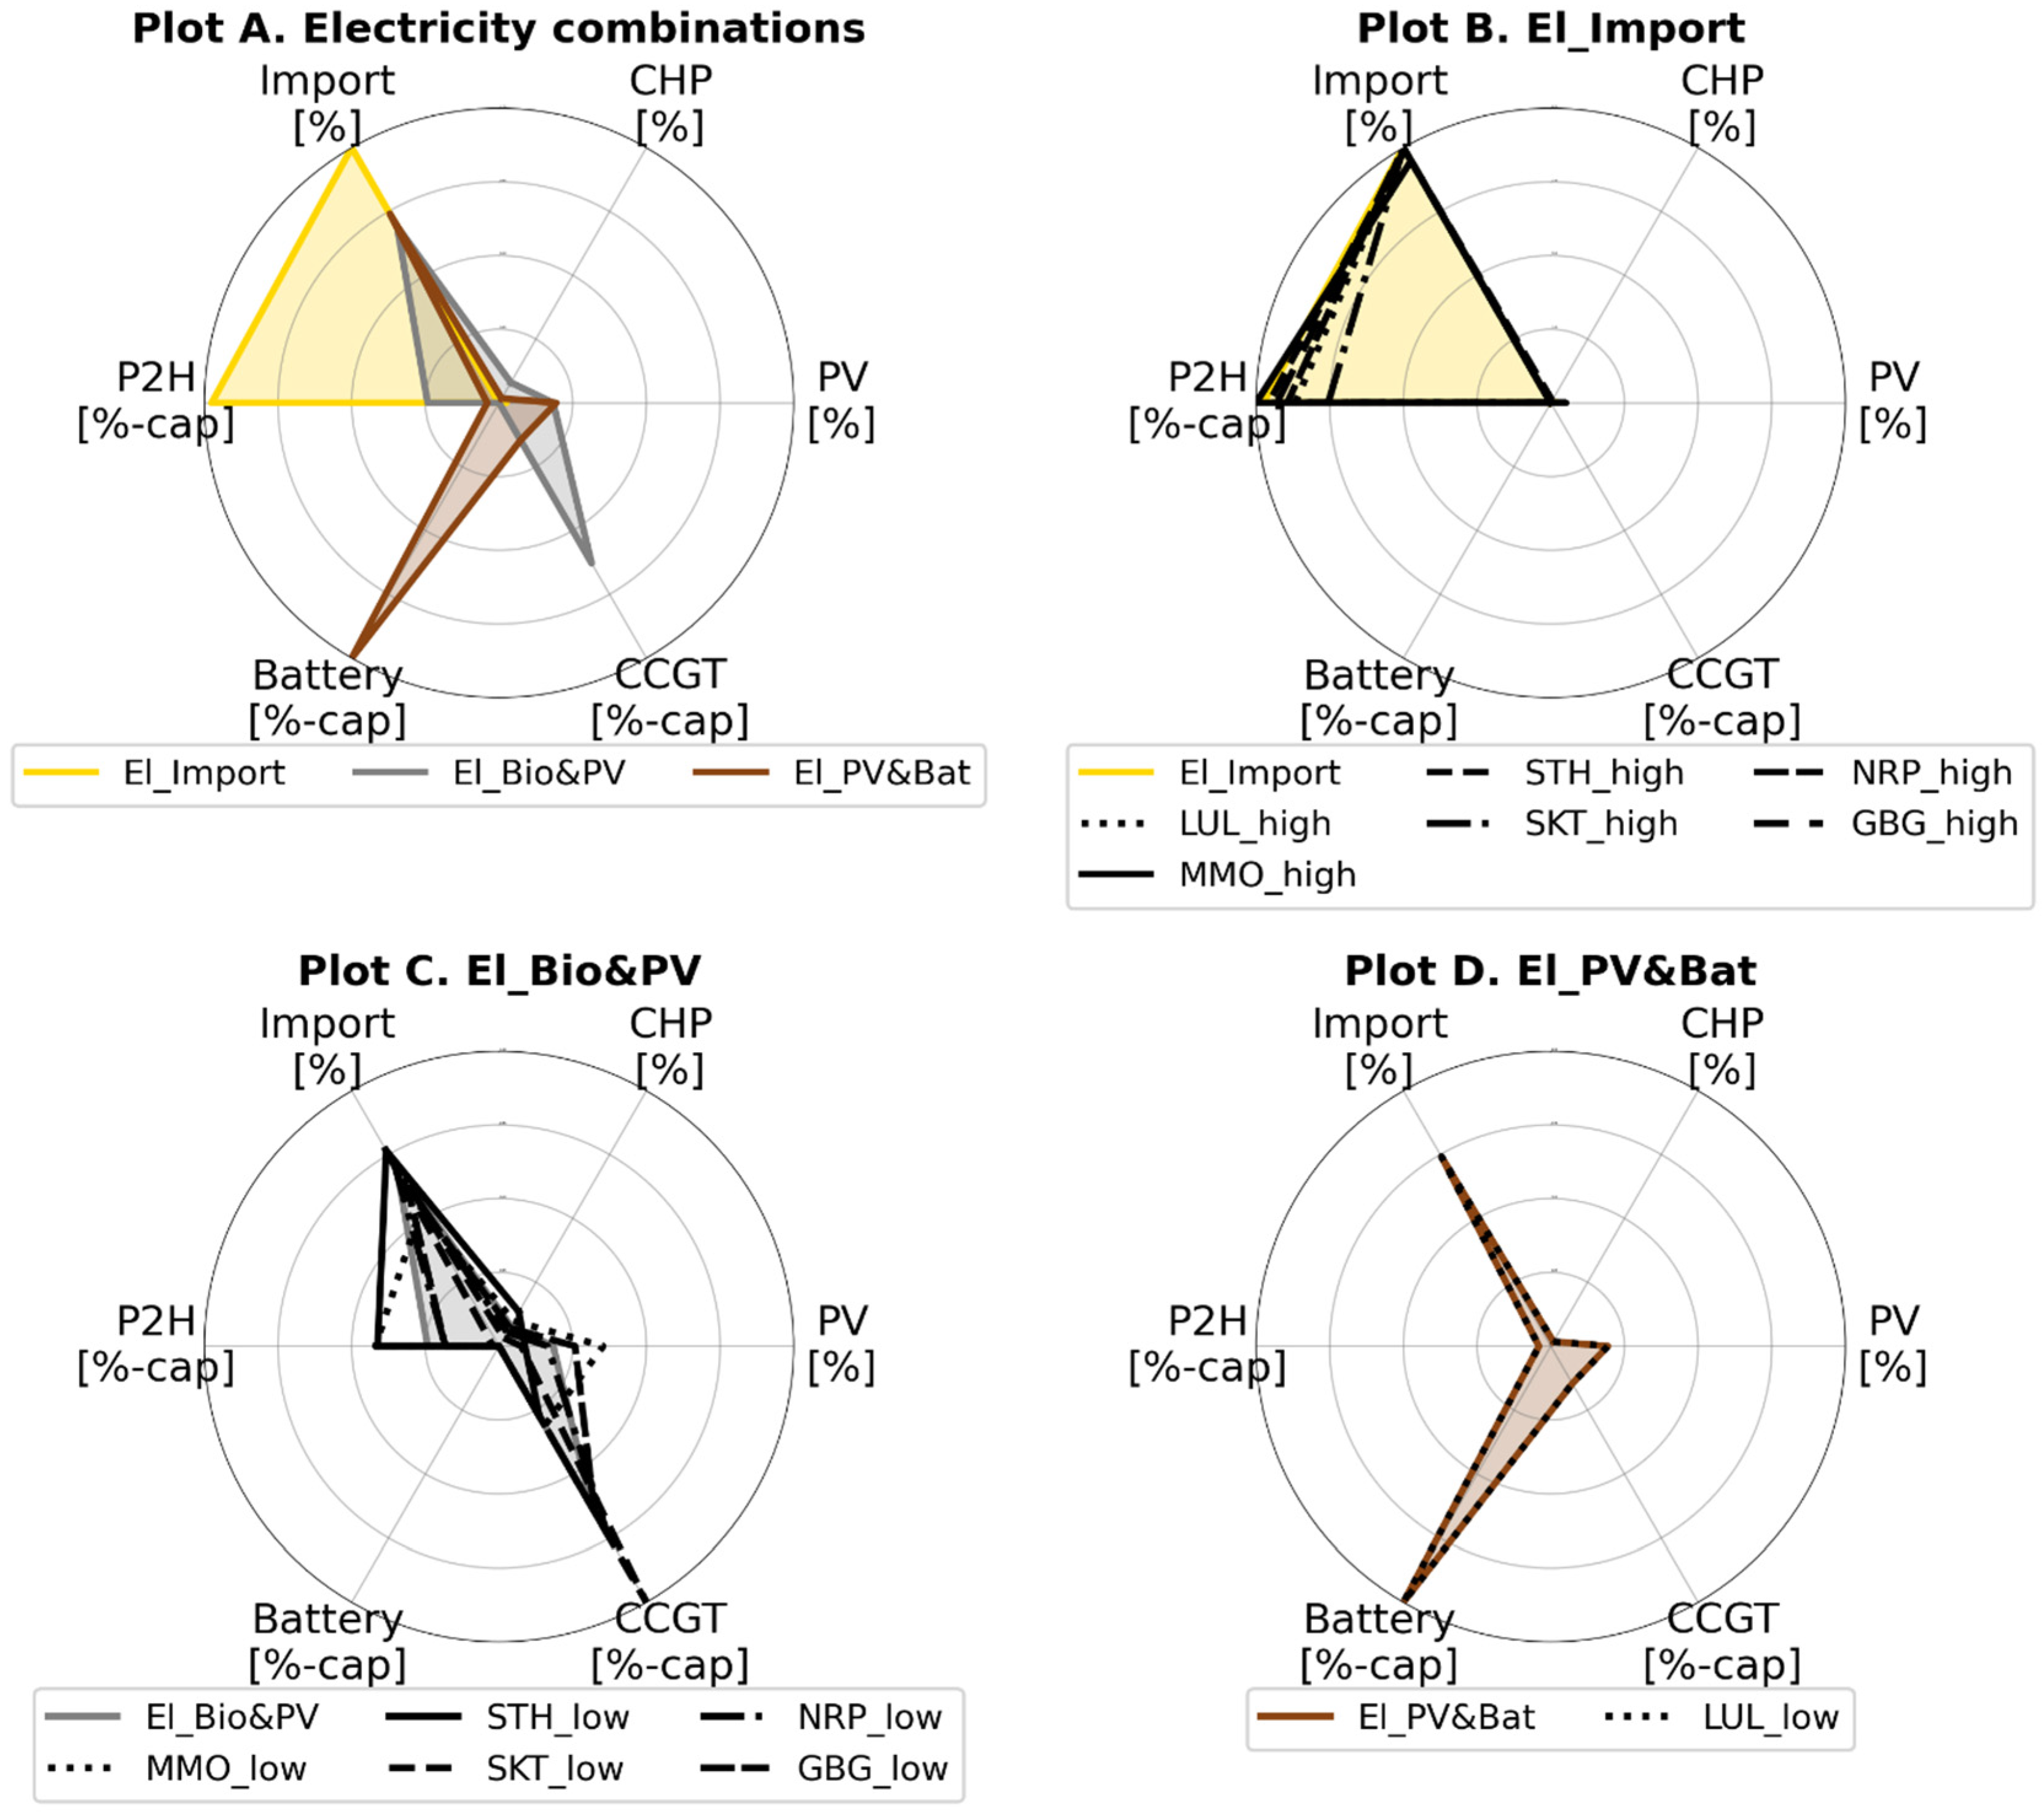
In a similar way as for the heating sector, the 12 modeled cases were clustered into three different groups (Figure 8). The clustering was based on six identified features, characterizing the technologies implemented to supply in an optimal manner electricity in the cities: import-share; CHP-share; PV-share; power-to-heat share (P2H); capacity of CCGTs; and capacity of stationary lithium-ion batteries. For the parameters displayed as percentages (%) in Figure 8, the values represent the modeled share of the total electricity originating from that source, while for the other parameters, the values in the figure indicate the normalized installed capacity (%-cap).
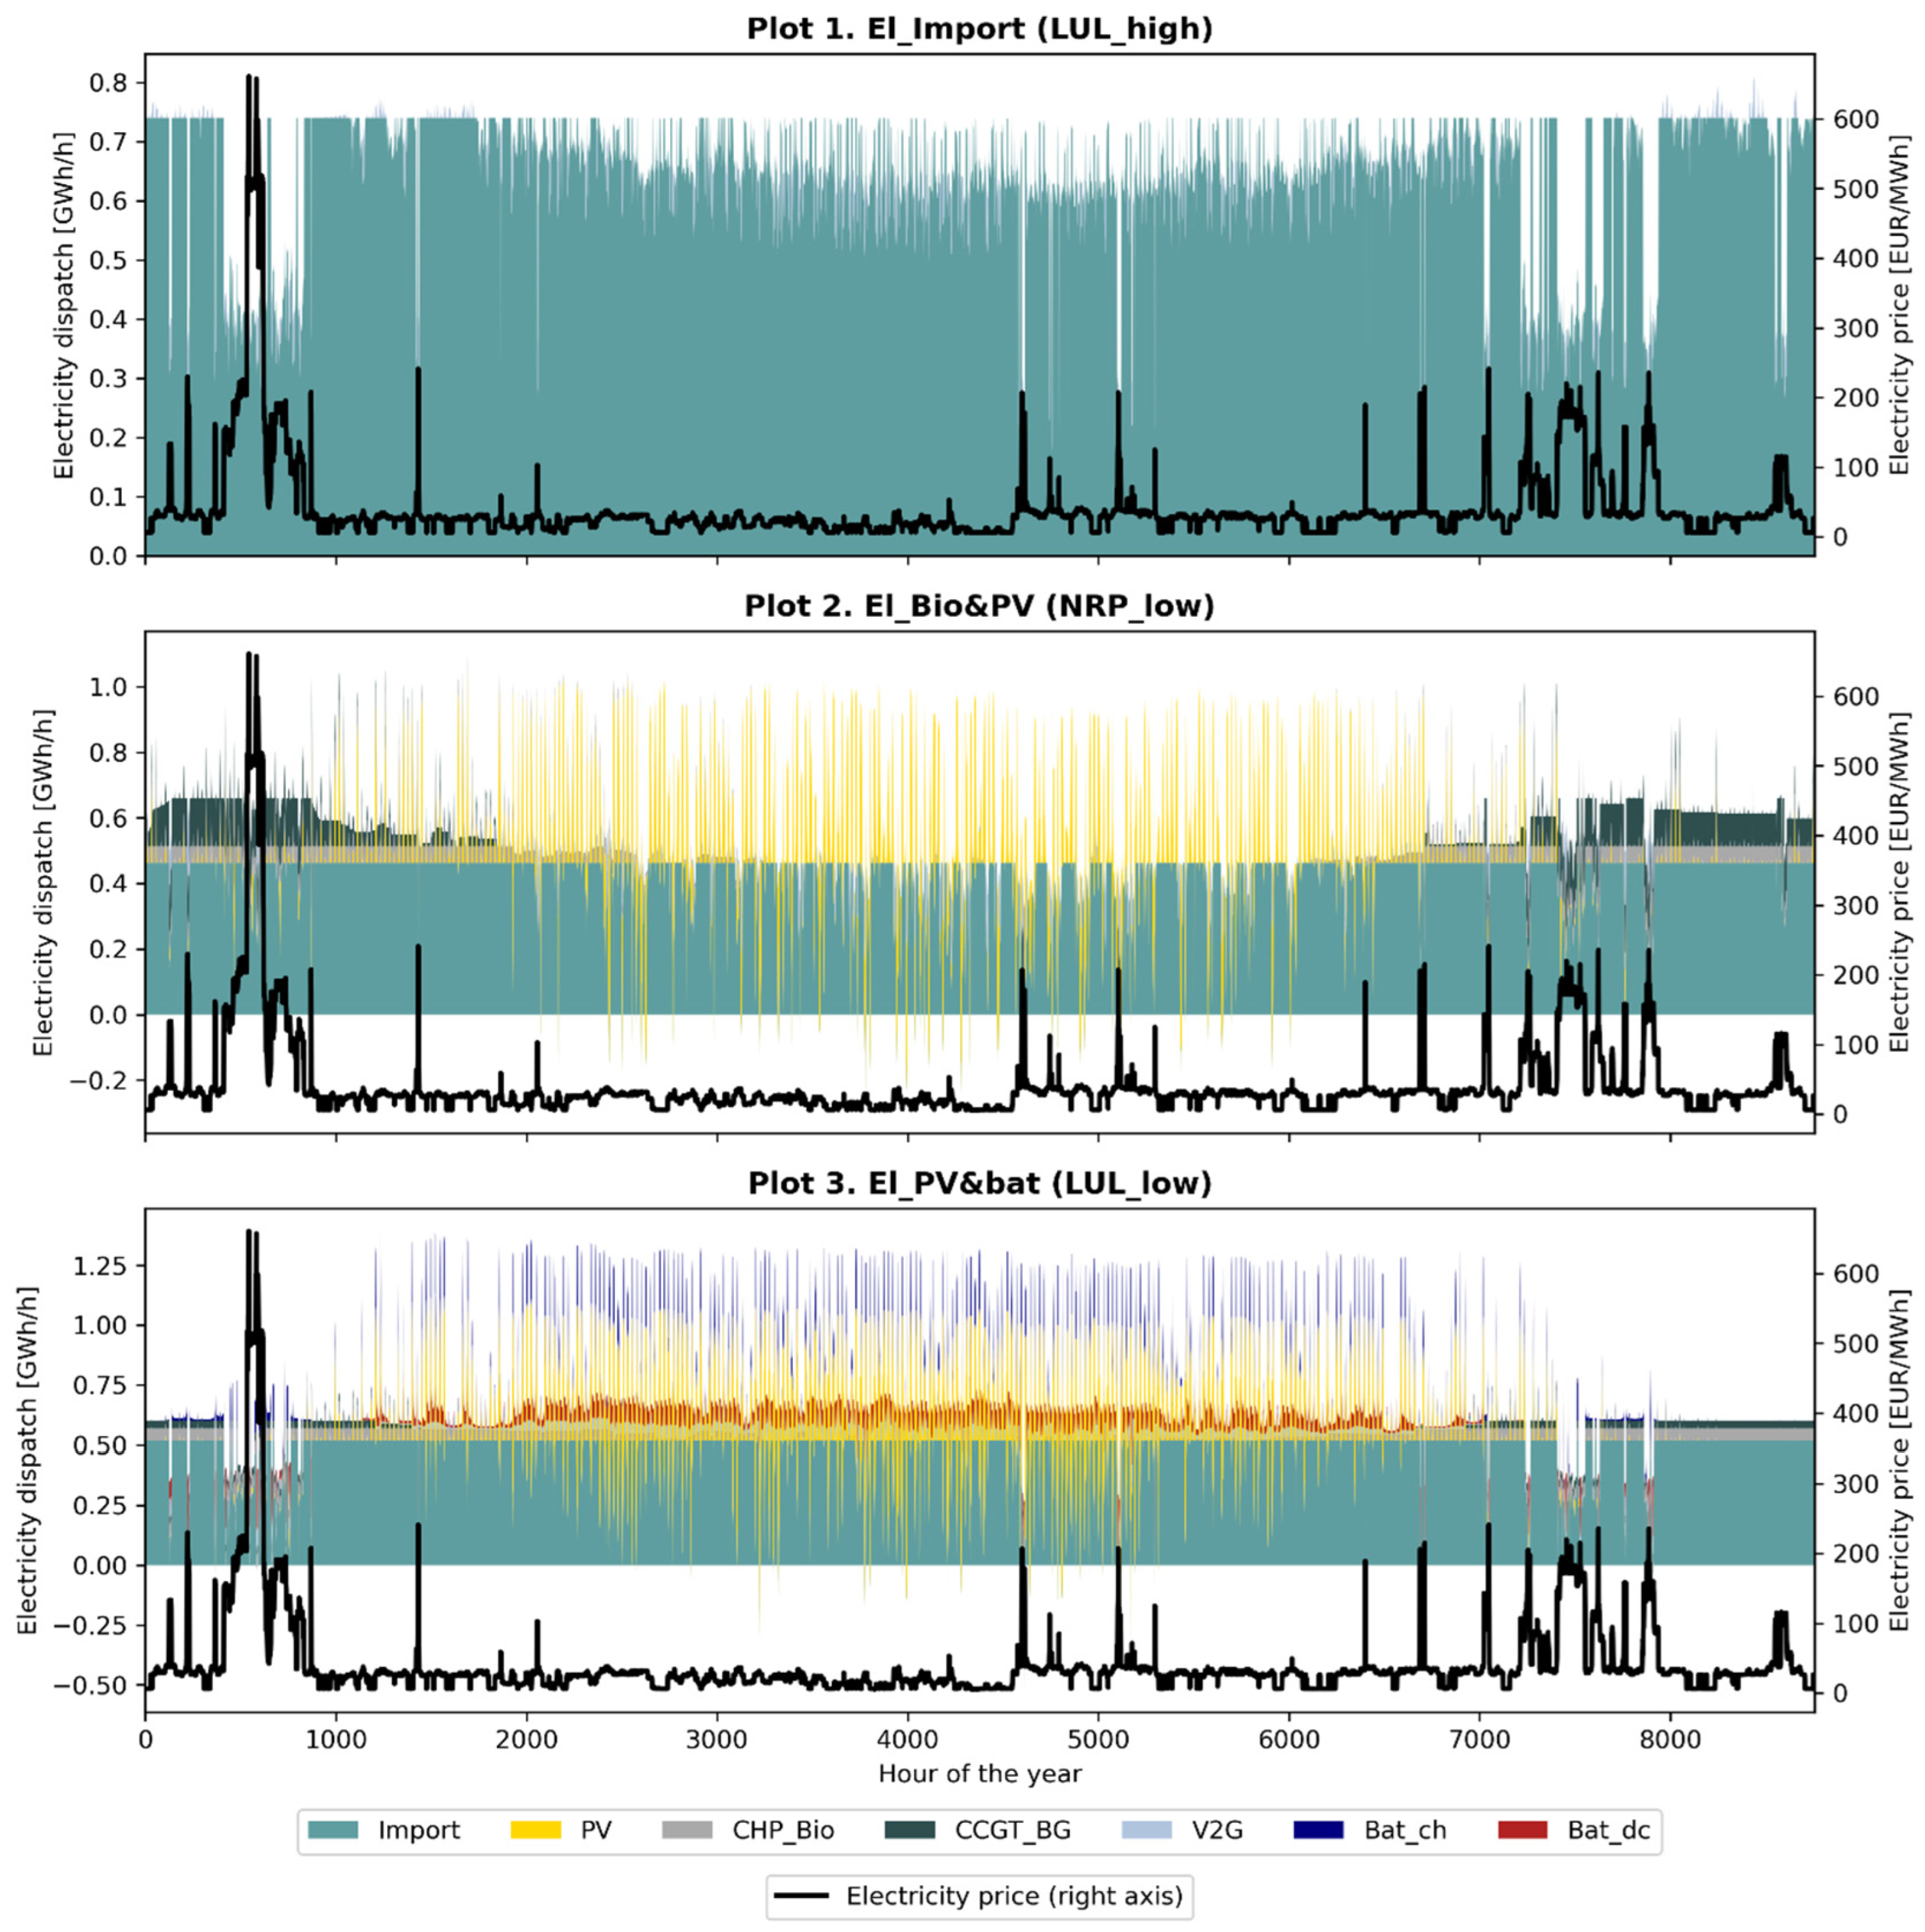
Figure 8 shows that for electricity generation, three clusters were identified, with centroids depicted in Plot A. Plots B–D show the results of all 12 modeled cases (six cities with high and low import capacity scenarios), grouped together based on their respective clusters. Figure 9 illustrates the dispatch of electricity during the entire year for three of the modeled cases, each representing one of the technology combinations presented in Plot A in Figure 8.
The combination labeled El_Import in Figure 8 is characterized by a significant reliance on imported electricity, with flexibility being achieved through the adjustment of import levels. This is further visualized in Plot 1 in Figure 9, which shows the dispatch of electricity over time. In this plot, it can be seen that electricity imports are reduced during periods of high electricity prices and that no alternative electricity production capacity is introduced. Instead, high costs during hours of high import prices are efficiently avoided by load shifting (through flexible EV charging and industrial loads, if available) and by reducing power-to-heat levels.
The technology mix labeled El_Bio&PV in Figure 8, on the other hand, is distinguished by a higher share of electricity being produced within the city from CHP, PV, and CCGT. As can be observed in Plot 2 in Figure 9, which shows the dispatch of one of the modeled cities included in this cluster, this results in increased shares of PVs and CHP to cover the bulk electricity demand. Gas turbines in a combined cycle, together with reduced power-to-heat from HPs, also provide alternative power capacity during high electricity demand events.
The third technology combination, referred to as El_PV&Bat in Figure 8, is similar to El_Bio&PV in the sense that the electricity demand that remains after electricity imports is met by PV and, to some extent, by CCGT and CHP. What sets this approach apart from the technology combination El_Bio&PV is the inclusion of stationary batteries, which serve as a complement to the high PV production during summertime. This behavior is illustrated in Plot 3 in Figure 9, which depicts the electricity dispatch pattern over time for a city (LUL_low) that belongs to this cluster. Contrasting with Plot 2, a reduction in the required capacity of gas turbines for peak electricity generation is observed. This reduction is attributed to the shift in electricity demand from the wintertime to the summertime, made possible by the presence of substantial flexibility in electricity demand arising from the EAF processes in this particular city.

3.3. Impacts of the Energy-Related Properties of the Cities

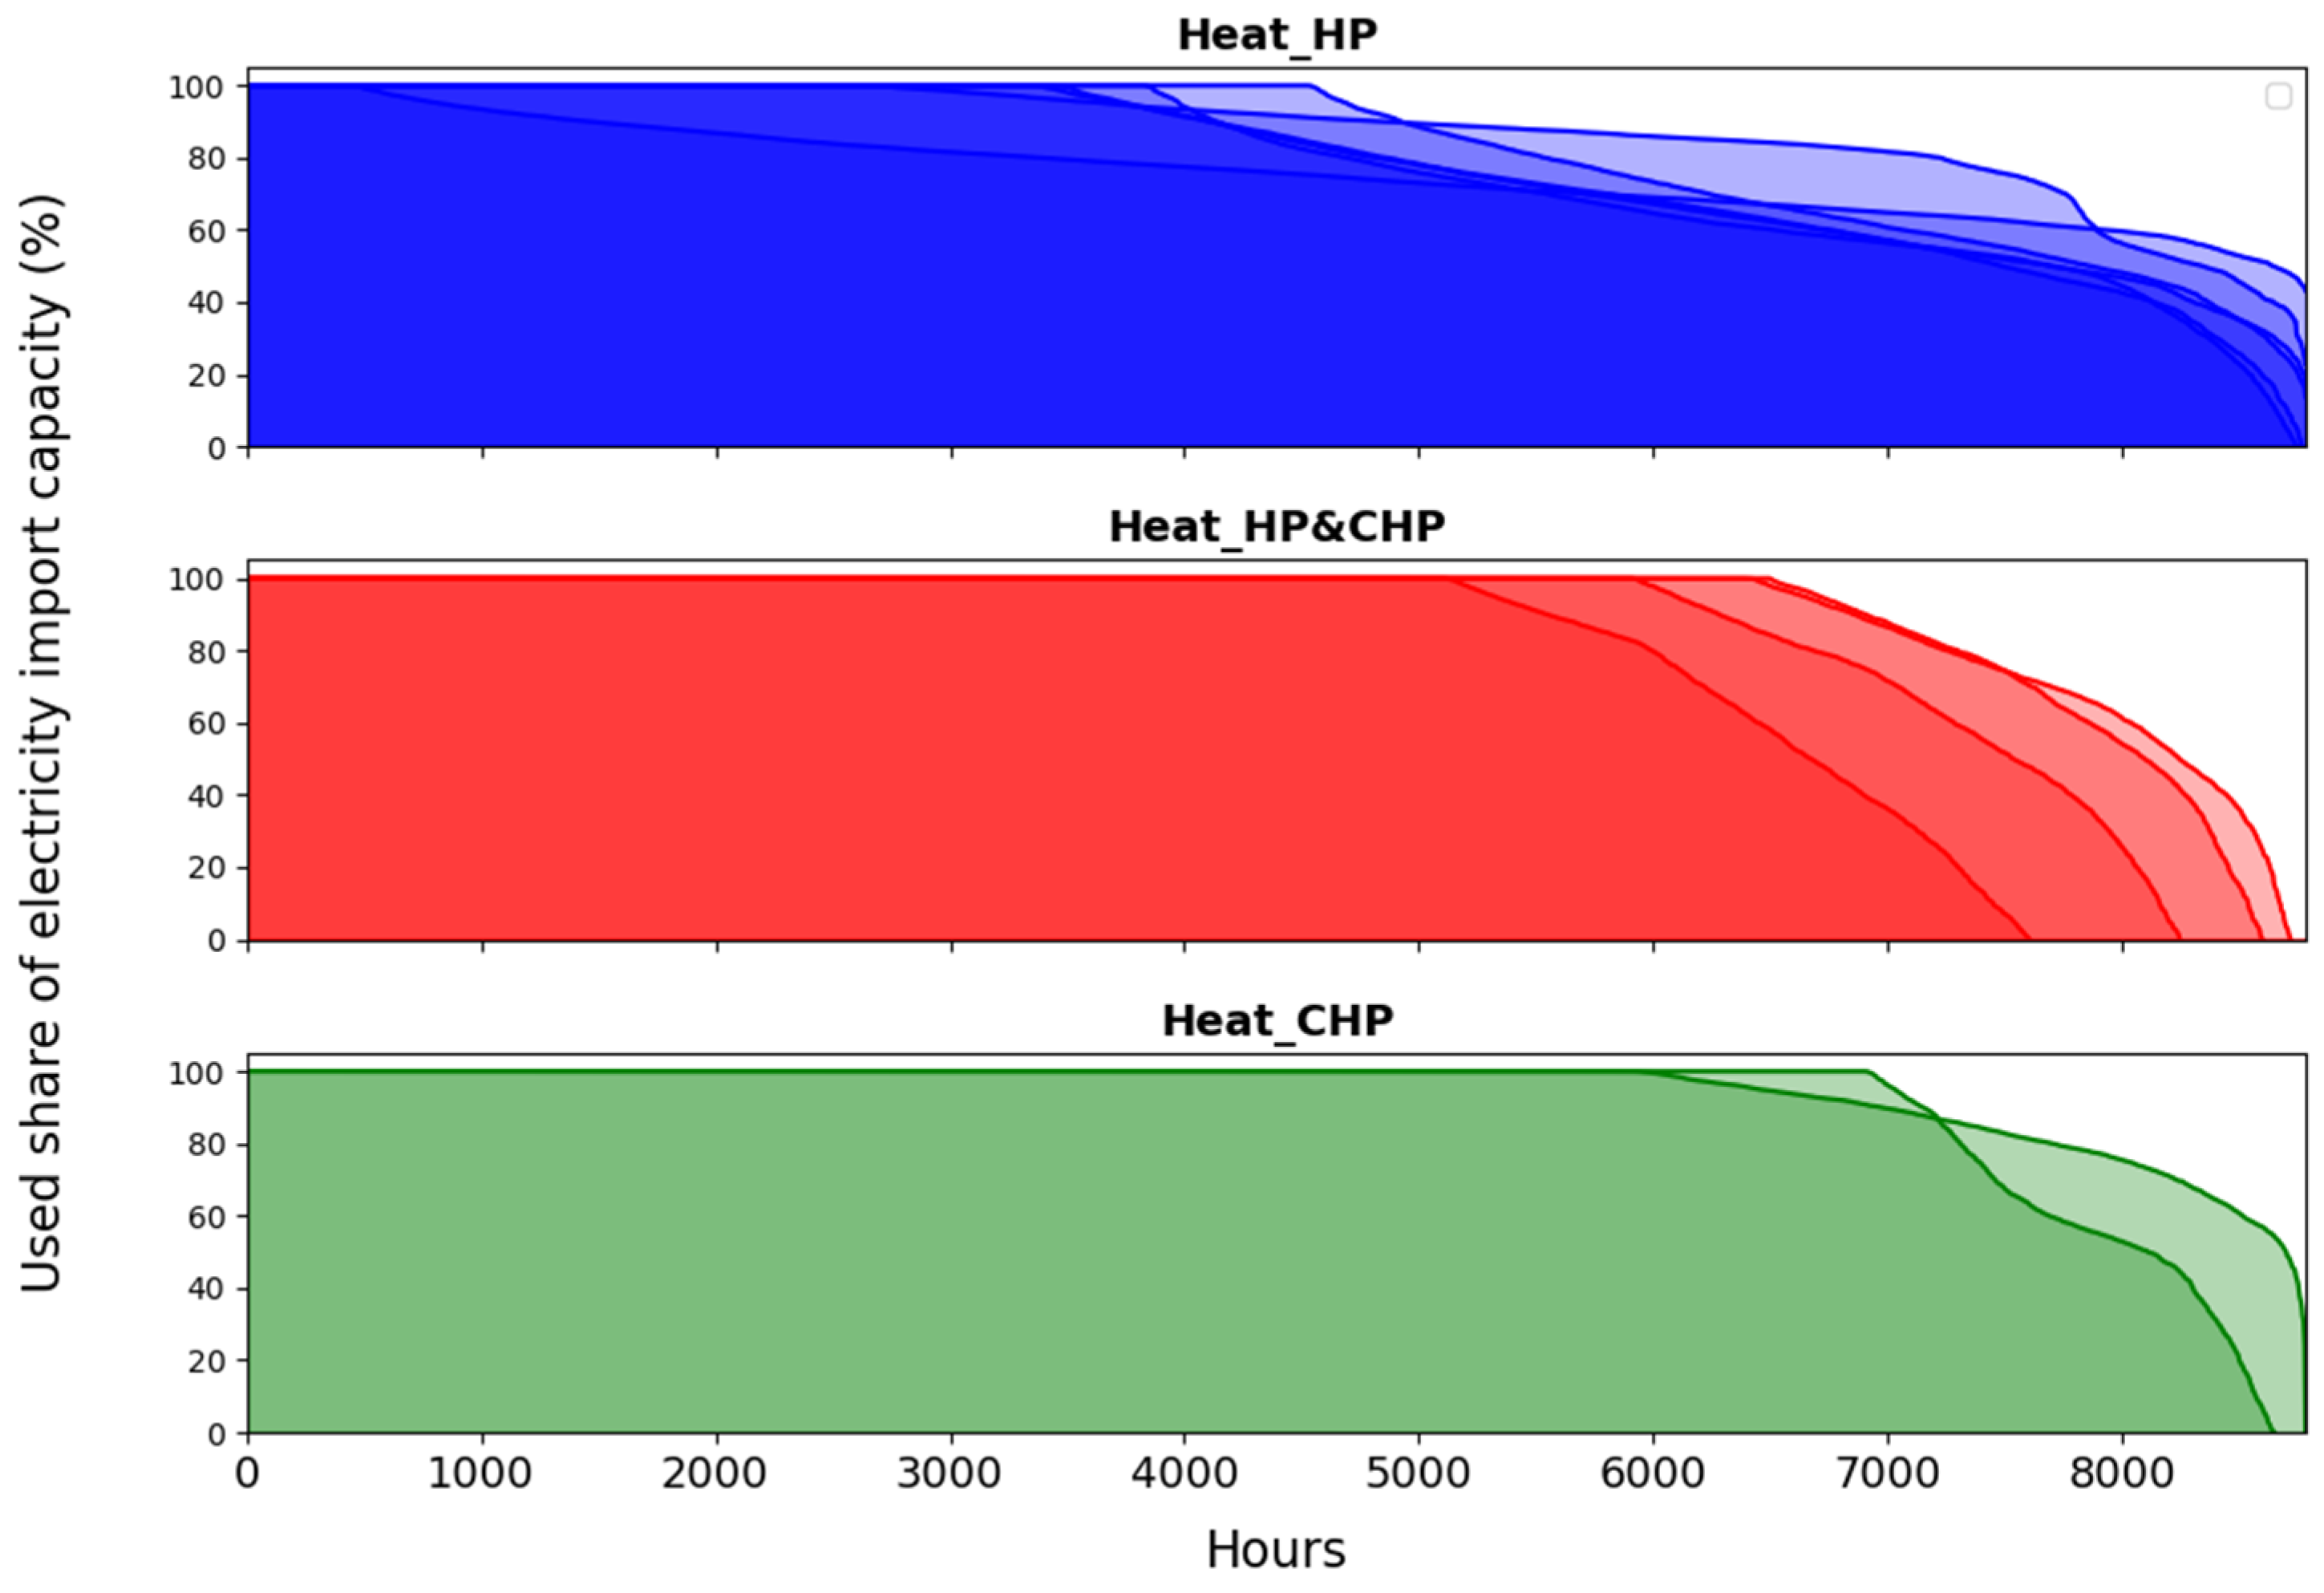
In the high electricity import capacity scenario, the optimal approach in all the modeled cases is the implementation of Heat_HP plus El_Import. This can be translated to a system that largely relies on power-to-heat to supply heat and imported electricity to meet the electricity demand. Consequently, it appears that differences in individual properties between the modeled cities do not exert substantial influences on the optimal technological solution as long as the import capacity is relatively high and electricity is available at a low cost. As seen in Figure 10, which illustrates the utilized share of electricity import capacity sorted over all hours of the year for all cities and for the three heat supply technologies, this assertion appears accurate for cities where electricity import capacity is used to a maximum of up to 5000 h annually. Notably, in this figure, all modeled cases associated with a heat pump-dominated heating system (Heat_HP, blue in Figure 5 and Figure 10) correspond to cities with the lowest number of hours with maximized import capacity, all of which are part of the high electricity import capacity scenario. Available electricity imports thus appear to be the dominant energy-related city property in terms of impact on modeled results.
As stricter electricity import capacity levels are enforced, a general shift away from HPs to CHP systems can be observed. In Figure 10, this can be seen for the modeled cases with annual hours with maximum electricity import capacity surpassing 5000 h (all cities in Heat_CHP and Heat_HP&CHP). For the purpose of this study, it should be emphasized that when stricter import capacity limitations are imposed, the variations in the other energy properties of cities appear to have more pronounced effects on determining with which cluster in Figure 5 and Figure 8 a particular city aligns.
More specifically (seen in Figure 4) the share of power-to-heat varies significantly among the cities in the low electricity import scenario, despite experiencing a similar degree of import congestion. Cities with a low electricity-to-heat ratio in the low electricity import scenario are associated with a higher share of heat from electricity. This can be attributed to the magnitude of the installed CHP. To maintain cost optimality, the CHP capacity is limited by the available heating demand in the city, which implies that this technology is contingent upon a low electricity-to-heat ratio to be a significant contributor to the total urban electricity demand. Consequently, a higher CHP capacity mitigates some of the pressure on the electric grid connection to the outside region, thereby indirectly making the presence of CHPs an enabler of HPs when electricity imports are restricted. In addition, this results in cities with the highest ratio between annual electricity and heat demand (SKT and LUL, both with an electricity-to-heat-ratio above 6, as seen in Table 2) being categorized in the Heat_CHP cluster without any HP capacity at all.
Only one of the modeled cases includes stationary batteries as part of the cost-optimal solution, categorized in the El_PV&Bat cluster in Figure 8. This behavior coincides with the city (LUL) exhibiting the highest share of flexible electricity demand, as indicated in Table 2. The capability to adjust the electric load over periods extending up to several months facilitates the cost-optimal deployment of a seasonally dependent combination of solar PV and stationary batteries within this city (despite poor geographic conditions for PV in LUL). Consequently, for the El_PV&Bat configuration depicted in Figure 8 to become viable, a considerable level of seasonal demand flexibility seems to be a prerequisite.
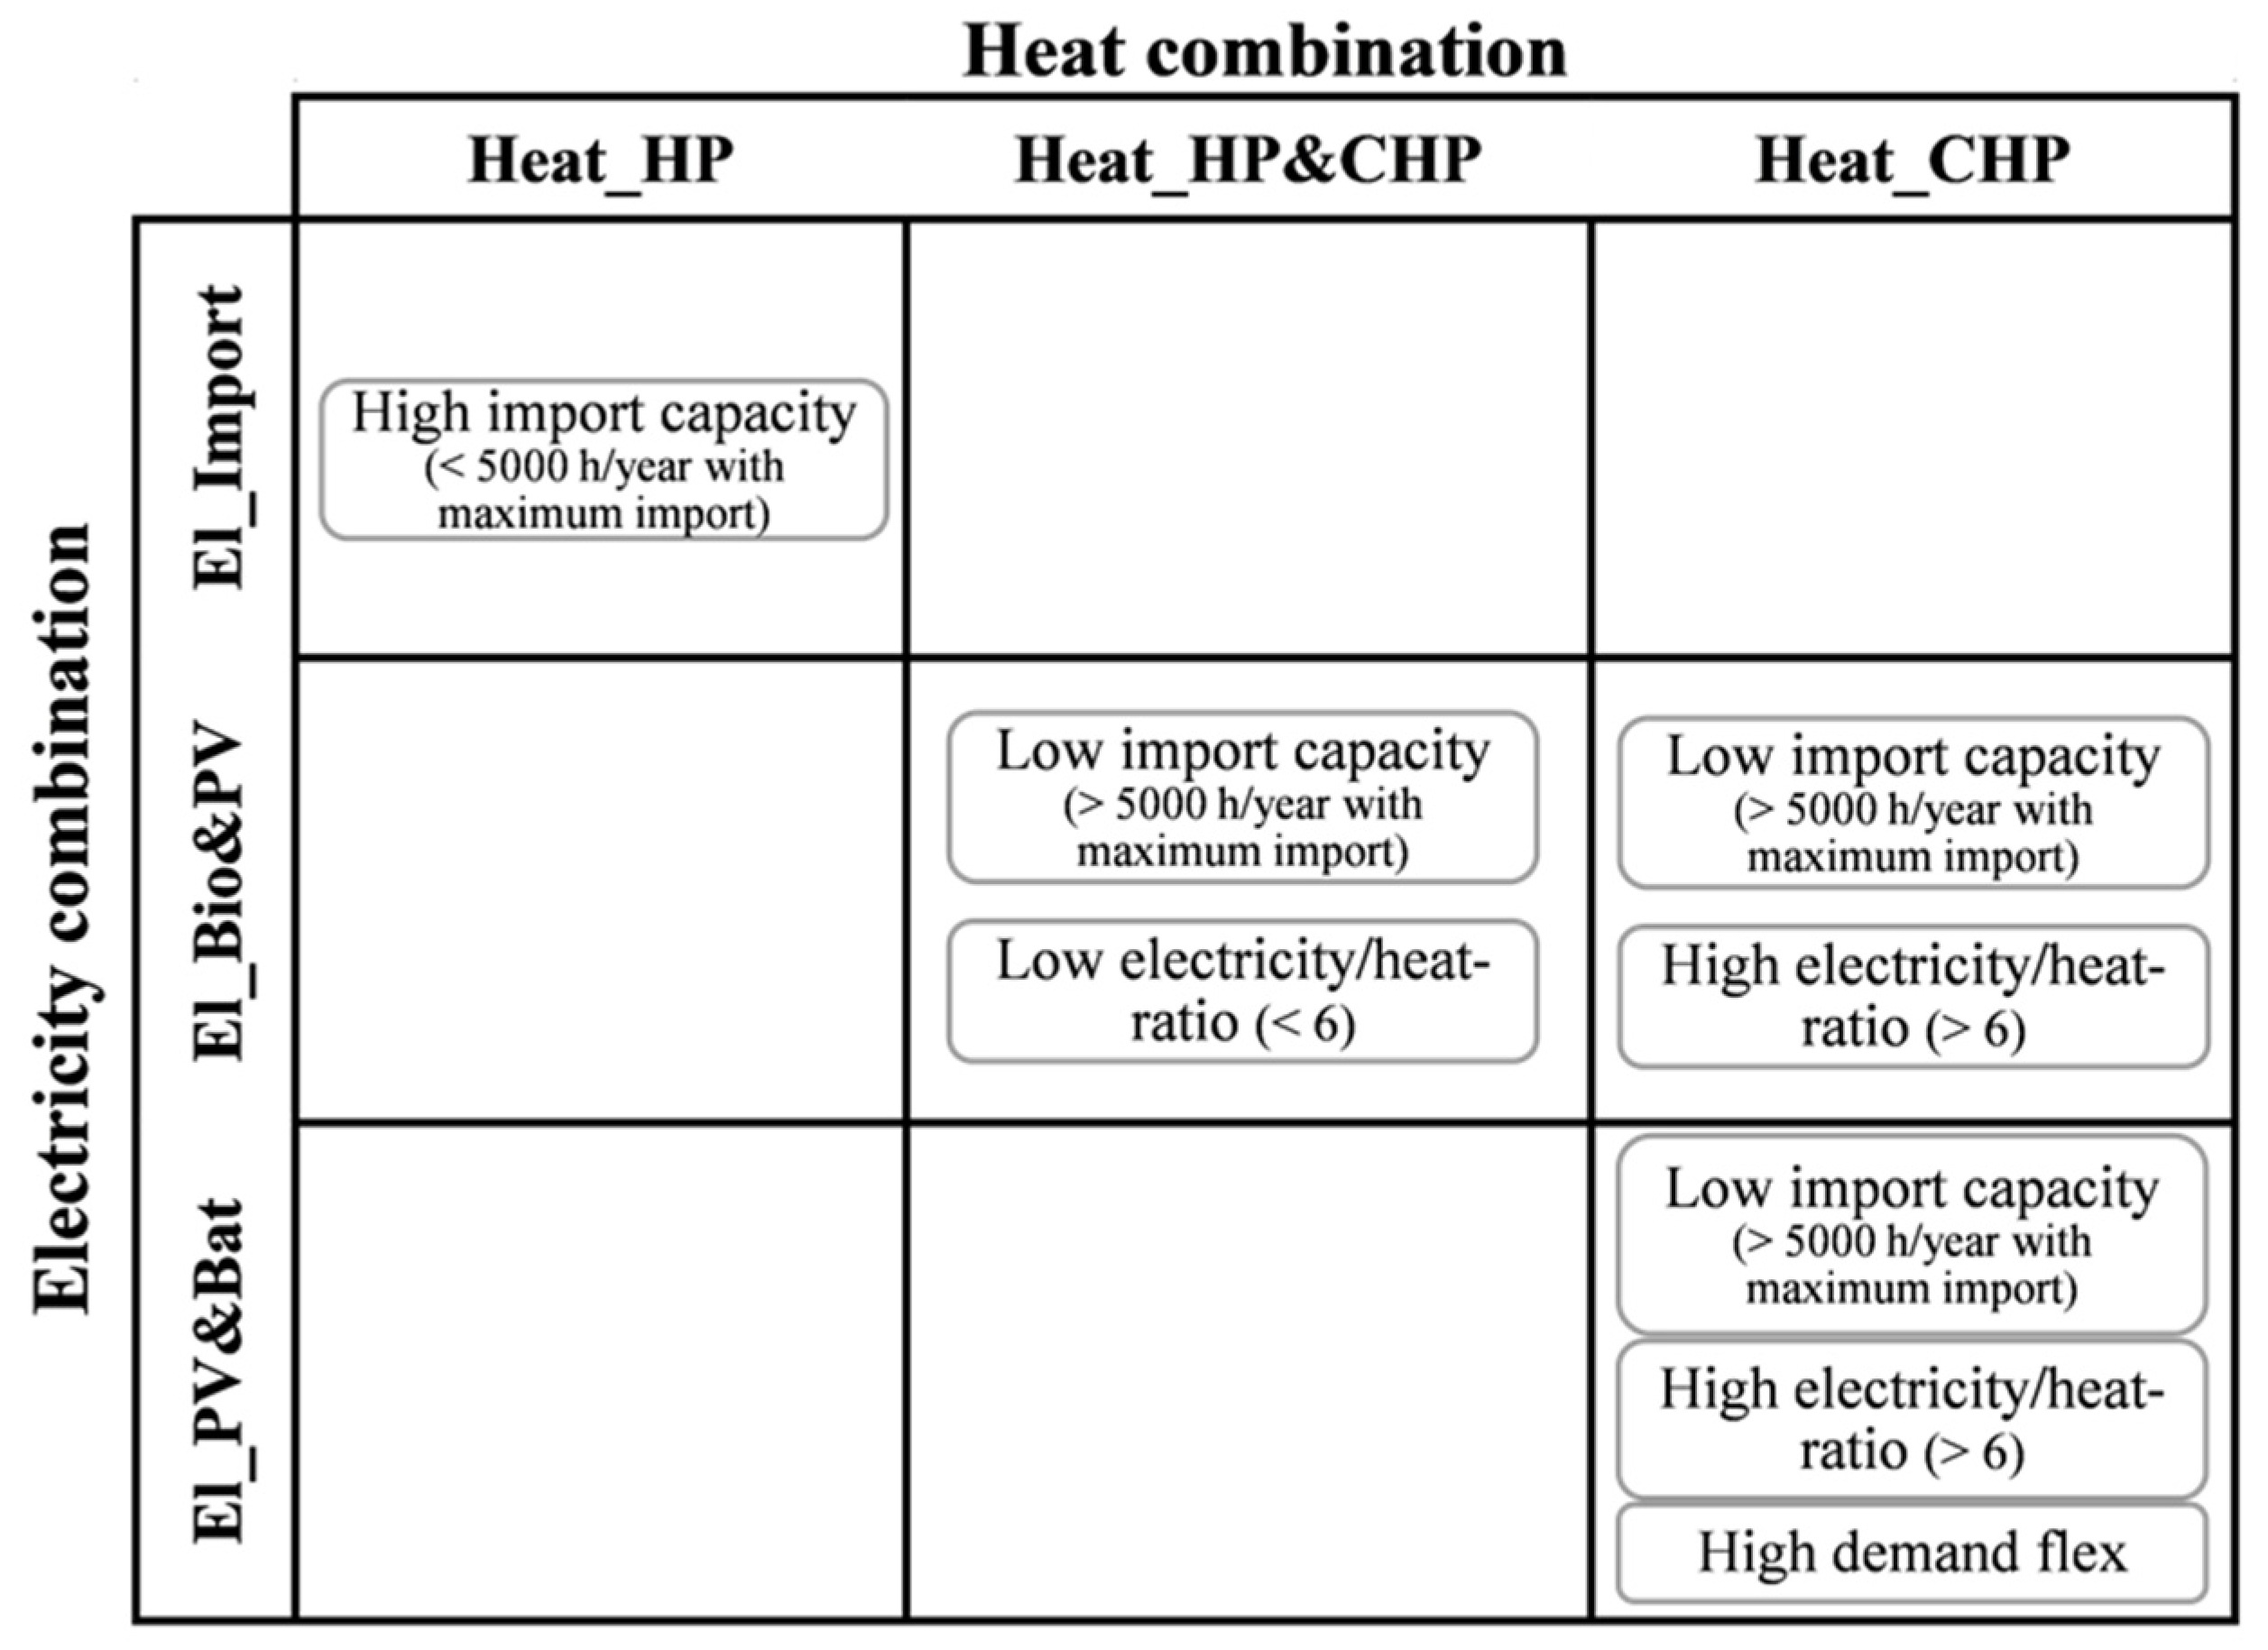
A summary of the impacts of the different energy-related properties of the cities on the results is presented in Figure 11. Here, it is evident that when there is greater availability of imported electricity, the impacts of other individual city characteristics are diminished. In contrast, when the electricity import capacity is more constrained, factors such as the electricity-to-heat ratio and demand-side flexibility take on more prominent roles in defining the most cost-effective approach to providing electricity and heat within the urban energy system.

3.4. Sensitivity Analysis of Biomass Price

In light of biomass being a finite resource and its substantial utilization in the heating sector across the Nordics, its price emerged as a central factor for scrutiny in the sensitivity analysis. This analysis, conducted under the high import capacity scenario, exclusively focuses on the heating sector, aiming to scrutinize the resilience of the previously noted prevalence of heat pumps (HPs) and imported electricity. The impacts of different levels of biomass price on the results are indicated in Figure 12, in which the value of 30 EUR/MWh should here be regarded as the reference case, as it was the value utilized in the previous results. Figure 12 demonstrates that HPs assume the role of primary heat source for biomass prices equal to or exceeding 20 EUR/MWh. At lower biomass prices, there is a shift towards the adoption of a heating system based primarily on CHP (similar to Heat_CHP in Figure 5) in all the cities. Notably, however, the presence of industrial waste heat outcompetes CHPs, resulting in the city with the most abundant industrial waste heat (SKT) being less inclined to transition towards CHP-based heating, even with decreased biomass prices. Besides this, the response to variations in biomass price remains consistent across all modeled cities, suggesting that individual city characteristics exert a low influence on the outcomes.
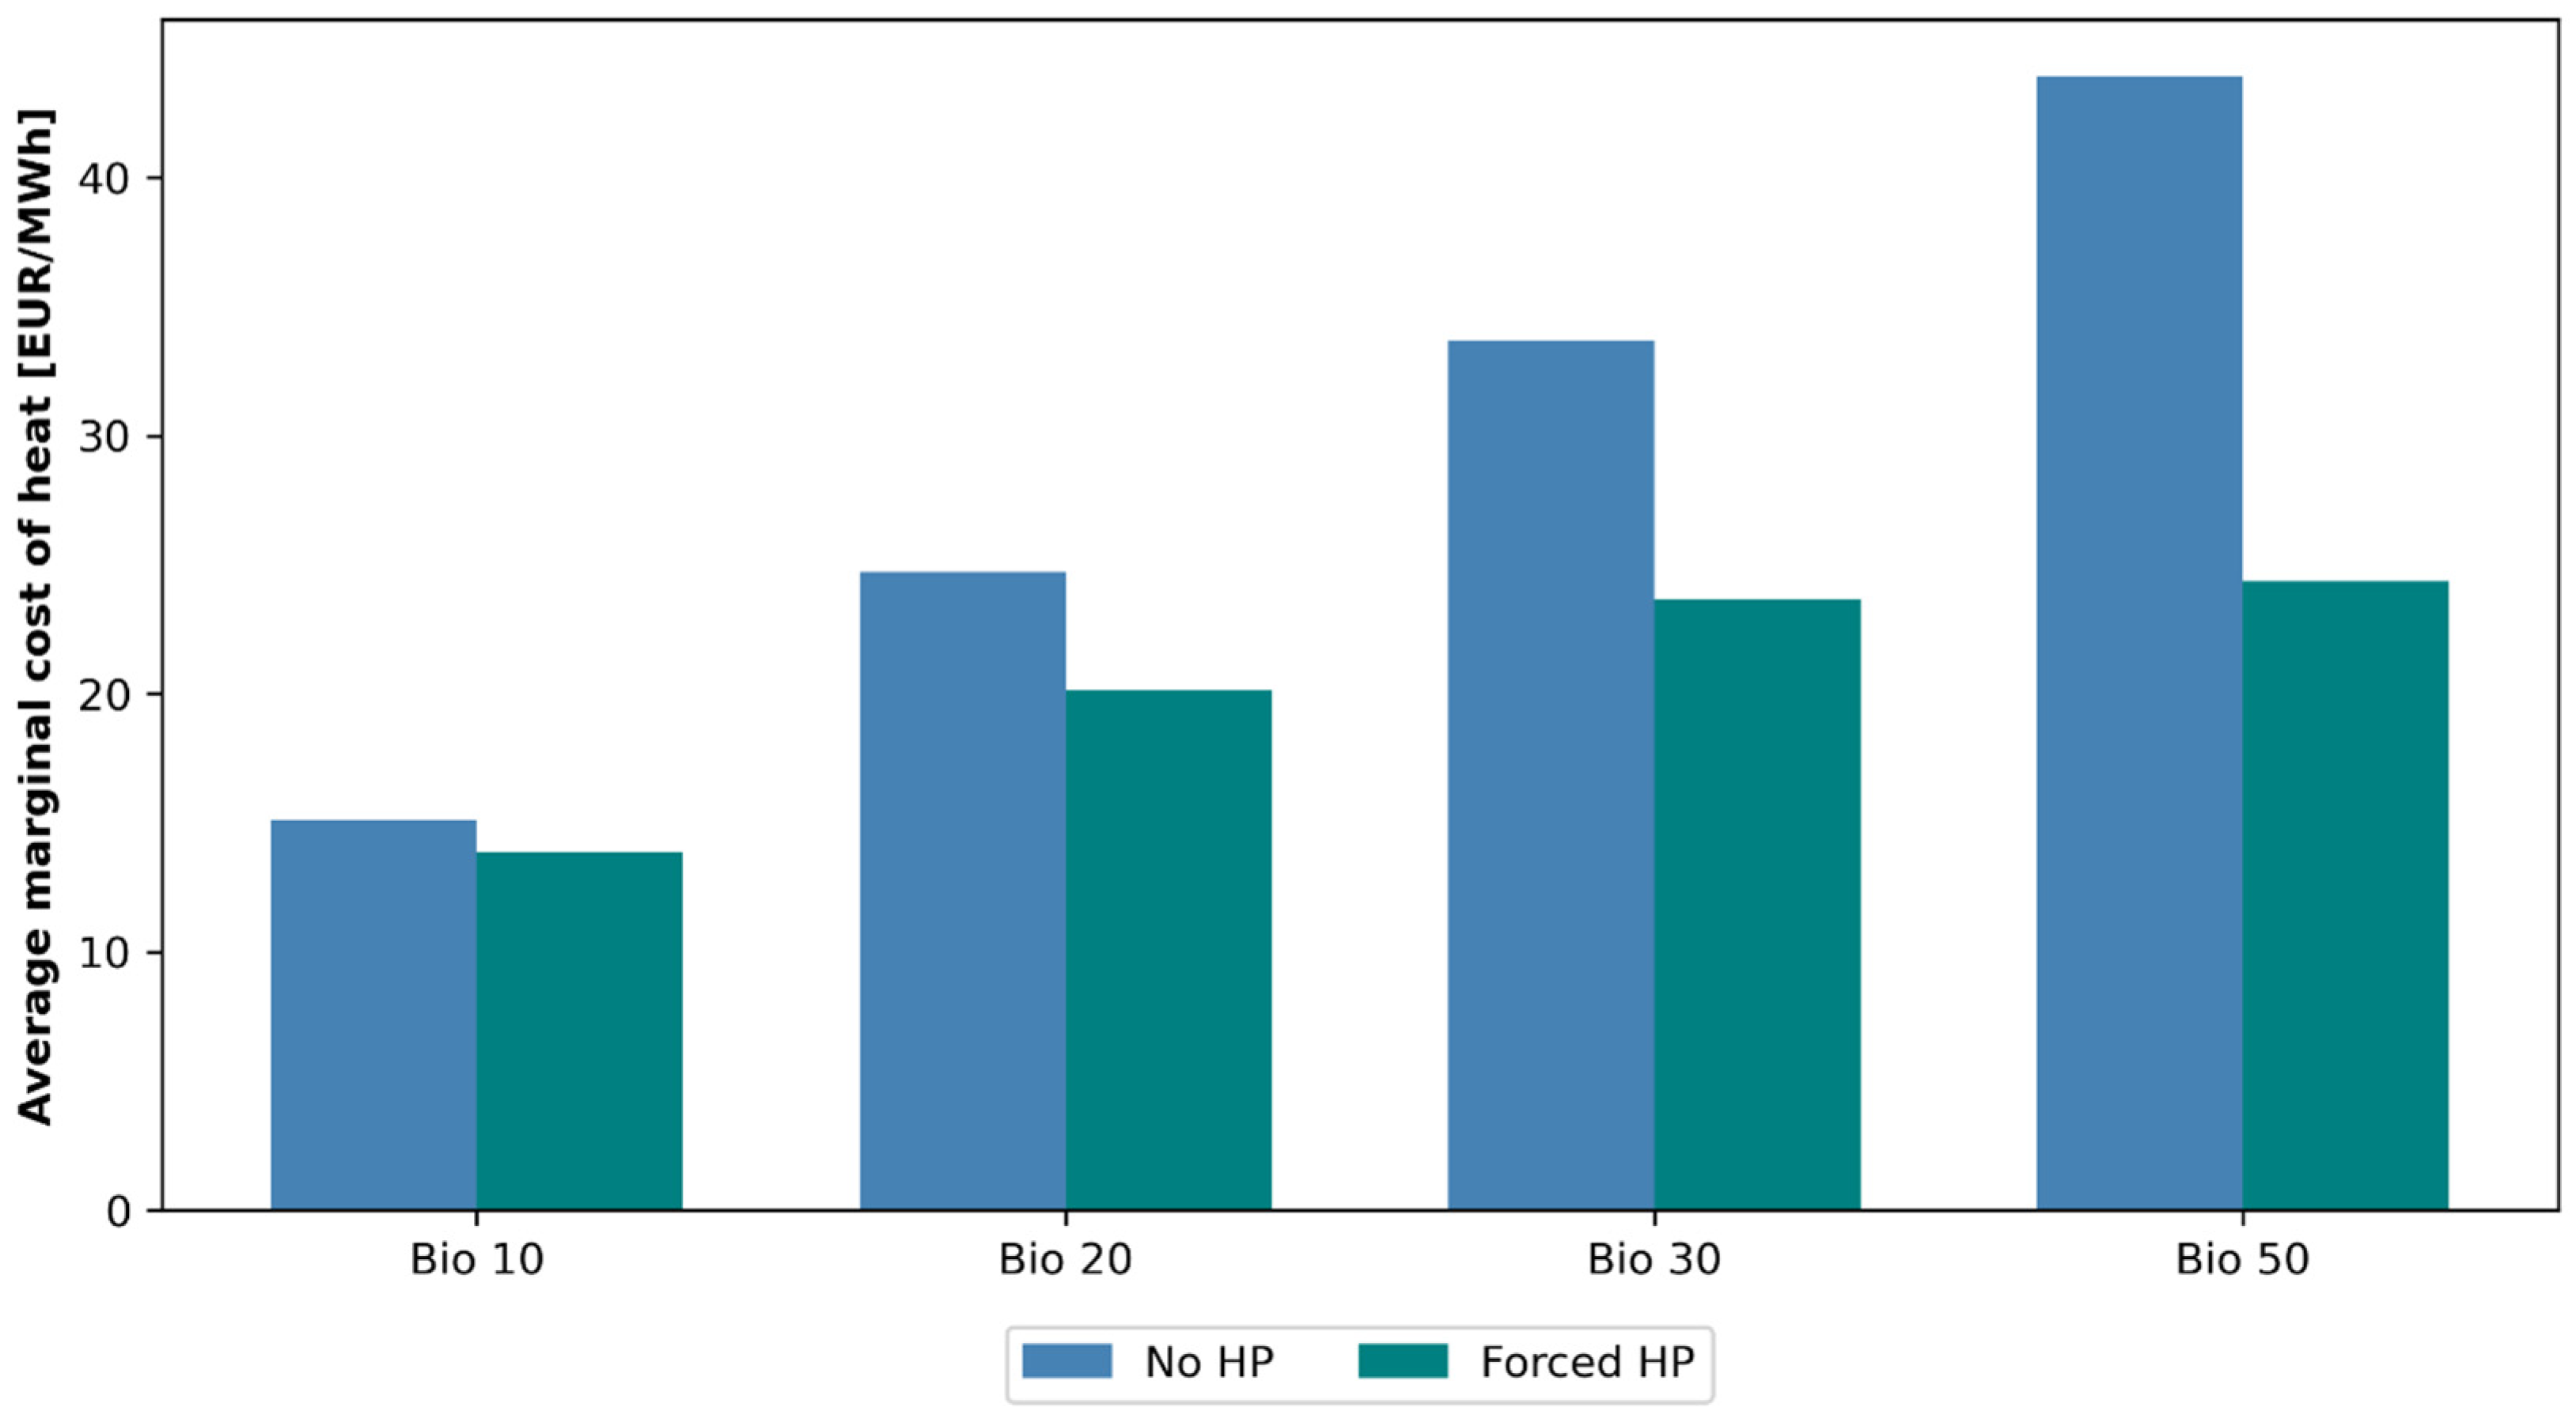
Figure 13 illustrates the additional impact of changes in biomass prices. It displays the average marginal heat cost across all the cities for four biomass price levels, considering two distinct situations: No HP, which excludes HP usage; and forced HP, where a baseline of HP capacity from the reference case at 30 EUR/MWh is mandated as the minimum level. The purpose of these modeling cases is to demonstrate that a low cost for biomass does not lead to a lower marginal cost for heat compared to a system that is forced to invest in HPs. However, Figure 13 also reveals that in the absence of HPs, the marginal cost of heat becomes significantly higher as biomass prices increase. This underscores the significance of including HPs when mitigating the economic risk of higher biomass costs.
A further sensitivity analysis focusing on the impact of including a tax on electricity-to-heat has been conducted. This analysis indicates that tax levels up to 30 EUR/MWh, comparable to the Swedish level of approximately 35 EUR/MWh in 2023, have limited effects on production sources. However, at a tax level of 60 EUR/MWh, a significantly higher share of biomass-based heat production becomes cost-optimal. Further details can be found in Supplementary Figure S1.

4. Discussion

In the majority of the cases analyzed in this study, the most cost-effective solution for a fossil-free urban energy system revolves around power-to-heat technologies combined with TES, together with the import of electricity from the surrounding region. This outcome holds true despite the application of conservative estimates for future HP performance and high estimates for investment costs for power-to-heat and thermal storage technologies. While we have identified alternative technology options based on biomass CHP, solar PV, and batteries, it is important to recognize that significant changes, such as substantial reductions in biomass costs or the imposition of severe constraints on import capacity, are required to substantiate any deviation from the dominant strategy centered on power-to-heat and electricity imports. The consistency with which the cities exhibit similar behaviors, unless subjected to significant exogenous stresses, suggests that the complexity of the modeling can be reduced while still accurately capturing the dynamics of urban electrification. This insight can guide future energy system modeling efforts so as to streamline the approach to facilitate improved understanding and planning of urban energy transitions.
However, the observed preference for imported electricity should be seen in the context of the model employed in this work. First, the availability of electricity from sources with low marginal costs outside the city model, such as wind and hydropower, makes it difficult for local electricity production to compete. Second, even if these technologies were available as potential investments within the city, it is likely that importing electricity would still be prioritized, as the model does not require taking into account investment costs for building additional production units outside the city. To address this issue, an alternative approach in future work would be to incorporate the outside of the city into the model, similar to what was performed by Heinisch et al. [30], albeit at the expense of additional computational effort.
The generalizability of the findings of the present study must also be viewed from a geographical perspective. Given the significant reliance on imported electricity from surrounding regions, the layout and design of this area undeniably influence the results. Consequently, when extrapolating the results to cities that are located in regions predominantly characterized by other production sources, this factor should be kept in mind. Beyond the parameters examined in this study, there exist other geographical factors that can significantly influence the results. For instance, the presence and coverage of district heating networks vary across cities, local geological conditions for thermal energy storage are site specific, and variations in temperature between seasons vary between different parts of the world. In addition, as pointed out by Eguiarte et al. [19], electrification of the heating sector may not be a suitable path if the surrounding electricity system is fossil-based. Addressing these geographic nuances is essential for developing tailored and robust solutions, and the results presented here should be seen in light of these limitations.
The findings of this study align with several other works, such as Arabzadeh et al. [38], Jambagi et al. [39], and Gudmundsson et al. [40], highlighting the potential for enhanced coupling between the electricity and district heating sectors as volatile renewable energy sources become increasingly dominant. However, limited previous research has focused on exploring the impact of variations in city properties on the results. As indicated above, Lund et al. [28] compared the introduction of large-scale renewable energy sources in Helsinki and Shanghai, revealing larger differences in the optimal technology implementation between the investigated cities compared to the present study. This dissimilarity in outcomes can be attributed to the significant variations in size, structure, and geographical conditions between Helsinki and Shanghai. If similar variations were considered in the present study, it is likely that the differences between cities would have been more pronounced. Consequently, including other types of cities in future research is seen as a natural extension of the current work.
A key observation in this study is that the modeling prioritizes a heating system predominantly reliant on power-to-heat technology, provided that electricity import capacity is not heavily restricted and biomass prices are not assumed to decrease. This observation is partially in line with prior research, such as the study conducted by Sneum et al. [27], which explored the consequences of restricting the availability of biomass-based technologies on the coupling between the heating and electricity sectors. Using the Balmorel energy system model, their findings indicate a reduction in overall system costs with a higher power-to-heat share. However, their results diverge from those of the present study regarding the anticipation of a significant increase in heat prices with decreased biomass utilization. This discrepancy can largely be attributed to Sneum et al.’s incorporation of a tax on power-to-heat and electricity grid tariffs across all scenarios, underscoring the substantial influence of regulatory frameworks and modeling assumptions on the outcomes of studies of this type.

5. Conclusions

This study investigates how variations in the energy-related properties of cities impact the optimal composition of an urban energy system in terms of technologies, so as to meet in a cost-efficient manner the demands for electricity, heating, and hydrogen, assuming the electrification of transportation and other industries. The results highlight the following:
  • In high electricity import capacity scenarios, the impacts of other properties in the city on the results are limited. In this scenario, electricity primarily originates from imports, which, in conjunction with the availability of urban flexibility measures, outcompete most local electricity production. Large-scale heat pumps combined with thermal energy storage and biogas boilers dominate the heating sector in all the modeled cities. Based on the assumptions outlined in this study, this assertion holds true for cities where the maximum import capacity is utilized up to 5000 h annually.
  • In situations where electricity imports are more restricted, the properties of each individual city assume a more crucial role in determining the most cost-effective energy system configuration:
    o
    The electricity-to-heat ratio of a city becomes crucial in terms of determining the optimal layout of the heating sector, as cities with a large heat demand relative to their electricity demand (low electricity-to-heat ratio) tend to favor a heating system that incorporates both heat pumps and CHP. In contrast, cities with a high electricity-to-heat ratio (exceeding 6 in Table 2) tend to incorporate a heating system that is based primarily on CHP in conjunction with high levels of thermal energy storage.
    o
    High electricity demand flexibility within a city, in which loads are shiftable over seasons, enables the synergistic use of solar PV and stationary batteries as a cost-efficient alternative.
  • Heating systems primarily reliant on power-to-heat emerge as the best option when biomass prices exceed 20 EUR/MWh for future electricity import costs assumed in this work. If biomass prices increase, a heating system that lacks the capacity to utilize power-to-heat through large-scale heat pumps and thermal energy storage runs the risk of encountering a substantial increase in marginal heat cost.

Supplementary Materials

The following supporting information can be downloaded at: https://www.mdpi.com/article/10.3390/en17153813/s1, Figure S1: Shares of heat production from the different production sources for three levels of taxes imposed on power-to-heat in the modeled cities. The black circular markers indicate the optimal normalized TES capacity for each model run (right-hand y-axis); Table S1: Assumed costs and technical data for the production and storage technologies included in the model [36,41,42]; Table S2: Assumed data for the modeled cities for Year 2050.

Author Contributions

Conceptualization, J.B., L.G. and F.J.; Methodology, J.B., L.G. and F.J.; Formal analysis, J.B.; Investigation, J.B.; Data curation, J.B.; Writing—original draft, J.B.; Writing—review and editing, L.G. and F.J.; Visualization, J.B.; Supervision, L.G. and F.J.; Project administration, F.J.; Funding acquisition, F.J. All authors have read and agreed to the published version of the manuscript.

Funding

This study was supported financially by the Mistra Electrification program.

Data Availability Statement

Restrictions apply to the availability of these data. Data were obtained from third party and are available [from the authors/at URL] with the permission of third party.

Conflicts of Interest

The authors declare that they have no known competing financial interests or personal relationships that could have influenced the work reported in this paper.

References

  1. International Energy Agency. Empowering Cities for a Net Zero Future; Organisation for Economic Co-Operation and Development (OECD): Paris, France, 2021. [CrossRef]
  2. REN21. Renewables 2019—Global Status Report 2019; REN21 Secretariat: Paris, France, 2019; Available online: https://www.ren21.net/wp-content/uploads/2019/05/gsr_2019_full_report_en.pdf (accessed on 2 November 2023).
  3. Puthalpet, J.R. Mitigation of Climate Change. Daunting Clim. Chang. 2022, 1454, 219–276. [Google Scholar] [CrossRef]
  4. International Energy Agency. World Energy Outlook; OECD/IEA: Paris, France, 2022; p. 524. Available online: https://www.iea.org/reports/world-energy-outlook-2022 (accessed on 10 September 2023).
  5. Perea-Moreno, M.-A.; Hernandez-Escobedo, Q.; Perea-Moreno, A.-J. Renewable Energy in Urban Areas: Worldwide Research Trends. Energies 2018, 11, 577. [Google Scholar] [CrossRef]
  6. Birk, S.; Brosig, C.; Waffenschmidt, E.; Schneiders, T. Influence of Sector Coupling in Future Inner City Low Voltage Grids. In Proceedings of the 2018 7th International Energy and Sustainability Conference (IESC), Cologne, Germany, 17–18 May 2018; pp. 1–8. [Google Scholar] [CrossRef]
  7. Robinius, M.; Otto, A.; Heuser, P.; Welder, L.; Syranidis, K.; Ryberg, D.S.; Grube, T.; Markewitz, P.; Peters, R.; Stolten, D. Linking the Power and Transport Sectors—Part 1: The Principle of Sector Coupling. Energies 2017, 10, 956. [Google Scholar] [CrossRef]
  8. Heinisch, V.; Göransson, L.; Odenberger, M.; Johnsson, F. Interconnection of the electricity and heating sectors to support the energy transition in cities. Int. J. Sustain. Energy Plan. Manag. 2019, 24, 57–66. [Google Scholar] [CrossRef]
  9. He, G.; Mallapragada, D.S.; Bose, A.; Heuberger-Austin, C.F.; Gençer, E. Sector coupling via hydrogen to lower the cost of energy system decarbonization. Energy Environ. Sci. 2021, 14, 4635–4646. [Google Scholar] [CrossRef]
  10. Khalil, M.; Dincer, I. Development and assessment of integrated hydrogen and renewable energy systems for a sustainable city. Sustain. Cities Soc. 2023, 98, 104794. [Google Scholar] [CrossRef]
  11. Azizi, E.; Ahmadiahangar, R.; Rosin, A.; Bolouki, S. Characterizing energy flexibility of buildings with electric vehicles and shiftable appliances on single building level and aggregated level. Sustain. Cities Soc. 2022, 84, 103999. [Google Scholar] [CrossRef]
  12. Li, D.J.; Li, D.Y.; Huang, D.J. Optimal Scheduling of Household Appliances in Urban Smart Home: Community Approaches to Socio-Economic Aspects of Urban Energy Transition. Sustain. Cities Soc. 2023, 101, 105156. [Google Scholar] [CrossRef]
  13. Bartolini, A.; Comodi, G.; Salvi, D.; Østergaard, P.A. Renewables self-consumption potential in districts with high penetration of electric vehicles. Energy 2020, 213, 118653. [Google Scholar] [CrossRef]
  14. Wang, Q.; Hou, Z.; Guo, Y.; Huang, L.; Fang, Y.; Sun, W.; Ge, Y. Enhancing Energy Transition through Sector Coupling: A Review of Technologies and Models. Energies 2023, 16, 5226. [Google Scholar] [CrossRef]
  15. Ramsebner, J.; Haas, R.; Ajanovic, A.; Wietschel, M. The sector coupling concept: A critical review. WIREs Energy Environ. 2021, 10, e396. [Google Scholar] [CrossRef]
  16. Arabzadeh, V.; Mikkola, J.; Jasiūnas, J.; Lund, P.D. Deep decarbonization of urban energy systems through renewable energy and sector-coupling flexibility strategies. J. Environ. Manag. 2020, 260, 110090. [Google Scholar] [CrossRef]
  17. de Chalendar, J.A.; Glynn, P.W.; Benson, S.M. City-scale decarbonization experiments with integrated energy systems. Energy Environ. Sci. 2019, 12, 1695–1707. [Google Scholar] [CrossRef]
  18. Pensini, A.; Rasmussen, C.N.; Kempton, W. Economic analysis of using excess renewable electricity to displace heating fuels. Appl. Energy 2014, 131, 530–543. [Google Scholar] [CrossRef]
  19. Eguiarte, O.; Garrido-Marijuán, A.; de Agustín-Camacho, P.; del Portillo, L.; Romero-Amorrortu, A. Energy, environmental and economic analysis of air-to-air heat pumps as an alternative to heating electrification in Europe. Energies 2020, 13, 3939. [Google Scholar] [CrossRef]
  20. Bloess, A.; Schill, W.-P.; Zerrahn, A. Power-to-heat for renewable energy integration: A review of technologies, modeling approaches, and flexibility potentials. Appl. Energy 2018, 212, 1611–1626. [Google Scholar] [CrossRef]
  21. Heinisch, V.; Göransson, L.; Erlandsson, R.; Hodel, H.; Johnsson, F.; Odenberger, M. Smart electric vehicle charging strategies for sectoral coupling in a city energy system. Appl. Energy 2021, 288, 116640. [Google Scholar] [CrossRef]
  22. Huang, P.; Munkhammar, J.; Fachrizal, R.; Lovati, M.; Zhang, X.; Sun, Y. Comparative studies of EV fleet smart charging approaches for demand response in solar-powered building communities. Sustain. Cities Soc. 2022, 85, 104094. [Google Scholar] [CrossRef]
  23. Pastore, L.M. Combining Power-to-Heat and Power-to-Vehicle strategies to provide system flexibility in smart urban energy districts. Sustain. Cities Soc. 2023, 94, 104548. [Google Scholar] [CrossRef]
  24. Pilpola, S.; Arabzadeh, V.; Mikkola, J.; Lund, P.D. Analyzing National and Local Pathways to Carbon-Neutrality from Technology, Emissions, and Resilience Perspectives—Case of Finland. Energies 2019, 12, 949. [Google Scholar] [CrossRef]
  25. Thellufsen, J.Z.; Lund, H. Roles of local and national energy systems in the integration of renewable energy. Appl. Energy 2016, 183, 419–429. [Google Scholar] [CrossRef]
  26. Heinisch, V.; Göransson, L.; Odenberger, M.; Johnsson, F. The impact of limited electricity connection capacity on energy transitions in cities. Smart Energy 2021, 3, 100041. [Google Scholar] [CrossRef]
  27. Sneum, D.M.; González, M.G.; Gea-Bermúdez, J. Increased heat-electricity sector coupling by constraining biomass use? Energy 2021, 222, 119986. [Google Scholar] [CrossRef]
  28. Lund, P. Large-scale urban renewable electricity schemes—Integration and interfacing aspects. Energy Convers. Manag. 2012, 63, 162–172. [Google Scholar] [CrossRef]
  29. Liu, Y.; Chen, S.; Jiang, K.; Kaghembega, W.S.-H. The gaps and pathways to carbon neutrality for different type cities in China. Energy 2021, 244, 122596. [Google Scholar] [CrossRef]
  30. IRENA. Sector Coupling in Facilitating Integration of Variable Renewable Energy in Cities. 2021. Available online: https://www.irena.org/publications/2021/Oct/Sector-Coupling-in-Cities (accessed on 7 November 2023).
  31. Arowolo, W.; Perez, Y. Rapid decarbonisation of Paris, Lyon and Marseille’s power, transport and building sectors by coupling rooftop solar PV and electric vehicles. Energy Sustain. Dev. 2023, 74, 196–214. [Google Scholar] [CrossRef]
  32. Göransson, L.; Goop, J.; Odenberger, M.; Johnsson, F. Impact of thermal plant cycling on the cost-optimal composition of a regional electricity generation system. Appl. Energy 2017, 197, 230–240. [Google Scholar] [CrossRef]
  33. Taljegard, M.; Göransson, L.; Odenberger, M.; Johnsson, F. To represent electric vehicles in electricity systems modelling—Aggregated vehicle representation vs. individual driving profiles. Energies 2021, 14, 539. [Google Scholar] [CrossRef]
  34. Sahlén, K.; Antonsson, E.; Bergerlind, J. Kartläggning av Hur Planerade Nätinvesteringar Avhjälper Kapacitetsbrist i Elnätet. 2020, p. 30. Available online: https://ei.se/om-oss/projekt/avslutade/kapacitetsutmaningen-i-elnatet#query/ (accessed on 10 August 2023).
  35. Svenska Kraftnät. Långsiktig Marknadsanalys Scenarier för Kraftsystemets Utveckling Fram till 2050. 2024. Available online: www.svk.se (accessed on 10 May 2024).
  36. Danish Energy Agency. Technology Data for Generation of Electricity and District Heating. 2022. Available online: https://ens.dk/en/our-services/projections-and-models/technology-data/technology-data-generation-electricity-and (accessed on 1 February 2023).
  37. Öberg, S.; Odenberger, M.; Johnsson, F. The cost dynamics of hydrogen supply in future energy systems—A techno-economic study. Appl. Energy 2022, 328, 120233. [Google Scholar] [CrossRef]
  38. Arabzadeh, V.; Pilpola, S.; Lund, P.D. Coupling variable renewable electricity production to the heating sector through curtailment and power-to-heat strategies for accelerated emission reduction. Futur. Cities Environ. 2019, 5, 1–10. [Google Scholar] [CrossRef]
  39. Jambagi, A.; Kramer, M.; Cheng, V. Electricity and heat sector coupling for domestic energy systems: Benefits of integrated energy system modelling. In Proceedings of the 2015 International Conference on Smart Cities and Green ICT Systems (SMARTGREENS), Lisbon, Portugal, 20–22 May 2015; pp. 66–71. [Google Scholar] [CrossRef]
  40. Gudmundsson, O.; Thorsen, J.E.; Brand, M. The role of district heating in coupling of the future renewable energy sectors. Energy Procedia 2018, 149, 445–454. [Google Scholar] [CrossRef]
  41. Staffell, I.; Pfenninger, S. Using bias-corrected reanalysis to simulate current and future wind power output. Energy 2016, 114, 1224–1239. [Google Scholar] [CrossRef]
  42. Pfenninger, S.; Staffell, I. Long-term patterns of European PV output using 30 years of validated hourly reanalysis and satellite data. Energy 2016, 114, 1251–1265. [Google Scholar] [CrossRef]
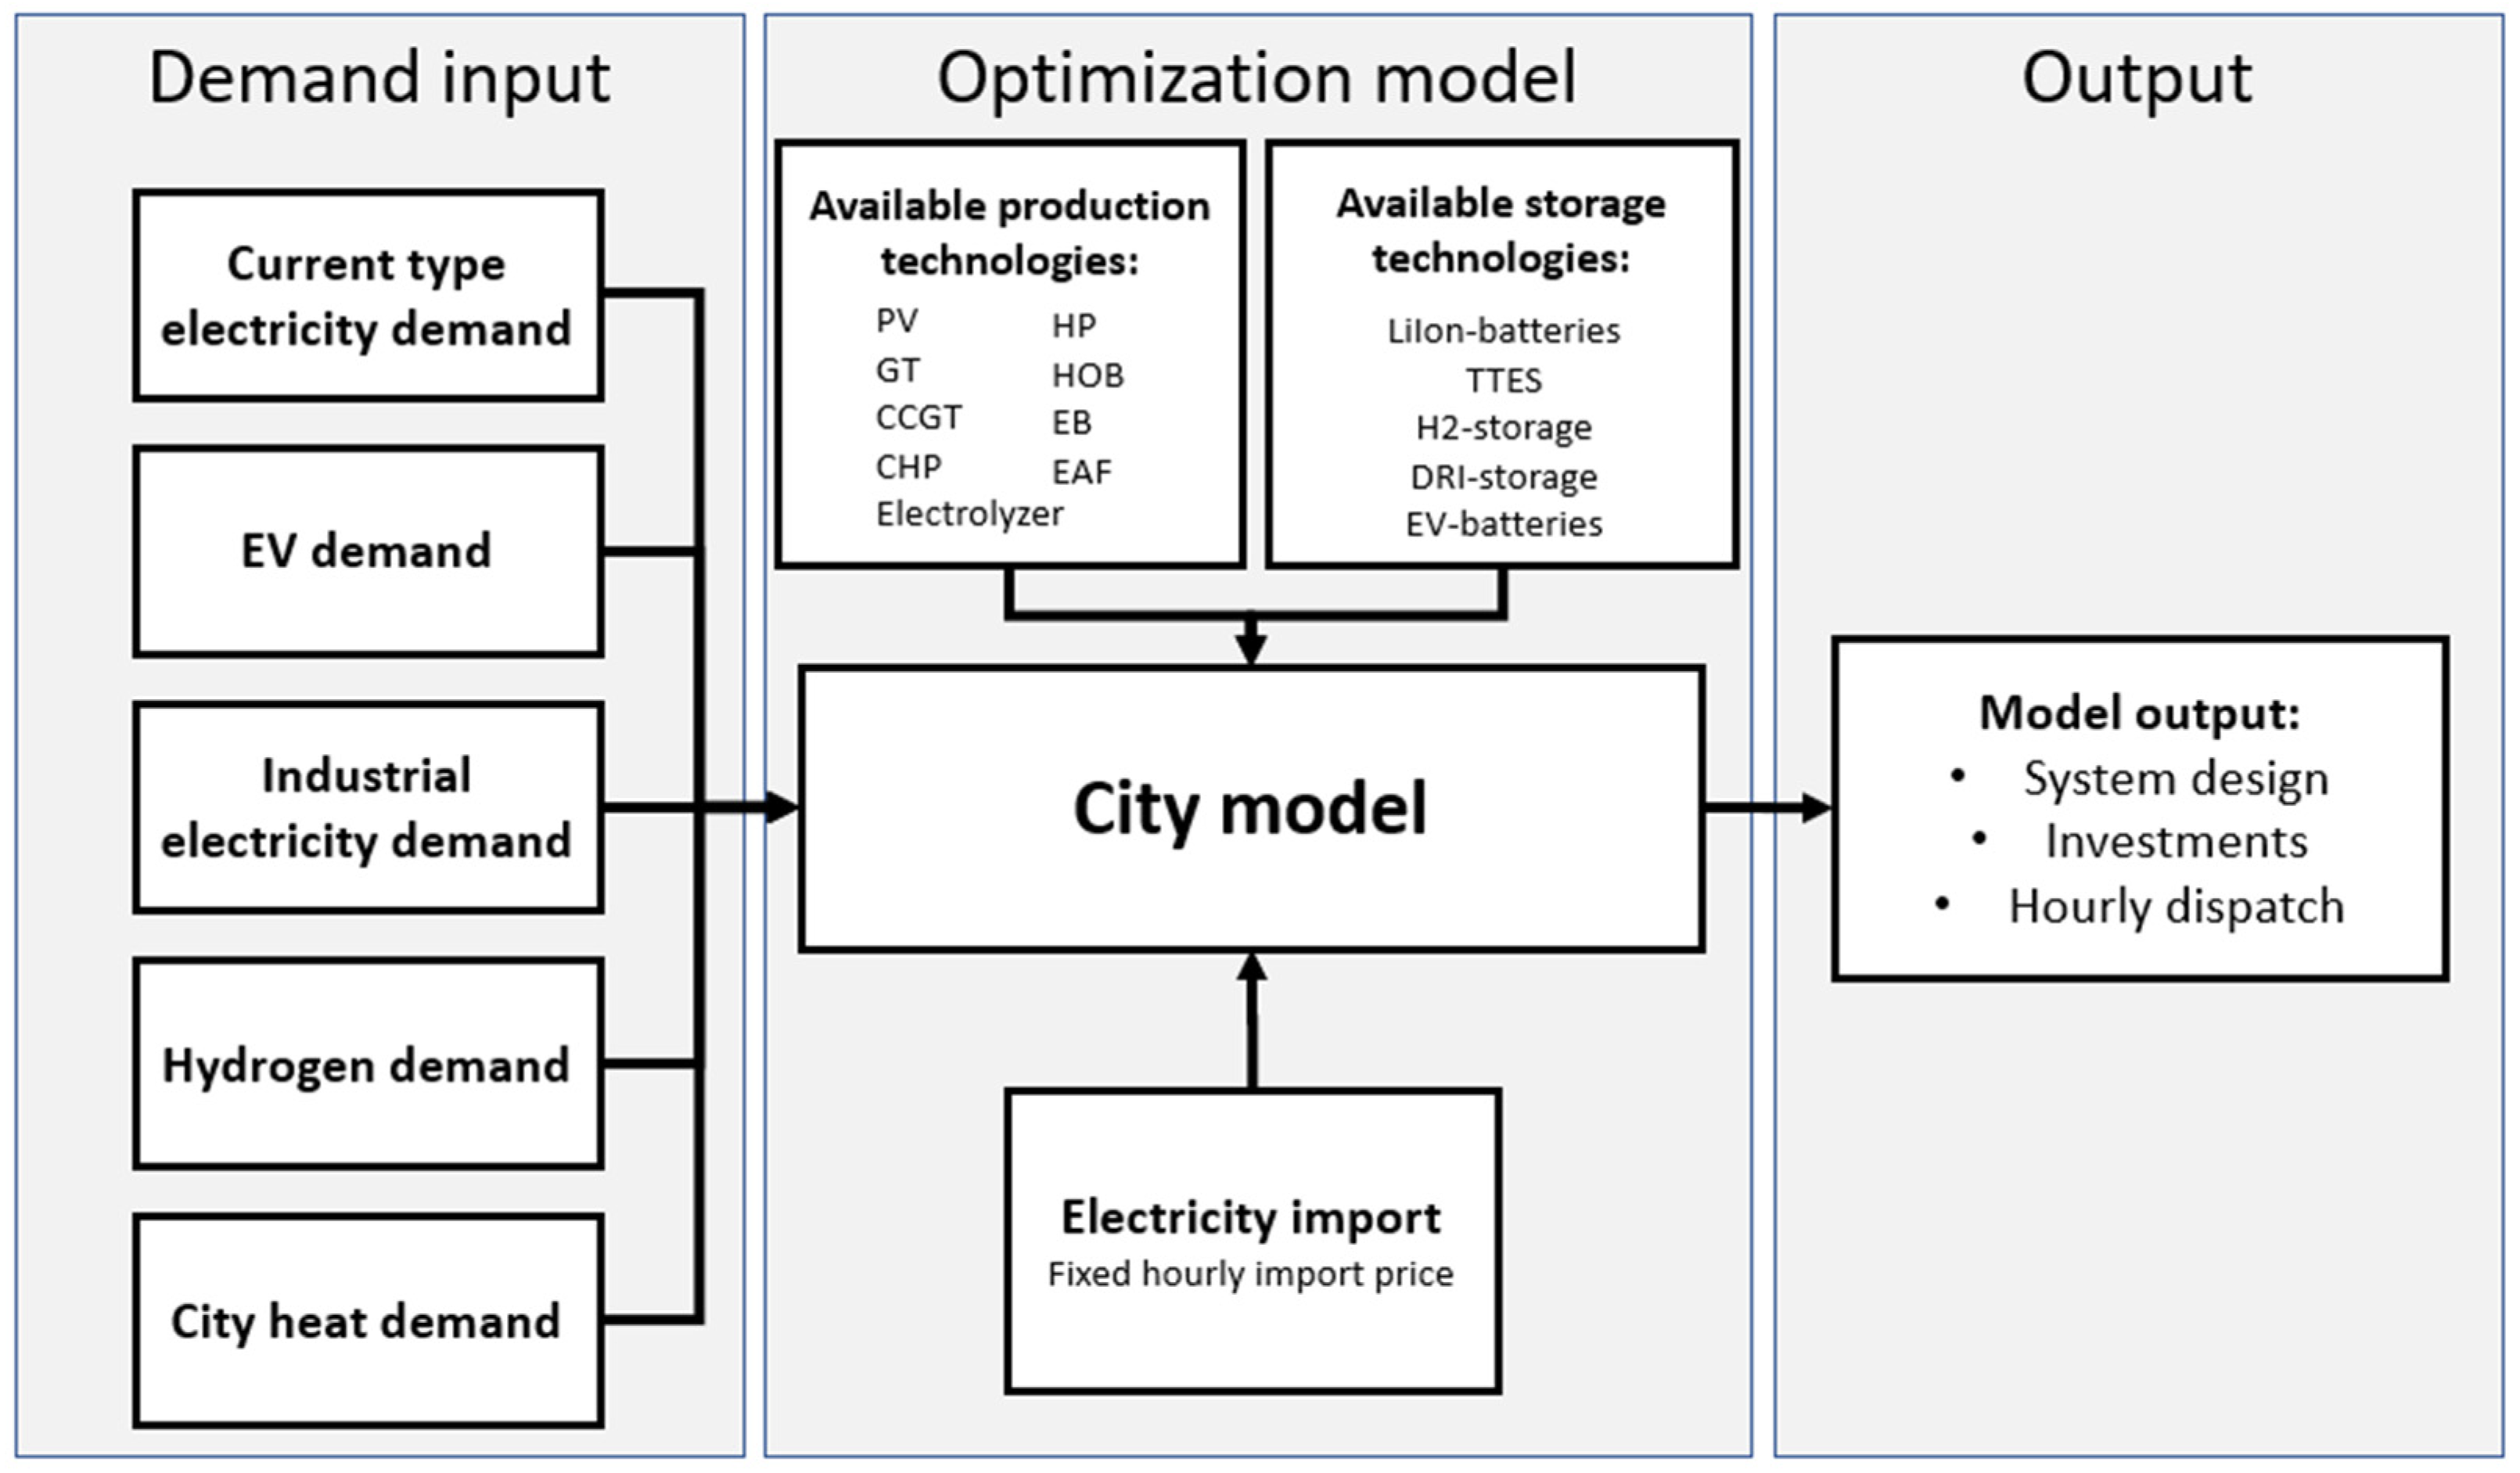
Figure 1. Overview of the city model applied in this work. The demands for electricity, heat, and hydrogen are attributed to each city. The optimization model then identifies the cost-optimal technology mix that can meet the demands for electricity, heat, and hydrogen, based on available production technologies, storage systems, and electricity imports. Output from the model is presented in the form of hourly dispatch for all the technologies, annual production levels, and investment sizes.
Energies 17 03813 g001
Figure 2. The annual electricity demand inputs for the modeled cities in the year 2050. The electricity demand is divided into different subcategories that indicate the origin of the electricity demand. Electricity used to produce heat is omitted from the figure since it is created endogenously in the model.
Energies 17 03813 g002
Figure 3. Prices for electricity imported to the cities over time. The blue line represents the projected electricity price based on a simulation of the weather for the year 2019, in the year 2050 energy system based on the model presented in [37]. The gray line represents the actual electricity spot market price for SE3 in the year 2019 as a comparison. The average price for electricity imported to the cities is approximately 40 EUR/MWh in both cases.
Energies 17 03813 g003
Figure 4. Heat production per year for the six cities and the two modeled scenarios. The different colors indicate different heat production sources and their supplied shares of the total annual heat demand.
Energies 17 03813 g004
Figure 5. Plot A: Cluster centroids of the three identified technology combinations designed to supply, in an optimal manner, the heat in the modeled cities. Plots B–D: Results for all the modeled cities, grouped according to the cluster to which they belong. For the parameters displayed with percentage (%) as the unit, the values in the figure represent the modeled shares of total heat originating from that source, excluding waste heat. For the other parameters, the values indicate the normalized installed capacity of the technology [%-cap].
Energies 17 03813 g005
Figure 6. The levels of heat supplied by the different technologies in the modeling cases LUL_high, MMO_low, and LUL_low during a period of 6 months (January–June). Each city represents a technology cluster, as illustrated in Figure 5. The charging of TES is included as a negative value to indicate when the charging of the thermal storage is carried out. The electricity import cost is indicated on the right axis.
Energies 17 03813 g006
Figure 7. Annual electricity production levels for the six cities and two modeled scenarios. The different colors indicate different electricity sources and their shares of the total annual supply of electricity.
Energies 17 03813 g007
Figure 8. Plot A: The cluster centroids of the three technology combinations were identified as optimally supplying electricity in the modeled cities. Plots B–D: The results for all the modeled cities, grouped according to the cluster of their belongings. For the parameters displayed with percentage [%] as the unit, the values in the figure represent the modeled share of total electricity originating from that source. For the other parameters, the values indicate the normalized installed capacity of the technology [%-cap].
Energies 17 03813 g008
Figure 9. Amounts of electricity supplied by the different technologies in the LUL_high, NRP_low, and LUL_low modeling cases during the entire year. Each plot represents a technology cluster that is illustrated in Figure 8. The y-axis includes negative values in Plots 2 and 3 because electricity is exported from the modeled city. The electricity import price is indicated on the right-hand y-axis.
Energies 17 03813 g009
Figure 10. The used share of the total electricity import capacity to the cities for all 12 modeled cases, grouped into their corresponding technology combinations to optimally supply heat, as illustrated in Figure 5. The values have been sorted from highest (to the left) to lowest (to the right).
Energies 17 03813 g010
Figure 11. Summary of the impacts of the city characteristics on the obtained results. Shown are the key energy-related properties of the cities (in the gray boxes) and how these relate to the modeling outcomes in terms of the resulting heat and electricity technology combinations (from Figure 5 and Figure 8).
Energies 17 03813 g011
Figure 12. Annual production levels of heat for the modeled cities, when subjected to four different biomass price levels (suffixes in the column labels): 10, 20, 30, and 50 EUR/MWh. The 30 EUR/MWh level should be regarded as the reference case because this value was used when modeling the previous results in the study. An electricity import capacity corresponding to the high import capacity scenario has been used. CHP_bio, combined heat and power fueled by solid biomass fuels; HP, heat pump; HOB_BG, heat-only boilers fueled by biogas; EB, electric boiler.
Energies 17 03813 g012
Figure 13. Average marginal cost of heat for all the cities for four different biomass price levels, for two cases: No HP and forced HP. In the no HP case, heat pumps are excluded from the urban technology mix. In the forced HP case, a minimum level of heat pumps equal to the capacity installed in the high import scenario with a biomass price of 30 EUR/MWh is introduced.
Energies 17 03813 g013
Table 1. Description and mathematical formulation of all constraints included in the city model.
Type of ConstraintDescription of Constraint
Electricity import capacity Electricity import and export is limited by maximum capacity
M E l ,     C A P w t i m p M E l , C A P
Electricity production Electricity production is always lower than the installed capacity per technology type.
p i , t s i     i   I e l
Heat production Heat production is always lower than the installed capacity per technology type.
q i , t s i     i   I H
Storage level batteries Storage level in stationary batteries in the next timestep is equal to the level in previous timestep plus charging minus discharging.
l t b a t = l t 1 b a t + b t c h b t d c h
Maximum storage batteriesStorage level in stationary batteries is always lower than the installed storage capacity.
l t b a t s b a t
Charging/discharging batteries The charging and discharging of stationary batteries are limited by the installed charging capacity.
b t d c h ,   b t c h s b a t , c a p
Storage level TES Storage level in TES in the next timestep is equal to the level in previous timestep plus charging minus discharging of heat.
l t T E S = l t 1 T E S + q t c h q t d c h
Maximum storage TESStorage level in TES is always lower than the installed storage capacity.
l t T E S s T E S
Charging/discharging TES The charging and discharging of TES are limited by a factor times the installed storage capacity.
h t d c h ,   h t c h s T E S   N T E S
Storage level H2 Storage level in H2-storage in the next timestep is equal to the level in previous timestep plus charging minus discharging of H2.
l t + 1 H 2 l t H 2 + h 2 t g e n D H 2
Maximum storage H2 Storage level in H2-storage is always lower than the installed storage capacity.
l t H 2 s H 2 , s t
Charging/discharging H2 The charging and discharging of H2 is limited by a factor times the installed storage capacity.
h 2 t d c h ,   h 2 t c h s H 2 , s t   N H 2 , s t
Storage level direct reduced iron (DRI) Storage level in DRI-storage in the next timestep is equal to the level in the previous timestep plus charging minus discharging of DRI.
l t + 1 D R I l t D R I + D R I g e n d t D R I
Maximum storage DRI Storage level in DRI-storage is always lower than the installed storage capacity.
l t D R I s D R I , s t
Hourly DRI demandThe hourly DRI-demand is limited by the installed electric arc furnace capacity.
d t D R I s E A F
Annual DRI demand The sum of DRI demand over the year must equal the supplied amount of DRI.
t T d t D R I = D R I g e n 8760  
Maximum PV capacity Installed capacity of PV is less than the maximum capacity based on city size.
s P V       M P V , c a p
Thermal cyclingCycling of thermal plants is limited by introducing a start-up cost when increasing production output and limited by start-up times, depending on type of technology. See [32] for details.
EV charging patternLimitations on charging patterns for electric vehicles. See [33] for details.
Table 2. Description of symbols used in equations.
SymbolDescription of Symbol
b t c h is the charging of stationary batteries at time t.
b t d c h is the discharge of electricity from stationary batteries at time t.
C t i m p is the import cost of electricity to the city at time t.
C i i n v is the annualized investment cost per technology i.
C i O M f i x is the fixed operation and maintenance cost per technology i.
C i , t p a r t l o a d is the additional cost of running technology i at part load at time t.
C i r u n is the running cost of technology i, including variable operation and maintenance cost and fuel cost.
C i , t s t a r t is the additional cost associated with starting technology i at timestep t.
C t o t is the total annual system cost to be minimized.
D c o n s t is the added constant industrial electricity demand.
d t D R I is the demand of DRI at time t.
D t e l is the electricity demand in the city at time t.
D H 2 is the demand for hydrogen (constant).
D t h e a t is the heat demand at time t.
D R I g e n is the production level of DRI (constant).
E A F t e l is the electricity demand in the EAFs at time t.
E V t c h is the electricity used to charge electric vehicles at time t.
E V t V 2 G is the discharge of electricity from electric vehicles at time t.
h 2 t e l is the electricity demand of the electrolyzers to produce hydrogen at time t.
h 2 t g e n is the production level of hydrogen in electrolyzers at time t.
h i , t c h is the heat charged in TES at time t.
h i , t d c h is the heat discharged from TES at time t.
Iis the set of all technologies allowed in the city energy system.
I e l is a subset of all technologies producing electricity.
I H is a subset of all technologies producing heat.
I P t H is a subset of all technologies producing heat from electricity.
I T E S is a subset of all technologies storing thermal energy.
l t b a t is the electricity storage level in stationary batteries at time t.
l t D R I is the level of DRI in the DRI storage at time t.
l t H 2 is the level of hydrogen in the hydrogen storage at time t.
l t T E S is the storage level in the thermal energy storage at time t.
M E l , C A P is the electricity import capacity.
M P V , c a p is the capacity limit for solar PV in a city.
N H 2 , s t is a factor limiting the charging and discharging rate from H2 storage.
N T E S is a factor limiting the charging and discharging rate from TES storage.
p i , t is the electricity produced from technology i at timestep t.
q i , t is the heat produced from technology i at timestep t.
s i is the installed capacity of technology i.
Tis the set of all timesteps.
w t i m p is the level of import to the city at time t.
W H t i n d is the available industrial waste heat at time t.
η i is the efficiency of power-to-heat technologies. This correlates to COP for HP and thermal efficiency of EB.
Table 3. The main energy-related city properties for each selected city. The electricity-to-heat ratio is calculated by dividing the total annual electricity demand by the total annual heat demand. Electricity demand flexibility is categorized based on the total share of demand that is flexible in time. More information on the individual cities is provided in Supplementary Table S2.
City IDElectrification DriversElectricity Demand FlexibilityElectricity-to-Heat RatioWaste Heat Availability
LULEAF, Data centersVery high6.4Medium
MMOEV, Current industryLow2.0No
STHData centers, EVLow1.4No
SKTData centers, Battery factoryVery low7.9High
NRPHydrogen, Current industryHigh5.4No
GBGHydrogen, Battery factoryHigh3.4Medium
Table 4. Applied investment costs and technical lifetimes in the study. Details on operational costs and technical limitations are found in Supplementary Table S1.
TechnologyTechnical Lifetime (Years)Investment Cost (EUR/kW)
Production technologies
Solar PV (PV)40525
Gas turbine biogas (GT_BG)25520
Combined-cycle gas turbine biogas (CCGT_BG)25800
Electric boiler (EB)2060
Heat pump (HP)25830
Heat only-boiler biomass (HOB_bio)20400
Heat only-boiler biogas (HOB_BG)2550
Combined heat and power biomass (CHP_Bio)253200
Electric arc furnace (EAF)401294
Electrolyzer25500
Storage technologies
Lithium ion battery storage (LiIon-bat)2575
Lithium ion battery discharge capacity (LiIon-cap)2560
Tank thermal energy storage (TTES)258
Direct reduced iron storage (DRI-storage)400.1
Hydrogen storage (H2-storage)3011
Disclaimer/Publisher’s Note: The statements, opinions and data contained in all publications are solely those of the individual author(s) and contributor(s) and not of MDPI and/or the editor(s). MDPI and/or the editor(s) disclaim responsibility for any injury to people or property resulting from any ideas, methods, instructions or products referred to in the content.