Article

Adaptability Evaluation of Power Grid Planning Scheme for Novel Power System Considering Multiple Decision Psychology

1
State Key Laboratory of Alternate Electrical Power System with Renewable Energy Sources, North China Electric Power University, Beijing 102206, China
2
Department of Economic Management, North China Electric Power University, Baoding 071000, China
*
Author to whom correspondence should be addressed.
Energies 2024, 17(15), 3672; https://doi.org/10.3390/en17153672
Submission received: 31 May 2024 / Revised: 8 July 2024 / Accepted: 22 July 2024 / Published: 25 July 2024
(This article belongs to the Topic Advances in Power Science and Technology)

Abstract

:
With a substantial fraction of renewable energy integrated into the electrical grid, the new power system urgently requires grid planning scheme displaying adaptability to different energy types and their volatility. Considering the indeterminacy of renewable energy generation output and the different attitudes of decision-makers towards its risk, this paper proposes an adaptability assessment methodology for power grid planning schemes considering multiple decision psychology. First, an evaluation indicator framework is established based on the adaptive requirements of the grid planning for novel power system, and the weights of indicators are calculated based on an improved AHP-CRITIC combination weighting method. Second, improved cumulative prospect theory (ICPT) is adopted to improve to the calculation method of the distance between the evaluation program and the positive and negative ideal programs in the GRA and TOPSIS, which effectively characterize the different decision-making psychologies, and a combination evaluation model is constructed based on a cooperative game (CG), namely, an adaptability evaluation model of grid planning schemes for novel power systems based on GRA-TOPSIS integrating CG and ICPT. Finally, the proposed model serves to evaluate grid planning schemes of three regions in China’s 14th Five-Year Plan. The evaluation results show that the adaptability of the schemes varies under different decision-making psychologies, and under the risk-aggressive and loss-sensitive decision-making psychologies, grid planning scheme of Region 1 with the greatest accommodation capacity of renewable energy is preferable.

1. Introduction

With the increasing energy crisis and environmental pollution, China is committed to constructing a novel power system mainly composed of new energy to promote the clean and low-carbon transformation of energy [1]. In the future, the substantial integration of renewable energy generation will emerge as a pivotal characteristic of the novel power system, but its stochastic and intermittent nature will pose a serious challenge to the existing power grid [2,3]. In view of the central position of the power grid in power transmission and distribution, the adaptability of its planning scheme is decisive for ensuring the stable operation and economic benefits of the novel power system [4,5]. Therefore, there is an immediate need to assess the adaptability of the grid planning approaches for novel power system to efficiently identify the weaknesses, rationally construct the grid, and offer guidance for ensuring the system’s future economic and stable functioning [6].
Recently, academics have conducted extensive research on evaluating the adaptability of grid planning schemes for emerging power systems. In [7], the authors pointed out that the grid planning for a novel power system should adapt to the new challenges brought by the development of new energy sources, and more attention should be paid to the adaptability of different energy types and the volatility of different power sources. In [8], the authors believed that upon the interconnection of a substantial proportion of renewable energy sources to the grid, a comprehensive assessment of the grid planning scheme’s adaptability must encompass both the grid’s intrinsic properties and its interactions with external factors. This constituted a vital aspect in evaluating and appraising the grid’s construction quality, serving as a feedback mechanism for enhancing subsequent construction quality and operational performance of the grid planning.
In assessing the adaptability of distribution network planning, the technical indicators for instance capacity expansion margin, power supply capacity margin, and expandability were proposed to construct an evaluation index system, and then AHP methodology was employed to derive the comprehensive score of the planning scheme [9]. In [8], some technical indicators, for instance, load ratio, current, power quality, operating life, and new energy utilization rate, were considered to construct an adaptability evaluation index system of distribution network planning schemes; entropy weight and the AHP method were adopted to calculate weight; then, TOPSIS was used to construct the evaluation model. In [10], the complexity of the grid structure after the significant integration of renewable energy sources was considered, and for the planning of distribution network under the big data environment, the adaptability evaluation index system was established by selecting technical indicators from five perspectives: grid structure, power supply capacity, equipment level, load characteristics, and grid integration of new elements; then, the planning scheme was evaluated employing the back propagation neural network (BNPP) method. On this basis, in [11], the authors considered the economic and environmental benefits brought about by the substantial integration of renewable energy sources into the grid, proposed an evaluation index system of distribution grid planning adaptability, which contains equipment operation status, power supply reliability, economy, and environmental friendliness, and adopted a variety of empowerment methods for combined empowerment; evaluation results were obtained through the AHP method.
In assessing the adaptability of transmission grid planning, in [12], the efficiency benefits of transmission grid planning scheme were considered to propose the evaluation index system of system scale, development, and environment. Then G1 method and GRA method were adopted for combination assignment, and the fuzzy comprehensive evaluation approach was employed to derive the assessment outcomes. In [13], the evaluation index system was formulated encompassing the dimensions of economy, technology, reliability, and new energy acceptance capacity, and the “Over-Average Penalty” entropy weight method was employed to allocate weights to the indicators; then, a comprehensive evaluation method based on high penetration of new energy (HPNE) was proposed. Moreover, in [14], the impact of flexibility and vulnerability on the grid planning scheme was considered, and the IFAHP method was adopted for the assignment of indicators and comprehensive evaluation.
In summary, the current study exhibits the following weaknesses: (1) mainly, studies are focused separately on the adaptability evaluation of the transmission or distribution network, while few studies consider the coordination factors among all levels of a power grid, and the new needs generated by the grid planning for a novel power system, to construct the evaluation index system; (2) in the process of grid planning for novel power system, due to the significant uncertainty in the renewable energy power, it is necessary to fully consider the different attitudes of decision-makers towards risk when constructing the evaluation model. However, current studies generally ignore the influence of decision-making psychological factors on the evaluation results, and tend to use a single evaluation model, which may lead to a large limitation in the results. Thus, it is difficult to comprehensively reflect the complexity of the real decision-making environment, which may lead to bias or conflict in the practical application.
Therefore, this paper introduces a methodology for assessing the adaptability of power grid planning schemes for a novel power system considering multiple decision psychology, and the key contributions of this paper are outlined as follows:
(1)
A comprehensive evaluation index system of power grid planning adaptability is established, which comprehensively addresses the emerging requirements of grid planning for the novel power system, including economy adaptability, energy structure adaptability, power grid structure adaptability, reliability adaptability, and environment adaptability.
(2)
An improved cumulative prospect theory (ICPT) is introduced into the evaluation model to effectively characterize the different decision-making psychologies, which enhances the adaptability to the uncertainty of renewable energy and makes the evaluation results more realistic.
(3)
A combination evaluation method based on a cooperative game (CG) is constructed, fully contributing to the advantages of different evaluation models to make the evaluation results fairer.
The subsequent sections of this paper are structured as follows: In Section 2, the adaptive requirement of grid adaptive planning for novel power system are analyzed. Section 3 describes the adaptability evaluation index system of power grid planning scheme for novel power system. Section 4 presents the weighting method and adaptability evaluation model of grid planning scheme for novel power system based on GRA-TOPSIS integrating CG and ICPT. Section 5 presents case studies and comparative analysis of the results. Lastly, Section 6 concludes this study.

2. Adaptive Requirements of Grid Planning for Novel Power System

In the context of developing a novel power system characterized by a high integration of renewable energy sources, the characteristics of the power grid have undergone tremendous changes: from passive network to active network, from one-way to two-way power flow, from pure consumption to both production and consumption, from rigid demand to adjustable and controllable, and from source–network coordination to source–network–load–storage coordination [15]. Therefore, due to the transformation of the distinctive features of the power grid, power grid planning is facing many new demands, as shown in Figure 1:

2.1. Adaptive Requirements for Economic

To propel the transformation and upgrading of the power system, the power grid needs to accelerate its digital transformation urgently. This will enable it to optimize the allocation of multiple factors, effectively fulfill its platform role, and facilitate the in-depth development of the energy revolution [16]. In this process, the first step in power grid planning is to focus on the economic aspect of each link, including sourcing, networking, loading, and storage. It is crucial to fully consider the impact of various power sources, electric vehicles, and energy storage on load forecasting. This comprehensive approach enhances the overall planning concept, shifting the focus from the main power grid to the broader power system extension. The second consideration is to anticipate the increase in electricity demand and load, implementing proactive planning and construction of the power grid. This foresighted approach ensures efficient scalability and adaptability of the grid network. Furthermore, enhancing the deployment of intelligent terminals and improving the distribution communication network are essential. These actions boost the observability, measurability, adjustability, and controllability of the power grid, thereby enhancing its internal rate of return. Ultimately, this translates into a reduction in the overall lifecycle expenditure of power grid development.

2.2. Adaptive Requirements for Energy Structure

In the novel power system, non-fossil energy sources, notably hydroelectric, wind, and solar power, will progressively emerge as the primary sources of installed capacity and electricity generation [17]. Nevertheless, China faces a persistent challenge of mismatched distribution between clean energy resources and demand, with water resources concentrated in the southwest, wind and solar resources predominantly in the “Three-North” regions, and electricity demand heavily skewed towards the eastern, central, and southern regions [18]. Ultrahigh-voltage transmission emerges as a pivotal solution for facilitating long-distance, large-scale power transmission, thereby enhancing new energy integration capabilities and mitigating wind and solar curtailment issues [19]. As new energy sources integrate on a massive scale, cross-regional power transmission will inevitably escalate. Consequently, power grid planning necessitates the development of ultra-high-voltage and various levels of power grids to enhance the power grid’s capacity to accept new energy sources.

2.3. Adaptive Requirements for Grid Structure

Under the “Peak Carbon and Carbon Neutral” goal, the penetration rate of distributed power generation and the proportion of electricity to end energy consumption will continue to increase [20]. Emerging new loads, represented by electric vehicles, will scale up significantly, leading to the normalization of the integrated production and sales model. As new energy sources are increasingly integrated into the power grid on a large scale, issues such as equipment overload and declining power quality are gradually becoming prominent, placing higher demands on the substation capacity. When planning the grid, the flexible coordination between the transmission and distribution networks should be considered, and the potential for transformation and intelligent upgrade of grid construction should be enhanced at the planning stage to facilitate the harmonious integration of large-scale new energy sources with the power grid [21]. At the same time, substation full stop and turn rate should be improved. When the power outage is caused by special circumstances, the power grid structure should respond positively enough to transfer the power load to other normally operating substation buses and quickly restore power supply.

2.4. Adaptive Requirements for Reliability

Considering economic globalization, the establishment of a contemporary industrial system is speeding up, the eco-friendly transition of conventional industries is picking up pace, and the high-tech manufacturing sector is gradually emerging as the primary catalyst for progress. As people’s expectations for an improved quality of life rise, there arises a critical requirement for power grid design to holistically enhance the electricity supply quality [22]. Moreover, the substantial share of renewable energy power fluctuations transforms the initial unidirectional random demand alteration system into a bidirectional random modification system, resulting in challenges such as diminished inertia and insufficient voltage support capabilities. To safeguard grid security and elevate power quality standards, it is imperative to augment investments in reliability during the planning phase.

2.5. Adaptive Requirements for Environment

Traditional power grid planning aims to enhance the economic efficiency of the system while meeting specific stability and reliability criteria. Under the “Peak Carbon and Carbon Neutral” goal, power grid planning should prioritize safety and environmental friendliness. Building upon the existing standards for reliability and cost-effectiveness, power grid planning must now incorporate heightened environmental protection measures. The focus of planning and design needs to shift from solely ensuring safety to achieving a balance between safety and sustainability.

3. Construction of Evaluation Index System

This paper adheres to the principles of scientific rigor, comprehensiveness, independence, applicability, and operability in the construction of the index system. An adaptability evaluation index system of power grid planning scheme for novel power system is established by integrating the adaptive requirement of grid adaptive planning for novel power system. This index system encompasses five key dimensions, including economic adaptability, energy structure adaptability, grid structure adaptability, reliability adaptability, and environment adaptability. The adaptability evaluation index system are shown in Table 1.

3.1. Economic Adaptability

Economic adaptability refers to the adaptability and support capacity of a new power grid project to future economic development. The load growth rate of the region is directly affected by the level of local economic development. As the load increases, the maximum transmission capacity of the grid will be insufficient to supply the load demand. So, the capacity construction and economic cost of spare capacity for future development should be balanced in the grid planning, which enhance the grid’s ability to resist uncertainties in the future. Therefore, this paper proposes that secondary indicators of economic adaptability include elasticity coefficient of power production, investment revenue expansion ratio, additional load capacity per unit investment, and additional electricity supply per unit investment [23].

3.2. Energy Structure Adaptability

In the assessment of power grid planning, energy structure adaptability constitutes a pivotal evaluation dimension, assessing the grid’s capacity to accommodate shifts in energy composition. Amid the ongoing transformation of energy mix and the proliferation of renewable energy sources, grid planning necessitates a comprehensive consideration of clean energy’s share within the energy structure, along with the grid’s resilience to integrate new energy forms, ultimately ensuring grid stability and optimizing energy utilization efficiency. Therefore, this paper proposes that secondary indicators of energy structure adaptability include the proportion of clean energy and capacity to accommodate renewable energy.

3.3. Grid Structure Adaptability

The evaluation framework for energy grid structural adaptability primarily aims to secure that the grid can flexibly and effectively respond to various load changes, resource allocations, and emergencies. These measures guarantee a stable supply of electricity and improve a power supply reliability, thereby fostering optimal resource allocation and enabling sustainable grid development. Therefore, this paper proposes that secondary indicators of grid structure adaptability include substation full stop and turn rate, capacity ratio of transformer, capacity expansion margin of substation, remaining interval ratio, line capacity-to-load ratio, and line loss rate [24].

3.4. Reliability Adaptability

In the evaluation of grid planning, reliability adaptability is essential metric for measuring whether the grid system can provide power supply to customers in a continuous and stable manner when facing various uncertainties. The integration of large-scale renewable energy into the grid presents new challenges to the reliability of the grid, especially considering the randomness in both power supply and load during summer and winter load peaks. Therefore, this paper proposes that secondary indicators of reliability adaptability include the N-1 pass rate of power lines, N-1 pass rate of transformers, voltage compliance rate, and mean power supply reliability [8,25].

3.5. Environment Adaptability

As global attention to climate change and environmental protection continues to grow, the power sector, as one of the major areas of energy consumption and greenhouse gas emissions, bears an important responsibility for reducing environmental impacts. Considering environmental constraints, the impact of high-ratio renewable energy integration on mitigating grid-connected emissions must be assessed. This assessment is crucial for evaluating the planning scheme’s compatibility with impending environmental demands. Therefore, this paper proposes that secondary indicators of environment adaptability include CO2 emission reduction, NOX emission reduction, and SO2 emission reduction.

4. Construction of Evaluation Method Considering Multiple Decision Psychology

4.1. Framework of the Evaluation Method

The volatility, intermittency, and randomness in renewable energy output in a novel power system have a profound impact on grid planning. The risk attitude of decision-makers directly leads to the extent to which the grid planning scheme can adapt to the grid-connected capacity of renewable energy in advance. Therefore, this paper considers the impact of multiple psychological factors of decision-makers on evaluation results and expands the cumulative prospect theory into an improved method that includes multiple risk attitudes and multiple profit and loss attitudes. On this basis, in order to weaken the one-sidedness of the results caused by a single evaluation method, this paper combines the subjective and objective factors in the evaluation process and the impact of different measures on the evaluation results. The evaluation results of the GRA method are more subjective and based on geometric similarity measures, while the evaluation results of the TOPSIS method are more objective and based on distance similarity. We combined these two methods with ICPT to build two different evaluation models, namely, ICPT-GRA and ICPT-TOPSIS. Then, in order to ensure the fairness and rationality of the evaluation results, the results of the two evaluation models were scientifically coupled based on the ideas of CG and overall difference maximization. In addition, in order to improve the accuracy of the weights, this paper considers the impact of subjective and objective factors on the weights and adopts an improved AHP and CRITIC indicator combination weighting method. Based on the above, this paper proposes an adaptability evaluation method of grid planning scheme for a novel power system considering multiple decision psychology.
Figure 2 shows the flow chart of the adaptability evaluation method of the grid planning scheme for a novel power system considering multiple decision psychology. Firstly, the subjective weight of the improved AHP method is obtained based on expert scores, the objective weight of the CRITIC method is obtained based on the original evaluation data, and the optimal combination weight is obtained based on the minimum deviation combination weighting method. Secondly, the comprehensive prospect values are calculated based on the ICPT-GRA method and the ICPT-TOPSIS method. Finally, based on CG and overall difference maximization, the combined weight coefficient of the results of the two evaluation methods is obtained, and the combined comprehensive prospect value is calculated, which is the evaluation result.

4.2. Weighting Method Based on Improved AHP-CRITIC

4.2.1. Subjective Weight Calculation Based on Improved AHP

At present, AHP is a method widely used in power grid planning evaluation, and mostly uses a 1–9 scale to weigh the significance between indicators to determine the weight value. However, in actual engineering, it is difficult for decision-makers to make such detailed distinctions between the differences in indicators, resulting in errors; and when calculating weights, decisions may not be made when the judgment matrix dissatisfies the consistency check. In response to the above problems, this paper proposes a method by assigning a three-scale value based on the significance of every two indicators to improve the judgment matrix. And by constructing a consistency matrix to omit the consistency check step, the calculation process is simplified, and the decision-making efficiency and accuracy are improved. The key steps for improvement are as follows:
(1)
Improved judgment matrix
A three-scale evaluation method on the basis of the importance of elements is introduced in this paper, categorized as significant, equally significant, and insignificant. This approach requires only the comparison of whether elements are important, without the need to compare their relative importance. This makes for a more intuitive matrix construction, omitting the step of the consistency test of judgment matrix, and eventually simplifying subsequent calculations. Additionally, it becomes easier to determine the degree of importance between indicators. The specific steps of matrix construction are as follows:
(a)
Experts select the importance of each indicator;
(b)
Based on the opinions of experts, a judgment matrix A = a i j n × n is formed, with the following parameters:
a i j = 1 , E l e m e n t   j   i s   l e s s   s i g n i f i c a n t   t h a n   i   0 , T h e   s i g n i f i c a n c e   o f   e l e m e n t   i   a n d   j   i s   s a m e 1 , E l e m e n t   j   i s   m o r e   s i g n i f i c a n t   t h a n   i
where a i j represents the value obtained from comparing the element i with the element j . When i = j , it is stipulated that holds the same level of importance when compared to itself, that is, a i i = 0 . a i i is the comparison of the element itself. When i j , the element j is less significant than the element i and the value is assigned as 1, otherwise as −1.
(2)
Improve matrix consistency
One approach to determine the significance of each element in AHP is through the empirical method, but because people’s understanding of things is subjective, it may fail to capture objective facts accurately. Traditional AHP requires consistency testing of the judgment matrix because of discontinuity in expert judgment on multi-indicator. If it is inconsistent, mathematical methods need to be used to adjust it, thereby increasing the computational complexity of the problem. However, if a consistent matrix can be constructed from the start, the consistency test can be omitted, allowing for the matrix to inherently satisfy the consistency requirements and thus simplifying the process of matrix calculation.
(3)
Construct an antisymmetric matrix
Let there be n -order real matrices A = a i j n × n and B = b i j n × n , where i = 1 , 2 , , n ;   j = 1 , 2 , , n .
Definition 1.
For a real matrix  A , if j = 1 , 2 , , n , and there is always a i j = a j i , then it is called an antisymmetric matrix A .
Based on Equation (1) and incorporating expert opinions, the judgment matrices A is constructed. From definition 1, it can be seen that the matrix A must be an antisymmetric matrix, and the size of the matrix varies according to the number of indicators.
A = a 11 a 12 a 1 j a 1 n a 21 a 22 a 2 j a 2 n     a i 1 a i a i j a i n     a n 1 a n 2 a i j a n n
(4)
Solve the optimal transfer matrix
Definition 2.
If the antisymmetric matrix  A satisfies  a i j = a i k + a k j  , then the matrix  A  must be a transfer matrix. If matrix  A  is a transfer matrix, it is necessary to fulfill the above condition for all  k  less than or equal to the dimension of matrix. Among them,  a i k  a is the element in  i th row and  k th column of matrix  A  , and  a k j  is the element in  k th row and  j   k th column of matrix  A .
Definition 3.
For transfer matrix   A , if  B  is the optimal transfer matrix of  A  , then  i = 1 n j = 1 n b i j a i j  must obtain the minimum value, where  b i j  is the element in row  i th row and column  j th column of the transfer matrix  B .
Theorem 1.
If   A  is an antisymmetric matrix, then the optimal transfer matrix   B   satisfies the following:
b i j = 1 n k = 1 n a i k a j k
Reasoning 1.
Because of the property of antisymmetric matrix  A , the optimal transfer matrix   B   must satisfy the following:
b i j = 1 n k = 1 n a i k + a k j
From Theorem 1 or Reasoning 1, the optimal transfer matrix of B can be obtained:
B = b 11 b 12 b 1 j b 1 n b 21 b 22 b 2 j b 2 n     b i 1 b i 2 b i j b i n     b n 1 b n 2 b i j b n n
where b i j = 1 n k = 1 n a i k a j k = 1 n k = 1 n a i k + a k j .
(5)
Solve the consistency matrix
Definition 4.
For matrix  A , if  i , j , k N  , there is   a i k a k j = a i j  , which is called a completely consistent matrix  A .
Reasoning 2.
For the antisymmetric matrix  A , if matrix   B  is an optimal transfer matrix of   A  , when  A * = e B  ,   A *   is a completely consistent matrix of  A .
It can be derived from Theorem 2 that the matrix B can be converted into a completely consistent matrix A * .
A * = a 11 a 12 a 1 j a 1 n a 21 a 22 a 2 j a 2 n     a i 1 a i 2 a i j a i n     a n 1 a n 2 a i j a n n
where a *   i j is the element in i th row and j th column of A * , a i j = exp b i j . A * is the completely consistency matrix of A , which satisfies consistency requirements and guarantees the information of A to the maximum extent.
(6)
Calculate the weight value
The weight value of indicators signifies the significance of elements in this layer relative to the previous layer. Determining these values can be simplified to computing the principal eigenvalues and eigenvectors of the matrix. The eigenvectors of the consistency matrix A * , which corresponds to the eigen roots, must satisfy A * W = λ W . In this equation, A * is the eigenvector; λ is the eigen root. This paper identifies the eigenvectors associated with the largest eigenvalues through the method of the square root, and the specific steps are as follow:
(a)
The n th root of the product for the elements in each row of A * are calculated.
W ¯ i = j = 1 n a i j n , i = 1 , 2 , , n ; j = 1 , 2 , , n
where W i ¯ is the n th root of the product of the elements of the i row.
(b)
The values of the elements of each row are processed to the n th power and recorded as vectors
W ¯ = W ¯ 1 , W ¯ 2 , , W ¯ n T
(c)
Through the step of normalizing W ¯ , the weight obtained:
W i = W ¯ i j = 1 n W ¯ j
where W j ¯ is for the elements of the j th column of the n th root of the product
W = W 1 , W 2 , , W n T
W in Equation (10) is the eigenvector which is corresponding to the maximum eigenvalue λ , that is, the eventual weight value.

4.2.2. Objective Weight Calculation Based on CRITIC

This paper uses the CRITIC method to calculate the objective weight of indicators based on the amount of information in the indicator data [26]. When weights are determined by this method, not only is the amount of information contained in the indicator considered, but the contrast and the conflict between different solutions and indicators are also regarded. Therefore, the results are more objective and reasonable.

4.2.3. Combination Weight Calculation Based on Deviation Minimization

Using a single method of subjective empowerment or objective empowerment will lead to differences and defects in evaluation results. The objective function aims to minimize the sum of the squares of the differences between “the deviation between the improved AHP weight and the combination weight” and “the CRITIC weight and the deviation between the combination weight”. The combination weight and the subjective and objective weights are solved, respectively, when the sum of squares of deviations is minimized and the optimal combined weight result is solved, in which the minimization problem is solved with respect to the variable β .
min z = i = 1 m u i W i 2 + u i V i 2
u i = β W i + ( 1 β ) V i
Among them, u i is the comprehensive weight of the i th indicator after combining the two weighting methods that are represented as a linear combination of W i and V i ; β is the proportion of the subjective preference coefficient weight in the combination weight; W i is the improved analytic hierarchy process weight of the i th indicator; 1 β is the proportion of the objective preference coefficient in the combination weight; and V i is the CRITIC weight of the i th indicator.

4.3. Adaptability Evaluation Model Based on GRA-TOPSIS Integrating CG and ICPT

4.3.1. ICPT Method

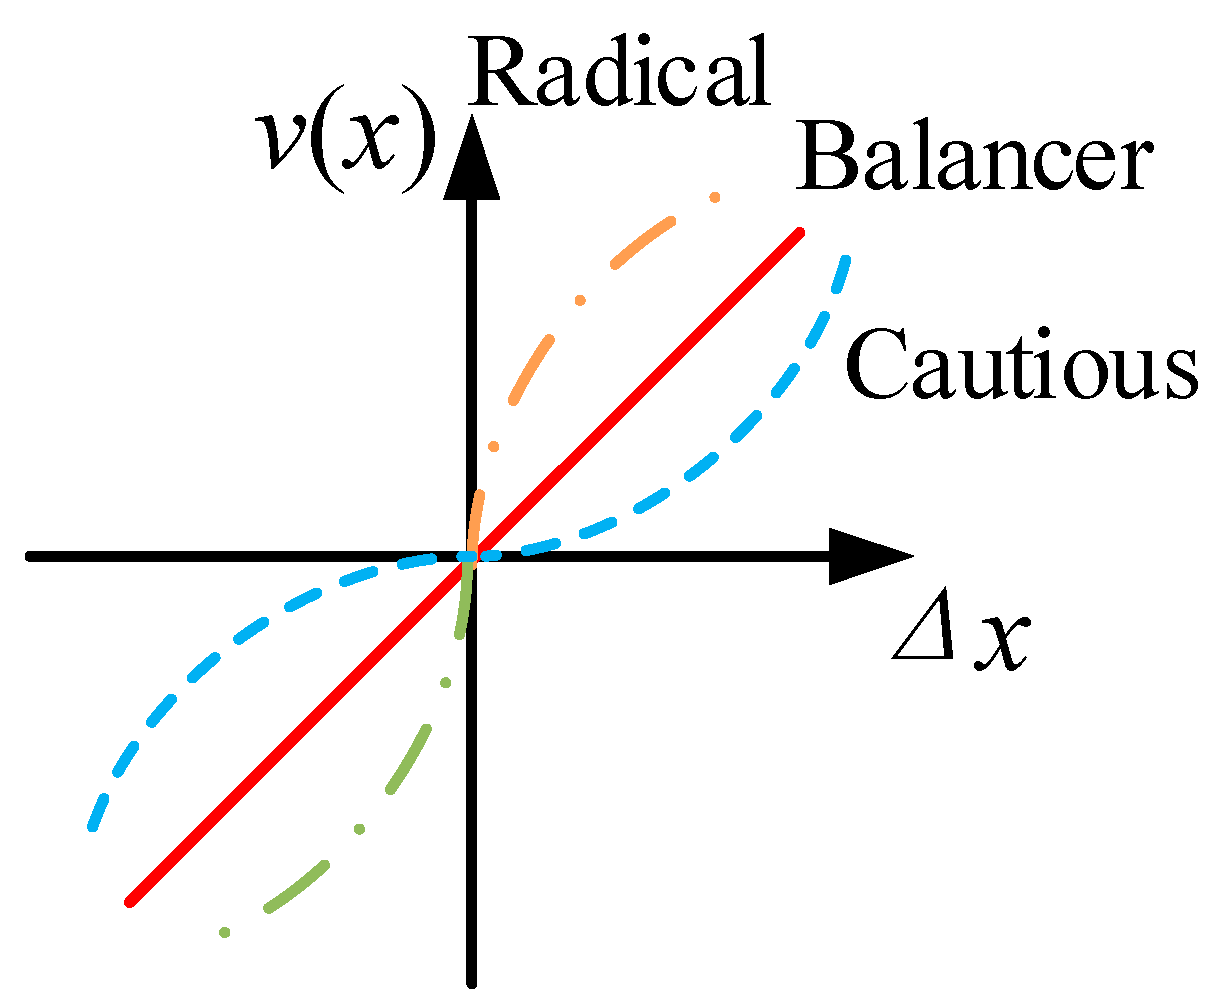
Cumulative prospect theory focuses on the irrational behavior of decision-makers and reflects bounded rational behavior by establishing a value function. However, the existing value function does not distinguish the risk preference type and profit and loss attitude of decision-makers [27]. This paper expands the value range of the decision-making risk preference coefficient; proposes an improved prospect value function for three risk attitudes, radical, balanced, and cautious; and adds parameters δ to adjust the decision-maker’s outlook profit and loss attitude [28]. The details are as follows:
v Δ x = δ ( Δ x ) α , Δ x 0 θ ( Δ x ) β , Δ x < 0
where v Δ x is the prospect value; Δ x is the difference between the evaluation plan value and the reference plan value −1~1, which is the value under standard circumstances. If Δ x 0 , then the prospect value is the income value Δ x 0 ; otherwise, it is the loss value v ; α β are the parameters of risk attitude from different decision-maker; δ is the decision-maker’s sensitivity coefficient to returns; θ is the sensitivity coefficient of the decision-maker to the loss.
The improved traditional prospect theory is shown in Figure 3. The value range of α β is expanded and decision-makers are divided into three types. If 0 < α , β < 1 , then the decision-maker is a radical type; if α , β = 1 , then the decision-maker is a balanced type; if α , β > 1 , then the decision-maker is a cautious type. Traditional prospect theory is only a cautious decision-making model.
A new prospect value function parameter δ is added to adjust the decision-maker’s attitude towards profit and loss. If the decision-maker is more sensitive to prospect losses than to prospect losses, then let δ > θ = 1 ; if the decision-maker is more sensitive to prospective losses than to prospective gains, then θ > δ = 1 ; if the decision-maker is equally sensitive to prospective gains and losses, then make θ = δ = 1 .
Based on the improved prospect value function and using the cumulative functional to optimize the decision weight, the comprehensive prospect value of ICPT can be obtained:
V j = i = 1 n v i j + π + ω i + i = 1 n v i j π ω i
where V j is the comprehensive prospect value of the j th plan; v i j + v i j are, respectively, the positive and negative prospect values of the i th plan under the j th indicator; π + ω i , π ω i are, respectively, the decision weight functions of the positive and negative prospect values corresponding to the i th indicator weight ω i ; i = 1 , 2 , , n ,   j = 1 , 2 , , m . The decision weight function is as below:
π + ω i = ω i γ + ω i γ + + 1 ω i γ + 1 γ + π ω i = ω i γ ω i γ + 1 ω i γ 1 γ
where γ + γ are the fitting parameters; usually, the values are γ + = 0.61 , γ = 0.69 [29].

4.3.2. ICPT-GRA Method

The GRA method determines the closeness based on the geometric similarity between the comparison sequence curve and the reference sequence curve. The greater the gray correlation degree, the closer the comparison sequence is to the reference sequence [30]. According to the standardized evaluation matrix, the positive and negative ideal schemes are established as reference schemes, and the Dun’s gray correlation coefficient between each evaluation scheme and the positive and negative ideal schemes under each evaluation index is calculated [31].
The gray correlation coefficient ξ i j   between the reference plan sequence x 0 ' and the plan sequence x j ' to be evaluated with respect to the i th indicator is as follows:
ξ i j = min j min i | x i 0 x i j | + ρ max max i | x i 0 x i j | | x i 0 x i j | + ρ max i min i 0 x | x i 0 x i j |
where x i j ' x i 0 ' are the evaluation values of the index x j ' x 0 ' , respectively; ρ is the resolution coefficient, which generally takes the value 0.5 [32].
Any evaluation plan should be a gain compared with the negative ideal plan, so its prospect value should be a positive number; similarly, any evaluation plan should be a loss compared with the positive ideal plan, so its prospect value should be a negative number.
The prospect value function of the ICPT-GRA method takes the positive ideal solution as a reference:
v 1 i j + = δ 1 ξ i j α , T a k e   t h e   n e g a t i v e   i d e a l   s o l u t i o n   a s   a   r e f e r e n c e ; v 1 i j = θ ξ i j + 1 β , T a k e   t h e   p o s i t i v e   i d e a l   s o l u t i o n   a s   a   r e f e r e n c e .
where ξ i j + ξ i j are the coefficients of gray correlation for the i th plan and the positive and negative ideal plans under the j th index, respectively; v 1 i j + is the positive prospect value of the j th plan and the negative ideal plan with respect to the i th index; v 1 i j is the positive prospect value of the j th plan and the positive ideal plan with respect to the i th index negative prospect value. Combining Equation (14), we can obtain the comprehensive prospect value V 1 j of the first solution using the ICPT-GRA method (the first evaluation method in this paper).

4.3.3. ICPT-TOPSIS Method

The basic idea of the TOPSIS method is to use Euclidean distance to measure the distance between the evaluation object and the positive and negative ideal solutions [33]. As shown in Table 1, there is a correlation between the secondary indicators in environment adaptability. If calculated using the Euclidean TOPSIS method, it will lead to biased ranking results. Mahalanobis distance can eliminate the impact of indicator correlation, but it requires that the number of evaluation objects must be greater than the number of indicators, so it is not suitable for power grid planning adaptability evaluation, while cosine similarity (CS) is not interfered with by the correlation of indicators, and there is no requirement for the relationship between the number of indicators and the number of evaluation objects [34]. Therefore, this paper uses cosine similarity as the ranging algorithm of the TOPSIS method.
v 2 i j + = δ x i j ' x i min ' α , T a k e   t h e   n e g a t i v e   i d e a l   s o l u t i o n   a s   a   r e f e r e n c e ; v 2 i j = θ x i j ' x i max ' β , T a k e   t h e   p o s t i v e   i d e a l   s o l u t i o n   a s   a   r e f e r e n c e ;
v 2 i j = v 2 i j + π + ω i + v 2 i j π ω i
where v 2 i j + is the positive prospect value of the j th plan and the negative ideal plan with respect to the i th index; v 2 i j is the negative prospect value of the j th plan and the positive ideal plan with respect to the i th index; x i min ' , x i max ' are, respectively, the negative and positive ideal plans in the standard evaluation matrix index value; v 2 i j is the comprehensive prospect value of the j th plan with regard to the i th index. The comprehensive prospect matrix is V = v 2 i j n × m = v 2 j m .
sim v 2 a , v 2 b = cos θ a b = i = 1 n v 2 i a v 2 i b i = 1 n ( v 2 i a ) 2 i = 1 n ( v 2 i b ) 2
v 2 a v g = 0.5 ( v 2 max + v 2 min )
d ( v 2 j , v 2 max ) = log 1 2 ( sin ( v 2 j v 2 a v g , v 2 max v 2 a v g ) + 1 2 ) d ( v 2 j , v 2 min ) = log 1 2 ( sin ( v 2 j v 2 a v g , v 2 min v 2 a v g ) + 1 2 )
V 2 j = d v 2 j , v 2 min d v 2 j , v 2 min + d v 2 j , v 2 max
where v 2 j is the comprehensive prospect column vector of the j th plan; v 2 max , v 2 min are the comprehensive prospect column vectors of the positive and negative ideal plans, respectively; V 2 j is the comprehensive prospect value of the j th ICPT-TOPSIS method (the second evaluation method in this paper).

4.3.4. Integrating CG and ICPT GRA-TOPSIS Method

Using the TOPSIS method to evaluate the adaptability of power grid planning schemes, if the evaluation index data are limited, it may lead to large errors in the evaluation results [35]. The GRA method is suitable for comprehensive evaluation in gray environments with incomplete information [36]. The evaluation results of the TOPSIS method are more objective, while the GRA method has the subjective color of dividing the optimal value of the gray index; the TOPSIS method is based on distance measurement, while the GRA method is based on geometric similarity [37]. In view of the advantages and disadvantages of the TOPSIS method and the GRA method, this article adopts the combined evaluation method of ICPT-GRA and ICPT-TOPSIS (ICPT-GRA-TOPSIS method). In order to determine the combined evaluation coefficient, this paper uses the CG method, which has a relatively small total system error. However, the feasibility of using the average value as the benchmark value of this method needs further study, and it is not suitable for the combination of two evaluation methods. The combination coefficient has no solution [38]. Therefore, this paper improves the CG combination evaluation method, uses variance maximization as a measurement standard, and constructs an integrated CG and ICPT GRA-TOPSIS combination evaluation model and overall difference maximization to solve the problem of artificial setting of benchmark values, the limited number of combination evaluation methods, and other issues.
The comprehensive prospect values obtained by the ICPT-GRA method and the ICPT-TOPSIS method are standardized as follows:
V k j * = V k j V k min V k max V k min
e k j = V k j * V k * ¯ s k
V k * ¯ = 1 m j = 1 m V k j * s k = 1 m 1 j = 1 m V k j * V k * ¯ 2
where V k j is the comprehensive prospect value of the k th evaluation method for the j th plan; V k min , V k max are, respectively, the minimum and maximum comprehensive prospect values of the k th evaluation method; V k j * , V k j are the standardized processing results; V k * ¯ , s k are the average values of all plans of the k th evaluation method’s standard deviations, respectively.
m a x J = L H L T = L e e T L T
where L = l 1 l 2 , l 1 + l 2 = 1 , l k > 0 k = 1 , 2 ; H is the variance information matrix of the combined evaluation model; e = e k j 2 × m .
Let G = 1 , 2 , , g , f G , u f be a real-valued function defined on the set 2 G , and let u f = J f .
u ϕ = 0 u G k = 1 g u k
If u f satisfies the above conditions, it is called the characteristic function of the cooperative game G , u , where J f is the variance information matrix of the alliance f for combined evaluation.
φ k u = f ( g | f | ) ! ( | f | 1 ) ! g ! u ( f ) u ( f k )
φ k is the Shapely value, which represents the average contribution of the k th evaluation method in the cooperative game. After normalizing the obtained Shapely values, the combined evaluation weight coefficient determined by the cooperative exchange is as follows:
l k = φ k u u G / k = 1 g φ k u u G

5. Example Analysis

5.1. Basic Data and Standardized Processing

In this paper, grid planning schemes from three regions encompassed by China’s 14th Five-Year Plan are designated as the evaluation subjects. The adaptability evaluation model of grid planning scheme for novel power system based on GRA-TOPSIS integrating CG and ICPT is applied to assess the degree of adaptability and identify the limitations inherent in each regional grid planning scheme.
The region-specific data were transformed into isotropic indicators, which were then converted to positive indicators and rendered dimensionless prior to presentation in Table 2.

5.2. Weighting of Indicators

Using the improved AHP method, expert opinions are collected and scores for each indicators are obtained according to Equations (1)–(10); the average value is taken as subjective weights W = (0.0672, 0.037, 0.0579, 0.0774, 0.0761, 0.0525, 0.0395, 0.0903, 0.0168, 0.0254, 0.054, 0.0373, 0.084, 0.0703, 0.0782, 0.0821, 0.0301, 0.0117, 0.0122)T. Meanwhile, we used the RANCOM method [39], which takes into account the inaccuracy of expert judgment, to calculate the value of indicator weights as W′ = (0.0654, 0.0354, 0.0498, 0.0787, 0.0759, 0.0498, 0.0327, 0.1057, 0.0215, 0.0265, 0.0504, 0.0363, 0.0873, 0.0669, 0.0683, 0.0928, 0.0239, 0.0193, 0.0134)T, where the difference in weight under the two methods is minimal and the results are consistent.
The CRITIC method was employed to compute the index information quantity and corresponding objective weights, with the outcomes presented in Table 3.
Table 4 displays the comprehensive weights of each indicator, derived from the integration of subjective and objective weights. Notably, reliability and grid structure exhibit a heightened influence in assessing grid planning adaptability, particularly through indicators like N-1 pass rate of power lines and mean power supply reliability, which are intimately tied to this metric. Conversely, environmental adaptability demonstrates a lesser impact.

5.3. Adaptability Evaluation of Grid Planning Scheme for Novel Power System Based on GRA-TOPSIS Integrating CG and ICPT

5.3.1. Evaluating Based on ICPT-GRA

Using the geometric similarity of the GRA method, the grey correlation coefficient between the planning scheme and the positive and negative ideal schemes is separately calculated. To investigate the influence of the limited psychological behaviors of the decision-makers in grid scheduling on the evaluation results, the ICPT-GRA method, which takes into account the psychology of decision-making, introduces the cumulative prospect theory on the basis of the grey correlation coefficient, and the comprehensive prospect value of each evaluation scheme is calculated. The final evaluation scores and ranking results of each scheme, as shown in Table 5. This section takes the more radical loss-sensitive psychological evaluation of decision-makers as an example for analysis. It is consistent with the most conservative mindset held by grid planning decision-makers to ensure reliable and safe operation of the system, for which α = β = 1 , δ = 1 , θ = 2.25 .

5.3.2. Evaluating Based on ICPT-TOPSIS

According to the TOPSIS method, the Euclidean distance between the decision matrix and the positive and negative ideal schemes is separately acquired. Combined with the cumulative prospect theory, the ICPT-TOPSIS method considering the decision psychology applies cosine similarity to obtain the comprehensive prospect value of each index of the schemes, as shown in Table 6.

5.3.3. Combination Evaluation Based on CG

Considering the advantages and disadvantages of the ICPT-GRA and ICPT-TOPSIS evaluation methods, their combined prospective values are normalized to obtain the variance information matrix. Based on the variance maximization principle, the optimal weights for the combined evaluation methods are derived by calculating the shapely values of individual evaluation techniques. Combined with the results of the improved combination assignment, the comprehensive evaluation scores and ranking results of GRA-TOPSIS integrating CG and ICPT methods are shown in the Table 7.
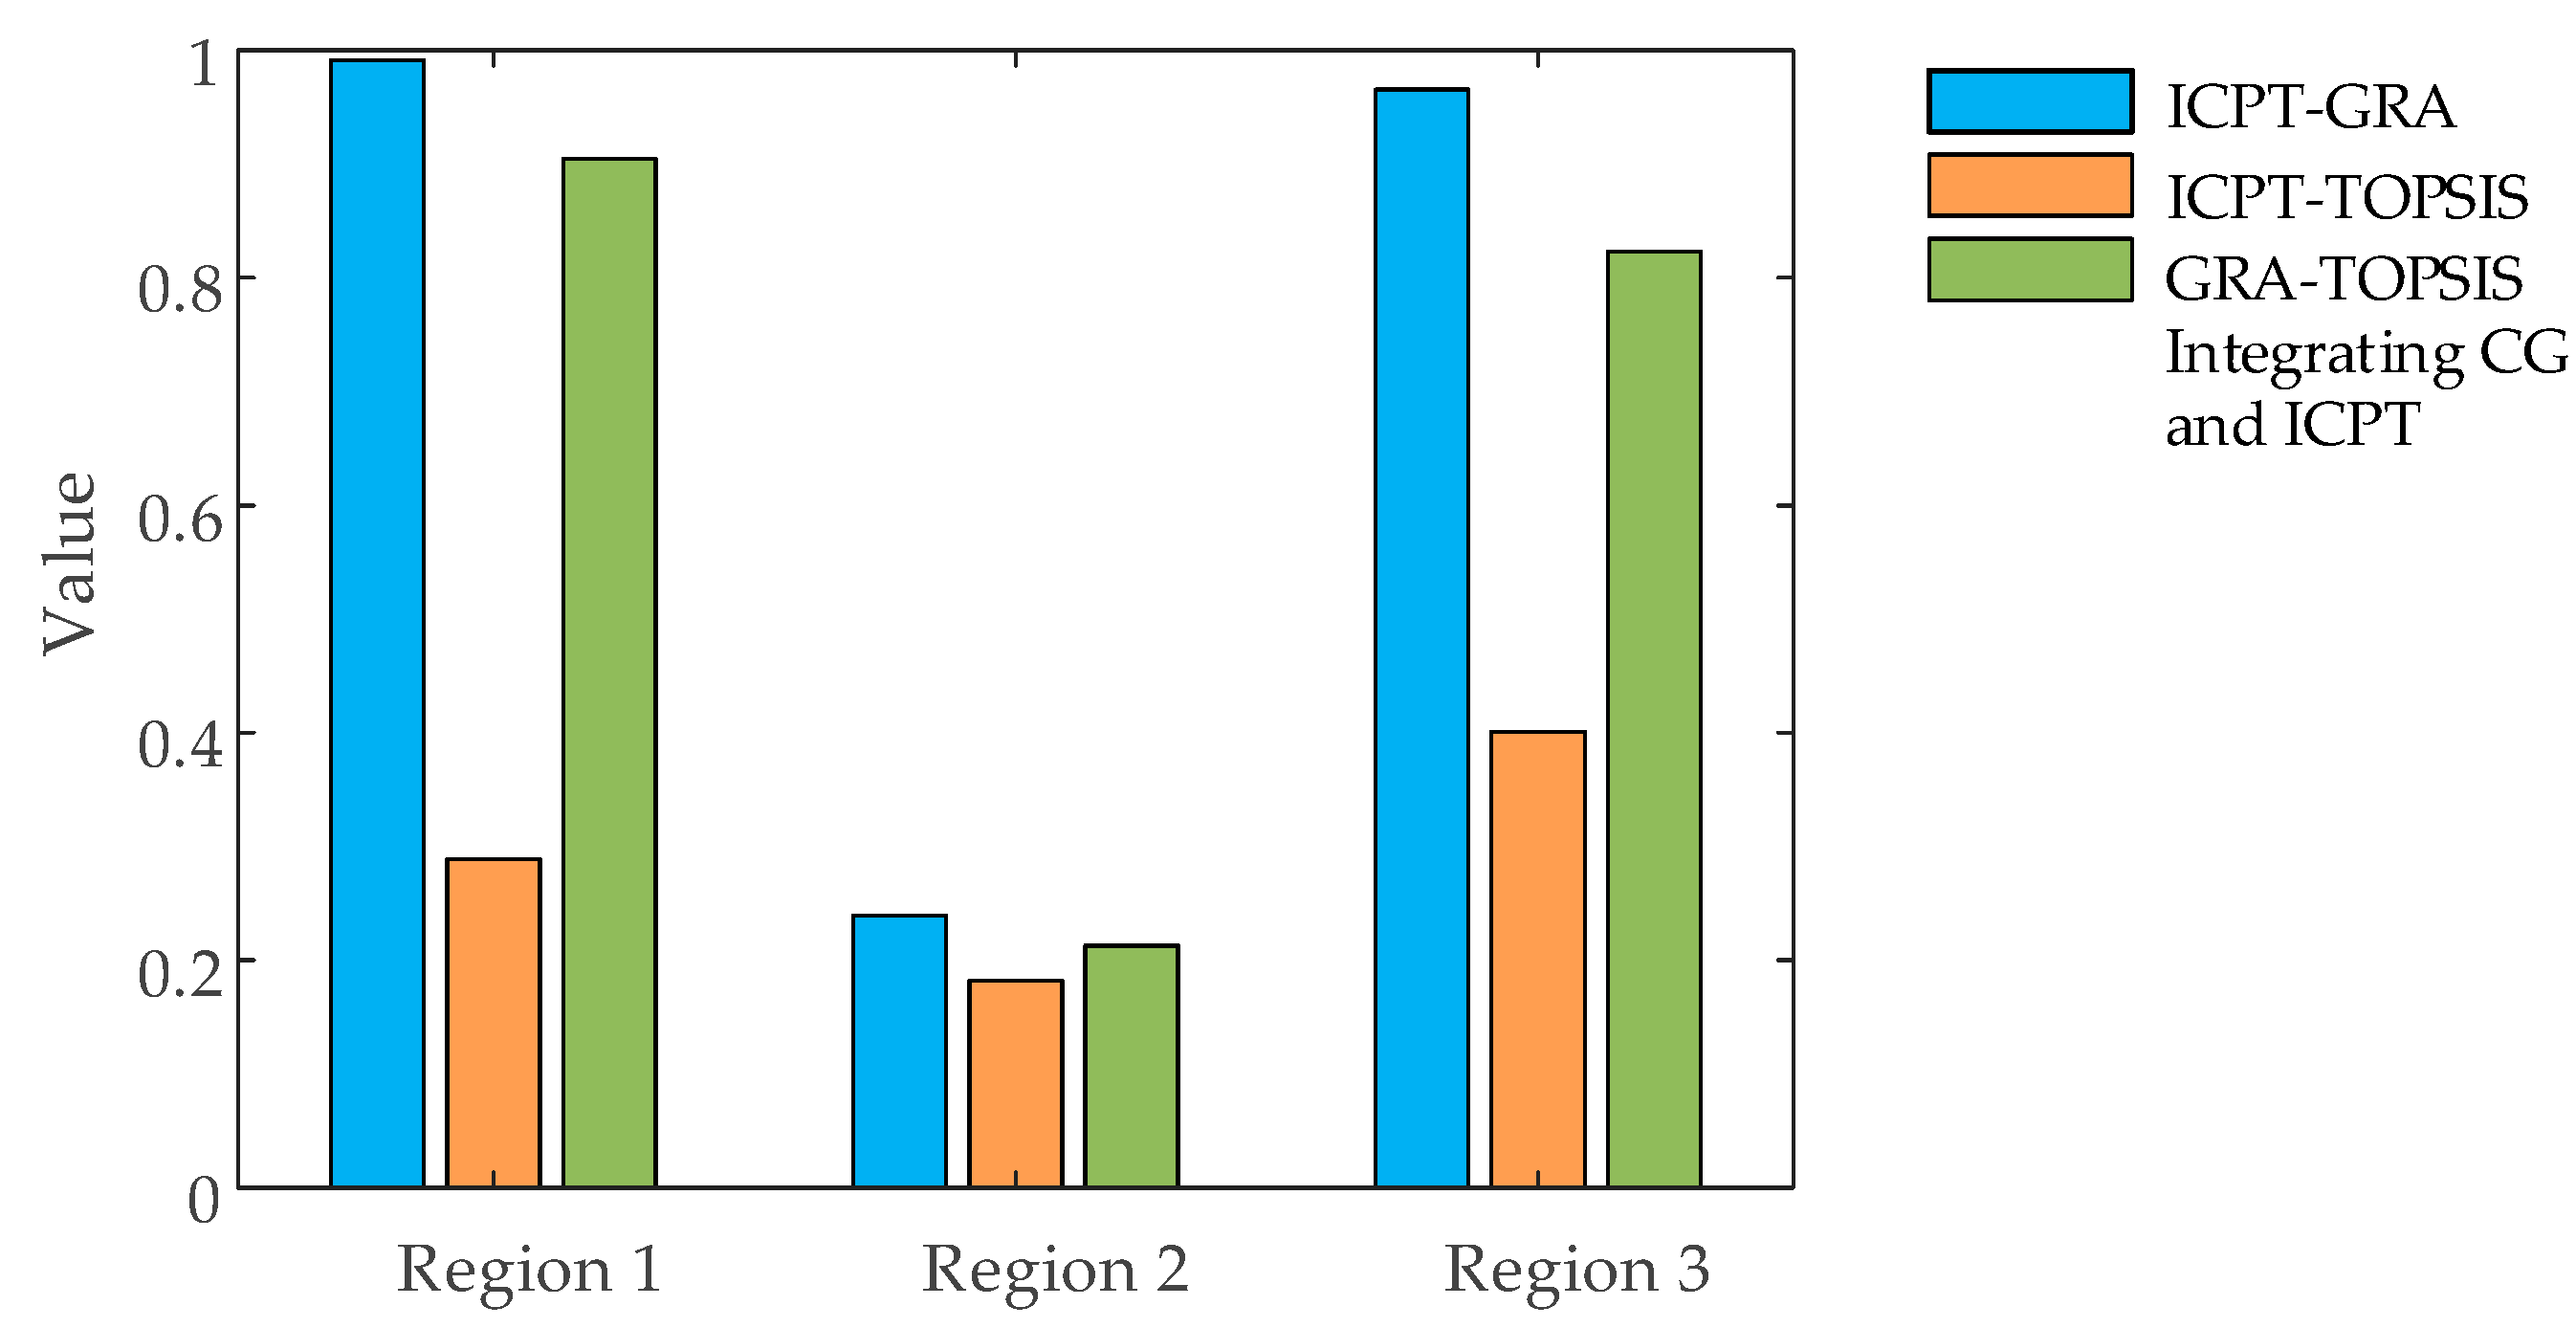
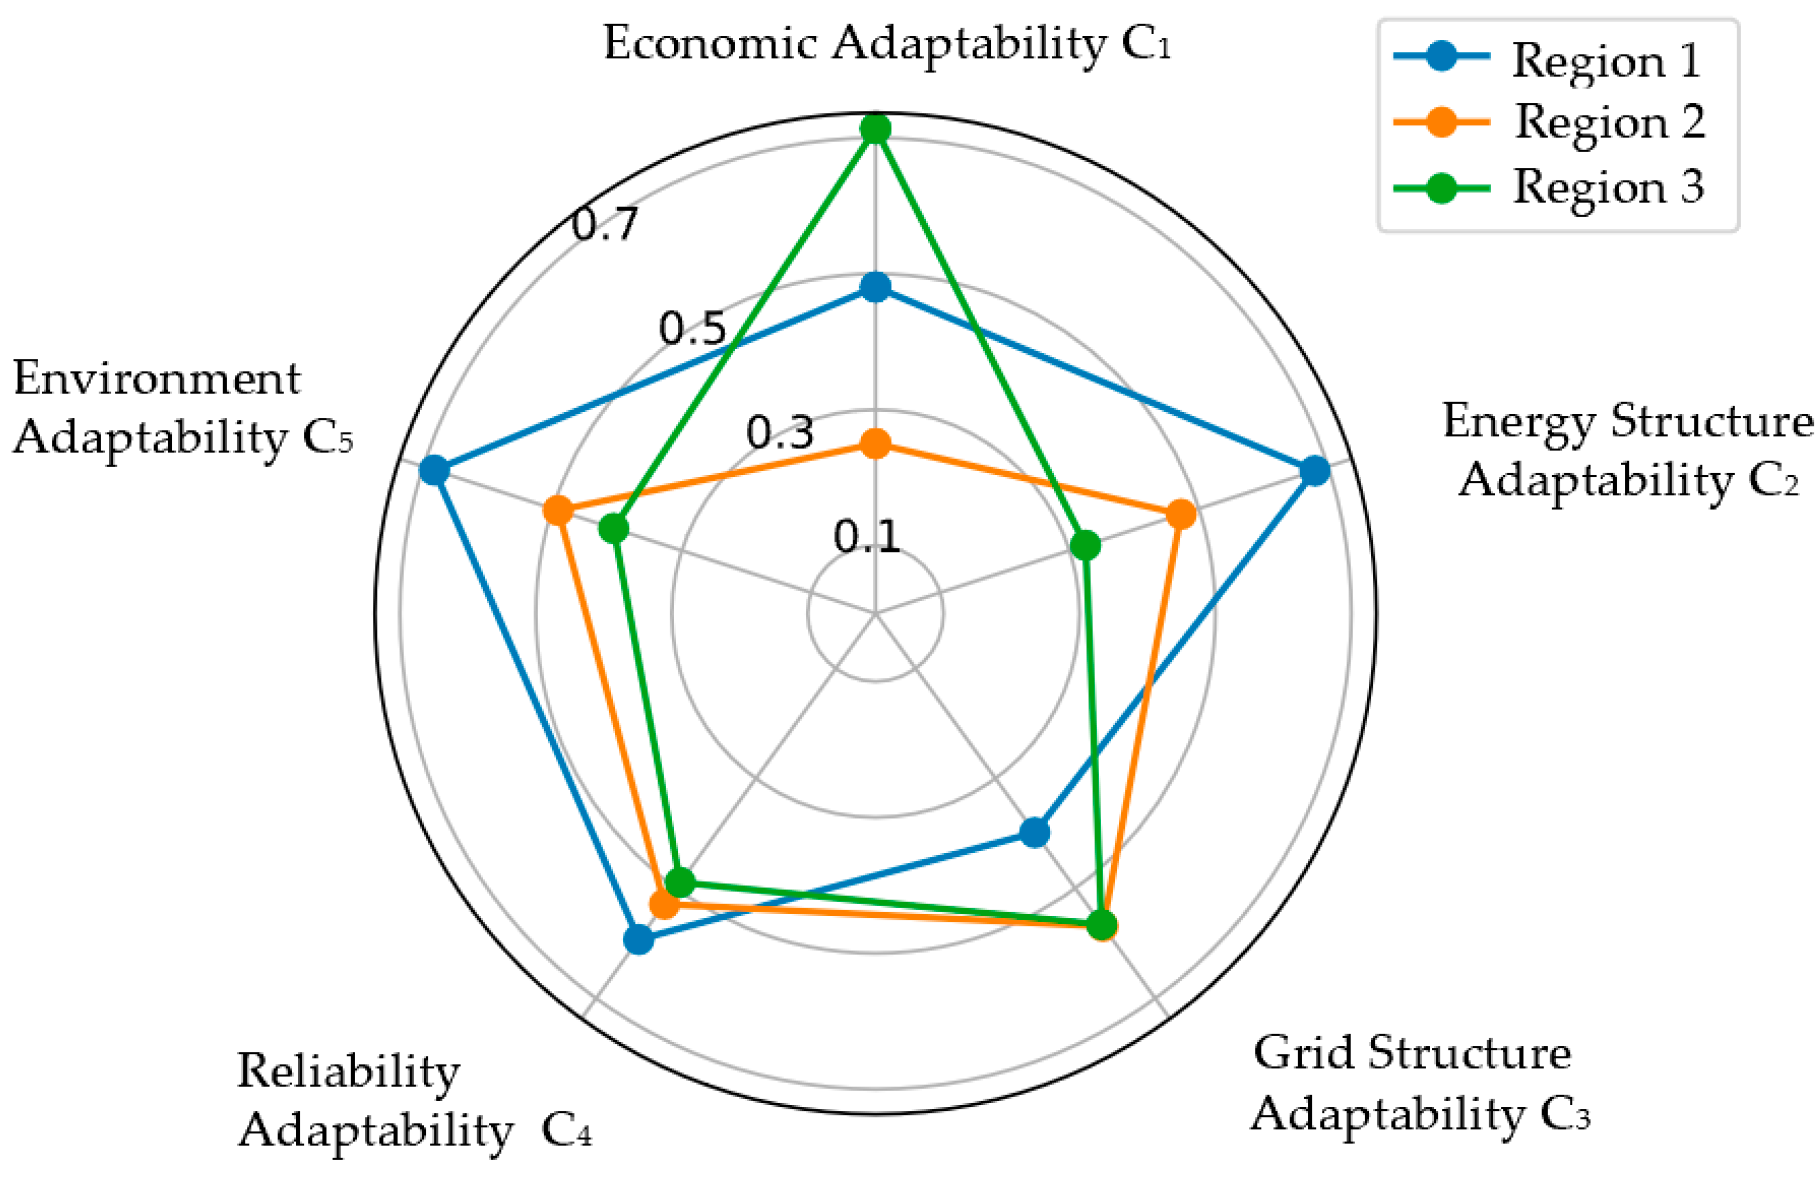
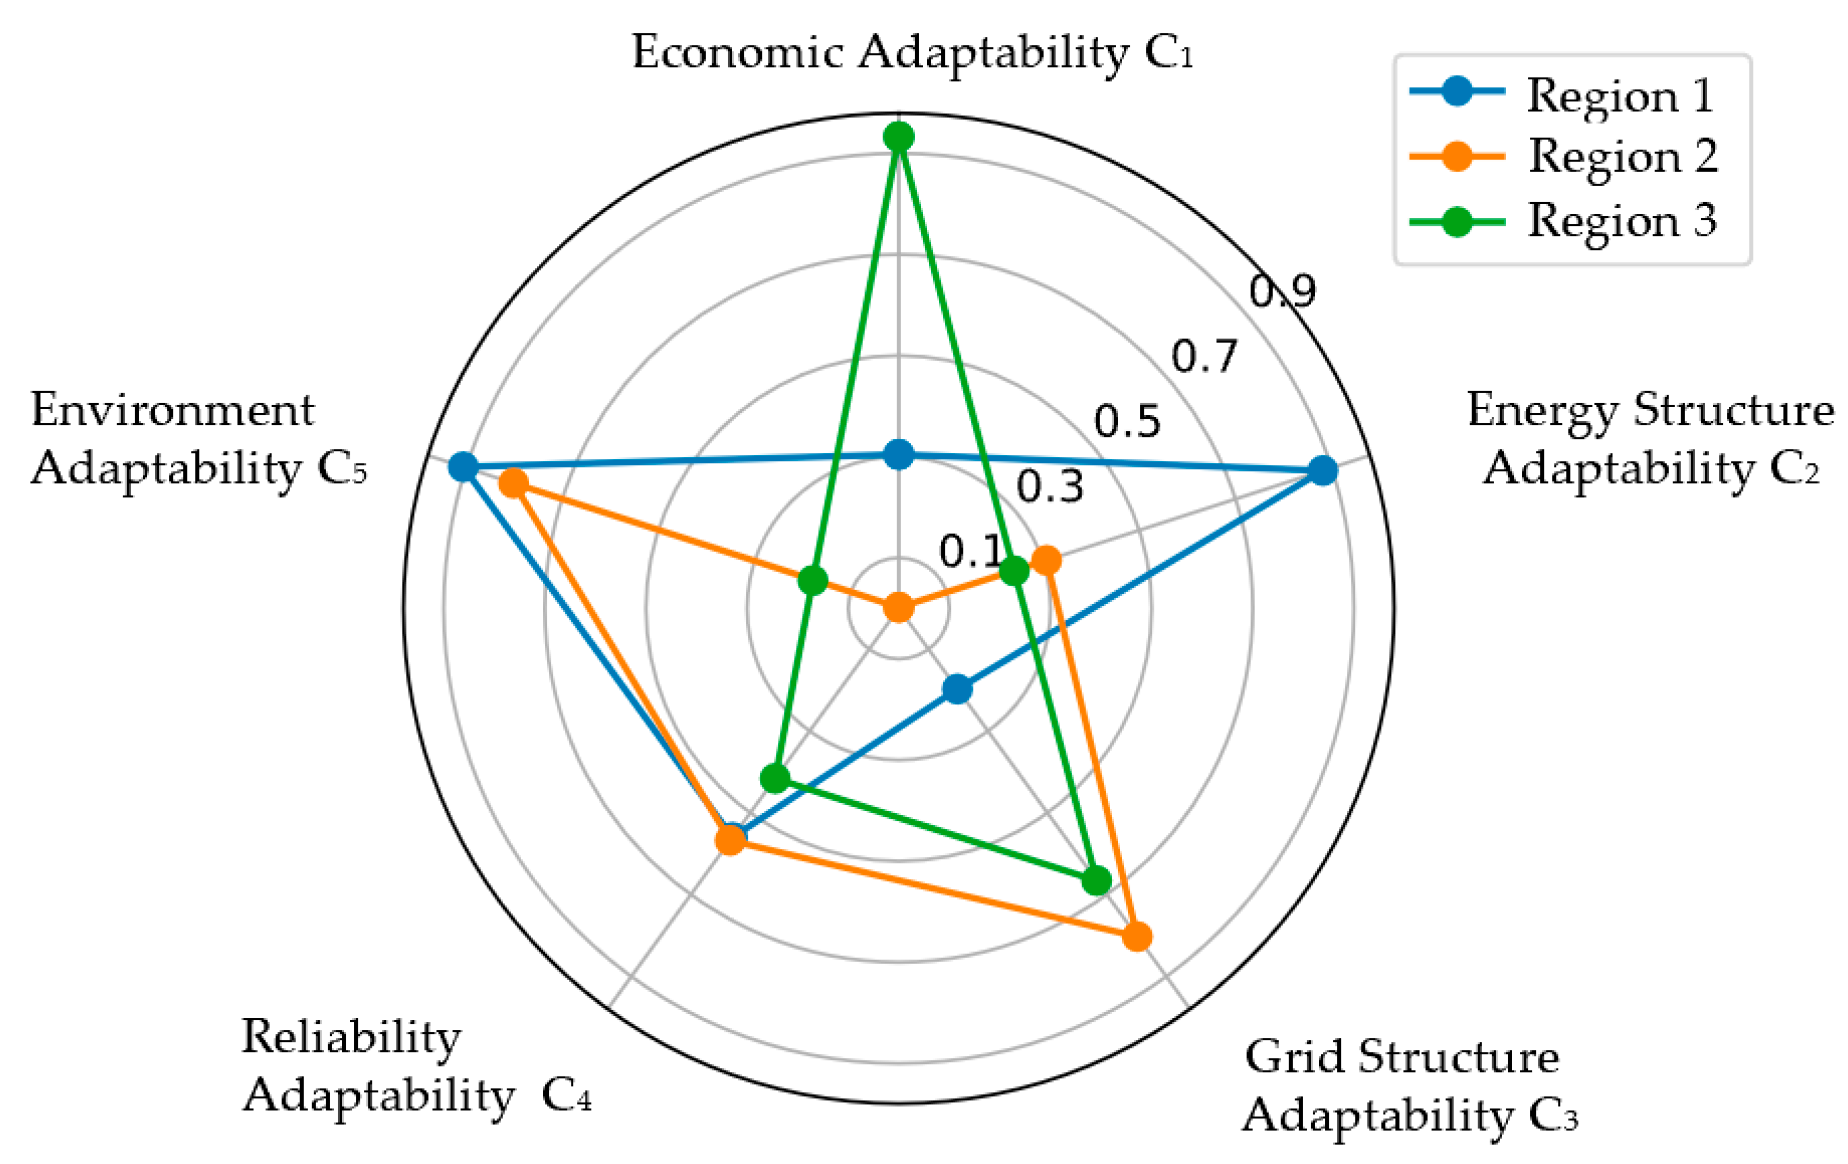
Comparison of the results in Table 5, Table 6 and Table 7 reveals that the combination evaluation not only evaluates the optimal scheme explicitly from the overall dimension, but also widens the gap between different schemes, which makes up for the shortcomings of a single evaluation method. Figure 4 shows the comprehensive evaluation results of ICPT-GRA, ICPT-TOPSIS, and GRA-TOPSIS integrating CG and ICPT. Figure 5 and Figure 6 show the first-level indicator scores for each scheme under the ICPT-GRA and ICPT-TOPSIS methods. Although both evaluation methods are based on the relative distances of positive and negative ideal scenarios, there are large differences in their overall scenario and first-level indicator scores. As can be seen from Figure 2 and Figure 3, the scores for each first-level indicator under the ICPT-GRA method of evaluation are relatively balanced, while the ICPT-TOPSIS method makes a more significant distinction between the strengths and weaknesses of the first-level indicators. For Region 1, economic adaptability and adaptability of grid structure are evaluated poorly in the ICPT-GRA method, but they are significantly worse in the ICPT-TOPSIS method. That is, when evaluating the overall scenario, the ICPT-TOPSIS method highlights the worse structures in the scenario, while the ICPT-GRA method can distinguish the better overall scenario more intuitively. The evaluation approach that incorporates the combination of CG assigns weights based on the marginal contribution of each evaluation method, thereby addressing the limitations of single-method evaluations and quantitatively fusing the outcomes from two individual evaluation techniques.
Combined with the results of the scenarios in Table 3, it can be seen that Region 1 has the highest overall rating, Region 3 occupies second place, and Region 2 is the worst. The safe and reliable operation of the grid is the prerequisite for evaluating the adaptability of the grid planning scheme, which has the largest weight, as high as 0.3065. Among them, the two indicators of mean power supply reliability and N-1 pass rate of power lines determine the safety and reliability of the grid, the combined weight of two accounting for more than 53.15%. The strengths of Region 1 in terms of reliability adaptability, in particular the mean power supply reliability and N-1 pass rate of lines, make its overall score stand out among the three scenarios. Region 1 has significant advantages in terms of adaptability of energy structure, reliability adaptability, and environmental adaptability. This region is equipped with a certain scale of installed renewable energy capacity and realizes the transfer of power resources in time through large-capacity energy storage to ensure the controllability of grid fluctuations, so that the proportion of clean energy and the mean reliability of power supply are increased by 18.78% and 30.17%, respectively. Compared with other regions, the significant increase in the proportion of its clean energy makes the environmental adaptability of the region better than that of other regions. At the same time, limited by the scale of renewable energy installed capacity and line capacity ratio, the ability to increase load and power supply by subsequent unit investment is insufficient in Region 1. The planning scheme of Region 2 has the largest transformer capacity–load ratio and large available capacity, which is more conducive to the access of a high proportion of new energy sources. Despite the capacity to integrate new energy sources, there is a mismatch between the scale of renewable energy sources and the grid structure planning, resulting in grid line redundancy. The inefficiency can lead to increased operational costs and underutilized infrastructure. The primary cause is the lack of synchronization between renewable energy development and grid planning, leading to oversupply in certain grid lines and insufficient supply in others. Region 3 focuses on wind power, due to the large differences in the seasonal distribution of wind resources, resulting in the overall power supply of the project being overly dependent on the generation of traditional thermal power units. This reliance on thermal power is primarily due to the intermittent nature of wind energy and the lack of sufficient storage or backup renewable sources to compensate for periods of low wind availability. The efficient use of existing thermal power plants and strategic deployment of renewable resources make it outstanding in terms of economic adaptability and grid structure adaptability, and relatively balanced power supply reliability capacity.
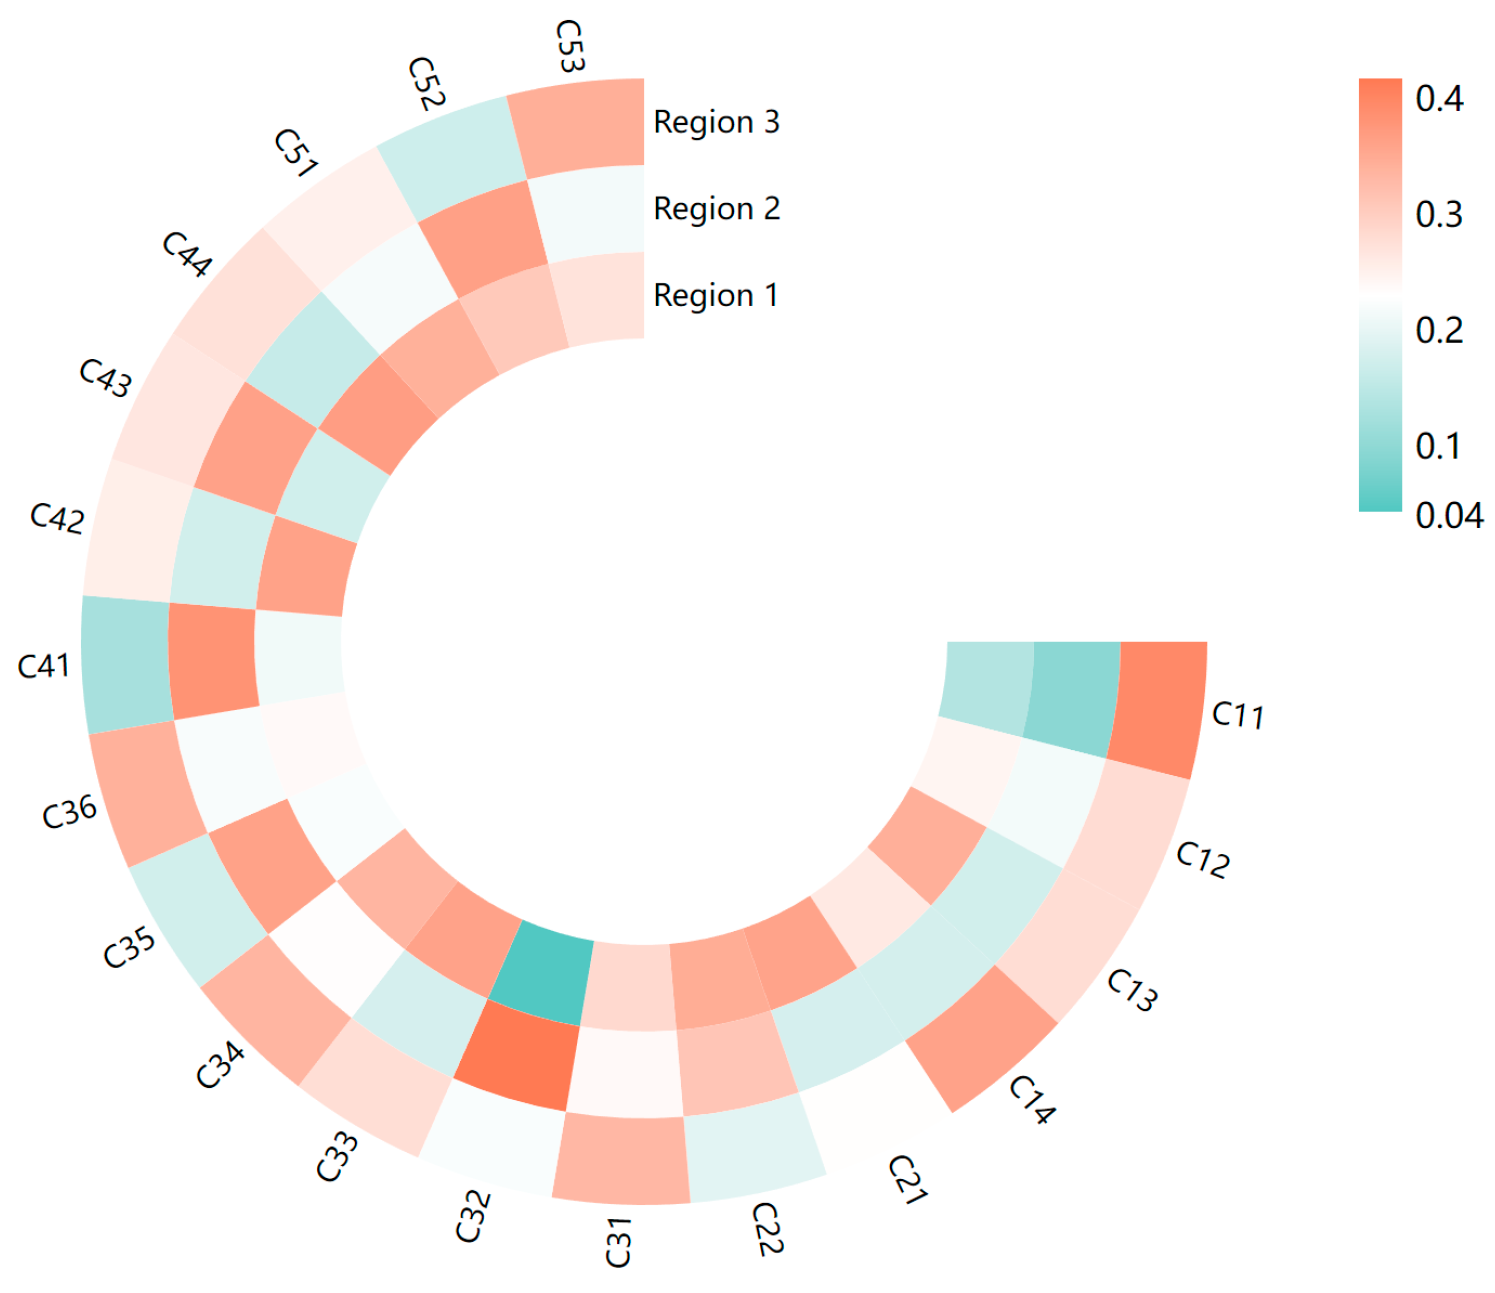
Considering the limited psychological behavior of the planning decision-makers, the results of the evaluation of the fist and secondary indicators under the planning scenarios for the three districts based on the ICPT-GRA-TOPSIS methodology are shown in Figure 7 and Figure 8.

5.4. Sensitivity Analysis Based on Multiple Psychology of Decision-Maker on the Evaluation of Planning Schemes

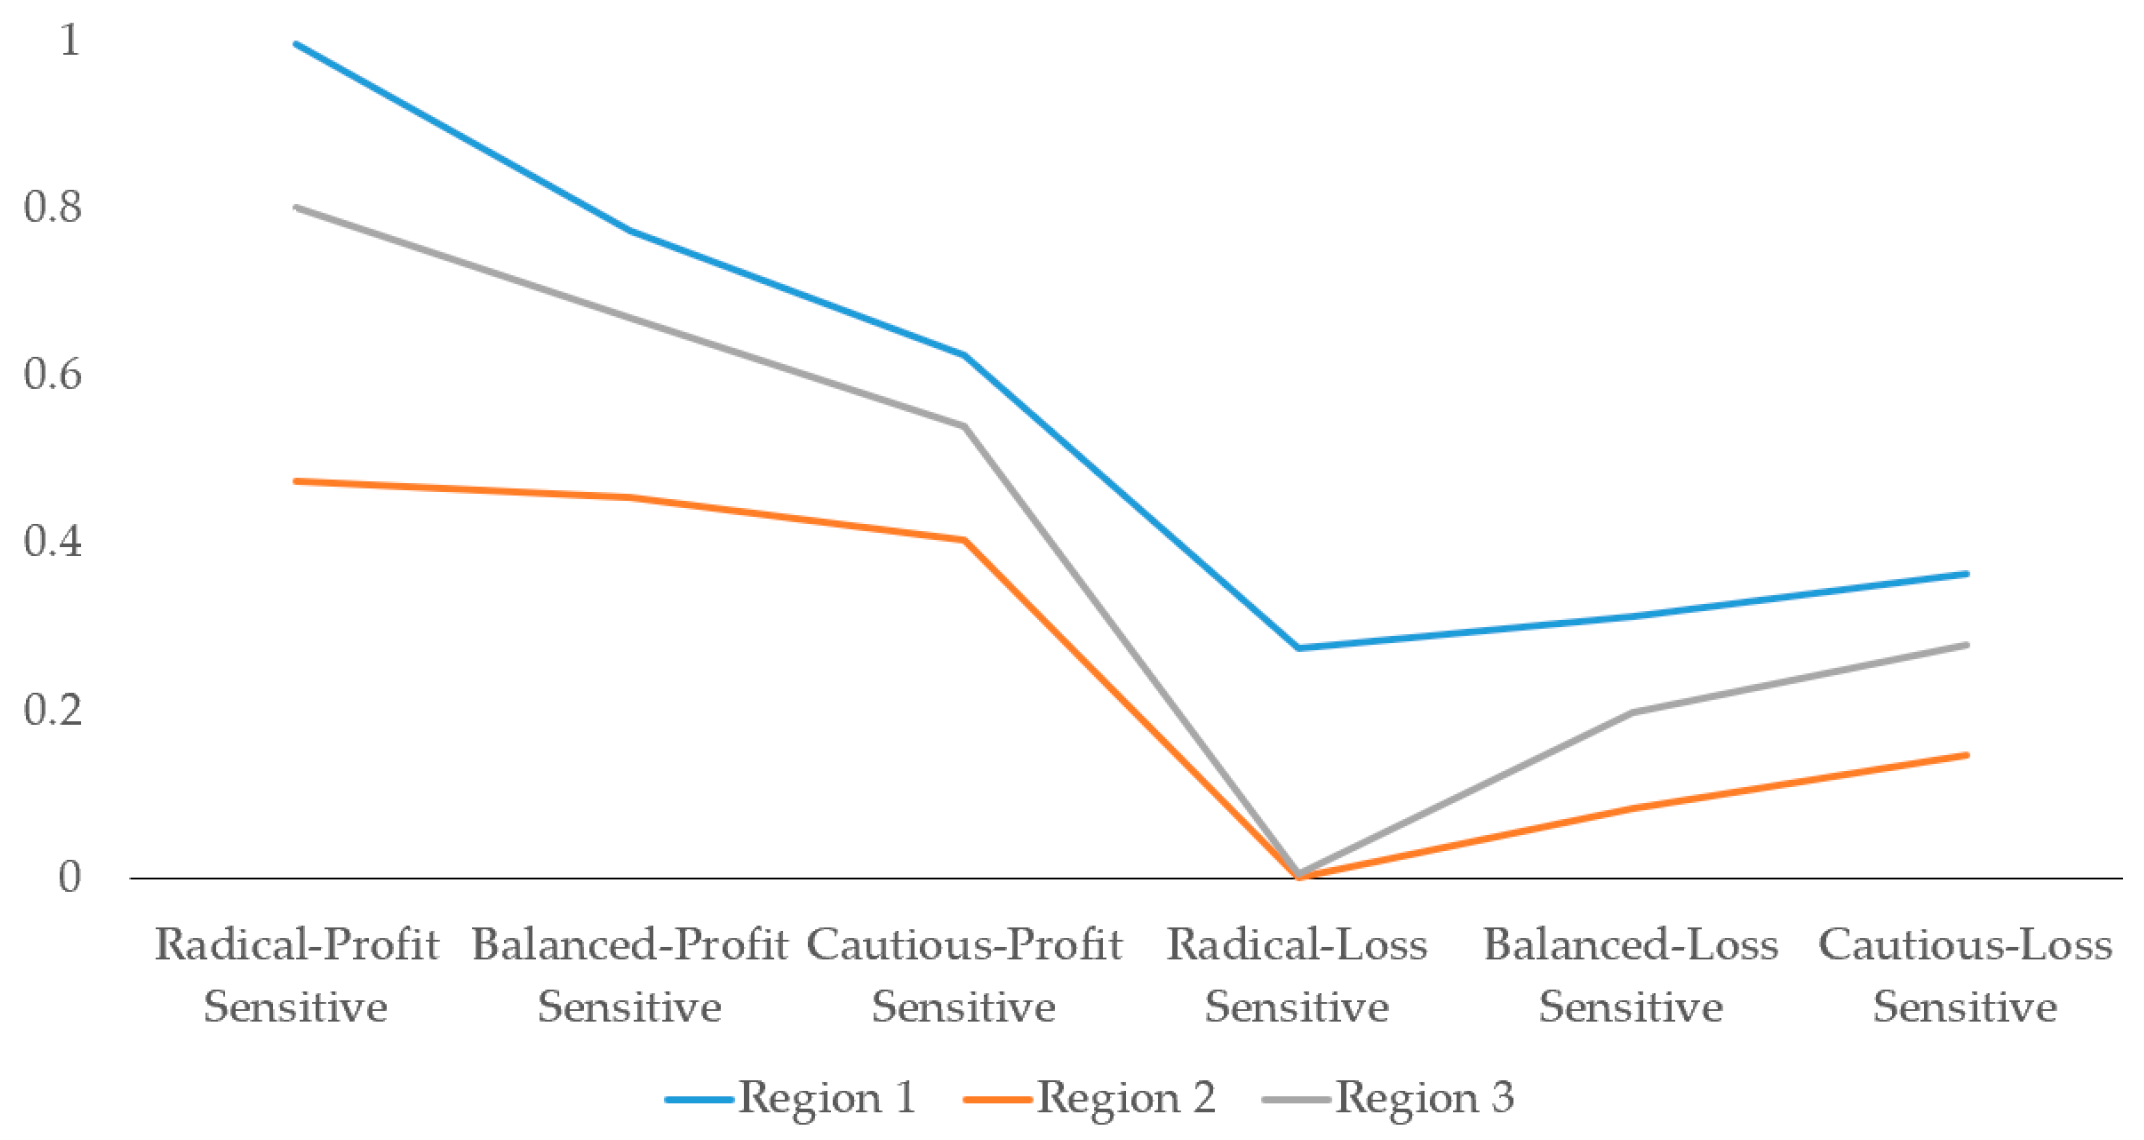
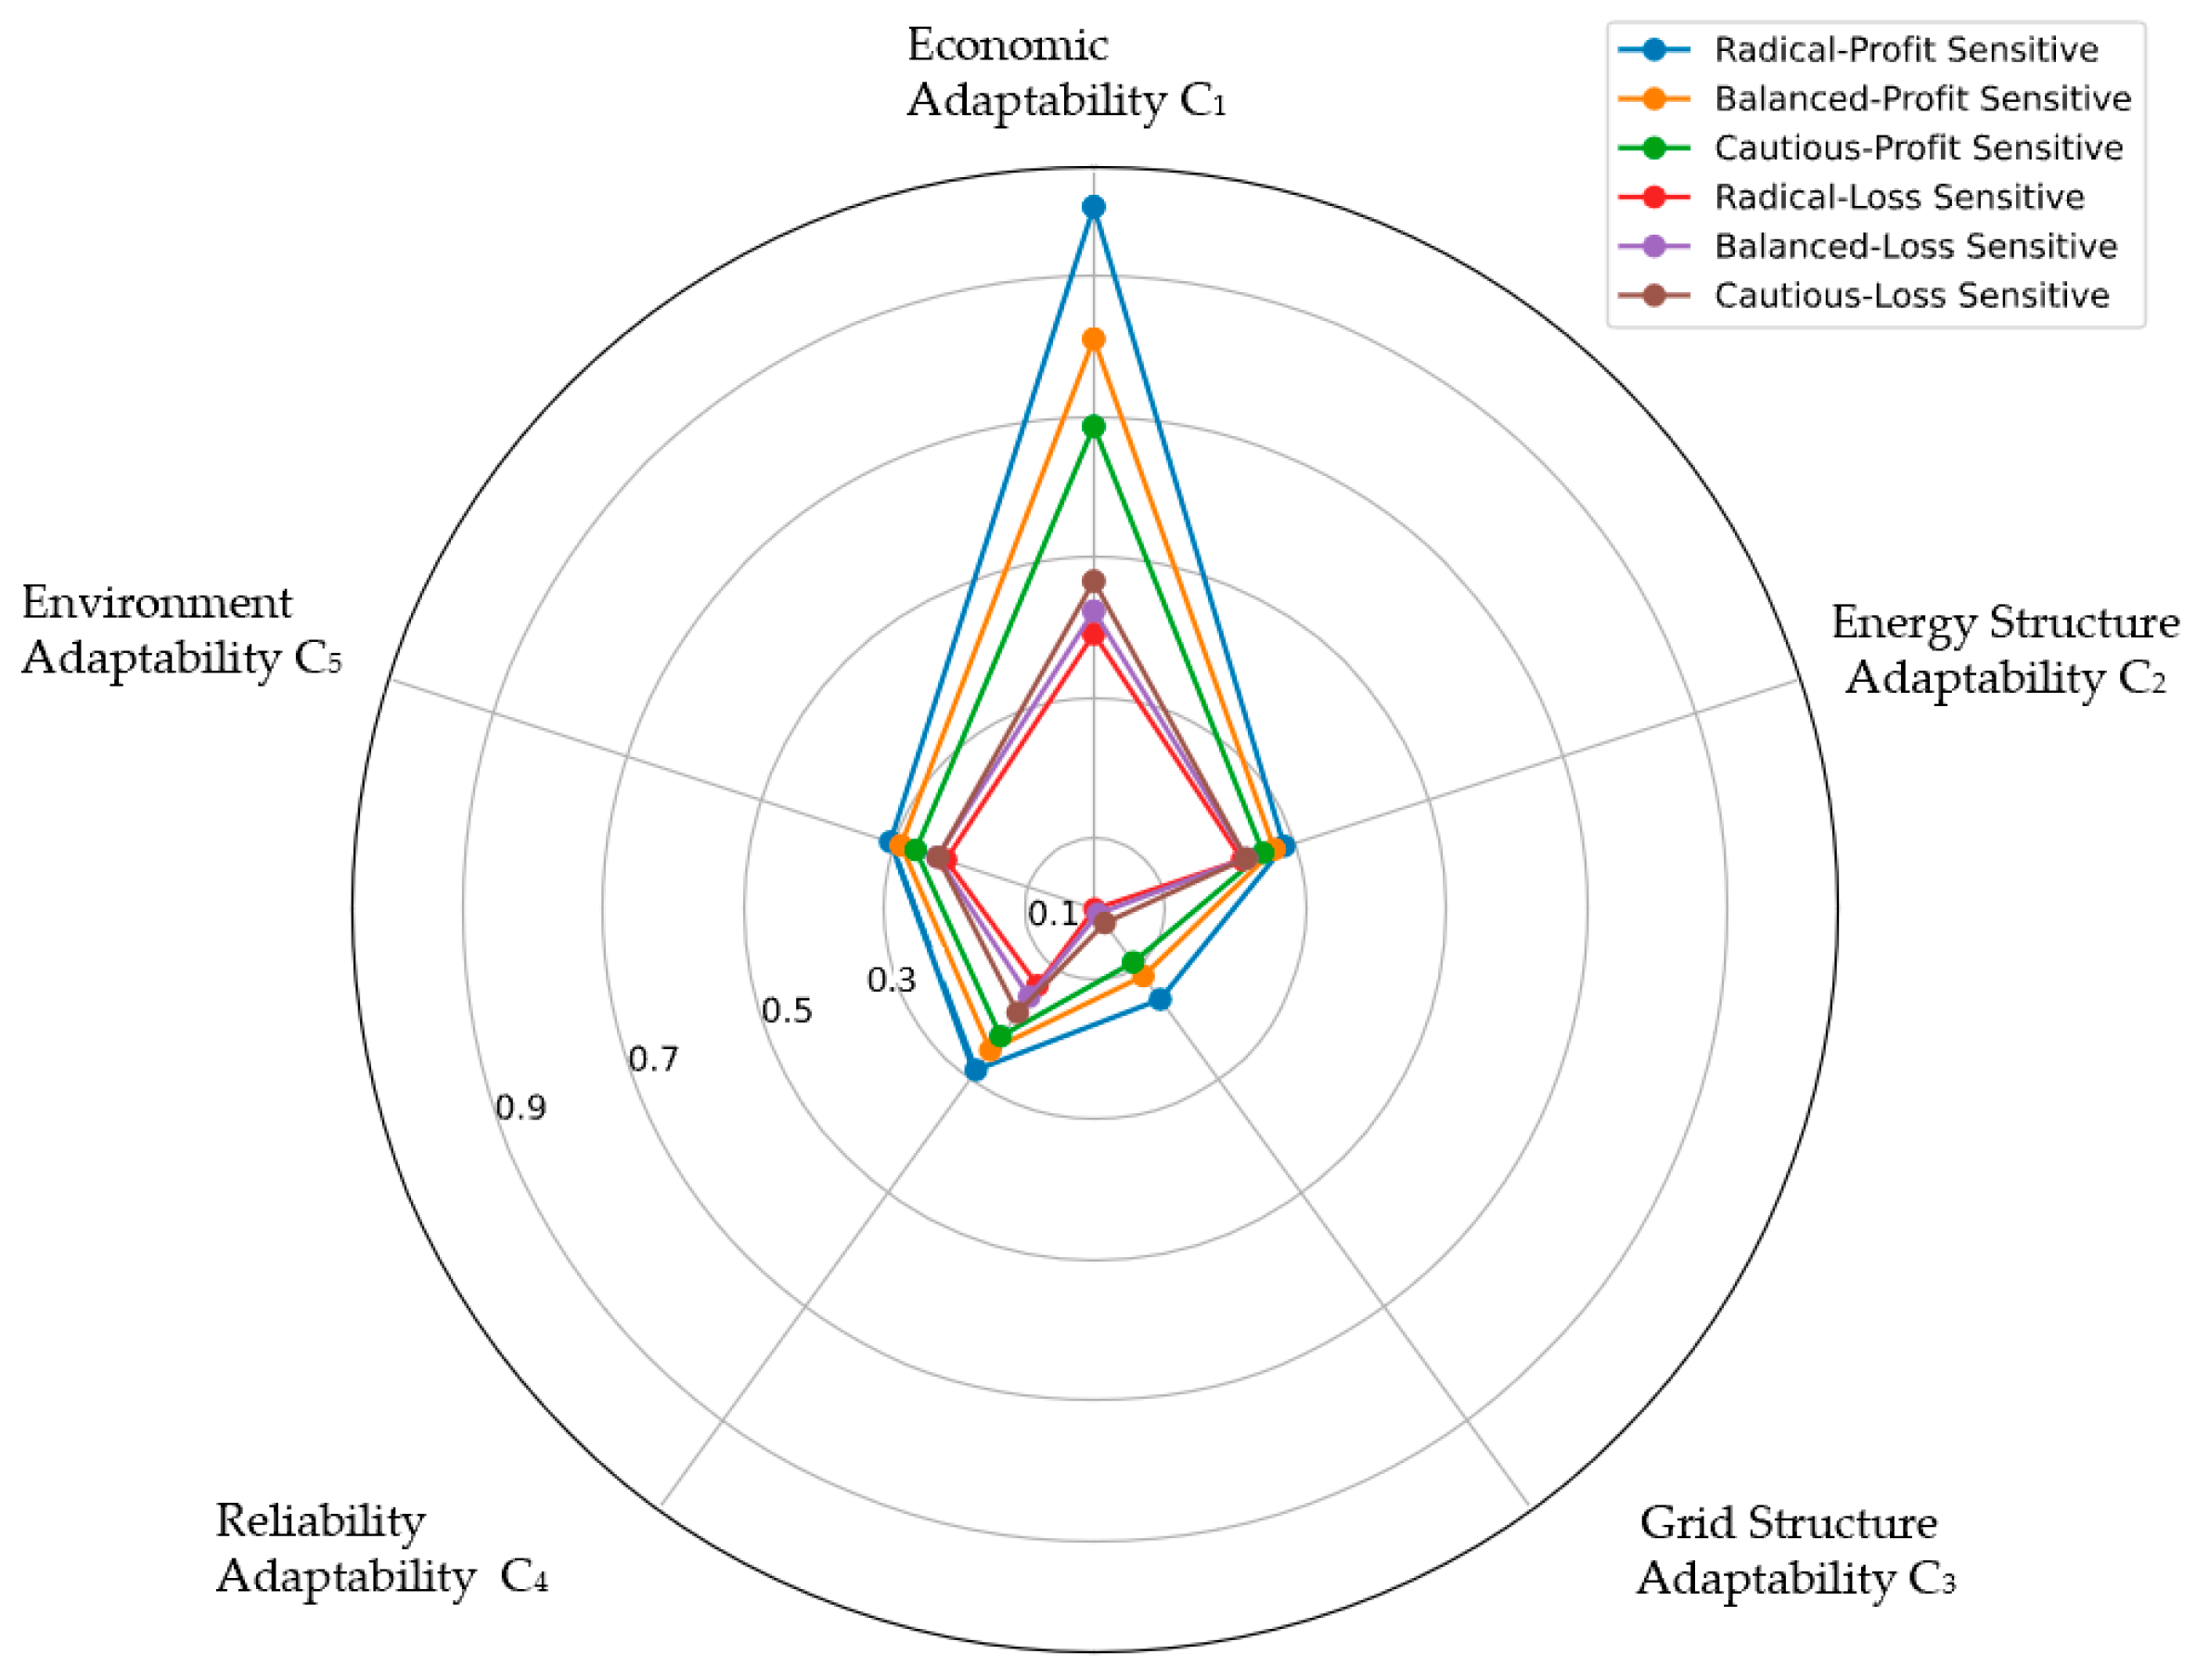
In this paper, decision-making psychology is taken as a sensitive factor that is introduced into the GRA-TOPSIS integrating CG and ICPT method combined evaluation model for the adaptive evaluation of grid planning schemes. The personalities of different decision-makers are classified as radical, balanced, or cautious based on the improved cumulative prospect theory. Combining these three psychological behaviors as well as profit–loss attitudes to explore their influence on the comprehensive evaluation and ranking results of regional planning schemes, the constructed six combinations of psychological parameters for grid planning decision-making are shown in Table 8, Figure 9 shows the results of the comprehensive rating evaluation of the six combinations, and Figure 10 shows the results of the evaluation of the first-level indicators under multiple psychology in the case of Region 1.
From the Figure 9, it can be seen that in the case of the decision-maker having the same profit–loss attitude, the three different decision-making mindsets of radical, balanced, and cautious evaluate the value of the integrated prospect value of the same scheme differently, but the rank of three regions remains consistent, which proves the validity in accurately evaluating the value of different schemes and informing decision-makers. Furthermore, for the more cautious, with a loss-sensitive attitude, the higher the prospect value of the scheme is assessed at, while for the less aggressive, with a lower prospect value of the scheme under the profit-sensitive attitude, it suggests that a difference in the personality/mindset of grid planning decision-makers will produce different selection outcomes for scenario evaluation. Under the same risk attitude, the profit-sensitive type evaluates the prospect value of the scheme 42.5% higher than the loss-sensitive type on average. When the prospect value of Regions 2 and 3 tends to zero, the evaluation value of Region 1 remains around 0.3, which means that under the most conservative and negative planning mindset proposed in this paper, the planning scheme of Region 1 still has a great prospect of revenue and planning application value. That is, the decision-makers believe that the planning scheme in Region 1 has a larger prospect of gain and can bear a controllable risk of loss. The more radical the loss-sensitive decision-maker is, the lower the prospective value of the scenario is considered for the same profit–loss attitude, while the opposite is true for the gain-sensitive decision-maker. In region 1, the difference in the evaluation of the indictor in adaptability of energy structure across risk attitudes for loss-sensitive attitudes is less than 0.02, which shows that the adaptability of the energy structure is less considered to be significantly affected by the psychology of decision-makers. Nevertheless, the prospect value of economic adaptability varies by as much as 0.57 across different decision-making mindsets, which means this level of indicator is the most sensitive to the mentalities of decision-makers.

6. Conclusions

To foster the efficient utilization and consumption of renewable energy sources, this paper proposes an adaptability evaluation of power grid planning scheme for a novel power system considering multiple decision psychology. Compared with the existing studies, this paper analyzes the demand for the adaptability of grid planning for a novel power system in depth, constructs an index system based on it to characterize the adaptability of the planning scheme more comprehensively, and builds an adaptability evaluation model of grid planning scheme for a novel power system based on GRA-TOPSIS integrating CG and ICPT, so as to more accurately reflect the evaluation results of the experts based on different decision-making mentalities in the real environment. After the simulation and analysis of the algorithms, subsequent conclusions can be drawn, as follows:
(1)
In the evaluation of the adaptability of grid planning for novel power system, grid structure adaptability and reliability adaptability have a greater impact.
(2)
It is considered that the different risk and loss attitudes of decision-makers can effectively improve the accuracy of the evaluation results, and radical profit-sensitive decision-making psychology pays more attention to economic adaptability.
(3)
The ICPT-TOPSIS method can better identify the weakness of the evaluation scheme, while the ICPT-GRA method can distinguish the better overall scenario more intuitively, and the combination evaluation method based on CG effectively combines the advantages of these two different methods.
In the future, we will consider the different identities and backgrounds of decision-makers to build a more credible evaluation model, and carry out extensive empirical evaluations to guide power grid planning and promote the high-quality development of new energy.

Author Contributions

Y.W. and C.Y. contributed to conception and design of this study; methodology and validation, C.Y. and Z.W.; investigation, Z.W. and J.W.; writing—original draft preparation, Y.W. and C.Y.; writing—review and editing, Z.W. and J.W.; visualization, Z.W. and J.W. All authors have read and agreed to the published version of the manuscript.

Funding

This research was funded by Natural Science Foundation of Hebei Province, grant number G2022502004, Specia Fund for Basic Scientific Research Business Expenses of Central Universities, grant number 2023MS156.

Data Availability Statement

Data are contained within the article.

Conflicts of Interest

The authors declare no conflicts of interest.

References

  1. Wu, J.; Chen, Y.; Yu, L.; Li, G.; Li, J. Has the evolution of renewable energy policies facilitated the construction of a new power system for China? A system dynamics analysis. Energy Policy 2023, 183, 113798. [Google Scholar] [CrossRef]
  2. Li, R.; Hu, Y.; Wang, X.; Zhang, B.; Chen, H. Estimating the impacts of a new power system on electricity prices under dual carbon targets. J. Clean. Prod. 2024, 438, 140583. [Google Scholar] [CrossRef]
  3. Bo, H.; Xie, K.G.; Shao, C.Z.; Pan, C.; Lin, C.; Zhao, Y. Commentary on Risk of New Power System Under Goals of Carbon Emission Peak and Carbon Neutrality: Characteristics, indices and Assessment Methods. Autom. Electr. Power Syst. 2023, 47, 1–15. [Google Scholar]
  4. Liao, Z.; Kally, J.; Ru, S. Probabilistic modeling of renewable energy sources in smart grids: A stochastic optimization perspective. Sustain. Cities Soc. 2024, 109, 105522. [Google Scholar] [CrossRef]
  5. Wu, Y.; Fang, J.; Ai, X.; Xue, X.; Cui, S.; Chen, X.; Wen, J. Robust co-planning of AC/DC transmission network and energy storage considering uncertainty of renewable energy. Appl. Energy 2023, 339, 120933. [Google Scholar] [CrossRef]
  6. Li, F.; Yang, J.; Shen, S.; Zhu, K.; Qian, J.; Yan, C. Adaptability Evaluation of Power Grid Planning Scheme Based on Improved AHP-CRITIC-TOPSIS with High Proportion of Renewable Energy. In Proceedings of the 2023 IEEE International Conference on Power Science and Technology (ICPST), Kunming, China, 5–7 May 2023; pp. 623–630. [Google Scholar] [CrossRef]
  7. Yin, L.; Wei, X. Multigroup differential evolutionary and multilayer Taylor dynamic network planning for zero-carbon grid extension model with user satisfaction. Energy Convers. Manag. 2023, 297, 117753. [Google Scholar] [CrossRef]
  8. Huang, Y.S.; Jiang, Y.Q.; Wang, J. Research on Adaptability Evaluation of Distribution Network Based on Improved TOPSIS-PSO-SVM. Electron. Sci. Technol. 2022, 35, 54–63. [Google Scholar]
  9. Lu, X.Q.; Ye, Y.; Cao, C.; Meng, J.H.; Tang, H.; He, J. Comprehensive evaluation method of distribution network planning for distributed photovoltaic access. J. North China Electr. Power Univ. (Nat. Sci. Ed.) 2022, 51, 1–10. [Google Scholar]
  10. Zhang, Z.; Yang, H.Y.; Gao, X.T.; Wang, J.; Wang, Q. Research on Evaluation Method of Distribution Network Planning Scheme Adaptability Based on BPNN Model. Distrib. Util. 2021, 38, 56–63+88. [Google Scholar]
  11. He, X.; Gao, C.; Cao, H.Z.; Li, Y.; Yu, T. Index evaluation of distribution network based on improved analytic hierarchy process. Electr. Meas. Instrum. 2022, 59, 93–99. [Google Scholar]
  12. An, Z.; Wei, N.; Liu, S.; Chen, Q.F.; Xing, D. An Efficiency and Benefit Evaluation Method for New Transmission Network Planning Based on Production Simulation. Power Syst. Clean Energy 2024, 40, 73–83. [Google Scholar]
  13. Zhang, J.; Gao, C.; Wang, T.; Duan, Y.; Xu, M.; Guo, Z. A Dynamic Evaluation Method for High-Permeability New Energy Distribution Network Planning Considering Multistage Development Trends. Front. Energy Res. 2022, 10, 958892. [Google Scholar] [CrossRef]
  14. Lu, L.; Zhou, H.; Cai, S.; Liao, Y.; Jiang, L.; Wang, Y. Comprehensive Evaluation of Transmission Network Planning Schemes Based on IFAHP. In Proceedings of the 2020 4th International Conference on HVDC (HVDC), Xi’an, China, 6–9 November 2020; pp. 375–381. [Google Scholar]
  15. Si, J.D.; Wu, X.; Guo, Q.S.; Cai, H.; Cheng, L. Review of Flexible Interconnection of Regional Grids Interconnection Planning and Operation Techniques for High Percentage of Renewable Energy Consumption. Power Syst. Technol. 2024, 48, 2272–2286. [Google Scholar]
  16. Gao, Y.; Gao, Q.C. Serve the high-quality development of the power grid with standard digital innovation. State Grid News China 2024, 1. [Google Scholar] [CrossRef]
  17. Fan, W.; Fan, Y.; Tan, Z.; Ju, L.; Yao, X. Distributionally robust optimization model for virtual power plant participation in electricity carbon market based on multi-layer benefit sharing. Syst. Eng.-Theory Pract. 2024, 44, 661–683. [Google Scholar]
  18. Wang, Z.; Lu, X.; Zhuang, M.; Zhang, C.; Chen, S. Spatial Optimization of Wind-PV Hybrid Energy Systems for the Three-North Region in China. J. Glob. Energy Interconnect. 2020, 3, 97–104. [Google Scholar]
  19. Gu, J.M.; Song, Y.T.; Liu, X.Y.; Zhu, S.X.; Lei, Y. Design of Security Defense System for UHV Power Grids under the Dual Carbon Background. Electr. Drive 2024, 1–6. [Google Scholar] [CrossRef]
  20. Tian, C.; Liu, Y.; Zhang, G.; Yang, Y.; Yan, Y.; Li, C. Transfer learning based hybrid model for power demand prediction of large-scale electric vehicles. Energy 2024, 300, 131461. [Google Scholar] [CrossRef]
  21. Wang, J.H. Exploration of Power Grid Planning Method Based on New Energy Consumption Under the “Dual Carbon” Goal. Electr. Eng. 2023, S1, 237–239. [Google Scholar]
  22. Zhang, Y.; Xiang, R.M.; Zheng, Z.H. Industrial User Decision Model Considering Differentiated Power Quality Services in the Context of Carbon Market. Proc. CSEE 2024, 1–14. [Google Scholar]
  23. Lu, Y.F.; Liu, D.; Zhang, Y. Construction Sequence Planning of Power Transmission and Transformation Projects Based on Game Theory Combined Weighting and Improved Technique for Order Preference by Similarity to Ideal Solution. Sci. Technol. Eng. 2024, 24, 4124–4131. [Google Scholar]
  24. Fang, H.; Shang, L.; Dong, X.; Tian, Y. High Proportion of Distributed PV Reliability Planning Method Based on Big Data. Energies 2023, 16, 7692. [Google Scholar] [CrossRef]
  25. Zhang, K.; Zhao, Q.; Wang, S.; Liang, F.; Ni, J.F. Construction and calculation method of comprehensive evaluation index reflecting distributed photovoltaic hosting capacity of distribution network. Distrib. Util. 2024, 41, 3–11. [Google Scholar]
  26. Zhao, S.Q.; Tang, S.F. Comprehensive evaluation of transmission network planning scheme based on improved analytic hierarchy process, CRITIC method and TOPSIS. Electr. Power Autom. Equip. 2019, 39, 143–148+162. [Google Scholar]
  27. Ilbahar, E.; Kahraman, C.; Cebi, S. Risk assessment of renewable energy investments: A modified failure mode and effect analysis based on prospect theory and intuitionistic fuzzy AHP. Energy 2022, 239, 121907. [Google Scholar] [CrossRef]
  28. Cao, Y.; Li, G.J. Comprehensive evaluation of island isolated microgrid dispatch considering multiple decision psychology. Control Decis. 2022, 37, 1591–1600. [Google Scholar]
  29. Liu, Y.; Gaun, X.; Li, Y.C. Multi-attribute decision making based on comprehensive hesitation fuzzy entropy. Control Decis. 2024, 39, 2022–2030. [Google Scholar]
  30. Qu, K.Q.; Qiao, J.M.; Mao, L.; Zhu, S.J.; Zhao, J.B. Optimal Configuration and Site-selection Evaluation Method for Shared Energy Storage Stations. Mod. Electr. Power 2024, 1–9. [Google Scholar] [CrossRef]
  31. He, L.J.; Li, W.F.; Zhang, Y. Multi-objective optimization method based on grey synthetic incidence analysis. Control Decis. 2020, 35, 1134–1142. [Google Scholar]
  32. Zhao, H.; Hao, X. Location decision of electric vehicle charging station based on a novel grey correlation comprehensive evaluation multi-criteria decision method. Energy 2024, 299, 131356. [Google Scholar] [CrossRef]
  33. Wang, L.; Yang, J.; Qu, B.; Pang, C. Multi-Objective Optimization of an Organic Rankine Cycle (ORC) for a Hybrid Solar–Waste Energy Plant. Energies 2024, 17, 1810. [Google Scholar] [CrossRef]
  34. Akram, F.; Ahmad, T.; Sadiq, M. An integrated fuzzy adjusted cosine similarity and TOPSIS based recommendation system for information system requirements selection. Decis. Anal. J. 2024, 11, 100443. [Google Scholar] [CrossRef]
  35. Aiello, G.; Quaranta, S.; Inguanta, R.; Certa, A.; Venticinque, M. A Multi-Criteria Decision-Making Framework for Zero Emission Vehicle Fleet Renewal Considering Lifecycle and Scenario Uncertainty. Energies 2024, 17, 1371. [Google Scholar] [CrossRef]
  36. Çakiroğlu, R.; Çinici, O.K.; Asal, Ş.; Acır, A. Multi-objective optimization of the hydrogen fuel production of a solar-based cobalt-chlorine (Co–Cl) thermochemical cycle with grey relational analysis. Int. J. Hydrogen Energy 2024, 68, 360–373. [Google Scholar] [CrossRef]
  37. Zhang, X.; Duan, X. Evaluating water resource carrying capacity in Pearl River-West River economic Belt based on portfolio weights and GRA-TOPSIS-CCDM. Ecol. Indic. 2024, 161, 111942. [Google Scholar] [CrossRef]
  38. Chen, Y.T.; Chen, G.H.; Li, M.J. Research on Determining Weights of Combination Evaluation Method Using Cooperative Games. Chin. J. Manag. Sci. 2005, 13, 89–94. [Google Scholar]
  39. Więckowski, J.; Kizielewicz, B.; Shekhovtsov, A.; Sałabun, W. RANCOM: A novel approach to identifying criteria relevance based on inaccuracy expert judgments. Eng. Appl. Artif. Intell. 2023, 122, 106114. [Google Scholar] [CrossRef]
Figure 1. Adaptive demand of grid planning for novel power system.
Energies 17 03672 g001
Figure 2. Flow chart of adaptability evaluation method of grid planning scheme for novel power system considering multiple decision psychology.
Energies 17 03672 g002
Figure 3. Improved prospect value function.
Energies 17 03672 g003
Figure 4. Comparison of the assessment results of 3 evaluation methods.
Energies 17 03672 g004
Figure 5. The scores of the first-level indicators in ICPT-GRA.
Energies 17 03672 g005
Figure 6. The scores of the first-level indicators in ICPT-TOPSIS.
Energies 17 03672 g006
Figure 7. The scores of the first-level indicators in GRA-TOPSIS integrating CG and ICPT.
Energies 17 03672 g007
Figure 8. The scores of the second-level indicators in GRA-TOPSIS integrating CG and ICPT.
Energies 17 03672 g008
Figure 9. Results of multiple psychological comprehensive evaluation of decision-makers.
Energies 17 03672 g009
Figure 10. Results of the evaluation of first-level indicators under multiple psychology in Region 1.
Energies 17 03672 g010
Table 1. Adaptability evaluation index system of power grid planning scheme for novel power system.
First-Level IndicatorsSecond-Level Indicators
Economic Adaptability (C1)Elasticity coefficient of power production (C11)
Investment revenue expansion ratio (C12)
Additional load capacity per unit investment (C13)
Additional electricity supply per unit investment (C14)
Energy Structure Adaptability (C2)Proportion of clean energy (C21)
Capacity to accommodate renewable energy (C22)
Grid Structure Adaptability (C3)Substation full stop and turn rate (C31)
Capacity ratio of transformer (C32)
Capacity expansion margin of substation (C33)
Remaining interval ratio (C34)
Line capacity-to-load ratio (C35)
Line loss rate (C36)
Reliability Adaptability (C4)N-1 pass rate of power lines (C41)
N-1 pass rate of transformers (C42)
Voltage compliance rate (C43)
Mean power supply reliability (C44)
Environment Adaptability (C5)CO2 emission reduction (C51)
NOX emission reduction (C52)
SO2 emission reduction (C53)
Table 2. Standardized data.
IndicatorsRegion 1Region 2Region 3
C110.62000.60000.9800
C120.86270.80130.8480
C130.84600.53310.7840
C140.75780.65250.8867
C210.64210.52620.5575
C220.58460.60480.5408
C310.75410.82300.6997
C320.47100.90580.7609
C331.00000.67500.9300
C341.00000.95551.0000
C350.80360.87940.7851
C360.65840.65690.6996
C410.90001.00000.8300
C420.74560.66160.7144
C430.75460.87500.8449
C440.97090.77500.9340
C510.61210.55380.5645
C520.64110.65540.3992
C530.58390.52090.6227
Table 3. Objective weights.
Evaluation Indicators G i V i Evaluation Indicators G i V i
C110.84020.0498C351.32430.0785
C120.66860.0397C360.84480.0501
C130.66660.0395C411.29510.0768
C140.73400.0435C420.67960.0403
C210.74530.0442C431.24990.0741
C221.23200.0731C440.66620.0395
C310.68530.0406C510.76620.0454
C321.26920.0753C521.16070.0688
C330.66740.0396C530.69950.0415
C340.66530.0395
Table 4. Combined weights.
First-Level IndicatorsCombined WeightsSecond-Level IndicatorsCombined Weights
C10.1969C110.0601
C120.0383
C130.0476
C140.0509
C20.1210C210.0492
C220.0718
C30.2936C310.0388
C320.0873
C330.0364
C340.0341
C350.0548
C360.0422
C40.03065C410.0825
C420.0672
C430.0764
C440.0804
C50.07940C510.0315
C520.0235
C530.0244
Table 5. Overall scores and ranking results in ICPT-GRA method.
SamplePositive Ideal Solution DistanceNegative Ideal Solution DistanceComprehensive Prospect Value of ICPT-GRARanking Results in ICPT-GRA
Region 10.65550.59901.78741
Region 20.59980.60370.53953
Region 30.63120.56591.66232
Table 6. Overall scores and ranking results in ICPT-TOPSIS method.
SamplePositive Ideal Solution DistanceNegative Ideal Solution DistanceComprehensive Prospect Value of ICPT-TOPSISRanking Results in ICPT-TOPSIS
Region 10.61380.68730.333642
Region 20.465400.55480.19743
Region 30.69730.42130.40641
Table 7. Overall scores and ranking results in GRA-TOPSIS integrating CG and ICPT method.
SampleComprehensive Prospect Value of GRA-TOPSIS Integrating CG and ICPT MethodRanking Results in GRA-TOPSIS Integrating CG and ICPT Method
Region 10.98791
Region 20.29833
Region 30.91002
Table 8. Combination of mental parameters for decision-makers.
Sequence α β δ θ Risk Attitudes of Decision-MakerProfit–Loss Attitude of Decision-Maker
10.40.412.25RadicalLoss-sensitive
21112.25Balanced
31.91.912.25Cautious
40.40.42.251RadicalProfit-sensitive
5112.251Balanced
61.91.92.251Cautious
Disclaimer/Publisher’s Note: The statements, opinions and data contained in all publications are solely those of the individual author(s) and contributor(s) and not of MDPI and/or the editor(s). MDPI and/or the editor(s) disclaim responsibility for any injury to people or property resulting from any ideas, methods, instructions or products referred to in the content.