Article

Investigation on Cryogenic Cavitation Characteristics of an Inducer Considering Thermodynamic Effects

1
School of Mechanical and Automotive Engineering, Zhejiang University of Water Resource and Electric Power, Hangzhou 310018, China
2
School of Mechanical and Engineering, Ningxia University, Yinchuan 750021, China
3
The Zhejiang Provincial Key Laboratory of Fluid Transmission Technology, Zhejiang SCI-Tech University, Hangzhou 310018, China
*
Author to whom correspondence should be addressed.
Energies 2024, 17(15), 3627; https://doi.org/10.3390/en17153627
Submission received: 3 July 2024 / Revised: 17 July 2024 / Accepted: 22 July 2024 / Published: 24 July 2024
(This article belongs to the Section J: Thermal Management)

Abstract

:
An inducer is a key component in a cryogenic pump to improve its cavitation performance. The thermodynamic effects of the cryogenic medium make the cryogenic cavitation flow extremely complicated. For this reason, it is crucial to investigate the cryogenic cavitation flow of the inducer which is equipped upstream of the cryogenic pump. In this paper, the isothermal cavitation model is modified based on the law of heat conduction, and the cryogenic cavitation model of the inducer is developed by considering thermodynamic effects. The turbulence model is also modified to account for the compressibility of cryogenic cavitation flow. The methods of numerical calculations are performed to investigate the influence of thermodynamic effects on cryogenic cavitation of the inducer. The law of the spatio-temporal evolution of cryogen cavitation in the inducer is clarified. The initial position, development and collapse phenomenon of cavitation are obtained. The relationship between the generation and collapse of the cavitation and the work capacity of the inducer’s blade, the relationship between thermodynamic effects and the influence of the inducer’s blade tip leakage vortex and thermodynamic on cryogenic cavitation of the inducer are revealed.

1. Introduction

High-speed centrifugal pumps are the core devices of liquid transmission systems, which are widely used in the aerospace, petrochemical and nuclear power industries. The performance of high-speed centrifugal pumps directly affects stable operation of the entire system. High-speed centrifugal pumps are highly susceptible to cavitation during operation due to their high rotational speed characteristics. Once cavitation occurs, the localized micro-jet formed when the vacuole collapses will erode the blade surfaces, which can cause fatigue damage of the material. When cavitation develops seriously in blade channels, it will directly lead to a decrease in pump head, and even whole-pump-unit failure [1,2,3]. As the cavitation phenomenon is easy to occur and difficult to avoid, an inducer is generally installed in front of the pump impeller for suppressing cavitation to ensure stable operation of the pump.
In recent years, lots of research has been carried out on the internal flow and cavitation phenomenon of inducers. Cheng et al. [4] investigated the effect of different inlet sweepback angles on the cavitation performance of an inducer and summarized the relationship between cavitation position and cavitation coefficients. Morii et al. [5] and Kim et al. [6] studied the effect of incident angle on cavitation instability. The results showed that the axial rotating cavitation vortex and low-frequency cavitation surge are more prominent at the inlet pipe of the inducer under a large incidence angle. Zhai et al. [7] conducted numerical simulations and experimental research on the cavitation characteristics of inducers with two and three blades. It was found that cavitation occurs near the leading edge of the blade tip, and the cavitation performance of the three-blade inducer was better than that of the two-blade inducer. Karakas [8] investigated the effects of the blade tip gap of an inducer on the cavitation and non-cavitation performance of a centrifugal pump. It was revealed that the tip gap had a large effect on cavitation performance and no effect on non-cavitation performance.
The above-mentioned studies were confined to room temperature water medium and did not consider cryogenic cavitation. In recent years, with the diversification of the conveying media, high-speed inducer centrifugal pumps are used to transport cryogenic media, and scholars have carried out relevant research on cryogenic cavitation of inducers. Hashimot et al. [9] experimentally investigated cryogenic cavitation phenomenon in the inducer of a liquid-oxygen turbopump, and found that rotational cavitation caused super-synchronous axial vibration. Franc et al. [10] studied the effect of cavitation parameters on the length of the cavity through visualization experiment, and monitored the incipient phenomenon of cavitation instability through pressure fluctuation spectrum. Kim et al. [11] measured cavitation instability of the two working media of water and liquid oxygen with an acceleration meter. The results showed that super-synchronous rotational cavitation occurs in both fluids at low flow coefficient. Ito et al. [12,13] conducted visualization experiment using water and liquid nitrogen to study the cavitation characteristics of the inducer in different media and at different temperatures. It was demonstrated that the cavitation rate and the cavity size of the backflow vortex in front of the inducer blades are independent of the type of media and are related to the head coefficient. Kikuta et al. [14] studied the influences of thermodynamic effects on cavitation performance of the inducer under liquid nitrogen and water. The results revealed that when the length of the cavity exceeds over the blade throats, thermodynamic effects affected the cavitation instability in the form of “thermal damping”. Yoshida et al. [15] used liquid nitrogen as the medium to study the relationship between thermodynamic effects and sub-synchronous rotating cavitation in a three-blade inducer, and concluded that thermodynamic effects suppressed the occurrence of sub-synchronous rotational cavitation with increasing temperature. Fan et al. [16] investigated the effect of temperature on the cavitation performance of the inducer. It was discovered that the volume of the cavity decreased and the temperature drop around the cavity increased with increasing temperature, which delayed the sudden drop in head. Ehrlich et al. [17] carried out unsteady numerical simulations of water under different temperature conditions. The results showed that thermodynamic effects greatly improved the cavitation instability of the inducer. Chen et al. [18] adopted a modified cavitation model to study the influences of thermodynamic effects and tip leakage vortex on the hydraulic losses in a three-blade inducer. The results demonstrated that thermodynamic effects reduced the size of the cavity and the vortex at the leading edges of the blades as well as suppressed tip leakage vortex. Xiang et al. [19] proposed a calculation method of cryogenic cavitation based on a transport cavitation model to study cavitation flow characteristics in the inducer with liquid oxygen, and revealed that thermodynamic effects significantly decreased the cavitation area and the volume fraction of vapor phase in the cavity. Generally, thermodynamic effects have a great influence on the cavitation characteristics of thermal medium. Scholars have conducted some research on cryogenic cavitation.
In recent years, some scholars have employed large eddy simulation (LES) models to study low-temperature cavitation on hydrofoils. Alavi and Roohi [20], using an LES model, investigated the cavitation phenomena on a NACA 66 hydrofoil under combined oscillatory effects at different cavitation numbers. The results indicated that increasing the oscillation speed of the hydrofoil delays the onset of cavitation and enlarges the cavity size. Additionally, cavitation on the hydrofoil surface can accelerate the transition from laminar to turbulent boundary layers, enhancing the intensity of the turbulent boundary layer, thereby delaying the occurrence of flow separation. Mousavi and Roohi [21] studied supercavitating flow behavior on a Clark-Y hydrofoil with different contact angle patterns based on the LES model. Their findings showed that a superhydrophobic surface on the pressure side and trailing edge, combined with a superhydrophilic surface on the leading edge, can reduce the thickness of the wake region, the length of the cavitation cloud, and flow instability, while delaying the occurrence of cavitation.
However, the spatio-temporal evolution law of cryogenic cavitation, the generation and collapse of the cavity in relation to energy changes, the influence of thermodynamic effects on the cavitation position and the cavitation intensity, and the relationship between tip leakage vortex and cryogenic cavitation have not been well revealed. Therefore, in this paper, the cryogenic cavitation of the inducer is numerically investigated by a modified turbulence model and a cavitation model considering thermodynamic effects under the assumption of homogeneous mixed flow with liquid nitrogen as the working medium.

2. Research Objects and Numerical Calculation Methods

2.1. Research Objects

In this paper, a splitter-bladed inducer upstream of an LNG pump is adopted as the research object. The specific structure and geometric parameters are shown in Figure 1 and Table 1, respectively.

2.2. Governing Equations

There is obvious vapor–liquid phase transition during cavitation, which involves complex multi-phase flow problems. In this paper, the homogeneous mixed flow model is used for numerical calculations in the cavitation flow, that is, the gas–liquid two-phase flow is regarded as a single flow with variable density, and the flow parameters are averaged over the corresponding parameters of the two-phase flow [22,23]. The basic equations are as follows:
ρ m t + x j ( ρ m u j ) = 0
ρ m u i t + ρ m u i u j x i = p x i + x j μ m + μ t u i x j + u j x i 2 3 u k x k δ i j
t ρ m C p l T + x j ρ m C p l T u j = x j [ ( λ m + λ t ) T x j ] m ˙ L
m ˙ = m ˙ + + m ˙ = α v ρ v t + α v ρ v u j x j
ρ m = α v ρ v + 1 α v ρ l
μ m = α v μ v + 1 α v μ l
where ρ, u and p denote density, velocity and pressure, respectively. v, l and m denote vapor phase, liquid phase and mixed phase, respectively. i, j and k represent coordinate axes. μm is dynamic viscosity; μt is the turbulent viscosity of the mixture. λm and λt are the thermal conductivity of the mixture and turbulence, respectively. T, Cpm and L, are temperature, specific heat and latent heat. α is volume fraction.

2.3. The Cavitation Model

The Zwart cavitation model is developed based on the Rayleigh–Pleasset cavitation dynamics equations. The temperature change during cavitation is not taken into account in the derivation and the effects of the surface tension and viscosity terms are neglected. The equations for the evaporation source term  m ˙ +  and condensation source term  m ˙  are shown below,
m = C v a p 3 α n u c ρ v ( 1 α v ) R B 2 ( p v ( T ) p ) 3 ρ l   p p v ( T )
m + = C c o n d 3 α v ρ v R B 2 ( p p v ( T ) ) 3 ρ l           p > p v ( T )
Thermodynamic effects and compressibility are inseparable in cavitation studies of cryogenic fluids. Compressibility is introduced into the gas–liquid two-phase equation based on the heat transfer equation. Thus, the modified evaporation source term  m ˙ + , condensation source term  m ˙ , and gas–liquid equations can be shown as follows [24,25,26,27].
m + = F v a p 3 α n u c ρ v ( 1 α ) R B 2 max ( p v ( T ) p , 0 ) 3 ρ l C 0 h b K l ρ l C l
m = F c o n d 3 α ρ v R B 2 max ( p p v ( T ) , 0 ) 3 ρ l C 0 h b K l ρ l C l
p + p c ρ l = R l T + T c
p = ρ v R v T
where conducting numerical simulations on the airfoil, set the bubble radius RB = 1 × 10⁻⁶ m, the volume score of the gas core point αnuc = 5 × 10⁻⁴, C0hb = 1 W/(m2·k) [25,26,27], Fvap = 5.0, Fcond = 0.001 [24], Pressure experience coefficient pc = 295.6 MPa, temperature experience coefficient Tc = 102.5 K. Liquid constant Rl and steam constant Rv of liquid nitrogen are 2040 J/(kg·k) and 296.8 J/(kg·k), respectively. The saturated steam pressure PV (T) = exp [58.28 + (−1084.1/t) − 8.3144 LN (T) + 0.044 T], and T is the reference temperature at a given point in the flow field. Where conducting digital simulations on the inducer, set RB = 2 × 10⁻⁶ m, αnuc = 4 × 10⁻³, the material properties are set according to the data in Table 2, and the other constants are set the same as those in the Clark-Y hydrofoil model.

2.4. Turbulence Model

A turbulence model is added to closed the set of governing equations. In this paper, the SST k-w model is applied, which considers the transfer of turbulent shear forces and is able to capture with accuracy the flow separation phenomena under relative counterpressure gradients. For the SST k-w model, the turbulence viscosity  μ t  is shown below:
μ t = α 1 ρ m k max ( α 1 , ω , S F 2 )
where α1 = 0.31,  S = 2 Ω i j Ω i j  and  Ω i j = 1 2 ( u i x j u j x i ) . The transition function  F 2 = tanh ( arg 2 2 ) arg 2 = max ( 2 k β ω y , 500 υ y 2 ω ) . y represents the distance between the local mesh node to the nearest wall surface, υ is motion viscosity, β′ = 0.09. k and ω are turbulent kinetic energy and turbulent vortex frequency, respectively, which can be solved through the following equations.
ρ m k t + u j ρ m k x j = x j μ m + μ t σ k 3 k x j + P k β ρ m k ω
ρ m ω t + ρ m ω x j = x j μ m + μ t σ ω 3 ω x j + α 3 ω k P k β 3 ρ m ω 2 + 2 1 F 1 ρ m 1 σ ω 2 ω k x j ω x j
where σk3, σω3, α3 and β3 are linear combinations of the corresponding coefficients of the k-ω model and the k-ε model. F1 is a mixed function based on the distance from the local grid nodes to the walls. Due to the compressibility of the cryogenic cavitation flow, the turbulence viscosity item is corrected, as shown below:
μ t m = α 1 ρ m k max ( α 1 , ω , S F 2 ) f ( ρ m )
f ( ρ m ) = ρ v + ρ v ρ m ρ v ρ l n ( ρ l ρ v )
where n = 3, and the turbulent viscosity in Equation (2) is then replaced by Equation (14) to obtain better accuracy in turbulence prediction.

2.5. Computing Domain and Grid Independence Verification

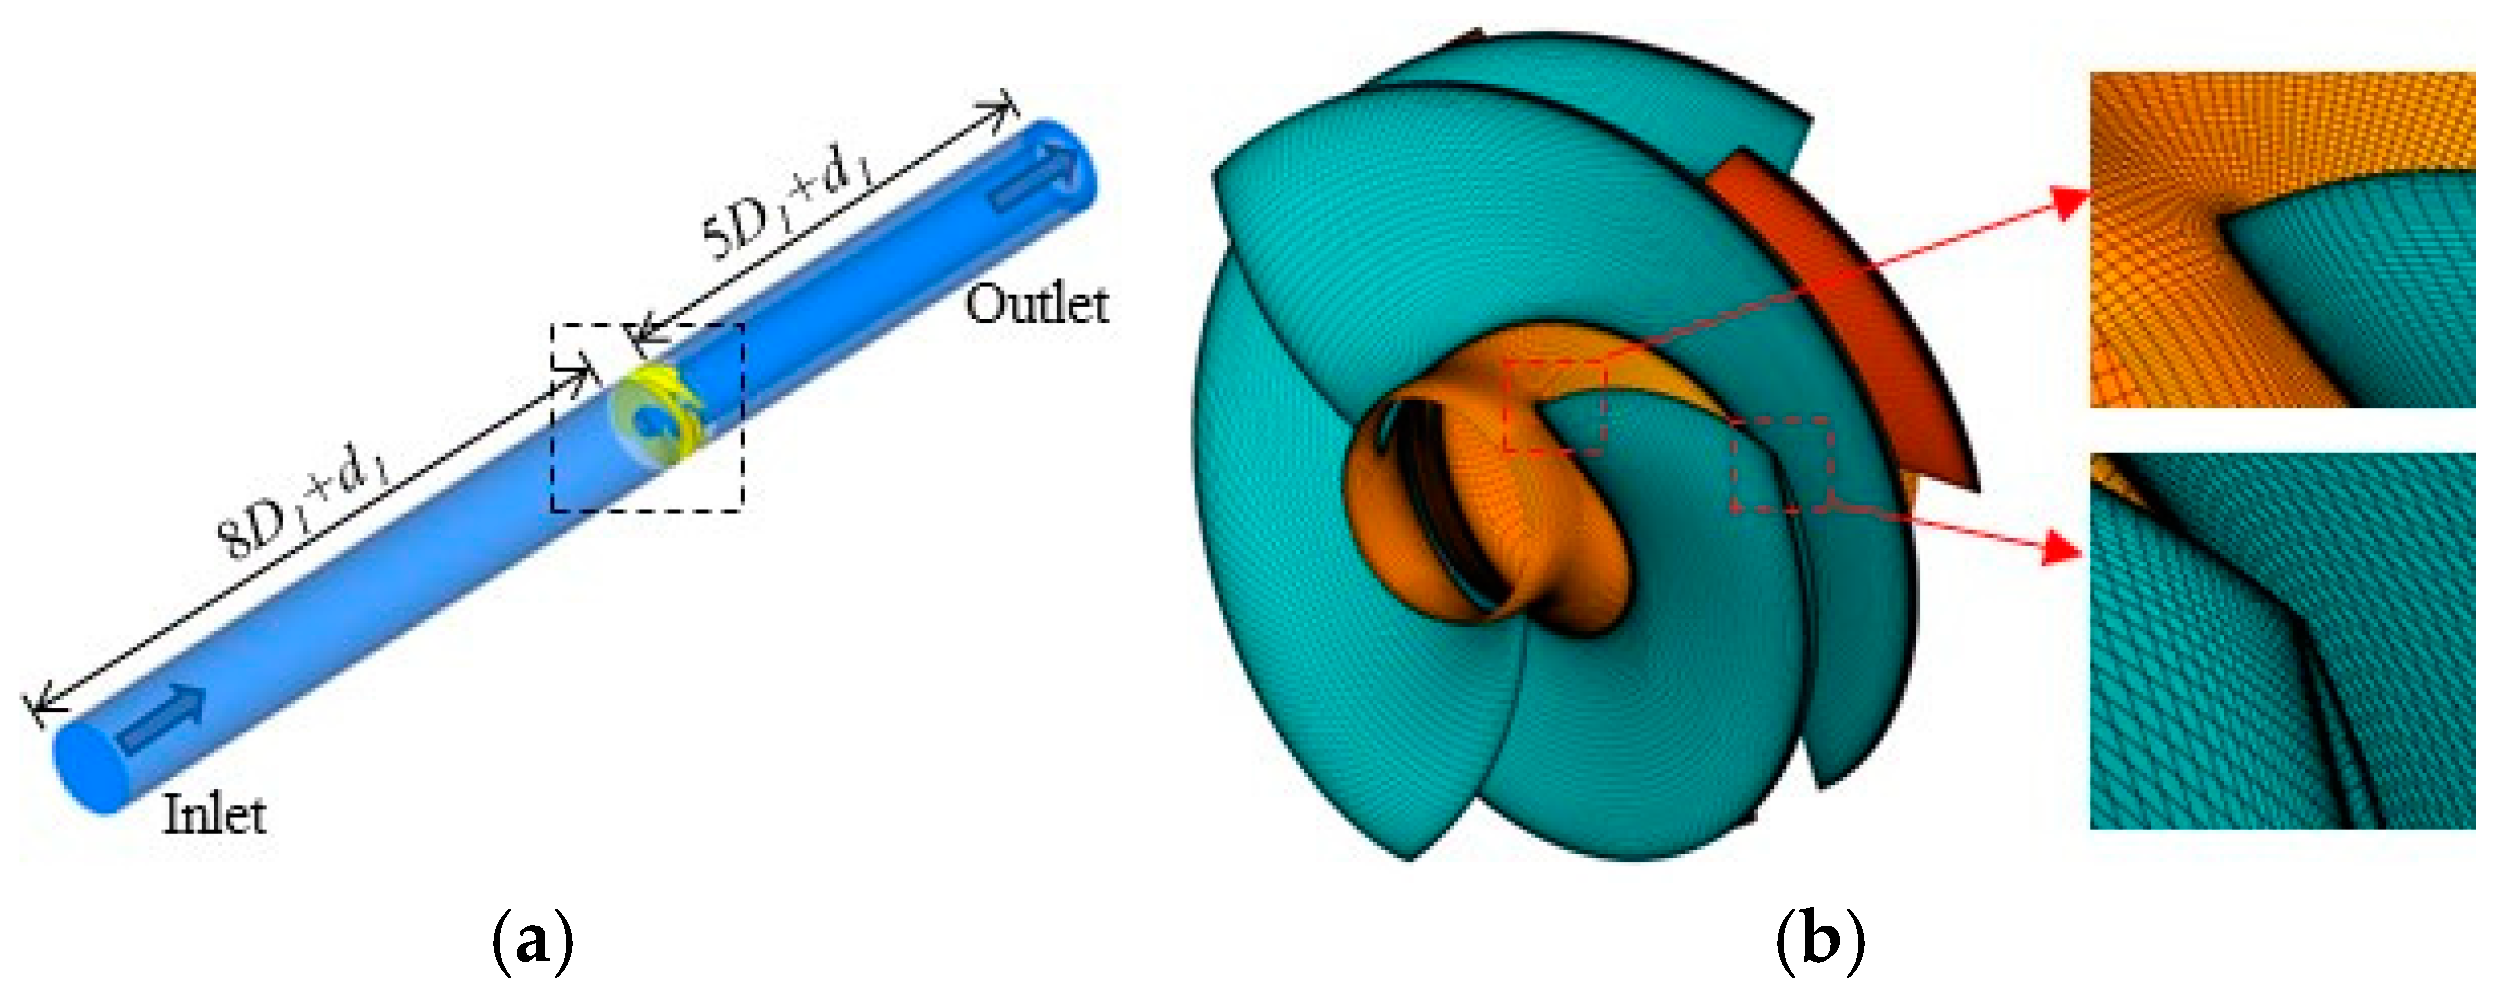
The three-dimensional fluid domain is shown in Figure 2. The inlet and outlet of the inducer are lengthened to 8(D1 + d1) and 5(D1 + d1), respectively, to minimize interference with the flow field, as shown in Figure 2a. The mesh for the inducer and the inlet and outlet flow channels was generated using Turbogrid 2018 and ICEM CFD 2018 software, respectively. To improve the computational accuracy, the whole calculation domains are structured with hexahedral structured mesh and mesh encrypted is performed near the walls, the y+ value of the mesh on the surface of the inducer is less than 40, as shown in Figure 2b.
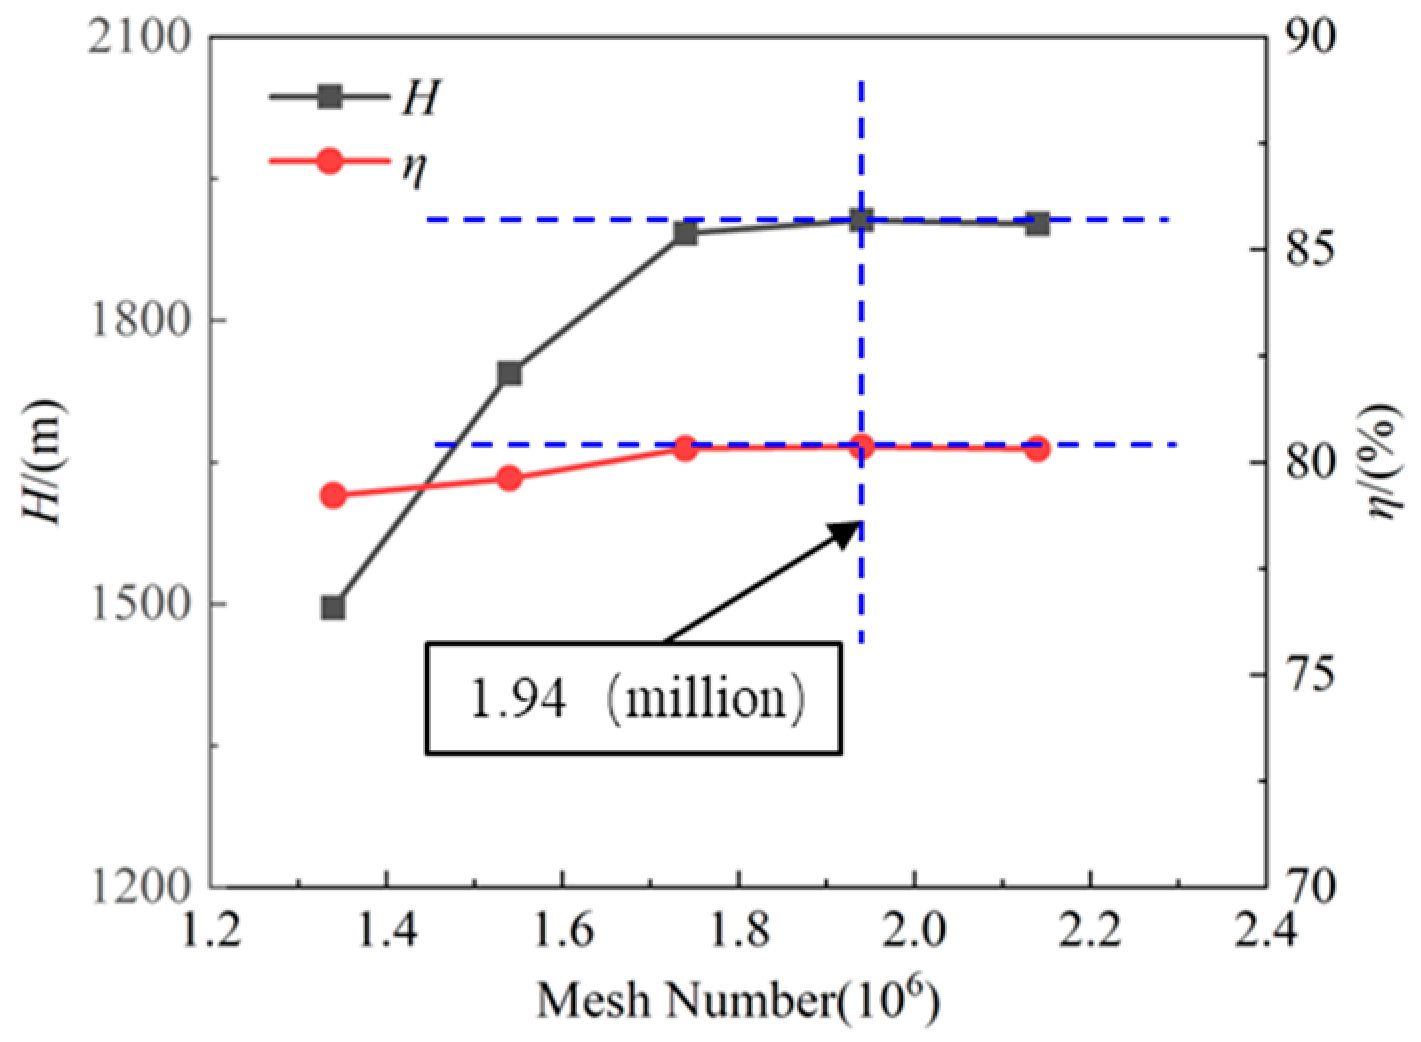
Grid independence is checked by comparing the head and efficiency at different grid densities, as shown in Figure 3. It can be seen from the Figure that when the number of grids increases to 1.95 million, the head and efficiency remain almost unchanged, so the grid number of 1.95 million is chosen for subsequent numerical studies.

2.6. Boundary Condition Settings

The finite volume method is used to discrete the Navier-stokes equations. The convection and diffusion terms are discretized by the second-order upwind scheme and the central difference scheme, respectively, and the three-dimensional unsteady flow field is solved by CFX 18.0. The modified cavitation model and turbulence model are loaded through CEL language, and the total pressure (0.71 MPa) and the mass flow rate (66.69 kg/s) are set at the inlet and outlet, respectively. The impeller speed is 3000 r/min. The average y+ value of the adjacent wall is approximately 10~30, and all wall are set as non-slip walls. Static and rotating domains are connected by frozen rotor. The convergence accuracy of numerical calculations is 10−5. The solution is calculated once every 3° rotation of the impeller, so the time step is 0.00002 s, and the total simulation time is 20 rotation cycles.

2.7. Cavitation Model Verification

To verify the computational accuracy of the modified turbulence and cavitation models, the internal flow of the airfoil is numerically calculated with liquid nitrogen as the working medium based on the cryogenic cavitation experimental conditions and results of the airfoil by Hord [28]. The material properties of liquid nitrogen are shown in Table 2.
The geometric model of the airfoil is shown in Figure 4a. The length of the calculation domain l = 230 mm, the width w = 12.7 mm, the Chord length D = 63.5 mm, and the airfoil and head radius r = 3.96 mm. The mesh around the airfoil head is shown in Figure 4b, and its grid is encrypted. Define the cavitation number  σ  as:
σ = p i n p v 1 2 ρ V i n 2
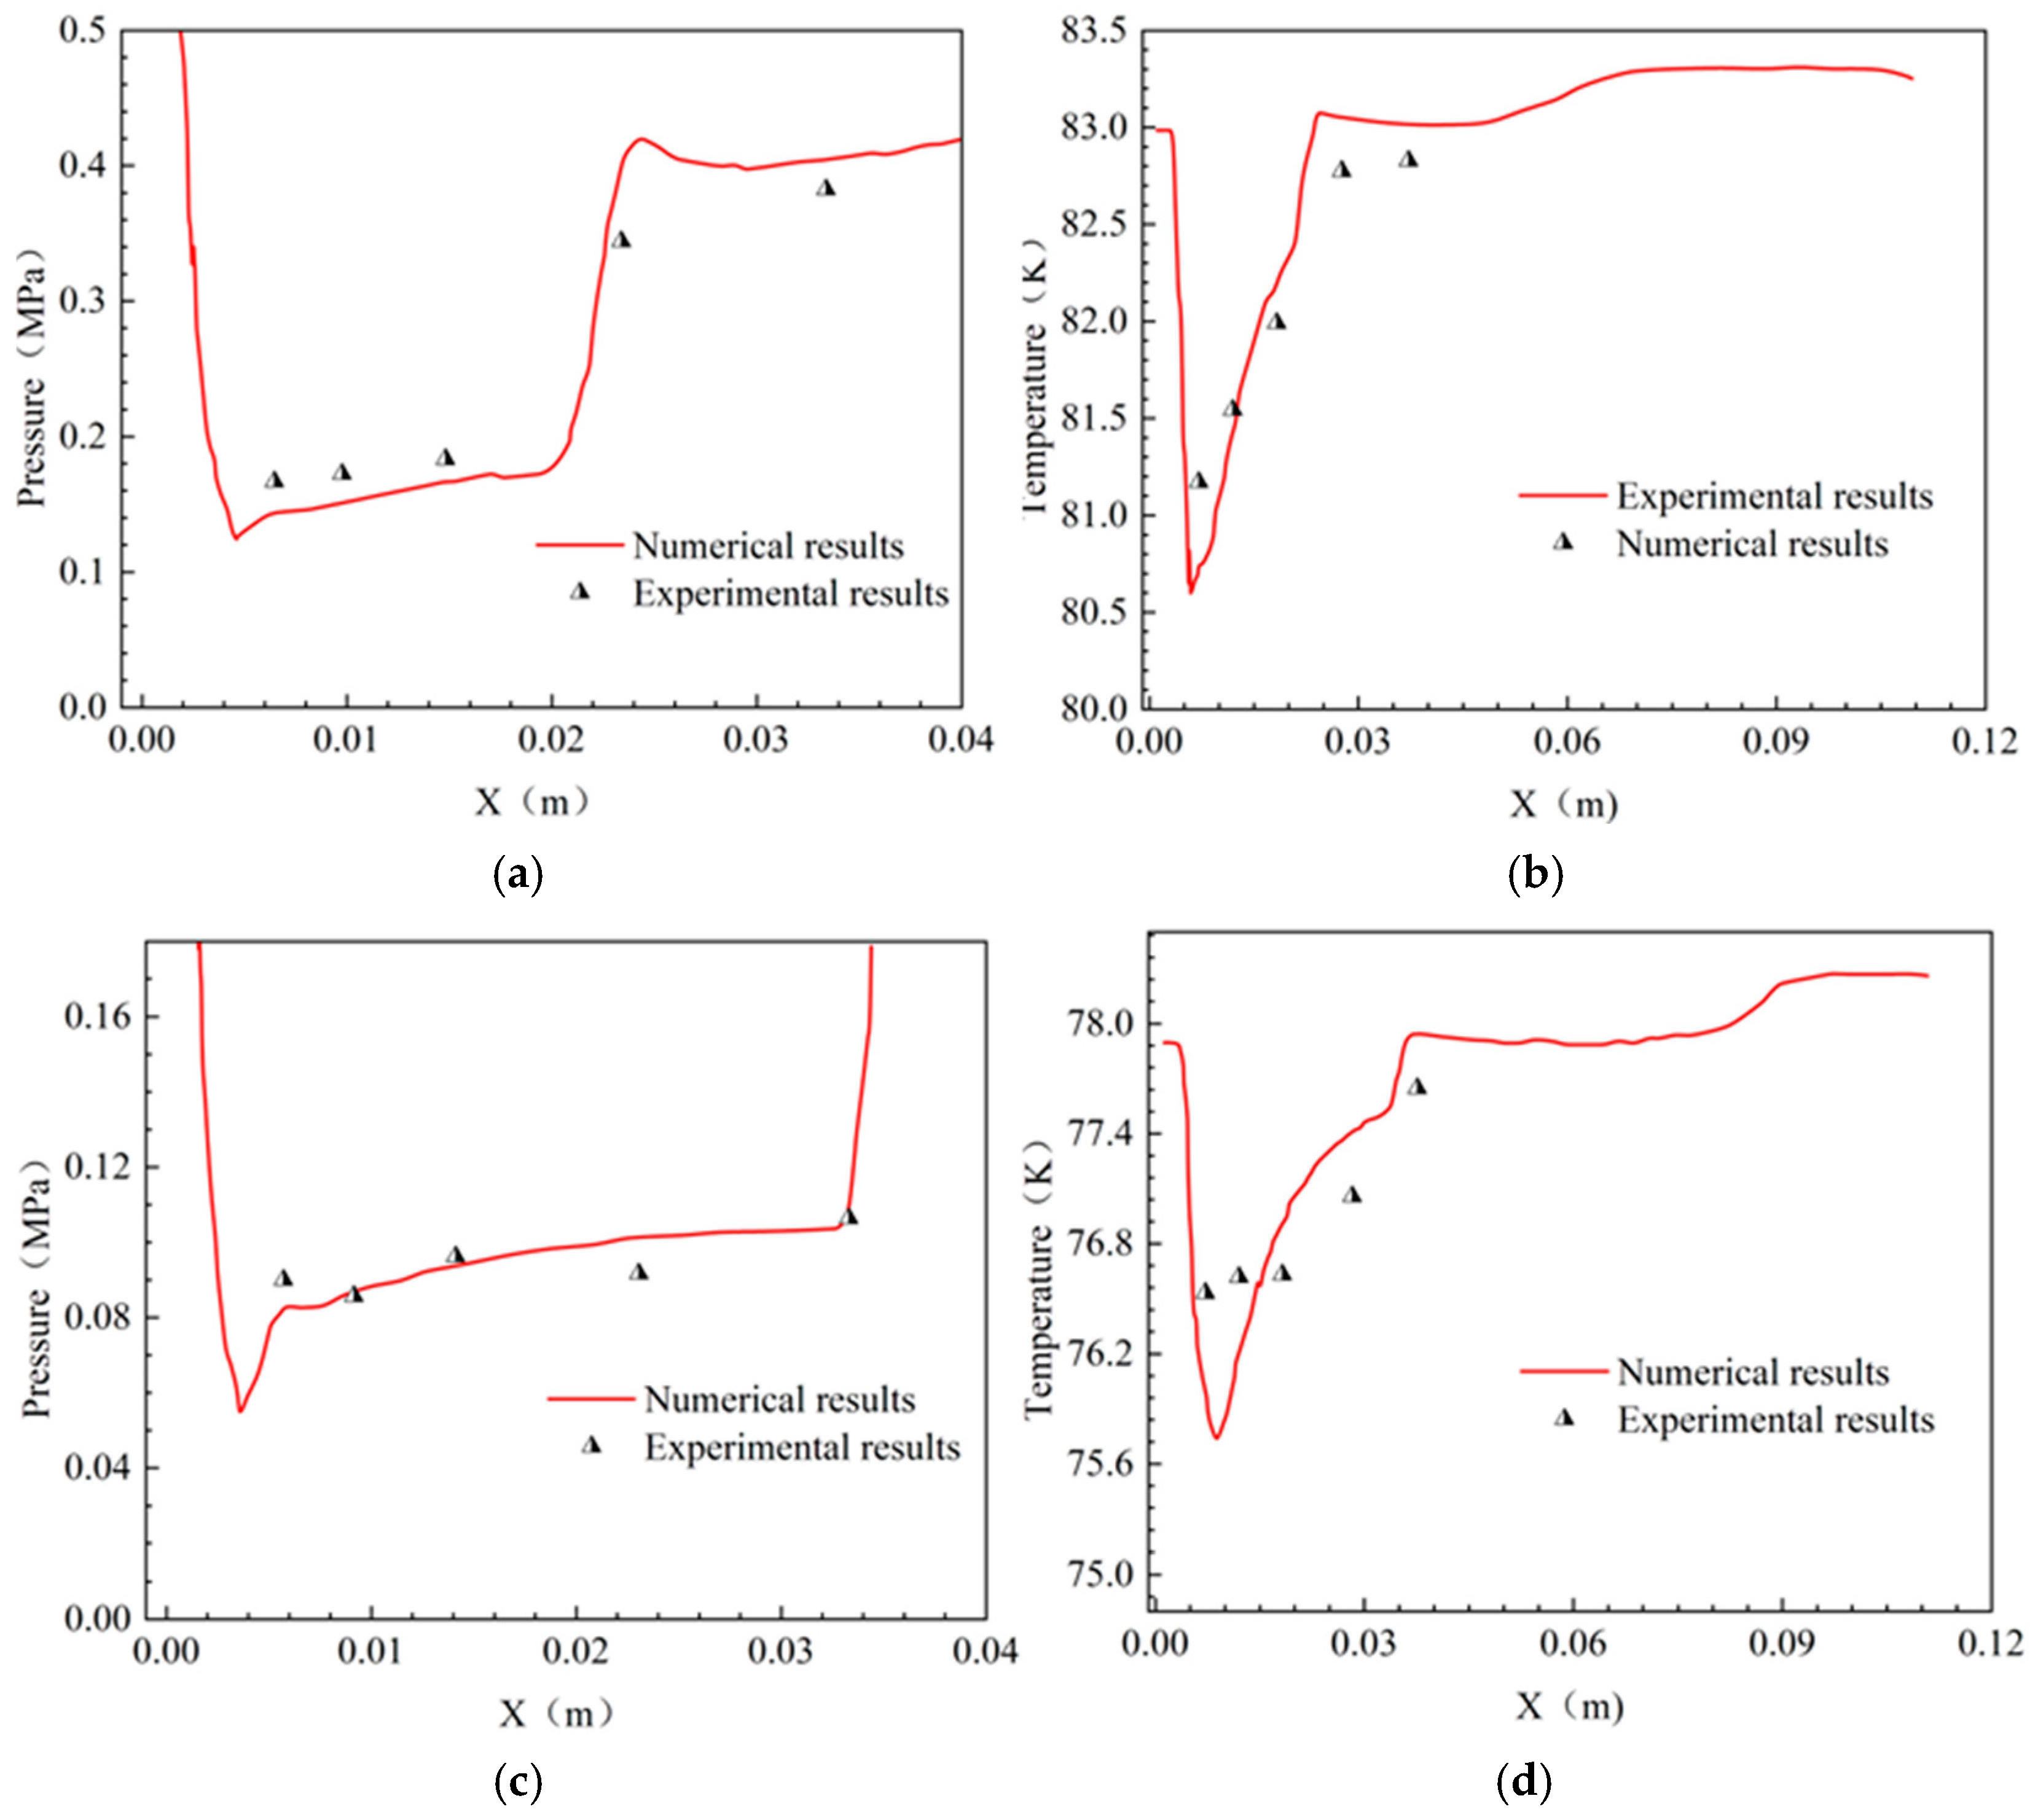
In order to verify the accuracy, numerical calculations are performed for two operating conditions as shown in Table 3, and the comparison between the calculation results and experimental results are shown in Figure 5.
It can be seen from Figure 5a–d that the average relative errors of pressure and temperature are 4.43%and 0.28%, respectively, and the numerical results are in good agreement with the experimental results. In conclusion, the modified ZGB cavitation model can accurately simulate the pressure and temperature distribution of the airfoil, which verifies the accuracy of the cavitation model and is suitable for the study of the cryogenic cavitation characteristics of inducers with liquid nitrogen as the medium

3. Analysis of Calculation Results

3.1. Study on Cavitation Performance of the Inducer at Different Temperature Conditions

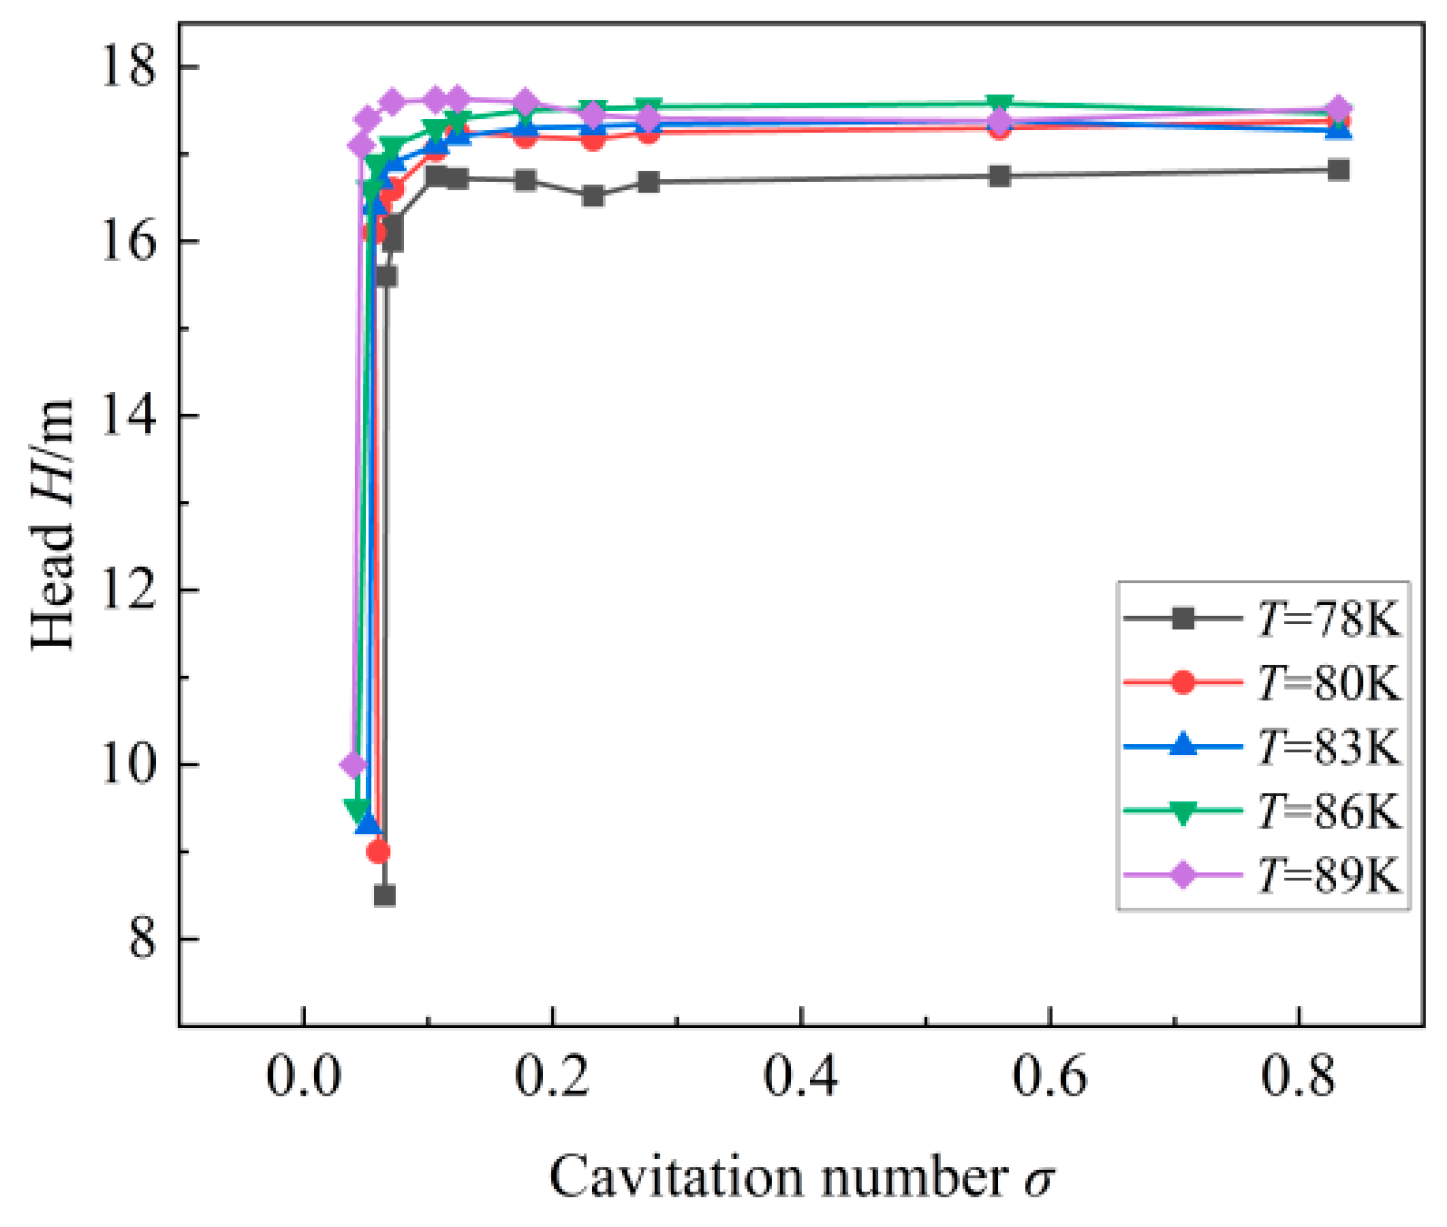
In this paper, numerical calculations of cryogenic cavitation of the inducer are carried out for five temperature conditions (78 K, 80 K, 83 K, 86 K, and 89 K) with liquid nitrogen, and the cavitation performance curves at different temperatures are obtained, as shown in Figure 6. Figure 7 analyzes the position of the cavity with different cavitation coefficients for the same temperature condition. Figure 8 obtains the distribution of the gas volume fraction in the axial cross-section and the pressure coefficient in the axial cross-section of the inducer at different temperatures.
As seen in Figure 6, with the decrease in the cavitation number, the lift of the induced wheel at different temperatures remained basically unchanged at first, then increased slightly, and finally decreased rapidly. The main reasons are as follows: in the early stage of cavitation, a small amount of cavitation is attached to the blade surface, forming a hydraulic smooth area on the blade surface, reducing the friction loss on the blade surface and slightly increasing the head. At T = 89 K, the increase in head is significantly greater than at other temperatures. This is because the suppression of cavitation development within the flow channel is most effective at this temperature, resulting in the lubricating effect of cavitation being greater than its blocking effect. With the development of cavitation degree, a large number of cavitation falls off from the blade surface, blocking the flow channel, blocking the liquid flow, and significantly reducing the head.
At the same time, the temperature has a great influence on the cavitation performance of the inductor wheel. The specific conclusions are as follows: With the increase in temperature, the critical cavitation coefficient decreases. When the cavitation number is 0.14, the fracture cavitation begins to occur at 78 K, and the head decreases rapidly, while the cavitation at other temperatures does not reach the fracture cavitation point. When the cavitation coefficient is 0.05, fracture cavitation begins to occur in 89 K condition, while at this time, fracture cavitation has occurred in other temperature conditions. The main reason is that with the increase in temperature, the thermodynamic effect is enhanced, which effectively inhibits cavitation, reduces the critical cavitation number, and improves the performance of induction wheel.
Figure 7 shows the cavity positions at different cavitation numbers (78 K), along with the pressure distribution on the inducer blades for comparative analysis. The space-time evolution law of cavitation can be seen from Figure 7. When  σ  = 0.3, cavitation begins at the outer edge of the long blade A, and the distribution is in the shape of a small triangle, and the spatio-temporal area is very small, the cavitation phenomenon is mainly due to the pressure reduction caused by the flow motion around the inlet edge of the inducer blade. As σ decreases, the pressure at the inlet end gradually reduces, causing the cavitation area to expand and extend into the flow channel. Due to the centrifugal force generated by the rotation of the inducer wheel, the cavitation shifts backward towards the outer edge of the inducer wheel, forming a triangular cavitation region (see region B). With a further decrease in σ, wake phenomena are observed in the cavitation regions. During cavitation, leakage vortices emerge in the tip region of the inducer and are deflected towards the hub, rendering the tail of the cavitation region more unstable and leading to vortex tail phenomena (see region C).
Also according to Figure 7, the relationship between the low-pressure region and the cavitation region is clarified. For different cavitation coefficients, the cavitation regions are similar at low-pressure locations, and the maximum region of pressure drop is located at the leading edge of the blades. Due to the reduction in pressure, the medium cavitation produces bubbles, and the low-pressure regions are larger than the cavity regions. The generation and collapse of cavities are accompanied by energy changes, which affects the work capacity of the blades. When σ = 0.3, the cavitation intensity is low and the cavitation region is small. Cavitation only appears at the leading edge of the inducer inlet, which has a little effect on the inducer. When σ = 0.16, the inlet leading edge blades of the inducer begins to show obvious lamellar cavitation, which affects the pump head, but the inducer can still work. When σ = 0.1, the cavitation regions of the inducer extend further and the cavitation become more severe. When σ = 0.08, the cavitation regions in the inducer develop faster and the vortex cavitation is intense, Part of the energy generated by the work of the impeller is consumed in the process of the bubble being changed back to the liquid. This phenomenon causes the pump head to decrease significantly (see Figure 6).
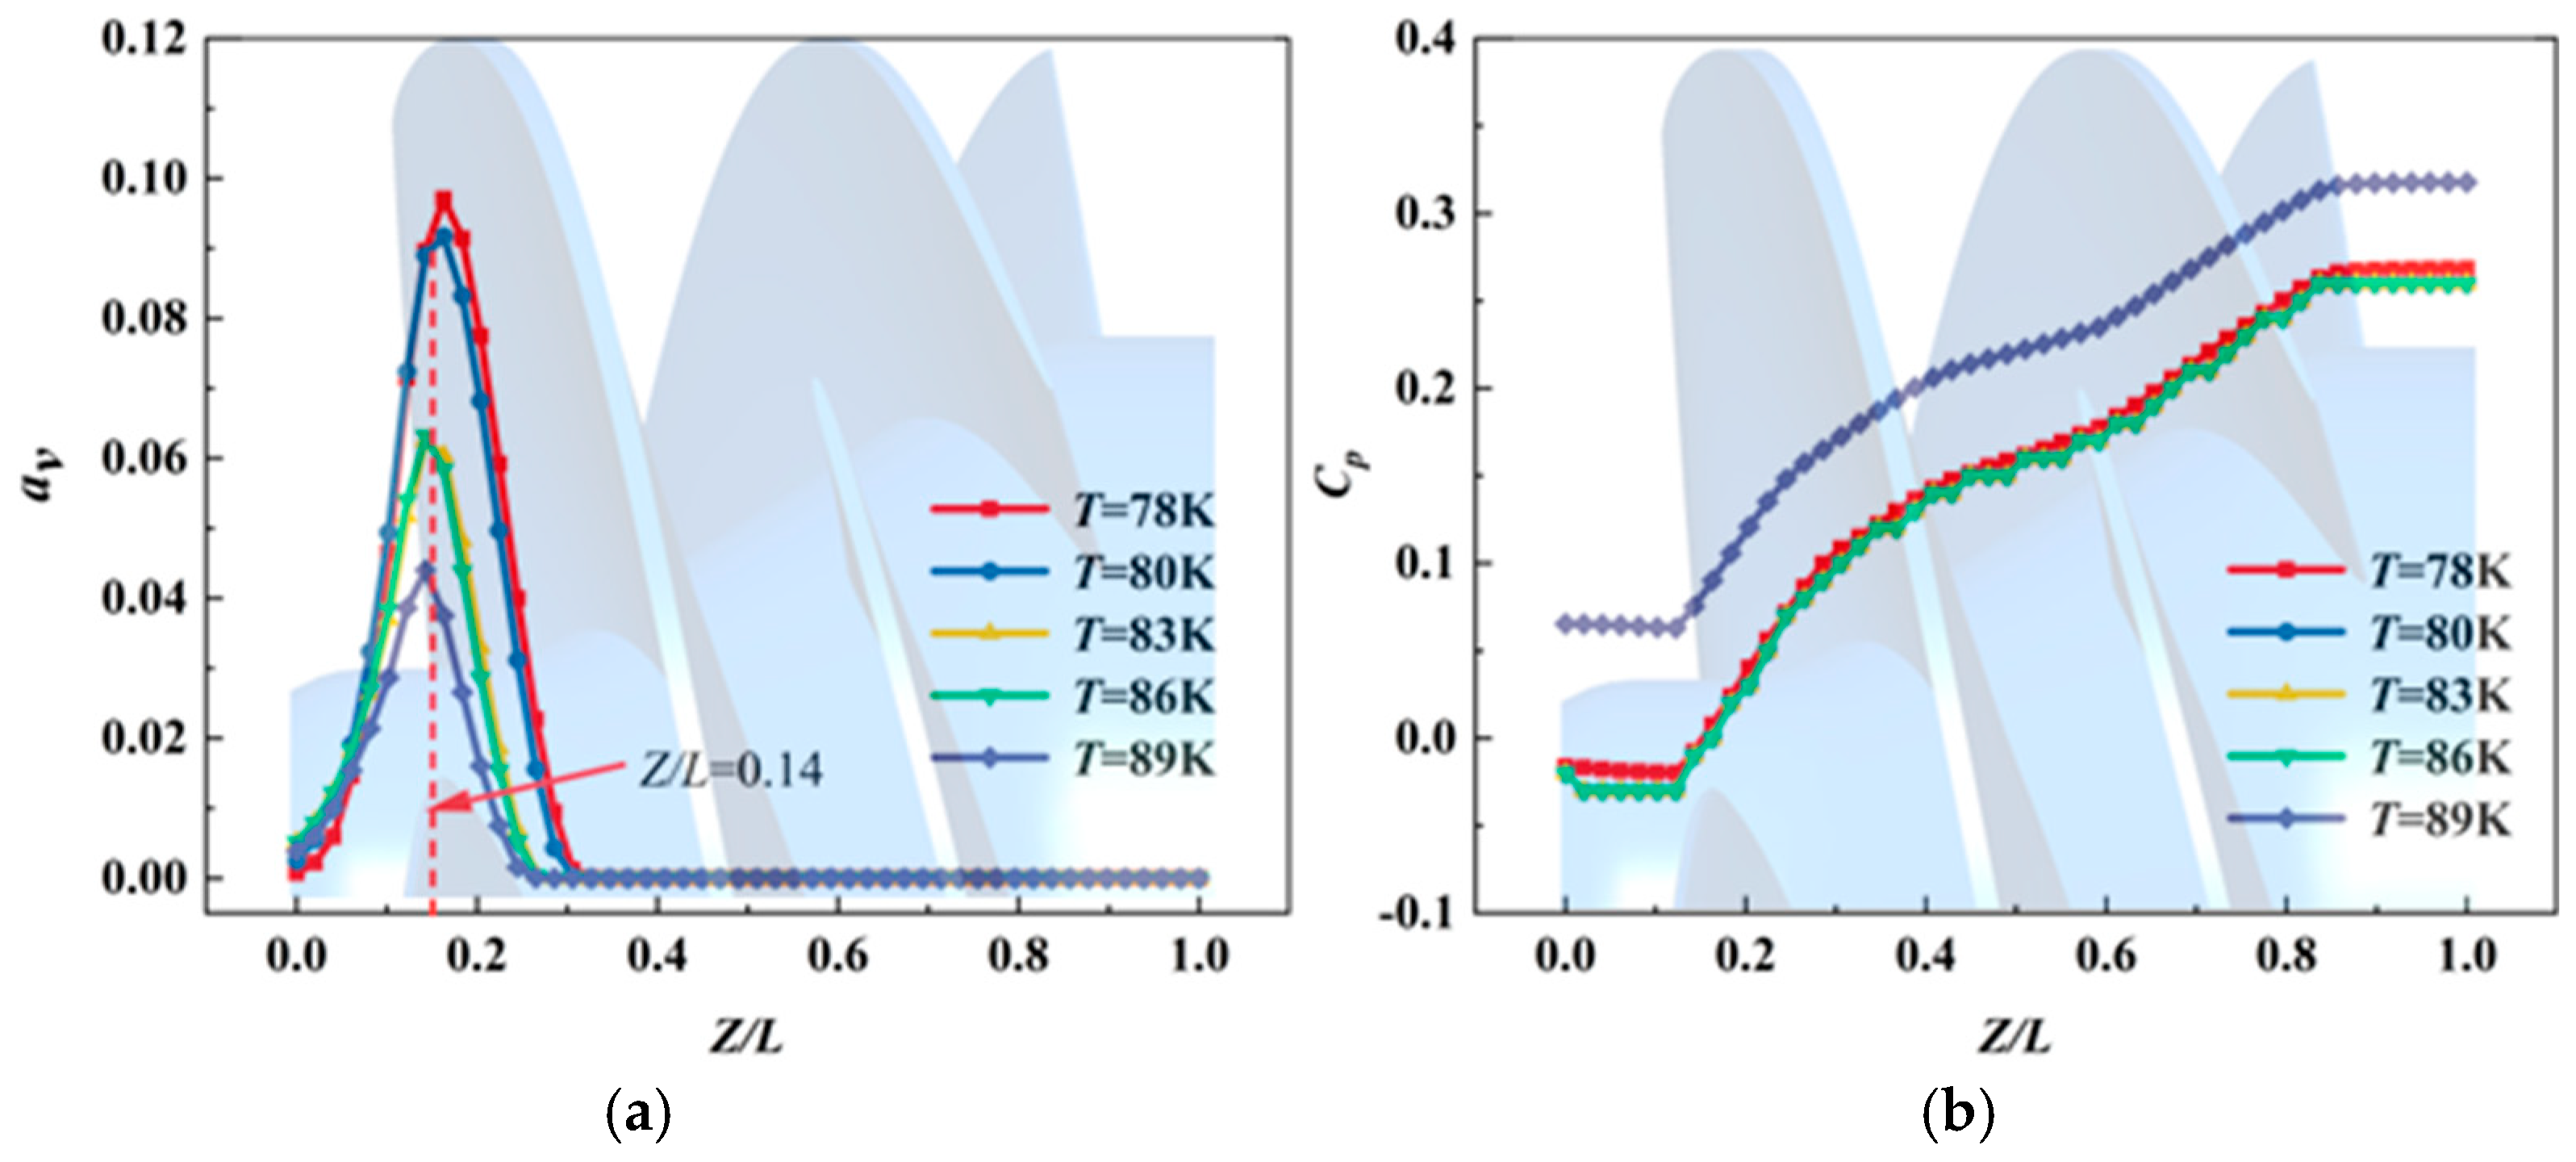
It can be seen from Figure 8a that at different temperatures, the volume fraction of vapor first increases and then decreases along the axial flow direction of the induction wheel. At different temperatures, the vapor volume fraction reaches its peak value when Z/L = 0.14, and tends to 0 when Z/L > 0.3, where Z is the axial coordinate and L is the total axial length of the inducer. This is because the liquid at the inlet blade of the induction wheel moves around the flow, resulting in a decrease in pressure and a larger medium cavitation. With the axial flow, the pressure increases, and the cavitation disappears with the axial flow. In this process, the temperature has little influence on the location of cavitation, but the thermodynamic effect has a great influence on the degree of cavitation. As shown in Figure 8a, cavitation occurs at basically the same location at different temperatures, and when the temperature increases from 78 k to 89 k, the volume fraction of the gas decreases by 54.6%, indicating that the thermodynamic effect of cavitation plays a major role in the medium studied in this study, and the heat absorbed during cavitation causes the temperature of the local medium to decrease. The saturated vapor pressure of the medium is reduced, so the temperature increase effectively inhibits the generation of cavitation.
As shown in Figure 8b, the pressure coefficients at different temperatures exhibit a consistent pattern, initially decreasing and then increasing along the axial position. When T ≤ 86 K, the pressure coefficients at various coaxial positions are nearly equal. However, as the temperature further rises to 89 K, Cp increases significantly. Referencing Figure 8a, it is evident that cavitation occurs at this temperature but is suppressed. Under these conditions, the gas volume fraction is minimized, resulting in a relatively high head and pressure coefficient for the inducer. This further demonstrates the influence of the thermodynamic effect on cavitation. The higher the temperature, the stronger the suppression of cavitation by the thermodynamic effect.

3.2. Cavitation Flow Characteristics in the Inducer at Different Temperature Conditions

From the above analysis, it can be seen that the thermodynamic effect has a great influence on the cryogenic cavitation of the inducer. To further study the influence of the thermodynamic effect on the cryogenic cavitation of the inducer, the numerical calculation is carried out by using the cavitation model without thermodynamic effects (Equations (7) and (8)) and the cavitation model with thermodynamic effects (Equations (9) and (10)). The axial velocity distribution with a gas volume fraction of 0.1 in the inducer and gas volume fraction distribution at different blade spans are obtained as shown in Figure 9 and Figure 10, respectively.
Figure 9a,b, respectively, show the iso-surface of a 0.1 gas volume fraction and the cross-sectional velocity streamlines distribution, without and with considering thermodynamic effects, when cavitation is relatively severe (T = 78 K, σ = 0.103). It can be seen that the cavity area of Figure 9a is significantly more than that of Figure 9b, which has a blocking effect on the flow passage. Compared with Figure 9a, the length of the cavity in Figure 9b is shortened and the thickness is increased. By comparison, it is found that the trajectory of the leakage vortex is no longer the boundary of the cavitation region after considering the thermodynamic effects, and the thermodynamic effects has an influence on the tip leakage vortex, which has better cavitation performance. It can be seen that the thermodynamic effects have a significant inhibitory effect on cavitation.
The distribution of the gas phase volume fraction at different blade spans is shown in Figure 10. Without considering thermodynamic effects, the cavities are distributed asymmetrically, severely impeding the flow in the passages. When considering thermodynamic effects, the thickness of the cavity increases, the length and volume fraction of the cavity decrease, and the cavity boundary becomes ambiguous. This phenomenon conforms to the physical properties of liquid nitrogen cavitation, which is in agreement with the numerical results of Utturkar et al. [29].
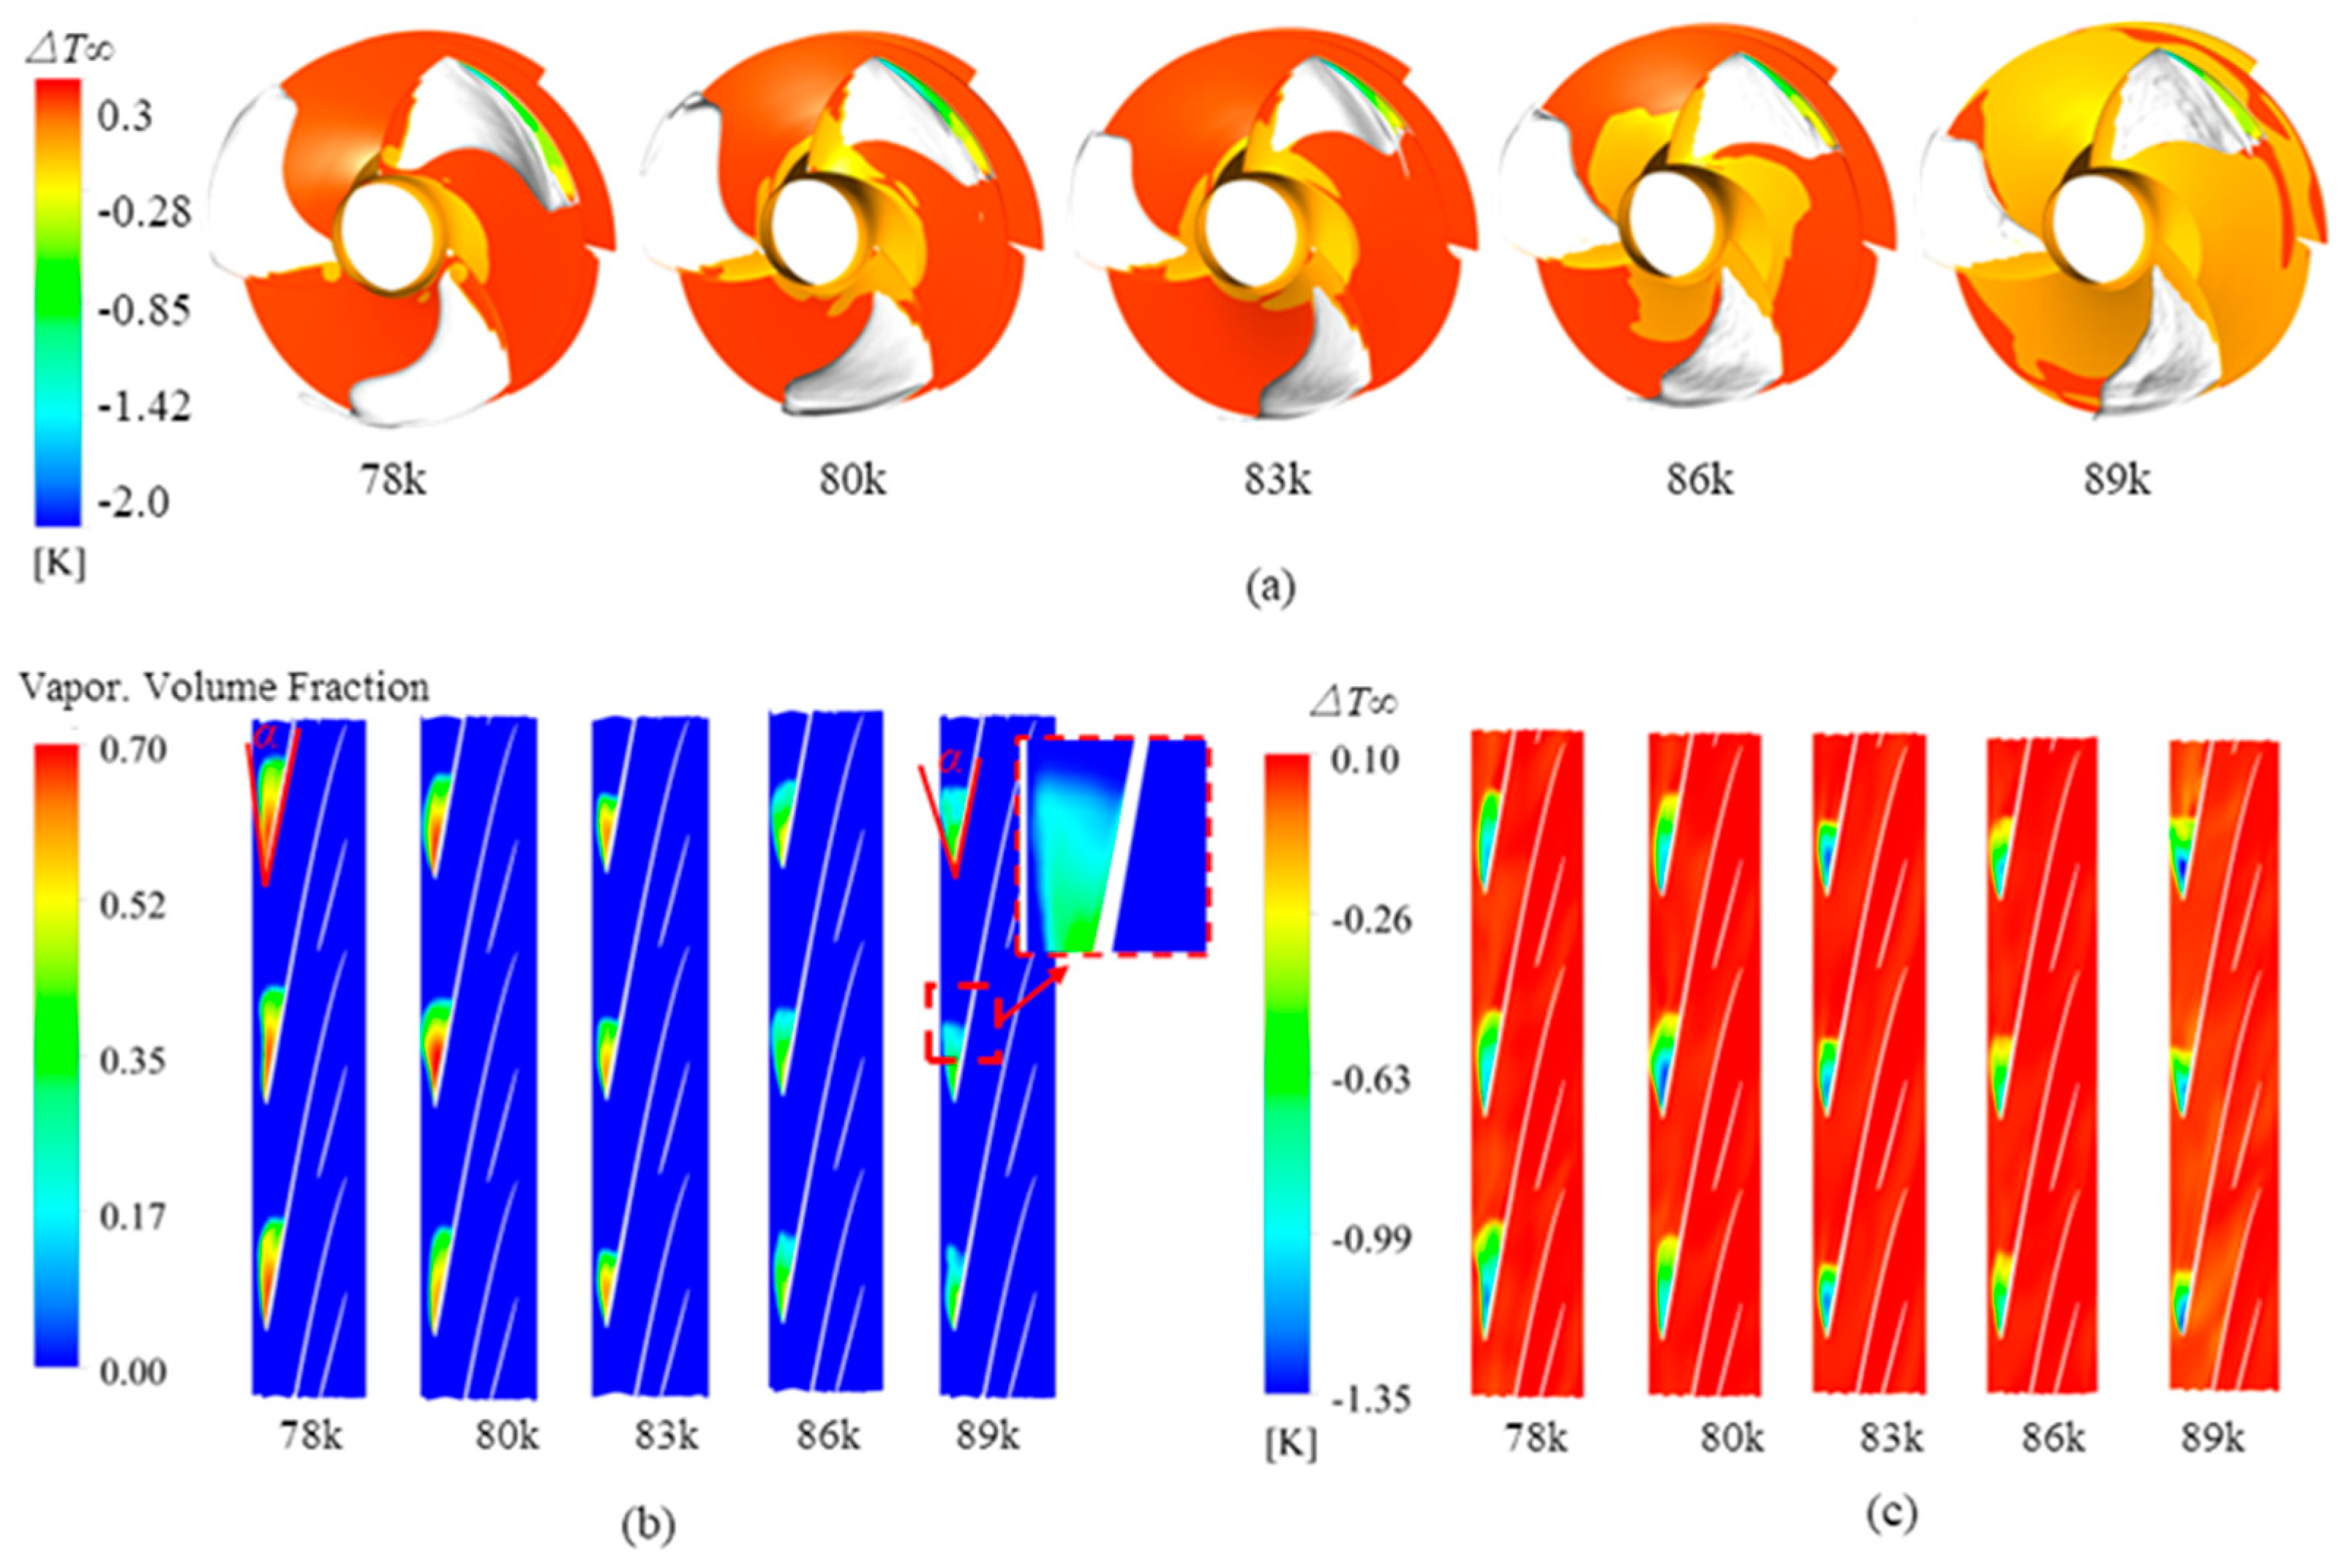
It can be seen from Figure 11 that under the joint action of tip leakage vortex cavitation and jet shear layer cavitation, the cavitation profile is triangular. With the increase in the temperature of the experimental medium, the morphology, structure and distribution of the cavitation are similar, but the length of the cavitation is shortened in the hub and flow direction. The following conclusions can be drawn from this phenomenon. (1) It is further confirmed that the thermodynamic effect of low temperature medium plays a leading role in the cavitation process. The temperature of the medium has a certain effect on the volume fraction distribution of the gas. In combination with Figure 11b, it can be observed that as the temperature of the medium increases, the length of the cavity decreases and the thickness increases due to the thermal effect, and the Angle α between the outer edge of the cavity and the blade increases. At the same time, it is found that the cavity boundary is more fuzzy after considering the thermodynamic effect, which is because the inside of the cavity is a mixture of nitrogen bubbles and liquid nitrogen. As the medium absorbs heat after gasification, the cavitation intensity is reduced, and the small bubble group at the vapor–liquid interface is easier to diffuse. (2) The variation rule of the temperature drop in the cavity of the induction wheel with the temperature of the medium was obtained. In combination with Figure 11b,c, it can be observed that since the generation of cavitation is accompanied by the decrease in temperature, the change in temperature drop in the cavity is positively correlated with the volume fraction of gas, and the temperature drop value in the core region of cavitation is up to 1.35 K, and the range of temperature changes increases with the increase in medium temperature.
In order to further study the changes in regional vortices during induced wheel cavitation, streamlines colored by the λ2 criterion at different temperatures in the induced wheel were studied, as shown in Figure 12.
The occurrence location and development law of tip leakage vortex can be obtained from Figure 12. It is observed that at the first section, vortices are mainly concentrated at the tip of the blade, and the vortex area is the smallest (see region A), which is the starting point of leakage vortex. With the flow of liquid in the induction wheel, the pressure difference between the pressure surface and the low-pressure surface gradually increases, and the vertical length of leakage vortex at the tip of the blade gradually increases, and extends along the blade towards the flow direction. At the same time, the relationship between tip leakage vortex and cavitation region can be observed. The tip cavitation area of the inducer wheel is mainly composed of tip leakage vorticity, and the cavity completely covers the tip leakage vorticity of the inducer wheel. As the temperature increases, the area of leakage vorticity gradually decreases, and the leakage vorticity is more serious at 78.00 K and 80.00 K, while the leakage vorticity range at 86.00 K and 89.00 K decreases significantly, mainly because during the cavitation process, the leakage vorticity of the inducer wheel decreases significantly. The thermodynamic effect of cavitation plays a dominant role. As the temperature rises, the cutoff saturated vapor pressure decreases, and the amount of bubbles generated in the cavitation process increases, while the process of medium gasification absorbs a lot of heat, reducing the local medium temperature and saturated vapor pressure, which inhibits the occurrence of cavitation.

4. Conclusions

In this paper, the modified cavitation model considering thermodynamic effects is used to carry out numerical calculations for cryogenic cavitation of the inducer under different temperature conditions (78 K, 80 K, 83 K, 86 K, and 89 K), and the influence of thermodynamic effects on the cryogenic cavitation of the inducer is investigated. The conclusions are as follows.
  • The spatio-temporal evolution of cryogenic cavitation in the inducer is clarified. Cavitation initially occurs at the outer edge of the long blade. Then, the cavities take on a triangular shape, and the cavitation area continues to grow, spreading along the direction of fluid flow. When cavitation reaches a certain level, the wake phenomenon is observed.
  • Cavities production and collapse are accompanied by energy changes that affect the work capacity of the blades. The incipient cavitation is of a low intensity and area, with a small effect on the performance of the inducer. When the inlet of the inducer begins to show obvious flake cavitation, the pump performance is affected, but can still work normally. As the cavitation region expands further, the vortex cavitation become intense, causing the pump to fail to work properly.
  • The relationship between thermodynamic effects and tip leakage vortex is revealed. The cavitation area of the inducer wheel is mainly composed of tip leakage vorticity, and the cavity completely covers the leakage vorticity of the inducer wheel. As the temperature decreases, the area of the leakage vorticity gradually increases. The leakage vorticity is more serious at 78.00 K and 80.00 K, which causes the attached vorticity that falls off from the tip leakage vorticity and moves towards the wheel hub.
  • Thermodynamic effects have less influence on the position at which cryogenic cavitation occurs in the inducer, but there is a significant inhibition of cavitation. Temperature has little influence on the position of cavitation under different temperature conditions. The increase in temperature enhances the thermodynamic effects, the boundaries of the cavities become more ambiguous and the tiny bubble groups at the vapor–liquid interface are more easily diffused, thus effectively suppressing cavitation.

Author Contributions

Conceptualization, X.G., F.L. and Z.Z.; methodology, X.G. and M.Y.; validation, X.G., F.L., Z.Z. and B.C.; investigation, X.G. and M.Y.; resources, X.G., M.Y. and F.L.; data curation, X.G. and Z.Z.; writing—original draft preparation, X.G.; writing—review and editing, X.G. and M.Y.; supervision, Z.Z. and B.C.; project administration, Z.Z. and B.C.; funding acquisition, X.G. and Z.Z. All authors have read and agreed to the published version of the manuscript.

Funding

The work was sponsored by the National Natural Science Foundation of China (No. 52376037), the Natural Science Foundation of Zhejiang Province (No. L2JWY22E060001), Key Program of National Natural Science Foundation of China of Zhejiang Joint Fund: U22A20209.

Data Availability Statement

The original contributions presented in the study are included in the article, further inquiries can be directed to the corresponding author.

Conflicts of Interest

The authors declare no conflict of interest.

References

  1. Lu, G.; Zuo, Z.; Sun, Y.; Liu, D.; Tsujimoto, Y.; Liu, S. Experimental evidence of cavitation influences on the positive slope on the pump performance curve of a low specific speed model pump-turbine. Renew. Energy 2017, 113, 1539–1550. [Google Scholar] [CrossRef]
  2. Zhang, M.; Huang, B.; Wu, Q.; Zhang, M.; Wang, G. The interaction between the transient cavitating flow and hydrodynamic performance around a pitching hydrofoil. Renew. Energy 2020, 161, 1276–1291. [Google Scholar] [CrossRef]
  3. Zhu, D.; Xiao, R.; Liu, W. Influence of leading-edge cavitation on impeller blade axial force in the pump mode of reversible pump-turbine. Renew. Energy 2021, 163, 939–949. [Google Scholar] [CrossRef]
  4. Cheng, X.; Li, Y.; Zhang, S. Effect of inlet sweepback angle on the cavitation performance of an inducer. Eng. Appl. Comp. Fluid 2019, 13, 713–723. [Google Scholar] [CrossRef]
  5. Morii, T.; Tanaka, Y.; Watanabe, S.; Ohashi, S.; Matsunaga, Y. Suction performance and cavitation instabilities of turbopumps with three different inducer designs. Int. J. Fluid Mach. Syst. 2019, 12, 128–135. [Google Scholar] [CrossRef]
  6. Kim, J.; Song, S.J. Visualization of rotating cavitation oscillation mechanism in a turbopump inducer. J. Fluid Eng.-Trans. ASME 2019, 141, 091103. [Google Scholar] [CrossRef]
  7. Zhai, L.; Li, Y.; Cui, B.; Guo, J.; Li, X.; Zhu, Z. Studies of cavitation characteristics of inducers with different blade numbers. AIP Adv. 2021, 11, 085216. [Google Scholar] [CrossRef]
  8. Karakas, E.S.; Watanabe, H.; Aureli, M.; Evrensel, C.A. Cavitation performance of constant and variable pitch helical inducers for centrifugal pumps: Effect of inducer tip clearance. J. Fluids Eng. 2020, 142, 021101. [Google Scholar] [CrossRef]
  9. Hashimoto, T.; Yoshida, M.; Watanabe, M.; Kamijo, K.; Tsujimoto, Y. Experimental study on rotating cavitation of rocket propellant pump inducers. J. Propul. Power 1997, 13, 488–494. [Google Scholar] [CrossRef]
  10. Franc, J.-P.; Rebattet, C.; Coulon, A. An experimental investigation of thermal effects in a cavitating inducer. J. Fluid Eng.-Trans. ASME 2004, 126, 716–723. [Google Scholar] [CrossRef]
  11. Kim, D.-J.; Sung, H.J.; Choi, C.-H.; Kim, J.-S. Cavitation instabilities of an inducer in a cryogenic pump. Acta Astronaut. 2017, 132, 19–24. [Google Scholar] [CrossRef]
  12. Ito, Y.; Tsunoda, A.; Kurishita, Y.; Kitano, S.; Nagasaki, T. Experimental visualization of cryogenic backflow vortex cavitation with thermodynamic effects. J. Propul. Power 2016, 32, 71–82. [Google Scholar] [CrossRef]
  13. Ito, Y. The world’s first test facility that enables the experimental visualization of cavitation on a rotating inducer in both cryogenic and ordinary fluids. J. Fluid Eng.-Trans. ASME 2021, 143, 121105. [Google Scholar] [CrossRef]
  14. Kikuta, K.; Yoshida, Y.; Watanabe, M.; Hashimoto, T.; Nagaura, K.; Ohira, K. Thermodynamic effect on cavitation performances and cavitation instabilities in an inducer. J. Fluid Eng.-Trans. ASME 2008, 130, 111302. [Google Scholar] [CrossRef]
  15. Yoshida, Y.; Nanri, H.; Kikuta, K.; Kazami, Y.; Iga, Y.; Ikohagi, T. Thermodynamic effect on subsynchronous rotating cavitation and surge mode oscillation in a space inducer. J. Fluid Eng.-Trans. ASME 2011, 133, 061301. [Google Scholar] [CrossRef]
  16. Fan, Y.; Chen, T.; Liang, W.; Wang, G.; Huang, B. Numerical and theoretical investigations of the cavitation performance and instability for the cryogenic inducer. Renew. Energy 2022, 184, 291–305. [Google Scholar] [CrossRef]
  17. Ehrlich, D.A.; Murdock, J.W. A dimensionless scaling parameter for thermal effects on cavitation in turbopump inducers. J. Fluid Eng.-Trans. ASME 2015, 137, 041103-1–041103-8. [Google Scholar] [CrossRef]
  18. Chen, Z.; Yang, S.; Li, X.; Li, Y.; Li, L. Investigation on leakage vortex cavitation and corresponding entropy characteristics in a liquid nitrogen inducer. Cryogenics 2023, 129, 103606. [Google Scholar] [CrossRef]
  19. Xiang, L.; Tan, Y.; Chen, H.; Xu, K. Numerical simulation of cryogenic cavitating flow in LRE oxygen turbopump inducer. Cryogenics 2021, 126, 103540. [Google Scholar] [CrossRef]
  20. Alavi, A.; Roohi, E. Large eddy simulations of cavitation around a pitching–plunging hydrofoil. Phys. Fluids 2023, 35, 125102. [Google Scholar] [CrossRef]
  21. Mousavi, S.M.; Roohi, E. On the effects of hybrid surface wettability on the structure of cavitating flow using implicit large eddy simulation. J. Taiwan Inst. Chem. Eng. 2023, 104828, 148. [Google Scholar] [CrossRef]
  22. Ji, B.; Luo, X.W.; Arndt, R.E.A.; Peng, X.; Wu, Y. Large eddy simulation and theoretical investigations of the transient cavitating vortical flow structure around a NACA66 hydrofoil. Int. J. Multiphas. Flow 2015, 68, 121–134. [Google Scholar] [CrossRef]
  23. Li, X.; Li, B.; Yu, B.; Ren, Y.; Chen, B. Calculation of cavitation evolution and associated turbulent kinetic energy transport around a NACA66 hydrofoil. J. Mech. Sci. Technol. 2019, 33, 1231–1241. [Google Scholar] [CrossRef]
  24. Shen, T.; Li, X.; Li, L.; Wang, Z.; Liu, Y. Evaluation of vorticity forces in thermos-sensitive cavitating flow considering the local compressibility. Int. Commun. Heat Mass Transf. 2021, 120, 105008. [Google Scholar] [CrossRef]
  25. Zhang, S.; Li, X.; Hu, B.; Liu, Y.; Zhu, Z. Numerical investigation of attached cavitating flow in thermo-sensitive fluid with special emphasis on thermal effect and shedding dynamics. Int. J. Hydrogen Energy 2018, 11, 224. [Google Scholar] [CrossRef]
  26. Li, X.; Shen, T.; Li, P.; Guo, X.; Zhu, Z. Extended compressible thermal cavitation model for the numerical simulation of cryogenic cavitating flow. Int. J. Hydrogen Energy 2020, 45, 10104–10118. [Google Scholar] [CrossRef]
  27. Zhang, S.F.; Li, X.J.; Zhu, Z.C. Numerical simulation of cryogenic cavitating flow by an extended transport-based cavitation model with thermal effects. Cryogenics 2018, 92, 30352. [Google Scholar] [CrossRef]
  28. Hord, J. Cavitation in Liquid Cryogens. 2: Hydrofoil; NASA: Washington, DC, USA, 1973.
  29. Utturkar, Y.; Wu, J.; Wang, G.; Shyy, W. Recent progress in modeling of cryogenic cavitation for liquid rocket propulsion. Prog. Aerosp. Sci. 2005, 41, 558–608. [Google Scholar] [CrossRef]
Figure 1. The structure diagram of the splitter-bladed inducer.
Energies 17 03627 g001
Figure 2. (a) The inducer model. (b) Grid.
Energies 17 03627 g002
Figure 3. Mesh independence analysis.
Energies 17 03627 g003
Figure 4. The geometry and mesh of airfoil. (a) Airfoil geometry. (b) Airfoil mesh.
Energies 17 03627 g004
Figure 5. The comparison of numerical results with experimental results. (a) Pressure distribution under condition A. (b) Temperature distribution under condition A. (c) Temperature distribution under condition B. (d) Temperature distribution under condition B.
Energies 17 03627 g005
Figure 6. Cavitation performance curves of the inducer at different temperature conditions.
Energies 17 03627 g006
Figure 7. Positions of the cavities at different cavitation numbers in steady-state simulation (78 K).
Energies 17 03627 g007
Figure 8. Distributions of the gas volume fraction and the pressure coefficient in the axial section of the inducer at different temperature conditions. (a) The gas volume fraction in the axial section. (b) The pressure coefficient in the axial section.
Energies 17 03627 g008
Figure 9. Iso-surface and cross-section velocity streamlines with a gas volume fraction of 0.1 (78 K, σ = 0.103).
Energies 17 03627 g009
Figure 10. The cavitation of the inducer under different blade spans (78 K, σ = 0.103).
Energies 17 03627 g010
Figure 11. The temperature variation and the distribution of cavity pattern in the inducer at different temperature conditions. (a) Distribution of iso-surfaces with a gas volume fraction of 0.1. (b) The distribution of the gas volume fraction at 0.9 span of blades. (c) The temperature distribution at 0.9 span of blades.
Energies 17 03627 g011
Figure 12. Streamlines of the cross-section in the inducer colored by the λ2 criterion.
Energies 17 03627 g012
Table 1. Main dimensions and working conditions of the Inducer.
ParametersValues
Imported hub diameter dh154 mm
Imported hub diameter dh2129.3 mm
Inducer diameter D1192.5 mm
Blade inlet angle βb1Long blade: 10.1°
Short blade: 23.1°
Blade outlet angle βb2Long blade: 23.1°
Short blade: 22.4°
Wrap angle φ217.8°
Tip clearance d11.1 mm
Number of blades zLong blade: 3
Short blade: 3
Table 2. The material properties of liquid nitrogen.
Operating ConditionsT = 78 KT = 80 KT = 83 KT = 86 KT = 89 K
Density (kg/m3)803.1482793.9471779.7973765.2261750.1647
Dynamic Viscosity (10−5 Pa·s)15.664314.511013.007411.724610.6178
Saturation Pressure (kPa)109.2552136.8718187.79884251.7359330.5505
Latent Heat of Vaporization (kJ/kg)198.3391195.6756191.4698186.9806182.1696
Specific Heat Capacity at Constant Pressure (kJ·kg−1·K−1)2.04472.05552.07512.09932.1292
Thermal Conductivity (W·m−1·K−1)0.14350.13950.13360.12770.1218
Table 3. The experimental conditions.
Operating ConditionsInlet Temperature T (K)Inlet Velocity V (m/s)Cavitation Number σGasification Latent Heat L (J/kg)
A83.0623.91.71.91 × 105
B77.923.91.71.98 × 105
Disclaimer/Publisher’s Note: The statements, opinions and data contained in all publications are solely those of the individual author(s) and contributor(s) and not of MDPI and/or the editor(s). MDPI and/or the editor(s) disclaim responsibility for any injury to people or property resulting from any ideas, methods, instructions or products referred to in the content.