Article

Energy Management of Green Port Multi-Energy Microgrid Based on Fuzzy Logic Control

Department of Electrical Automation, Shanghai Maritime University, Shanghai 201306, China
*
Author to whom correspondence should be addressed.
Energies 2024, 17(14), 3601; https://doi.org/10.3390/en17143601
Submission received: 21 June 2024 / Revised: 10 July 2024 / Accepted: 16 July 2024 / Published: 22 July 2024
(This article belongs to the Section A1: Smart Grids and Microgrids)

Abstract

:
The green port multi-energy microgrid, featuring renewable energy generation, hydrogen energy, and energy storage systems, is an important gateway to achieve the net-zero emission goal. But there are many forms of energy in green port multi-energy microgrid systems, the power fluctuates frequently, and the port loads with large fluctuations and fast changes. These factors can easily lead to the problem of the state of charge exceeding the limit of the energy storage system. To distribute the fluctuating power in the green port multi-energy microgrid system reasonably and maintain the state of charge (SOC) of the hybrid energy storage system in an moderate range, an energy management strategy (EMS) based on dual-stage fuzzy control with a low pass-filter algorithm is proposed in this paper. First, the mathematical model of a green port multi-energy microgrid system is established. Then, fuzzy rules are designed, and the dual-stage fuzzy controller is used to change the time constant of the low-pass filter (LPF) and modify the initial power distribution by an LPF algorithm. Finally, simulation models are built in Matlab 2016a/Simulink. The simulation results demonstrate that, compared with other algorithms under the control of the EMS proposed in this paper, the high-frequency component in the flywheel power is smaller, and the SOC of the supercapacitor is maintained in a reasonable range of 34–78%, which extends the lifespan of the flywheel and supercapacitor. Additionally, it has a faster automatic adjustment ability for the state of charge of the energy storage system, which is conducive to better maintaining the stable operation of green port multi-energy microgrid systems.

1. Introduction

Massive greenhouse gas emissions have brought about serious problems such as rising sea levels and extreme weather. The international community reached The Paris Agreement for the sustainable development of the planet in 2015. Countries have made commitments to reduce emissions and are devoted to limiting the whole world’s maximum temperature rise to 1.5 °C by the end of this century [1]. In 2016, more than 90% of international goods were traded by marine transport [2], and ports play an important role in marine transport, but generate a lot of greenhouse gasses from ships and handling equipment. The greenhouse gasses generated by the port industry account for approximately 3% of global greenhouse gasses [3]. For this reason, green ports have become a hot research direction at present. Many researchers believe that the realization of green ports mainly involves utilizing renewable energy for power generation [4], utilizing clean fuels (for example hydrogen energy) instead of fuel oil [5,6], and utilizing electric energy for transportation equipment [7,8]. The green port multi-energy microgrid is one of the best ways to apply the above measures to the port.
However, the power of renewable energy is uncertain [9,10]. Port load (mainly composed of the quay crane, yard crane, and a ship) is coupled with the logistics system [11,12], which has the characteristics of a high peak value, frequent fluctuation, and periodicity. Hydrogen energy is a fine clean fuel, but its production process has high requirements for power quality [13,14,15]. Hence, it is essential to use energy storage systems to absorb the fluctuating power of renewable energy generation systems and port load to maintain the steady work of green port multi-energy micro-grids. Naturally, how to distribute the fluctuating power reasonably and maintain the safe and settled operation of the energy storage system has become the key. The LPF algorithm is used to separate the power fluctuations in renewable energy generation systems into high-frequency fluctuating components and low-frequency fluctuating components in [16,17]. In Ref. [18], wind power signals are decomposed into high-frequency components and low-frequency components, which is based on the wavelet packet decomposition algorithm, and then dispensed to the hybrid energy storage system. Compared with LPF algorithms, the wavelet packet decomposition algorithm has a better local decomposition ability for signals [19], but the wavelet packet decomposition algorithm needs to change multiple parameters and its control is complicated in the complex application scenario. In the port microgrid, the author considered the SOC of the battery and proposed a rule-based EMS to make sure that the SOC of battery is maintained in a limited extent in [20,21]. Fuzzy control theory is widely used in energy management strategies of microgrids due to its good robustness and flexibility. The author of Ref. [22] uses a fuzzy controller to change the power of fuel cells in electric vehicle power supply systems to improve their lifespan and efficiency. An energy management strategy based on fuzzy control theory is proposed to maintain the safe and steady operation of microgrids in Ref. [23]. Ref. [24] uses a fuzzy logic controller to change the input power of renewable energy systems to cope with different atmospheric conditions and prolong the life of a battery, but this can lead to the waste of renewable energy. Ref. [25] uses a fuzzy controller to maintain the SOC balance of supercapacitors in hybrid energy storage systems of electric vehicles, but it does not consider the SOC of batteries in hybrid energy storage systems. Ref. [26] aims to address the issues of voltage instability and energy loss in hybrid energy storage systems based on fuzzy control theory, but it does not take into account the efficiency and lifespan of energy storage components. In Ref. [27], the output power of an energy storage system was regulated after contemplating the wind power fluctuation and the SOC of an energy storage system based on fuzzy control. The SOC of the battery was controlled, which extends the lifespan of the battery. The author of Ref. [28] proposed to use the power-modifying factor of the fuzzy controller to address the issue of the SOC exceeding limits in energy storage systems, but the power-modifying factor is only decided by the SOC and SOC variation of the energy storage system in the previous time window, which may cause additional high-frequency power fluctuations.
This research examines an EMS of a green port multi-energy microgrid, which is an AC/DC microgrid, and mainly composed of a renewable energy generation system (including a photovoltaic and wind power generation system), hybrid energy storage system, and port load. The lifespan and efficiency of the hybrid energy storage system are affected by the great fluctuating power of the system. To reasonably distribute the fluctuating power of the system and ensure the safe operation of the hybrid energy storage system, an EMS based on two-stage fuzzy control is proposed. The simulation outcome indicates that the fluctuation power of the system is reasonably allocated, and compared with the wavelet packet decomposition algorithm and single-stage fuzzy control algorithm, the EMS proposed in this paper is more reasonable for the control of the SOC of supercapacitors, which makes it have a sufficient charge-and-discharge response ability, and the rate of variance of flywheel power is also controlled below the limit value. Compared with rule-based energy management algorithms and single-stage fuzzy control algorithms, it has a faster SOC automatic adjustment ability, and guarantees the steady and reliable operation of green port multi-energy microgrid systems. This paper is organized as follows: Section 2 explains the aim and contribution of this paper. Section 3 explains the structure of the green port multi-energy microgrid and its mathematical model. Section 4 introduces details of the proposed EMS. Section 5 presents the simulation outcomes of the EMS. Section 6 presents the conclusion of the paper.

2. Aim and Main Contribution

In the green port multi-energy microgrid system, the output power of renewable energy generation systems is uncertain, and the port load has the characteristics of a high peak value, frequent fluctuations, and strong periodicity. These fluctuations of power can easily lead to the problem of the charge of state exceeding the limit of the energy storage system, and affect the efficiency and lifespan of the hybrid energy storage system. Therefore, it is necessary to allocate the fluctuating power of the system reasonably and to control the SOC of the energy storage system. Refs. [16,17] propose using a fixed time constant LPF to decompose the fluctuating power of renewable energy generation systems, but it cannot cope with changing working scenarios and cannot fully leverage the advantages of hybrid energy storage systems. Ref. [20] proposes a rule-based energy management strategy. Although it can maintain the SOC of the energy storage system within a safe range, it may control the system to exit the operation, thereby reducing system stability. Ref. [28] proposes using a fuzzy controller output power adjustment coefficient to solve the problem of the SOC exceeding the limit in energy storage systems based on the SOC and SOC variables of the energy storage system. However, it may bring additional high-frequency power fluctuations due to the inaccurate power adjustment coefficient. The work of Ref. [29] proposes an energy management strategy based on a Type-2 fuzzy controller to solve the problems of an unstable power grid and the increased operating costs of hybrid microgrid energy systems, which are due to the inconsistent charging of electric vehicles and fluctuations in renewable energy output. However, the aspect it lacks consideration of is that the battery is unable to systematically cope with high-frequency fluctuations within the system. Ref. [30] proposes an energy management strategy based on double-layer fuzzy logic control to reduce the life loss of a high-speed railway hybrid energy storage system, but it does not take into account the frequency characteristics of the power absorbed by different energy storage devices. To address these issues, an EMS based on two-stage fuzzy control is put forward, and its main contributions include the following:
  • Compared to fixed time constant LPF algorithms and wavelet packet decomposition algorithms, the energy management algorithm proposed in this paper changes the time constant of the LPF based on the alteration of power, which reasonably allocates the fluctuating power of the system and improves the operational efficiency of the hybrid energy storage system. When the SOC of the supercapacitor is large, if the supercapacitor is charging, reducing the power of the supercapacitor and adjusting the power of the flywheel is required. If the supercapacitor is discharging, it is not required to adjust the power of the supercapacitor.
  • Compared to single-stage fuzzy control and rule-based energy management algorithms, the EMS proposed in this paper adjusts the power instruction of the energy storage system based on the power of the energy storage system, SOC of the energy storage system, and the time constant of LPF, to control the SOC of the energy storage system within a reasonable range and improve the automatic adjustment speed of the SOC of the energy storage system. This is beneficial for extending the lifespan of energy storage systems and maintaining the security and steady working of green port multi-energy microgrid systems.

3. Green Port Multi-Energy Microgrid Modeling

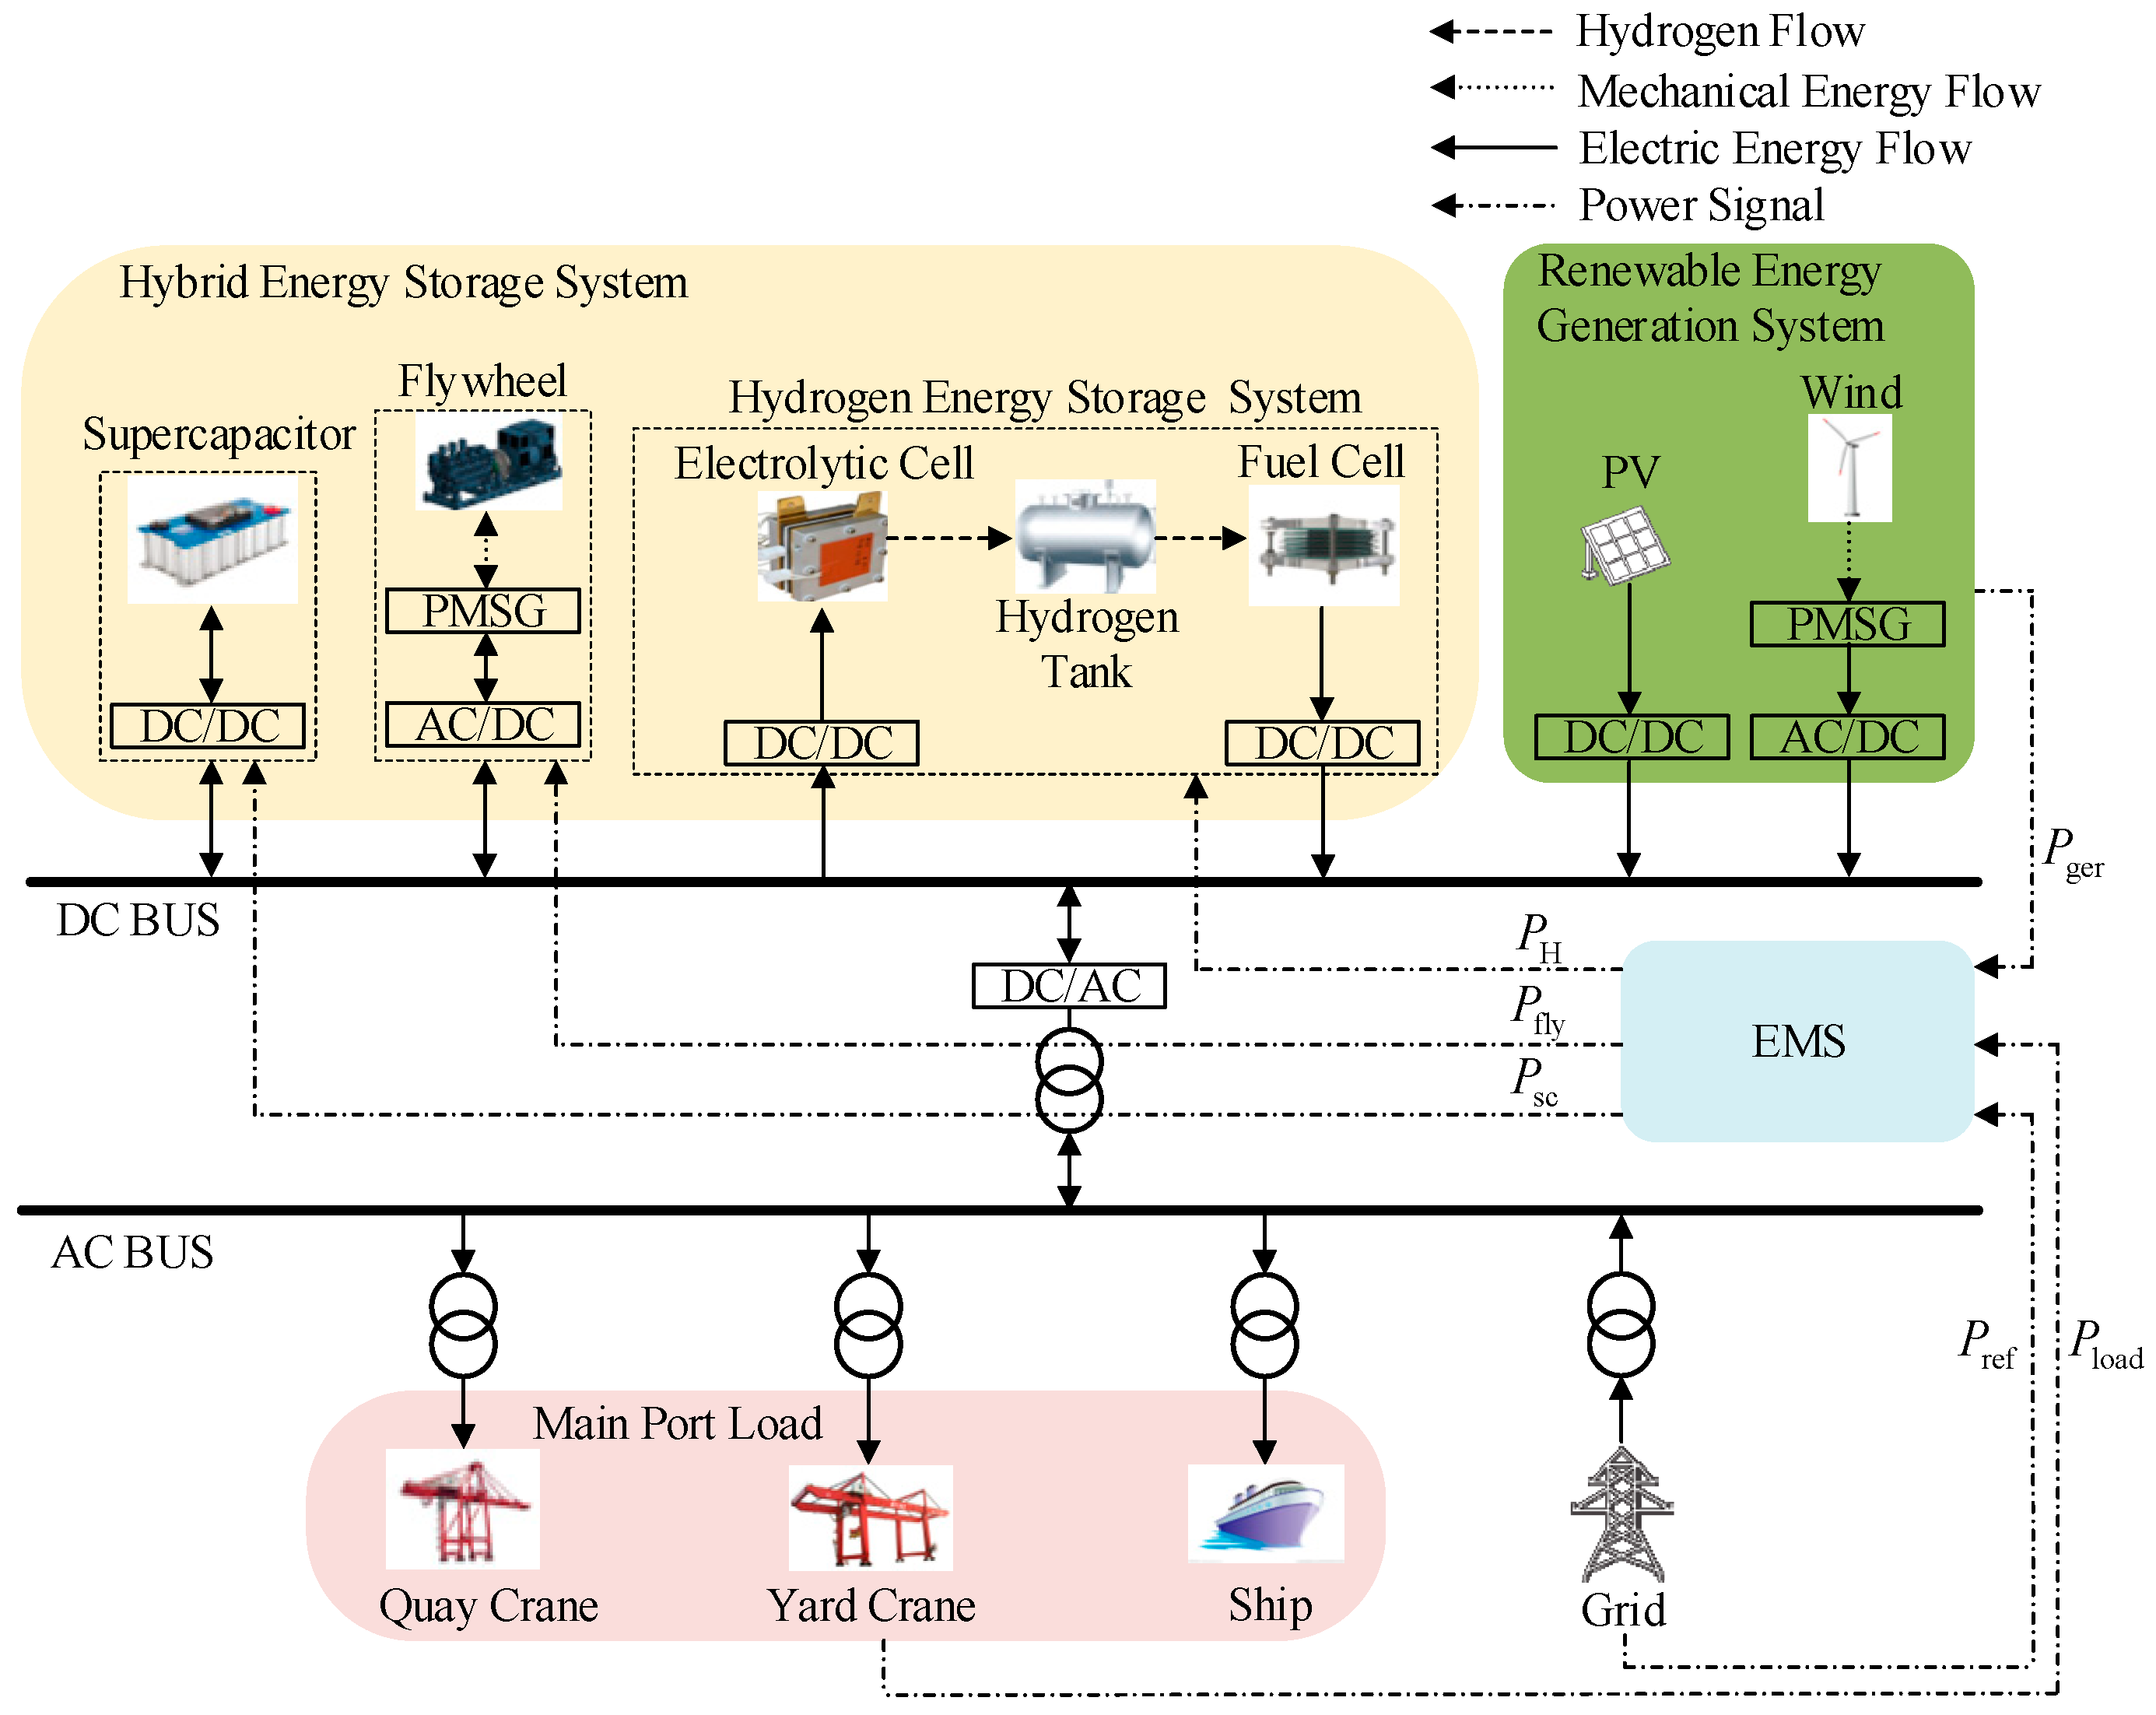
A typical green port multi-energy microgrid system and the power signal of the EMS is depicted in Figure 1.
Obviously, the green port multi-energy microgrid system is mainly composed of the renewable energy generation system, hybrid energy storage system, and port load. The renewable energy generation system consists of a photovoltaic and wind power generation system. The hybrid energy storage system consists of a supercapacitor, flywheel, and hydrogen energy storage system (composed of an electrolytic cell, hydrogen tank, and fuel cell). The main port load consists of a quay crane, yard crane, and a ship. The renewable energy generation system and hybrid energy storage system are connected with the DC bus. The port load and grid is joined to the AC bus. The DC bus and AC bus are connected through AC/DC converters and transformers. The EMS obtains the output power of the renewable energy generation system ( P ger ), the port load power ( P load ), and the reference power instructions given by the grid control center ( P ref ), and then the EMS will output the power signal of the supercapacitor ( P sc ), flywheel ( P fly ), and hydrogen energy storage system ( P H ). P H can be separated into the power signal of electrolytic cell ( P elec ) and the power signal of the fuel cell ( P fuel ) by the sign function. All power signals satisfy the following formula:
P load P ger P ref = P H + P sc + P fly
P H = P elec + P fuel

3.1. Modeling of Renewable Energy Generation System

There are several PV cell models available. Figure 2 [9,22] shows a classic equivalent electrical circuit of PV cells.
The current equation of PV cells [23] can be expressed as follows:
I d = I ph I 0 ( exp V pv + I R sr 1 ) V pv + I R sr R sh
V T = N m k T q
where V T is the thermal voltage; N is the number of PV cells connected in series; m is the diode constant; q is the charge of the electron; k is the Boltzmann constant; T is the temperature of the p–n junction; I ph is the current of PV; and I 0 represents the reverse saturation currents of the diode. Table 1 shows the parameter of the photovoltaic power generation system.
The energy captured by the wind turbine [10] is calculated by
P wind = 1 2 ρ π R 2 V w 3 C p ( β , λ )
where ρ is the density of air; C p is the coefficient of the utilization of wind energy; λ is the tip speed ratio; β is the pitch angle of the wind turbine; R is the radius of the wind turbine blade; and V w is wind speed. This paper uses the permanent magnet synchronous generator (PMSG), which has the merit of a simple structure and high efficiency. Table 2 shows the parameter of the wind power generation system. In practical work, the output power of wind turbines does not increase continuously with the increase in wind speed. Figure 3 shows the power–wind speed diagram of the generator.
The solar irradiance and wind speed data (shown in Figure 4) in this paper are sourced from observation data from meteorological stations on the same day and in the same region of port ship data statistics. These data are the average values recorded by meteorological stations every 30 min. Then, the data at all times are obtained through linear interpolation.
The System Advisor Model (SAM) is used in this paper to simulate photovoltaic and wind power systems. In addition to the parameters mentioned in Table 1 and Table 2, the system parameters set in the software are shown in Table 3.

3.2. Modeling of Hybrid Energy Storage System

3.2.1. Supercapacitors

Supercapacitors have low energy density [17] and can release or absorb electric energy with great power for a few seconds to tens of seconds, and are a power-type energy storage unit. The formula for calculating the SOC sc and electric energy of the supercapacitor [17] is as follows:
S O C sc = V sc V R 2
E sc = 1 2 C sc V sc 2
where V sc is the voltage of the supercapacitor, C sc is the capacitance, and V R is the rated voltage of the supercapacitor. Using supercapacitors to construct energy storage systems requires stacking cells, where N s cells are connected in series and N p cells are parallelly connected. Equations (8) and (9) fix on the resistance and capacity of the supercapacitor energy storage system.
C sc = N p N s × C cell
R sc = N s N p × R cell
This article uses the supercapacitor module LSUM-048R6C-0166F-EA-DC00 as a reference, and its parameters are given in Table 4. The parameters of the supercapacitor energy storage system are shown in Table 5.

3.2.2. Flywheel

The flywheel stores electrical energy as rotating mechanical energy. The flywheel has the advantages of a long life, deep discharge and high energy conversion efficiency, and belongs to the power-type energy storage unit. The formula for calculating the SOC fly and electrical energy of the flywheel [31] is as follows:
S O C fly = ω fly ω R 2
E fly = 1 2 J f ω fly 2
where ω fly is the mechanical angular velocity of the flywheel, ω R is the rated mechanical angular velocity of the flywheel, and J f is the moment of inertia of the flywheel. The motor of the flywheel still utilizes the PMSG, and the parameters of the flywheel energy storage system are shown in Table 6.

3.2.3. Hydrogen Energy Storage System

Hydrogen has the characteristics of high energy density, high storage and transportation efficiency [32], and it is an excellent green energy. A hydrogen energy storage system can achieve large-scale, long-term storage of energy. Hence, it is the power-type energy storage unit.
  • Alkaline Water Electrolysis
There are several techniques for producing hydrogen. One commercially mature hydrogen production technology is alkaline water electrolysis (AWE). Equation (12) [32] shows the voltage equation of the electrolytic cell.
U elec = U rev + r 1 + r 2 T elec A elec I elec + s log 10 b 1 + b 2 / T elec + b 3 / T elec 2 A elec I elec + 1
where U elec is the electrolyzer stack voltage; U rev is the reversible voltage of the electrolytic cell; r 1 and r 2 are the ohmic resistance parameters of the AWE; T elec is the electrolyzer temperature; A elec is the electrolyzer surface area; I elec is the current of the electrolyzer; and s, b 1 , b 2 , and b 3 are the electrode overvoltage coefficients. Table 7 [32] shows the parameter values of an electrolytic cell. To reduce the complexity of the system model and improve simulation speed, this paper sets the temperature of the electrolytic cell as a constant, but this has little impact on the working process of the energy management strategy.
2.
Proton Exchange Membrane Fuel Cell (PEMFC)
The PEMFC is widely applied because of its simple structure, short start-up time and good dynamic response characteristics. The voltage inside of the fuel cell [33] can be described as follows:
V fc = N s × ( E nernst V act V conc V ohm )
where V fc is the output voltage; E nernst is the reversible fuel cell voltage; V act is the voltage drop due to activation losses; V conc is the voltage drop caused by concentrated voltage loss; V ohm is the voltage drop caused by ohmic losses; and N s is the number of cells in stack. More detailed calculation formulas and values of parameters are given in [33].
3.
Hydrogen Tank
The mathematical model of the hydrogen tank is related to thermodynamics. The inner pressure of a hydrogen tank is calculated in Equations (14) and (15) [32,34] based on the gas-state equation, and the state of hydrogen (SOH) is determined by Equation (16) [34].
P sto , t = n H , t G T sto V sto
n H , t = n H , t 0 + t 0 t η elec I elec 2 F d t t 0 t η fc I fc 2 F d t
S O H = P sto , t P sto , max
where P sto , t is the pressure of the tank at time t; n H , t is the quantity of hydrogen inside the gas tank at time t; G is the gas constant; T sto is the gas temperature; V sto is the volume of the gas tank; n H , t 0 is the value of the quantity of hydrogen at time t 0 ; η elec is the efficiency of the electrolytic cell; F is Faraday’s constant (96,500 C/mol); η fc is the efficiency of fuel cells; I f c is the current of fuel cells; P sto , max is the maximum pressure of the tank. Table 8 shows the parameter values of the hydrogen tank. To improve simulation speed, this paper sets the gas temperature of the hydrogen storage tank as a constant, which may cause changes in the capacity of the hydrogen storage tank in practical work. However, it does not affect the energy management strategy’s control of the SOC in medium- and high-frequency energy storage systems.

3.3. Modeling of Quantification of Logistics Transportation Energy at Port

The port multi-energy microgrid system is composed of a logistics system and an energy system [11]. In a great electrified port, the logistics system and the energy system are closely coupled, which means that the port load is related to the logistics operation. To make the port load have the characteristics of the logistics system, it is necessary to establish the modeling of the quantification of the logistics transportation energy. Equation (17) [11,12] determines the status of the variable in the port of ship j.
D j ( t ) = 0 , t [ 0 , t 1 ] 1 , t [ t 1 , t leave ] 0 , t [ t leave , T ]
where t 1 is the arrival time of ship j at the port; t leave is the departure time of ship j from the port; and T is the period of logistical dispatch. When the ship reaches the port, the ship is connected to shore power, and the quay crane and yard crane begin to work. Obviously, the variable can represent the logistics operation, and can be multiplied by the power of the ship, quay crane, and yard crane to obtain the port load.
The power of the ship is expressed by D j ( t ) as follows:
P ship ( t ) = P ship _ rated D j ( t )
where P s h ip _ rated is the rated shore power of the ship.
The power of the quay crane and yard crane is expressed by D j ( t ) as follows:
P crane ( t ) = P crane _ cycle D j ( t )
where P crane _ cycle is a craning cycle power of the quay crane or yard crane. A craning cycle (as shown in Figure 5 [35]) is composed of: (1) lifting with load; (2) trolley transmitting with load; (3) dropping with load; (4) lifting without load; (5) trolley transmitting without load; (6) dropping without load.
The power curve of a craning cycle of a quay crane (parameters are shown in Table 9 [35]) is shown in Figure 6.
The total amount of running cranes cannot exceed the total amount of port cranes ( U max ) at all times, as follows:
j = 1 n D j ( t ) U j U max
The main port load can be calculated by the following equation:
P load = j P ship _ rated j D j ( t ) + j P crane _ cycle j D j ( t ) U j
In addition to ships, quay cranes, and yard cranes, port loads also include refrigerated containers and lighting electricity, but they belong to stable loads and do not affect the research on fluctuating loads in this paper. This paper surveys the ship data (Table 10 and Figure 7) of the Shanghai Hudong container terminal in one day, and combines this with the data of the ship shore power (Table 11 [36]) and Equation (21) to obtain the power curve of the port (Figure 8). It is obvious that the port load has large fluctuations and changes fast.

4. Energy Management Strategy Based on Fuzzy Logic Control

The structure of a green port multi-energy microgrid system is complex, and the output power of a renewable energy generation system and the port load are stochastic, which makes the control of energy resources more difficult. Fuzzy control is a type of nonlinear control. It has good robustness and the exact mathematical model for the controlled object is not needed, and can adapt to complex and uncertain green port multi-energy microgrid systems. In addition, fuzzy control is easy to implement and has great practical value.
There is large power fluctuation in green port multi-energy microgrid systems, which easily leads to the problems of over-charge or over-discharge, low efficiency, and the reduced lifespan of the energy storage system. To solve these problems, an EMS based on dual-stage fuzzy control with a low-pass filter (DSFCLPF) is proposed in this paper. Figure 9 shows the internal structure of the DSFCLPF-EMS.
The hybrid energy storage power ( P Hess ) is degraded into three parts: low-frequency power, medium-frequency power, and high-frequency power by dual LPF. The low-frequency part is allocated to the hydrogen energy storage system, the mid-frequency part is distributed to the flywheel, and the high-frequency part is distributed to the supercapacitor.
The function of the front-stage fuzzy controller (FSFC) is to adjust the time constant of the LPF based on the change in power, which can reasonably distribute fluctuating power and improve the efficiency of the hybrid energy storage system. The principle of FSFC is increasing the time constant of the LPF when the fluctuation of power is large, and decreasing the time constant of the LPF when it becomes smooth. Therefore, the FSFC inputs the change in the power of the supercapacitor and flywheel in Δ t ( Δ P sc _ fly ) and outputs the time constant (T(t)) of the second LPF. Negative big (NB), negative middle (NM), negative small (NS), zero (Z), positive small (PS), positive middle (PM), and positive big (PB) are selected as fuzzy sets to describe the Δ P sc _ fly . The range of Δ P sc _ fly is obtained by dividing its peak value by the quantization factor. The quantification factor is 106 in this paper, and the range of Δ P sc _ fly is [−0.4, 0.4].
Through fast Fourier transform (FFT) analysis of the load power of the port, the result shows that the high-frequency fluctuating power frequency of the port load is generally in the range of 0.01 Hz–1 Hz. The relationship between the time constant and the signal frequency [17] is shown as follows:
T = 1 2 π f
The upper limit of T is set to 20 in this paper, which means that the filter can pass fluctuating power with a frequency less than 0.008 Hz. In order for T to represent the direction of power change, T is signed and it will take an absolute value before being passed to the LPF. Seven fuzzy sets (negative big (NB), negative middle (NM), negative small (NS), zero (Z), positive small (PS), positive middle (PM), and positive big (PB)) are selected to cover the interval [−20, 20]. The membership function of FSFC comprises triangular and trapezoidal membership functions. The membership and control rule of the FSFC are shown in Figure 10 and Table 12, respectively. The value of Δ t is 0.12 s.
The primary distribution of power controls the power instruction of the energy storage system based on the frequency characteristics of the absorbed power of each energy storage system, and improves the efficiency of the hybrid energy storage system. However, it does not consider the problem of over-charge and over-discharge during the actual working of the hybrid energy storage system. For power-type energy storage units, this problem is more likely to occur. Hence, to impede the over-charge and over-discharge of the supercapacitor and flywheel, it is necessary to adjust the result of the primary distribution of power.
For the secondary power adjustment of the supercapacitor, the principles are as follows:
  • When the SOC of the supercapacitor is moderate, the supercapacitor operates according to the primary distribution of power.
  • When the SOC of the supercapacitor is large, if the supercapacitor is charging, it is necessary to reduce the power of the supercapacitor and adjust the power of the flywheel. If the supercapacitor is discharging, it is not necessary to adjust the power of the supercapacitor.
  • When the SOC of the supercapacitor is small, if the supercapacitor is discharging, it is necessary to increase the power of the supercapacitor and adjust the power of the flywheel. If the supercapacitor is charging, it is not necessary to adjust the power of supercapacitor.
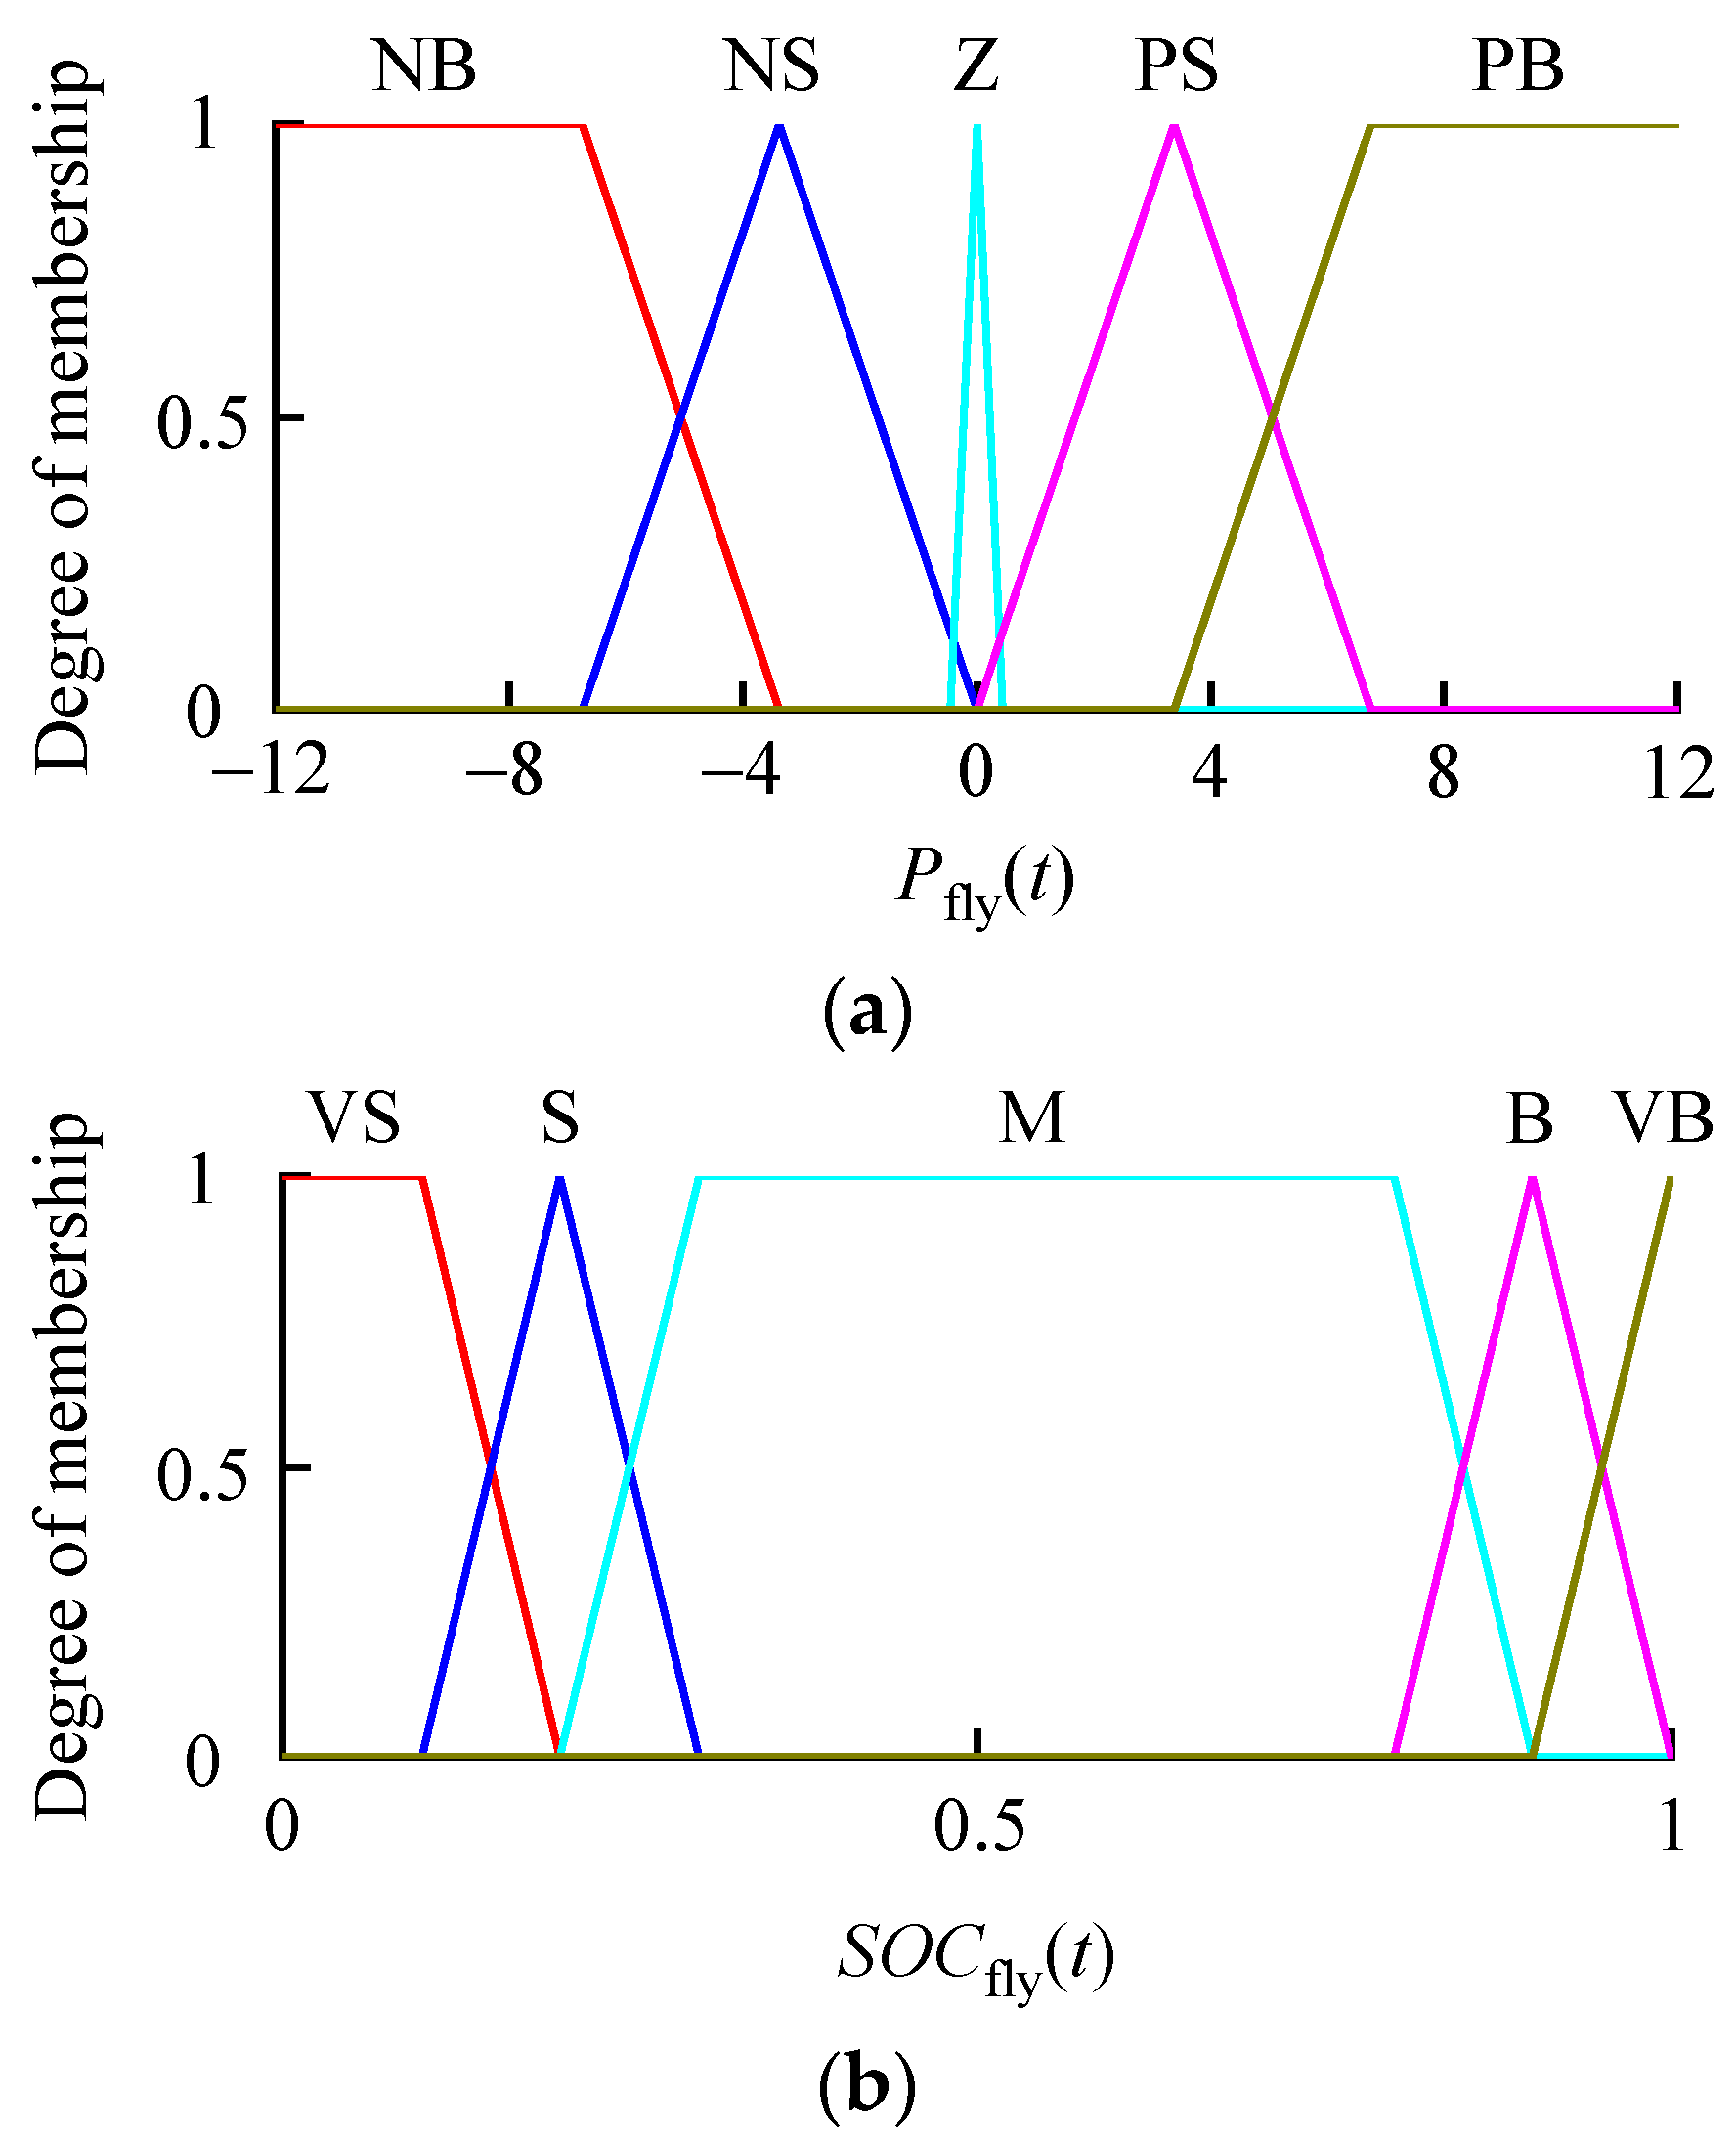
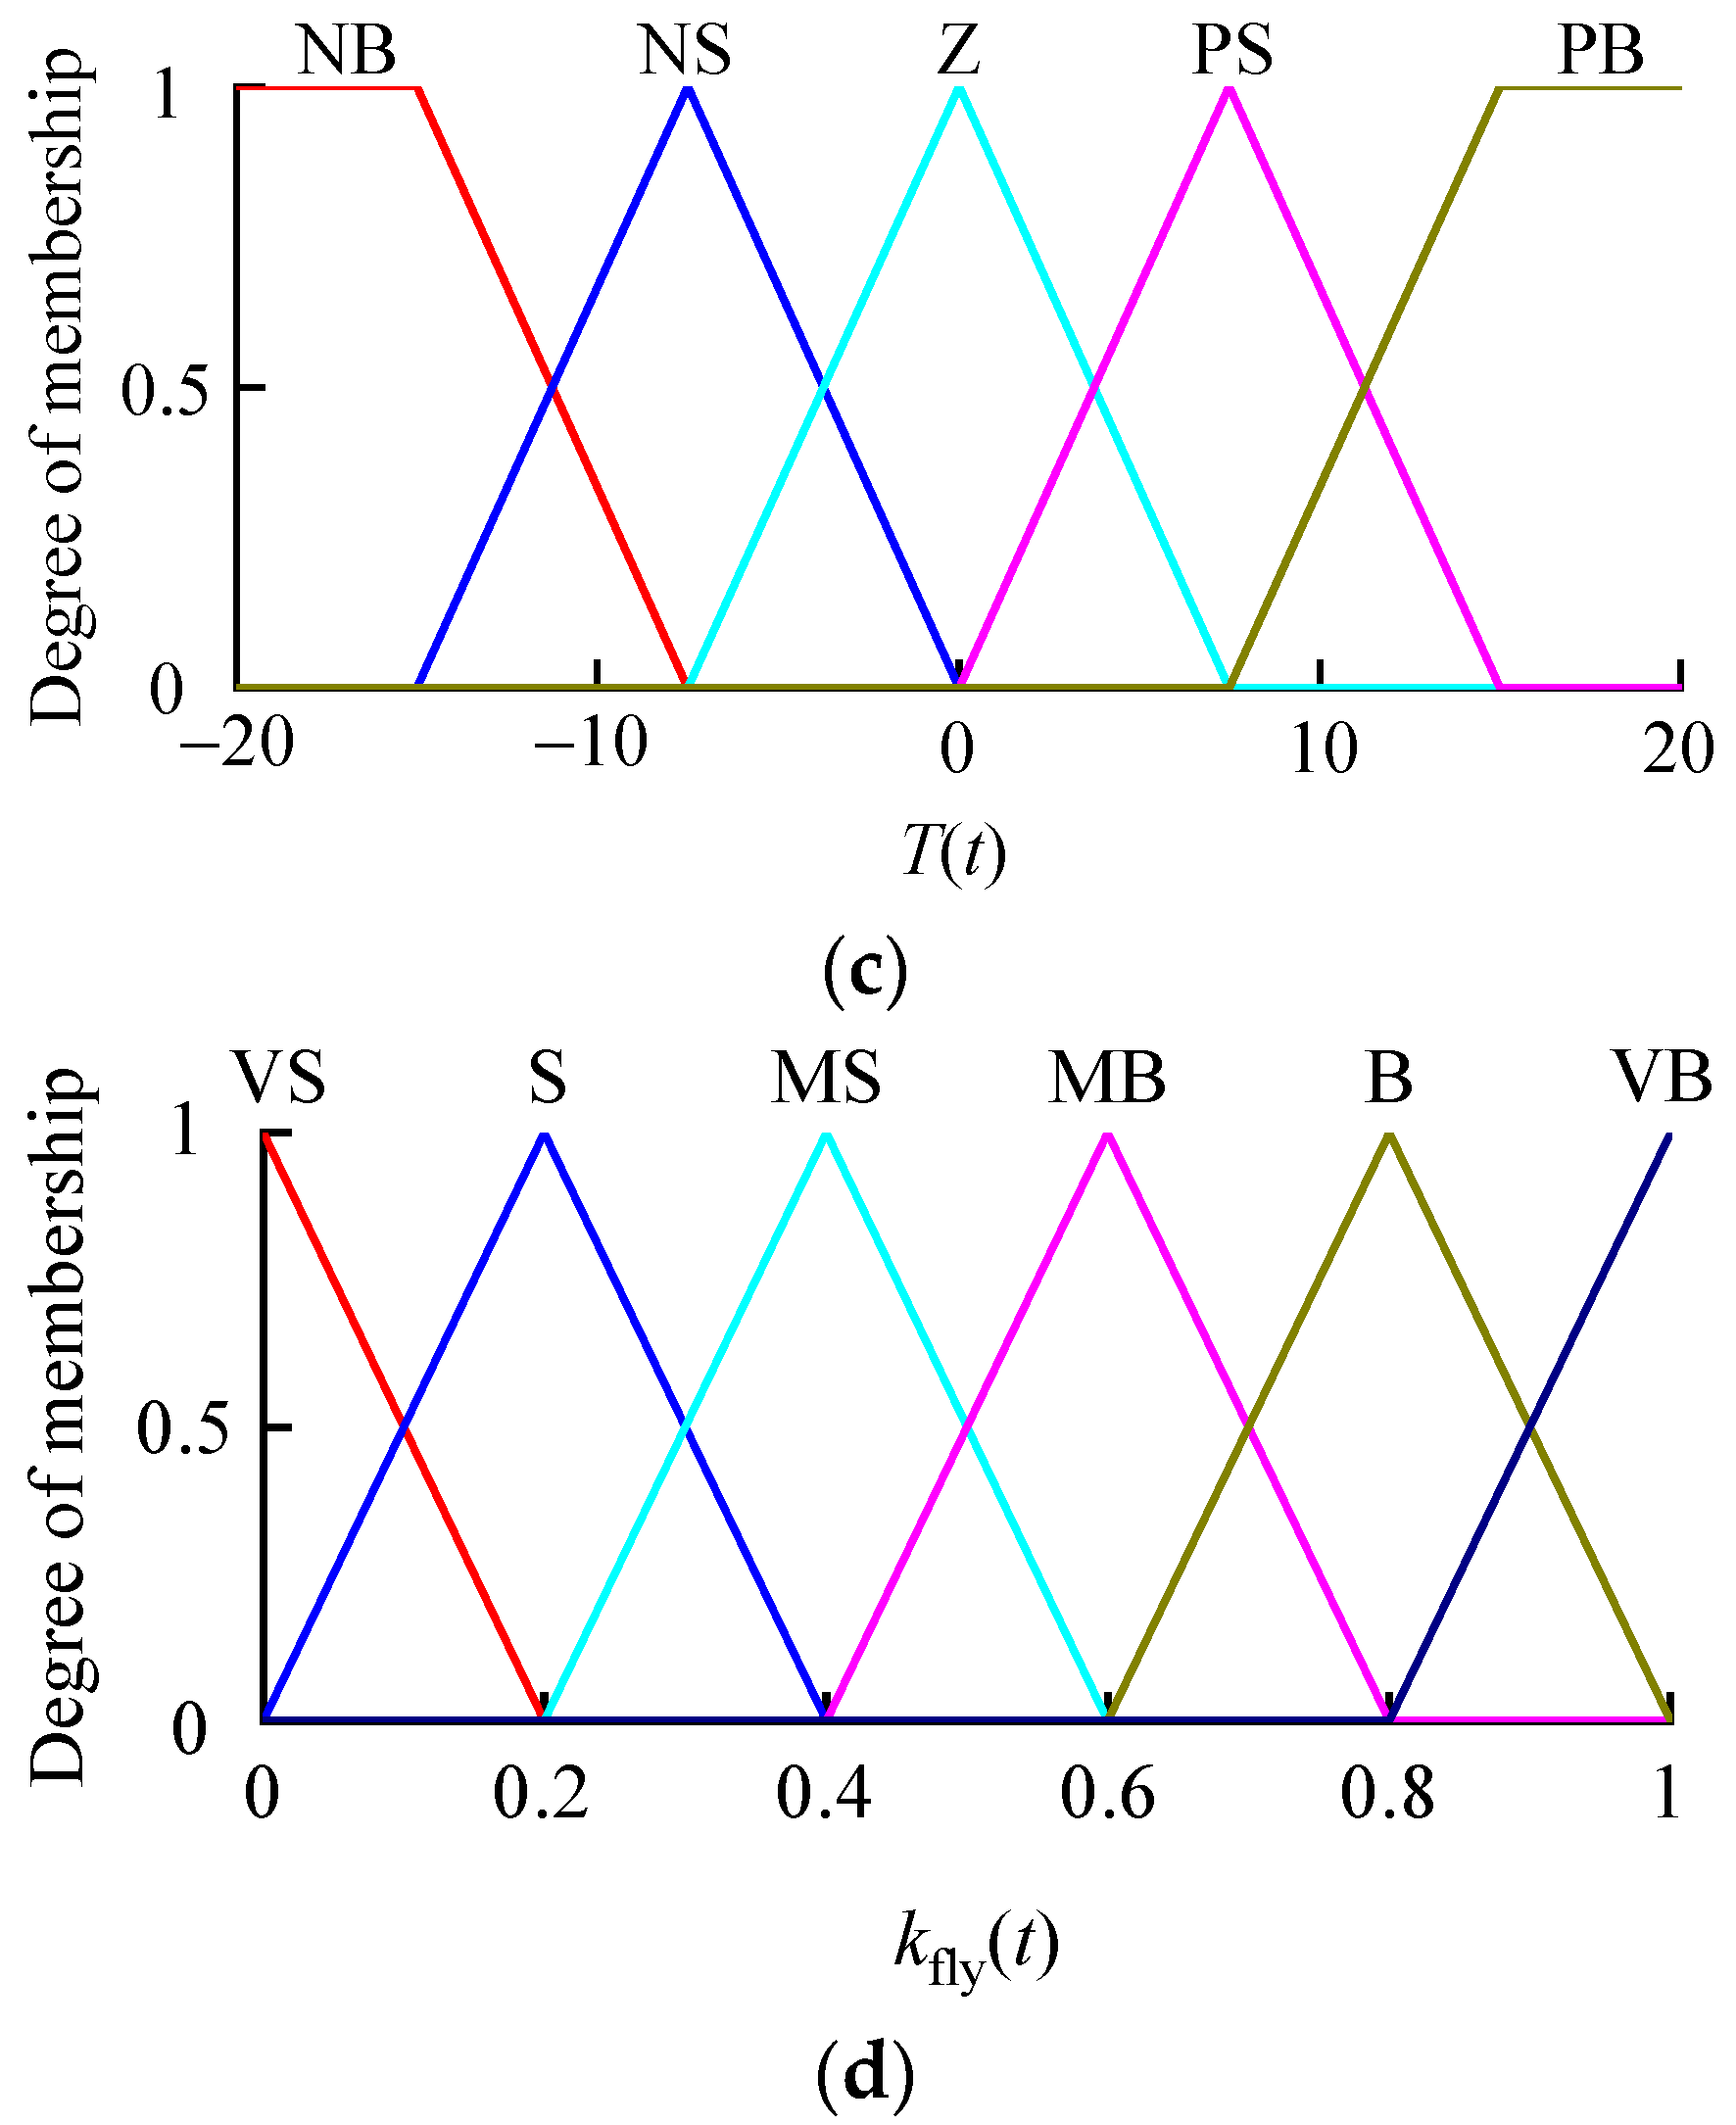
The principles of the flywheel are similar to those of the supercapacitor. According to these principles, this paper designed the fuzzy controller of the supercapacitor and flywheel to adjust the result of the primary distribution of power. The supercapacitor-post-stage fuzzy controller (SC-PSFC) input the power of the supercapacitor ( P sc ( t ) ), the SOC of supercapacitor ( SOC sc ( t ) ), and the time constant of the LPF ( T ( t ) ), and output the power adjustment factor of the supercapacitor ( k sc ( t ) ). T ( t ) can reflect the trend in the P sc ( t ) , which can make the power adjustment factor more accurate. Five fuzzy sets (negative big (NB), negative small (NS), zero (Z), positive small (PS), and positive big (PB)) are selected to cover the interval [−8, 8] of P sc ( t ) . Five fuzzy sets (very small (VS), small (S), middle (M), big (B), and very big (VB)) are selected to cover the interval [0, 1] of SOC sc ( t ) . Five fuzzy sets (negative big (NB), negative small (NS), zero (Z), positive small (PS), and positive big (PB)) are selected to cover the interval [−20, 20] of T ( t ) . Six fuzzy sets (very small (VS), small (S), middle small (MS), middle big (MB), big (B), and very big (VB)) are selected to cover the interval [0, 1] of k sc ( t ) . The membership function of SC-PSFC comprises triangular and trapezoidal membership functions. This paper uses the centroid method to fulfill defuzzification.
The power adjustment formula of SC-PSFC is shown as follows:
P sc ( t ) = k sc ( t ) P sc * ( t )
P fly ( t ) = P fly * ( t ) + [ 1 k sc ( t ) ] P sc * ( t )
where P sc * ( t ) and P fly * ( t ) are the power of the supercapacitor and of the flywheel of the primary distribution. The membership and control rule of the SC-PSFC are shown in Figure 11 and Table A1, respectively.
Given the presence of fuzzy rules in this paper, two fuzzy rules of SC-PSFC will be explained as follows:
  • When the SOC is very big (VB), the P sc ( t ) is positive small (PS), and the T ( t ) is negative big (NB), this means that although the supercapacitor is discharging, the discharge power is rapidly decreasing and there may even be charging. Then, the SC-PSFC needs to output a very small (VS) k sc ( t ) .
  • When the SOC is small (S), the P sc ( t ) is positive small (PS), and the T ( t ) is negative big (NB), this means that although the supercapacitor is discharging, the charge power is rapidly decreasing. Then, the SC-PSFC needs to output a very big (VB) k sc ( t ) .
The structure of the flywheel-post-stage fuzzy controller (F-PSFC) is similar to that of the SC-PSFC, and the power adjustment formula of the SC-PSFC is shown as follows:
P fly ( t ) = k fly ( t ) P fly * ( t )
P sc ( t ) = P sc * ( t ) + [ 1 k fly ( t ) ] P fly * ( t )
The membership and control rule of the F-PSFC are shown in Figure A1 and Table A2, respectively.
Obviously, both the SC-PSFC and F-PSFC can adjust the primary distribution of power. But the SC-PSFC and F-PSFC cannot operate at the same time, which may cause power imbalance. Therefore, it is necessary to set the PSFC operating standard (shown in Table 13) to ensure that two PSFCs will not be operating at the same time.
When the SOC of the supercapacitor and flywheel are both large or small, it indicates that the energy storage system does not have the ability to absorb the fluctuating power, and the energy storage system needs to be controlled out of operation.
The calculation time and resource consumption of fuzzy control algorithms mainly focus on the calculation of input–output membership functions and fuzzy inference. When there are more membership functions and fuzzy rules, the computation time and resource consumption of the algorithm also increase. The calculation steps and temporary data of the algorithm proposed in this paper mainly focus on the PSFC. Although each PSFC has three input variables (each variable has five membership functions), one output variable (six membership functions), and 125 fuzzy rules, regardless of the scale of the input data, its calculation steps and temporary data are always fixed, which means that its time and space complexity are both O (1). In real work, to reduce computation time and memory requirements, computer simulation models can be used to obtain query tables, and the controller can obtain results based on the query tables.

5. Simulation and Results

The simulation model of a green port multi-energy microgrid system is established in Matlab 2016a/Simulink in this paper, as shown in Figure 12. A renewable energy generation system and hybrid energy storage system are connected with the DC bus. The electricity in the port is provided by the AC bus and connected to the power grid. The EMS obtains the power information of each subsystem and the charge state information of the energy storage system, then transmits power instructions to the hybrid energy storage system. Finally, the hybrid energy storage system charges and discharges according to the power instructions of the EMS and maintains a stable system operation. The parameter of the simulation model is shown in Table 14. P ref is derived from the load power through the inertial element.
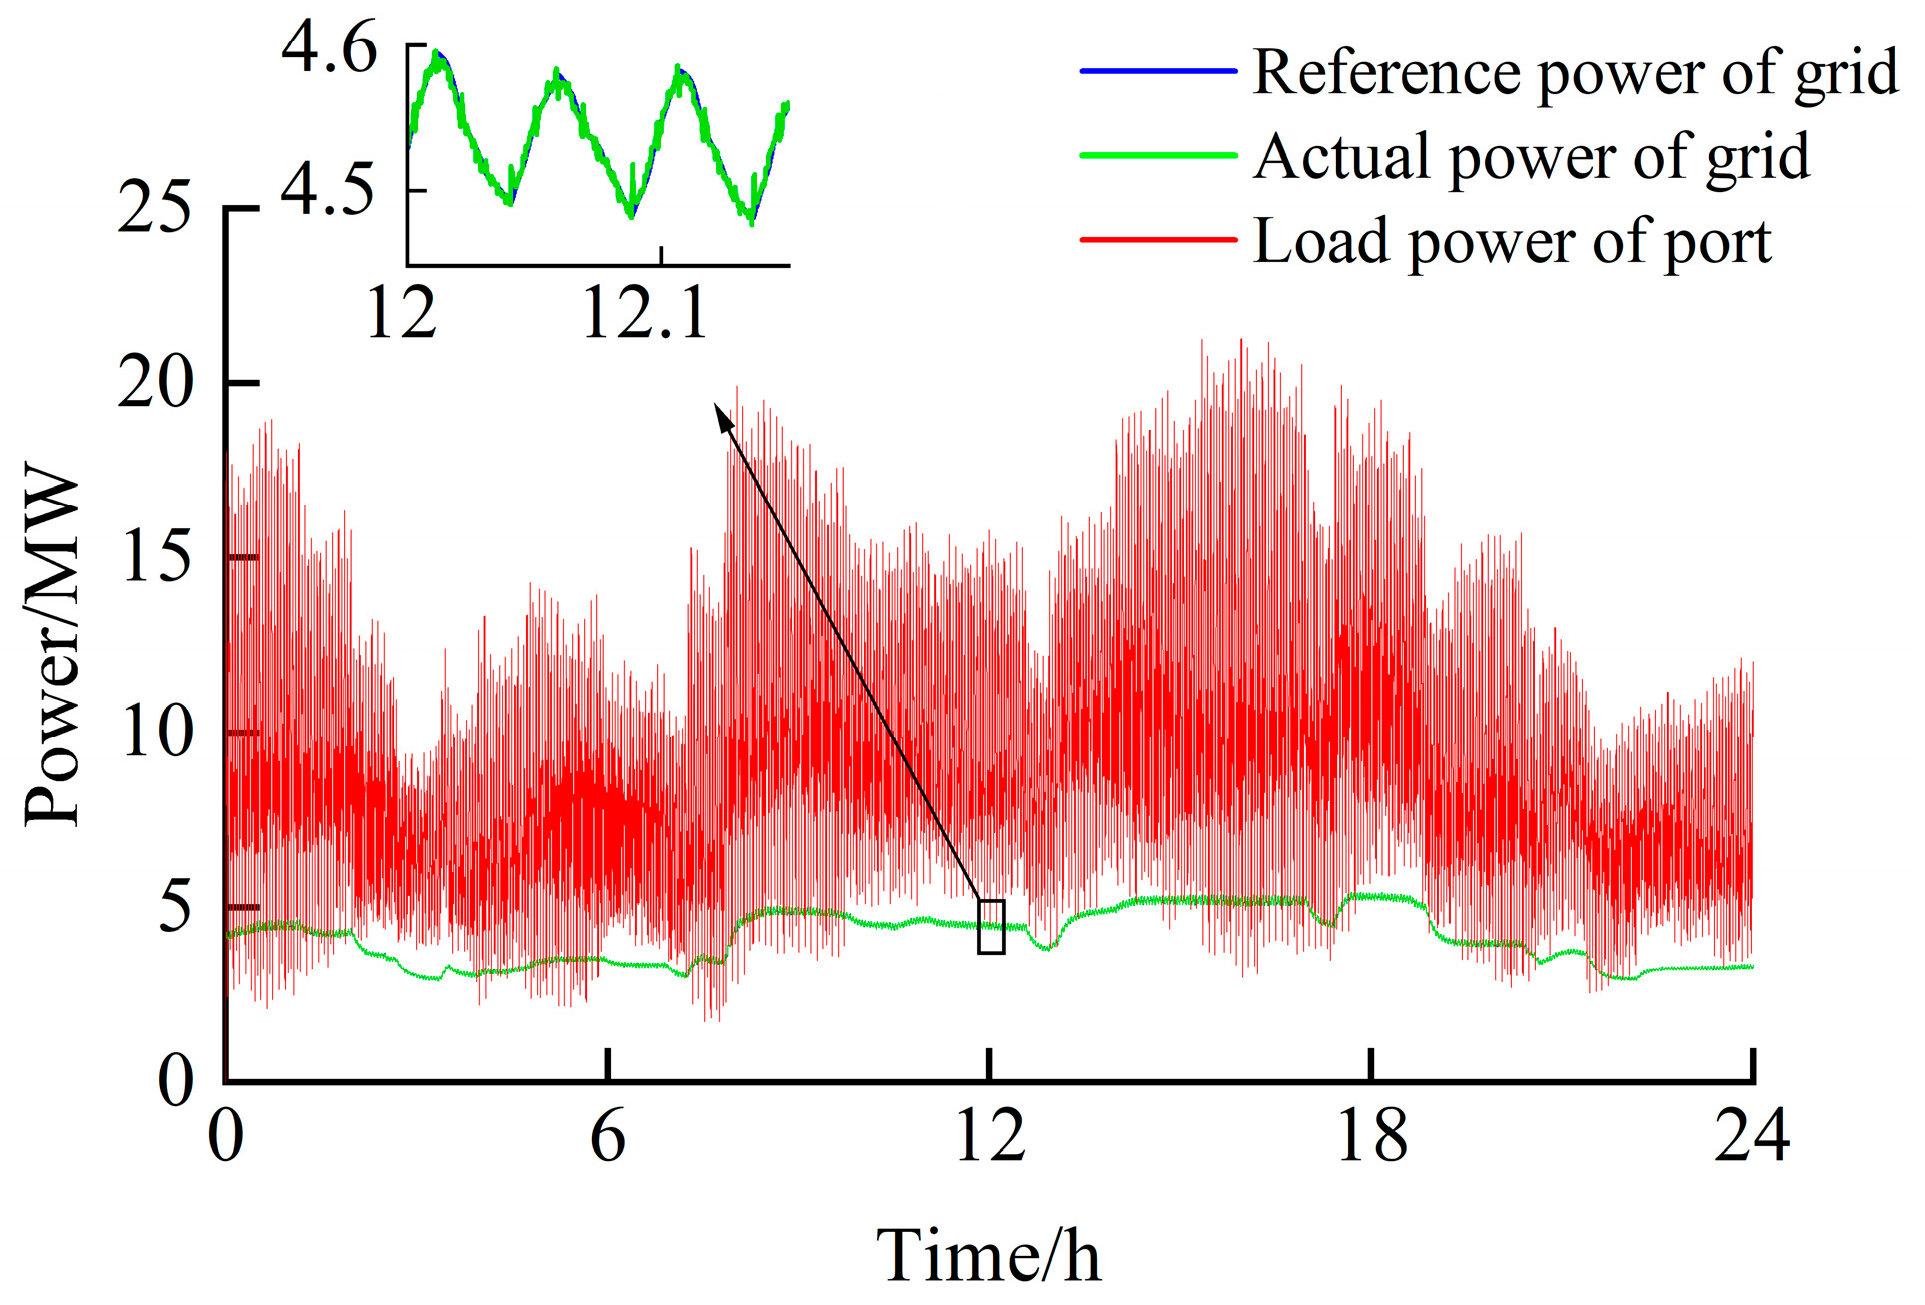
The simulation results of load power, grid power, and the partial hybrid energy storage system are shown in Figure 13 and Figure 14. It is evident that the actual grid power follows the reference power instructions of the grid, and that the fluctuating power is distributed to different energy storage systems according to different frequencies. In addition, the port’s electricity consumption is reduced and the fluctuation of load power is greatly reduced, which leads to less impact on the grid.
Figure 15 shows the time constant of a partial LPF and the corresponding power curves of the supercapacitor and flywheel. When the power curve fluctuates dramatically, the time constant increases rapidly, which leads to the supercapacitor absorbing more high-frequency power. Conversely, when the power curve does not fluctuate much, the time constant is in a small range, which causes the flywheel to absorb more medium-frequency power.
In this paper, a DSFCLPF is compared with a single-stage fuzzy control algorithm (SFC) and a wavelet packet decomposition algorithm (WPD). An SFC is proposed in [28]. A WPD uses a db6 wavelet to degrade the hybrid energy storage power into 10 layers, and the low-frequency power is P a 1 , the mid-frequency power is P a 2 , P a 3 , and P a 4 , and the high-frequency power is P ai (i = 5, 6, 7⋯1024).
Figure 16 shows the change rates of the flywheel power of the three algorithms. The limit of the power change rate is set as 600 kW/s in this paper. Obviously, under the control of both a WPD and an SFC, the flywheel power change rate will exceed the limit, which means that there is more high-frequency power in it. The flywheel cannot absorb this high-frequency power, which will affect the fixity of the DC bus voltage.
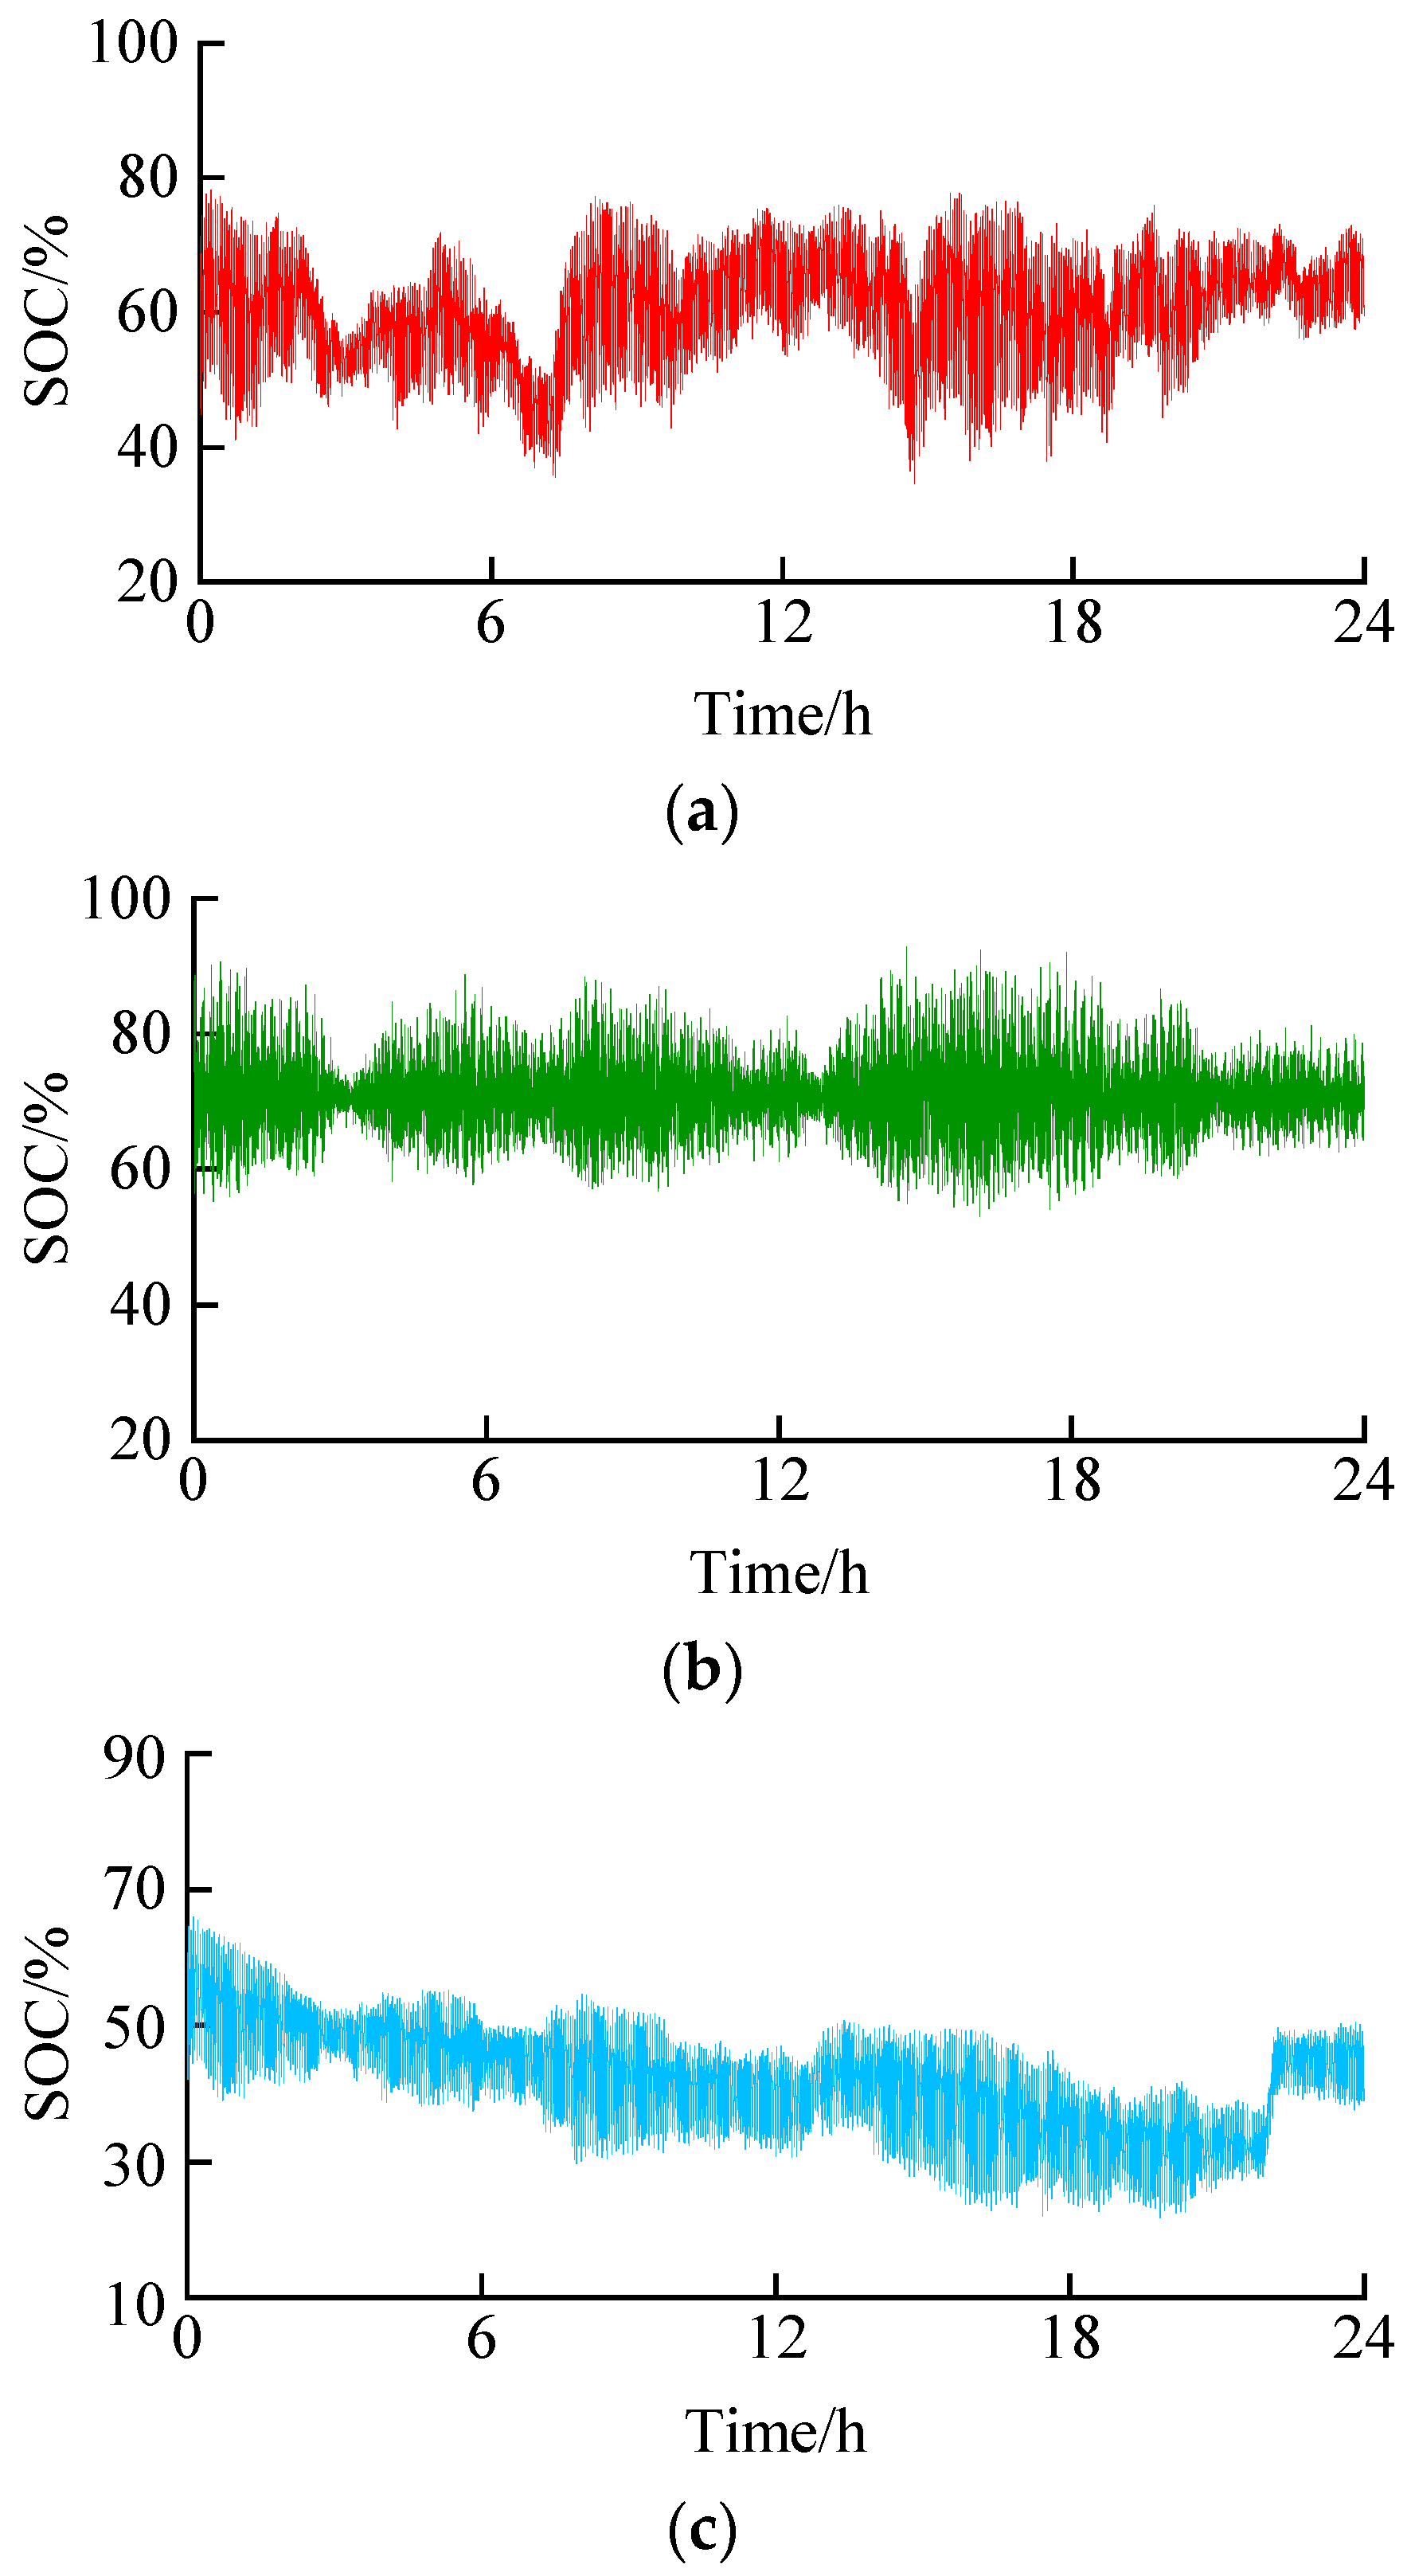
Figure 17 shows the SOC curves of supercapacitors under the three algorithms. Under the control of the DSFCLPF algorithm, the SOC of the supercapacitor is controlled within the reasonable extent of 34–78%. For the WPD, the SOC of the supercapacitor is controlled within a range of 57–93%, which has the potential of over-charging. For the SFC, the SOC of the supercapacitor is controlled within the range of 67–21%, which has the potential of over-discharging.
Taking the calculation formula of the maximum fluctuation of the output power of turbine generation proposed in [37] as a reference, the maximum fluctuation of the SOC of supercapacitors is defined as follows:
Δ S O C max = max i [ 1 , n ] S O C t ( i 1 ) Δ t min i [ 1 , n ] S O C t ( i 1 ) Δ t
where i is the sampling point. The range of i is [1, n], and n is related to the sampling interval ( Δ t ).
The maximum fluctuation in 1 min is calculated in this paper, so the value of Δ t is 0.6 s, and the value of n is 100. The average of the maximum fluctuation (μ) of the SOC of supercapacitors is determined by Equation (28). The value of μ of the three algorithms is shown in Table 15.
μ = t Δ S O C max d t t × 100 %
Both the μ of the DSFCLPF and WPD is greater than the μ of the SFC. This is due to the fact that the DSFCLPF and WPD allocate more high-frequency fluctuating power to the supercapacitor. According to Figure 16 and Table 14, the flywheel power change rate of the WPD exceeds the limit value, and the u of the WPD is greater than the u of the DSFCLPF, so it can be concluded that the WPD allocates part of the medium-frequency fluctuation power to the supercapacitor. So, the DSFCLPF algorithm is more reasonable in allocating the fluctuating power of the system, which is beneficial for improving the working efficiency of hybrid energy storage systems.
To verify the automatic adjustment capability of the DSFCLPF under the extreme working conditions of the energy storage system, the initial value of the supercapacitor’s SOC is set to 90% and 10%, respectively. Figure 18 shows the SOC curve of the supercapacitor of the DSFCLPF algorithm, the SFC, and the rule-based energy management algorithms (RB) [20], for an extreme initial SOC value.
This paper defines the reasonable range of the supercapacitor SOC as 30–75%. Figure 18 shows that all three algorithms have the ability to automatically adjust the SOC of the energy storage system, but the adjustment mechanism and speed are different. The RB algorithm adjusts the SOC of the energy storage system by setting SOC limits and controlling the system for exit operations. This method can quickly free the energy storage system from the danger of overcharging or discharging, but during the time when the energy storage system stops working, the fluctuating power of the system cannot be absorbed, which can easily lead to unstable DC bus voltage and damage to other electrical equipment in the system. The long-term shutdown of energy storage systems may even lead to the collapse of microgrids. The DSFCLPF algorithm and SFC adjust the SOC of energy storage systems by optimizing power instructions. It can greatly prevent the energy storage system from ceasing operation due to excessive or insufficient SOC, which is helpful for maintaining the steady working of the system. Table 16 shows the time required for three algorithms to adjust the SOC of supercapacitors to the reasonable range. It can be concluded that the DSFCLPF algorithm adjusts the SOC of the energy storage system more quickly, which is beneficial for the energy storage system to avoid overcharging or discharging problems and maintain the secure and steady operation of the system.
In order to further validate the effectiveness of the method proposed in the paper, one month of port data simulation was added, and the simulation results are shown in Figure 19 and Figure 20.
It can be seen from Figure 19 and Figure 20 that the SOC of the supercapacitor is maintained within a reasonable range of 31–81%, and the rate of change in flywheel power still does not exceed the limit value within a month. This implies that the DSFCLPF algorithm still has good control performance under different conditions, and attests that the DSFCLPF has good robustness and is effective.

6. Conclusions

In this work, an EMS based on fuzzy logic control was proposed to distribute the fluctuating power in a green port multi-energy microgrid system, maintain the SOC of the energy storage system, prolong the lifespan of the energy storage system, and ensure the steady operation of green port multi-energy microgrid systems. Firstly, this paper analyzed the structure of the green port multi-energy microgrid system and established the mathematical model of the system in MATLAB/SIMULINK. Moreover, this paper elaborated on the principle of modeling the quantity of logistics transportation energy at the port, and the main load of the port within a day was obtained based on the principle. Then, this paper provided a detailed design of variables and fuzzy rules of the fuzzy controller. The FSFC was used to change the time constant of the LPF. The PSFC was used to regulate the result of the primary distribution of power. Finally, the simulation results indicated that compared to traditional port systems, the green port multi-energy microgrid system has less electricity consumption and fluctuations of load power. After comparing the results with other EMS algorithms, the conclusion was that, under the control of the EMS proposed in this paper, the rate of change in flywheel power was controlled below the limit value, the high-frequency component in the flywheel power was less, and the SOC of the supercapacitor was reasonably maintained within 34–78%, which extends the lifespan of the flywheel and supercapacitor. Moreover, the medium- and high-frequency energy storage unit had a faster SOC automatic adjustment ability, which ensures the settled and safe operation of green port multi-energy microgrid systems.
The level of the author in this paper is limited, and there are some aspects that were not considered. Future research should focus on the following points:
  • It is necessary to provide a more detailed model of the quantification of logistics transportation energy at the port. This paper only considered the transportation characteristics and quantity limits of electric cranes, but the electric crane is influenced by many factors, such as the impact of wind speed on the quay cranes’ transportation process and the randomness of ship arrival time.
  • The fuzzy controller in this paper has not been trained. It is possible to consider the factors of port weather and use neural network algorithms to train fuzzy rules to improve the acclimatization of the EMS in the face of extreme weather.
  • The price of electricity can be used as inputs for fuzzy controllers to elevate the economy of the system.
Author Contributions

Conceptualization, Y.D. and J.H.; methodology, Y.D. and J.H.; software, Matlab 2016a and SAM 2022, Y.D.; validation, Y.D.; formal analysis, Y.D. and J.H.; resources, J.H.; writing—original draft preparation, Y.D.; writing—review and editing, Y.D. and J.H.; project administration, J.H. All authors have read and agreed to the published version of the manuscript.

Funding

This research received no external funding.

Data Availability Statement

Data are contained within the article.

Conflicts of Interest

The authors declare no conflicts of interest.

Glossary

SOCState of charge
EMSEnergy management strategy
LPFLow-pass filter
ACAlternating current
DCDirect current
PVPhotovoltaics
PMSGPermanent magnet synchronous generator
SAMSystem advisor model
AWEAlkaline water electrolysis
PEMFCProton exchange membrane fuel cell
SOHState of hydrogen
DSFCLPFDual-stage fuzzy control with low-pass filter algorithm
FSFCFront-stage fuzzy controller
PSFCPost-stage fuzzy controller
FFTFast Fourier transform
SC-PSFCSupercapacitor-post-stage fuzzy controller
F-PSFCFlywheel-post-stage fuzzy controller
SFCSingle-stage fuzzy control algorithm
WPDWavelet packet decomposition algorithm
RBRule-based energy management algorithm

Appendix A

Table A1. Control rules of SC-PSFC.
SOC sc = VBT(t) P sc ( t )
NBNSZPSPB
NBVSVSMBBVB
NSVSVSMBBVB
ZVSSBVBVB
PSVSMSBVBVB
PBVSMSBVBVB
SOC sc = BT(t) P sc ( t )
NBNSZPSPB
NBSMSBVBVB
NSSMSBVBVB
ZSMBVBVBVB
PSSMBVBVBVB
PBSMSVBVBVB
SOC sc = MT(t) P sc ( t )
NBNSZPSPB
NBVBVBVBVBVB
NSVBVBVBVBVB
ZVBVBVBVBVB
PSVBVBVBVBVB
PBVBVBVBVBVB
SOC sc = ST(t) P sc ( t )
NBNSZPSPB
NBBVBVBVBMB
NSVBVBVBMBMS
ZVBVBVBMBMS
PSVBVBVBMBMS
PBBBMBMSS
SOC sc = VST(t) P sc ( t )
NBNSZPSPB
NBVBVBVBMBMS
NSVBVBVBMSS
ZVBVBVBSVS
PSVBVBMBVSVS
PBVBVBMSVSVS
Table A2. Control rules of F-PSFC.
SOC fly = VBT(t) P fly ( t )
NBNSZPSPB
NBVSVSMBBB
NSVSVSMBBVB
ZVSVSBVBVB
PSVSSBVBVB
PBSMSVBVBVB
SOC fly = BT(t) P fly ( t )
NBNSZPSPB
NBSMBBVBVB
NSSMBBVBVB
ZSBVBVBVB
PSSBVBVBVB
PBSVBVBVBVB
SOC fly = MT(t) P fly ( t )
NBNSZPSPB
NBVBVBVBVBVB
NSVBVBVBVBVB
ZVBVBVBVBVB
PSVBVBVBVBVB
PBVBVBVBVBVB
SOC fly = ST(t) P fly ( t )
NBNSZPSPB
NBVBVBVBVBB
NSVBVBVBBMB
ZVBVBVBBMS
PSVBVBBMBMS
PBBMBMSMSS
SOC fly = VST(t) P fly ( t )
NBNSZPSPB
NBVBVBVBMBMS
NSVBVBVBMBMS
ZVBVBVBMSS
PSVBVBMBSVS
PBVBVBMSVSVS

Appendix B

Figure A1. (a) Input membership function P fly ( t ) ; (b) input membership function SOC fly ( t ) ; (c) input membership function T ( t ) ; (d) output membership function k fly ( t ) .
Energies 17 03601 g0a1aEnergies 17 03601 g0a1b

References

  1. Global Warming of 1.5 °C. Available online: https://www.ipcc.ch/sr15/ (accessed on 20 April 2024).
  2. Li, K.; Wu, M.; Gu, X.; Yuen, K.F.; Xiao, Y. Determinants of ship operators’ options for compliance with IMO 2020. Transp. Res. Part D Transp. Environ. 2020, 86, 102459. [Google Scholar] [CrossRef]
  3. Misra, A.; Karthik, P.; Gowrishanker, S.K.; Ayyasamy, E.; Ramalingam, V. GHG emission accounting and mitigation strategies to reduce the carbon footprint in conventional port activities—A case of the Port of Chennai. Carbon Manag. 2016, 8, 45–56. [Google Scholar] [CrossRef]
  4. Sadiq, M.; Ali, S.W.; Terriche, Y.; Mutarraf, M.U.; Hassan, M.A.; Hamid, K.; Ali, Z.; Sze, J.Y.; Su, C.L.; Guerrero, J.M. Future greener seaports: A review of new infrastructure, challenges, and energy efficiency measures. IEEE Access 2021, 9, 75568–75587. [Google Scholar] [CrossRef]
  5. Na, J.-H.; Choi, A.-Y.; Ji, J.; Zhang, D. Environmental efficiency analysis of Chinese container ports with CO2 emissions: An inseparable input-output SBM model. J. Transp. Geogr. 2017, 65, 13–24. [Google Scholar] [CrossRef]
  6. Geerlings, H.; Duin, R.V. A new method for assessing CO2-emissions from container terminals: A promising approach applied in Rotterdam. J. Clean. Prod. 2011, 19, 657–666. [Google Scholar] [CrossRef]
  7. Seddiek, I.S. Application of renewable energy technologies for eco-friendly sea ports. Ships Offshore Struct. 2020, 15, 953–962. [Google Scholar] [CrossRef]
  8. Fang, S.; Wang, Y.; Gou, B.; Xu, Y. Toward future green maritime transportation: An overview of seaport microgrids and all-electric ships. IEEE Trans. Veh. Technol. 2020, 19, 207–219. [Google Scholar] [CrossRef]
  9. Ali, Z.; Abbas, S.Z.; Mahmood, A.; Ali, S.W.; Javed, S.B.; Su, C.L. A study of a generalized photovoltaic system with MPPT using perturb and observer algorithms under varying conditions. Energies 2023, 16, 3638. [Google Scholar] [CrossRef]
  10. Dube, L.; Garner, G.C.; Garner, K.S.; Kamper, M.J. Simple and robust MPPT current control of a wound rotor synchronous wind generator. Energies 2023, 16, 3290. [Google Scholar] [CrossRef]
  11. Tai, N.; Wang, X.; Huang, W.; Yang, L.; Huang, Y. Review of low-carbon technology for integrated port energy systems. Power Syst. Technol. 2022, 46, 3749–3763. [Google Scholar] [CrossRef]
  12. Huang, Y.; Huang, W.; Wei, W.; Tai, N.; Li, R. Logistics-energy Collaborative Optimization Scheduling Method for Large Seaport Integrated Energy System. Proc. CSEE 2020, 40, 6804–6814. [Google Scholar] [CrossRef]
  13. Buitendach, H.P.C.; Gouws, R.; Martinson, C.A.; Minnaar, C.; Dmitri, B. Effect of a ripple current on the efficiency of a PEM electrolyser. Results Eng. 2021, 10, 100216. [Google Scholar] [CrossRef]
  14. Speckmann, F.; Bintz, S.; Birke, K.P. Influence of rectifiers on the energy demand and gas quality of alkaline electrolysis systems in dynamic operation. Appl. Energy 2019, 250, 855–863. [Google Scholar] [CrossRef]
  15. Koponen, J.; Ruuskanen, V.; Hehemann, M.; Rauls, E.; Antti, K.; Ahola, J.; Stolten, D. Effect of power quality on the design of proton exchange membrane water electrolysis systems. Appl. Energy 2020, 279, 115791. [Google Scholar] [CrossRef]
  16. Syed, M.A.; Khalid, M. Moving regression filtering with battery state of charge feedback control for solar PV firming and ramp rate curtailment. IEEE Access 2021, 9, 13198–13211. [Google Scholar] [CrossRef]
  17. Boonraksa, T.; Pinthurat, W.; Wongdet, P.; Boonraksa, P.; Boonruang, M.; Hredzak, B. Optimal capacity and cost analysis of hybrid energy storage system in standalone DC microgrid. IEEE Access 2023, 7, 65496–65506. [Google Scholar] [CrossRef]
  18. Jiang, Q.; Hong, H. Wavelet-based capacity configuration and coordinated control of hybrid energy storage system for smoothing out wind power fluctuations. IEEE Trans. Power Syst. 2013, 28, 1363–1372. [Google Scholar] [CrossRef]
  19. Trung, T.T.; Ahn, S.J.; Choi, J.H.; Go, S.I.; Nam, S.-R. Real-time wavelet-based coordinated control of hybrid energy storage systems for denoising and flattening wind power output. Energies 2014, 7, 6620–6644. [Google Scholar] [CrossRef]
  20. Kumar, J.; Khan, H.S.; Kauhaniemi, K. Smart control of battery energy storage system in Harbour area smart grid: A case study of Vaasa harbour. In Proceedings of the IEEE EUROCON 2021-19th International Conference on Smart Technologies, Lviv, Ukraine, 6–8 July 2021. [Google Scholar] [CrossRef]
  21. Kumar, J.; Mekkanen, M.; Karimi, M.; Kauhaniemi, K. Real-time testing of a battery energy storage controller for harbour area smart grid: A case study for Vaasa harbour grid. In Proceedings of the 2022 IEEE/IAS 58th Industrial and Commercial Power Systems Technical Conference, Las Vegas, NV, USA, 2–5 May 2022. [Google Scholar] [CrossRef]
  22. Kakouche, K.; Oubelaid, A.; Mezani, S.; Rekioua, T.; Bajaj, M.; Jurado, F.; Kamel, S. Energy management strategy of dual-source electric vehicles based on fuzzy logic control considering driving cycles. In Proceedings of the 2023 5th Global Power, Energy and Communication Conference (GPECOM), Nevsehir, Turkiye, 14–16 July 2023. [Google Scholar] [CrossRef]
  23. Al Sumarmad, K.A.; Sulaiman, N.; Wahab, N.I.A.; Hizam, H. Energy management and voltage control in microgrids using artificial neural networks, PID, and fuzzy logic controllers. Energies 2022, 15, 303. [Google Scholar] [CrossRef]
  24. Patel, S.; Ghosh, A.; Ray, P.K. Fuzzy logic control based energy management in hybrid microgrid system. In Proceedings of the 2023 5th International Conference on Energy, Power and Environment: Towards Flexible Green Energy Technologies (ICEPE), Shillong, India, 15–17 June 2023. [Google Scholar] [CrossRef]
  25. Shen, Y.; Xie, J.; He, T.; Yao, L.; Xiao, Y. CEEMD-fuzzy control energy management of hybrid energy storage systems in electric vehicles. IEEE Trans. Energy Convers. 2023, 39, 1. [Google Scholar] [CrossRef]
  26. Peng, T.; Wan, R.; Xu, Y.; Yang, C.; Gao, J.; Zhang, X. An Energy control strategy based on adaptive fuzzy logic for onboard hybrid energy storage system. In Proceedings of the IECON 2023-49th Annual Conference of the IEEE Industrial Electronics Society, Singapore, 16–19 October 2023. [Google Scholar] [CrossRef]
  27. Guo, T.; Liu, Y.; Zhao, J.; Zhu, Y.; Liu, J. A dynamic wavelet-based robust wind power smoothing approach using hybrid energy storage system. Int. J. Electr. Power Energy Syst. 2020, 116, 105579. [Google Scholar] [CrossRef]
  28. Wu, J. Studies on control strategy and capacity optimized configuration of hybrid energy storage system for wind power smoothing. Ph.D. Thesis, Hefei University of Technology, Hefei, China, 2019. [Google Scholar]
  29. Aljohani, T. Intelligent type-2 fuzzy logic controller for hybrid microgrid energy management with different modes of EVs integration. Energies 2024, 17, 2949. [Google Scholar] [CrossRef]
  30. Luo, J.; Gao, S.; Wei, X.; Tian, Z. Adaptive energy management strategy for high-speed railway hybrid energy storage system based on double-layer fuzzy logic control. Int. J. Electr. Power Energy Syst. 2024, 156, 109739. [Google Scholar] [CrossRef]
  31. Fang, S.; Lv, Z.; Chao, G. Methods of Increasing the Energy Storage Density of Superconducting Flywheel. IEEE Trans. Appl. Supercond. 2021, 31, 5700705. [Google Scholar] [CrossRef]
  32. Li, J.; Li, G.; Ma, S.; Liang, Z.; Li, Y.; Zeng, W. Modeling and simulation of hydrogen energy storage system for power-to-gas and gas-to-power systems. J. Mod. Power Syst. Clean Energy 2023, 11, 885–895. [Google Scholar] [CrossRef]
  33. Sharma, M.; Pachauri, R.K.; Goel, S.K. Matlab/Simulink modeling and analysis of parametric effects on PEMFC performance. In Proceedings of the 2015 International Conference on Recent Developments in Control, Automation and Power Engineering, Noida, India, 12–13 March 2015. [Google Scholar] [CrossRef]
  34. Peng, L.; Cai, G.; Kong, L.; Chen, C.; Du, J.; Duan, J.; Zhang, H. Control strategy of grid-connected PV-hydrogen-storage generation. Electr. Power Constr. 2016, 37, 56–61. [Google Scholar] [CrossRef]
  35. Parise, G.; Honorati, A. Port cranes with energy balanced drive. In Proceedings of the 2014 AEIT Annual Conference-From Research to Industry: The Need for a More Effective Technology Transfer, Trieste, Italy, 18–19 January 2014. [Google Scholar] [CrossRef]
  36. Esteves, J.; Gouveia, A.; Silva, N.P.D.; Liu, C.; Qu, B.; Yang, P. Green ports-building a shore power load model for simulation. In Proceedings of the 2022 IEEE International Power and Renewable Energy Conference, Kollam, India, 16–18 December 2022. [Google Scholar] [CrossRef]
  37. Fu, X.; Chen, J.; Teng, Y.; Deng, H.; Sun, Z. Energy management coordination control strategy for wind power hybrid energy storage system based on EEMD. Trans. China Electrotech. Soc. 2019, 34, 2038–2046. [Google Scholar] [CrossRef]
Figure 1. Green port multi-energy microgrid system and EMS.
Energies 17 03601 g001
Figure 2. Equivalent electrical circuit of PV cells.
Energies 17 03601 g002
Figure 3. Power–wind speed diagram of generator.
Energies 17 03601 g003
Figure 4. Solar irradiance and wind speed within a day.
Energies 17 03601 g004
Figure 5. Schematic diagram of a craning cycle.
Energies 17 03601 g005
Figure 6. Power curve of craning cycle of quay crane.
Energies 17 03601 g006
Figure 7. Number of berthing ships at port.
Energies 17 03601 g007
Figure 8. Load power of port.
Energies 17 03601 g008
Figure 9. Structure diagram of DSFCLPF-EMS.
Energies 17 03601 g009
Figure 10. (a) Input membership function of FSFC; (b) Output membership function of FSFC.
Energies 17 03601 g010
Figure 11. (a) Input membership function P sc ( t ) ; (b) input membership function SOC sc ( t ) ; (c) input membership function T ( t ) ; (d) output membership function k sc ( t ) .
Energies 17 03601 g011aEnergies 17 03601 g011b
Figure 12. Simulation model of the green port multi-energy microgrid system.
Energies 17 03601 g012
Figure 13. Load power and grid power of port.
Energies 17 03601 g013
Figure 14. Power of hybrid energy storage system.
Energies 17 03601 g014
Figure 15. The time constant and the power of the supercapacitor and flywheel.
Energies 17 03601 g015
Figure 16. (a) Change rate of flywheel power of DSFCLPF algorithm; (b) Change rate of flywheel power of WPD; (c) Change rate of flywheel power of SFC.
Energies 17 03601 g016
Figure 17. (a) SOC of supercapacitor of DSFCLPF algorithm; (b) SOC of supercapacitor of WPD; (c) SOC of supercapacitor of SFC.
Energies 17 03601 g017
Figure 18. SOC change in supercapacitor for extreme value of initial SOC. (a) Initial SOC is 10%; (b) initial SOC is 90%.
Energies 17 03601 g018
Figure 19. SOC of supercapacitor within one month.
Energies 17 03601 g019
Figure 20. Change rate of flywheel power within one month.
Energies 17 03601 g020
Table 1. Parameters of photovoltaic power generation system.
ParametersValues
Rated output power2.5 MW
Maximum power of PV cell180 W
Open circuit voltage22.8 V
Number of cells in series53
Number of cells in parallel262
Tilt angle35°
Azimuth angle
Efficiency of MPPT99%
Ambient temperature25 °C
Relative humidity60%
Table 2. Parameters of wind power generation system.
ParametersValues
Rated output power9 MW
Rated power of PMSG1500 kW
Rated wind speed11.5 m/s
Cut-in wind speed3 m/s
Cut-out wind speed22 m/s
Radius of the wind turbine blade32 m
Rated output voltage690 V
Number of wind power generator6
Ambient temperature25 °C
Relative humidity60%
Table 3. Parameter setting of SAM.
ParametersValues
Irradiance loss5%
Wiring loss2%
Wake loss1.1%
Turbine availability loss3.58%
Turbine performance loss3.954%
Environmental loss2.398%
Table 4. Characteristics of supercapacitor module (LSUM-048R6C-0166F-EA-DC00).
ParametersValues
Rated voltage50 V
Rated capacitance166 F
Series resistance equivalent0.005 Ω
Capacitance of electric energy0.04 kWh
Table 5. Parameters of supercapacitor energy storage system.
ParametersValues
Capacitor number in series16
Capacitor number in parallel93
Rated voltage800 V
Rated capacitance964.97 F
Series resistance equivalent0.86 mΩ
Capacitance of electric energy60 kWh
Table 6. Parameters of flywheel energy storage system.
ParametersValues
Rated rotational speed10,000 rpm
Moment of inertia8205 kg⋅m2
Capacitance of electric energy1000 kWh
Table 7. Parameters of electrolytic cell.
ParametersValuesParametersValues
r18.05 × 10−5 Ω⋅m2r2−2.5 × 10⁻⁷ Ω⋅m2⋅K−1
U rev 1.228 V T elec 353.15 K
t10.0874 A−1⋅m2t2−0.8944 A−1⋅m2⋅K
t3115.5614 A−1⋅m2⋅K2 A elec 0.25 m2
s0.185 V
Table 8. Parameters of hydrogen tank.
ParametersValues
Capacitance of electric energy70 MWh
Gas temperature313.15 K
Volume of tank90 m3
Maximum pressure of tank45 Mpa
Table 9. Parameters of quay crane.
ParametersValues
Maximum weight48 t
Maximum height32 m
Supply voltage3000 V
Working speed (with load and without load)1.41 m/s; 2.7 m/s
Table 10. Number of different types of ships.
Type of ShipsNumber of Ships
Container ships13
General cargo ships27
Offshore supply ships1
Bulk carriers1
Fishing vessels1
Crude oil tankers3
Table 11. Reference of shore power.
Type of ShipsGross Tonnage/GT
≤9991000–49995000–999910,000–24,999
Estimated Power Demand in Port per Ship/kW
Offshore supply Ships69216518829
Container ships 46181497709
General cargo Ships1999224388
Bulk carriers39119199296
Crude oil tankers56241528714
Fishing vessels64224427682
Table 12. Control rules of FSFC.
VariableFuzzy Subset
Δ P sc _ fly NBNMNSZPSPMPB
T(t)NBNMNSZPSPMPB
Table 13. Standard of operation of PSFC.
SOC sc SOC fly
SmallMiddleLarge
Small/SC-PSFCF-PSFC
MiddleF-PSFCSC-PSFCF-PSFC
LargeF-PSFCSC-PSFC/
Table 14. Parameters of simulation model.
ParametersValues
Rated voltage of DC bus1500 V
Rated voltage of AC bus6.6 kV
Initial SOC of the supercapacitor65%
Initial SOC of the flywheel60%
Initial SOC of the hydrogen tank60%
Step size of simulation5 × 10−4 s
Table 15. Values of μ of different algorithms.
AlgorithmValues of μ
DSFCLPF10.99%
WPD14.05%
SFC8.72%
Table 16. Adjustment time of different algorithms.
AlgorithmAdjustment Time/s
Initial SOC is 10%Initial SOC is 90%
DSFCLPF7271653
SFC15872686
RB26162702
Disclaimer/Publisher’s Note: The statements, opinions and data contained in all publications are solely those of the individual author(s) and contributor(s) and not of MDPI and/or the editor(s). MDPI and/or the editor(s) disclaim responsibility for any injury to people or property resulting from any ideas, methods, instructions or products referred to in the content.