Article

Study on Rapid Simulation of the Pre-Cooling Process of a Large LNG Storage Tank with the Consideration of Digital Twin Requirements

1
College of Mechanical and Electrical Engineering, Beijing University of Chemical Technology, Beijing 100029, China
2
CNOOC Energy Development Co., Ltd., Tianjin 300450, China
3
CNOOC Gas and Power Group, Beijing 100028, China
4
Offshore Oil Engineering Co,. Ltd., Tianjin 300461, China
*
Author to whom correspondence should be addressed.
Energies 2024, 17(14), 3471; https://doi.org/10.3390/en17143471
Submission received: 21 May 2024 / Revised: 8 July 2024 / Accepted: 10 July 2024 / Published: 15 July 2024

Abstract

:
The pre-cooling of a large LNG storage tank involves complex phenomena such as heat transfer, low-temperature flow, gas displacement, and vaporization. The whole pre-cooling process could take up to 50 h. For large-scale, full-capacity storage tanks, it is particularly important to accurately control the pre-cooling temperature. Digital twin technology can characterize and predict the full life cycle parameters from the beginning of pre-cooling development to the end and even the appearance of damage in real time. The construction of a digital twin platform requires a large number of data samples in order to predict the operating state of the device. Therefore, a simulation method with high computational efficiency for the pre-cooling process of LNG tanks is of great importance. In this paper, the mixture model and discrete phase model (DPM) are applied to simulate the pre-cooling process of a large LNG full-capacity tank. Following Euler–Lagrange, the DPM greatly simplifies the solution process. Compared with the experimental results, the maximum error of the DPM simulation results is less than 11%. Such a highly efficient simulation method for the large LNG full-capacity storage tank can make it possible to build the digital twin platform that needs hundreds of data model samples.

1. Introduction

As a clean energy source, LNG has been highly valued by countries all over the world, and LNG storage tanks are frequently constructed [1,2,3,4,5,6,7]. At present, most LNG storage tanks in LNG receiving stations are full-capacity concrete roof storage tanks [8,9]. In China, a Tianjin LNG storage tank with 16,000 m3 under atmospheric pressure and low temperature requires pre-cooling before formal liquid intake [10,11,12,13]. For pre-cooling, it is demanded that the tank temperature drop at a rate of 3 to 5 k/h, and the temperature difference between monitoring points cannot be greater than 10 k. At present, the flow control of LNG in the pre-cooling process mainly relies on experience. The long pre-cooling time and complex devices of LNG pre-cooling make the test difficult and extremely costly. As a result, it is hard to obtain detailed data on pre-cooling. With the increase in storage volume and the application of thin tanks, it is of great significance for large LNG storage tanks to establish a comprehensive and effective digital twin platform for real-time monitoring and prediction of risks in the operation and maintenance of the tanks.
The rapid development of new technologies such as the Internet of Things, BDA, cloud computing, and AIL has laid a good foundation for the construction of digital twins. Meanwhile, some standards and guidelines came into being, for example, in 2020, ISO issued the handbook “Automation systems and integration—Industrial data—Visualization elements of digital twins” (ISO-TR24464-2020) [14], making the digital twins possible in engineering applications. A certain amount of basic sample data for machine learning is the data foundation of the digital twin with the prediction function. Through CAE simulation, the filling process database and extreme condition database are established, which not only comprehensively observe the pre-cooling phenomenon to guide the pre-cooling process but also predict the phenomenon, directing field operations accurately in real time. Xie Hongheng et al. proposed a structural health hybrid digital twin monitoring system that meets the requirements of ship health monitoring and has certain reference significance for the future development of highly integrated and intelligent ships [15]. Zhang Qinglei et al. established a 3D digital twin, combined with the actual robotic welding process. The twin welding robot data are updated in real time through the real-time interactive data drive to achieve real-time synchronization and faithful mapping of the virtual twin, as well as 3D visualization and monitoring of the system [16]. Gu Wei et al. conducted a whole-life cycle simulation study on the vibration response of rolling bearings. Based on a five-degrees-of-freedom nonlinear rolling bearing vibration model, it establishes a virtual solid model. The virtual entity model can be used to describe the process of bearing failure from occurrence to serious failure [17]. It is seen that for establishing an accurate digital twin, both accurate analysis results and a large number of calculation samples are needed. Therefore, a quick simulation method that meets engineering accuracy is crucial to the construction of digital twins [18,19,20,21,22,23,24,25].
For the simulation of the pre-cooling process, the continuous flow model is often used to simulate mass and heat transfer in the pre-cooling process of large LNG tanks. The mixture model, combined with the Lee model of the fluent, is the main research method. Meng R, based on the fluent mixture model, considers the phase transition of cryogenic liquid vaporization [26]. Linhui Zhang et al. simulated the temperature field, flow field distribution, and temperature time history of the 80,000 m3 storage tank in the process of pre-cooling [27]. Also based on the fluent mixture model, Jinjuan Li et al. carried out a multi-inlet three-dimensional numerical simulation analysis for a 160,000 m3 storage tank and obtained the physical field data during the pre-cooling process [9].
The mixture model in fluent is a simplified multiphase model, which is a good substitute for the full Eulerian multiphase model in many cases. It allows for the selection of granular phases and calculates all properties of the granular phases, which can model a variety of phases (fluid or particulate) by solving the momentum, continuity, and energy equations. The typical applications of the mixture model include sedimentation, cyclone separators, and bubbly flows where the gas volume fraction remains low.
The DPM in fluent adopts the Euler–Lagrange approach. The gas is treated as a continuum by solving the Navier–Stokes equations, while the particles are solved by tracking a large number of particles, bubbles, or droplets through the calculated flow field. The DPM simulation is appropriate for the modeling of spray dryers, coal and liquid fuel combustion, and some particle-laden flows.
In this paper, simulation methods of the pre-cooling process of a large, full-capacity storage tank were investigated based on the pre-cooling process and the digital twin sample requirements. Specifically, the mixture model simulation and the DPM simulation were studied and compared in terms of the geometric model complexity, the number of meshes, simulation efficiency, and the accuracy of the solution results. After that, a simulation model is recommended to simulate the pre-cooling process of a large LNG tank with high accuracy and efficiency, which makes it possible to build a digital twin platform.

2. Structure and Pre-Cooling Process of an LNG Storage Tank

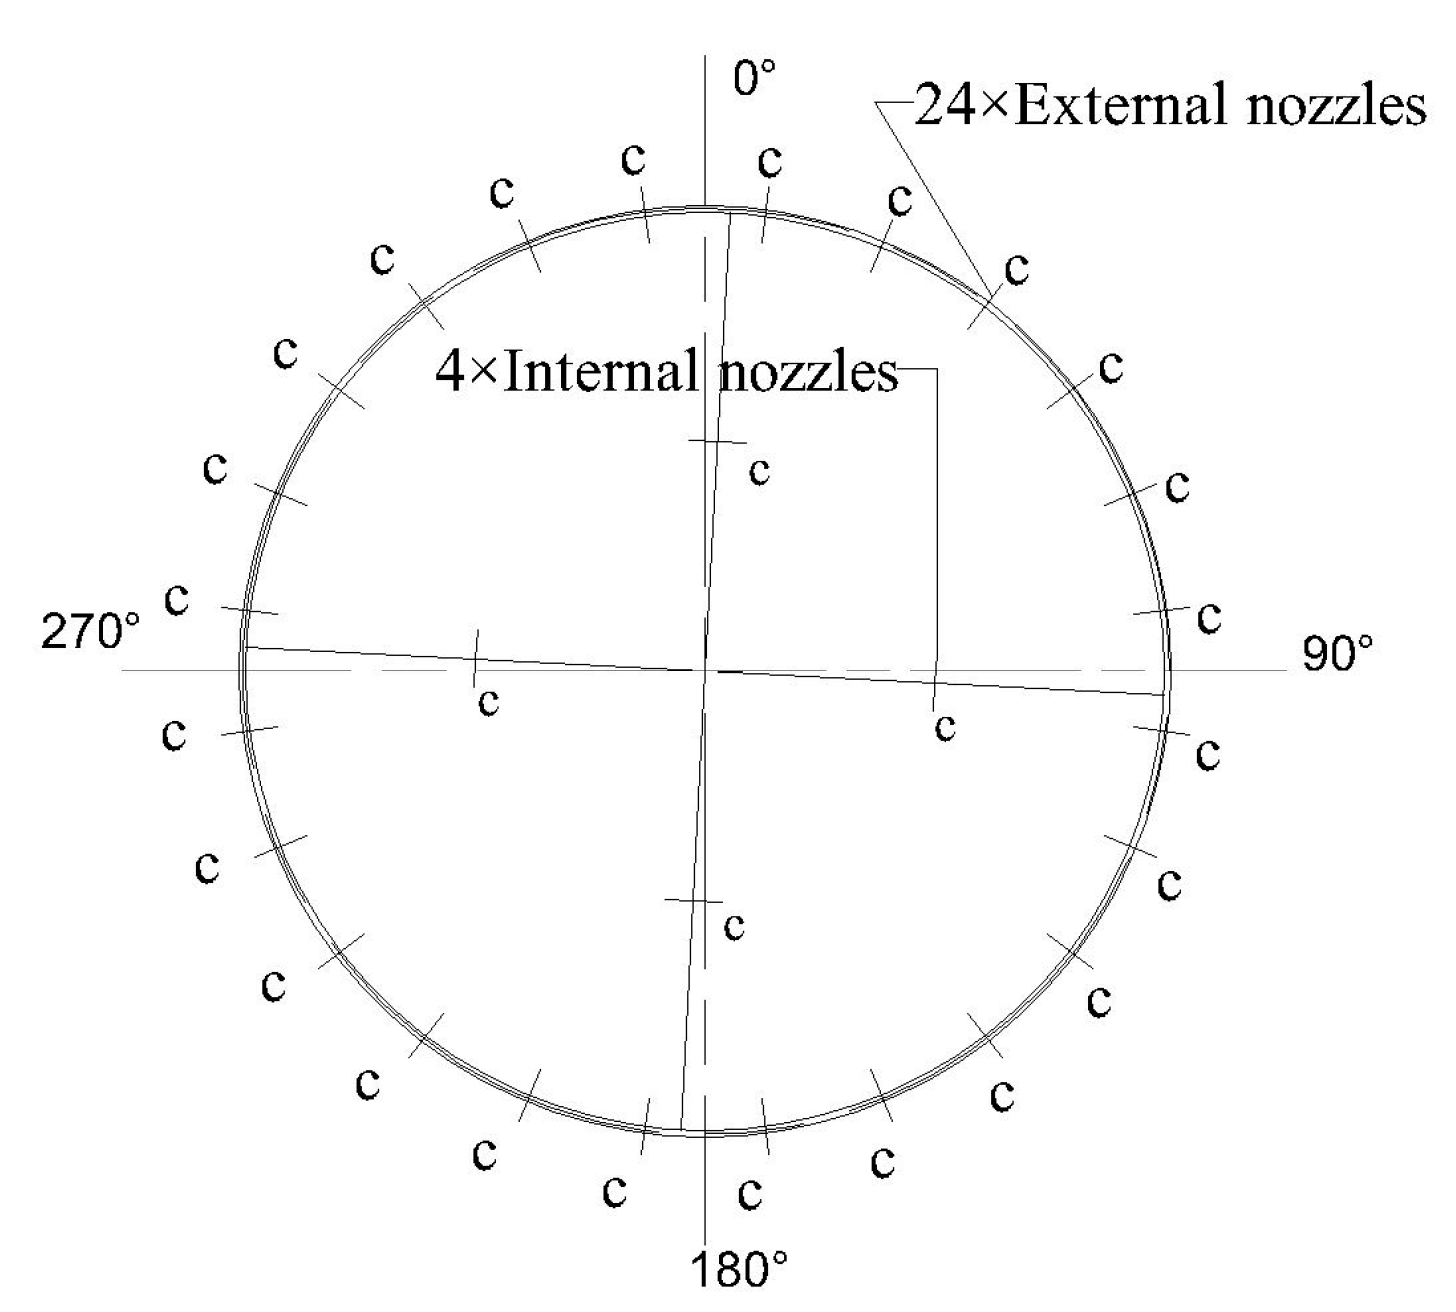
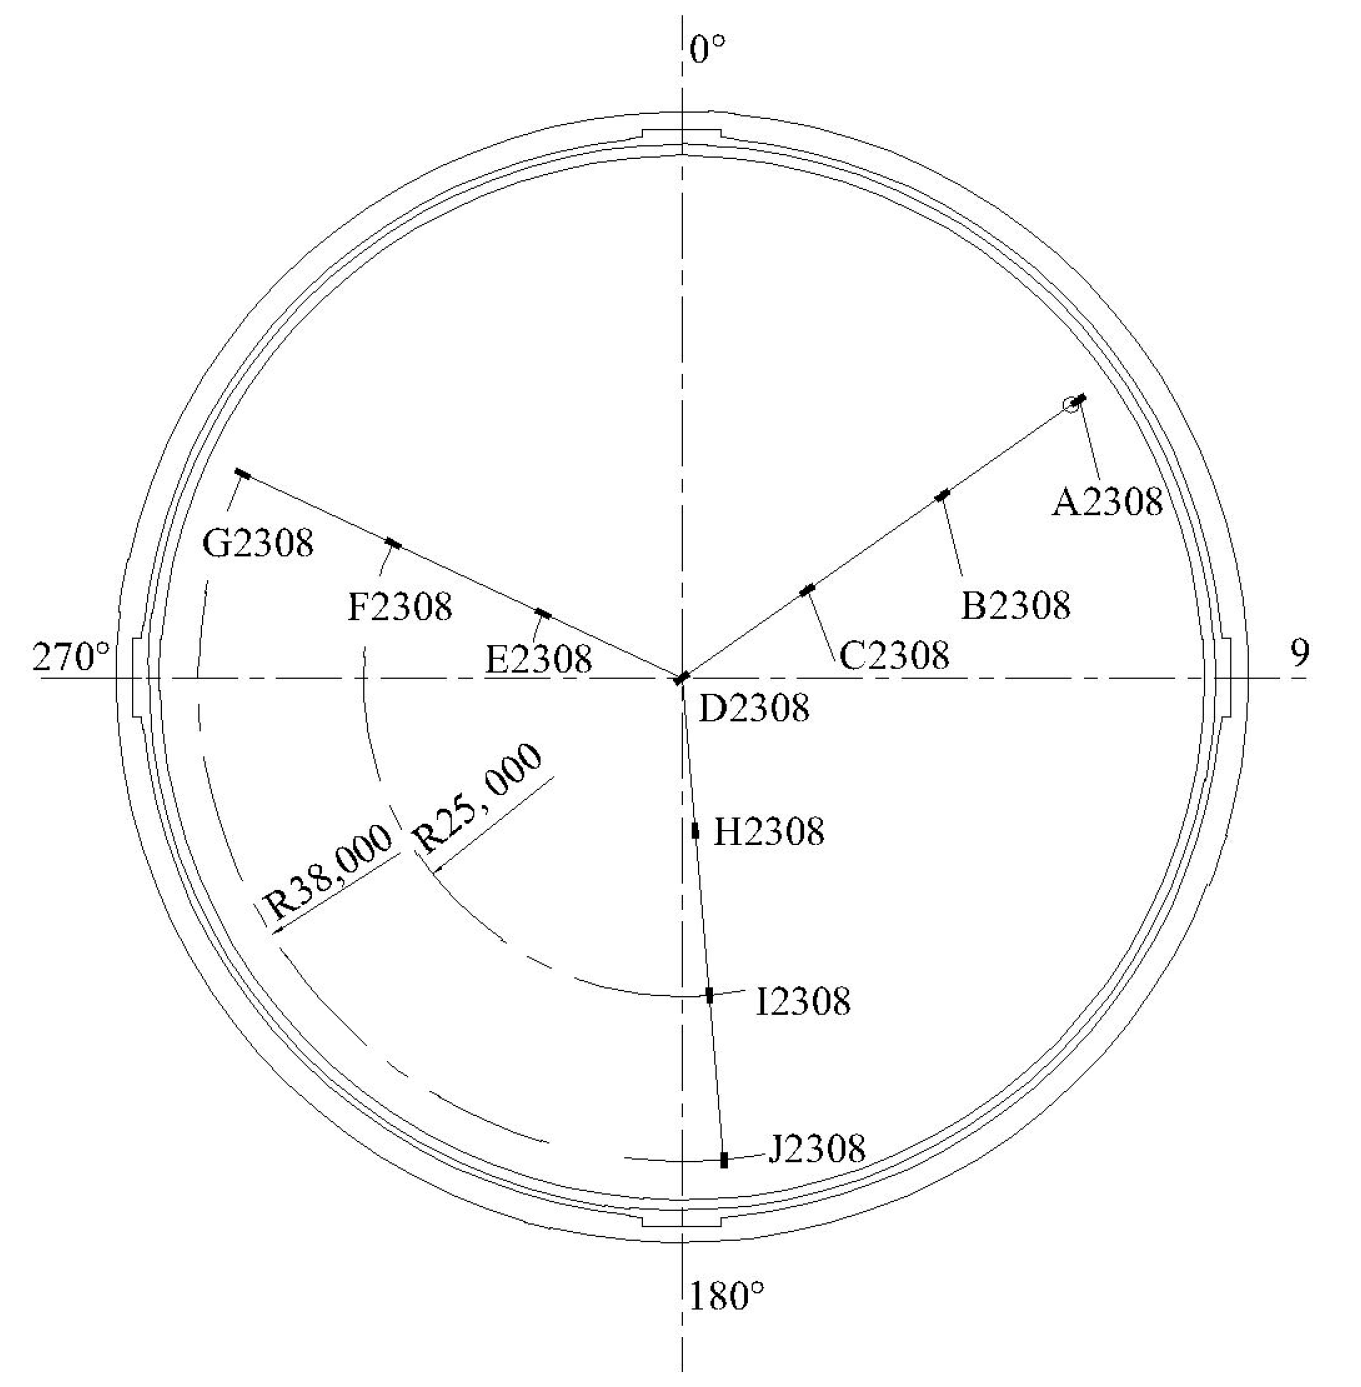
As shown in Figure 1, the LNG storage tank is mainly composed of an inner tank, aluminum ceiling, foam glass block, concrete layer, and spray ring. The spray ring has 28 nozzles, of which 24 spray outward and 4 spray toward the center of the storage tank to increase the uniformity of heat transfer, as shown in Figure 2. Before the pre-cooling of the LNG tank, the tank is filled with dry nitrogen at ambient temperature. During pre-cooling, the jet nozzles start to spray the low-temperature LNG, which vaporizes into BOG and cools the tank. As shown in Figure 3, ten temperature sensors are arranged at the bottom of the LNG tank to monitor the temperature during the pre-cooling process in real-time, which can be used to verify the accuracy of the simulation model.

3. Digital Twin Data Composition

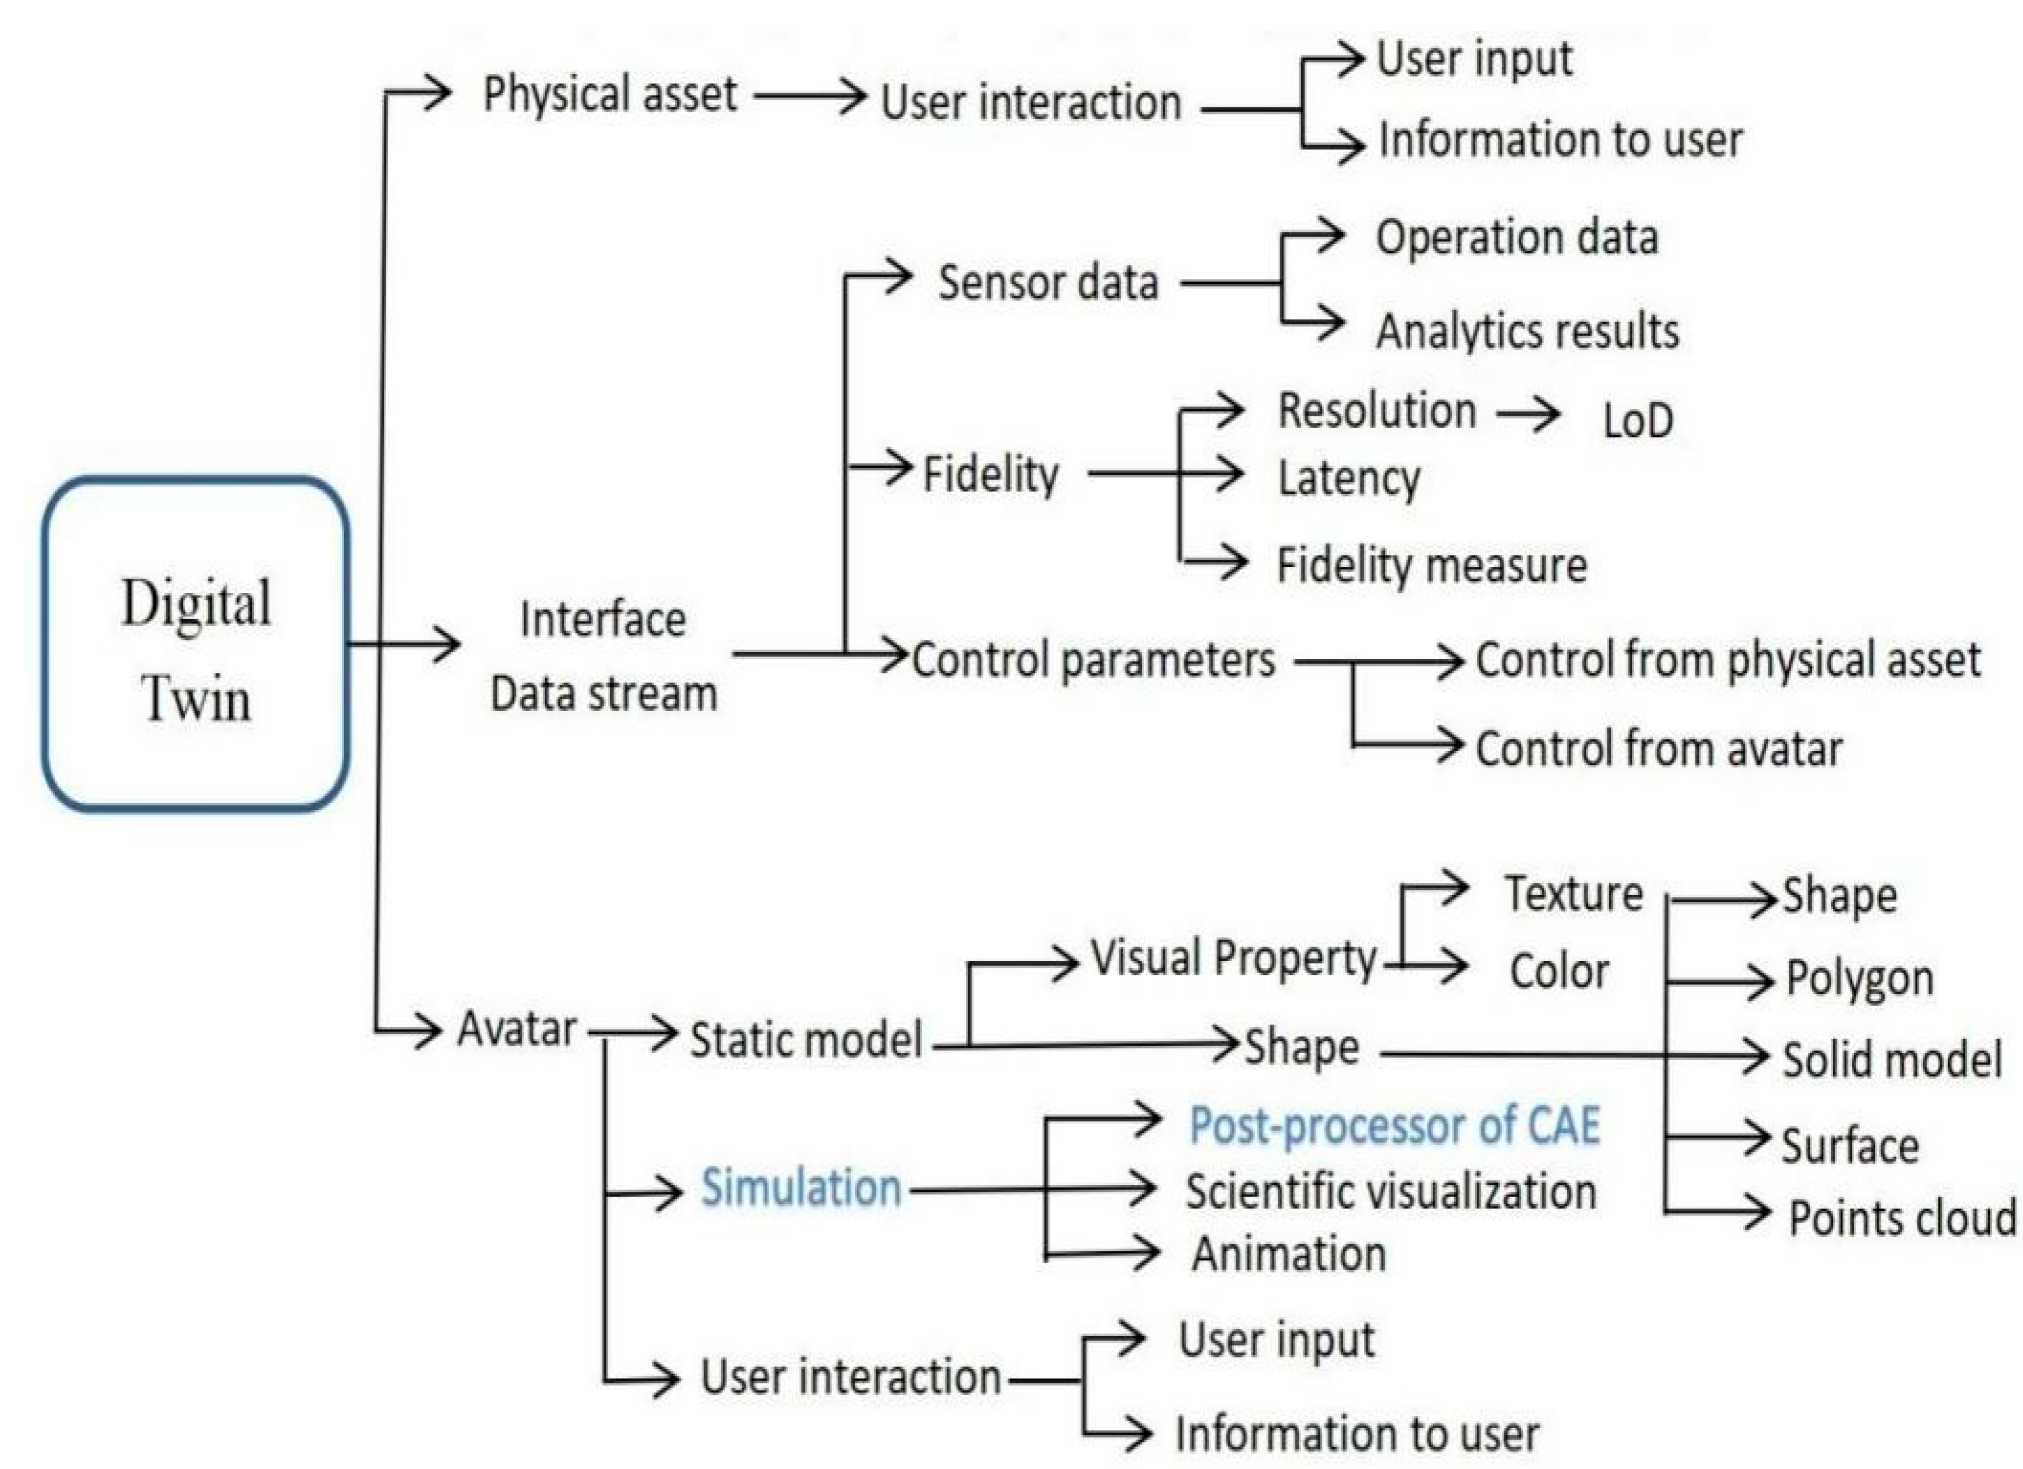
As shown in Figure 4, the establishment of digital twins is mainly divided into physical assets, interface data streams, and avatars (digital replicas). Avatar is the virtual model in a digital twin that contains both the digital geometry model with the running database and the prediction data. The static model in digital replica only displays the basic characteristics of the physical model. There is no data model to predict the health and life-cycle safety of the physical model.
Simulation in a digital replica provides a data model for the digital twin that can not only display the real-time state of the physical model but also predict the future health status and thus ensure the health of the physical model. The sample number and calculation accuracy of the CAE calculation determine the precision of digital twins.
For large equipment, such as large LNG storage tanks, comprehensive and detailed data cannot be obtained through experimental means but can be obtained from CAE calculations. A full-model simulation method for the pre-cooling process of large LNG storage tanks is very important for the healthy operation and life-cycle safety prediction of the tanks. In this paper, different methods are studied to obtain a set of fast and accurate simulation analysis models that can provide accurate and sufficient calculation samples for the construction of digital twins of large LNG full-capacity storage tanks.

4. A Comparative Study of Different Numerical Simulation Models

4.1. Model Geometry and Mesh

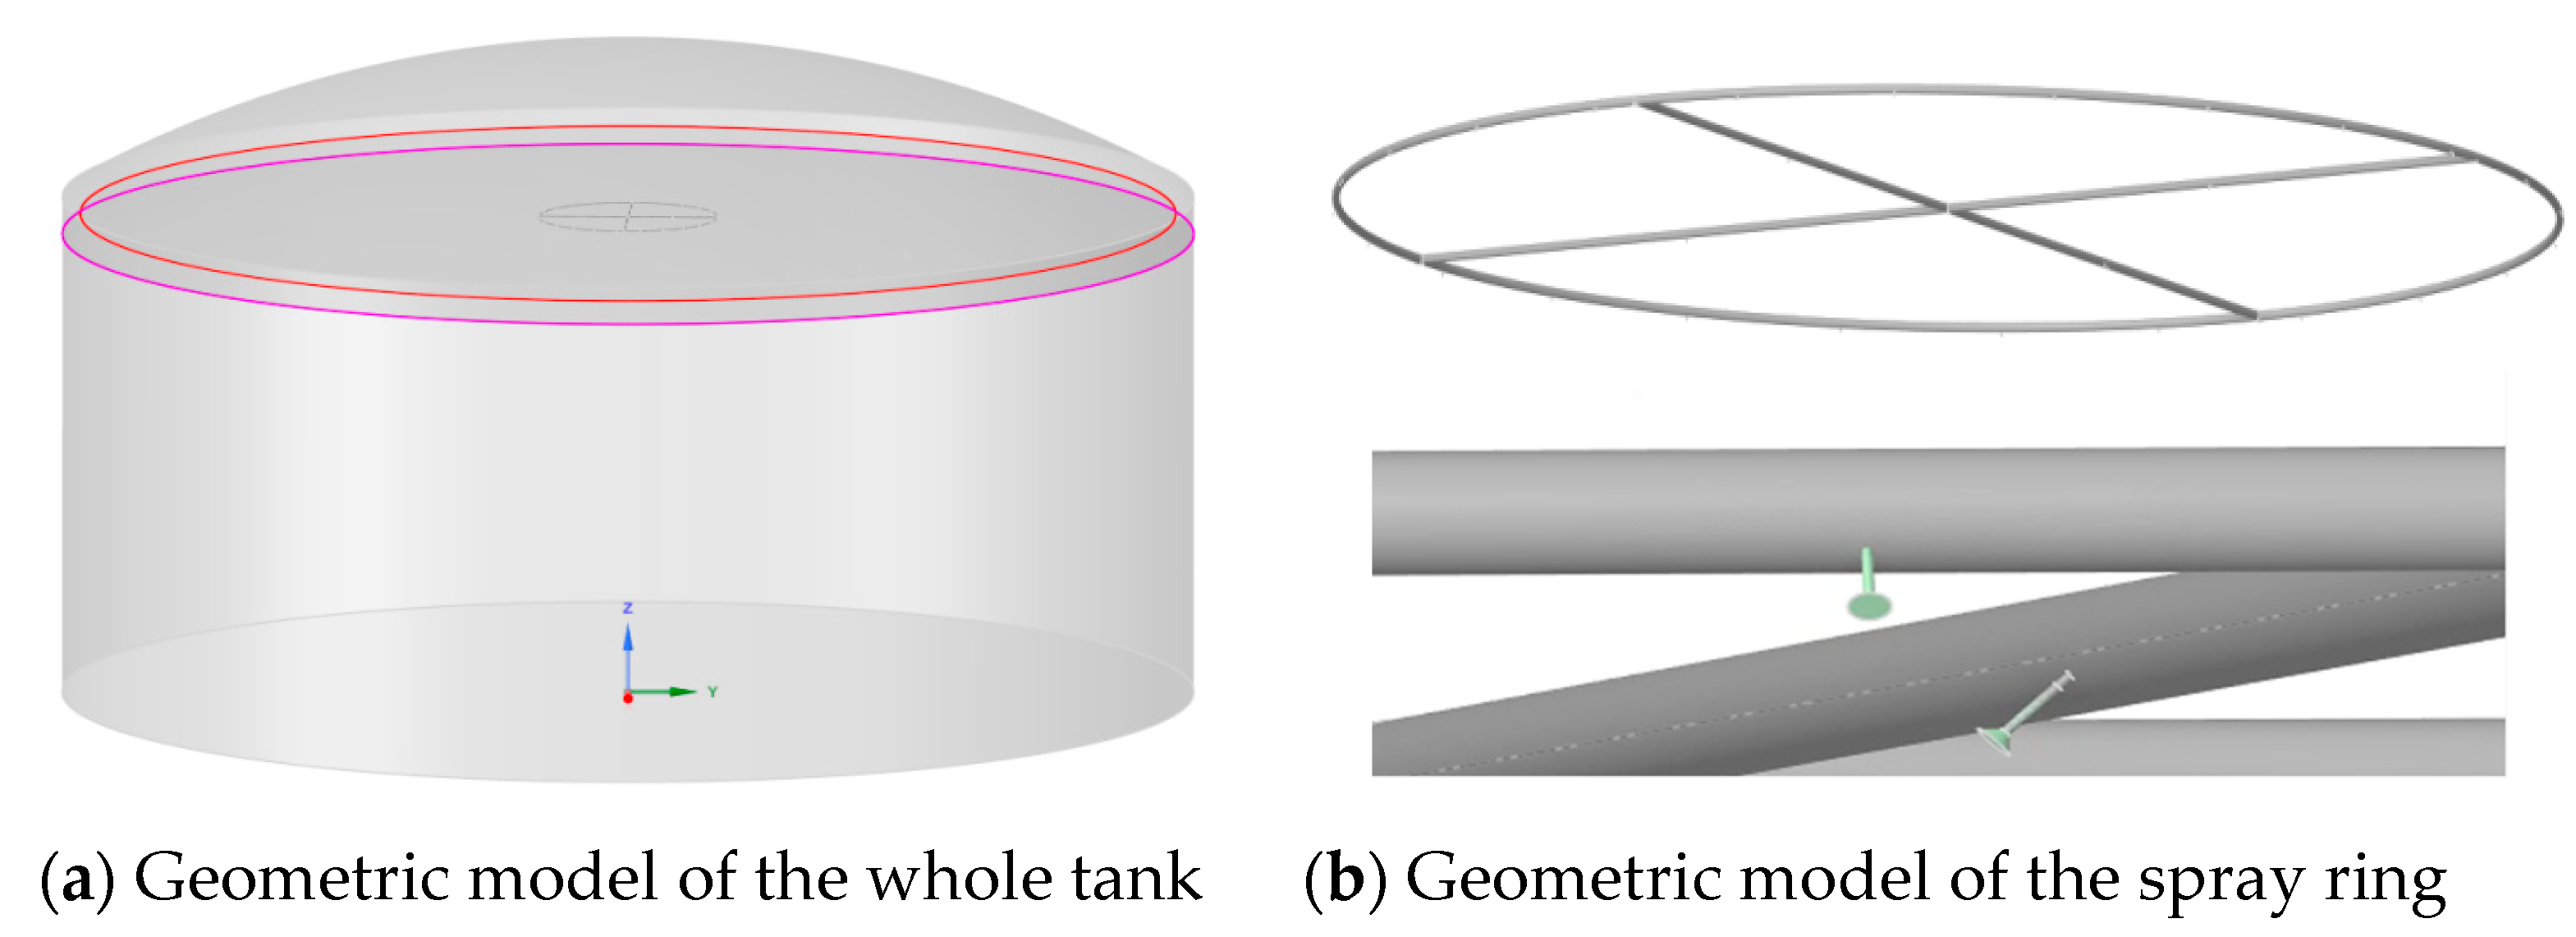
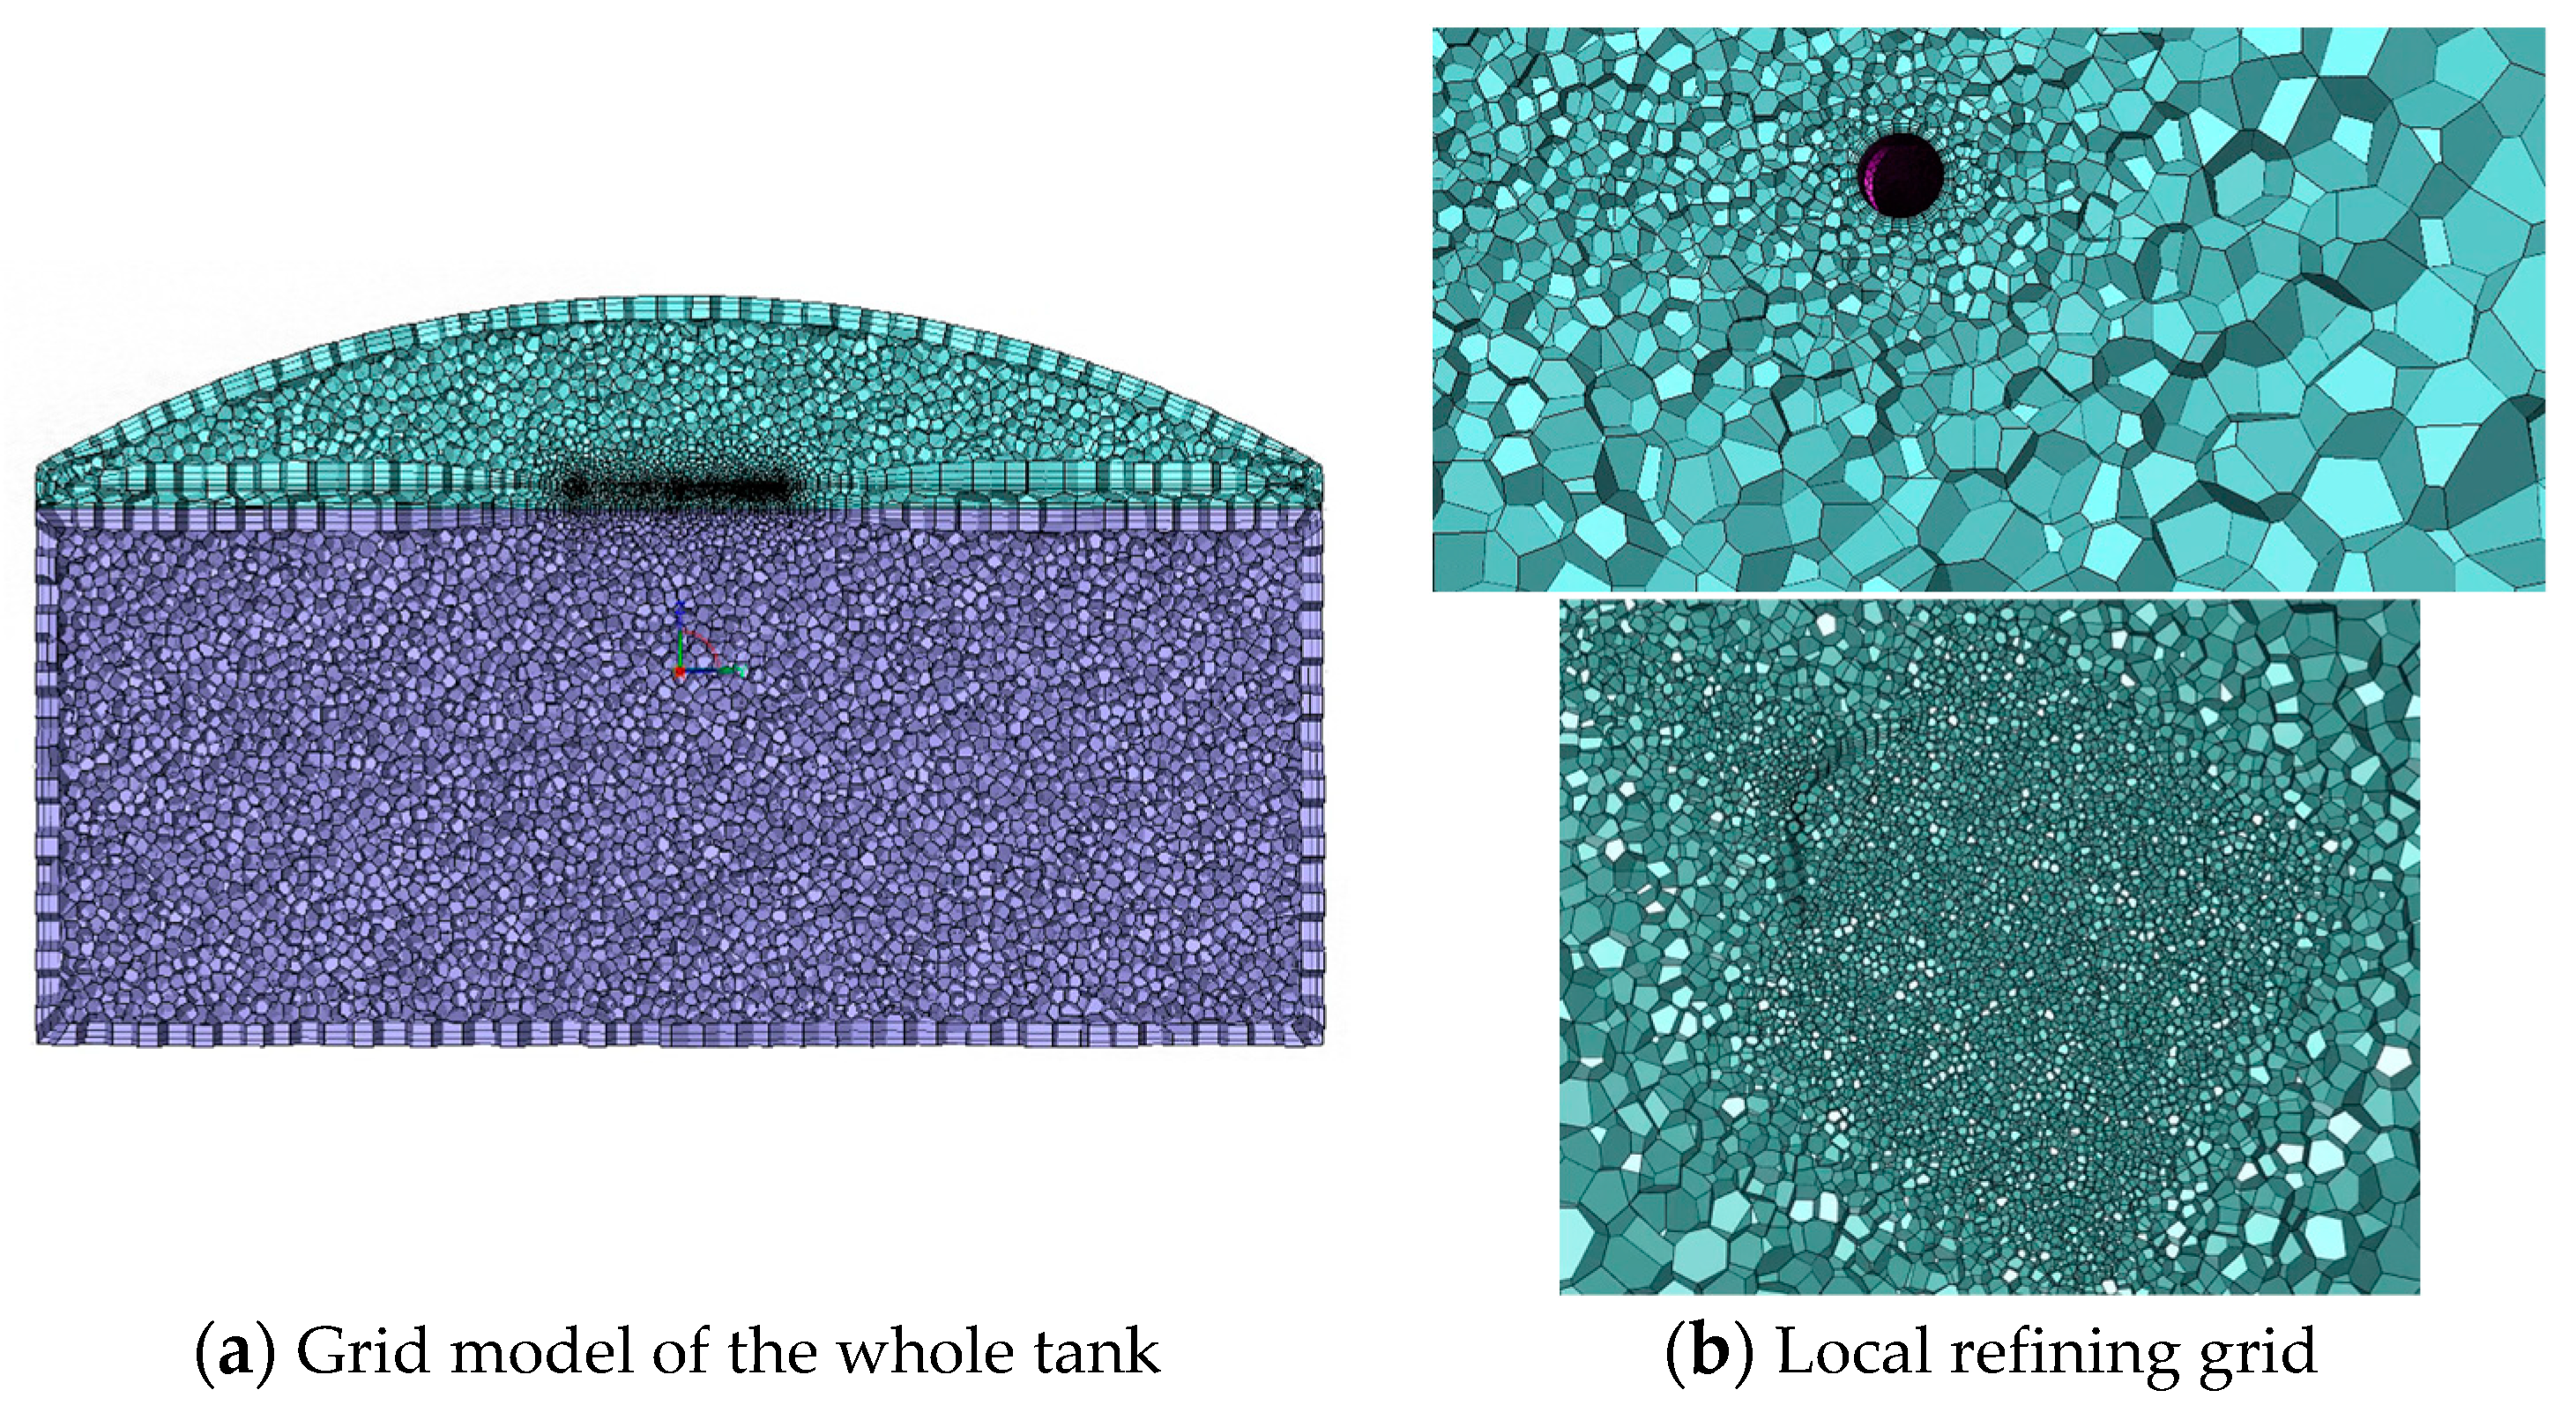
Figure 5 shows schematic geometric models for the pre-cooling simulation. In order to ensure the uniformity of the large LNG storage tank pre-cooling temperature, LNG is sprayed by nozzles. It is necessary to build a detailed nozzle model for pre-cooling simulation using a mixture model simulation. Since the nozzle diameter is only 5.8 mm and the tank diameter is about 82 m, the length-size difference is more than 3448 times. As a result, multi-scale simulations must be applied. In order to ensure the convergence and engineering accuracy of the solution, it is necessary to refine the local grid of the spray ring position. To accurately capture the geometric characteristics of the spray ring, the size of the face is 1/20 of the minimum perimeter of the spray ring. To accurately capture the temperature and velocity gradient changes near the nozzle, the body-of-influence method was used to refine the nozzle position. The body size was finally determined to be 8 mm after grid independence verification by comparing the temperature changes shown in Figure 6b. The element number of the final model reached 5.6 million, as shown in Figure 6a. As the size scale difference between nozzles and tanks is huge, convergence of the simulation is very hard to achieve. Because of the huge amount of computation in the mixture model, it is not suitable for the calculation of digital twin data as it is difficult to meet the requirements of the digital twin samples.
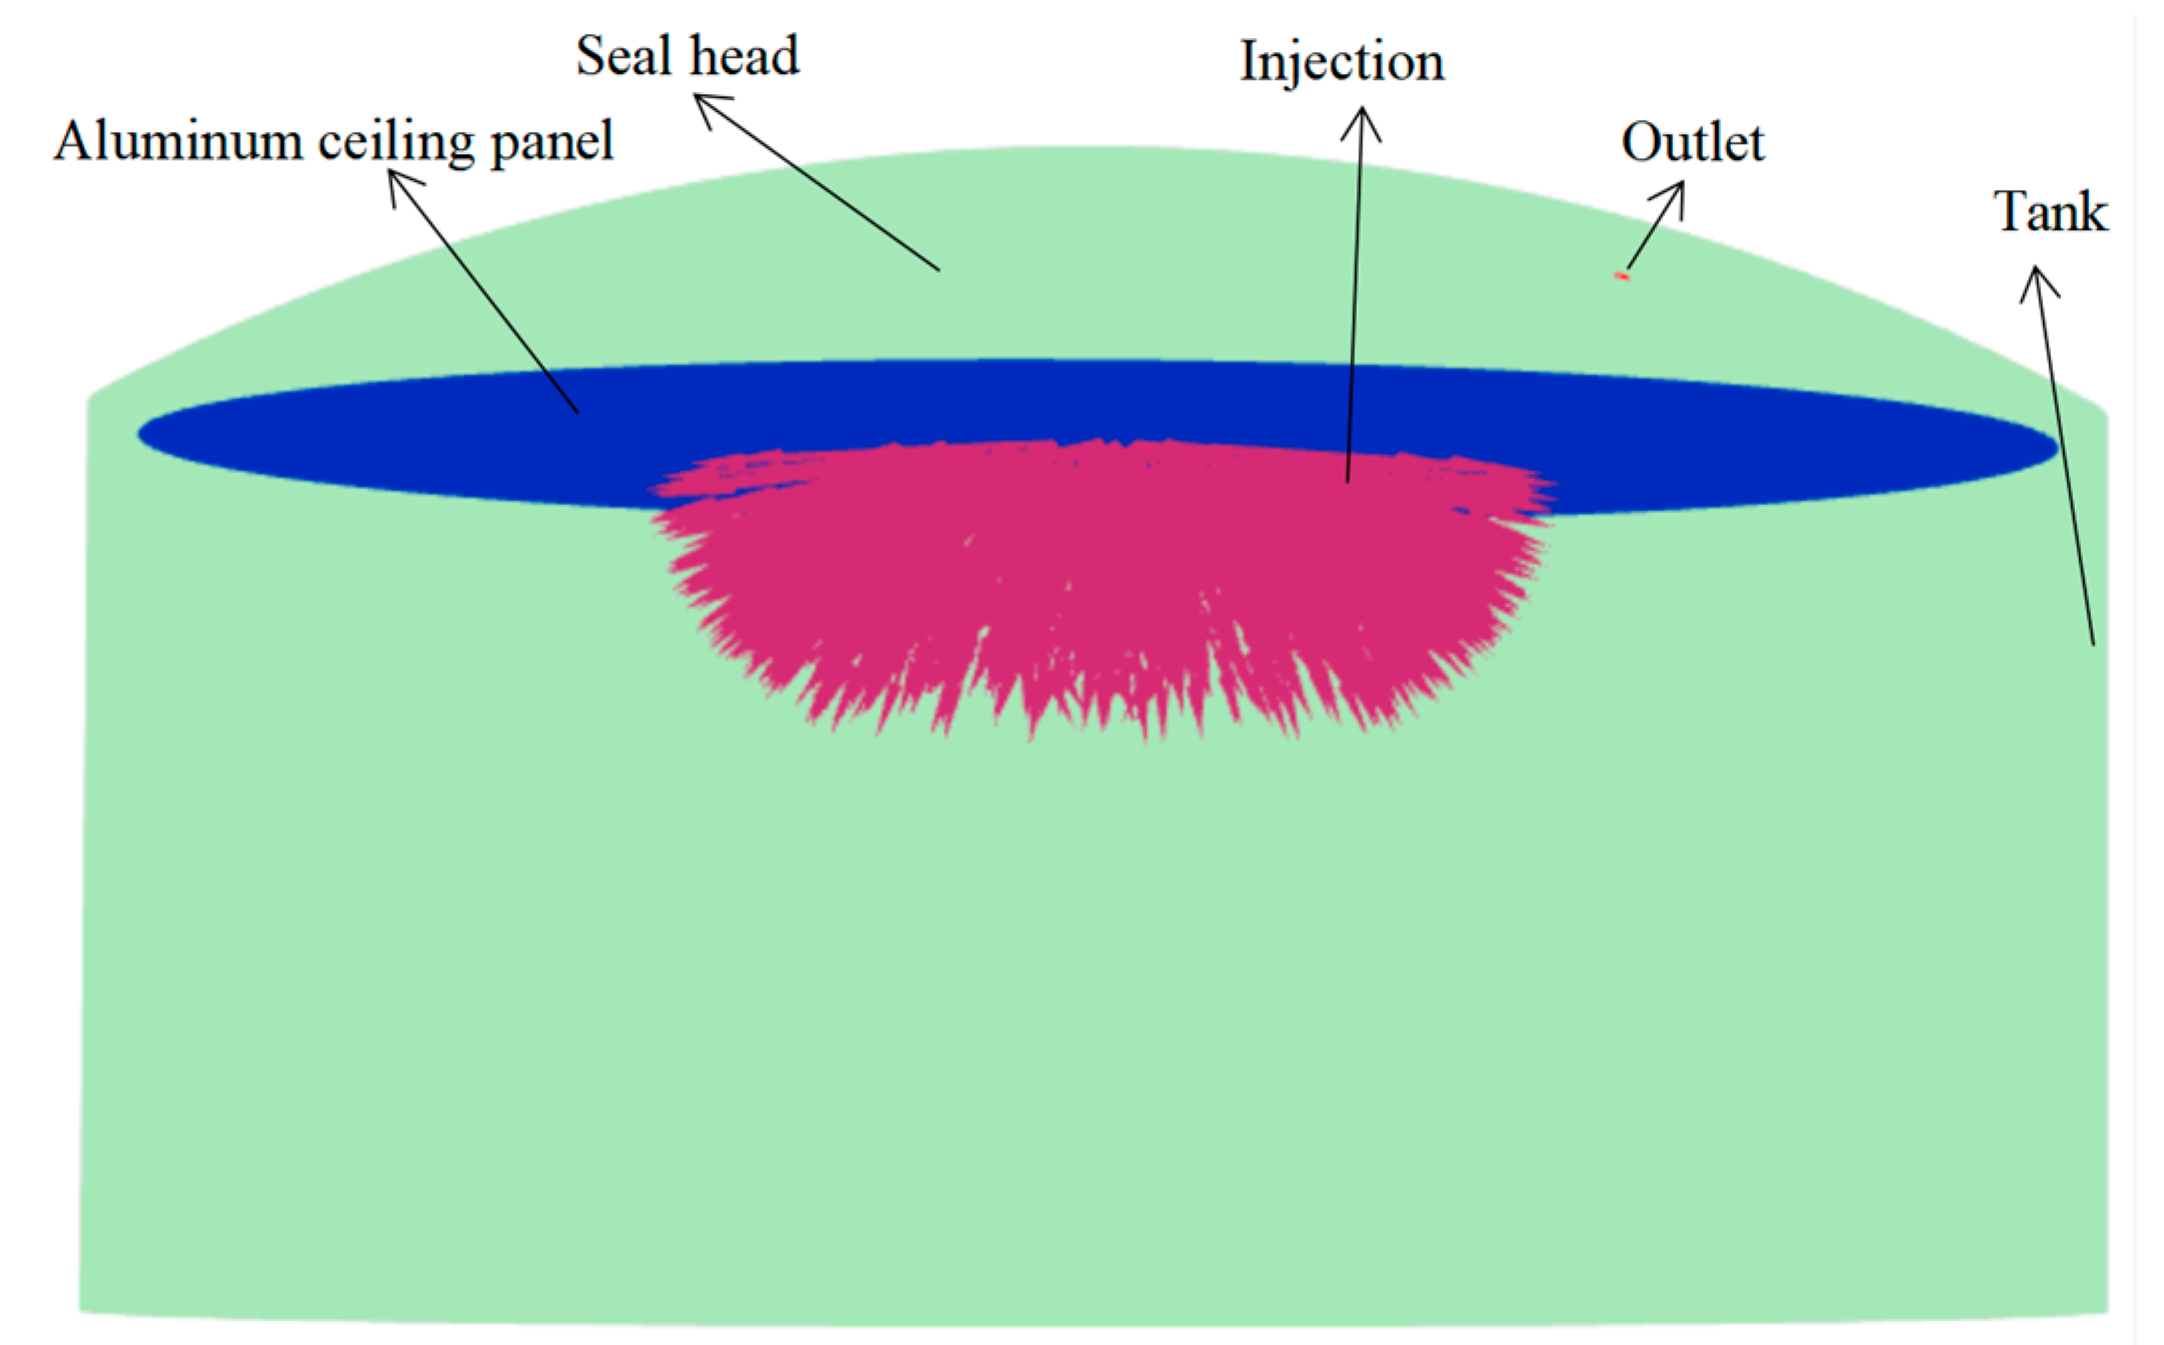
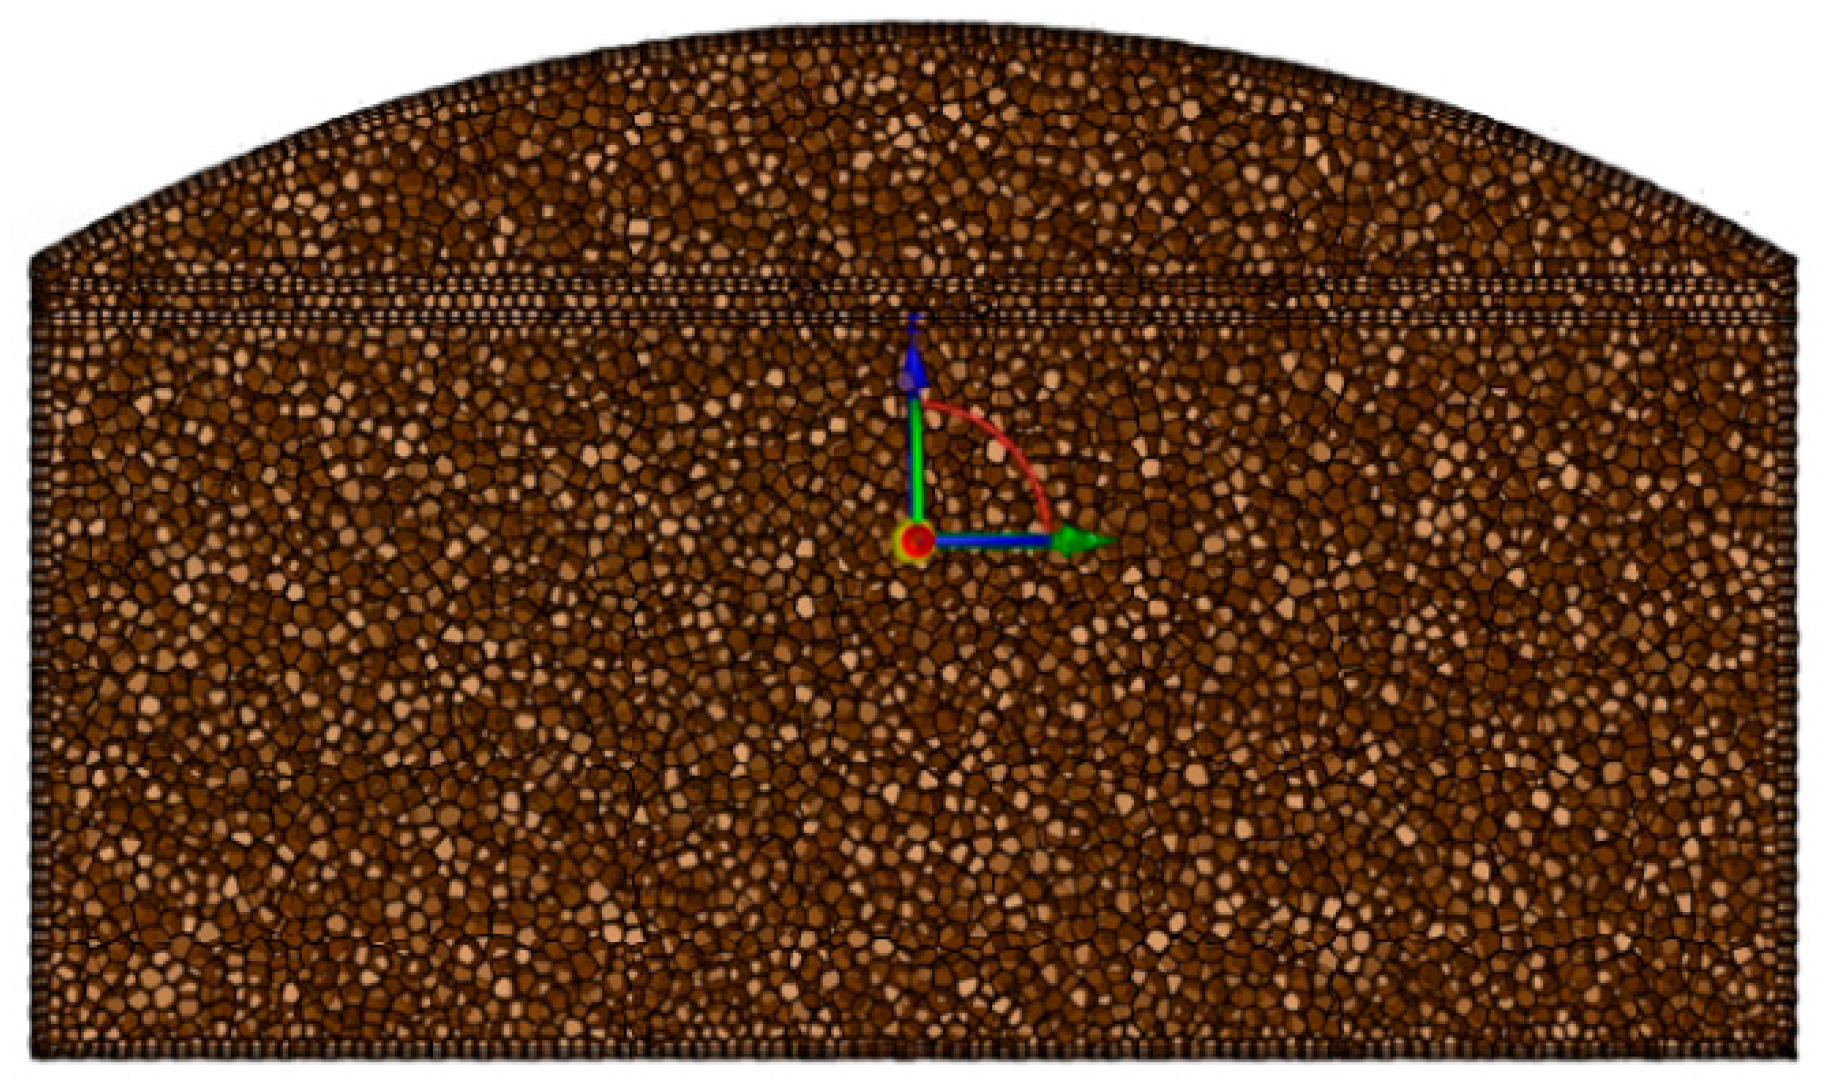
In the DPM simulation, injection is used instead of a spray inlet; thus, the storage tank model can be greatly simplified, as shown in Figure 7. By applying DPM, the multi-scale computation is eliminated, and the number of grids is reduced, as shown in Figure 8. The convergence of the solution and the time step for the solution are improved. The solving efficiency is greatly enhanced, and the solving time is shortened.

4.2. Comparison of Simulation Methods

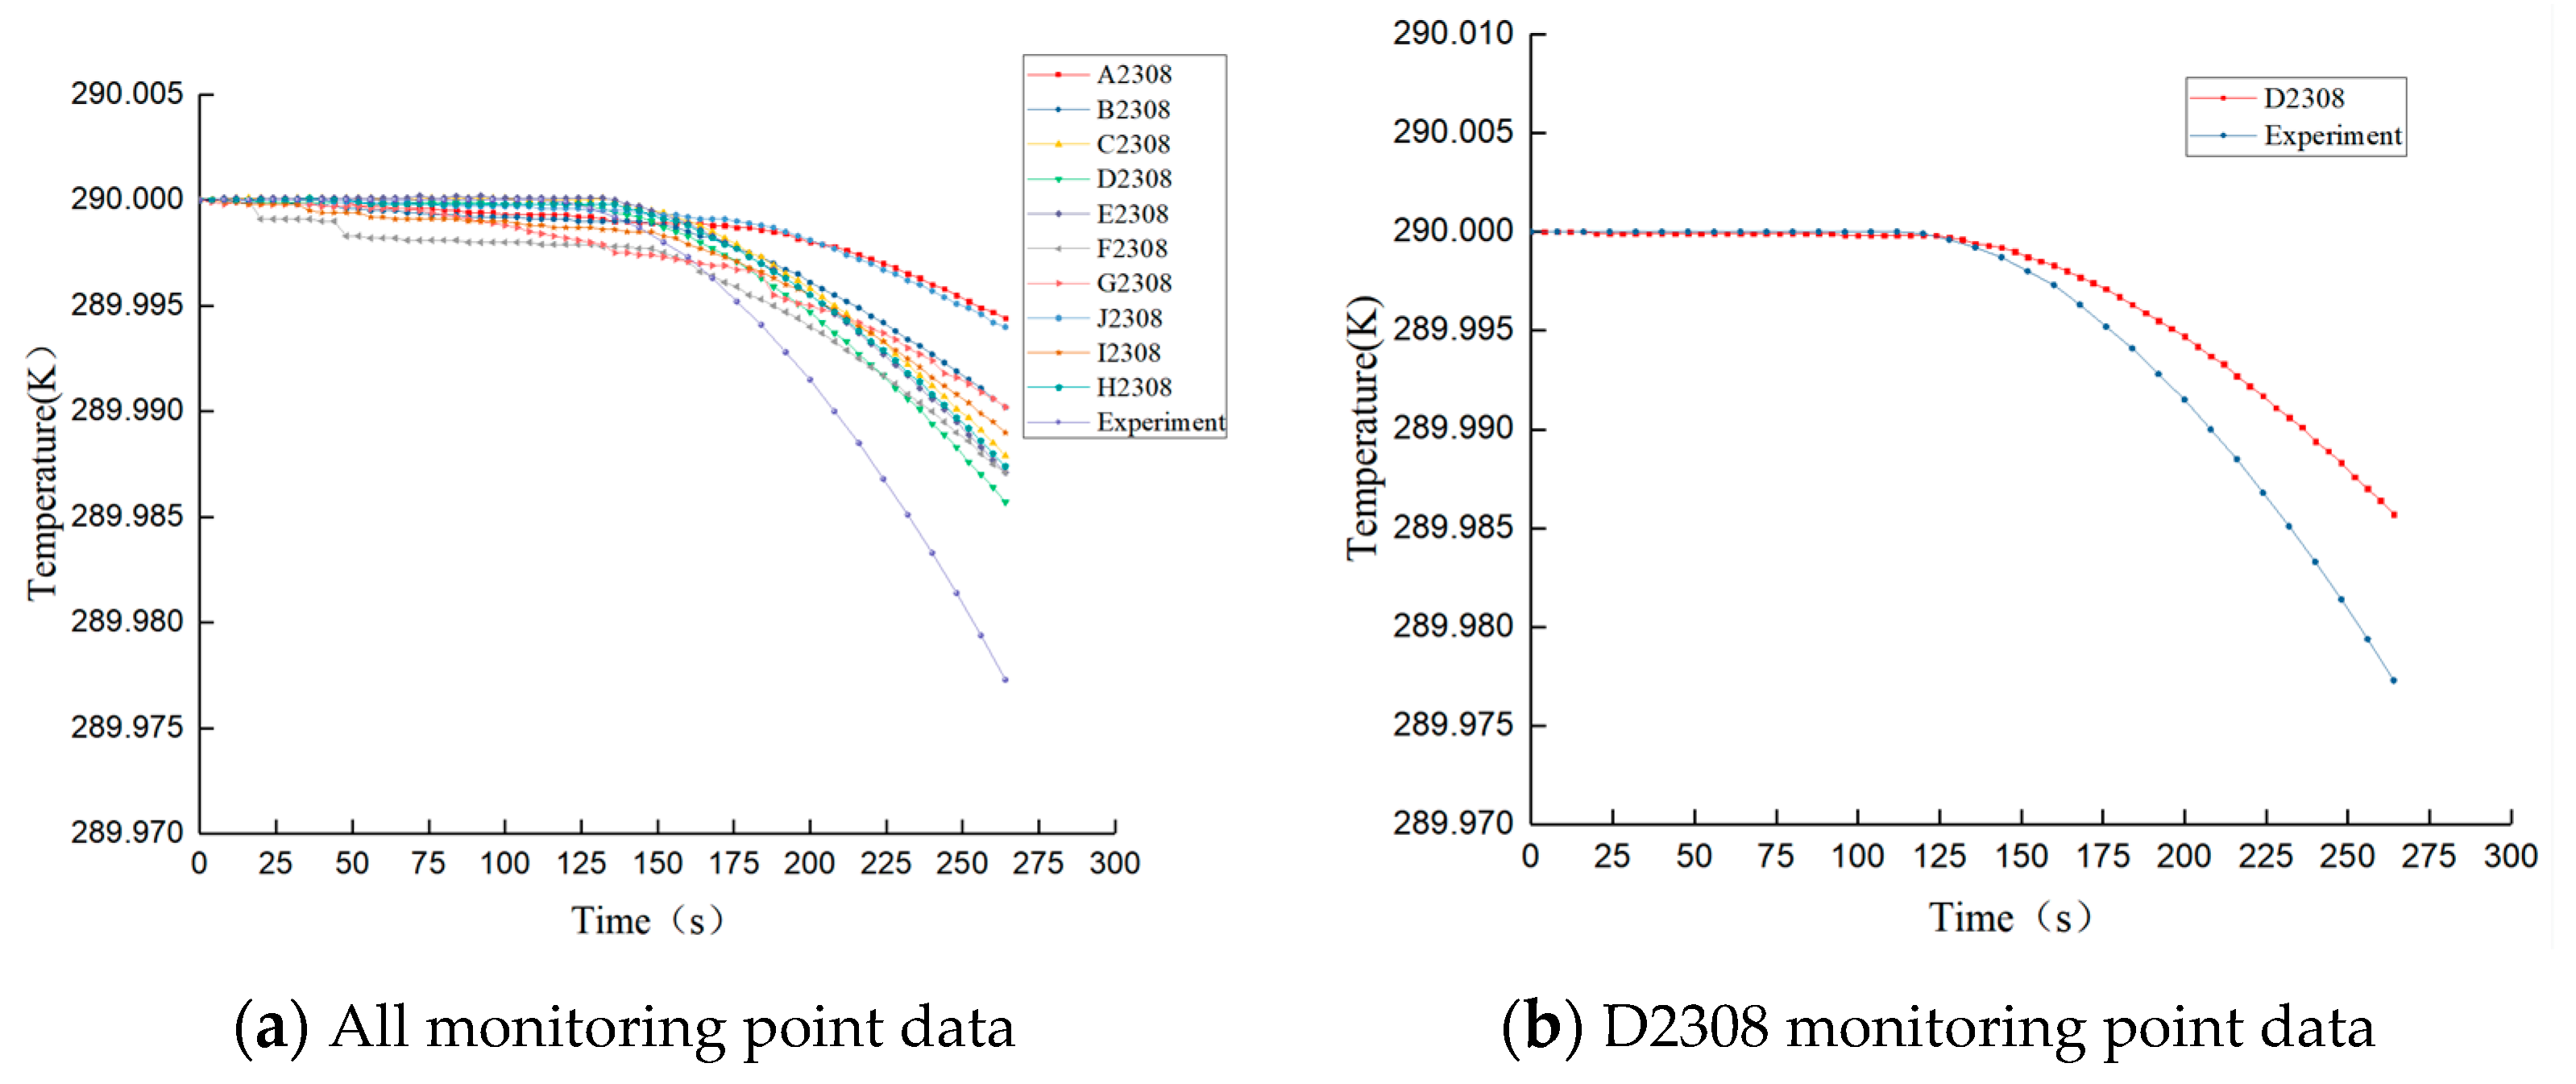
Figure 9 shows the temperature-drop curves of 10 monitoring points within 300 s obtained with the mixture model. The mixture model simulation results show that the temperature drop rates at the monitoring points were much different compared with the experimental rates. Figure 10 shows the temperature-drop curves for the test and DPM simulation; clearly, the differences are much smaller.
The ultra-large type of LNG tank is pre-cooled by a spray ring. The pre-cooling process involves spraying, atomization, phase transformation, etc. If the mixture model was used for analysis, the Navier–Stokes equation needs to be solved for both gas and liquid phases, which makes it hard to accurately capture the atomization phenomenon of the nozzles that affected the heat transfer efficiency and temperature uniformity. The low-temperature gas falls too fast to the bottom, causing the temperature drop rate at the bottom center position to be too fast, as shown in Figure 11. According to the field test data, during the whole pre-cooling process, the temperature difference between the two sensors is less than 10 k. The calculation results of the mixture model simulation are not so consistent with reality.
In the DPM simulation, the gas is treated as a continuum by solving the Navier–Stokes equations, while the LNG particles are treated by tracking a large number of droplets through the calculated flow field using a Lagrangian reference frame [19]. The LNG particles can exchange momentum, mass, and energy with the gas. DPM simulation predicts the trajectory of a discrete-phase particle by integrating the force balance on the LNG particle. This force balance equates the particle inertia with the forces acting on the particle, which can be written as follows:
m p d u p d t = m p u u p τ r + m p g ρ p ρ ρ p + F
where m p is the particle mass; u is the fluid phase velocity; u p is the particle velocity, ρ is the fluid density; ρ ρ is the density of the particle; τ r is an additional force; F is the drag force; and m p u u p τ r is the droplet or particle relaxation time.
The LNG particle temperature is updated according to a heat balance that relates the sensible heat change in the LNG droplet to the convective and latent heat transfer between the droplet and the gas (Equation (2)).
m p C p d T p d t = h A p T T p d m p d t h f g + A p ε p σ θ R 4 T p 4
where C p is LNG particle heat capacity (J/kg-k); T p is LNG particle temperature (k); h is the convective heat transfer coefficient; T is the temperature of gas (k); d m p / d t is the rate of evaporation (kg/s); h f g is latent heat (J/kg); ε p is LNG particle emissivity (dimensionless); σ is the Stefan–Boltzmann constant of 5.67 × 10 8 W/m2·k4; and θR is the radiation temperature.
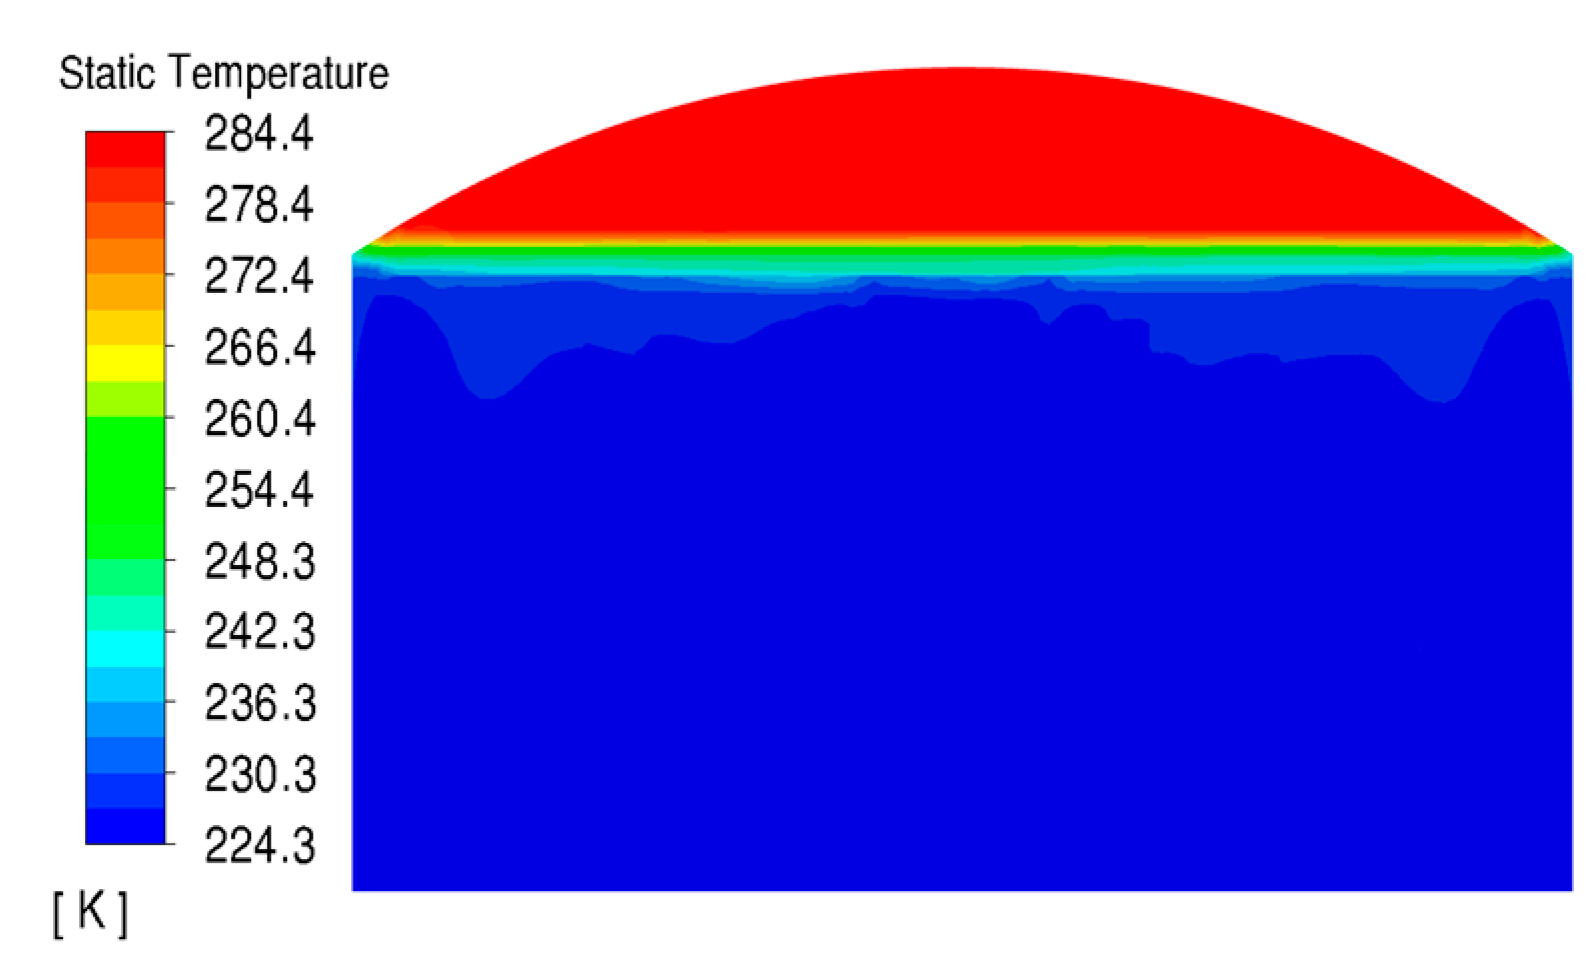
Using the DPM simulation, the atomized LNG particle diameter is considered in equations, which increases the contact area, improves the heat transfer efficiency, extends the residence time, and makes the temperature distribution more uniform [28,29,30]. The temperature distribution in the storage tank loading area is basically consistent with the field measurement as shown in Figure 12, and the result is closer to the physical reality.
After analyzing the complexity of geometric models, the number of grids, the difficulty of solving, and the calculation time, as listed in Table 1, the mixture model is not suitable for the sample calculation of digital twins. Using DPM simulation, the solution efficiency is higher with simpler geometry and fewer elements, which reduces the calculation amount from half a year to 5 days. The accuracy of DPM is more acceptable and can be used for the sample calculation of digital twins.

5. Solutions and Analysis

5.1. Physical and Boundary Conditions

The LNG tank is filled with dry N2 at ambient temperature before pre-cooling. The initial temperature of the LNG storage tank is 290 K. The initial pressure is 10 kPa, while the operating pressure is 101.325 kPa. The LNG tank insulation layers and concrete layer should be considered in the heat transfer of the tank. To reduce the analysis difficulties, this simulation adopts the shell conduction model, which can assign multiple layers of “virtual elements”. It should be pointed out that the shell model and solid model are basically the same for heat conduction in all directions under specific heat transfer conditions.
In this study, the droplet model in DPM combined with the heat transfer model, species transport model, and realizable k-ε model were used for tank pre-cooling analysis. Phase transition, heat transfer, gas displacement, and turbulent flow are considered in the analysis. The droplet model takes into account physical parameters such as temperature, droplet diameter, and spray cone angle.
The boundary conditions include the following:
(1)
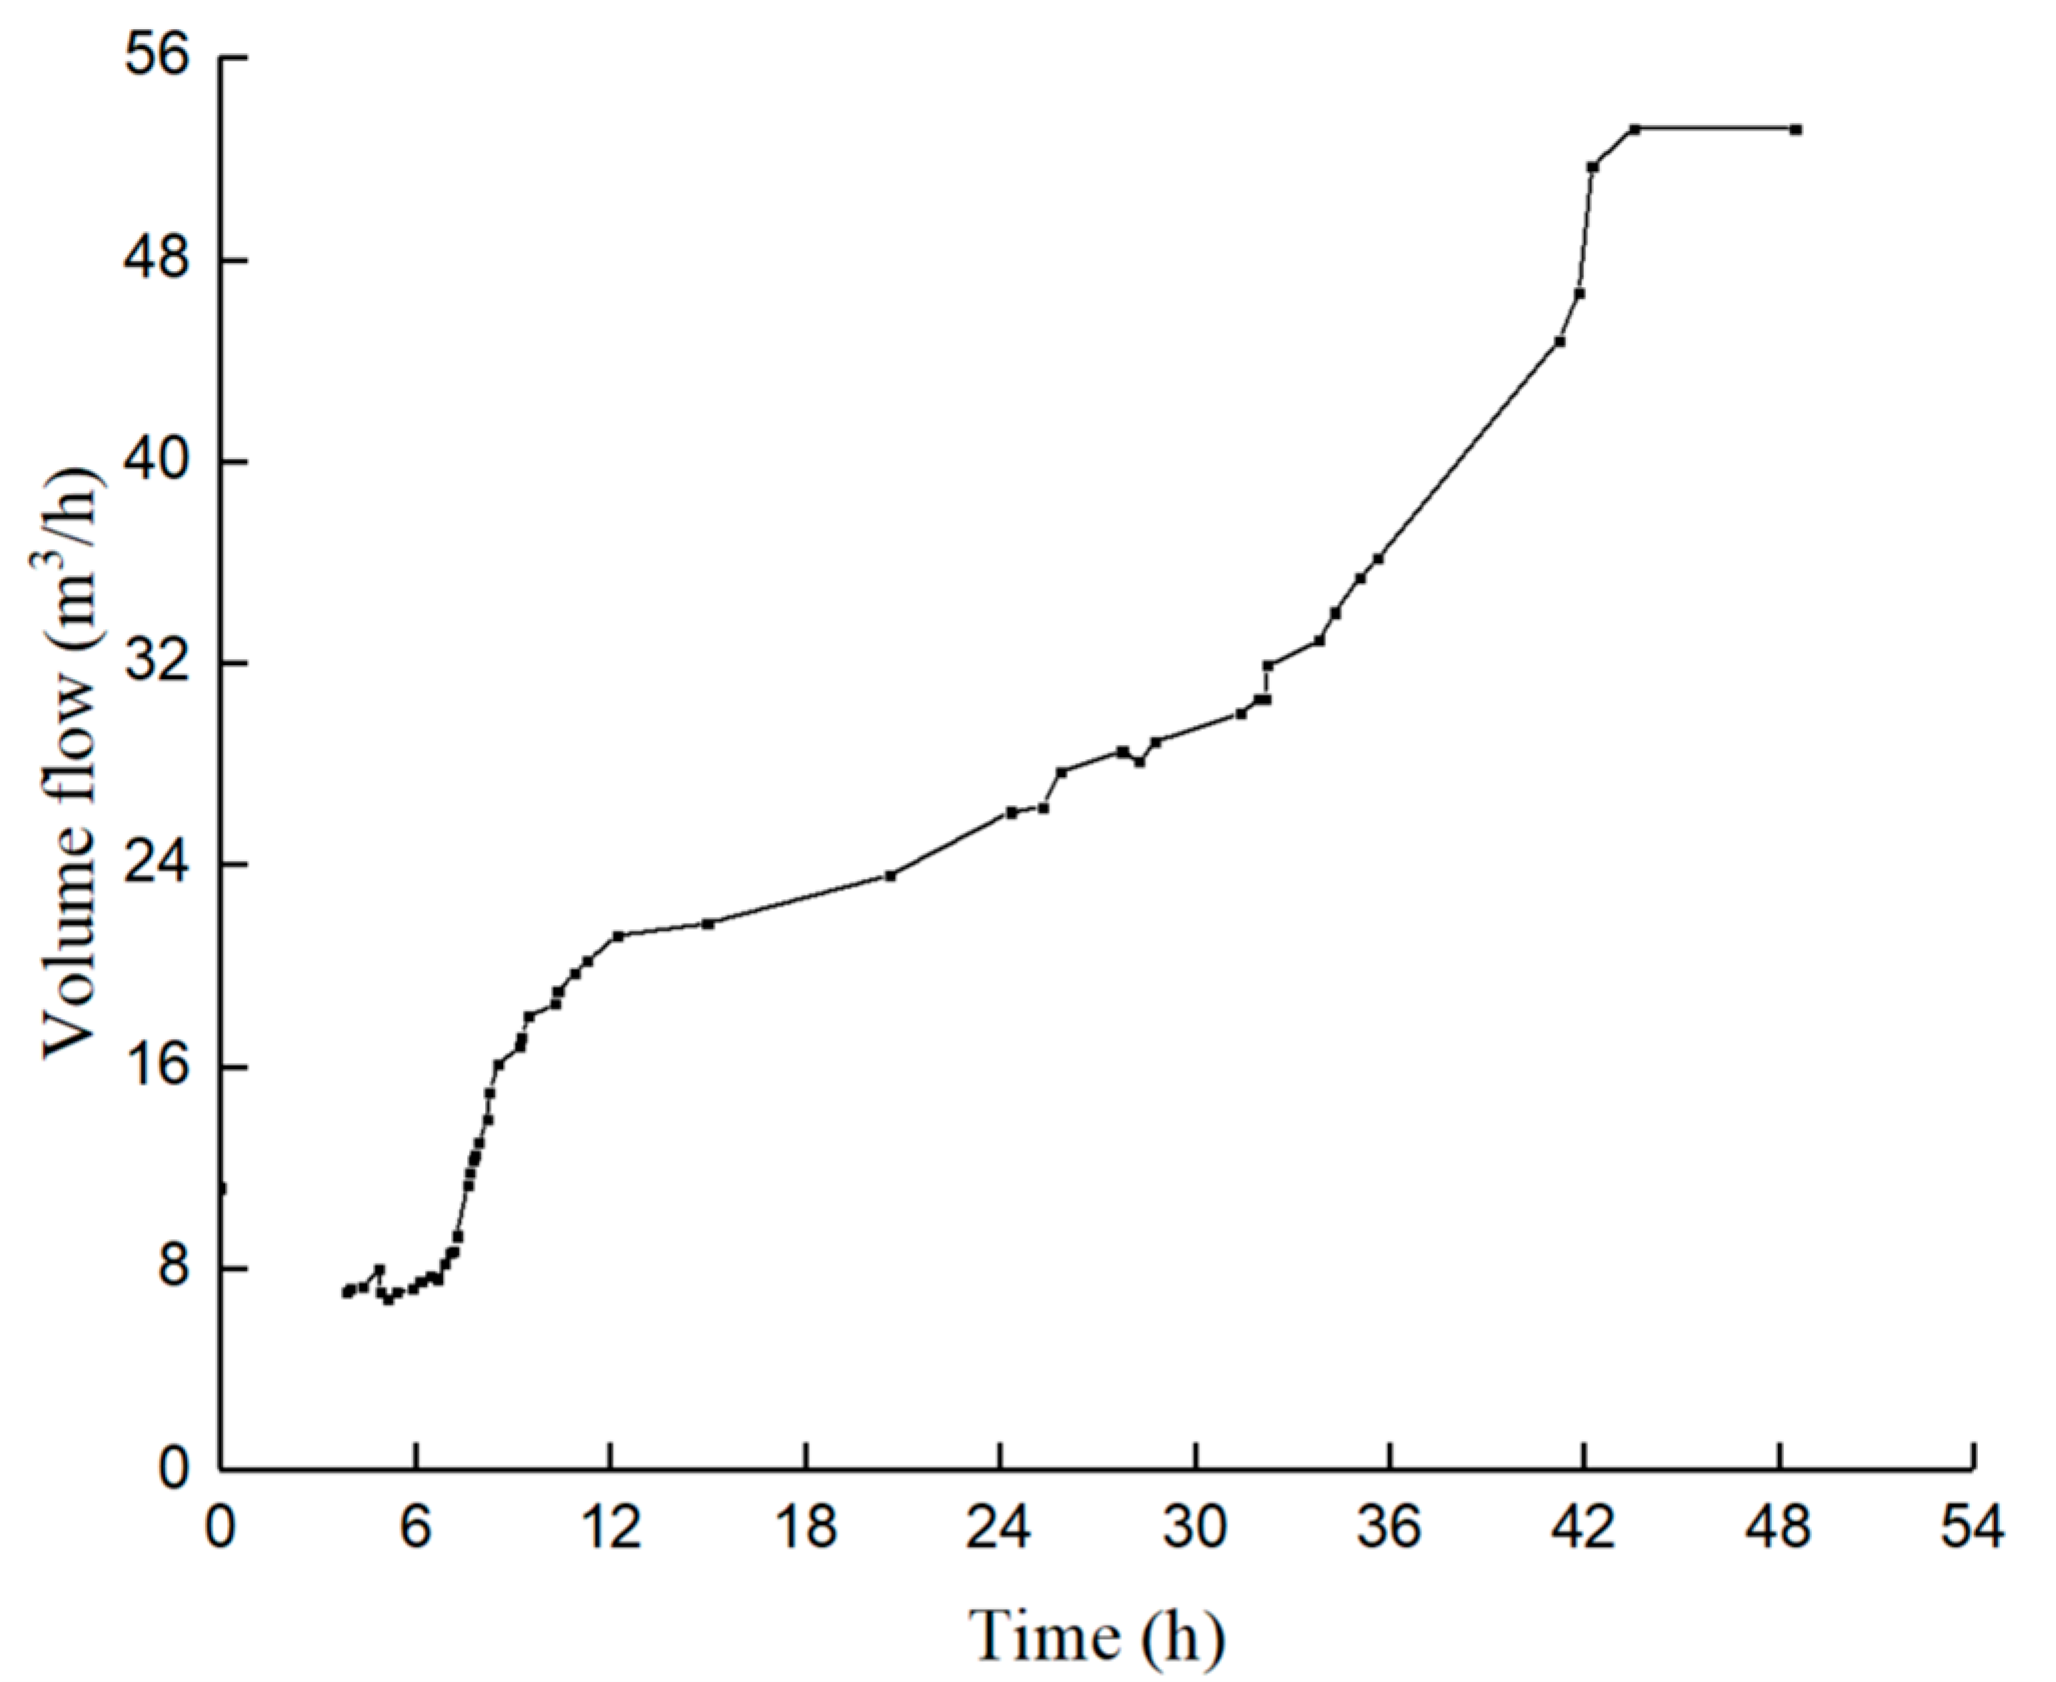
Injection boundary: The inlet flow rate of 111 k is shown in Figure 13. The detailed injection parameters are listed in Table 2.
(2)
Outlet boundary: The pressure of the outlet boundary is set to be the atmospheric pressure.
(3)
The initial temperature is 290 k.
(4)
The gravitational acceleration is 9.81 m/s2 along the negative Z direction.
(5)
The initial pressure in the tank is 10 kPa.
(6)
The wall condition is shell conduction. There are three layers, i.e., a metal plate, a foam glass block, and a concrete layer.
(7)
The thermal condition of the wall is convection. The heat transfer coefficient is 4.74 W/(m2·k) [31]. The free stream temperature is 290 k.

5.2. Results and Discussion

Through CFD simulation, the temperature-drop curve in the pre-cooling process of the LNG tank inside the LNG storage tank was obtained. Then, the calculation results of the DPM simulation are compared with the pre-cooling results of LNG field experiment monitoring data, as shown in Figure 14.
According to the pre-cooling process site of the LNG terminal, the temperature at the bottom of the tank drops from the ambient temperature to 112 K after about 50 h of pre-cooling. It is seen that the simulation results and the actual pre-cooling results are in good agreement, with the average relative error being less than 5% and the maximum error being less than 11%, as shown in Figure 14, implying the simulation results are reliable in engineering.
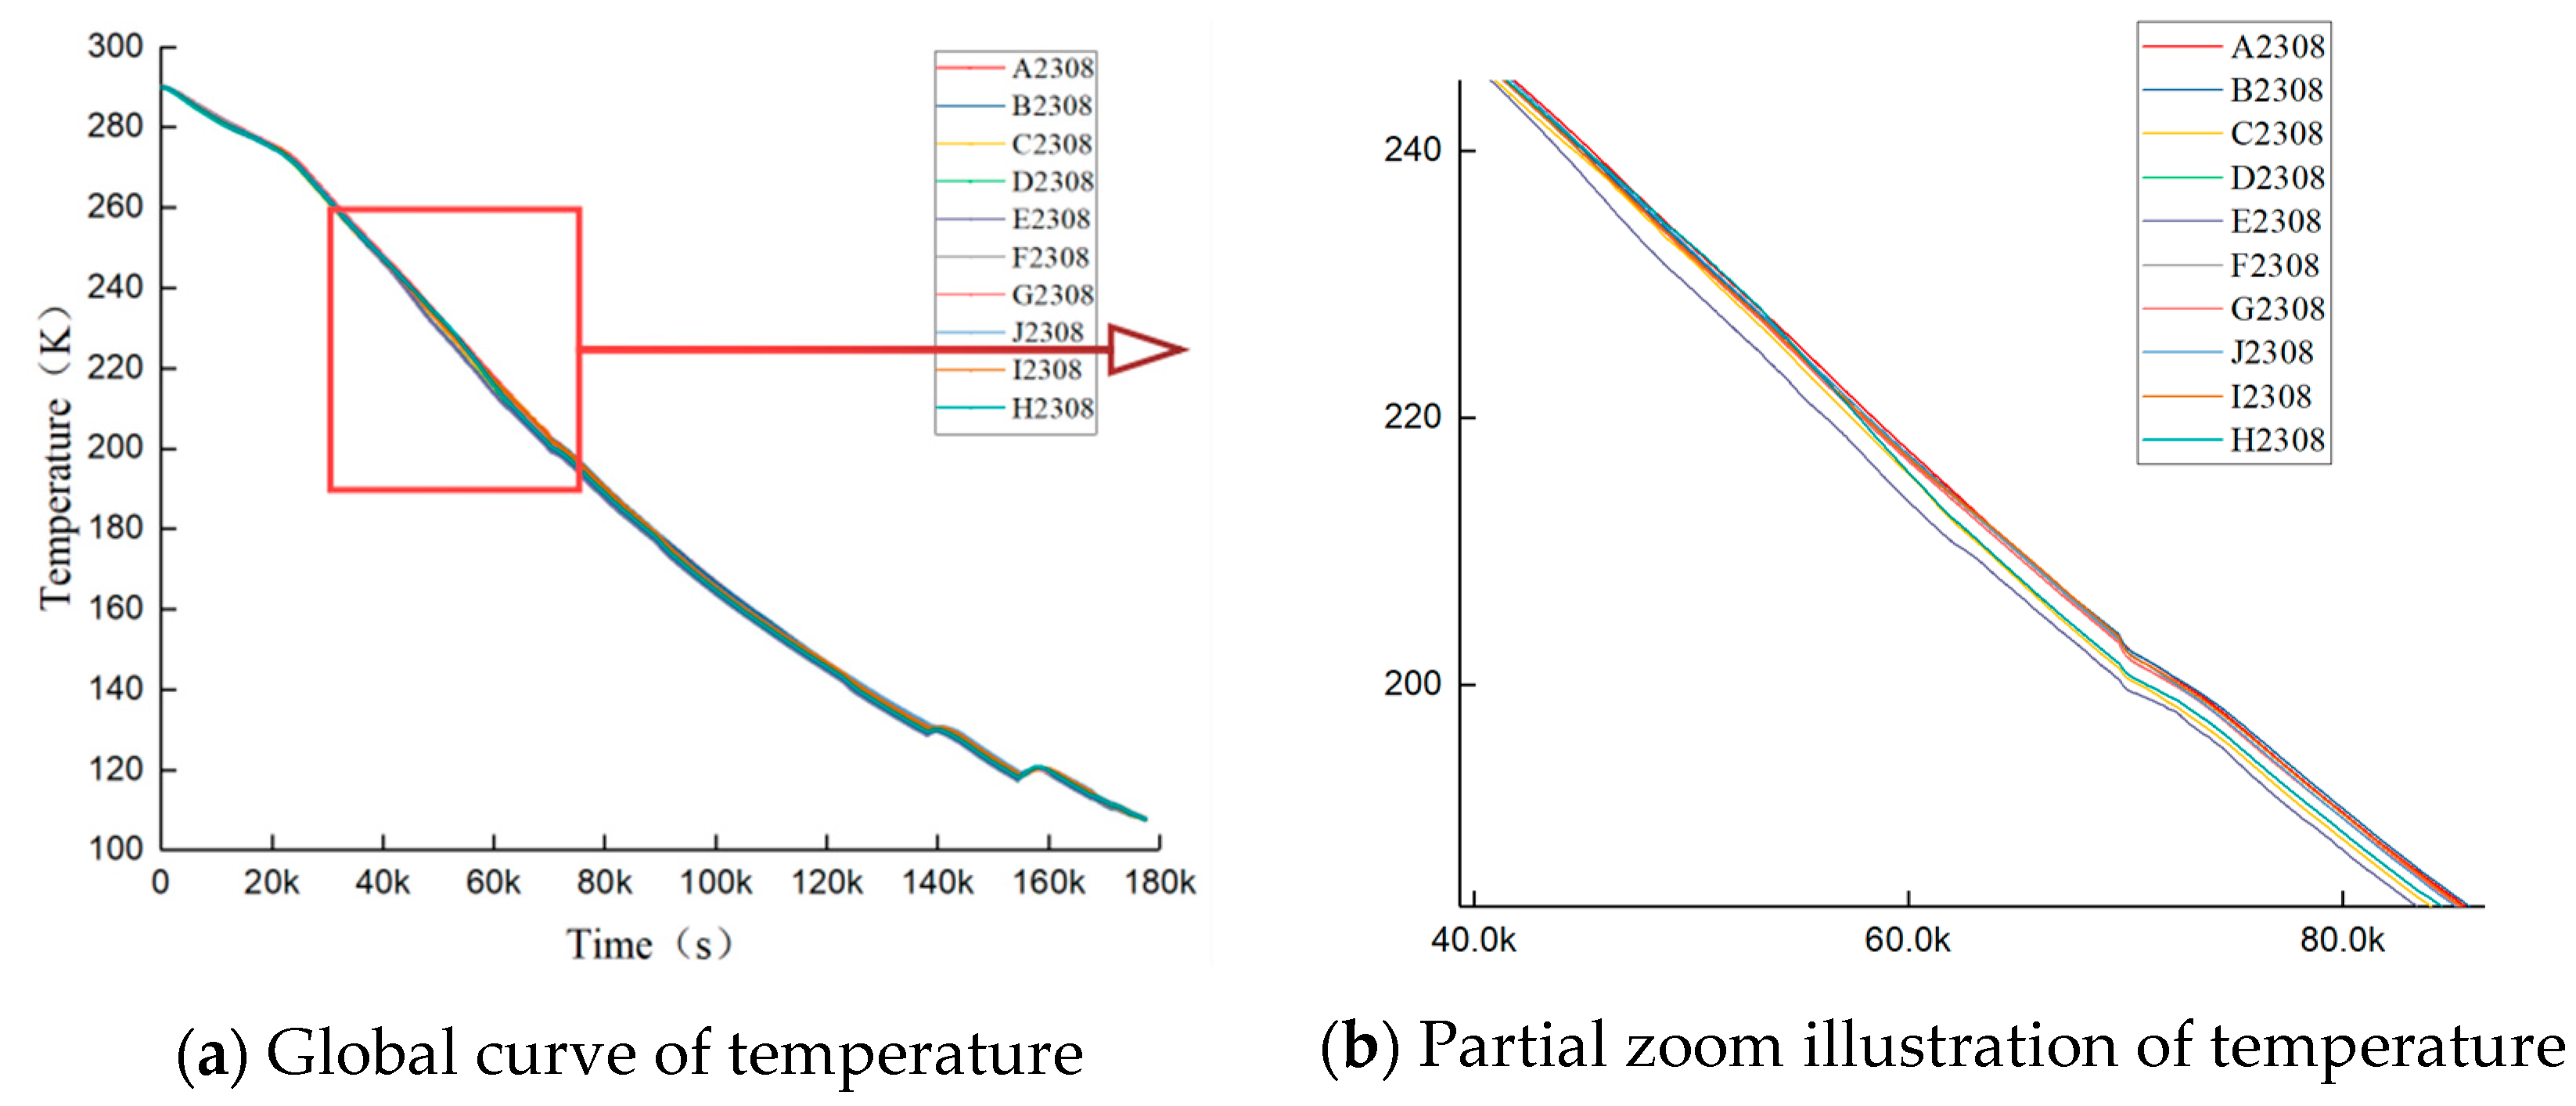
The temperature drop rate of each monitor is basically unanimous, which indicates that the temperature distribution is uniform during the spray pre-cooling process, as shown in Figure 15. The simulation results are consistent with actual physical phenomena.
That the following was found:
(1)
After 48.8 h of pre-cooling, the LNG storage tank temperature dropped from 290 k to 112.5 k, which is consistent with the field experiment results.
(2)
The pre-cooling can be divided into three stages, i.e., the early stage of the stable cooling stage, the middle rapid cooling stage, and the late slow cooling stage. The flow adjustment should be carried out in accordance with the three phases.
(3)
The diameter of the spray ring is close to the middle ring monitors (i.e., B2308, I2308, and F2308), whose temperature drop rate is the fastest. The temperatures of the inner monitors C2308, E2308, and H2308 and the outer monitors A2308, G2308, and J2308 are slower. However, the temperature difference is about 1~6 k, so the overall temperature drops in the LNG tank are uniform.
(4)
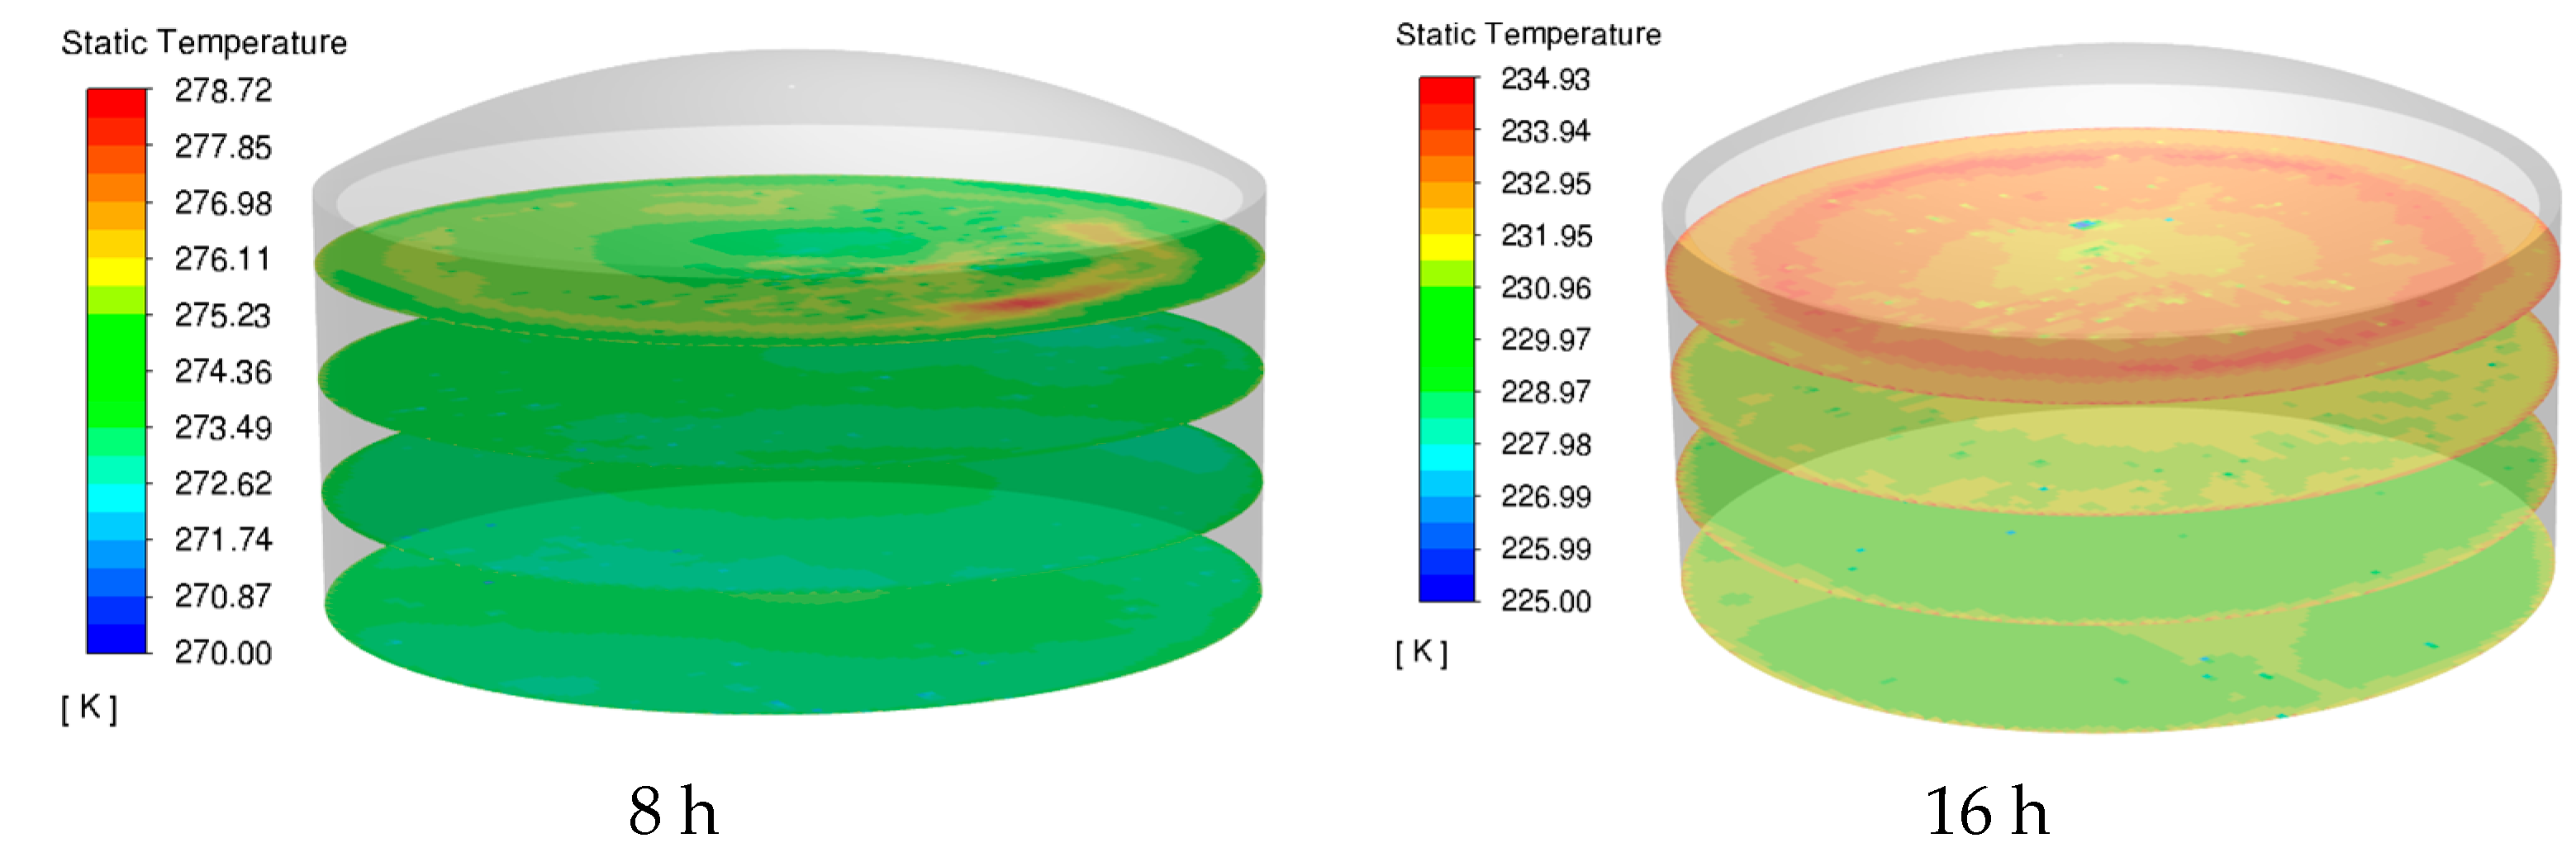
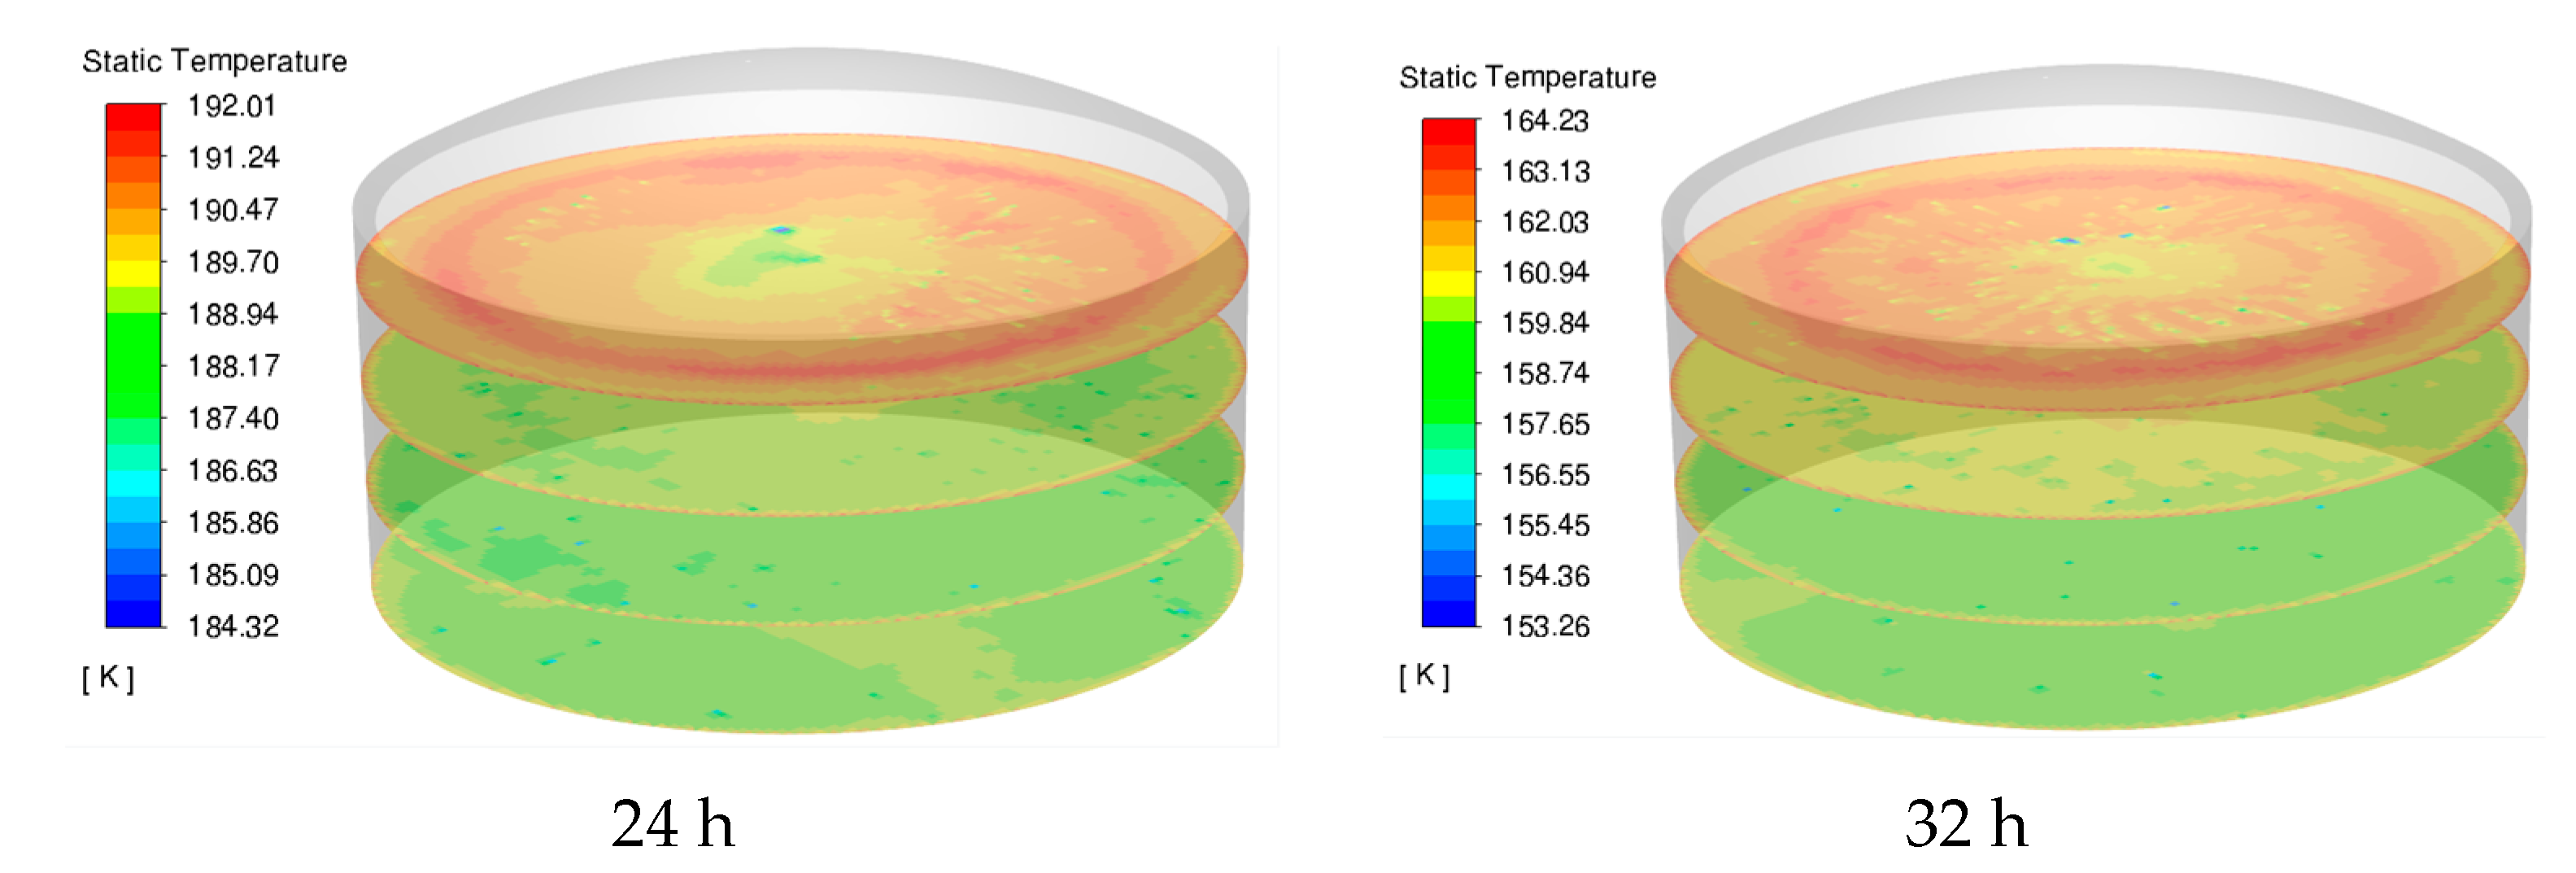
As shown in Figure 16, due to the density difference, low-temperature gas accumulates at the bottom, while high-temperature gas accumulates at the top. The overall temperature difference in the tank is about 10 k, which is consistent with the experiment temperature distribution.
(5)
The simulation model is within the engineering requirements for accuracy and can be used to calculate the digital twin samples of LNG tanks.

6. Conclusions

For simulating the pre-cooling process of a 160,000 m3 LNG tank in the LNG receiving station, a calculation method was established that meets the requirements of digital twins. The following conclusions can be drawn:
(1)
Both the mixture model and discrete phase model (DPM) are applied to simulate the pre-cooling process of a large LNG full-capacity tank, and their results were compared in terms of the geometric model complexity, the number of meshes, simulation efficiency, and the accuracy of the solution results.
(2)
For the simulation of LNG pre-cooling in the Tianjin Project, compared to the mixture model simulation, the DPM simulation has simpler geometry, fewer elements, and faster computation.
(3)
Compared with the experimental results, the maximum DPM simulation error is less than 11%, which meets the engineering requirements. Therefore, the DPM simulation can be well applied for simulating the pre-cooling process of large LNG tanks.
(4)
The DPM simulation can reduce the computation time to a few days, which can be used for sample calculations of digital twins. With enough samples, machine learning and ROM can be carried out to provide data for the construction of a digital twin platform for the pre-cooling of LNG storage tanks.

Author Contributions

Methodology, G.S., M.L. and Z.Q.; Software, B.Z. and Z.W.; Validation, C.Q.; Formal analysis, Y.Z.; Investigation, Y.Z.; Writing—original draft, Y.Z.; Writing—review & editing, C.Q., Z.Q., B.Z. and Z.W.; Supervision, C.Q.; Project administration, B.Z. All authors have read and agreed to the published version of the manuscript.

Funding

This research received no external funding.

Data Availability Statement

The original contributions presented in the study are included in the article, further inquiries can be directed to the corresponding author.

Conflicts of Interest

Authors Guangzhi Shi, Mu Li were employed by the company CNOOC Energy Development Co., Ltd. Author Baohe Zhang was employed by the company Offshore Oil Engineering Co,. Ltd. The remaining authors declare that the research was conducted in the absence of any commercial or financial relationships that could be construed as a potential conflict of interest.

References

  1. Yan, F.Y.; Geng, J.J.; Rong, G.X.; Sun, H.; Zhang, L.; Li, J.X. Optimization and Analysis of an Integrated Liquefaction Process for Hydrogen and Natural Gas Utilizing Mixed Refrigerant Pre-Cooling. Energies 2023, 16, 4239. [Google Scholar] [CrossRef]
  2. Khan, N.B.N.; Barifcani, A.; Tade, M.; Pareek, V. A case study: Application of energy and exergy analysis for enhancing the process efficiency of a three stage propane pre-cooling cycle of the cascade LNG process. J. Nat. Gas Sci. Eng. 2016, 29, 125–133. [Google Scholar] [CrossRef]
  3. He, T.B.; Liu, Z.; Ju, Y.L.; Parvez, A.M. A comprehensive optimization and comparison of modified single mixed refrigerant and parallel nitrogen expansion liquefaction process for small-scale mobile LNG plant. Energy 2019, 167, 1–12. [Google Scholar] [CrossRef]
  4. Soujoudi, R.; Manteufel, R. Thermodynamic. Economic and Environmental Analyses of Ammonia-Based Mixed Refrigerant for Liquefied Natural Gas Pre-Cooling Cycle. Processes 2021, 9, 1298. [Google Scholar] [CrossRef]
  5. Botão, R.P.; de Medeiros Costa, H.K.; dos Santos, E.M. Global Gas and LNG Markets: Demand, Supply Dynamics, and Implications for the Future. Energies 2023, 16, 5223. [Google Scholar] [CrossRef]
  6. Yang, X.; Lei, Q.; Zou, J.; Lu, X.; Chen, Z. Green and Efficient Recovery and Optimization of Waste Heat and LNG Cold Energy in LNG-Powered Ship Engines. Energies 2023, 16, 7957. [Google Scholar] [CrossRef]
  7. Zhang, Z.; Krishnan, P.; Jiao, Z. Developing a CFD heat transfer model for applying high expansion foam in an LNG spill—ScienceDirect. J. Loss Prev. Process Ind. 2021, 71, 104456. [Google Scholar] [CrossRef]
  8. Toftum, J.; Jørgensen, A.S.; Fanger, P.O. Upper limits for indoor air humidity to avoid uncomfortably humid skin. Energy Build. 1998, 28, 1–13. [Google Scholar] [CrossRef]
  9. Li, J.J.; Teng, H.; Zhang, X.M.; Li, A.H.; Liang, R.C.; Cao, X.W. Numerical simulation of the 160,000 m3 LNG tank pre-cooling. Cryogenics 2019, 47, 17–23. [Google Scholar]
  10. Wan, H.Y.; Zeng, T. Application and Development of LNG Low-temperature Tanks. Petro-Chem. Equip. Technol. 2016, 37, 4–8. [Google Scholar]
  11. Wang, C.; Yang, G.S.; Zhang, B. Research of Cooling Technology for New LNG Tank of Floating LNG Terminal. Petrochem. Ind. Technol. 2015, 22, 169. [Google Scholar]
  12. Li, H.N.; Wu, Z.X.; Gao, Y.F. Approach to Cooling Technology of LNG Large-sized Low-temperature Tank. Cryog. Technol. 2012, 1, 29–31. [Google Scholar]
  13. Zhang, B.H. Research of Cooling Technology for 30,000 m3 LNG Tank of Floating LNG Terminal. Chem. Eng. Oil Gas 2017, 46, 44–47. [Google Scholar]
  14. ISO-TR24464; Automation Systems and Integration—Industrial Data—Visualization Elements of Digital Twins. ISO: Geneva, Switzerland, 2020.
  15. Xie, H.S.; Huang, Z.X.; Liu, Y.; Zhu, Z.M.; Wang, Z. Implementation of a mixed digital twin monitoring model for deformation field of marine pressure bearing structures. Chin. J. Ship Res. 2024, 19, 52–61. [Google Scholar]
  16. Zhang, Q.L.; Run, X. Process Simulation and Optimization of Arc Welding Robot Workstation Based on Digital Twin. Machines 2023, 11, 53. [Google Scholar] [CrossRef]
  17. Gu, W.; Zhang, W.Y.; Wang, H. Digital twin virtual entity modeling for rolling bearing fatigue failure. Mach. Tool Hydraul. 2023, 51, 193–199. [Google Scholar]
  18. Lu, X.G.; Li, F.G. Real time load prediction of wind turbine based on digital twin. Mach. Electron. 2021, 39, 24–28. [Google Scholar]
  19. Yang, Y.L.; Sun, L.; Zhang, X.B. Analysis on the overall model framework of ship steam power based on digital twin. Chin. J. Ship Res. 2021, 16, 157–167. [Google Scholar]
  20. de López Diz, S.; López, R.M. A real-time digital twin approach on three-phase power converters applied to condition monitoring. Appl. Energy 2023, 334, 120606. [Google Scholar]
  21. Yu, C.; Tang, X.B.; Gaidai, O.; Wang, F. Digital twin real time monitoring method of turbine blade performancebased on numerical simulation. Ocean. Eng. 2022, 263, 112347. [Google Scholar]
  22. Chen, S.X.; Li, Z.R.; Wang, Y.Q.; Guan, H.L. Construction and application of Digital Twin model of pipeline. Digit. Intelligentization 2021, 40, 643–650. [Google Scholar]
  23. Yu, B.; Zhu, W.J. Application exploration of digital twin technology in petrochemical industry. Chem. Ind. Eng. Prog. 2019, 38, 278–282. [Google Scholar]
  24. Uwitonze, H.; Kim, A.; Kim, H.; Brigljević, B.; Ly, H.V.; Kim, S.S.; Upadhyay, M.; Lim, H. CFD simulation of hydrodynamics and heat transfer characteristics in gas–solid circulating fluidized bed riser under fast pyrolysis flow condition. Appl. Therm. Eng. 2022, 212, 118555. [Google Scholar] [CrossRef]
  25. de Oliveira, J.P.S.; Alves, J.V.B. Coupling a neural network technique with CFD simulations for predicting 2-D atmospheric dispersion analyzing wind and composition effects. J. Loss Prev. Process Ind. 2022, 80, 104930. [Google Scholar] [CrossRef]
  26. Molinaro, R.; Singh, J.S.; Catsoulis, S. Embedding data analytics and CFD into the digital twin concept. Comput. Fluids 2021, 214, 104759. [Google Scholar] [CrossRef]
  27. Meng, R. CFD–DPM Simulation Study of the Effect of Powder Layer Thickness on the SLM Spatter Behavior. Metals 2022, 12, 1897. [Google Scholar] [CrossRef]
  28. Zhang, L.H. Research on Pre-Cooling Process of Large Scale LNG Storage Tank; South China University of Technology: Guangzhou, China, 2019. [Google Scholar]
  29. Zhu, C.Y. Experimental investigation on gas-liquid mass transfer with fast chemical reaction in microchanne. Int. J. Heat Mass Transf. 2017, 114, 83–89. [Google Scholar] [CrossRef]
  30. Li, Y.Z.; Zhou, Y.H.; Xiao, Y.Q.; Yang, W.J. Study of gas-solid two-phase flow in pipeline elbows using an LES-DPM coupling method. Powder Technol. 2023, 413, 118012. [Google Scholar] [CrossRef]
  31. Zhang, J.R.; Liu, Z.Q.; Liu, W.Y. Experimental research on natural convective coefficient of concrete surface. Sichuan Build. Sci. 2007, 5, 1008–1933. [Google Scholar]
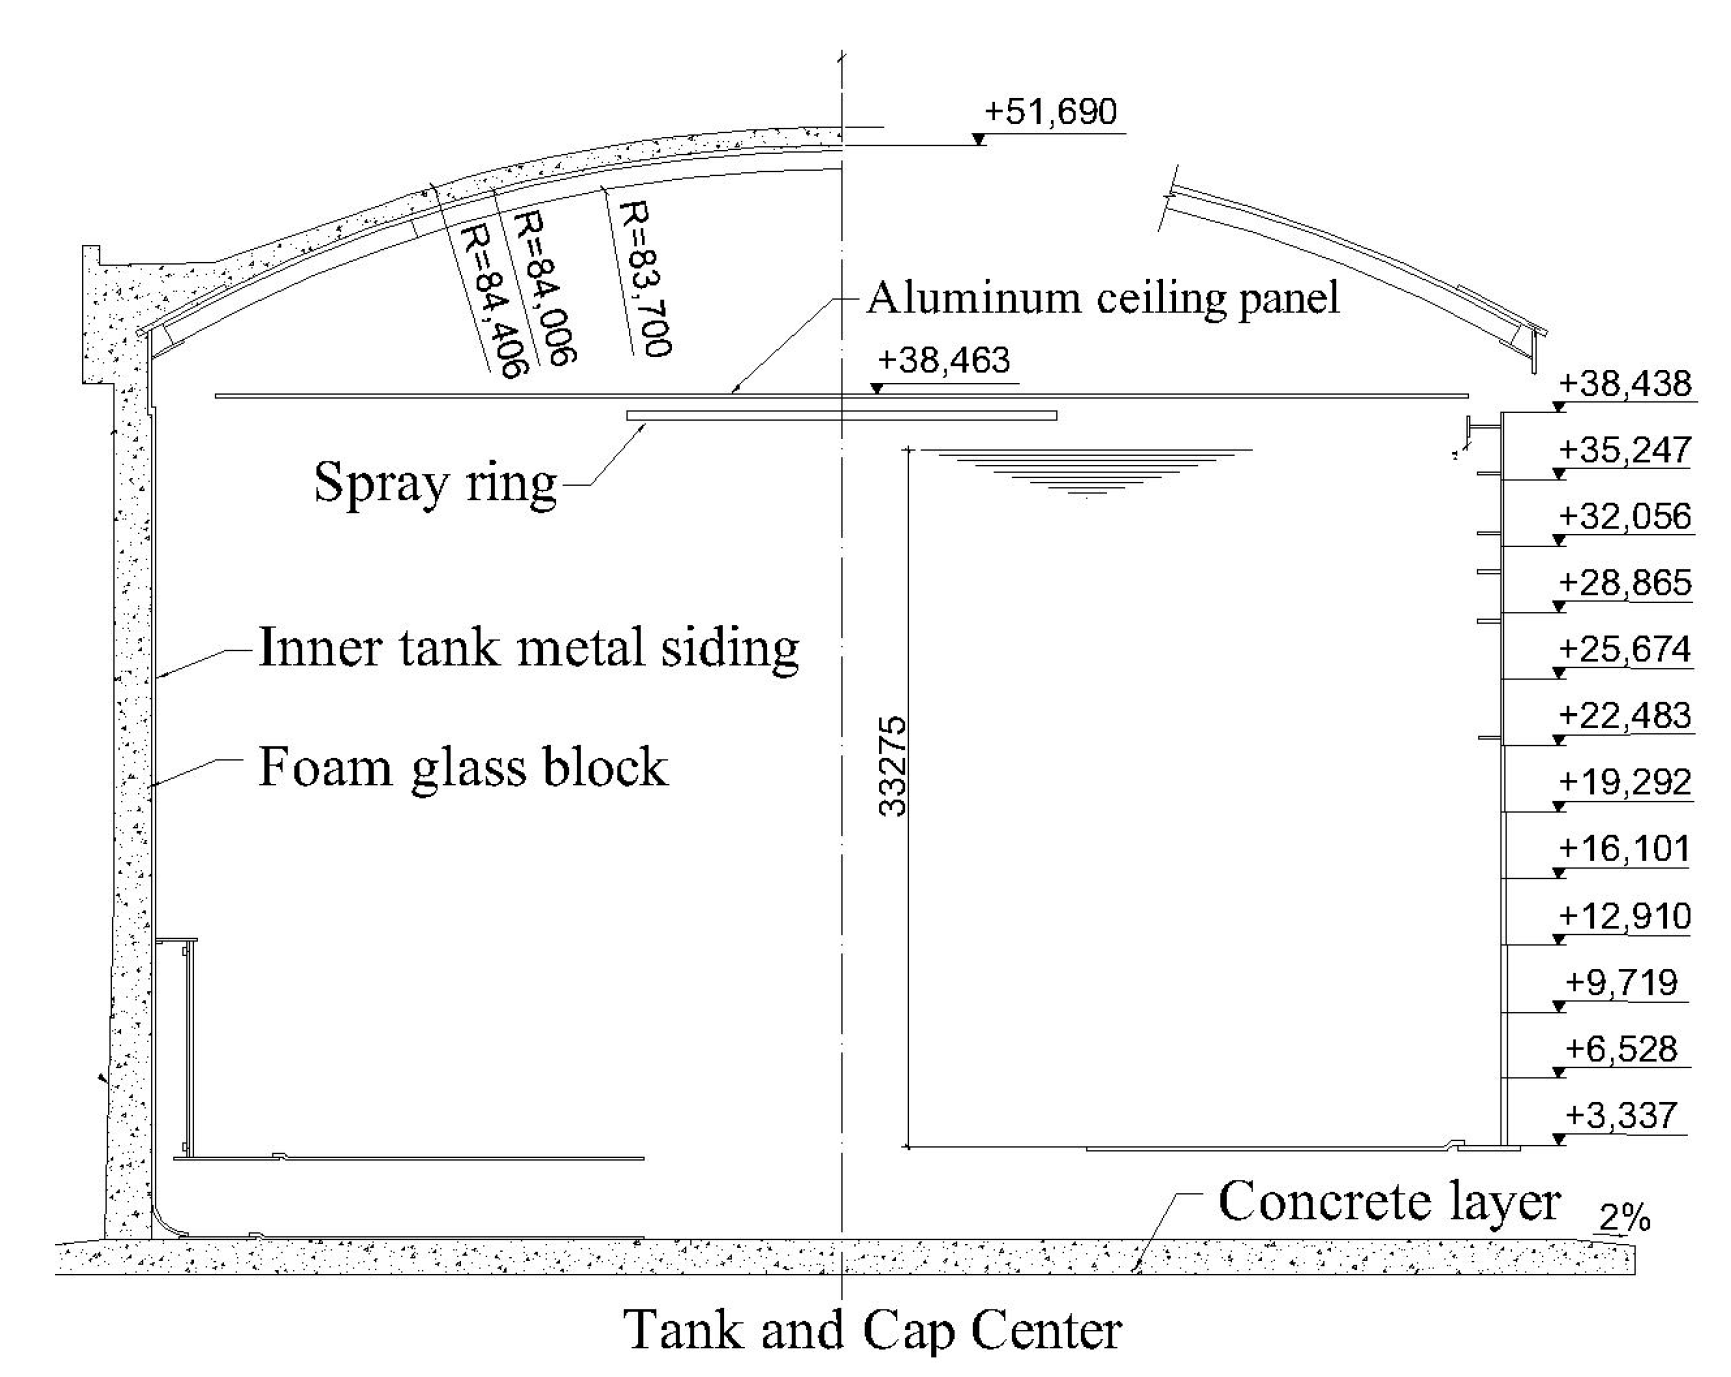
Figure 1. Structural diagram of the LNG storage tank.
Energies 17 03471 g001
Figure 2. Structural diagram of the spray ring and nozzle positions for the LNG storage tank.
Energies 17 03471 g002
Figure 3. Locations of the temperature sensors at the bottom of the tank.
Energies 17 03471 g003
Figure 4. Typical elements of a digital twin.
Energies 17 03471 g004
Figure 5. Schematic geometric models for the pre-cooling simulation.
Energies 17 03471 g005
Figure 6. Grid models for the pre-cooling simulation.
Energies 17 03471 g006
Figure 7. Storage tank and jet nozzles simulated in DPM.
Energies 17 03471 g007
Figure 8. Grid model in DPM.
Energies 17 03471 g008
Figure 9. The temperature-drop curves for the test and mixture model simulation.
Energies 17 03471 g009
Figure 10. The temperature-drop curves for the test and DPM simulation.
Energies 17 03471 g010
Figure 11. Contours of the temperature inside the tank with the mixture model.
Energies 17 03471 g011
Figure 12. Contours of the temperature inside the tank with the DPM.
Energies 17 03471 g012
Figure 13. The pre-cooling flow rate of the LNG tank at the project site.
Energies 17 03471 g013
Figure 14. Comparison of temperature-drop curves between simulation and test.
Energies 17 03471 g014
Figure 15. Temperature-drop curve of each monitoring point simulated by CFD.
Energies 17 03471 g015
Figure 16. Temperature distribution contours at different heights across the cross-section of the LNG storage tank at different times of pre-cooling.
Energies 17 03471 g016aEnergies 17 03471 g016b
Table 1. Comparison of two calculation methods.
ModelMulti-ScaleElement QuantityTime Step SizeCalculating TimeError
Mixture34485.64 million0.01175 days>30%
DPM10.44 million105 days<15%
Table 2. Injection parameters of the nozzle.
ItemDroplet Diameter (mm)Temperature (k)Outer Radius (mm)Spray Cone Angle (deg)
Parameter0.0011112.945
Disclaimer/Publisher’s Note: The statements, opinions and data contained in all publications are solely those of the individual author(s) and contributor(s) and not of MDPI and/or the editor(s). MDPI and/or the editor(s) disclaim responsibility for any injury to people or property resulting from any ideas, methods, instructions or products referred to in the content.