Article

Suitable Site Selection of Public Charging Stations: A Fuzzy TOPSIS MCDA Framework on Capacity Substation Assessment

by
Wilson Enrique Chumbi
1,*,
Roger Martínez-Minga
2,
Sergio Zambrano-Asanza
3,
Jonatas B. Leite
1 and
John Fredy Franco
1
1
Department of Electrical Engineering, São Paulo State University—UNESP, Ilha Solteira 15385000, SP, Brazil
2
Department of Electrical Engineering–Research Group on Energy Transition (GITE), University Polytechnic Salesiana, Cuenca 010102, Ecuador
3
Department of Planning, Centrosur Electric Distribution Utility, Cuenca 010209, Ecuador
*
Author to whom correspondence should be addressed.
Energies 2024, 17(14), 3452; https://doi.org/10.3390/en17143452
Submission received: 24 May 2024 / Revised: 27 June 2024 / Accepted: 29 June 2024 / Published: 13 July 2024
(This article belongs to the Special Issue Data Mining Applications for Charging of Electric Vehicles II)

Abstract

:
The number of electric vehicles (EVs) continues to increase in the automobile market, driven by public policies since they contribute to the global decarbonization of the transportation sector. Still, the main challenge to increasing EV adoption is charging infrastructure. Therefore, the site selection of public EV charging stations should be made very carefully to maximize EV usage and address the population’s range anxiety. Since electricity demand for charging EVs introduces new load shapes, the interrelationship between the location of charging stations and long-term electrical grid planning must be addressed. The selection of the most suitable site involves conflicting criteria, requiring the application of multi-criteria analysis. Thus, a geographic information system-based Multicriteria Decision Analysis (MCDA) approach is applied in this work to address the charging station site selection, where the demographic criteria and energy density are taken into account to formulate an EV increase model. Several methods, including Fuzzy TOPSIS, are applied to validate the selection of suitable sites. In this evaluation, the impact of the EV charging station on the substation capacity is assessed through a high EV penetration scenario. The proposed method is applied in Cuenca, Ecuador. Results show the effectiveness of MCDA in assessing the impact of charging stations on power distribution systems ensuring suitable system operation under substation capacity reserves.

1. Introduction

At the Paris climate change conference in December 2015, a total of 195 countries, for the first time, signed a legal and universal agreement to face climate change, known as the Paris Agreement. This agreement establishes a global action plan to keep the temperature increase of global warming below 2 °C, close to pre-industrial levels [1]. This ambitious plan requires a significant reduction in the emissions of greenhouse gases (GHG). According to the International Energy Agency (IEA), the concentration of GHG in the atmosphere should be limited to about 450 ppm of carbon dioxide (CO2) [2]. Nowadays, a quarter of GHG emissions come specifically from the internal combustion engines (ICE) used by conventional vehicles. In addition, when burning fossil fuels, ICEs release pollutants that are harmful to health and significantly reduce air quality [3].
In this sense, electric vehicles (EVs) emerge as an innovative and promising mobility alternative to drastically reduce GHG emissions and harmful pollutants generated by ICEs. In 2020, there were around 10 million EVs on the road worldwide [4]. According to the IEA’s Sustainable Development Scenario, no less than 230 million EVs will be needed across the globe by 2030 to meet the climate goals of the Paris Agreement [5], in addition to the research in distributed generation [6]. Significant economic incentives and new policies have been introduced across the world to reach this goal. Governments around the world spent USD 14 billion on direct purchase incentives and tax refunds for EVs in 2020 [5,7]. A significant increase in the number of EVs is expected, so it is necessary to enhance and expand the charging station infrastructure for EVs. The Electric Power Research Institute (EPRI), the Society of Automotive Engineers (SAE), and the International Electro-Technical Commission (IEC) through standard IEC 61851 [8] have characterized different charging modes/levels: AC—level 1, AC—level 2, DC fast charging level 3, and Extreme Fast Charging (XFC) level 4. Table 1 summarizes the key characteristics of every charging level according to the SAE J1772 standard [9,10,11].
The public charging infrastructure is primarily level 2 and DC fast charging, as per pilot programs [12,13,14]. They are most often sited in parking garages and stores and distributed across streets. In Boulder, Colorado, with a population of 108,250 as per the 2020 US census, there are 19 station locations with three designs, as illustrated in Table 2: Fifteen stations with two level 2 EV chargers; three stations with four level 2 EV chargers; and one station with four level 2 and four DC Fast chargers. In New York City, until May 2023, there were 1900 public location stations. The network of public and private chargers includes stations with two, four, and six level 2 EV chargers. The public charging infrastructure in the US is 86% level 2 and 14% DC fast. Across the major urban areas, new charging installations include more chargers per location, involving workplace charging infrastructure [15].
The site selection of EV charging stations requires the analysis of multiple conflicting criteria, such as economic, environmental, energy, geographic, and transportation [16]. Due to the conflicting features, the multi-criteria decision-making problem (MCDM) is one of the most accurate methods in the site selection process [17,18]. MCDM problems are addressed by a group of expert decision-makers who evaluate the most suitable alternatives based on their individual preferences and combine them into an overall decision [19]. Solving MCDM problems requires multi-criteria decision analysis (MCDA) approaches, which facilitate the identification and prioritization of alternative sites and are effective in dealing with the lack of valid data considering complex and conflicting criteria [20]. Therefore, MCDM methods become the main tool in this work to deal with several criteria involved in selecting sites for increasing the EV charging station infrastructure.

1.1. Literature Review

Despite the fast increase in the use of plug-in EVs, there are some technical-economic barriers that limit the popularization of EVs, such as high purchase costs, long recharging times, and a lack of charging station infrastructure [21,22]. Among these technical-economic barriers, the low development of public charging infrastructure is the barrier most significant to the deferral of the increase of EVs [23]. In this way, the deployment of a convenient, efficient, and economical EV charging infrastructure must enhance demand for purchasing EVs and boost the EV industry. The optimal location of the charging stations is a significant factor associated with the EV eco-system. It has an important impact on the city’s traffic network, the quality of service, and its efficient operation. Approach-wise, charging station placement is susceptible to both quantitative and qualitative criteria evaluation under different perspectives, namely economic, societal, environmental, and technological factors [24].
Methods commonly employed for MCDM include the Analytic Hierarchy Process (AHP), Analytic Network Process (ANP), Best Worst Method (BWM), Technique for Order Preference by Similarity to Ideal Solution (TOPSIS), Weighted Linear Combination (WLC), and Preference Ranking Organization Method for Enrichment of Evaluations (PROMETHEE) [25,26]. The authors in [25] applied a combination of AHP and TOPSIS techniques to select the most suitable location for EV charging stations. Due to the ambiguity and intangibility of human qualitative judgments, some factors cannot be measured with precise values. The integration of MCDM methods with fuzzy logic techniques enables the quantification of criteria that align more effectively with fuzzy values than numerical values [27]. Moreover, the efficiency of MCDM methods depends on the quality of the data used to generate the criteria maps. Geographic information system (GIS) capabilities have thus become fundamental to the processing of data. Table 3 summarizes some works from the specialized literature that have used MCDM methods for suitably locating charging stations.
Some researchers have addressed the charging station placement problem by integrating GIS-based MCDM methodologies with fuzzy theory. The main characteristic of these methods is the capture of vagueness in human perception through fuzzy theory. Erbaş et al. (2018) [28] used the Fuzzy Analytical Hierarchy Process (FAHP) and TOPSIS to account for the uncertainty inherent in subjective evaluations. The GIS-based FMDA approach aimed to calculate available EV charging station locations by considering several evaluation criteria, such as traffic density and geographical distribution, among the main ones. Zhou et al., 2020 [29] proposed a framework for location decisions for photovoltaic (PV) charging stations. The subjective and objective criteria weights were processed using interval numbers with an interactive MCDM method, which is supported by GIS. The rankings were compared with two commonly used methods: TOPSIS; and VIKOR. Kaya et al. (2020) [30] applied a GIS-based MCDM method using AHP, PROMETHEE, and VIKOR to optimize alternative and existing locations for electric taxis. PROMETHEE and VIKOR were used to rank the sites, while fuzzy AHP was used to weight the criterion. The findings highlighted the evaluation criteria under different decision-making perspectives and the use of fuzzy theory to collect qualitative information in selecting optimal locations.
Table 3. Summary of the main characteristics of previous MCDM works.
MethodCityYearGIS-Based MethodSustainable CriteriaReference
TechnicalEconomicSocialDemographicEnvironment
Fuzzy TOPSISBeijing, China2015 [27]
Fuzzy Delphi method (FDM), combination weighting, and fuzzy grey relation analysis GRA-VIKORTianjin, china2016 [24]
Fuzzy analytical Hierarchy Process (FAHP) and TOPSISAnkara, Turkey2018 [28]
FAHP technique and the traditional grey relational projection GRP method under a picture fuzzy environmentBeijing, China2019 [31]
FAHP, PROMETHEE, and VIKORAnatolian, Turkey2020 [30]
Decision-making trial and evaluation laboratory (DEMATEL), AHP, and TOPSISIstanbul, Turkey2020 [32]
AHP, fuzzy AHP, Weighted Linear Combination (WLC), and TOPSISIstanbul, Turkey2020 [33]
Linguistic entropy weight (LEW) method and fuzzy axiomatic design (FAD)Chengdu, China2021 [34]
AHP, TOPSISIstanbul, Turkey2021 [25]
Integrated group aggregation techniques (GATs) with AHP, TOPSIS, and MOORA methods and sensitivity analysis resultsBursa, Turkey2022 [35]
Machine learning frameworks (random forests, multinomial logistic regression, and support vector machines)Orange, Southern California2022 [36]
AHP, WLCWinchester, UK2022 [17]
Combination weightingDublin, Ireland2023 [37]
Proposed workCuenca, Ecuador2024
In recent years, the ranking comparison of candidate locations has become much more attention to demonstrate the stability of proposed MCDM methods. The sensitivity analysis outcomes comparatively evaluate changes in candidate locations. Zhao et al. (2016) [24] applied a sustainability perspective by considering the economy, society, environment, and technology criteria to identify the best location for charging stations. They utilized the Fuzzy Delphi Method (FDM), combination weighting, and fuzzy Grey Relation Analysis (GRA-VIKOR) approaches to assess the stability of their strategy. Ju et al. (2019) [31] proposed a framework employing the FAHP technique and the Grey Relational Projection (GRP) method to assess and select the optimal charging station site. The main characteristic of this method is the use of a new aggregation operator capable of integrating fuzzy information into the representation of experts’ preferences. The ranking and sensitivity analysis are performed using a set of six suitable locations. Karaşan et al. (2020) [32] developed a combined Intuitionistic Fuzzy Sets (IFS) MCDM method using the Decision Making Trial and Evaluation Laboratory (DEMATEL) to determine dependency relations among criteria, where traffic convenience and power system security are the most important. The changes in the ranks of candidate locations are analyzed based on the main criteria’s weight test to check their robustness.
Guler et al. (2020) [33] calculated suitability indexes by applying GIS techniques. Spatial analysis was previously carried out to generate spatial layers associated with each criterion. Subsequently, the AHP and fuzzy AHP methods were used to compute the weights of the criteria. Then, the suitability index is calculated using the means of WLC from three perspectives: environmental, accessibility, and fuzzy. Finally, the candidate locations are ranked by the TOPSIS method. Feng et al. (2021) [34] presented an MCDM approach with the Linguistic Entropy Weight (LEW) method to determine criteria weights and Fuzzy Axiomatic Design (FAD) in selecting the most suitable location for an EV charging station. The risk of possible failure in site selection was reduced by considering the probability of success of every criterion. The proposed method was compared to the TOPSIS, VIKOR, and MOORA methods, obtaining similar ranking results. Yagmahan et al. (2022) [35] developed another approach to assessing candidate locations by integrating Group Aggregation Techniques (GATs). Two different groups of GATs are used to aggregated weights with AHP. The sensitivity analysis outcomes were derived from TOPSIS and Multi-Objective Optimization on the Basis of Ratio Analysis (MOORA), which were applied to compare the rankings of five candidate locations.
This literature review reveals that previous works do not consider any criteria for modeling the massive increase of EVs and, therefore, the selection of charging station location. Most criteria relate to existing EV owners to deal with range anxiety, while potential EV owners are not taken into account. Thus, researchers are still looking for evaluation criteria from different decision-making perspectives. Besides, fuzzy theory in MCDM problems is being widely used to deal with the vagueness of human perception in identifying the optimal location for charging stations. The MCDM frameworks in the specialized literature integrate weighting criteria methods through fuzzy theory and ranking methods through mathematical foundations, mostly leaving out the GIS environment. The sensitivity analysis results without GIS data do not encompass all candidate locations; this is a critical limitation that needs to be addressed in an effective decision-making process for EV charging station infrastructure.

1.2. Contributions

In the context of EV charging station placement, this work presents a Fuzzy TOPSIS framework that consolidates key criteria and compares it with several GIS-based MCDA methods. The main contributions are as follows:
  • Different from previous works, the proposed method simultaneously takes into account important criteria such as socio-demographics and environmental factors, which can play a decisive role in the massive increase of EVs as well as in the placement of EV charging stations.
  • The density element in this analysis is important because it captures the strata of residential customers where an increase in EVs is most likely, consequently requiring greater dependence on public infrastructure. It uses high-resolution density electric load criteria in the analysis to determine suitable sites for EV charging stations.
  • This work employs an adaptive TOPSIS MCDA approach to address uncertainties and imprecision in human judgment during decision-making. It employs linguistic membership functions and fuzzy sets in the criteria-weighting process, incorporating technical, economic, and social perspectives.
  • The proposed GIS-based MCDA framework supports transformer capacity assessment in substations based on EV increase trends. It includes a charging station growth scenario to determine the expected electrical capabilities required to supply future EVs in the area.

2. Background

EV increase rates can benefit from geographic densities of charging station infrastructure, particularly through the placement of public chargers at popular locations to mitigate range anxiety. However, the location selection of public charging infrastructure is affected by direct or indirect criteria, including proximity to features, terrain, traffic patterns, mobility preferences, vehicle-to-grid interests, and spatial constraints such as land usage, environmental regulations, and property rights. The literature review highlights the significance of sociodemographic criteria when analyzing potential EV owners. Spatial restrictions also impact site selection due to differences in private land requirements and permission processes. For example, certain areas may have different requirements related to privately owned lands; consequently, obtaining permission to use the land may be more challenging in some cases. This section explores three domains. Firstly, geographical criteria are defined, which are useful for understanding and analyzing data based on its geographic location. Secondly, the concept of geographically weighted regression (GWR) is discussed, aiming to model the spatial relationship between variables. Lastly, geostatistical interpolation, a method that utilizes spatial information to estimate unknown values in unsampled locations, is examined.

2.1. Criteria Definition

The criteria are chosen based on a comprehensive review of existing literature and consultations with relevant experts. A hybrid approach encompassing socio-demographic variables and spatial factors is employed. The location selection criteria are categorized under five main features, as summarized in Table 4. The features considered for selecting sites for EV charging stations are energy, economic and social, transportation, socio-demographics, and environmental criteria.
Electrical substations. The degree of power loss, supply reliability, and project cost depend on the distance of the station from the point of connection to the electrical substation. Well-suited areas for EV charging stations are those near electrical substations.
Petrol stations. The presence of petrol stations reflects a well-organized facility distribution across the entire area, aligning with the traffic flow patterns. The ideal location for the charging station should be close to these supply points.
Current EV charging stations. The presence of existing EV charging stations reduces the need to build new ones, thereby preventing the waste of resources. The candidate charging station should be located as far as possible to existing EV charging stations.
Energy density. The expected increase in EV adoption is highest among residential consumers with higher electricity consumption. Therefore, the demand for charging stations is greater in areas with higher load density. Thus, the higher the density, the better the candidate location.
Commercial centers. Commercial centers attract vehicles for short-, medium-, and long-duration parking. Well-suited areas for EV charging stations are those located near shopping centers, chain stores, retail stores, etc.
Health facilities. Medical campuses, hospitals, and health clinics have adequate 24-h parking spaces for employees and visitors. EV owners can benefit from charging stations located close to health facilities.
Main roads. The EV charging stations should be strategically positioned with convenient connectivity to a significant network of roads, ensuring short travel times and swift access. An EV charging station site should be located near the main roads—the nearer, the better.
Insurance costs. If the insurance cost of people in a household increases, the higher the odds that a member of this household will become a new technology owner. The map layer is created using the insurance costs of districts. If the location has a high contribution rate, it will be more suitable.
New housing. Owners of new houses are inclined to purchase new technology. In other words, people living in new buildings are more likely to be EV owners. The map layer is prepared using the count of construction loans in each district.
Building materials. The building materials taken into consideration as an economic factor seem to have a positive impact as a predictor of new technology owners. The district score map layer is prepared by counting the flooring installations for high-quality housing.
Air quality. During use, EVs emit fewer environmental pollutants than internal combustion engine vehicles. After the construction of a public EV charging station (EVCS), the new infrastructure contributes to pollution reduction. Well-suited areas for EVCS are those where pollution is high.
Noise. Electric motors are eco-friendly. They offer better acceleration, silent operation, fewer emissions, and less noise pollution. The operation of EV charging stations positively impacts the daily lives of locals. If the location has high noise pollution, it will be more suitable.

2.2. Geographically Weighted Regression

In the context of demographic analysis, GWR is a spatial analysis method that examines how relationships between socioeconomic variables change across different districts within a study area. Where regression models are adapted to local conditions due to the heterogeneity in spatial data and the influence of local factors [41]. By fitting unique regression models to each census tract, GWR explores spatial phenomena by evaluating the regression coefficients of the local models [40]. These analyses utilize data from local population censuses and the influence of neighboring census tracts. This aids in understanding why certain residents of certain areas are prospective buyers of end-use electrical technology ( Y s , t , d ). Separate equations are constructed for every district, using (1).
Y s , t , d = β s , t , d 1 X d 1 + β s , t , d 2 X d 2 + + β s , t , d k X d k + ε s , t , d
where X d k is a k variable of socioeconomic characteristics of the population in district d , ε s , t , d is the residual between the values Y s , t , d and Y s , t , d O b s ; β s , t , d k is calculated as shown in (2).
β s , t , d k = ( x d k T W d x d k ) 1 x d k T W d Y s , t , d O b s
where W d is a square matrix as given in (3).
W d = [ W d , 1 0 0 0 W d , 2 0 0 0 0 0 W d , j ]
The diagonal elements W d , j are the weights that relate to the spatial proximity among districts in the study area. These values depend on the shape and extent of all neighborhoods used for each local regression equation being analyzed. They are calculated using the Gaussian and Bisquare methods to control the smoothness of the kernel model. GIS tools, such as ARCGIS® and GEODA®, could be employed to calculate the parameters W d , j , β s , t , d k , and Y s , t , d .

2.3. Geostatistical Interpolation

To construct an air pollution surface or map over a broad region using limited air quality monitoring stations, interpolation techniques are essential for estimating pollution levels at unsampled locations. Since surface data originate from discrete points, modeling continuous representations of pollutants such as particulate matter, nitrogen dioxide, and ozone requires spatial interpolation methods. Figure 1 depicts known air pollution levels for specific areas on the left side and predicted values via interpolation on the right side to cover unmeasured areas.
Spatial interpolation methods in GIS can be deterministic or geostatistical, relying on spatial autocorrelation (the similarity of neighboring sample points) to generate the surface. Deterministic methods use an initial data condition and a distance weighting parameter specified by the decision-maker. Geostatistical methods are based on the principles of statistical spatial autocorrelation, assuming that model parameters are subject to random variation and measurement error. Kriging’s geostatistical method acknowledges that modeling the spatial variation of a continuous attribute value is not possible with a simple, smooth mathematical function [42]. Then, Kriging is used when sample attribute data exhibit substantial variation beyond the capability of simpler modeling methods.
Kriging uses the semi-variogram to represent the autocorrelation. The semi-variogram measures the strength of the statistical correlation as a function of distance among the samples [43]. Equations (4) and (5) are used to determine the Kriging estimate z * ( x 0 ) and the error estimation variance σ k 2 ( x 0 ) at every point x 0 , respectively.
z * ( x 0 ) = i = 1 n λ i z ( x i )
σ k 2 ( x 0 ) = μ + i = 1 n λ i γ ( x 0 x i )
where λ i are the weights; μ is the Lagrange constant; γ ( x 0 x i ) is the semi-variogram value corresponding to the distance between x 0 and x i ; and the coordinate component is denoted by x 0 ( x , y ) .
Semi-variograms are the fundamental tool that summarizes the spatial continuity of all possible pairings of data. Using the intrinsic hypotheses and regionalized variable theory, a semi-variogram can be written as (6) and (7):
2 γ ( h ) = E [ Z ( x i ) Z ( x i + h ) ] 2
γ ( h ) = 1 2 N ( h ) i = 1 N ( h ) [ Z ( x i ) Z ( x i + h ) ] 2
where γ ( h ) is the semi-variance, h is the distance (or lag), Z is a random function with a steady mean, N ( h ) is the number of pairs of samples separated by a distance h , Z ( x i ) , and Z ( x i + h ) are values of Z at points x i and x i + h .

3. Proposed Method

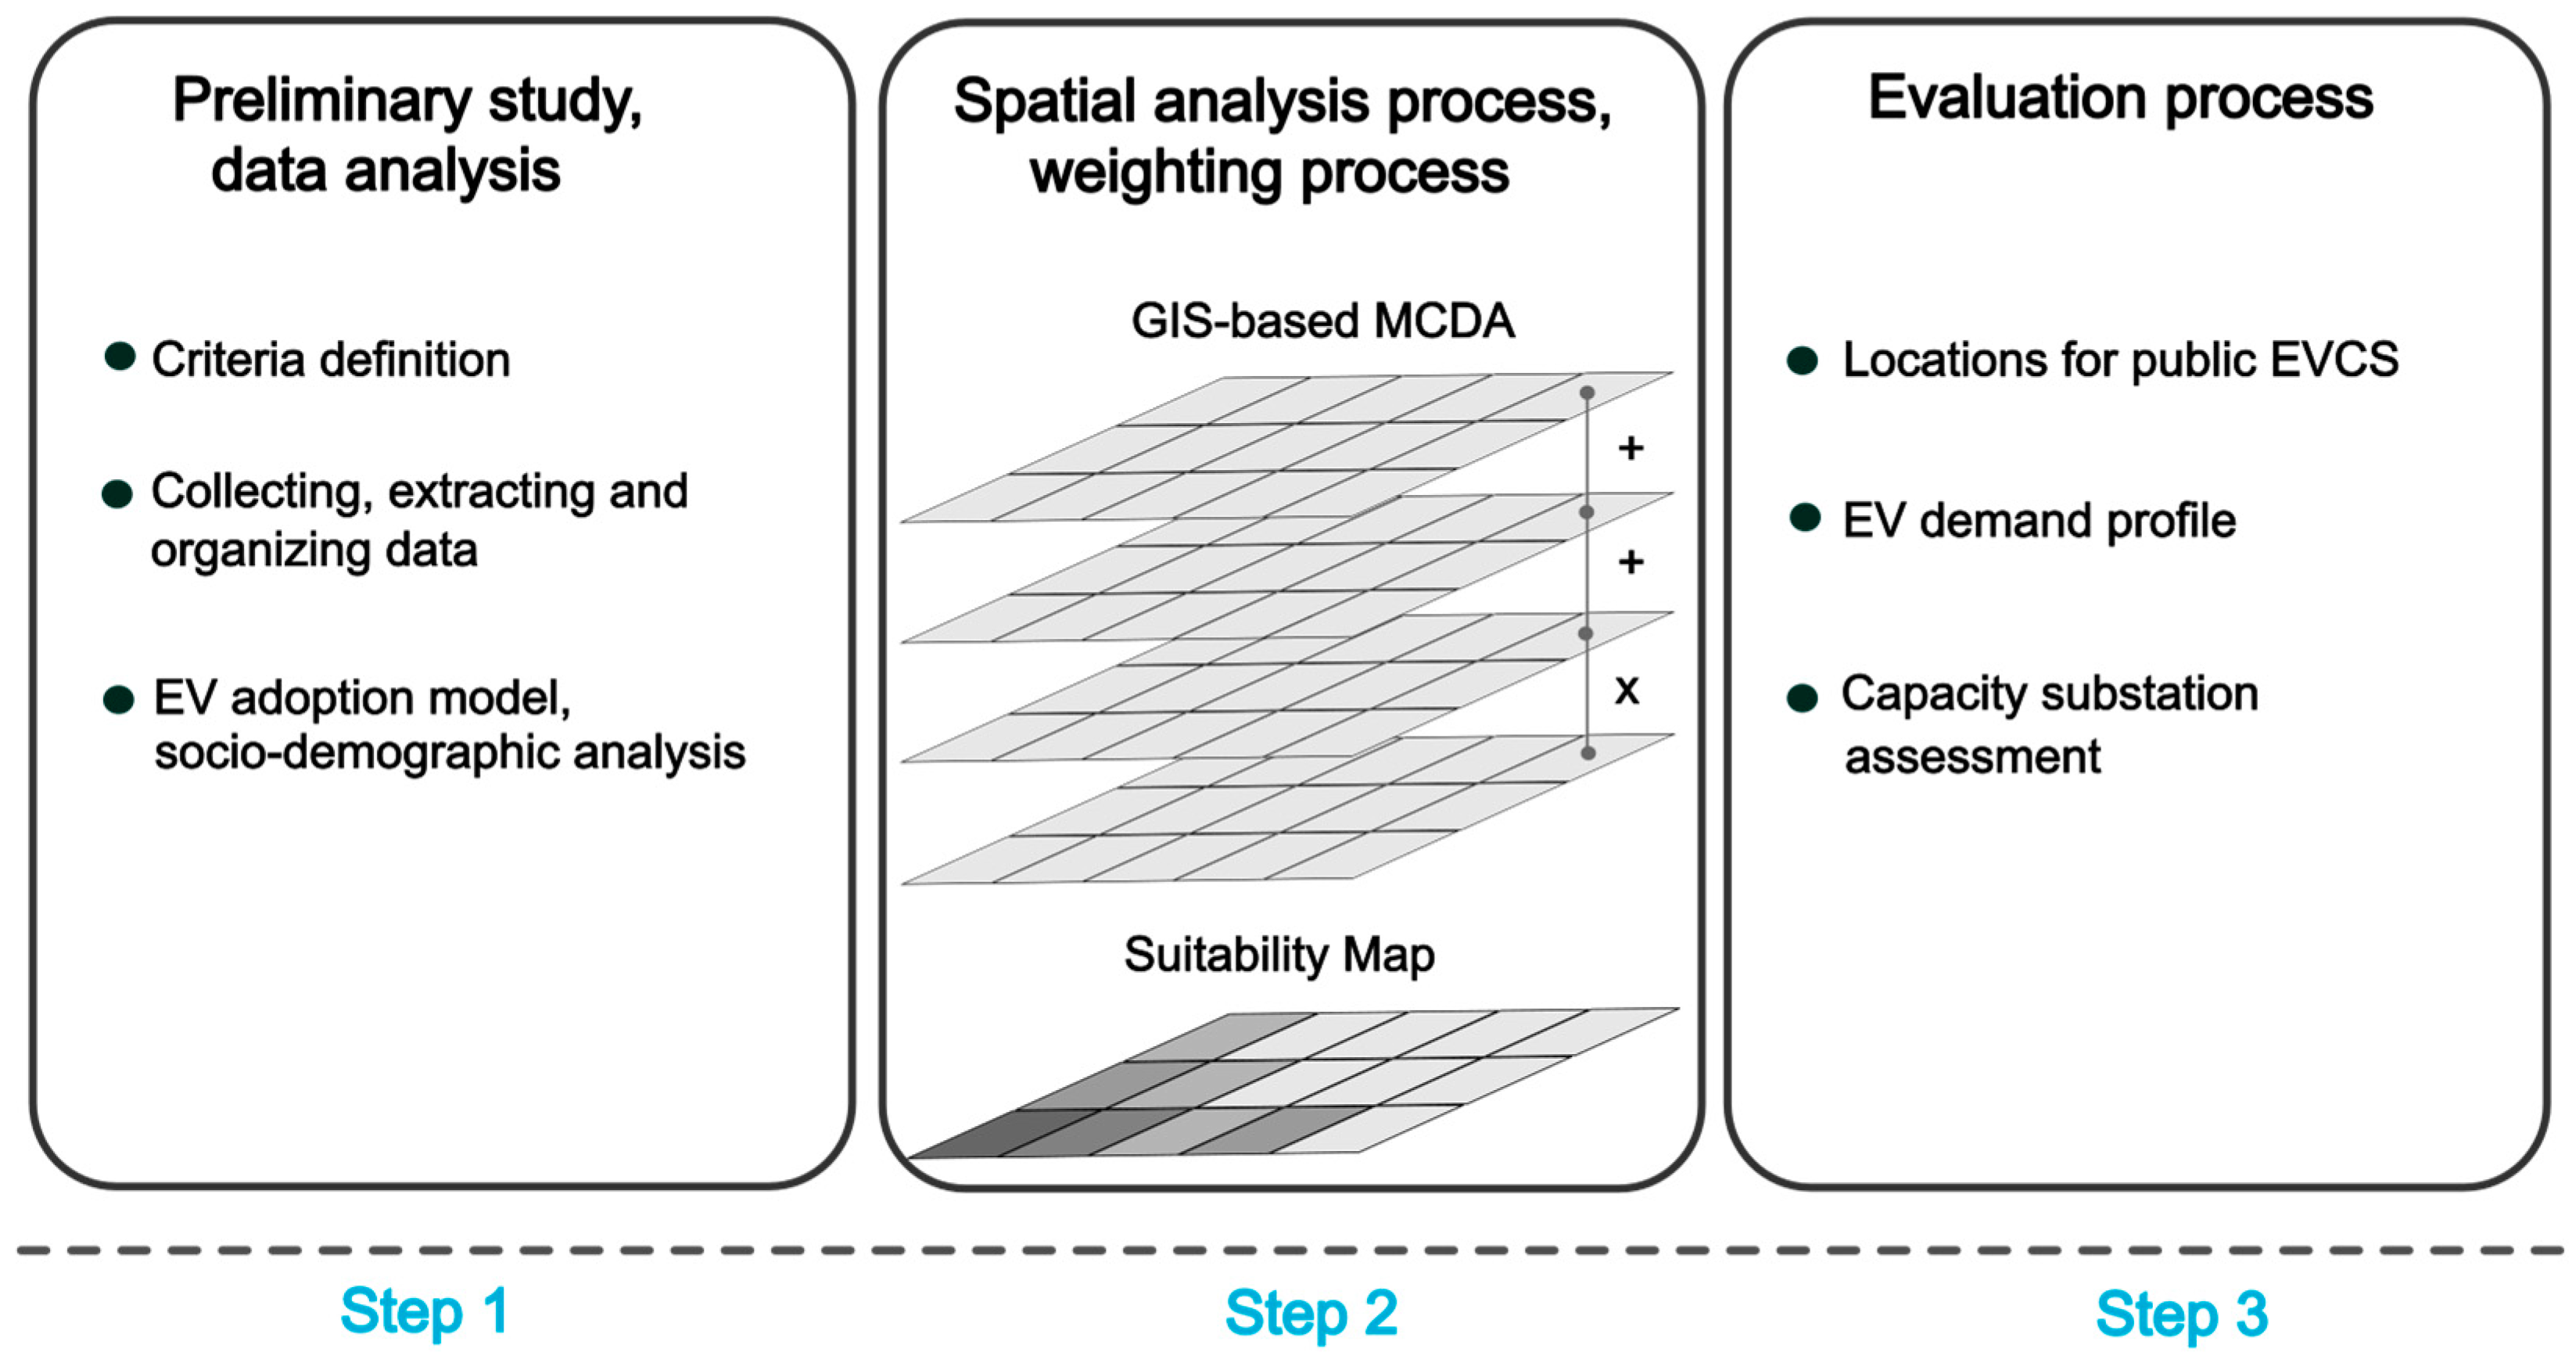
This section presents the proposed framework that combines spatial analysis and spatial decision-making processes. The integration of these two fields, known as GIS-based MCDA methods, is used in suitability analysis for EV charging station placement. The framework consists of three primary steps, as illustrated in Figure 2. Initially, during the pre-processing step, diverse geospatial datasets are collected, encompassing all defined criteria. The primary feature at this step entails performing an EV increase model. The GWR model identifies key criteria influencing new technology acquisition by exploring spatial relationships and patterns. GWR is, thus, used to identify socio-demographic criteria that establish the relation between spatially referenced data and potential EV owners’ profiles, as it identifies where EV increase is more likely and, consequently, where upcoming EV charging station placements are required. The findings in the first step are input for the second step, wherein several spatial analysis techniques, such as WLC, TOPSIS, and VIKOR, are employed. A comparative analysis evolves the implementation of different variations, including the combination of AHP and Fuzzy Logic to establish weights, along with spatial analysis techniques. Thus, four suitability maps can be obtained by applying AHP + WLC, AHP + TOPSIS, AHP + VIKOR, and Fuzzy + TOPSIS. The resulting suitability map and projected EV demand profiles enable the assessment of the impacts of charging station load profiles on substation load profiles.

3.1. Analytic Hierarchy Process

AHP is a rating method to estimate the weights of each criterion within a judgment decision-making approach. It requires a comparison pairwise on the basis of a predetermined scale called “Saaty’s Fundamental Scale” [44]. The decision-maker employs a pairwise comparison matrix with values from 1 to 9 to rate the preferences with respect to a pair of criteria.
The comparison matrix C = [ c k p ] n × n is reciprocal, i.e., c p k = 1 c k p with all diagonal elements. The Saaty scale is used to define relative weights c k p for the k-th and p-th criteria through comparison pairwise. After the pairwise comparison matrix is established, the vector of criterion weights w can be computed by (8).
C w = [ 1 c 12 c 1 n 1 c 12 1 c 2 n 1 c 1 n c 2 n 1 ] [ w 1 w 2 w n ] = λ m a x w
subject to:
k = 1 n w k = 1 k = 1 , 2 , , n
0 w k 1
where λ m a x is the largest eigenvalue of C . One of the most commonly used methods to solve (8) is averaging over normalized columns, as proposed by [44]. So, the entries in the matrix C are normalized with (9), and finally, the weights are computed using (10).
c k p * = c k p k = 1 n c k p k = 1 , 2 , , n
w k = p = 1 n c k p * n p = 1 , 2 , , n
The pairwise comparison requires measuring the inconsistency according to the transitivity principle. In general, the principle of transitivity can be defined as follows: a consistent set of pairwise comparisons in which human judgment is, to some degree, inconsistent [20]. The consistency ratio ( C R ) is defined by (11).
C R = λ m a x n R I ( n 1 )
where R I is the random index, which depends on the number of criteria being compared, i.e., for n = 2 ,   3 ,   4 ,   5 ,   6 ,   7 ,   8 , R I = 0.00 ,   0.52 ,   0.89 , ,   1.40 , respectively. The consistency ratio, C R < 0.1 , indicates a reasonable level of consistency and C R 0.1 indicates inconsistent judgment in the pairwise comparisons. If the consistency ratio C R indicates inconsistent judgment, the pairwise comparison matrix C must be reconsidered and the original values c k p revised.

3.2. Fuzzy Logic

Proposed by Zadeh in 1965, Fuzzy Theory is used to map linguistic terms into numerical counterparts within human judgments. Fuzzy sets are commonly employed to handle uncertainty and imprecision when weighing criteria and rating alternatives in MCDM problems [45]. So, a fuzzy set A in a referential universe of discourse X is characterized by a membership function A ( . ) , which associates with each element x X a real number A ( x ) [ 0 , 1 ] , having the interpretation A ( x ) as the membership grade of x in the fuzzy set A . In this way, A ( x ) = 1 means full membership of x in A , while A ( x ) = 0 means non-membership. A fuzzy set is identified by its membership function. Notations that are generally used are the following μ A ( x ) = A ( x ) [46]. The membership function of a classical set A X can be defined by its characteristic function, as given in (12).
μ A ( x ) = { 1 i f   x A   0 o t h e r w i s e
The triangular fuzzy number is one of the most popular shapes of fuzzy numbers. It can be defined as a triplet A = ( α 1 , α 2 , α 3 ) , as defined by (13).
μ A ( x ) = { 0 , x α 1 x α 1 α 2 α 1 , α 1 x α 2 α 3 x α 3 α 2 , α 1 x α 2 0 , x α 3
Assuming two triangular fuzzy numbers A = ( α 1 , α 2 , α 3 ) and B = ( b 1 , b 2 , b 3 ) , the next properties are satisfied as given in (14) and (15).
A ( + ) B = ( α 1 + α 2 + α 3 ) ( + ) ( b 1 + b 2 + b 3 ) = ( α 1 + b 1 , α 2 + b 2 , α 3 + b 3 )
A ( ) B = ( α 1 + α 2 + α 3 ) ( ) ( b 1 + b 2 + b 3 ) = ( α 1 b 3 , α 2 b 2 , α 3 b 1 )
A fuzzy matrix is a gathering of vectors in which a fuzzy vector is a certain vector that includes an element with a value between 0 and 1. So, the operations on given fuzzy matrices A and B are addition, product, and scalar multiplication:
A + B = m a x [ α i , j , b i , j ]
A · B = m a x [ m i n ( α i , k , b k , j ) ]
λ A
where 0 λ 1 .
The calculation of the distance between two triangular fuzzy numbers can be performed through the vertex method using (19).
d ( A , B ) = 1 3 [ ( α 1 b 1 ) 2 + ( α 2 b 2 ) 2 + ( α 3 b 3 ) 2 ]
A linguistic variable is one whose values represent crisp information in the form of words or sentences in its context. For example, ‘Age’ can take the values young, not young, old, very old, etc., rather than 18, 25, 40, 65 [47]. This kind of variable can well be represented by triangular fuzzy numbers.

3.3. MCDM Framework

Decision-makers using MCDM techniques can comprehensively evaluate candidate sites for EV charging stations, considering multiple criteria such as accessibility, demand, environmental impact, and infrastructure suitability. AHP WLC, AHP TOPSIS, AHP VIKOR, and Fuzzy TOPSIS are among the commonly utilized methods in specialized literature. WLC enables the linear combination of different criteria by assigning weights to every criterion based on its importance from pairwise comparison, thereby facilitating a comprehensive assessment. TOPSIS ranks candidate sites based on their proximity to the ideal solution and furthest from the negative ideal solution. VIKOR, on the other hand, identifies the best compromise solution among candidate sites by considering both the maximum group utility and the minimum individual regret. Lastly, Fuzzy TOPSIS accommodates the imprecision and uncertainty inherent in decision-making processes by employing fuzzy sets to represent linguistic terms to express preferences.
WLC is a technique used for site scoring within the spatial analysis approach [48]. It consists of a map combination procedure, i.e., for each geographic location ( x i , y i ) a weighted summation of a set of criteria weights, w 1 , w 2 , , w n , and criterion values, a i 1 , a i 2 , , a i n , is performed. Then, the map combination consists of two components: criterion weight w k ; and a value function v ( a i k ) , as given in (20).
V ( A i ) = k = 1 n w k v ( a i k ) · r i
where V ( A i ) is the suitability value. The subscript “i” represents the i-th candidate at coordinates ( x i , y i ) . Within a raster GIS-based decision analysis, each cell of a map layer is a candidate site. The spatial restrictions are included by using the restricted candidate site component r i . The AHP WLC algorithm consists of seven steps:
  • Identify and define criteria for site suitability.
  • Establish a hierarchy of criteria, conduct pairwise comparisons using AHP, and derive normalized weights.
  • Assess candidate sites against criteria, assigning scores.
  • Multiply scores by normalized weights and sum for each candidate site, and, for each candidate site, multiply the restricted condition.
  • Rank candidate sites based on composite scores.
  • Assess the impact of changes in criteria weights.
  • Make the final decision.
The TOPSIS method compares the distance of each one of the candidate sites to an ideal and anti-ideal solution [49]. It uses a decision matrix with m candidate sites A 1 , , A m and n criteria, C 1 , , C n . At first, each candidate site is evaluated with respect to each of the n criteria to form a decision matrix X = ( x i j ) m × n . The vector of the criteria weights obtained from the AHP method is W = ( w 1 , w n ) , where j = 1 n w j = 1 . The AHP TOPSIS algorithm consists of six steps:
  • Normalize the decision matrix;
  • Calculate the weighted normalized decision matrix;
  • Determine the ideal and anti-ideal solutions;
  • Calculate the separation measures;
  • Calculate the relative closeness to the ideal solution;
  • Rank the preferences in order.
VIKOR is considered effective in cases where the decision-maker cannot be certain how to express his/her preferences coherently and consistently at the initial stages of the system design [49]. Like TOPSIS, VIKOR theoretical background is based on “closeness to the ideal”, but it is helpful when non-commensurable and conflicting criteria are included.
The VIKOR method, denoted by m c o , has been developed to solve the MCDA problems by selecting the best candidate site as given in (21).
m c o i = { ( f i j ( A i ) , i = 1 , 2 , , m ) , j = 1 , 2 , , n }
where m is the number of feasible candidate sites; n is the number of criteria; A i = x 1 , x 2 , , x m is the i-th candidate site generated with certain values of system variables x ; f i j is the value of the j-th criterion function for the candidate site A i . The steps of the AHP VIKOR procedure consist of nine steps:
  • Determine the best and worst values of all criteria functions.
  • Compute the values S i and R i , representing Separation Measure and Individual Regret, respectively.
  • Compute the values Q i named Maximum Group Utility.
  • Rank the candidate sites.
  • Propose a compromise solution.
  • Determine the weight stability interval for each criterion.
  • Determine the trade-offs.
  • Adjust the trade-offs.
  • Verify conditions for the algorithm’s termination.
Fuzzy TOPSIS methodology adopted from Chen’s work uses the TOPSIS approach extended to group decision making involving linguistic variables [44]. The Fuzzy TOPSIS algorithm consists of six steps:
  • Form a committee of decision-makers, then identify the evaluation criteria.
  • Choose the linguistic variables.
  • Perform aggregations.
  • Construct the fuzzy decision matrix and the normalized fuzzy decision matrix.
  • Construct the fuzzy, weighted, normalized decision matrix.
  • Determine the fuzzy positive ideal solution (FPIS) and the fuzzy negative ideal solution (FNIS).
  • Calculate the distance for each candidate site from FPIS and FNIS.
  • Calculate the closeness coefficient for each candidate site.
  • Rank the candidate sites.

4. Results and Discussion

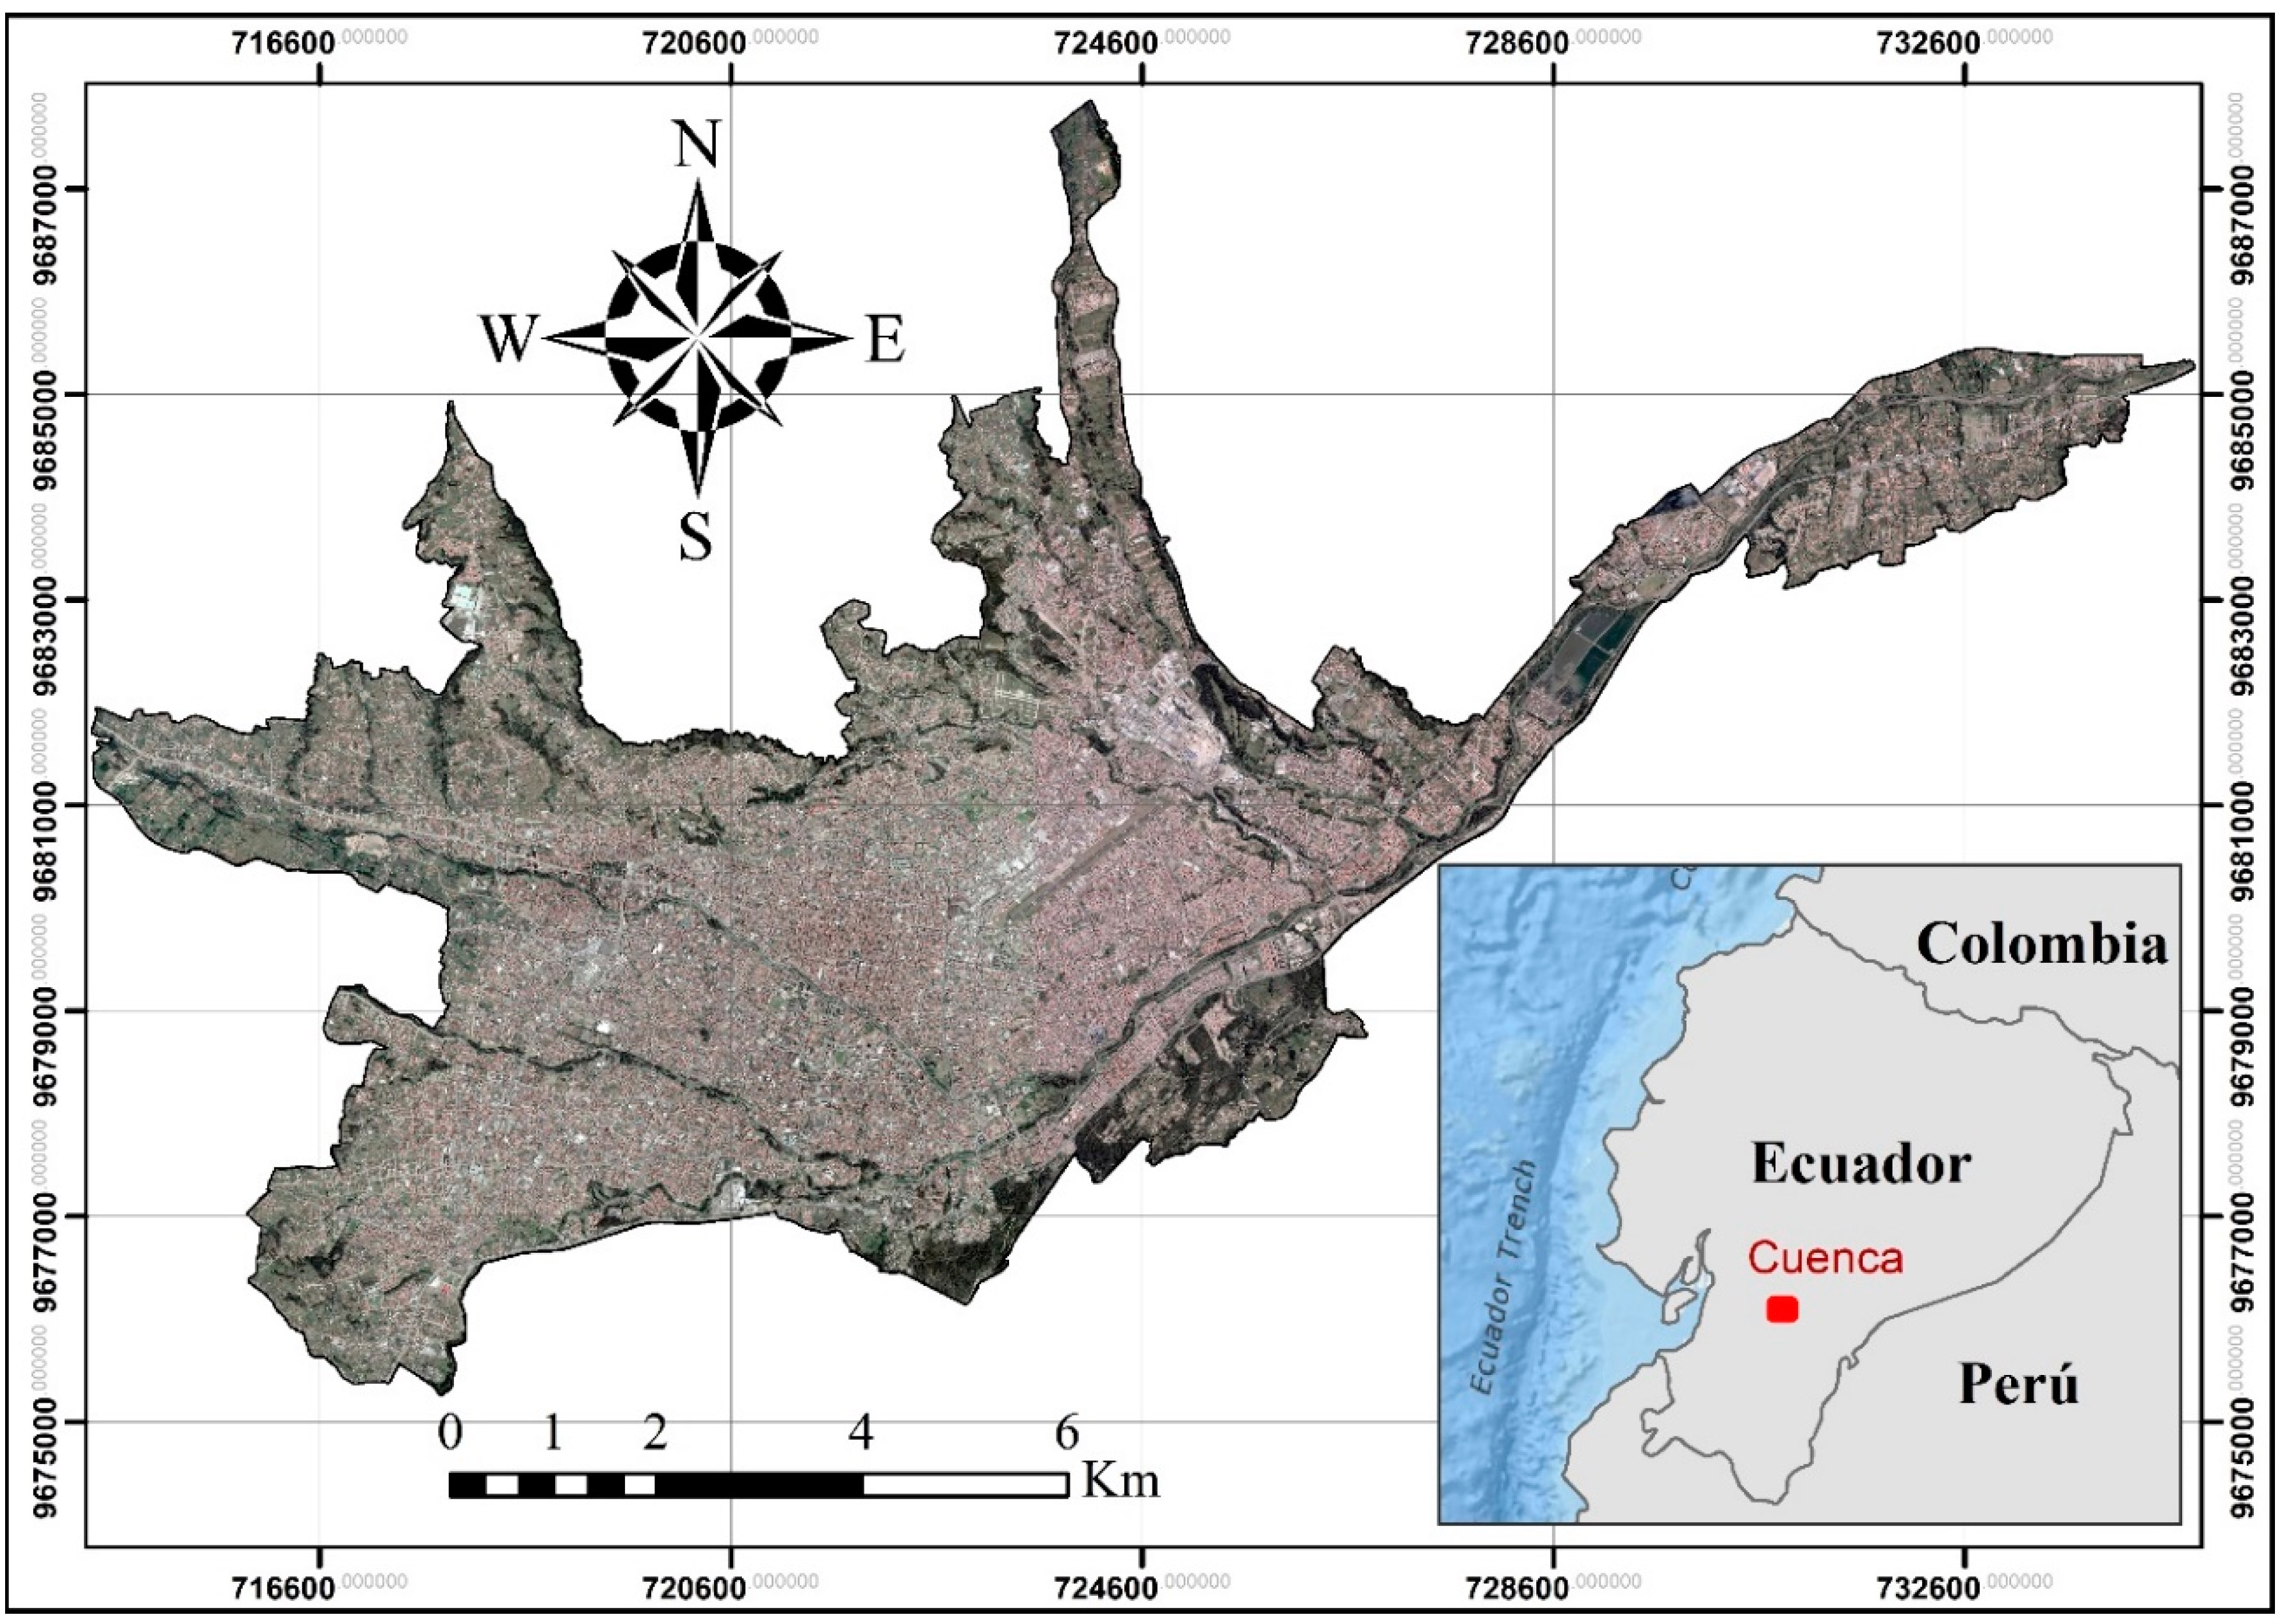
The proposed approach was implemented using an electrical system from “Empresa Eléctrica Regional Centro Sur C.A.” (Centrosur) in Cuenca, Ecuador, covering an extensive service area of 30,234 km2, constituting 11.8% of Ecuador’s territory. In 2018, 393,953 customers, predominantly residential (88%), commercial (11%), and industrial (1%), consumed 1074.10 GWh of energy, with a peak demand reaching 194.93 MW. The study area, dark-shaded in Figure 3, represents approximately 75% of the utility’s energy demand and accommodates 214,082 consumers as of the base year 2022.
According to the National Institute of Statistics and Censuses (INEC) historical data [50], Ecuador had approximately 2.5 million motorized vehicles in 2021, which represents an increase of 7.4% compared to the previous year and an average annual growth of 5.6%. Particularly in the province of Azuay, there were 163,598 registered vehicles, accounting for 6.45% of the nationwide total. Based on [51], 33 EVs have been registered until 2021 in the province of Azuay. Although the population grows at an average rate of 2% per year in Cuenca, the number of vehicles increases by 5% [52].

4.1. EV Adoption Model

The GWR model identifies socio-demographic criteria influencing new technology acquisition. The criteria, known as predictor variables, are gathered from a literature review as well as from the available population census data in the city of Cuenca. Socio-demographic variables such as education level, income, and household size are recognized as key determinants of EV purchasing behavior [53]. However, depending on where the study was developed, the degree of influence between these variables varies by the owners’ location [54].
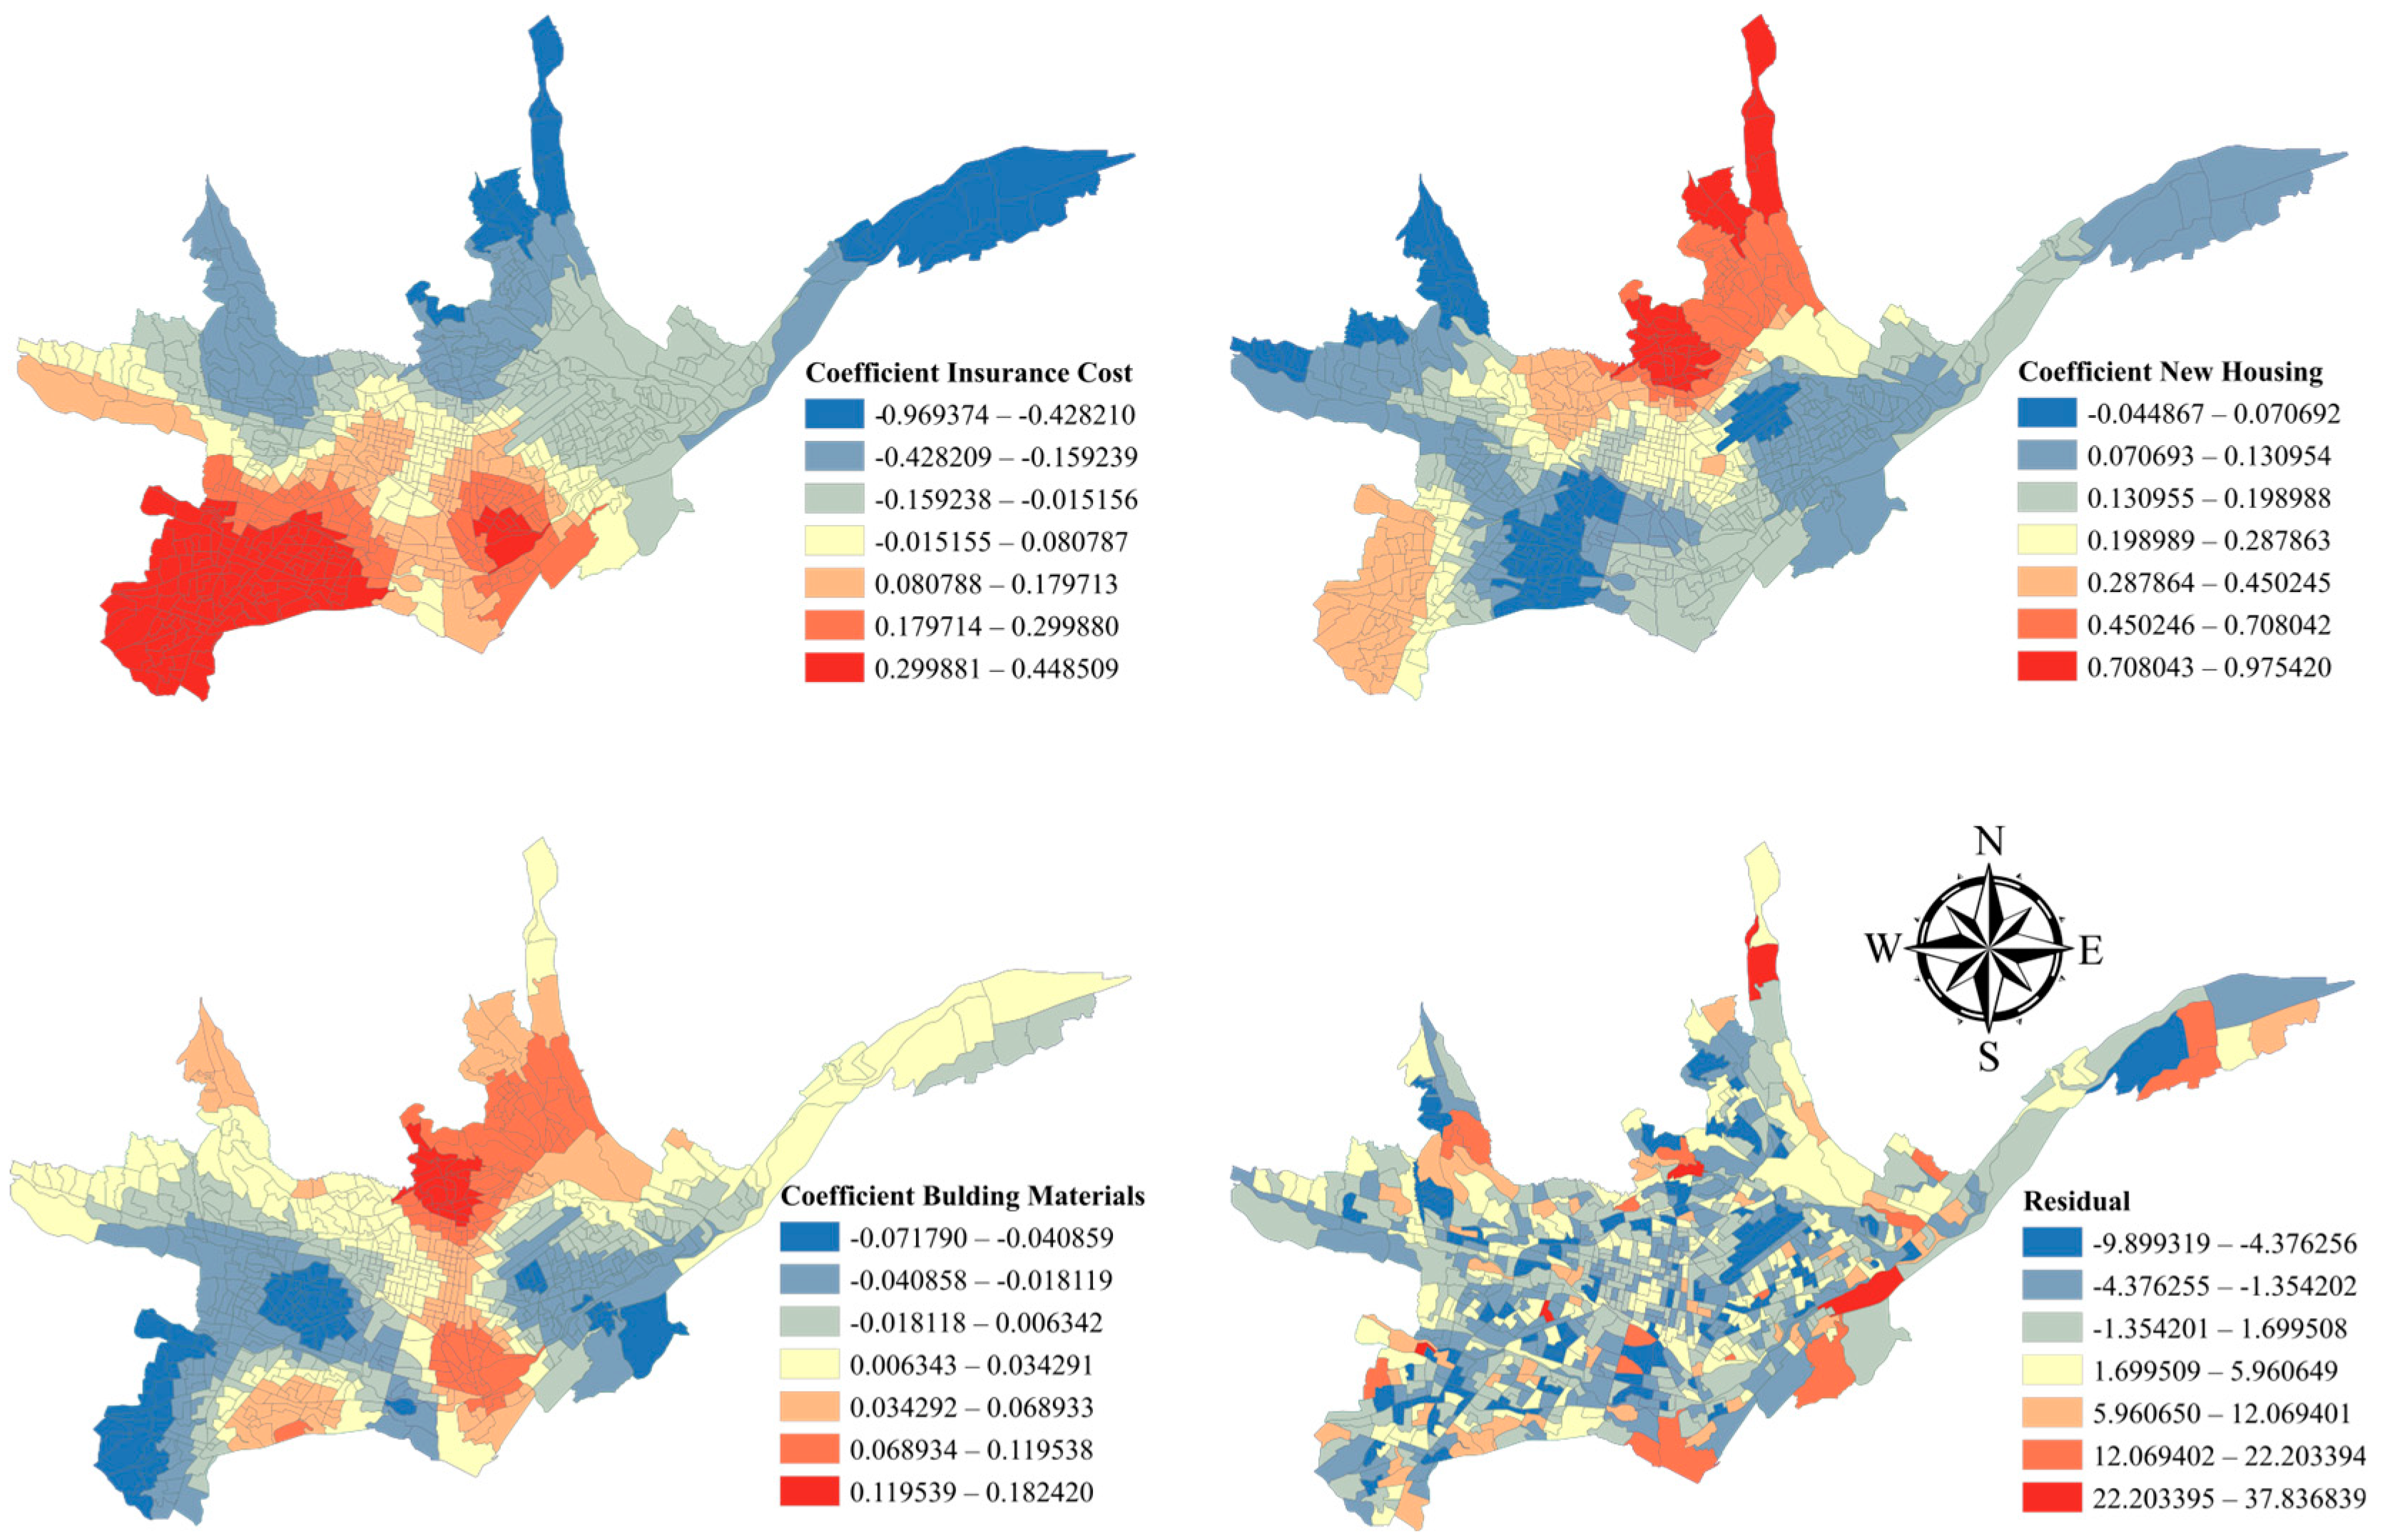
The INEC conducts the census in Ecuador, providing population statistics, with the most recent in 2022. The census gathers information about the age, gender, education level, housing units, number of rooms, building materials of households, access to basic services, etc. The city of Cuenca has a total of 775 census tracts. Over these census tracts, the GWR tool from ArcGIS® was applied to find the best combination of predictor variables. The tool generated a diagnostic value report, with the adjusted R-squared statistic serving as a measure of model performance. GWR was executed with the population census data as the independent variable and the electric stove owners as the dependent variable. Through an exploratory regression process, the model achieved an adjusted R-squared of 0.436. This suggests that the model explains about 44% of the variation in stove purchasing. The model identifies three predictor variables that have a significant impact on EV purchasing: insurance costs, aging households, and building materials. These predictor variables, with regression coefficients depicted as heatmaps in Figure 4, must be considered as spatial criteria for EV purchasing.

4.2. Criteria and Restriction Analysis

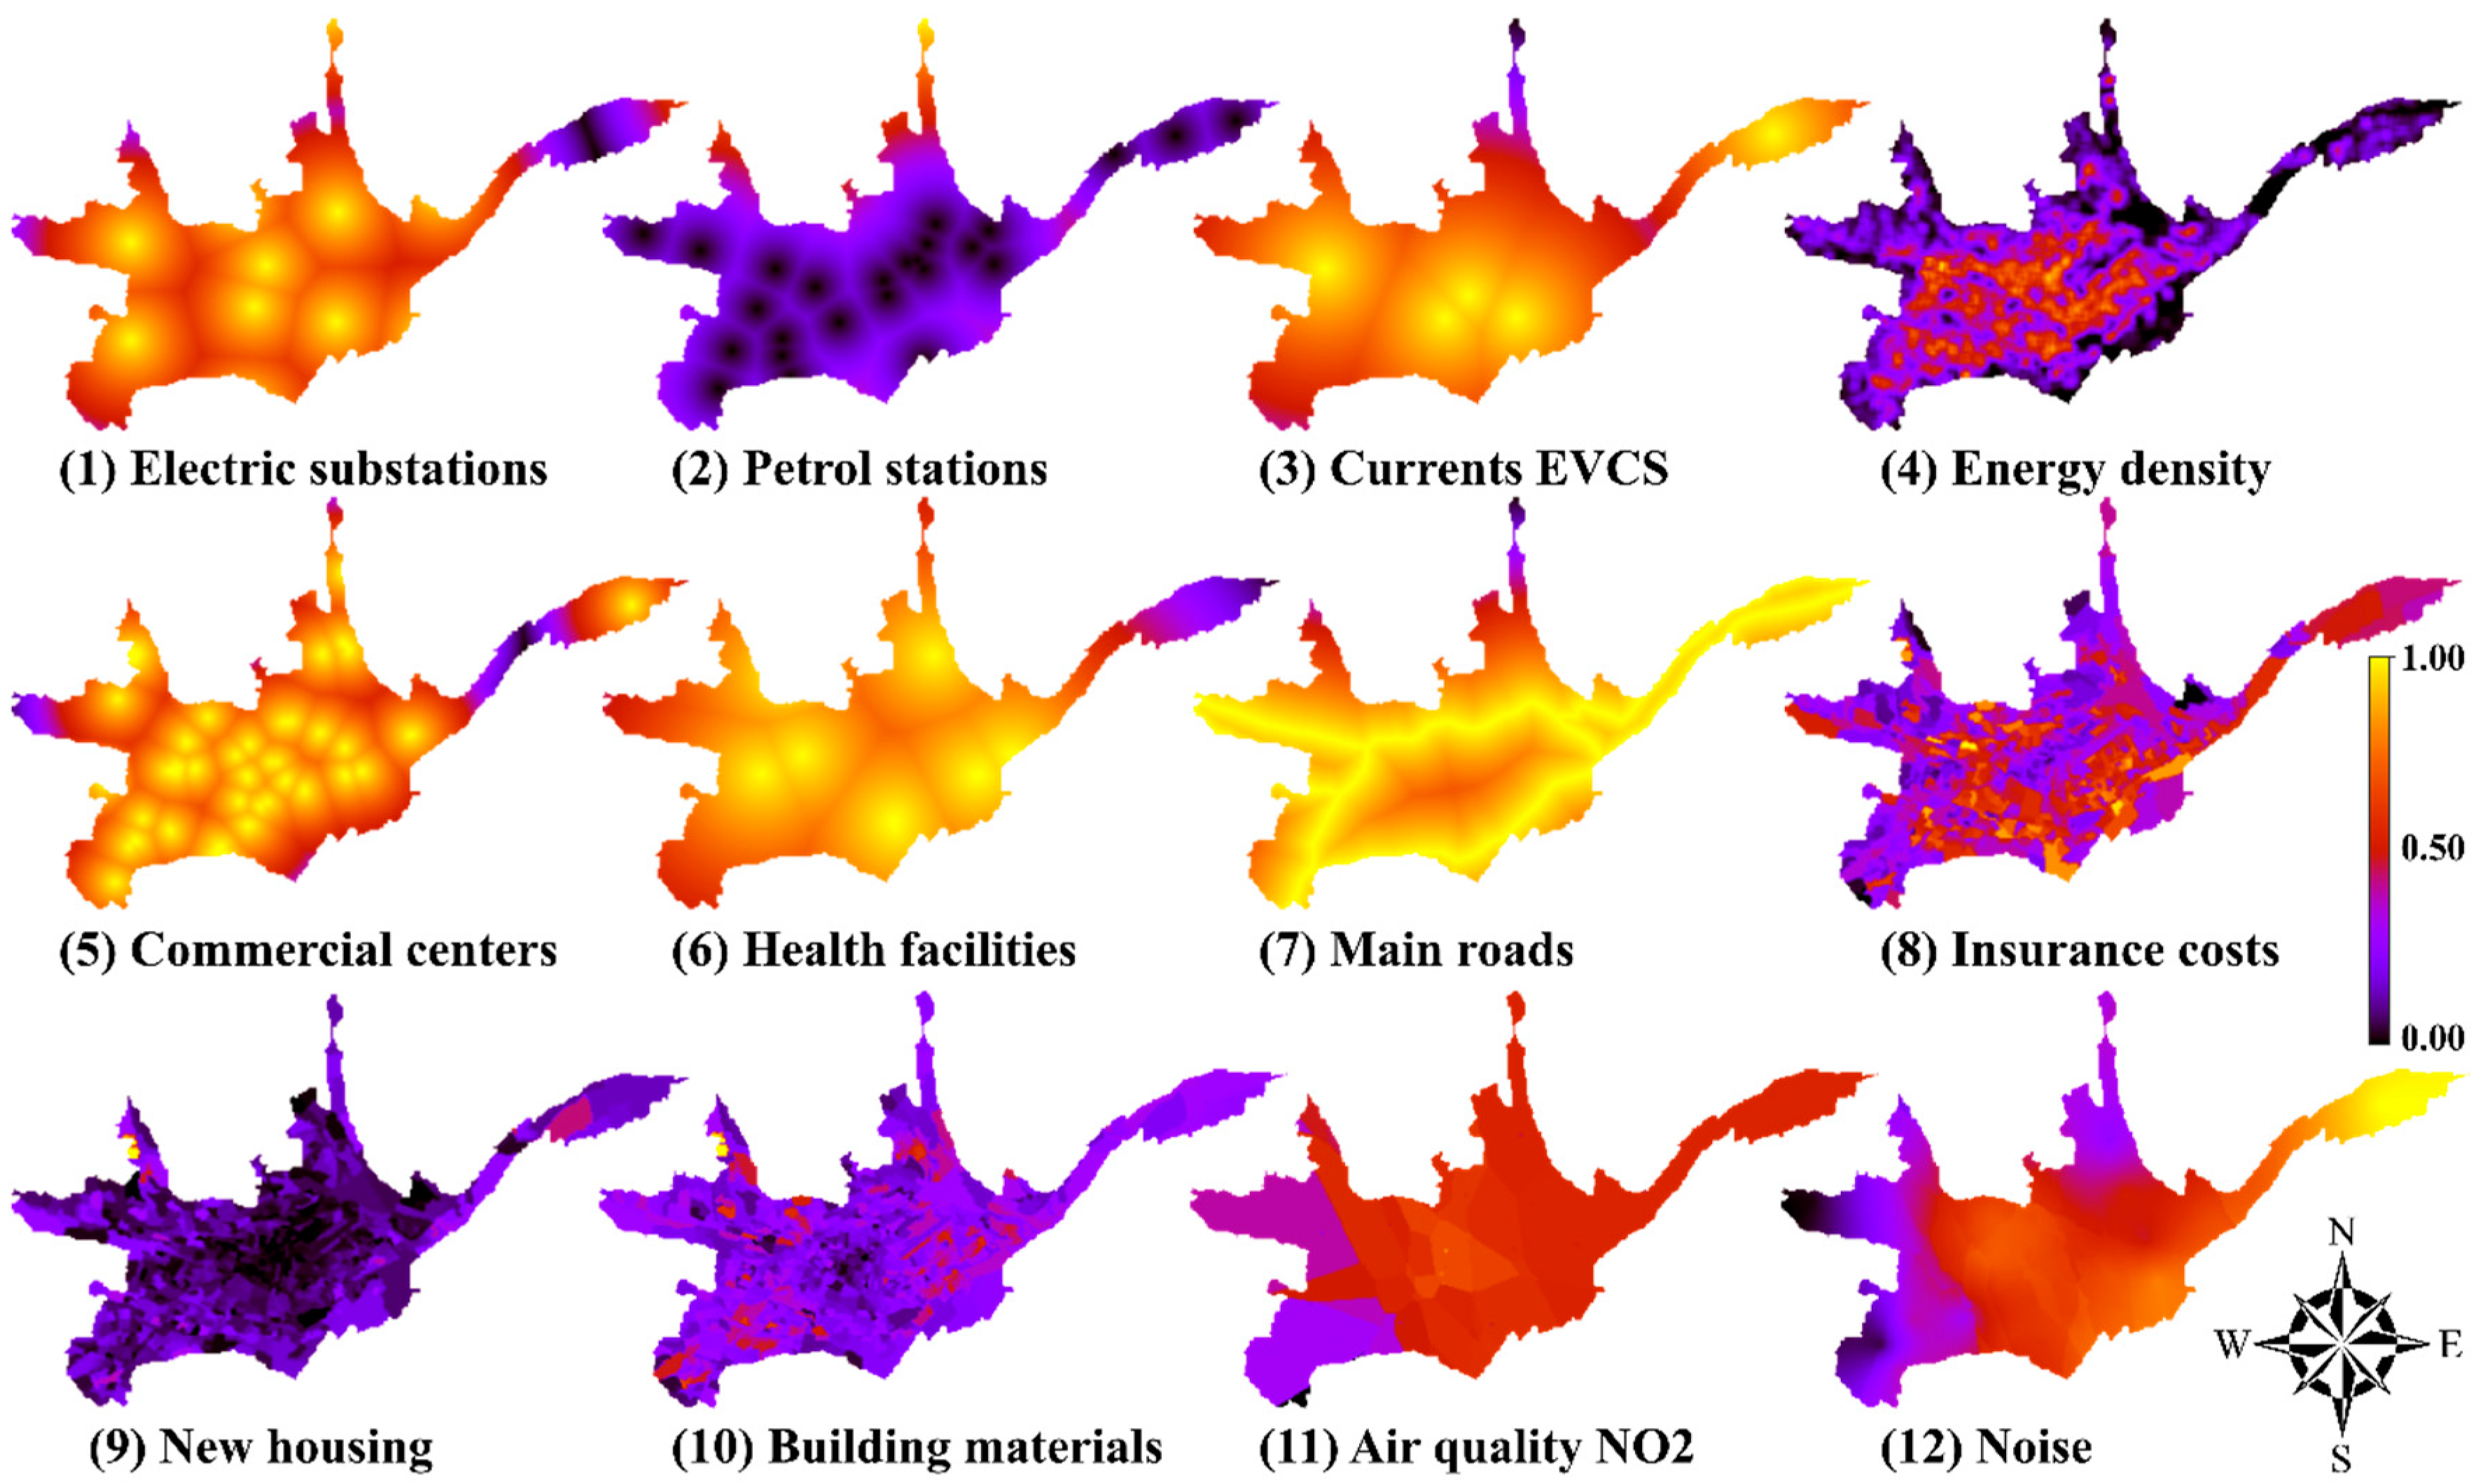
The processing of spatial criteria consists of four types of spatial analysis, as detailed in Table 5: proximity; density; spatial regression; and interpolation. Every one of the spatial criteria is illustrated in Figure 5. In the study, spatial restrictions are imposed on airports, military zones, watercourses, rivers, parks, recreational areas, protected land, and petrol stations.
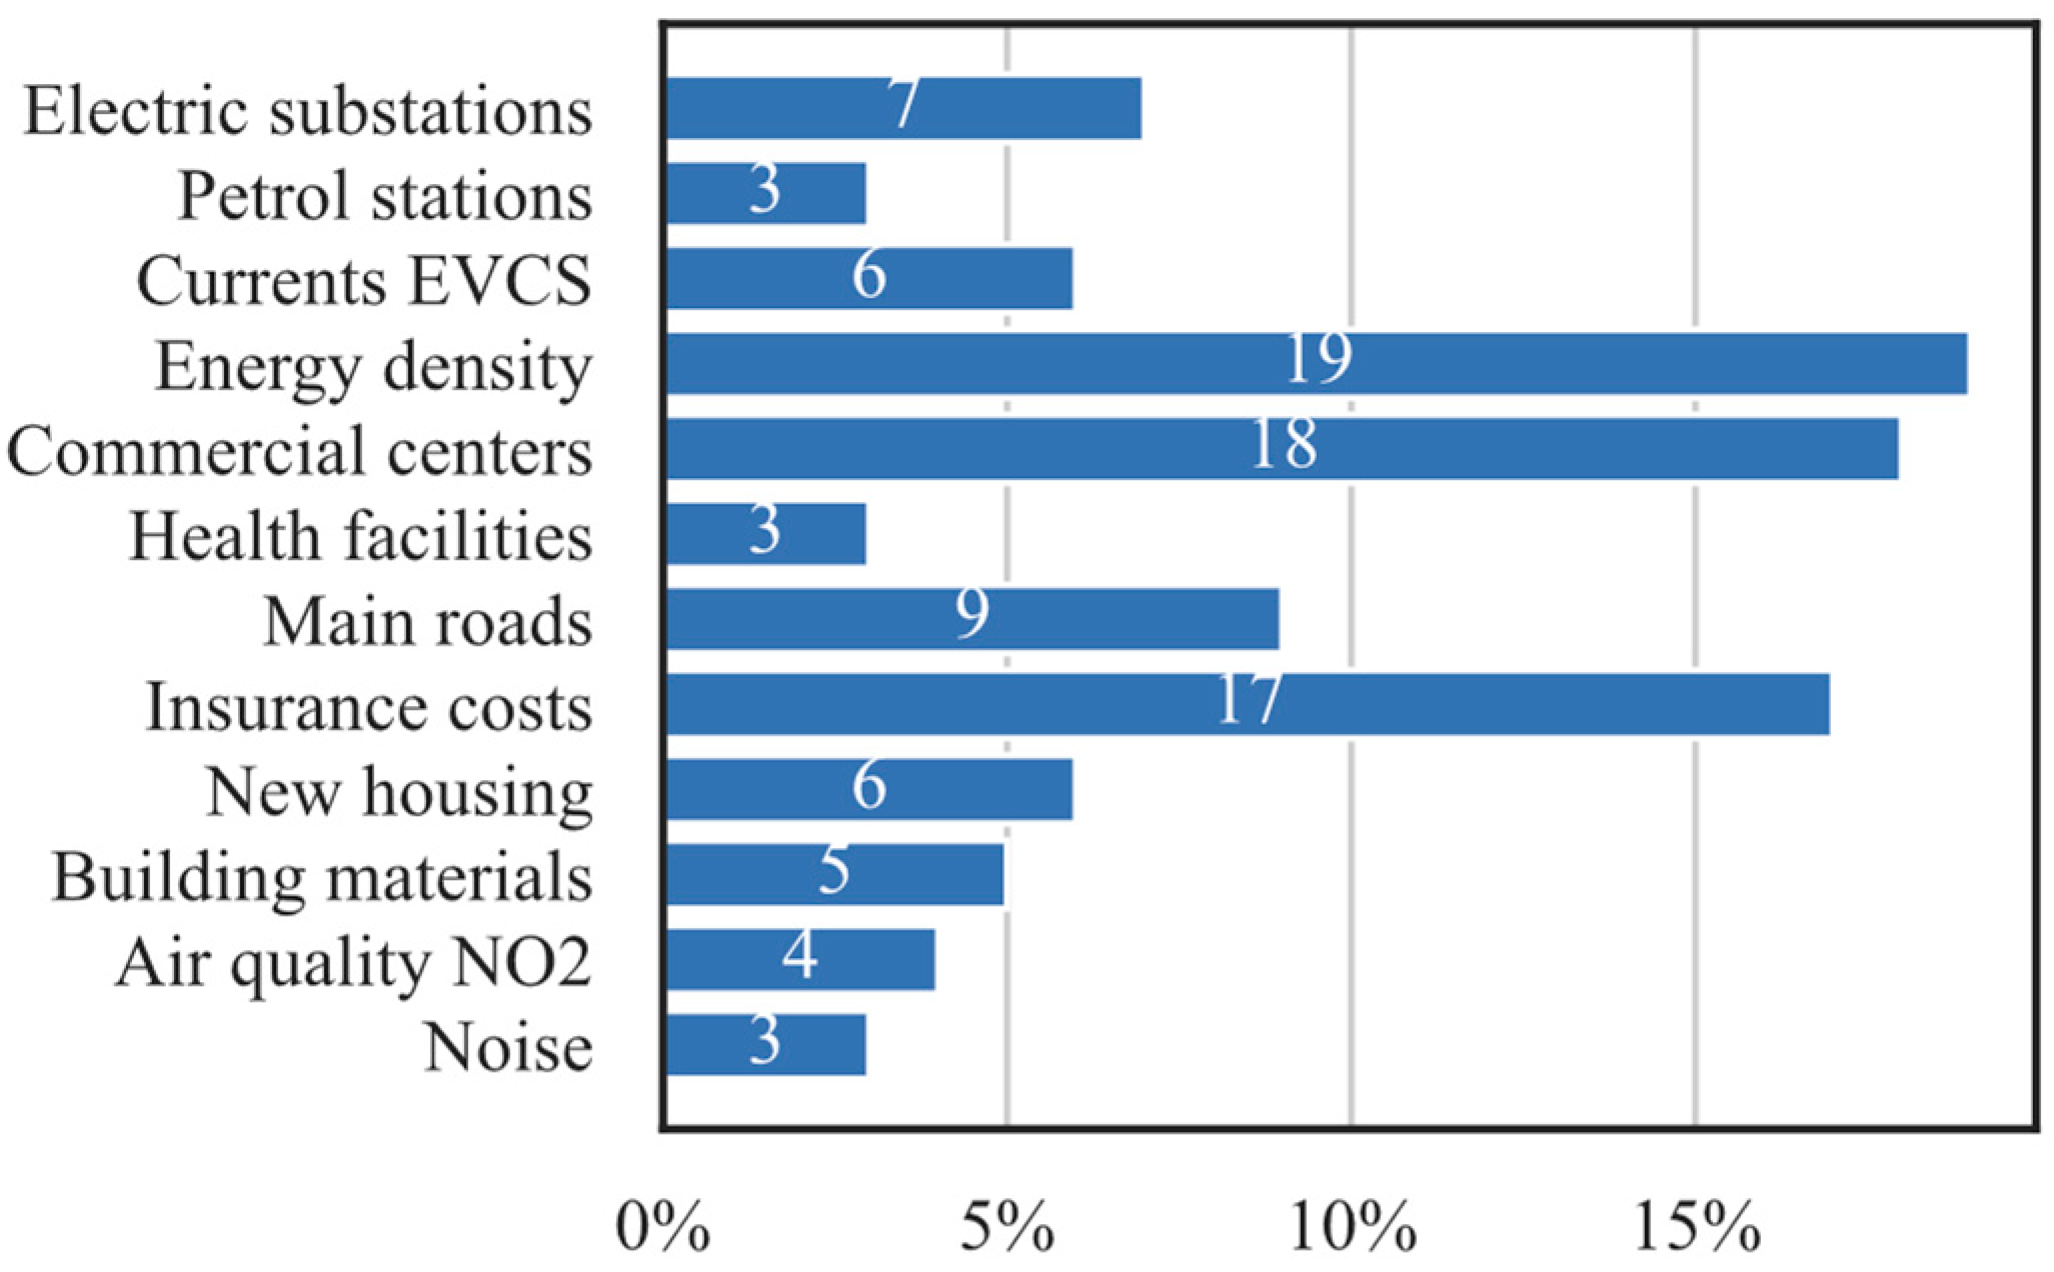
The weighting of the set of criteria needs to be carried out before beginning the spatial analysis procedure for suitability analysis. The AHP approach is applied to assign weights to twelve sub-criteria categorized under five main criteria: energy; social and economic; transportation; demographic; and environmental. The expert’s understanding of decision-making is expressed by the AHP approach using crisp numbers. These values are given through a pair-wise comparison based on the Saaty scale. The matrix comparison is shown in Table 6. The percentage weights calculated for each of the twelve sub-criteria are shown in Figure 6. Three criteria are highlighted: energy density; commercial centers; and insurance costs.
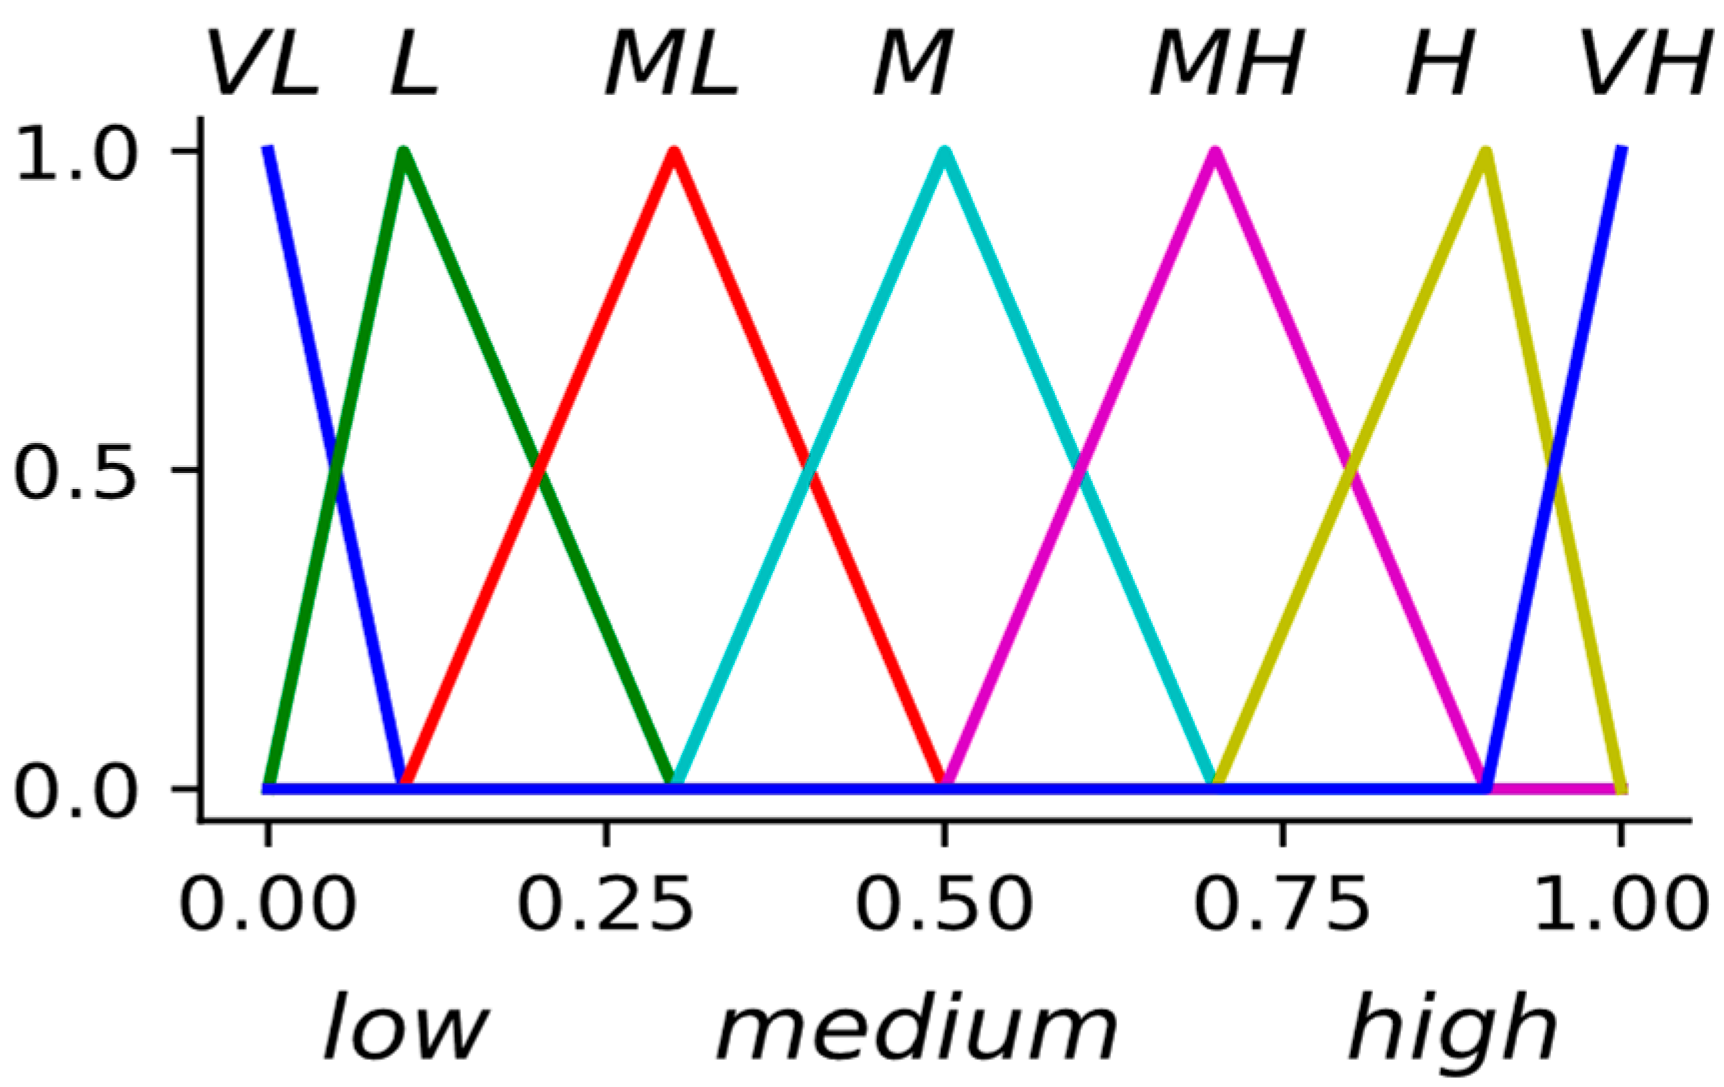
Three decision-makers from technical, economic, and social perspectives were selected considering their varied educational backgrounds and subject-matter expertise. Given the inherent uncertainty and imprecision in human judgment, the weighting of these criteria poses a significant challenge. Therefore, the three experts make their decisions using linguistic terms. The decision-maker assessment, employing linguistic terms, is presented in Table 7. The linguistic terms are characterized by a triangular fuzzy number, as shown in Figure 7. Seven triangle membership functions are employed: Very High (VH); High (H); Medium High (MH); Medium (M); Medium Low (ML); Low (L); and Very Low (VL).

4.3. Suitability Locations

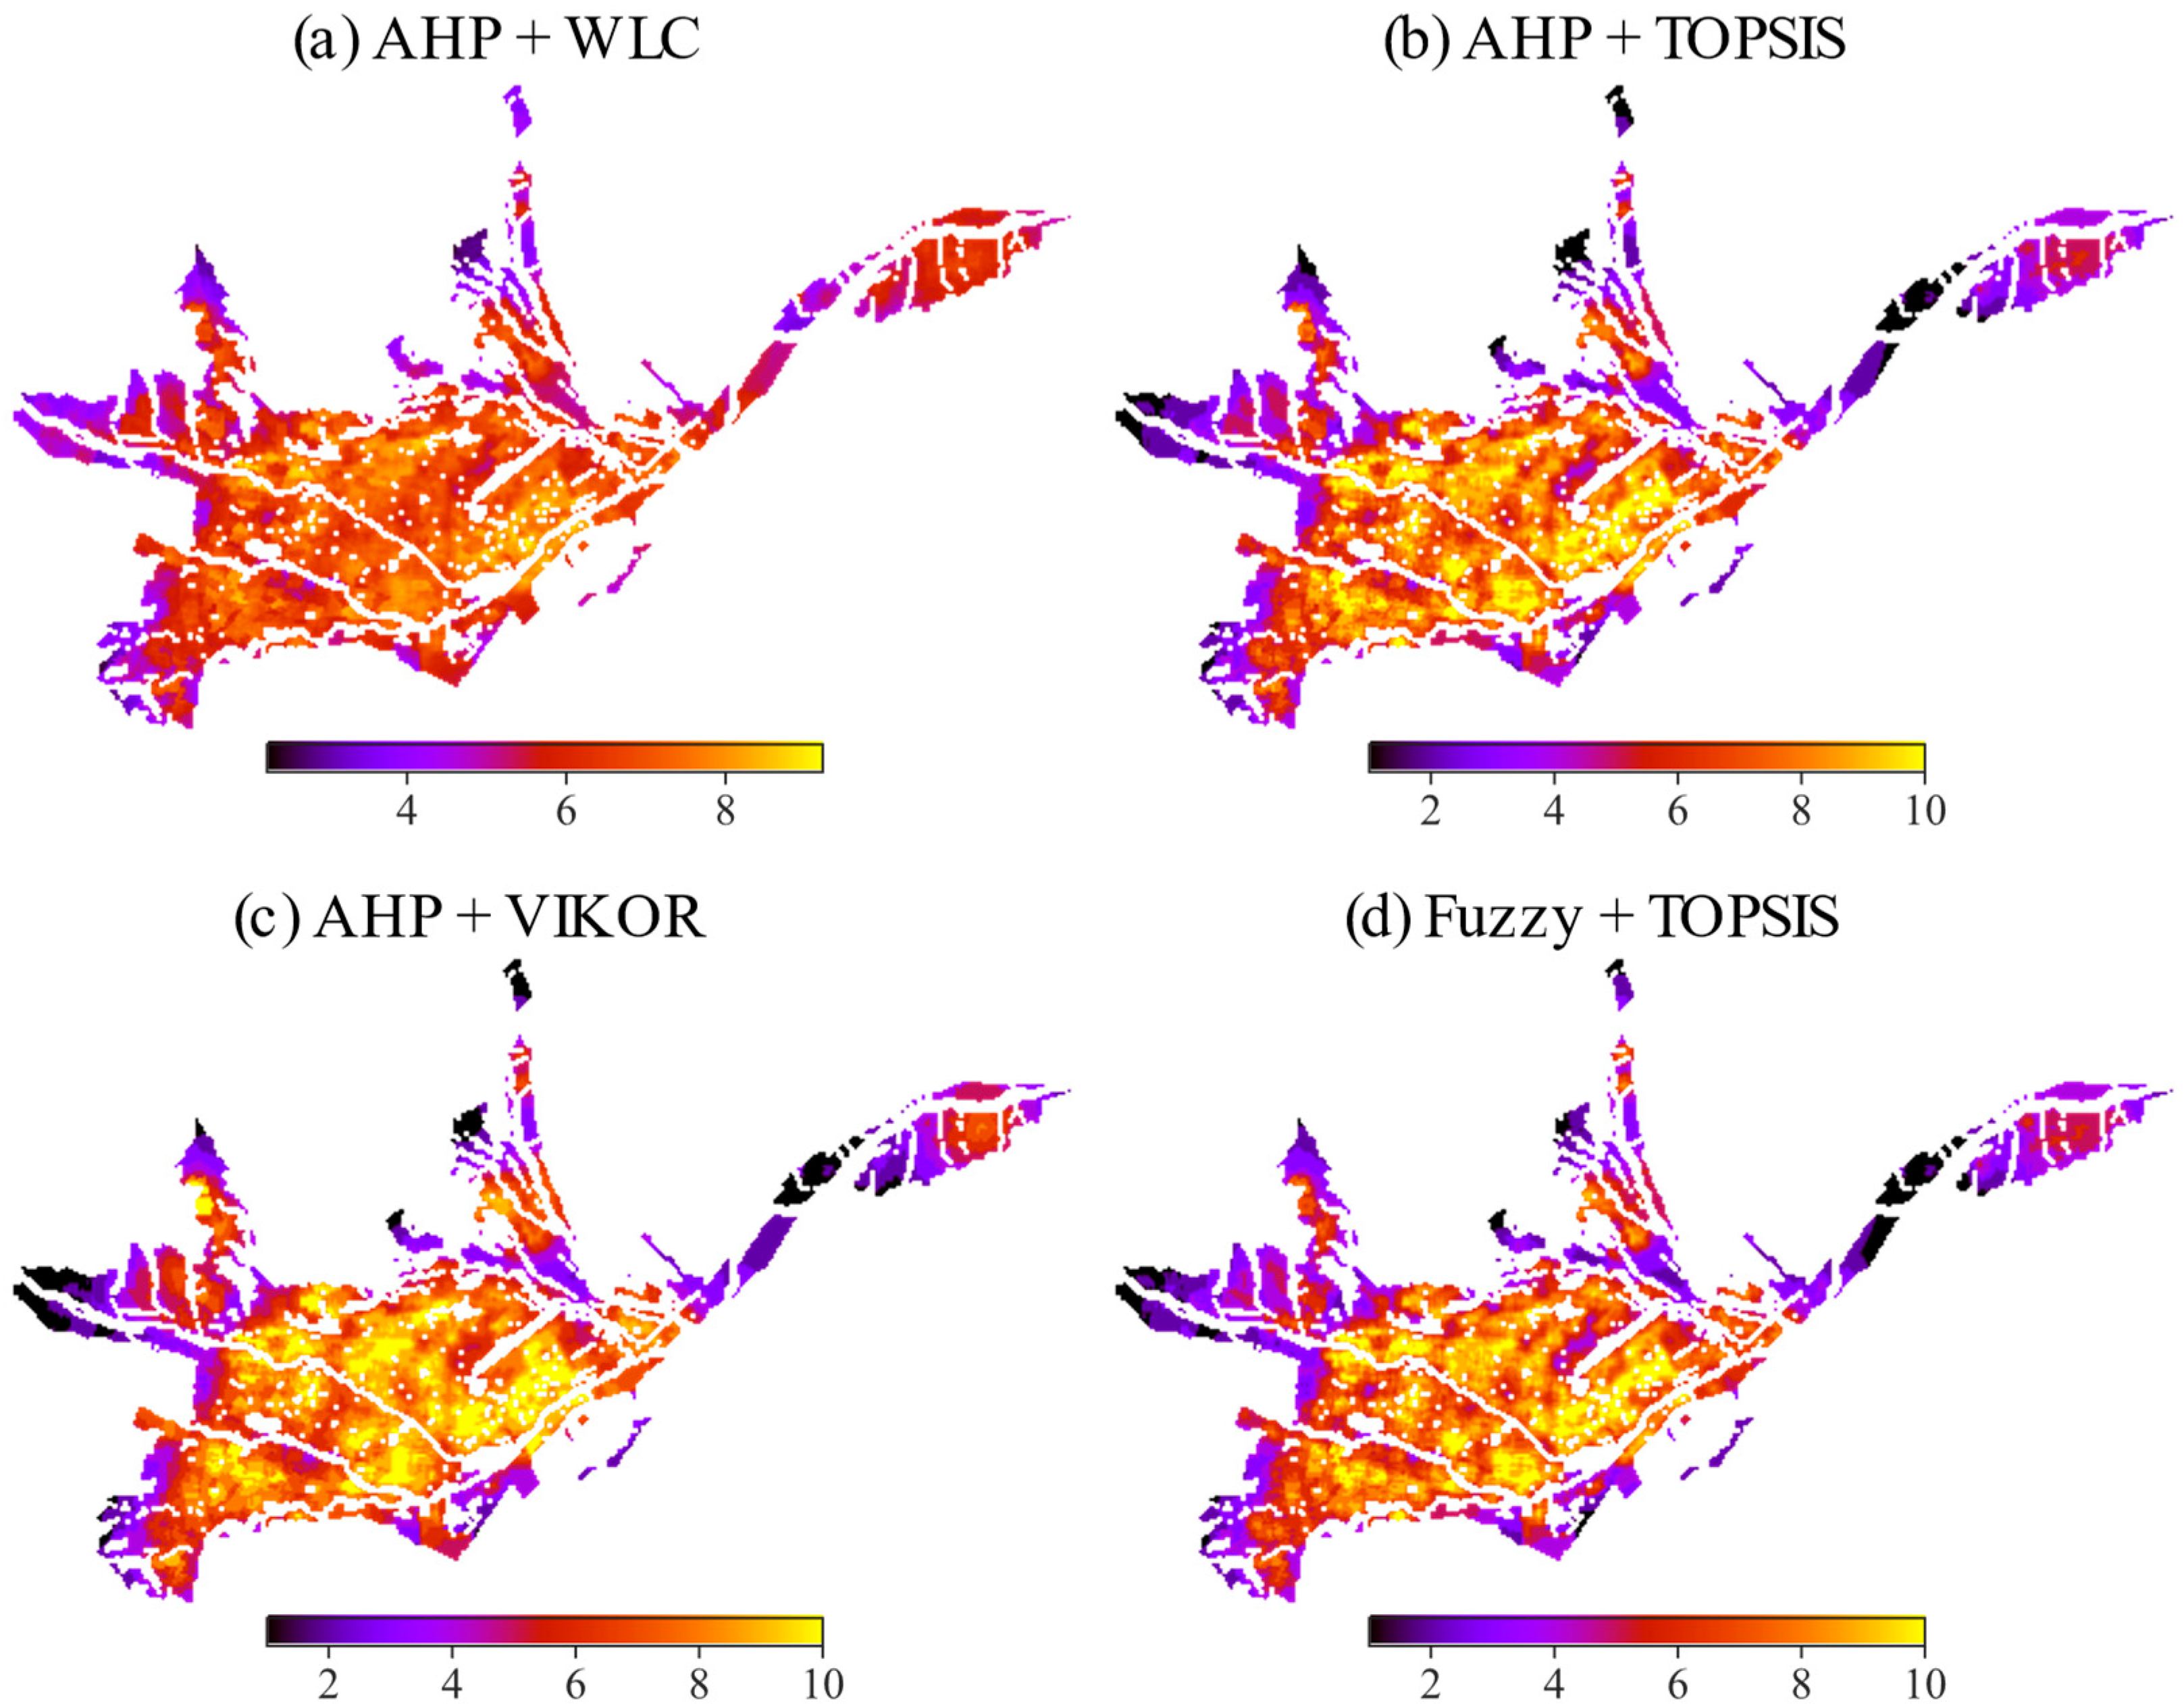
The layers are joined with spatial analysis techniques after a criterion weighting process, and the ranked candidate sites for EV charging stations are discovered. For comparison analysis purposes, four techniques are applied between the combined methods of AHP + WLC, AHP + TOPSIS, AHP + VIKOR, and FUZZY + TOPSIS. The consistency of the algorithms’ outcomes is displayed in Figure 8. The outcomes, as heatmaps, are adjusted with a higher ranking for the most suitable sites. The suitable spatial pattern seems consistent across all model results. One noteworthy feature is that AHP + WLC shows a comparable spatial pattern but at a reduced scale.
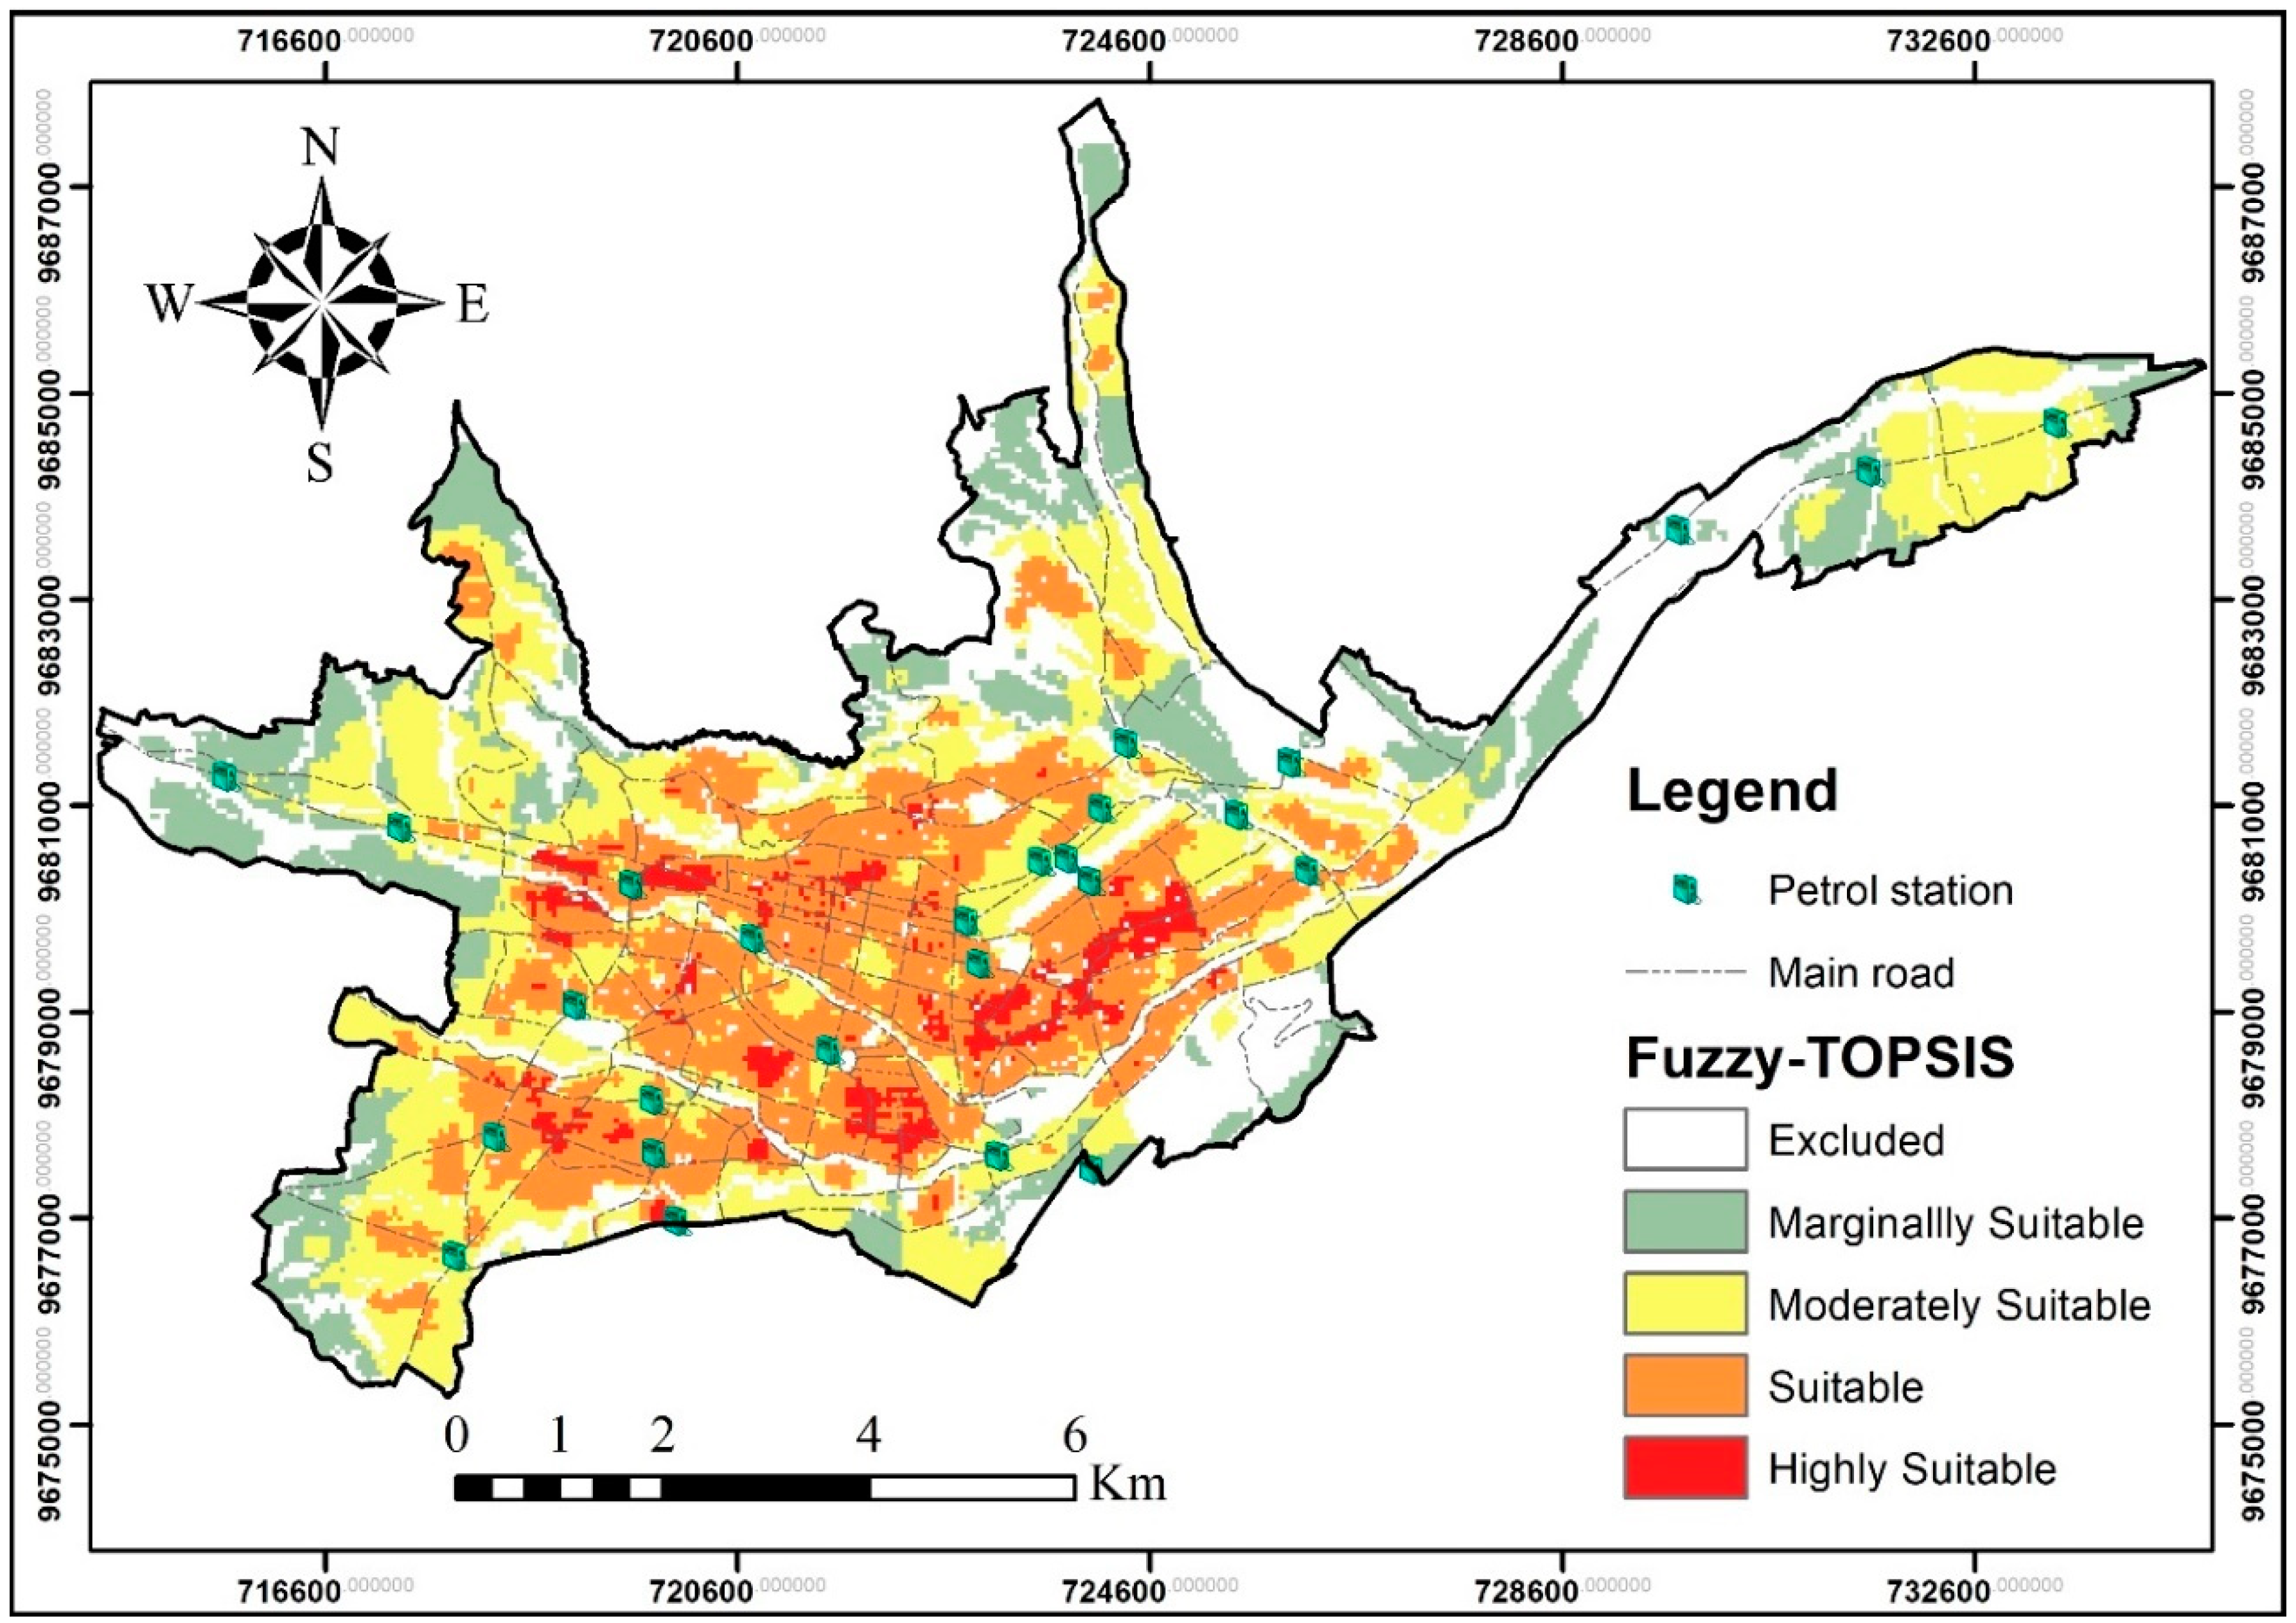
As seen in Figure 8, all results depict the same spatial pattern. The southwest and south of the city are the primary areas of suitability. The commercial centers are the primary influence points, supported by high-consumption residential neighborhoods. Areas with high insurance costs add valuable preference, as do roads that promote easy access. The fuzzy-TOPSIS result, Figure 9, is chosen to locate new public charging stations. The fuzzy method takes advantage of the fuzzy membership of the weights, unlike the crisp values obtained from the AHP method.

4.4. EV Charging Station Increase

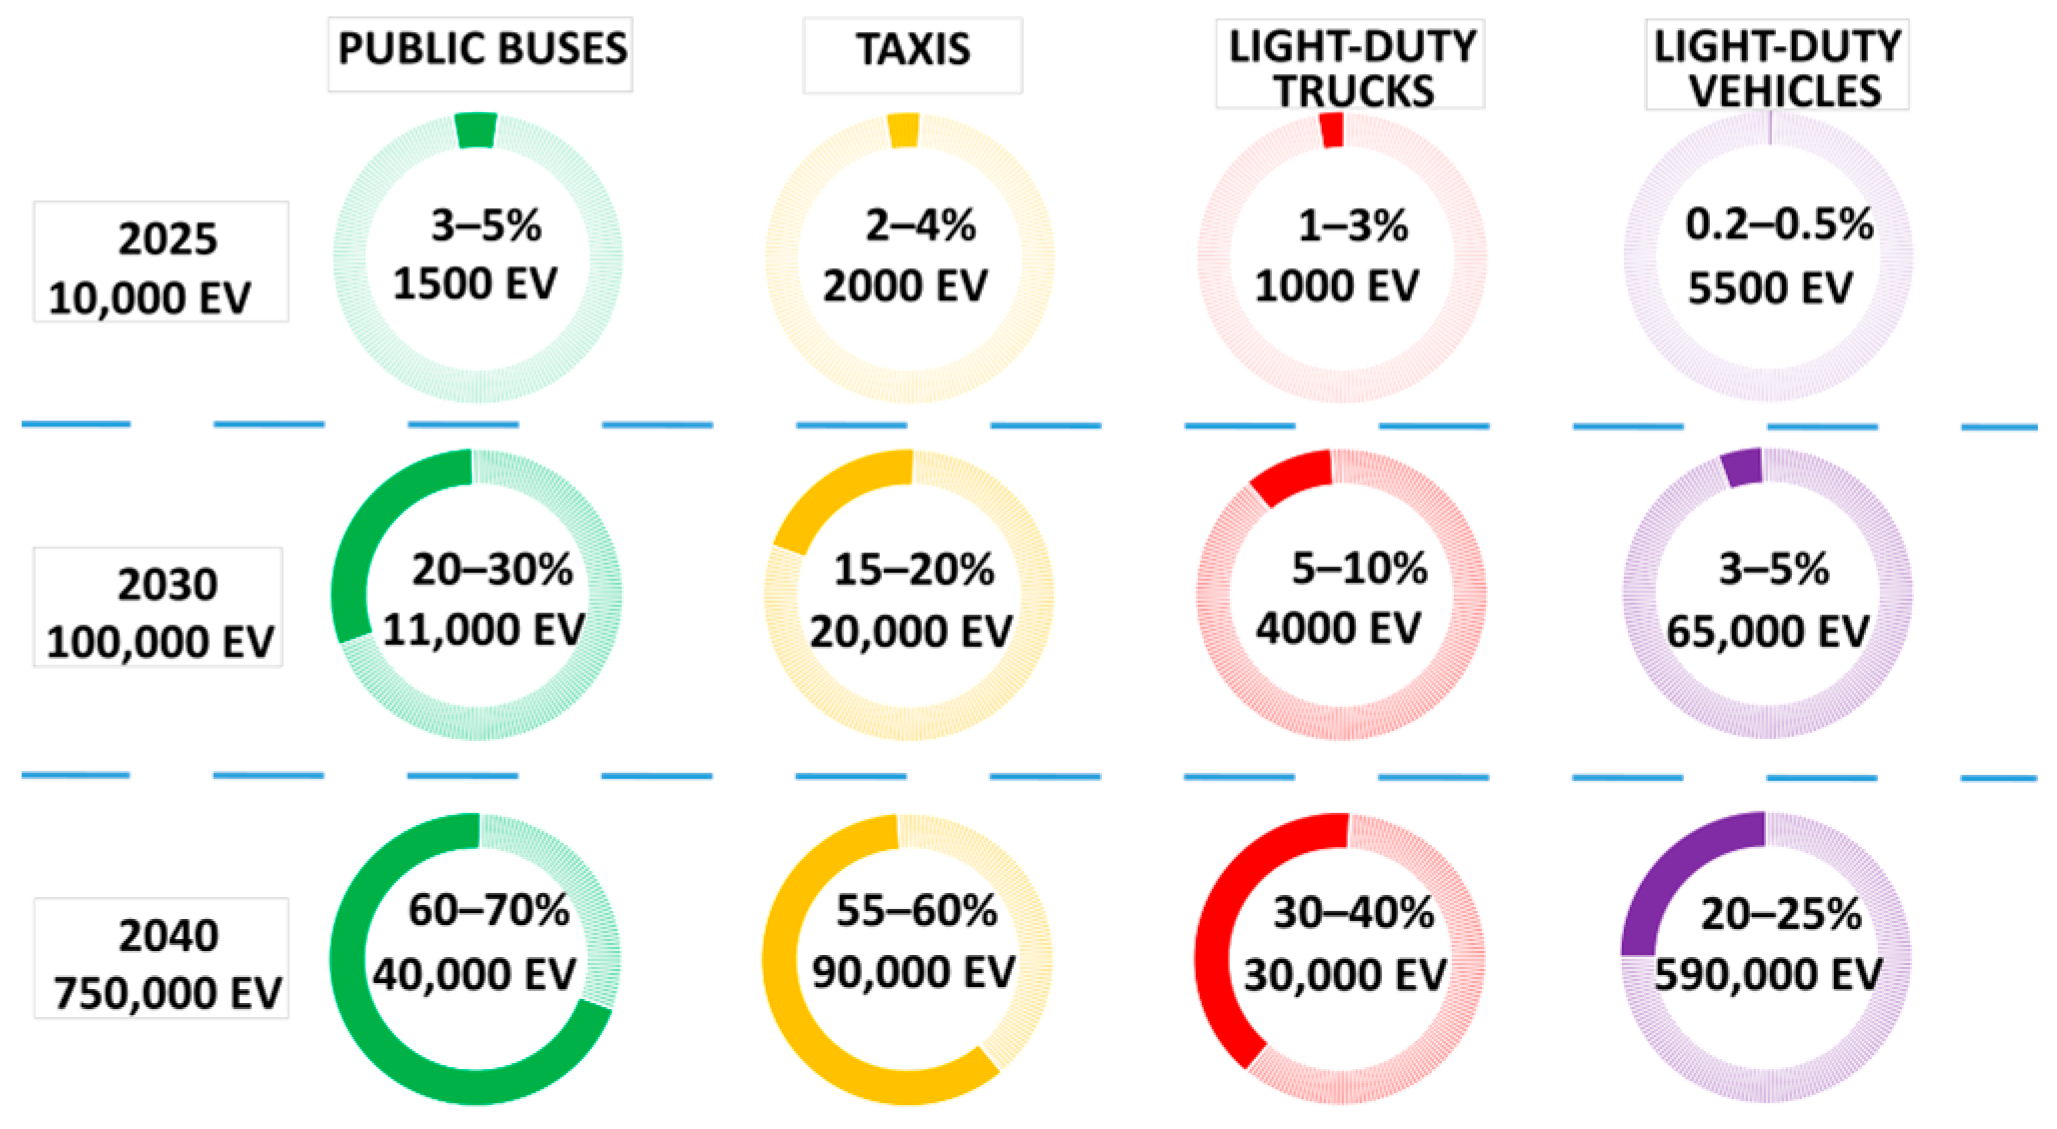
On 30 September 2021, the “Ministerio de Transporte y Obras Públicas” (MTOP) with the technical support of the Inter-American Development Bank (IDB) introduced the National Electromobility Strategy [55], aiming to reach 10,000 Battery Electric Vehicles (BEVs) by 2025, 100,000 BEVs by 2030, and eventually 750,000 BEVs by 2040, equating to around 60–70% of public buses, 60% of taxis, 30–40% of light cargo trucks, and 20–25% of all light vehicles in the country. The strategy to reduce the carbon footprint of the transportation sector in Ecuador is shown in Figure 10. This can bring significant economic and environmental benefits, including $6.4 billion in foreign currency savings, $700 million in CO2 emission reductions, and $143 million in reduced greenhouse gas emissions [56]. Only in Cuenca city, there 139,818 light-duty vehicles. The overall policy goal established by INEC is to achieve 25% of light-duty vehicles supported by electric vehicles by 2040. As a result, 34,955 electric vehicles are expected to be on the road by 2040.
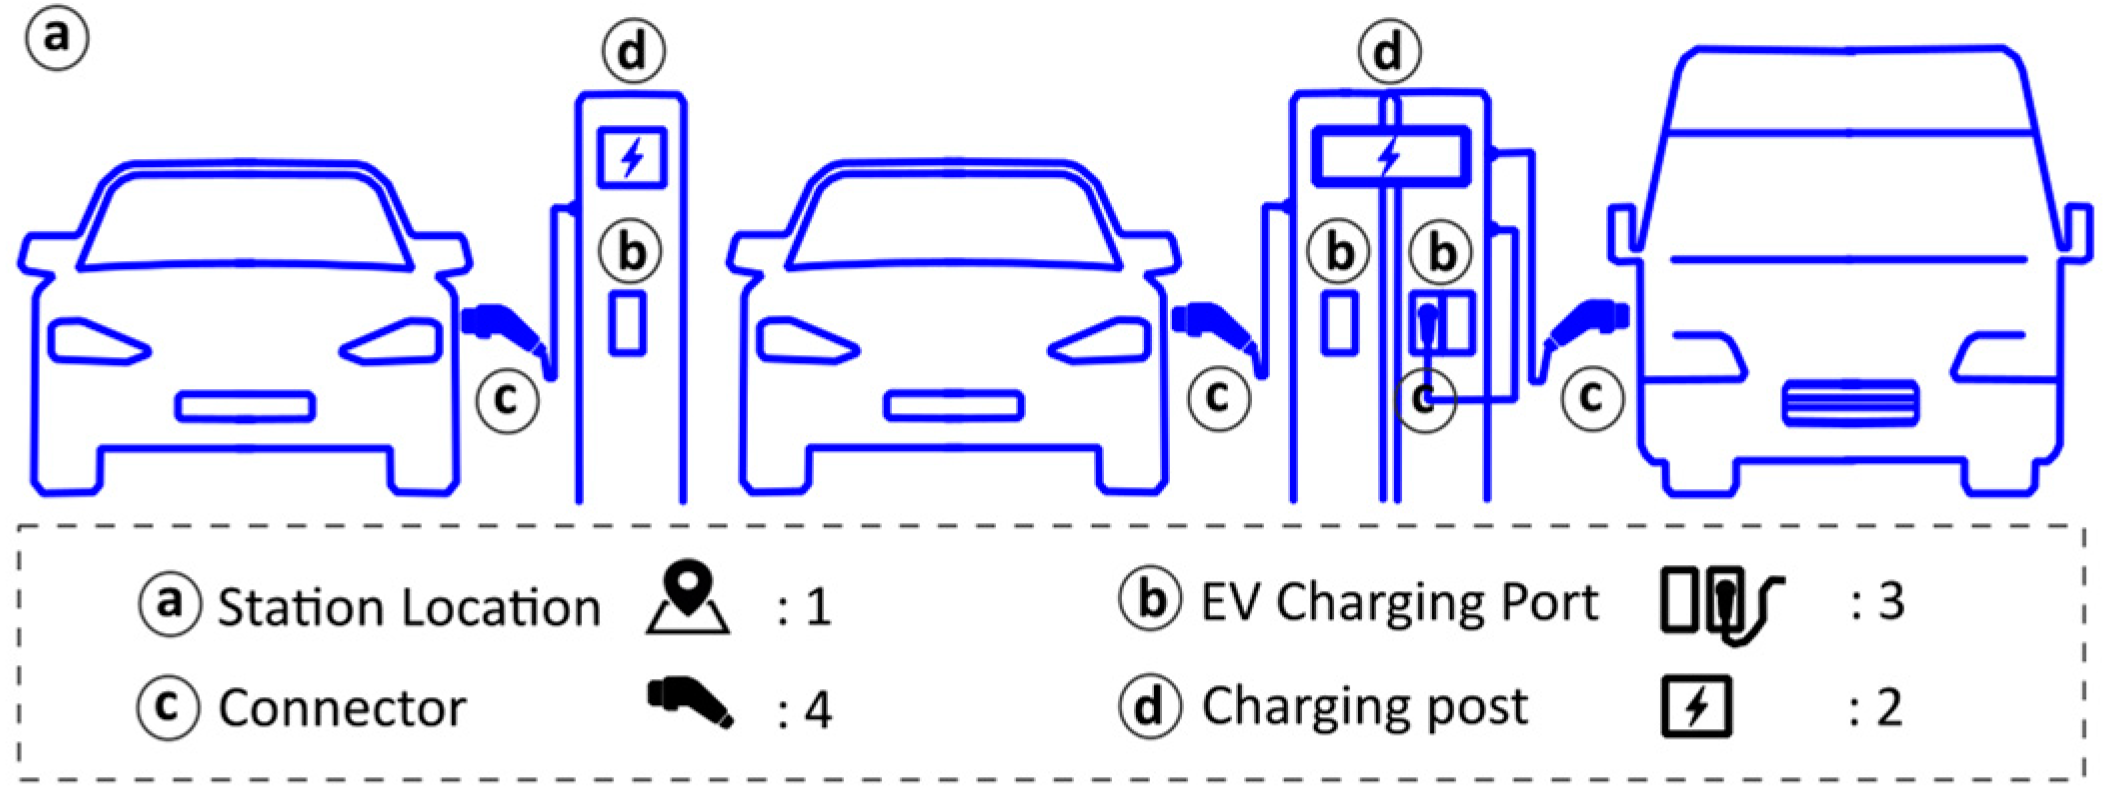
Four levels of EV charging are determined by the type of connector and consumer requirements. They offer different charging experiences based on their power output capacities over time. There is no standard design ‘one size fits all’ solution to providing operational feasibility for EV owners. The right public charging station needs to consider the most appropriate mix of connectors while balancing road user demand and infrastructure costs. Figure 11 depicts one station location according to the Open Charge Point Interface (OCPI) protocol, including three EV charging ports, four connectors, and two charging posts. (a) A station location is a site with one or more EV charging ports at the same address. (b) An EV charging port provides the power to charge only one vehicle at a time, even though it may have multiple connectors. (c) A connector is what is plugged into a vehicle to charge it. (d) A charging post is a unit that houses EV charging ports, which can have one or more EV charging ports.
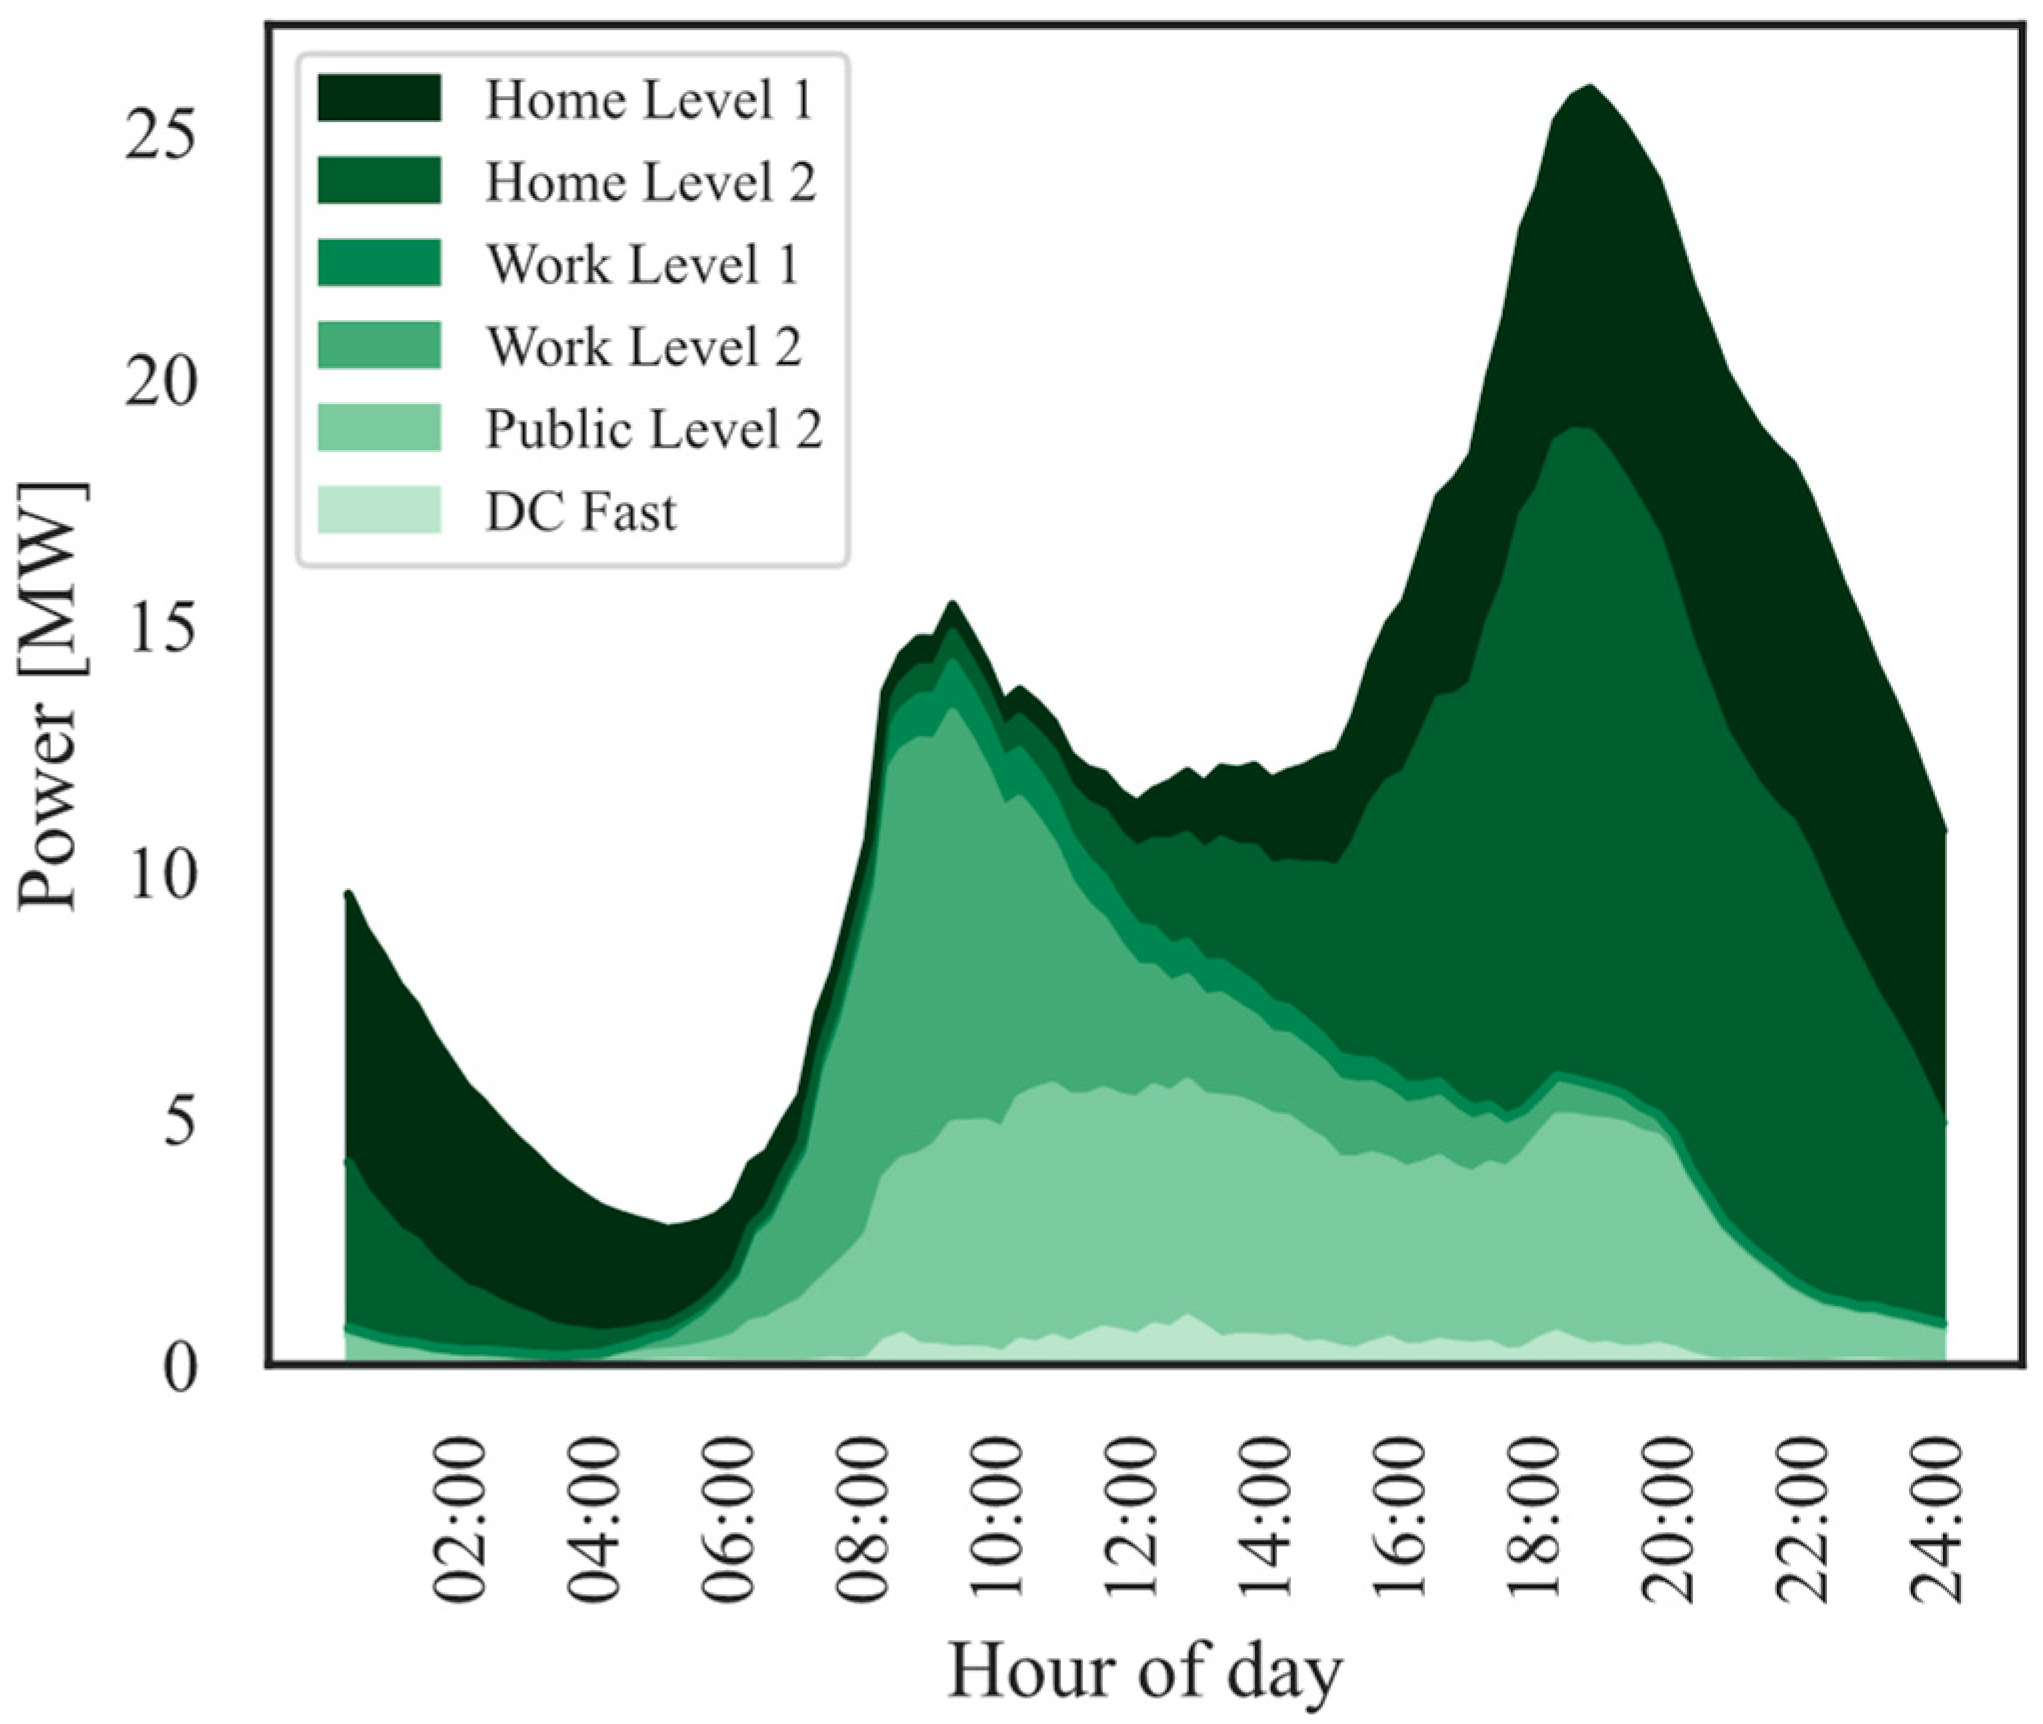
Deploying a convenient network of charging stations is crucial to accelerating the increase of EVs and lowering EV owners’ range anxiety. For a widespread increase in EVs, a robust network of charging stations needs significant electrical upgrades to support them. These charging stations consist of public charging, workplace charging, and home charging, as shown in Table 1. The EVI-Pro Lite tool [57] is available to estimate the quantity and type of charging infrastructure necessary to support regional EV increases. The electric vehicle infrastructure required is drawn from detailed data about personal vehicle travel patterns, EV attributes, and charging station characteristics. Additionally, it helps determine the impact of EV charging on electricity demand through a load profile. Load profiles are built from a load research process that is supported by many measurements of consumption habits. By using this tool, a weekday electric profile for the expected 35,000 EVs is produced (Figure 12). From this, work levels 1 and 2, public level 2, and DC fast electric profiles are used in this study.

4.5. Final Discussion

The substations are the connection places of the transmission and distribution systems, taking power at high voltage levels and routing it to primary voltage feeders. The transformers are the most distinguishing characteristic of a distribution substation, and the sum of all transformer ratings defines a substation’s capacity. In substation-level planning, a substation’s size is typically determined by adding up all of the feeder loads (cumulative loads) and incorporating load forecasting. There are nine distribution substations in the study area. The S/E 01 and S/E 02, located in the core urban area, are part of the 22 kV network. The remaining ones make up the 69 kV network. Accordingly, under Oil Natural—Air Natural (ONAN) cooling, the core urban area’s capacity is 30 MW, while the remaining area has a capacity of 246 MW. Table 8 summarizes the substations’ characteristics, showing the current peak load reached at each one. Reserve capacity refers to the remaining capability of transformers, based on their rated power, to accommodate load growth. Figure 13 shows the substation connection through the subtransmission network.
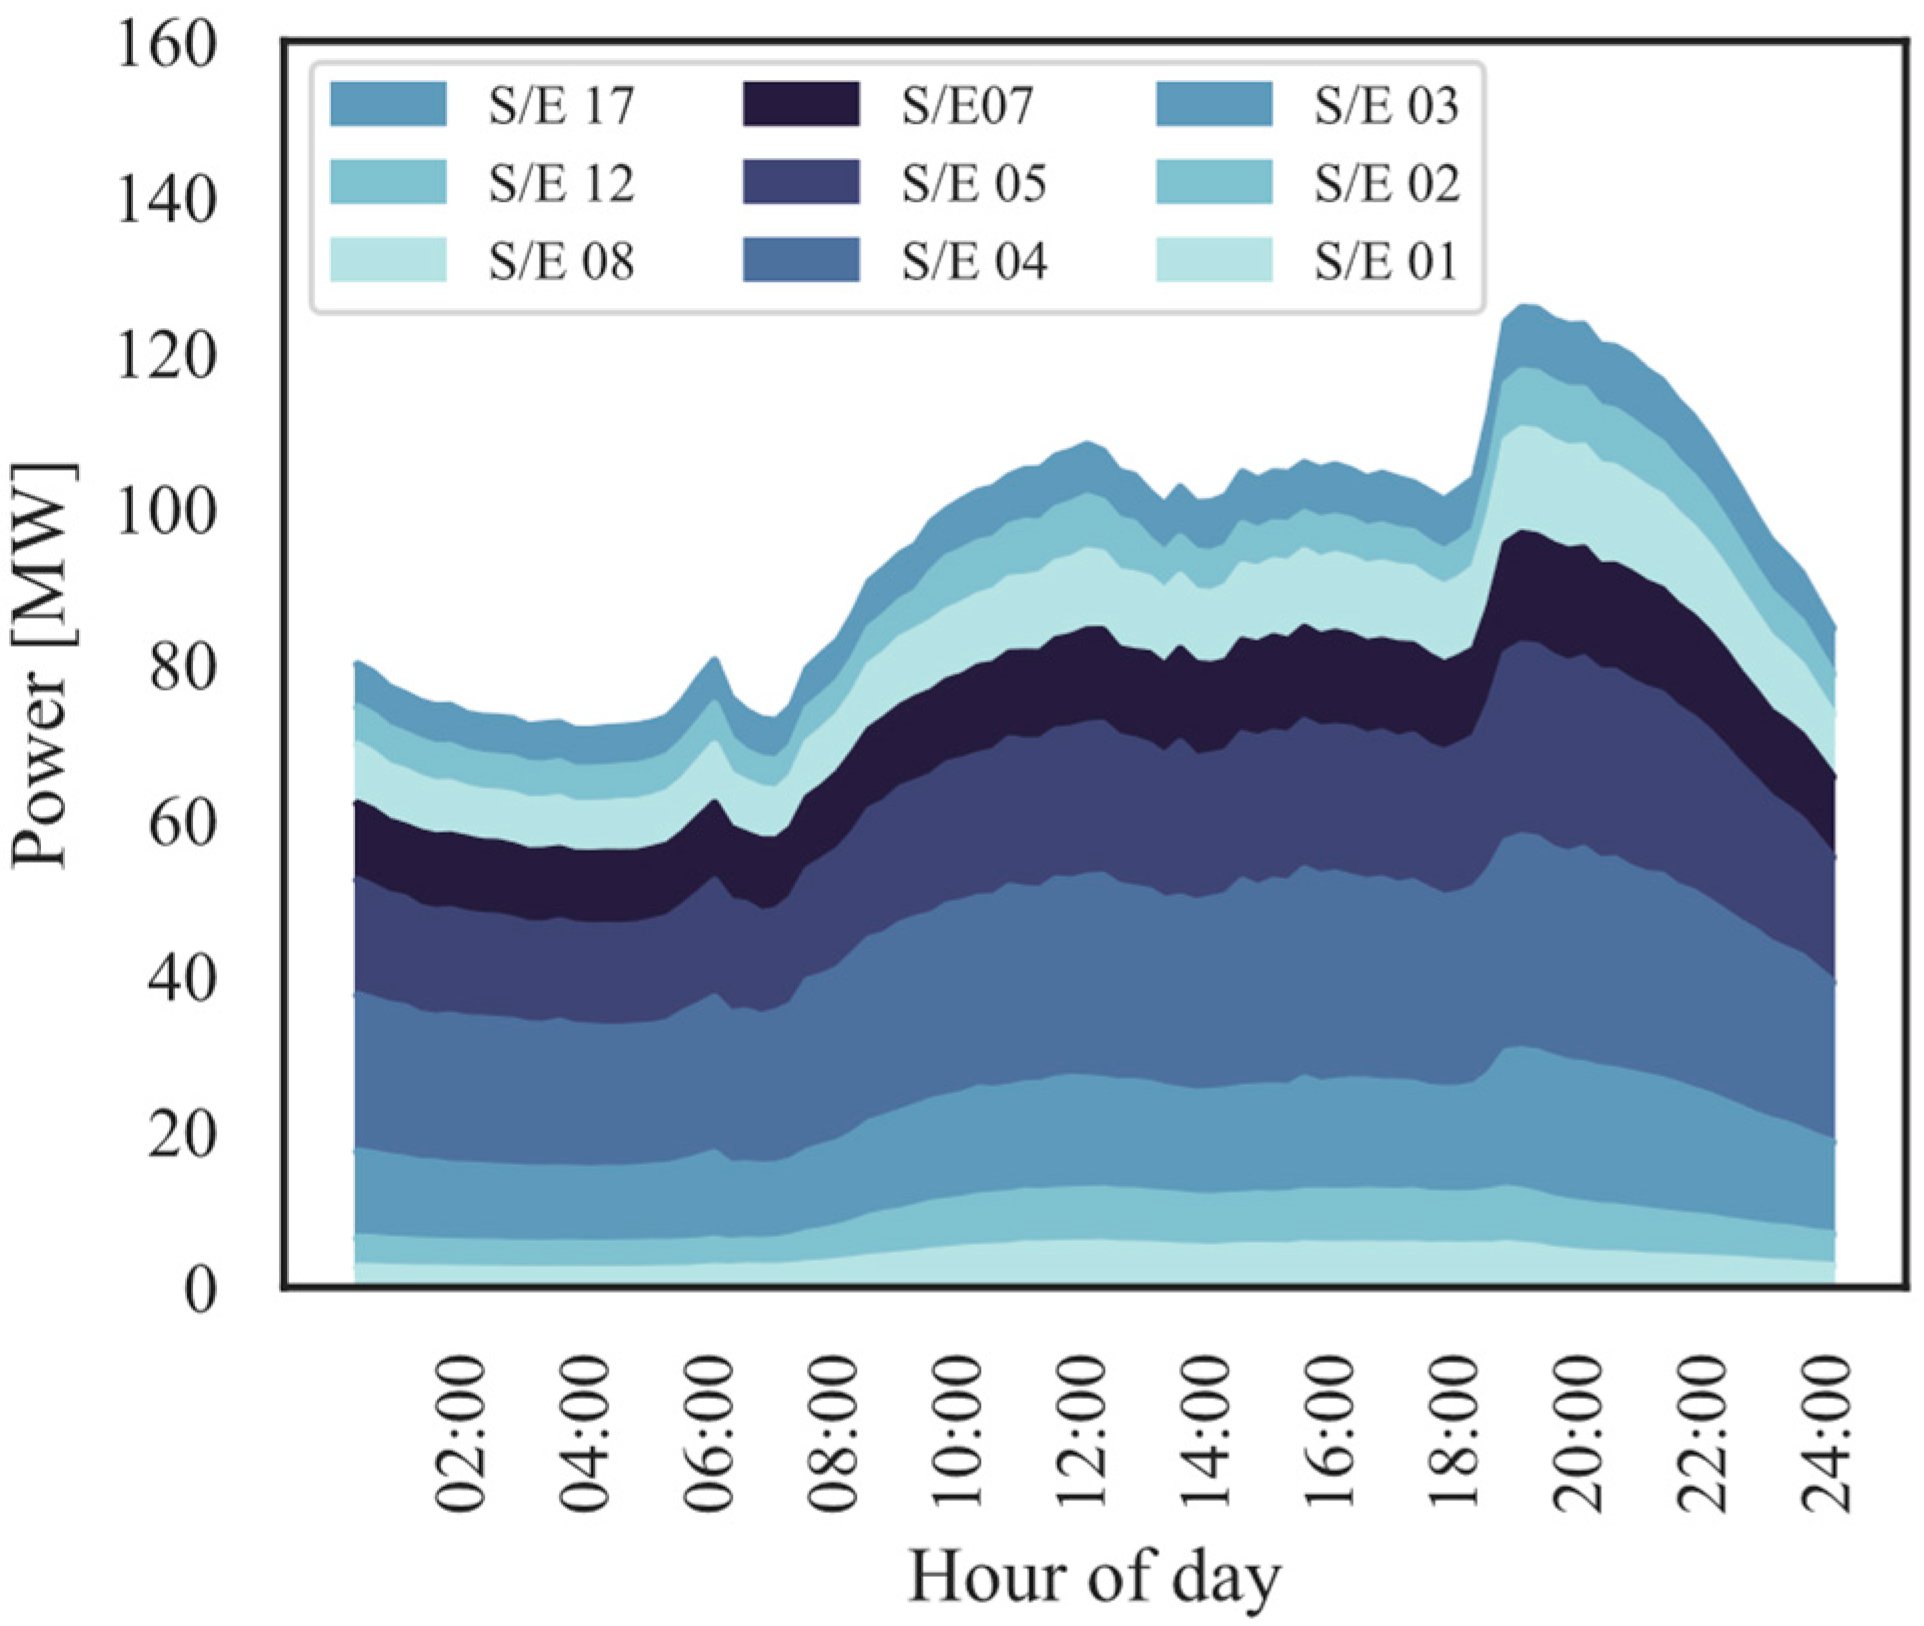
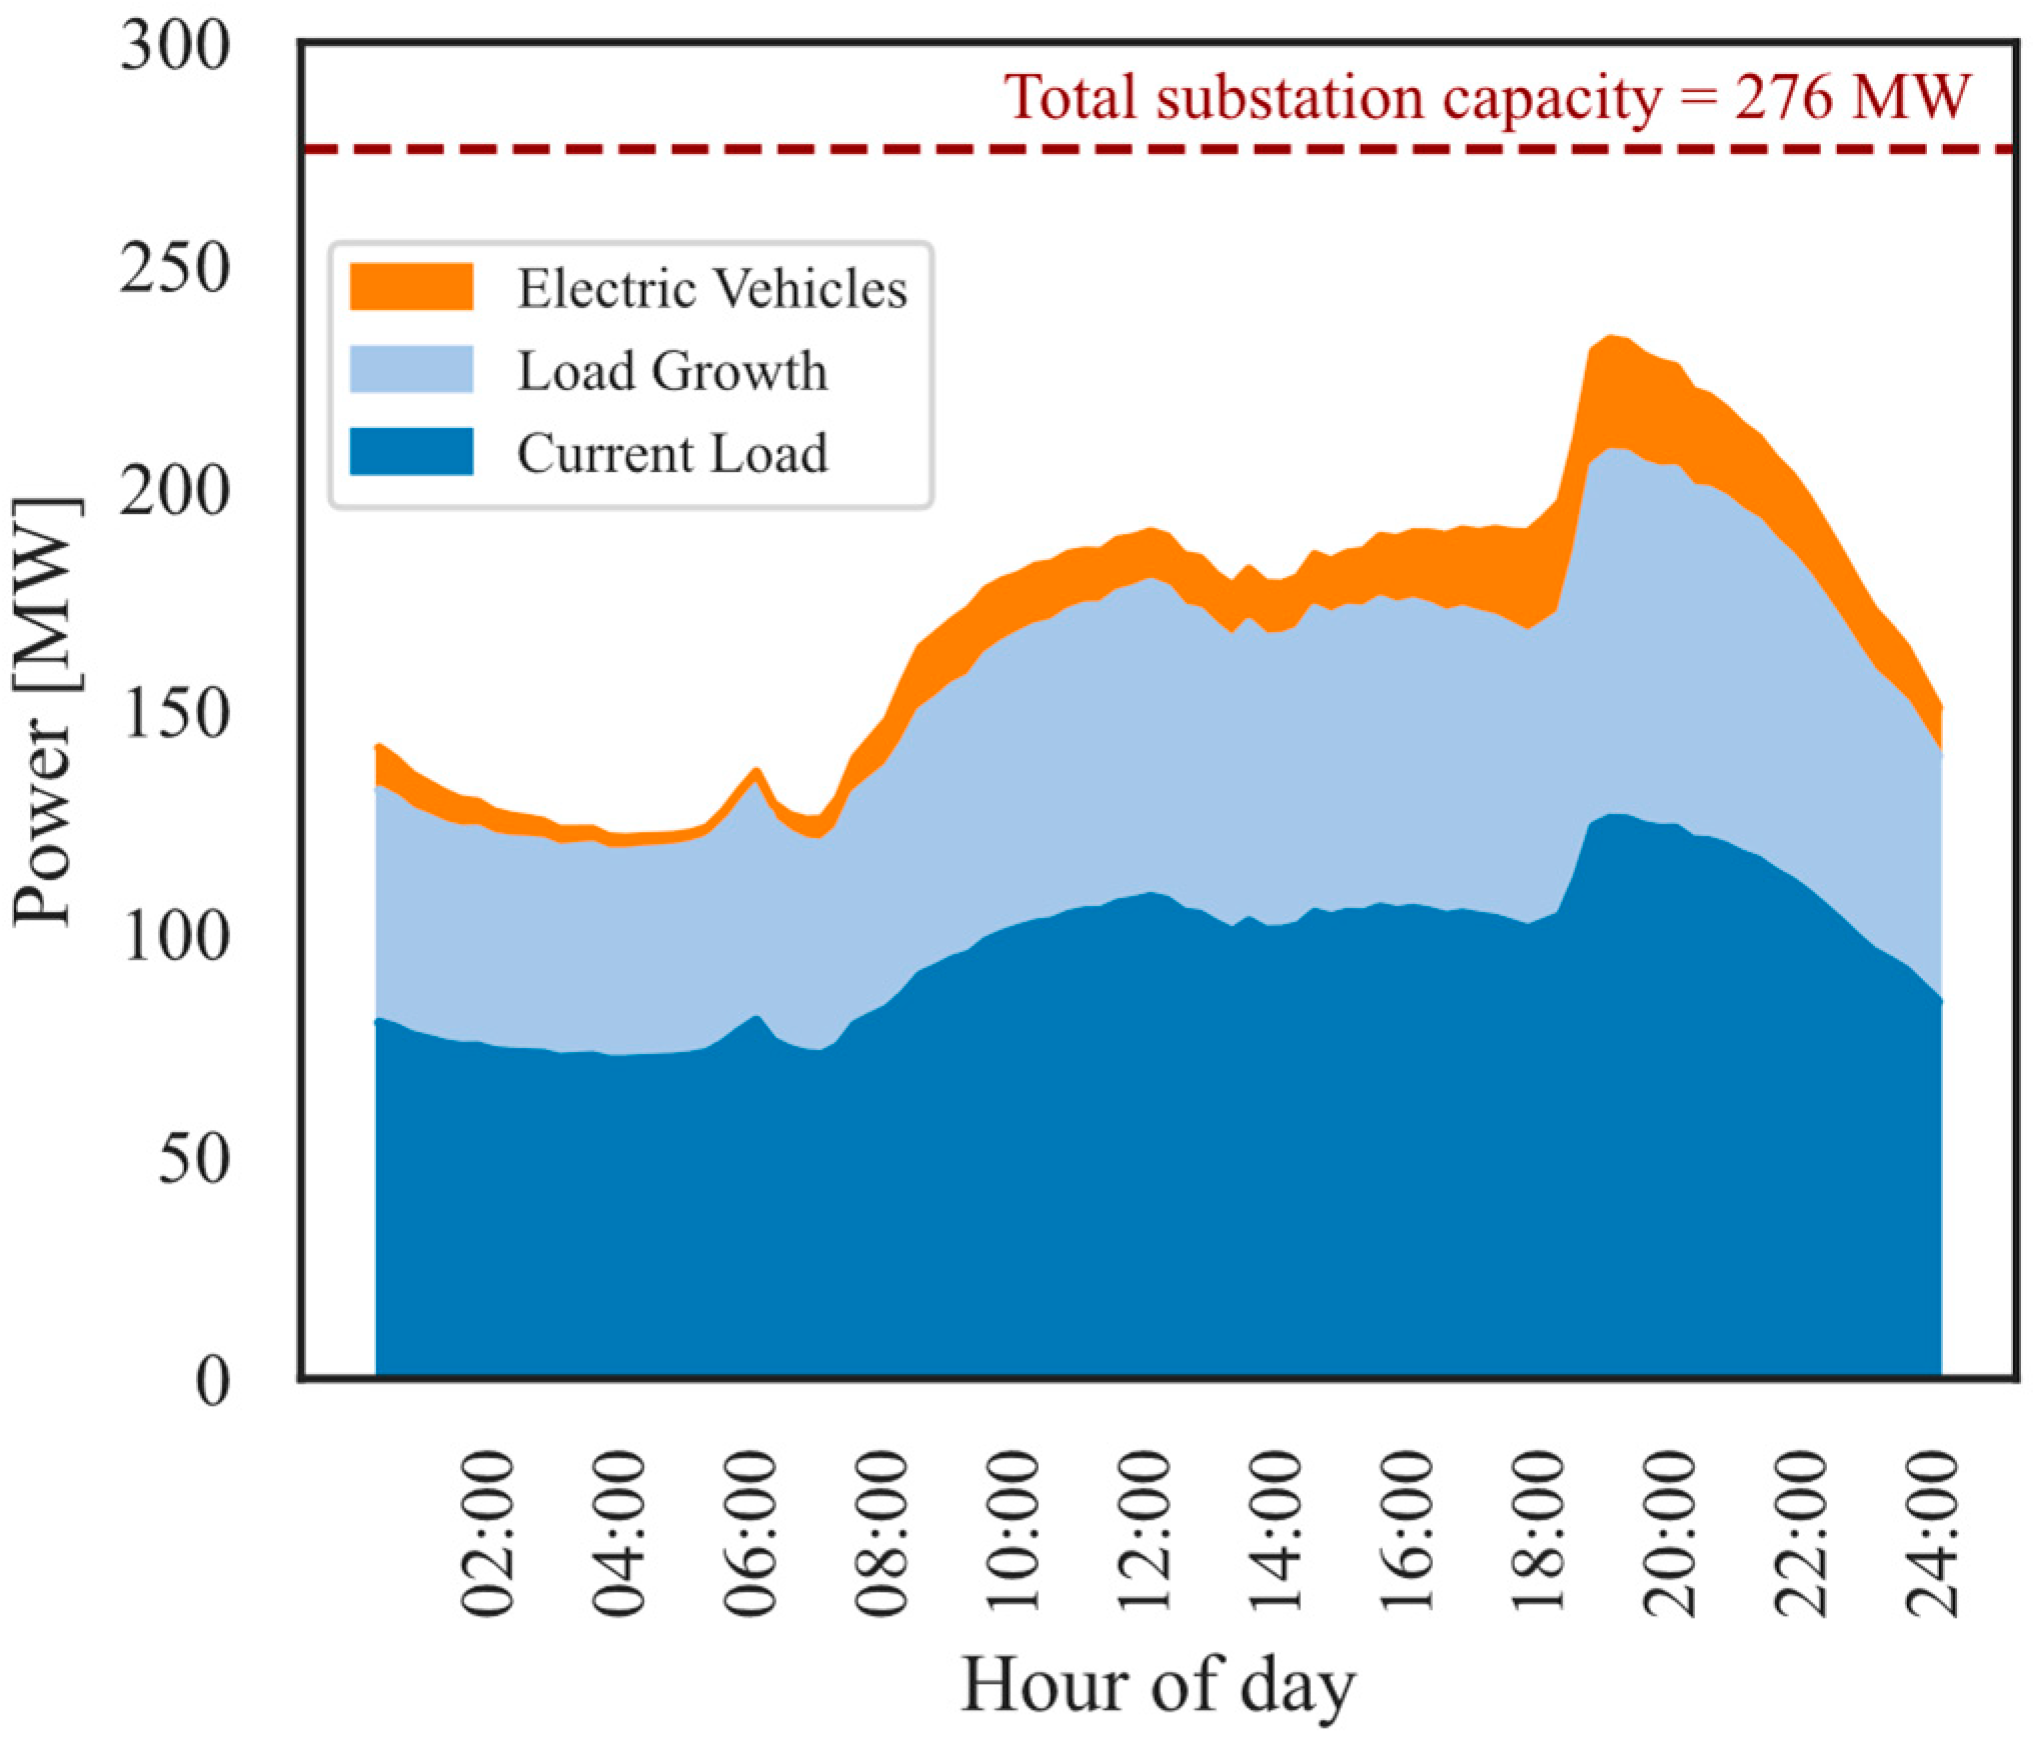
The total peak load attained is 125.70 MW, as shown in Table 8. The weekday electric load profile measured in 2023 is shown in Figure 14, with the total peak load occurring over about 19:00 h. Typically, the electric load profiles of every substation have high consumption rates around 6, 12, and 19:00 h. These current load profiles of the substation are obtained with the utility’s metering equipment, and these records are stored in its SCADA system.
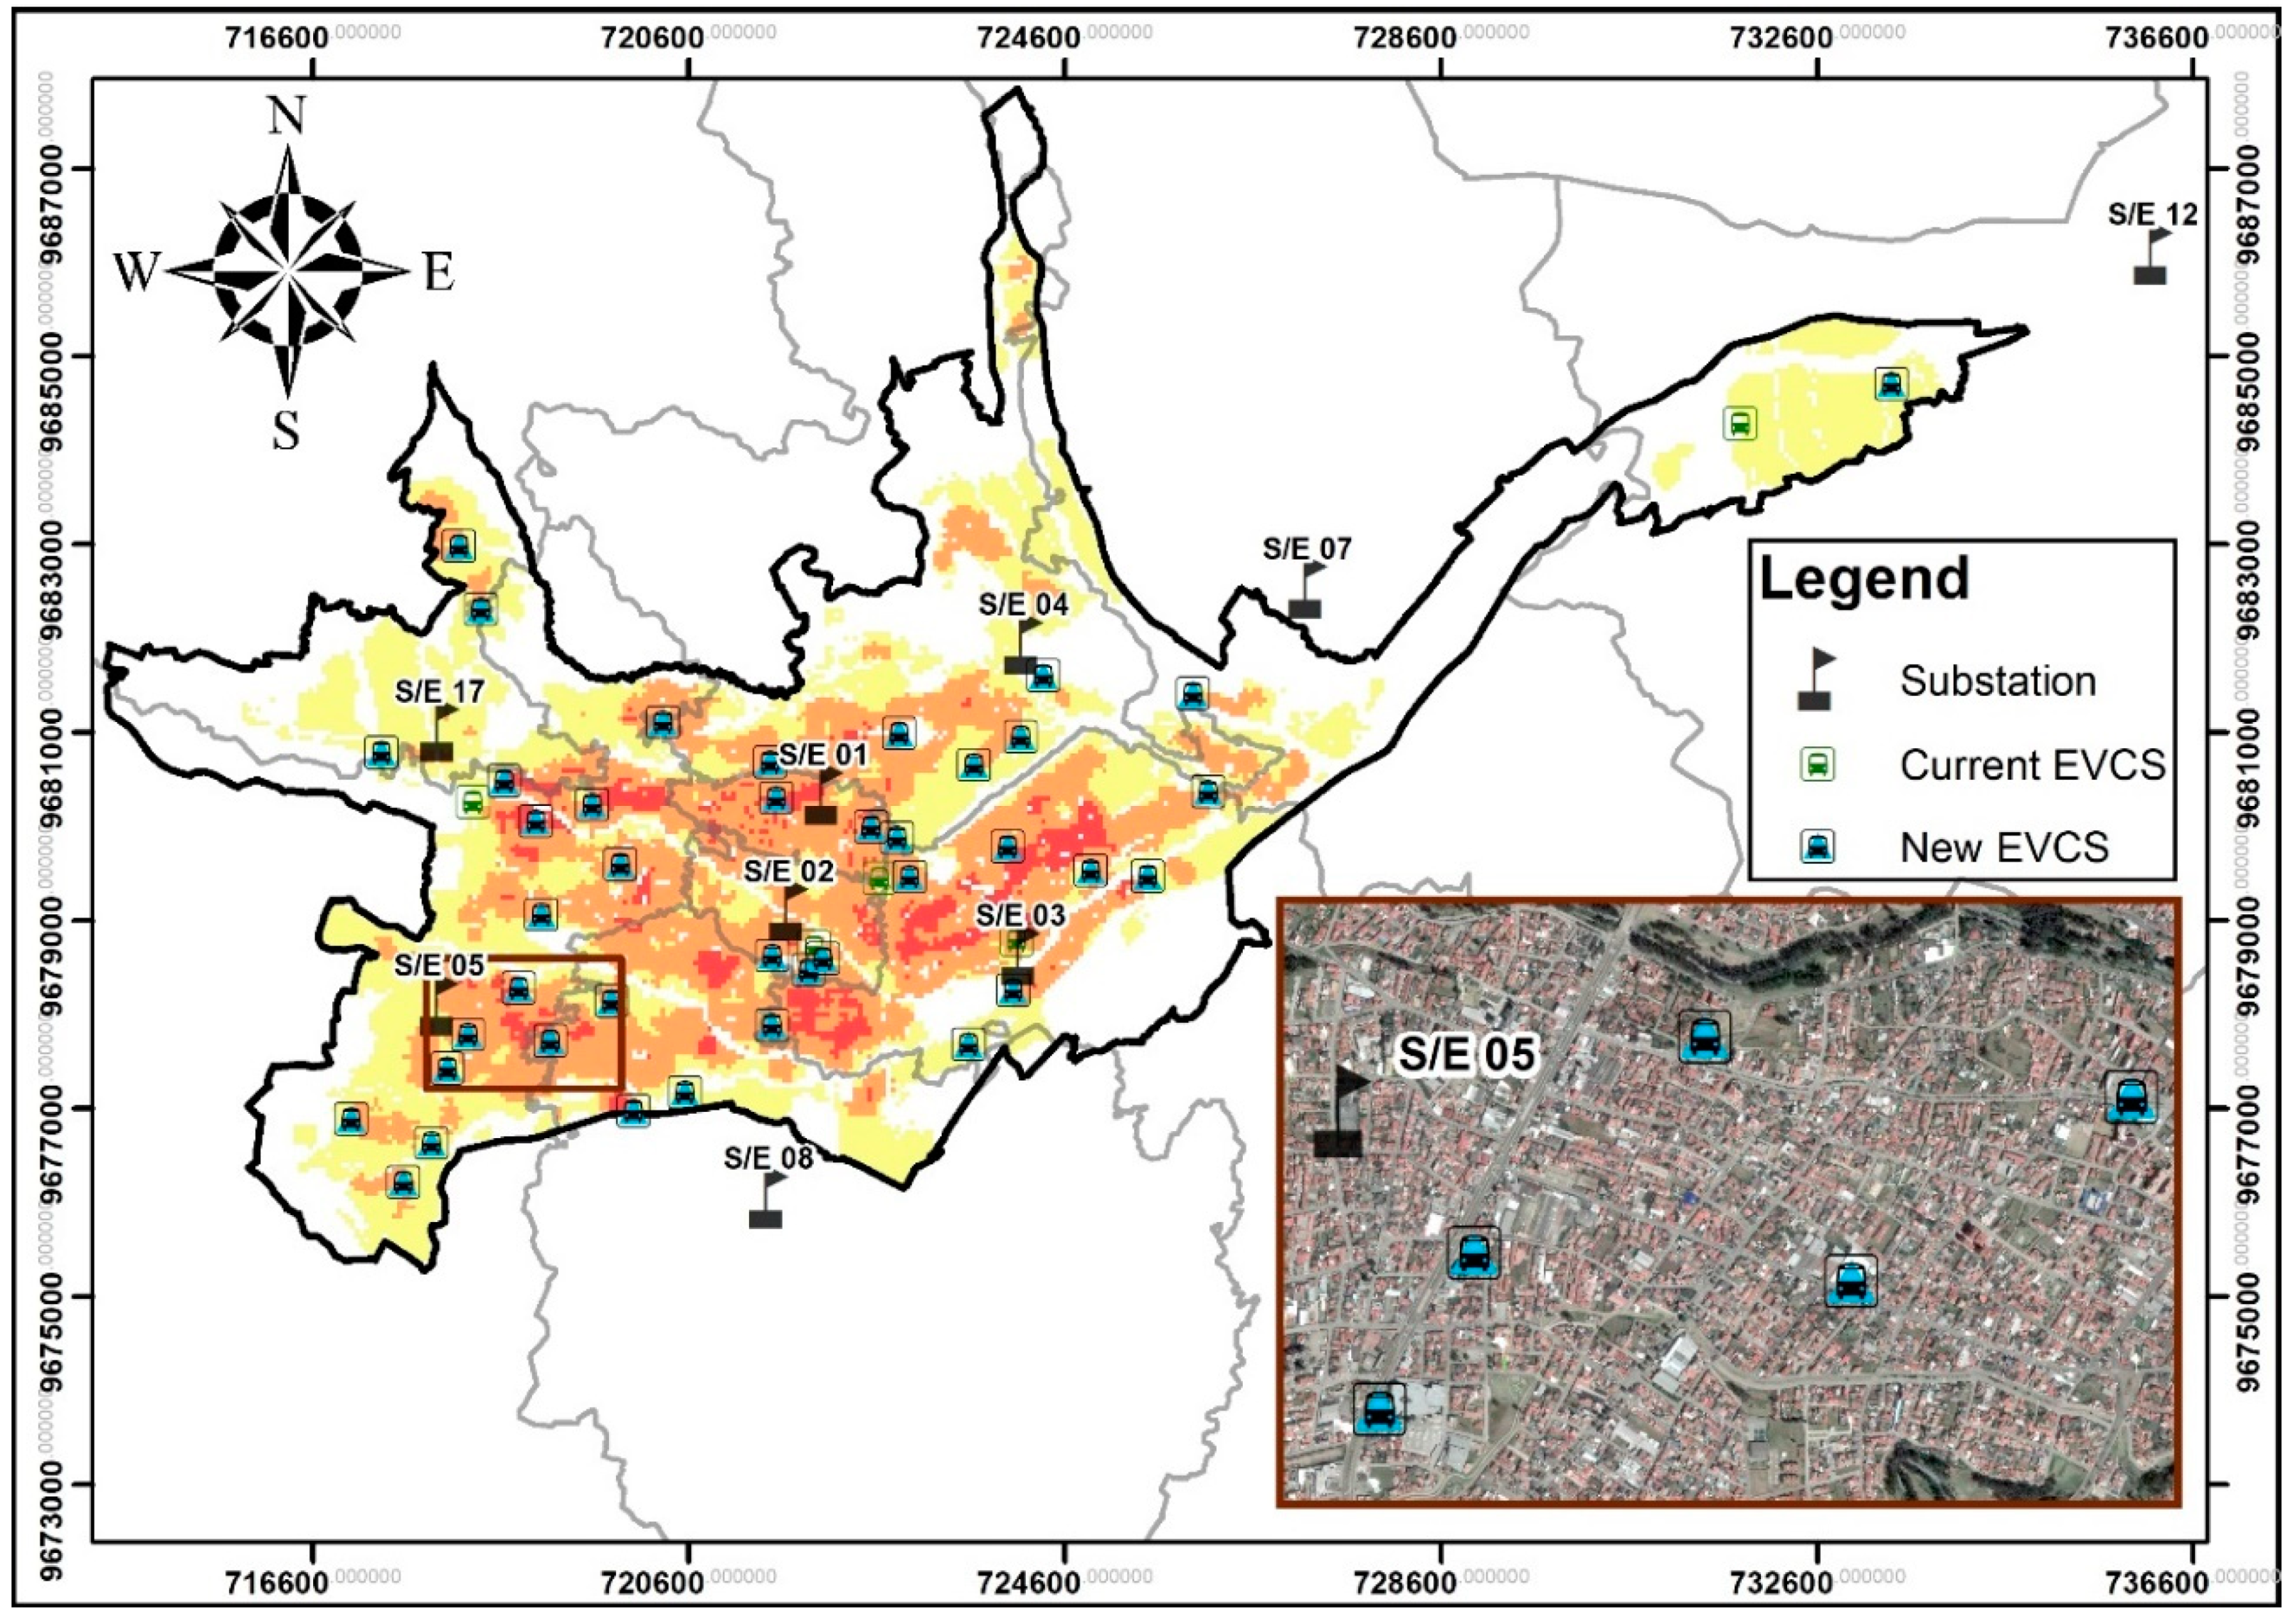
This work considers 40 charging stations. However, a different number of charging stations could also be considered. Table 9 shows the three charging station designs that were established based on Table 2. The peaks of the electric load profiles depicted in Figure 12 are used to calculate the number of ports for each level of EV charging. To meet the Work level 1 electric load profile, at least 256 of 4 kW ports are required. Likewise, 1056 of 8 kW ports for Work level 2, 276 of 19.2 kW ports for Public level 2, and 12 of 150 kW ports for DC Fast level are needed. The total capacity of the charging stations is 16.6 MW, with the same 400 kW capacity for all designs.
The forty charging stations are located throughout the suitability map, taking into account suitable and highly suitable levels. Type 1 stations are located near apartment buildings. Stores and parking garages are the locations of type 2 stations. Type 3 stations are dispersed throughout the city’s primary access routes. Figure 15 illustrates the current and new charging stations’ locations, as well as the substation’s locations with their service area across the suitability map.
The charging station’s placement contributes to awareness of the substation’s capacity. Table 10 highlights the load growth by substation and the port count by EV charging level. The ‘total MW’ column represents the load growth due to EVs, which is separate from customer-related load forecasting and will be added to the current peak load. S/E 05 supports the highest charging station load; however, it has a 23 MW reserve capacity. No substation’s capacity is compromised. The total number of ports complies with Table 9 to satisfy the peak electric load profile shown in Figure 12.
Although EV demand does not exceed any substation capacity, it significantly raises the load profile, especially around 19:00 h. The EV load profile, along with the electric load profile forecast for 2040, is depicted in Figure 16. The ‘Current Load’ in blue represents customer demand at the substation level for the base year. The ‘Load Growth’ in light blue corresponds to the vegetative growth of customers and changes in consumption habits projected for the long-term load forecast (the year 2040). The orange area labeled ‘Electric Vehicles’ represents the EV load from Figure 12 forecasted for the horizon year. As a result, substations are capable of handling the demand for 35,000 EVs via a public network of charging stations that meet the aforementioned characteristics.

5. Conclusions

To support the transition to EVs in accordance with emission-free mobility policies, this work provides an MCDA approach based on GIS. Demographic criteria, along with energy, economic, social, transportation, and environmental criteria, were combined. These five main criteria contain four, two, one, three, and two sub-criteria, respectively. Energy, economic, demographic, and transportation criteria are the most influential factors that played a significant role in EV charging station suitability site selection.
As part of the selection process, an evaluation system was constructed consisting of five key criteria: energy; economic and social; transportation; socio-demographics; and environmental. This facilitated the weighting process made through expert judgment in terms of technical, economic, and social perspectives.
The density element contained in the energy criteria for this analysis catches those customers’ strata in housing where the likelihood of EV purchasing is higher. Density, along with demographic criteria, contributes to reducing the spatial mismatch between where chargers are located and where the bulk of prospective EV owners live.
Through exploratory GIS analysis, GWR discovers those variables that correlate to a phenomenon’s occurrence. In the performed analysis, GWR is used to discover demographic criteria for the MCDA that catch where new technology increase is most likely. Early owners of a new technology are identified through both the rate of purchase at which households acquire electric stoves and the census population database. Early owners typically have high insurance rates, newly constructed dwellings, and upscale building materials. The demographic criteria that influence the increase of EVs and, consequently, the location of EV charging stations are insurance costs, new housing, and building materials.
Four comparative techniques were applied between the combined methods of AHP + WLC, AHP + TOPSIS, AHP + VIKOR, and FUZZY + TOPSIS to validate the model results. From the combined methodologies, the suitable spatial pattern is consistent across all model results. FUZZY + TOPSIS differs from the others in that it uses linguistic membership rather than crisp numbers for criterion weighting. Thus, two human judgment procedures are involved, i.e., pairwise comparison and fuzzy. The weights of sub-criteria are assigned by three experts based on their membership in a fuzzy set in terms of technical, economic, and social perspectives. The FUZZY + TOPSIS result is used to identify suitable sites for EV charging station placement.
The proposed framework allows substation capacity assessment with the integration of EV charging stations into the distribution system. Load capacity assessments involve incorporating EV charging station load profiles into the daily substation load profile. This approach was applied in the urban area of an Ecuadorian city. It is important to note that the substations’ capacity does not reach its nominal power, and, with the exception of SE 03 and SE 05, the added power in each substation is less than 3 MW. The results show that there is no compromise on any substation capacity reserve. Every substation houses a different number of charging stations, revealing the importance of using spatial analysis tools to determine the increase in demand resulting from charging station deployment. These understandings are necessary for network planners to monitor the impact of charging station growth scenarios on the power distribution system in major cities.
This study lacks an analysis of hosting capacity in the primary and secondary distribution networks, which is crucial given the exponential growth in electric vehicle adoption and the resulting increase in load magnitudes. No distribution network would be prepared for such an increase, making this a key area for future research. The current research scope serves as a primary input for a hosting capacity analysis. In the next stage, simulations of power flows (using quasi-static time series) and short circuits will be used to evaluate potential impacts on the network and quantify the hosting capacity of the distribution network.

Author Contributions

Conceptualization, W.E.C., R.M.-M. and S.Z.-A.; methodology, W.E.C., R.M.-M. and S.Z.-A.; software, W.E.C. and S.Z.-A.; validation, W.E.C. and S.Z.-A.; formal analysis, W.E.C., R.M.-M. and S.Z.-A.; investigation, W.E.C., R.M.-M. and S.Z.-A.; resources, S.Z.-A., J.B.L. and J.F.F.; writing—original draft preparation, W.E.C. and R.M.-M.; writing—review and editing, W.E.C., R.M.-M. and S.Z.-A.; visualization, S.Z.-A.; supervision, J.B.L. and J.F.F. All authors have read and agreed to the published version of the manuscript.

Funding

This work was supported by the Brazilian institutions: Coordination for the Improvement of Higher Education Personnel (CAPES)—Finance Code 001, and the São Paulo Research Foundation (FAPESP), under grants 2015/21972-6 and 2019/07436-5.

Data Availability Statement

The original contributions presented in the study are included in the article; further inquiries can be directed to the corresponding author.

Acknowledgments

The authors would like to thank “Empresa Eléctrica Regional Centro Sur C.A.”, Electric Distribution Utility of Ecuador, for the provided information and collaborative support.

Conflicts of Interest

The authors declare no conflicts of interest.

References

  1. UNFCCC. Adoption of the Paris Agreement; United Nations Framework Convention on Climate Change: Paris, France, 2015; p. 32. [Google Scholar]
  2. International Energy Agency. World Energy Outlook; International Energy Agency: Paris, France, 2011; ISBN 2989264124134. [Google Scholar]
  3. International Organization of Motor Vehicle Manufacturers. Climate Change and CO2 Brochure; OICA: Paris, France, 2008; p. 9. [Google Scholar]
  4. Koch, N.; Ritter, N.; Rohlf, A.; Scarazzato, F. When Is the Electric Vehicle Market Self-Sustaining? Evidence from Norway. Energy Econ. 2022, 110, 105991. [Google Scholar] [CrossRef]
  5. International Energy Agency. Accelerating Ambitions Despite the Pandemic; Global EV Outlook; International Energy Agency: Paris, France, 2021; p. 100. [Google Scholar]
  6. Kheirkhah, A.R.; Meschini Almeida, C.F.; Kagan, N.; Leite, J.B. Optimal Probabilistic Allocation of Photovoltaic Distributed Generation: Proposing a Scenario-Based Stochastic Programming Model. Energies 2023, 16, 7261. [Google Scholar] [CrossRef]
  7. Global EV Data Explorer—Data Tools. Available online: https://www.iea.org/data-and-statistics/data-tools/global-ev-data-explorer (accessed on 1 February 2024).
  8. IEC 61851-1; Electric Vehicle Conductive Charging System—Part 1: General Requirements; Edition 3.0. International Electrotechnical Commission: Geneva, Switzerland, 2017; ISBN 978-2-8322-3766-3.
  9. Savari, G.F.; Sathik, M.J.; Raman, L.A.; El-Shahat, A.; Hasanien, H.M.; Almakhles, D.; Aleem, S.H.E.A.; Omar, A.I. Assessment of Charging Technologies, Infrastructure and Charging Station Recommendation Schemes of Electric Vehicles: A Review. Ain Shams Eng. J. 2023, 14, 101938. [Google Scholar] [CrossRef]
  10. Alternative Fuels Data Center: Electric Vehicle Charging Stations. Available online: https://afdc.energy.gov/fuels/electricity_stations.html#terms (accessed on 12 February 2024).
  11. Spendiff-Smith, M. The Different Levels of EV Charging Explained—EVESCO. Available online: https://www.power-sonic.com/blog/levels-of-ev-charging/ (accessed on 13 February 2024).
  12. US Department of Energy Alternative Fuels Data Center: Developing Infrastructure to Charge Electric Vehicles. Available online: https://afdc.energy.gov/fuels/electricity_infrastructure.html (accessed on 2 February 2024).
  13. PLUGNYC. NYC DOT Curbside Level 2 EV Charging Pilot; PLUGNYC: New York, NY, USA, 2023; p. 21. [Google Scholar]
  14. Lehrman, M. Electric Vehicle Charging Stations. Available online: https://bouldercolorado.gov/services/electric-vehicle-charging-stations (accessed on 2 February 2024).
  15. Slowik, P.; Lutsey, N. The Continued Transition to Electric Vehicles in U.S. Cities; ICCT: Washington, DC, USA, 2018; p. 42. [Google Scholar]
  16. Zhang, Q.; Li, H.; Zhu, L.; Campana, P.E.; Lu, H.; Wallin, F.; Sun, Q. Factors Influencing the Economics of Public Charging Infrastructures for EV—A Review. Renew. Sustain. Energy Rev. 2018, 94, 500–509. [Google Scholar] [CrossRef]
  17. Mahdy, M.; Bahaj, A.S.; Turner, P.; Wise, N.; Alghamdi, A.S.; Hamwi, H. Multi Criteria Decision Analysis to Optimise Siting of Electric Vehicle Charging Points—Case Study Winchester District, UK. Energies 2022, 15, 2497. [Google Scholar] [CrossRef]
  18. Xu, J.; Zhong, L.; Yao, L.; Wu, Z. An Interval Type-2 Fuzzy Analysis towards Electric Vehicle Charging Station Allocation from a Sustainable Perspective. Sustain. Cities Soc. 2018, 40, 335–351. [Google Scholar] [CrossRef]
  19. Saint, S.; Lawson, J.R. Rules for Reaching Consensus: A Modern Approach to Decision Making; Wiley: Hoboken, NJ, USA, 1994. [Google Scholar]
  20. Malczewski, J.; Rinner, C. Multicriteria Decision Analysis in Geographic Information Science; Springer: Berlin/Heidelberg, Germany, 2015; p. 331. [Google Scholar]
  21. Riemann, R.; Wang, D.Z.W.; Busch, F. Optimal Location of Wireless Charging Facilities for Electric Vehicles: Flow-Capturing Location Model with Stochastic User Equilibrium. Transp. Res. Part C Emerg. Technol. 2015, 58, 1–12. [Google Scholar] [CrossRef]
  22. Tu, W.; Li, Q.; Fang, Z.; Shaw, S.L.; Zhou, B.; Chang, X. Optimizing the Locations of Electric Taxi Charging Stations: A Spatial–Temporal Demand Coverage Approach. Transp. Res. Part C Emerg. Technol. 2016, 65, 172–189. [Google Scholar] [CrossRef]
  23. Funke, S.Á.; Gnann, T.; Plötz, P. Addressing the Different Needs for Charging Infrastructure: An Analysis of Some Criteria for Charging Infrastructure Set-Up. Green Energy Technol. 2015, 203, 73–90. [Google Scholar] [CrossRef]
  24. Zhao, H.; Li, N. Optimal Siting of Charging Stations for Electric Vehicles Based on Fuzzy Delphi and Hybrid Multi-Criteria Decision Making Approaches from an Extended Sustainability Perspective. Energies 2016, 9, 270. [Google Scholar] [CrossRef]
  25. Kaya, Ö.; Alemdar, K.D.; Campisi, T.; Tortum, A.; Çodur, M.K. The Development of Decarbonisation Strategies: A Three-Step Methodology for the Suitable Analysis of Current Evcs Locations Applied to Istanbul, Turkey. Energies 2021, 14, 2756. [Google Scholar] [CrossRef]
  26. Wu, Y.; Yang, M.; Zhang, H.; Chen, K.; Wang, Y. Optimal Site Selection of Electric Vehicle Charging Stations Based on a Cloud Model and the PROMETHEE Method. Energies 2016, 9, 157. [Google Scholar] [CrossRef]
  27. Guo, S.; Zhao, H. Optimal Site Selection of Electric Vehicle Charging Station by Using Fuzzy TOPSIS Based on Sustainability Perspective. Appl. Energy 2015, 158, 390–402. [Google Scholar] [CrossRef]
  28. Erbaş, M.; Kabak, M.; Özceylan, E.; Çetinkaya, C. Optimal Siting of Electric Vehicle Charging Stations: A GIS-Based Fuzzy Multi-Criteria Decision Analysis. Energy 2018, 163, 1017–1031. [Google Scholar] [CrossRef]
  29. Zhou, J.; Wu, Y.; Wu, C.; He, F.; Zhang, B.; Liu, F. A Geographical Information System Based Multi-Criteria Decision-Making Approach for Location Analysis and Evaluation of Urban Photovoltaic Charging Station: A Case Study in Beijing. Energy Convers. Manag. 2020, 205, 112340. [Google Scholar] [CrossRef]
  30. Kaya, Ö.; Tortum, A.; Alemdar, K.D.; Çodur, M.Y. Site Selection for EVCS in Istanbul by GIS and Multi-Criteria Decision-Making. Transp. Res. Part D Transp. Environ. 2020, 80, 102271. [Google Scholar] [CrossRef]
  31. Ju, Y.; Ju, D.; Gonzalez, E.D.R.S.; Giannakis, M.; Wang, A. Study of Site Selection of Electric Vehicle Charging Station Based on Extended GRP Method under Picture Fuzzy Environment. Comput. Ind. Eng. 2019, 135, 1271–1285. [Google Scholar] [CrossRef]
  32. Karaşan, A.; Kaya, İ.; Erdoğan, M. Location Selection of Electric Vehicles Charging Stations by Using a Fuzzy MCDM Method: A Case Study in Turkey. Neural Comput. Appl. 2020, 32, 4553–4574. [Google Scholar] [CrossRef]
  33. Guler, D.; Yomralioglu, T. Suitable Location Selection for the Electric Vehicle Fast Charging Station with AHP and Fuzzy AHP Methods Using GIS. Ann. GIS 2020, 26, 169–189. [Google Scholar] [CrossRef]
  34. Feng, J.; Xu, S.X.; Li, M. A Novel Multi-Criteria Decision-Making Method for Selecting the Site of an Electric-Vehicle Charging Station from a Sustainable Perspective. Sustain. Cities Soc. 2021, 65, 102623. [Google Scholar] [CrossRef]
  35. Yagmahan, B.; Yılmaz, H. An Integrated Ranking Approach Based on Group Multi-Criteria Decision Making and Sensitivity Analysis to Evaluate Charging Stations under Sustainability. Environ. Dev. Sustain. 2022, 25, 96–121. [Google Scholar] [CrossRef]
  36. Roy, A.; Law, M. Examining Spatial Disparities in Electric Vehicle Charging Station Placements Using Machine Learning. Sustain. Cities Soc. 2022, 83, 103978. [Google Scholar] [CrossRef]
  37. Charly, A.; Thomas, N.J.; Foley, A.; Caulfield, B. Identifying Optimal Locations for Community Electric Vehicle Charging. Sustain. Cities Soc. 2023, 94, 104573. [Google Scholar] [CrossRef]
  38. Zambrano-Asanza, S.; Quiros-Tortos, J.; Franco, J.F. Optimal Site Selection for Photovoltaic Power Plants Using a GIS-Based Multi-Criteria Decision Making and Spatial Overlay with Electric Load. Renew. Sustain. Energy Rev. 2021, 143, 110853. [Google Scholar] [CrossRef]
  39. Zambrano-Asanza, S.; Chumbi, W.E.; Franco, J.F.; Padilha-Feltrin, A. Multicriteria Decision Analysis in Geographic Information Systems for Identifying Ideal Locations for New Substations. J. Control Autom. Electr. Syst. 2021, 32, 1305–1316. [Google Scholar] [CrossRef]
  40. Mejia, M.A.; Melo, J.D.; Zambrano-Asanza, S.; Padilha-Feltrin, A. Spatial-Temporal Growth Model to Estimate the Adoption of New End-Use Electric Technologies Encouraged by Energy-Efficiency Programs. Energy 2020, 191, 116531. [Google Scholar] [CrossRef]
  41. Fotheringham, A.S.; Brunsdon, C.; Charlton, M. Geographically Weighted Regression: The Analysis of Spatially Varying Relationships; Wiley: Chichester, UK; Hoboken, NJ, USA, 2002; ISBN 978-0-471-49616-8. [Google Scholar]
  42. Yang, D. Kriging for NSRDB PSM Version 3 Satellite-Derived Solar Irradiance. Sol. Energy 2018, 171, 876–883. [Google Scholar] [CrossRef]
  43. Oliver, M.A.; Webster, R. Kriging: A Method of Interpolation for Geographical Information Systems. Int. J. Geogr. Inf. Syst. 1990, 4, 313–332. [Google Scholar] [CrossRef]
  44. Saaty, T.L. The Analytic Hierarchy Process: Planning, Priority Setting. Resource Allocation, xiii ed.; McGraw-Hill: New York, NY, USA, 1980. [Google Scholar]
  45. Yager, R.; Zadeh, L. An Introduction to Fuzzy Logic Applications in Intelligent Systems, 1st ed.; Springer: New York, NY, USA, 1992; ISBN 1-4613-6619-4. [Google Scholar]
  46. Bede, B. Mathematics of Fuzzy Sets and Fuzzy Logic; Springer: Berlin/Heidelberg, Germany, 2013. [Google Scholar]
  47. Zadeh, L.A. The Concept of a Linguistic Variable and Its Application to Approximate Reasoning-I. Inf. Sci. 1975, 8, 199–249. [Google Scholar] [CrossRef]
  48. Malczewski, J. On the Use of Weighted Linear Combination Method in GIS: Common and Best Practice Approaches. Trans. GIS 2000, 4, 5–22. [Google Scholar] [CrossRef]
  49. Papathanasiou, J.; Ploskas, N. Multiple Criteria Decision Aid: Methods Examples and Python Implementations; Springer: Cham, Switzerland, 2018. [Google Scholar]
  50. INEC Anuario de Estadísticas de Transporte. 2021. Available online: https://www.ecuadorencifras.gob.ec/transporte/ (accessed on 2 February 2024).
  51. Instituto Nacional de Estadística y Censos. Estadísticas de transporte (ESTRA); Instituto Nacional de Estadística y Censos: Quito, Ecuador, 2022.
  52. Mendieta, C.S. Hay 64.199 vehículos matriculados en Cuenca. Diario El Mercurio, 10 September 2022. [Google Scholar]
  53. Priessner, A.; Sposato, R.; Hampl, N. Predictors of Electric Vehicle Adoption: An Analysis of Potential Electric Vehicle Drivers in Austria. Energy Policy 2018, 122, 701–714. [Google Scholar] [CrossRef]
  54. Namdeo, A.; Tiwary, A.; Dziurla, R. Spatial Planning of Public Charging Points Using Multi-Dimensional Analysis of Early Adopters of Electric Vehicles for a City Region. Technol. Forecast. Soc. Change 2014, 89, 188–200. [Google Scholar] [CrossRef]
  55. MTOP Socializa La Estrategia Nacional de Electromovilidad Para Ecuador Con Sectores Estratégicos. Available online: https://www.obraspublicas.gob.ec/mtop-socializa-la-estrategia-nacional-de-electromovilidad-para-ecuador-con-sectores-estrategicos/ (accessed on 2 February 2024).
  56. Hinicio. Estrategia Nacional de Electromovilidad para Ecuador (ENEM); BID, MTOP, Hinicio: Quito, Ecuador, 2021; p. 88. [Google Scholar]
  57. Alternative Fuels Data Center: Electric Vehicle Infrastructure Projection Tool (EVI-Pro) Lite. Available online: https://afdc.energy.gov/evi-x-toolbox (accessed on 20 March 2024).
Figure 1. Surface coverage (right) derived from point values (left) through interpolation.
Energies 17 03452 g001
Figure 2. Framework for EV charging station suitability analysis.
Energies 17 03452 g002
Figure 3. Geographical location of the study area: Cuenca, Ecuador.
Energies 17 03452 g003
Figure 4. Regression coefficients from the GWR model.
Energies 17 03452 g004
Figure 5. Spatial criteria maps.
Energies 17 03452 g005
Figure 6. Weights of spatial criteria.
Energies 17 03452 g006
Figure 7. Membership functions for fuzzy triangles.
Energies 17 03452 g007
Figure 8. Suitability maps from AHP WLC, AHP TOPSIS, AHP VIKOR, and Fuzzy TOPSIS.
Energies 17 03452 g008
Figure 9. Suitability map for EVCS locations using Fuzzy-TOPSIS MCDA.
Energies 17 03452 g009
Figure 10. Goal strategy for achieving Ecuador’s commitment to reduce the carbon footprint of the transportation sector by 2040 [56].
Energies 17 03452 g010
Figure 11. Charging station infrastructure.
Energies 17 03452 g011
Figure 12. Weekday electric load profile of 35,000 plug-in electric vehicles.
Energies 17 03452 g012
Figure 13. Subtransmission network and service area of each substation.
Energies 17 03452 g013
Figure 14. Weekday electric load profile of substations measured in 2023.
Energies 17 03452 g014
Figure 15. Location of potential public and work EVCS for the year 2040 in Cuenca-Ecuador.
Energies 17 03452 g015
Figure 16. Load profile forecast for the year 2040.
Energies 17 03452 g016
Table 1. Charging levels according to the SAE J1772 standard [9,10,11].
Charging LevelTypical UseCharging Power (kW)VoltageCurrent (A)Charging Time (h)Description
Level 1Home1.4120 V AC154–11Basic charging from a standard electrical outlet
1.92011–36
Level 2Home, workplace4240 V AC401–4Advanced charging at home or public stations
8400 V AC802–6
19.22–3
Level 3
(DC Fast Charging)
Public outlets30–150480 V + DC0.2–1.5Rapid charging at specialized public stations
250–350
Extreme Fast Charging (XFC)HighwayOver 350 kWUp to 0.1Ultra-rapid charging technology for future infrastructure
Table 2. Charging stations in Boulder, Colorado.
DesignNumber of StationsNumber of PortskW
Station
kW
Total
L2 (7.2 kW)DC Fast (150 kW)
1152038.4576
234076.8230.4
3144676.8676.8
19464 1483.2
Table 4. Background and criteria categorization.
Main CriteriaSub CriteriaDescriptionReference
C1: Energy criteriaElectric substationsDistance between the closest electrical substation and the candidate charging station location.[25,28,30]
Petrol stationsDistance between the closest petrol station and the candidate charging station location.[17,28,30,33]
Current EV charging stationsDistance between the closest charging station and the candidate charging station location.[17,28,30,36,37]
Energy densitySpatial distribution of energy consumption, calculated by total energy/land area.[38]
C2: Economic and Social criteriaCommercial centersDistance between the closest commercial center and the candidate charging station location.[25,29,30,33]
Health facilitiesDistance between the closest health facility and the candidate charging station location.[39]
C3: Transportation criteriaMain roadsDistance between the closest principal road and the candidate charging station location.[17,25,28,29,30,33,37]
C4: Socio-demographics criteriaInsurance costsAverage household insurance cost.[40]
New housingResidential buildings’ age.[40]
Building materialsHouseholds employing high-end building materials in their residences.[40]
C5: Environmental criteriaAir qualityAnnual mean concentration of particulate matter level. Measures (NO2) recorded by monitoring stations.[25,30]
NoiseThe day-averaged noise level on a weekday. Traffic noise (dB) derived from the monitoring stations.[39]
Table 5. The study’s criteria and the associated GIS analysis.
Main CriteriaSub CriteriaGIS Analysis
C1: Energy criteriaElectric substationsEuclidean distance
Petrol stationsEuclidean distance
Currents EVCSEuclidean distance
Energy densityPoint density
C2: Economic and Social criteriaCommercial centersEuclidean distance
Health facilitiesEuclidean distance
C3: Transportation criteriaMain roadsEuclidean distance
C4: Socio-demographic criteriaInsurance costsGWR
New housingGWR
Building materialsGWR
C5: Environmental criteriaAir qualityKriging interpolation
NoiseKriging interpolation
Table 6. Relative weights in the reciprocal matrix.
Criteria123456789101112
1: Electric substations1531/461/21/31/61/21/222
2: Petrol stations 11/31/721/321/321/51/31/3
3: Currents EVCS 11/431/521/631/723
4: Commercial centers 1624551/234
5: Health facilities 11/41/21/81/31/432
6: Main roads 121/521/323
7: New housing 11/721/333
8: Insurance costs 171/422
9: Building materials 11/532
10: Energy density 143
11: Air quality NO2 12
12: Noise 1
Table 7. Linguistic rating of the criteria weights.
Decision Maker12345678910
1: TechnicalMLMLVHHVLMHLL
2: EconomicVHMLLVHHMMLHL
3: SocialMHLMLHVHVHMHL
Table 8. Substations within the study area.
SubstationVoltage
(kV)
Peak Load
(MW)
Rated Capacity
ONAN (MW)
Reserve
(MW)
S/E 0122/6.35.57159.43
S/E 0222/6.37.08157.92
S/E 0369/2218.234829.77
S/E 0469/2227.654820.35
S/E 0569/2224.714823.29
S/E 0769/2214.453419.55
S/E 0869/2213.472410.53
S/E 1269/227.592012.41
S/E 1769/228.352415.65
125.70276
Table 9. EV charging station characteristics.
DesignNo. of Stations%Number of Ports per StationkW per StationTotal
(kW)
Work L1
(4 kW)
Work L2
(8 kW)
Public L2
(19.2 kW)
DC Fast
(150 kW)
1820%1134504123296
22870%62880401.611,244.8
3410%0033507.62030.4
40 256105627612 16,571.2
Table 10. Power demand increases at substations due to charging station placement.
SubstationNumber of PortsTotal (MW)
Work Level 1Work Level 2Public Level 2DC Fast
S/E 0112561600.80
S/E 0218842401.20
S/E 03572145033.35
S/E 04411744832.93
S/E 05863327934.97
S/E07628800.40
S/E 0818842731.71
S/E 12628800.40
S/E 1712561600.80
Total25610562761216.57
Max Power (kW)4819.2150
Total (MW)1.0248.4485.301.80
Disclaimer/Publisher’s Note: The statements, opinions and data contained in all publications are solely those of the individual author(s) and contributor(s) and not of MDPI and/or the editor(s). MDPI and/or the editor(s) disclaim responsibility for any injury to people or property resulting from any ideas, methods, instructions or products referred to in the content.