Article

Numerical Investigation of Flow Field Distributions and Water and Thermal Management for a Proton Exchange Membrane Electrolysis Cell

1
Guangdong Key Laboratory of Battery Safety, Guangzhou Institute of Energy Testing, Guangzhou 511447, China
2
School of Materials and Energy, Guangdong University of Technology, Guangzhou 510006, China
3
Guangdong Greenway Technology Co., Ltd., Dongguan 523000, China
4
Guangdong Zhuhai Supervision Testing Institute of Quality and Metrology, Zhuhai 519000, China
5
Dongguan Guixiang Insulation Material Co., Ltd., Dongguan 523861, China
*
Authors to whom correspondence should be addressed.
Energies 2024, 17(14), 3428; https://doi.org/10.3390/en17143428
Submission received: 19 June 2024 / Revised: 5 July 2024 / Accepted: 8 July 2024 / Published: 11 July 2024
(This article belongs to the Section J: Thermal Management)

Abstract

:
The proton exchange membrane electrolysis cell (PEMEC) has attracted considerable attention for large-scale and efficient hydrogen production because of its high current density, high hydrogen purity and fast dynamic response. Flow field distributions and water and thermal management characteristics of a PEMEC are vital for electrolytic cell structure and the determination of operating condition. A three-dimensional, non-isothermal, electrochemical model of a PEMEC was established in this manuscript. The flow field distribution and water and thermal management of the PEMEC are discussed. The corresponding results showed that the pressure of the flow channel decreased diagonally from the inlet to the outlet, and the pressure and velocity distribution exhibited a downward opening shape of a parabola. At the same inlet flow rate, when the voltage was 1.6 V, the oxygen generation rate was 15.74 mol/(cm2·s), and when the voltage was 2.2 V, the oxygen generation rate was 332.05 mol/(cm2·s); due to the change in the oxygen production rate, the pressure difference at 2.2 V was 2.5 times than that at 1.6 V. When the stoichiometric number was less than two, the average temperature of the catalyst layer (CL) decreased rapidly with the increase in the water flow rate. When the voltage decreased to 2.1 V, the current density came to the highest value when the stoichiometric number was 0.7, then the current density decreased with an increase in the stoichiometric number. When stoichiometric numbers were higher than five, the surface temperature and current density remained basically stable with the increase in the water flow rate, and the water and thermal management and electrolysis characteristics performed better. The research results could optimize the water supply of electrolysis cells. According to the velocity distribution law of the flow field, the water and thermal management performance of the PEMEC could be estimated, further promoting safety and reliability.

1. Introduction

In recent years, carbon emissions caused by rapid economic development have caused global climate problems. The development of clean energy is vital to achieve carbon emissions reduction [1,2]. Hydrogen is the important development direction of world energy transformation, due to its advantages of a high calorific value, clean environmental protection and abundant resources. During the hydrogen production progress, water electrolysis technology has attracted extensive attention [3]. At present, hydrogen production by electrolysis of water can be divided into alkaline water electrolysis (AWE), solid oxide electrolysis (SOEC) and the proton exchange membrane electrolysis cell (PEMEC) [4,5]. The PEMEC not only has the characteristics of a compact structure, high current density, high hydrogen purity and fast dynamic response but also can produce hydrogen under high-pressure conditions, which is beneficial for the direct storage of hydrogen. It is regarded as an ideal way to realize hydrogen storage by electrolysis of renewable energy [3,6].
In the past, some studies have been carried out on the key issues such as system reliability, the law of heat and mass transfer and material economy and so on. It is necessary for us to improve the safety and reliability of electrolysis for large-scale production according to the actual operating conditions [3]. García-Salaberri et al. [7] established a one-dimensional steady-state PEMEC model and analyzed the efficiency of the electrolysis cell. Research results indicated that the operating temperature and membrane thickness had a greater impact on the electrolysis performance than other parameters. Lopata et al. [8] investigated the changes in liquid water saturation in the porous transport layer (PTL). Due to the decrease in membrane transport resistance in high-temperature electrolysis, the electrochemical reaction kinetics were improved and the liquid saturation gradually decreased from the inlet to outlet. Gößling et al. [9] developed a numerical model based on dynamic feedback and MATLAB and considered the degradation effect of materials. They obtained that the electrolysis cell could be quantified through calibration parameters. To further determine the influence of the structural size of the electrolytic cell on the internal heat and mass transfer, Upadhyay et al. [10] studied the structure of the diffusion layer and membrane thickness. It was found that the increase in the membrane thickness would bring greater ohmic loss and enhance voltage loss. Nevertheless, the high porosity of the diffusion layer could reduce the concentration loss. The performance could be improved by designing the porosity of the new multi-layer diffusion layer. Toghyani et al. [11] also compared the effects of different thickness on the electrolysis efficiency, and they found that decreasing the diffusion layer thickness was beneficial for reducing the resistance of reaction gas diffusion and improving the performance of the PEMEC.
The flow channel (CH) structure design plays an important role in improving the guiding direction of liquid water, discharge of gas and distribution of liquid water on catalyst layer (CL). In order to strengthen the heat and mass transfer of the electrolysis cell, many scholars designed special CH structures with better mass transfer performance. Toghyani et al. [12] discussed the changes in pressure, temperature and current density of a parallel flow field and various serpentine flow fields through 3D numerical simulations. It was found that the pressure drop performance of the parallel flow field was better than that of the serpentine flow field, but the temperature and current density distribution uniformity of the serpentine flow field was better. At the same time, they found that a metal foam flow field displayed a more uniform current density and temperature [13]. The improvement of permeability was an important factor to increase the material transport capacity of the metal foam flow field. A new spiral flow field structure was proposed to improve the heat and mass transfer performance of the electrolysis cell [14]. Xu et al. [15] also developed a novel double-layer flow field structure with a uniform temperature and current density distribution. This flow field could effectively eliminate the phenomenon of gas accumulation in CH.
Compared with fuel cells, the flow behavior of a PEMEC is more complicated gas–liquid two-phase flow. Nie et al. [16] simplified the model and used the mixture model to simulate the gas–liquid two-phase flow, ignoring about the interaction between the electrochemical reaction and mass transfer. It was found that the reflux was obvious with the increase in the oxygen generation rate. Jia et al. [17] studied the changes in flow field pressure and velocity with transient conditions. They pointed out that the generation of oxygen bubbles occurred within 0.75 s of the beginning of electrolysis. When the number of channels was higher than nine, the oxygen flux and the number of channels changed linearly. Lafmejani et al. [18] analyzed the influence of liquid water and the gas contact angle on gas–liquid distribution. With changes in flow velocity and pressure, Taylor bubbles will be generated on the surface of the CH. Aubras et al. [19] observed the water content and bubble aggregation on the active surface of the catalytic layer. It was found that the change in the bubble formation state was caused by the pore structure of the porous medium. Wu et al. [20] constructed the oxygen distribution characteristics at different positions as the boundary condition of the model. They pointed out that the model simplification of the PEMEC should consider the difference in the distribution of anode oxygen at different positions. Olesen et al. [21] developed two-phase flow in a circular interdigital flow field. For the circular interdigital flow field, the distribution of liquid water could be improved by optimizing the cross-sectional area. Toghyani et al. [22] found that due to the accumulation effect of water at the ribs of the flow channel during the electrolysis process, the local gas concentration was higher, which further brought about a higher local temperature.
Based on the aforementioned literature review, most of the simulation work focused on the effects of different temperatures, voltages and structures on the heat and mass transfer and electrolysis performance of electrolysis cells. There is less work focusing on the electrolysis performance caused by the change in the water supply flow. Hence, in this study, a three-dimensional model of fluid flow, heat transfer and electrochemical coupling was established. The research results could better determine the operating flow rate of the electrolysis cell according to the structural size of the electrolytic cell. Moreover, a method was proposed to evaluate the hydrothermal management and electrolysis performance based on the velocity distribution of the parallel flow field. This outcome of this study can be beneficial for better understanding the law of two-phase mass transfer and provide reference value for the determination of actual boundary conditions.

2. Experimental Tests and Numerical Model

2.1. Experimental Tests

The experimental system of the PEM electrolysis cell is shown in Figure 1. In this experiment, the membrane electrode was a three-in-one membrane electrode. The active area was 2 cm × 2 cm. The proton exchange membrane was Nafion115, the anode catalyst was IrO2 with a load of 2.2 mg/cm2, and the cathode catalyst was 60% platinum carbon with a load of 1.2 mg/cm2. The experimental instrument information is shown in Table 1.
To ensure the smooth progress of the experiment, after the PEM electrolysis cell is connected to the pipeline, the whole system needs to be sealed and activated. In this experiment, the static test was used to test the sealing performance of the experimental system. Activation was carried out under the condition of a water flow rate of 5 mL/min and operating temperature of 333 K. The high and low current cycles were operated several times, and then the high-current electrolysis was maintained until the operating voltage of the electrolytic cell was stable.

2.2. Numerical Model

The PEMEC is an extremely complex multi-physical process, including charge transfer, heat and mass transfer and the electrochemical reaction. In this study, the mathematical model was based on the following assumptions:
(1)
The gas phase was considered as an compressible ideal gas;
(2)
The membrane was considered liquid-water-permeable and gas-impermeable;
(3)
The phase transition process of liquid water was neglected;
(4)
The material was homogeneous and isotropic;
(5)
Contact resistance between adjacent components was neglected.

2.2.1. Charge Transport and Conservation

The charge conservation equation of the electronic conductive phase of the bipolar plate (BP), gas diffusion layer (GDL) and CL of the PEMEC is as follows:
( σ s ϕ s ) = S ϕ s
where  σ s  is the effective electronic conductivity, S/m, and  ϕ s  is the electronic potential, V. For the CL,  S ϕ s  is the volume current source term generated by the electrochemical reaction; for the BP and GDL,  S ϕ s  is 0. Similarly, the charge conservation equation of the electrolyte is as follows:
( σ m ϕ m ) = S ϕ m
where  σ m  is the electrolyte conductivity, S/m. The Butler–Volmer equation is used to express the relationship between the electrode current density and activation loss of the CL, as follows:
i a = α v , a i r e f , a ( C O 2 C O 2 , r e f ) 1 2 ( e x p ( α a F η a c t , a R T ) e x p ( ( 1 α a ) F η a c t , a R T ) )
i c = α v , c i r e f , c ( C H 2 C H 2 , r e f ) ( e x p ( α c F η a c t , c R T ) e x p ( ( 1 α c ) F η a c t , c R T ) )
where  α a  and  α c  are the anode and cathode transfer coefficients.  i r e f , a  and  i r e f , c  are the reference exchange current densities of the anode and cathode, A/cm2 η act    is the overpotential caused by electrochemical reaction:
η a c t , a = ϕ s ϕ m E e q
η a c t , c = ϕ s ϕ m
ϕ s    and  ϕ m  are the solid-phase potential and membrane-phase potential, respectively, V.  E e q  is the thermodynamic equilibrium potential and be calculated as follows:
E e q = E e q , r e f ( T ) R T n F l n ( P i P r e f ) υ i
where  E e q , r e f  is the reference equilibrium potential, V, and  P i  and  P r e f  are the partial pressure and reference pressure of substance i, respectively, Pa.

2.2.2. Transport of Multicomponent Mass Transfer

The PEMEC reaction flow is composed of multiple components, and the multi-component continuity equation is expressed as follows:
t ( ρ ω i ) + ( ρ ω i u ) = S m
where  ρ  is the density of the mixture, kg/m3 u  is the average mass flow rate of the mixture, m/s; and  S m  is the mass source phase in the electrochemical reaction process. Darcy’s law is used to describe the flow velocity of fluid in porous media:
u = κ μ p
where  κ  is the permeability of porous electrode, m2, and  μ  is the fluid dynamic viscosity, Pa·s.
The Maxwell–Stefan equation is used to describe the gas- and liquid-phase diffusion of the CH, GDL and CL [23]:
c x i = j = 1 , i j n 1 D i j ( x j N i x i N j )
where c is the molar concentration, mol/m3 D i j  is the binary diffusion coefficient of species i in j, m2/s; x is the molar fraction of the substance; and N is the diffusion flux of the substance, kg/(m2·s). The binary diffusion coefficient is calculated by the Fuller–Schettler–Giddings formula as follows [24]:
D i j = 1.01325 × 10 2 T 1.75 1 M i + 1 M j P ( ( i v ) 1 3 + ( j v ) 1 3 ) 2
where  v  is the atomic diffusion volume of hydrogen, oxygen and water, 6.12 cm3/mol, 16.3 cm3/mol and 13.1 cm3/mol, respectively.
The Weber–Newman model is used to describe the relationship between ion transport and liquid water transport through the proton exchange membrane. The water flux through the proton exchange membrane is calculated as follows:
S w = n d σ m F ϕ m + ( α + n d 2 σ m F 2 ) μ 0
where  n d  is the electro-osmotic drag coefficient related to the relative humidity (RH) of proton exchange membranes, and α is the water transport coefficient.  μ 0  is the chemical potential of water, J/mol, which is calculated according to the following empirical formula [25]:
μ 0 = R T l n ( p v a p ( T ) p g 0 ) + V H 2 O p H 2 O ( l )
where  p g 0  is the gas pressure under standard conditions, Pa;  V H 2 O  is the partial molar volume of water, L/mol; and  p s a t  is the water-saturated vapor pressure.

2.2.3. Thermal Transport

The heat transfer model of the PEMEC mainly includes convective heat transfer and heat conduction. The energy equation for the entire computational domain can be described as follows [19]:
( ρ e f f C p e f f T ) t + ( ρ e f f C p e f f u T ) = ( k e f f T ) + S T
where  ρ e f f k e f f  and  C p e f f  are the effective density, the effective thermal conductivity and the specific heat capacity, respectively.  S T  is the energy source term. The compounded density, specific heat capacity and conductivity are considered in accordance with the following empirical equations:
ρ e f f = ( 1 ε ) ρ s + ε ρ f
C p e f f = ( 1 ε ) C ρ s + ε C ρ f
k e f f = ( 1 ε ) k s + ε k f
The heat source term of the energy equation includes electrochemical heat caused by the electrochemical reaction and Joule heat caused by electron conduction resistance. The heat source term generated by electrochemistry is expressed as follows:
Q r = ( Δ H r n F ( Δ G r n F η ) ) i m
where  Δ H r  is the enthalpy change of the reaction, kJ/mol;  Δ G r  is the Gibbs free energy of the reaction, kJ/mol L; and  η  is the sum of the overpotential of the reaction, V.
The Joule heat source term due to the conduction of solid and the charge transfer of electrolyte is expressed as follows:
Q J = ( i s ϕ s + i m ϕ m )
where  i s  and  i m  are the solid phase current and the film phase current, respectively, A/cm2. Table 2 lists the main parameters of the numerical model.

3. Boundary Conditions and Model Validation

The numerical model is built in the commercial software COMSOL Multiphysics 6.0. The geometric model of the PEMEC is modeled according to the experiment, and the relevant parameters are shown in Table 3.
It is necessary to determine the appropriate boundary conditions to ensure the accuracy and authenticity of the numerical model. The PEM electrolysis cell uses a constant liquid water flow. The operating temperature is 333 K, the outlet pressure is standard atmospheric pressure, the anode BP boundary is set to the potential or electrode current, and the cathode BP is set to 0 V. Considering the influence of the environment on the temperature, the outer wall is set to natural convection heat transfer. The heat transfer coefficient is 10 W/(m·K), and the fluid flow on the inner wall surface adopts the non-slip wall boundary condition. The determination of water flow rate is calculated according to the following expression [21]:
m i n = λ M H 2 O I A c 2 F
where  λ  is the stoichiometric number;  M H 2 O  is the molar mass of water, g/mol; I is the current density, A/cm2 A c  is the chemical reaction active area, m2; and F is the Faraday constant, C/mol.
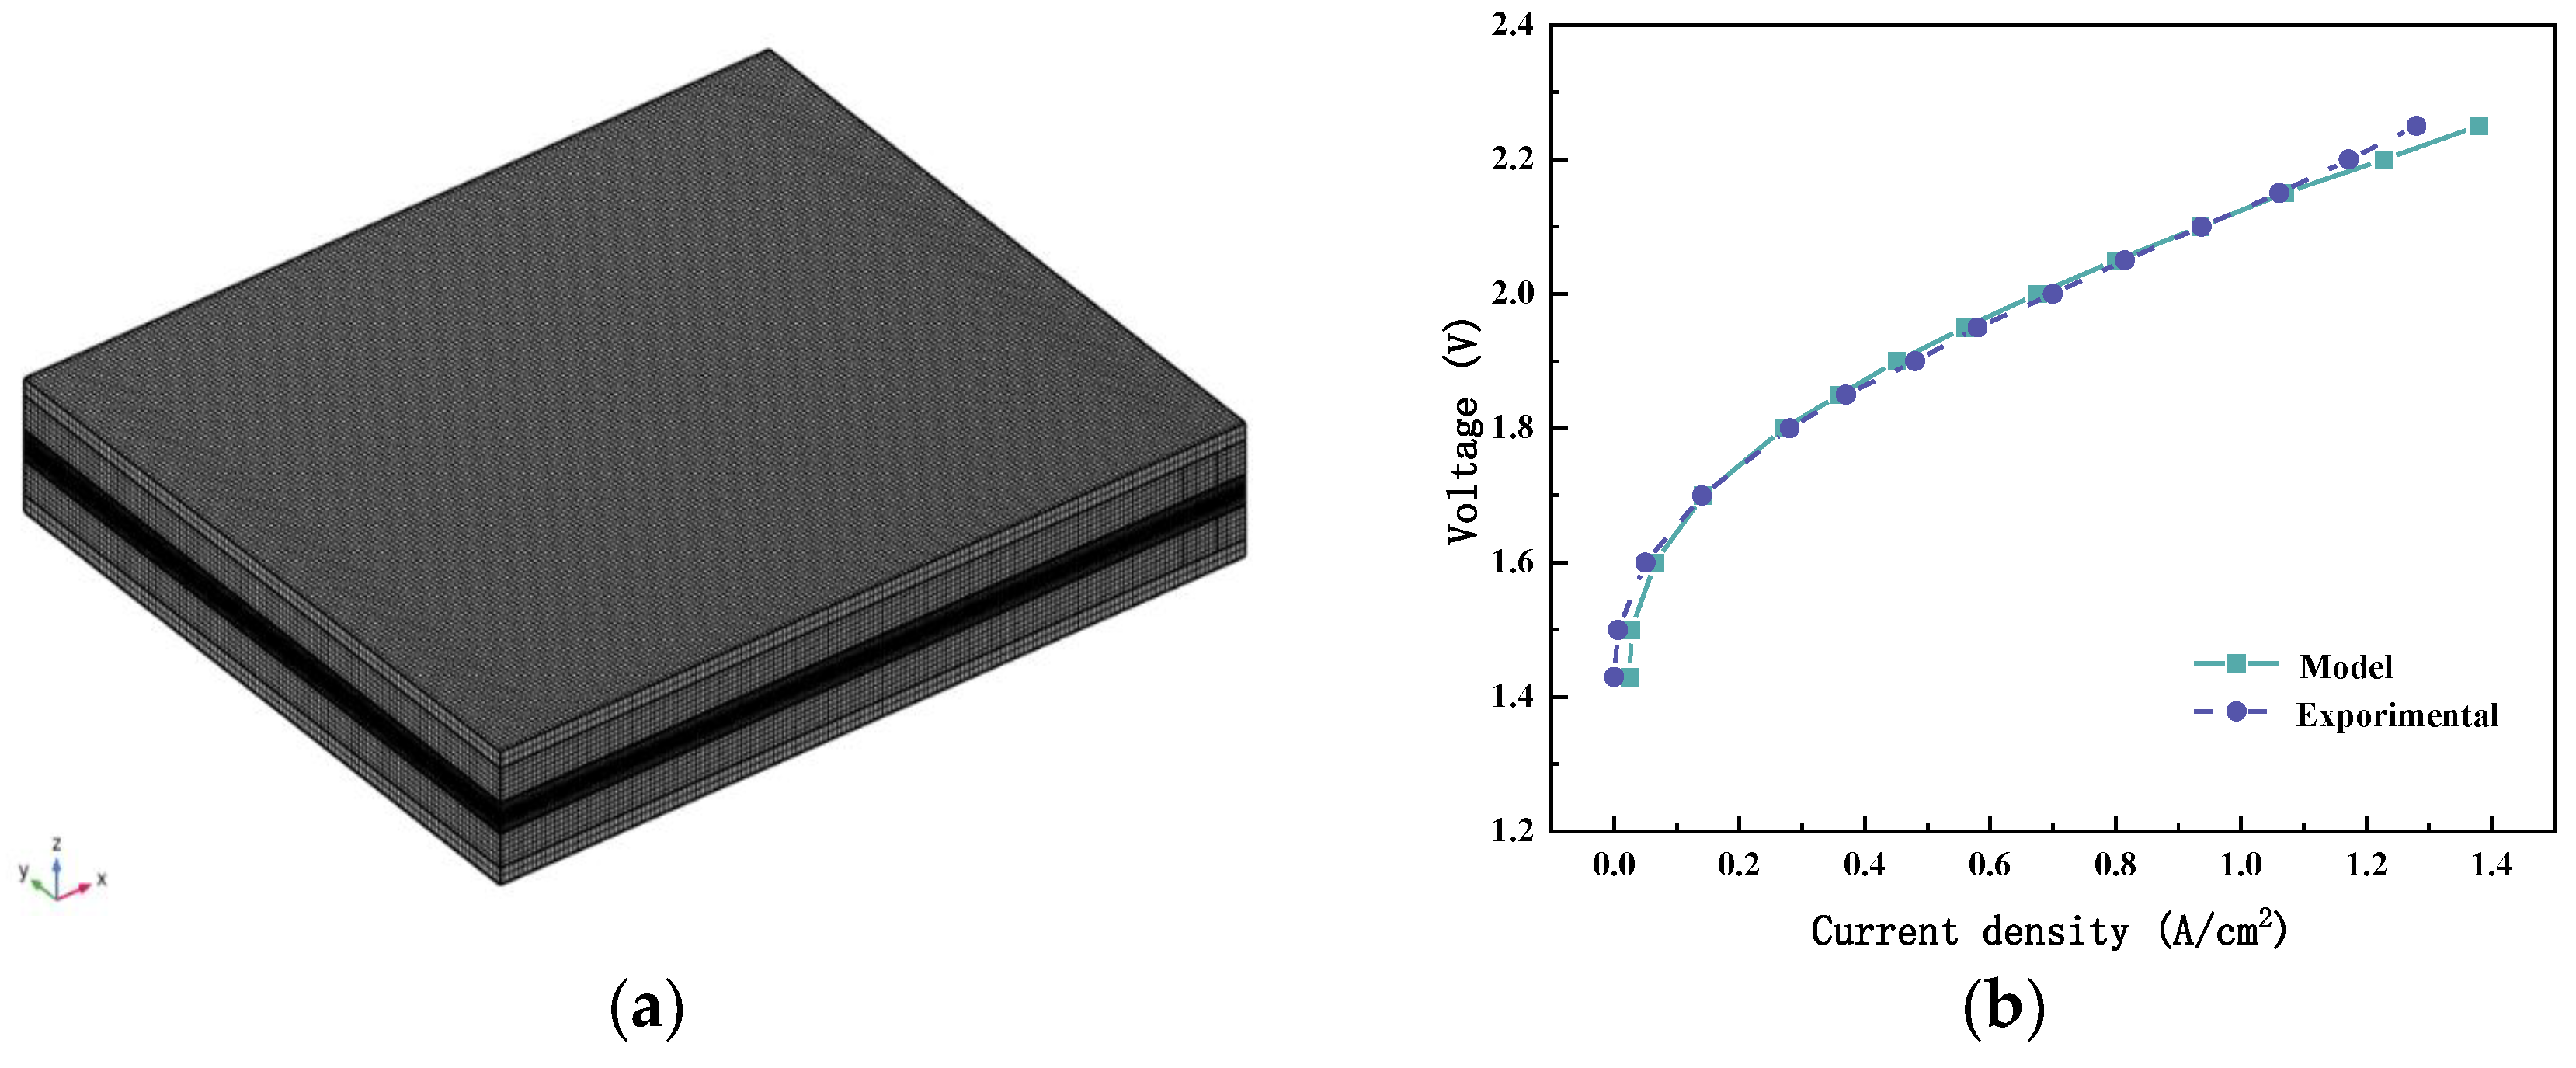
Figure 2a shows the grid model of the PEMEC. It is found that when the number of grids exceeds 927,000, there is no significant difference in the simulation results. This paper solves the model based on 927,912 grids. The polarization curves measured were compared with numerical model. Figure 2b shows the relative size of the numerical model calculation results and the experimental test results. The maximum error is controlled within 7%. It can be considered that the numerical model in this study is reliable.

4. Results and Discussion

Based on the above established model, the influences of voltages and the water flow rate on gas–liquid and temperature distributions were investigated in the steady state condition.

4.1. Pressure and Velocity Distributions at Different Voltages

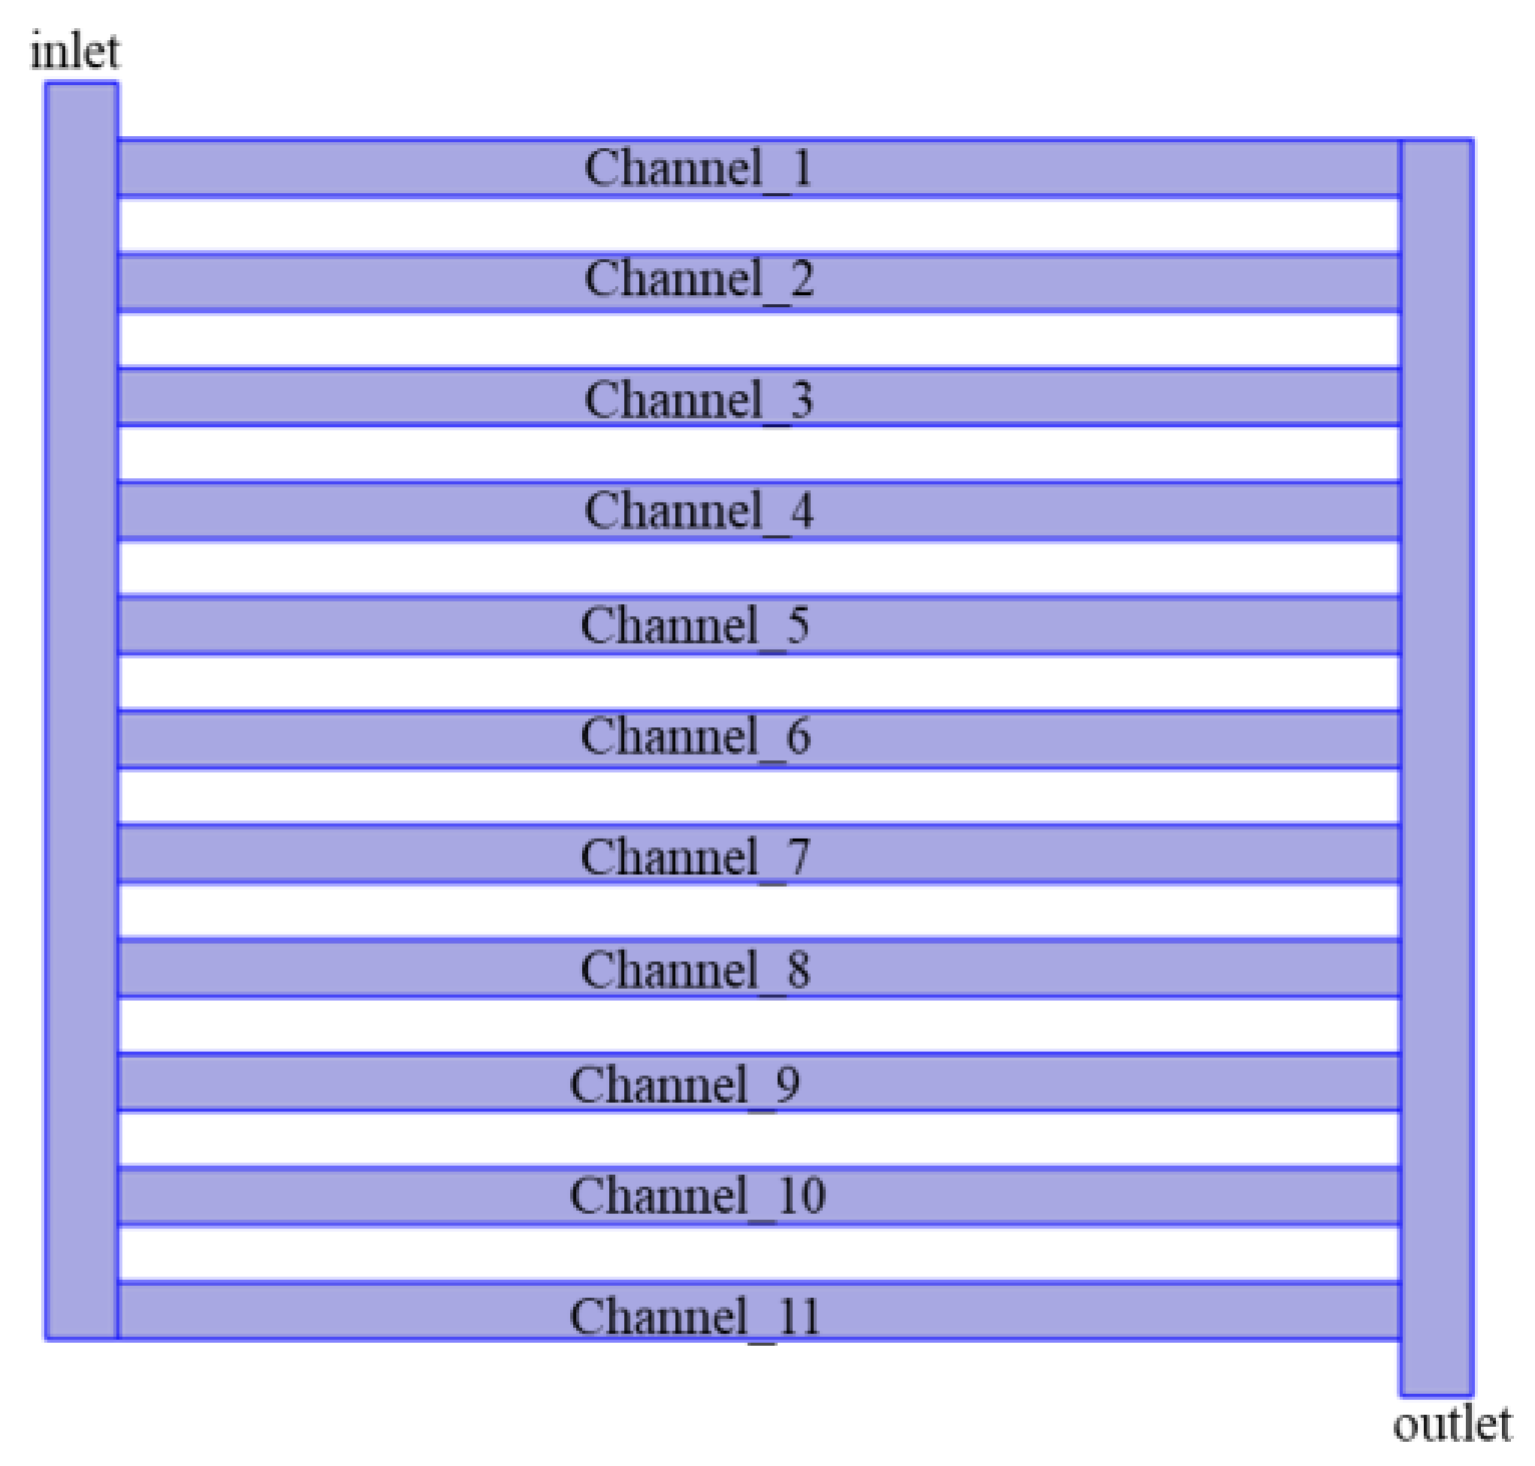
The various flow channels of the electrolytic cell are numbered to explain the different changes in the flow channels under different conditions, and the numbering order is shown in Figure 3.
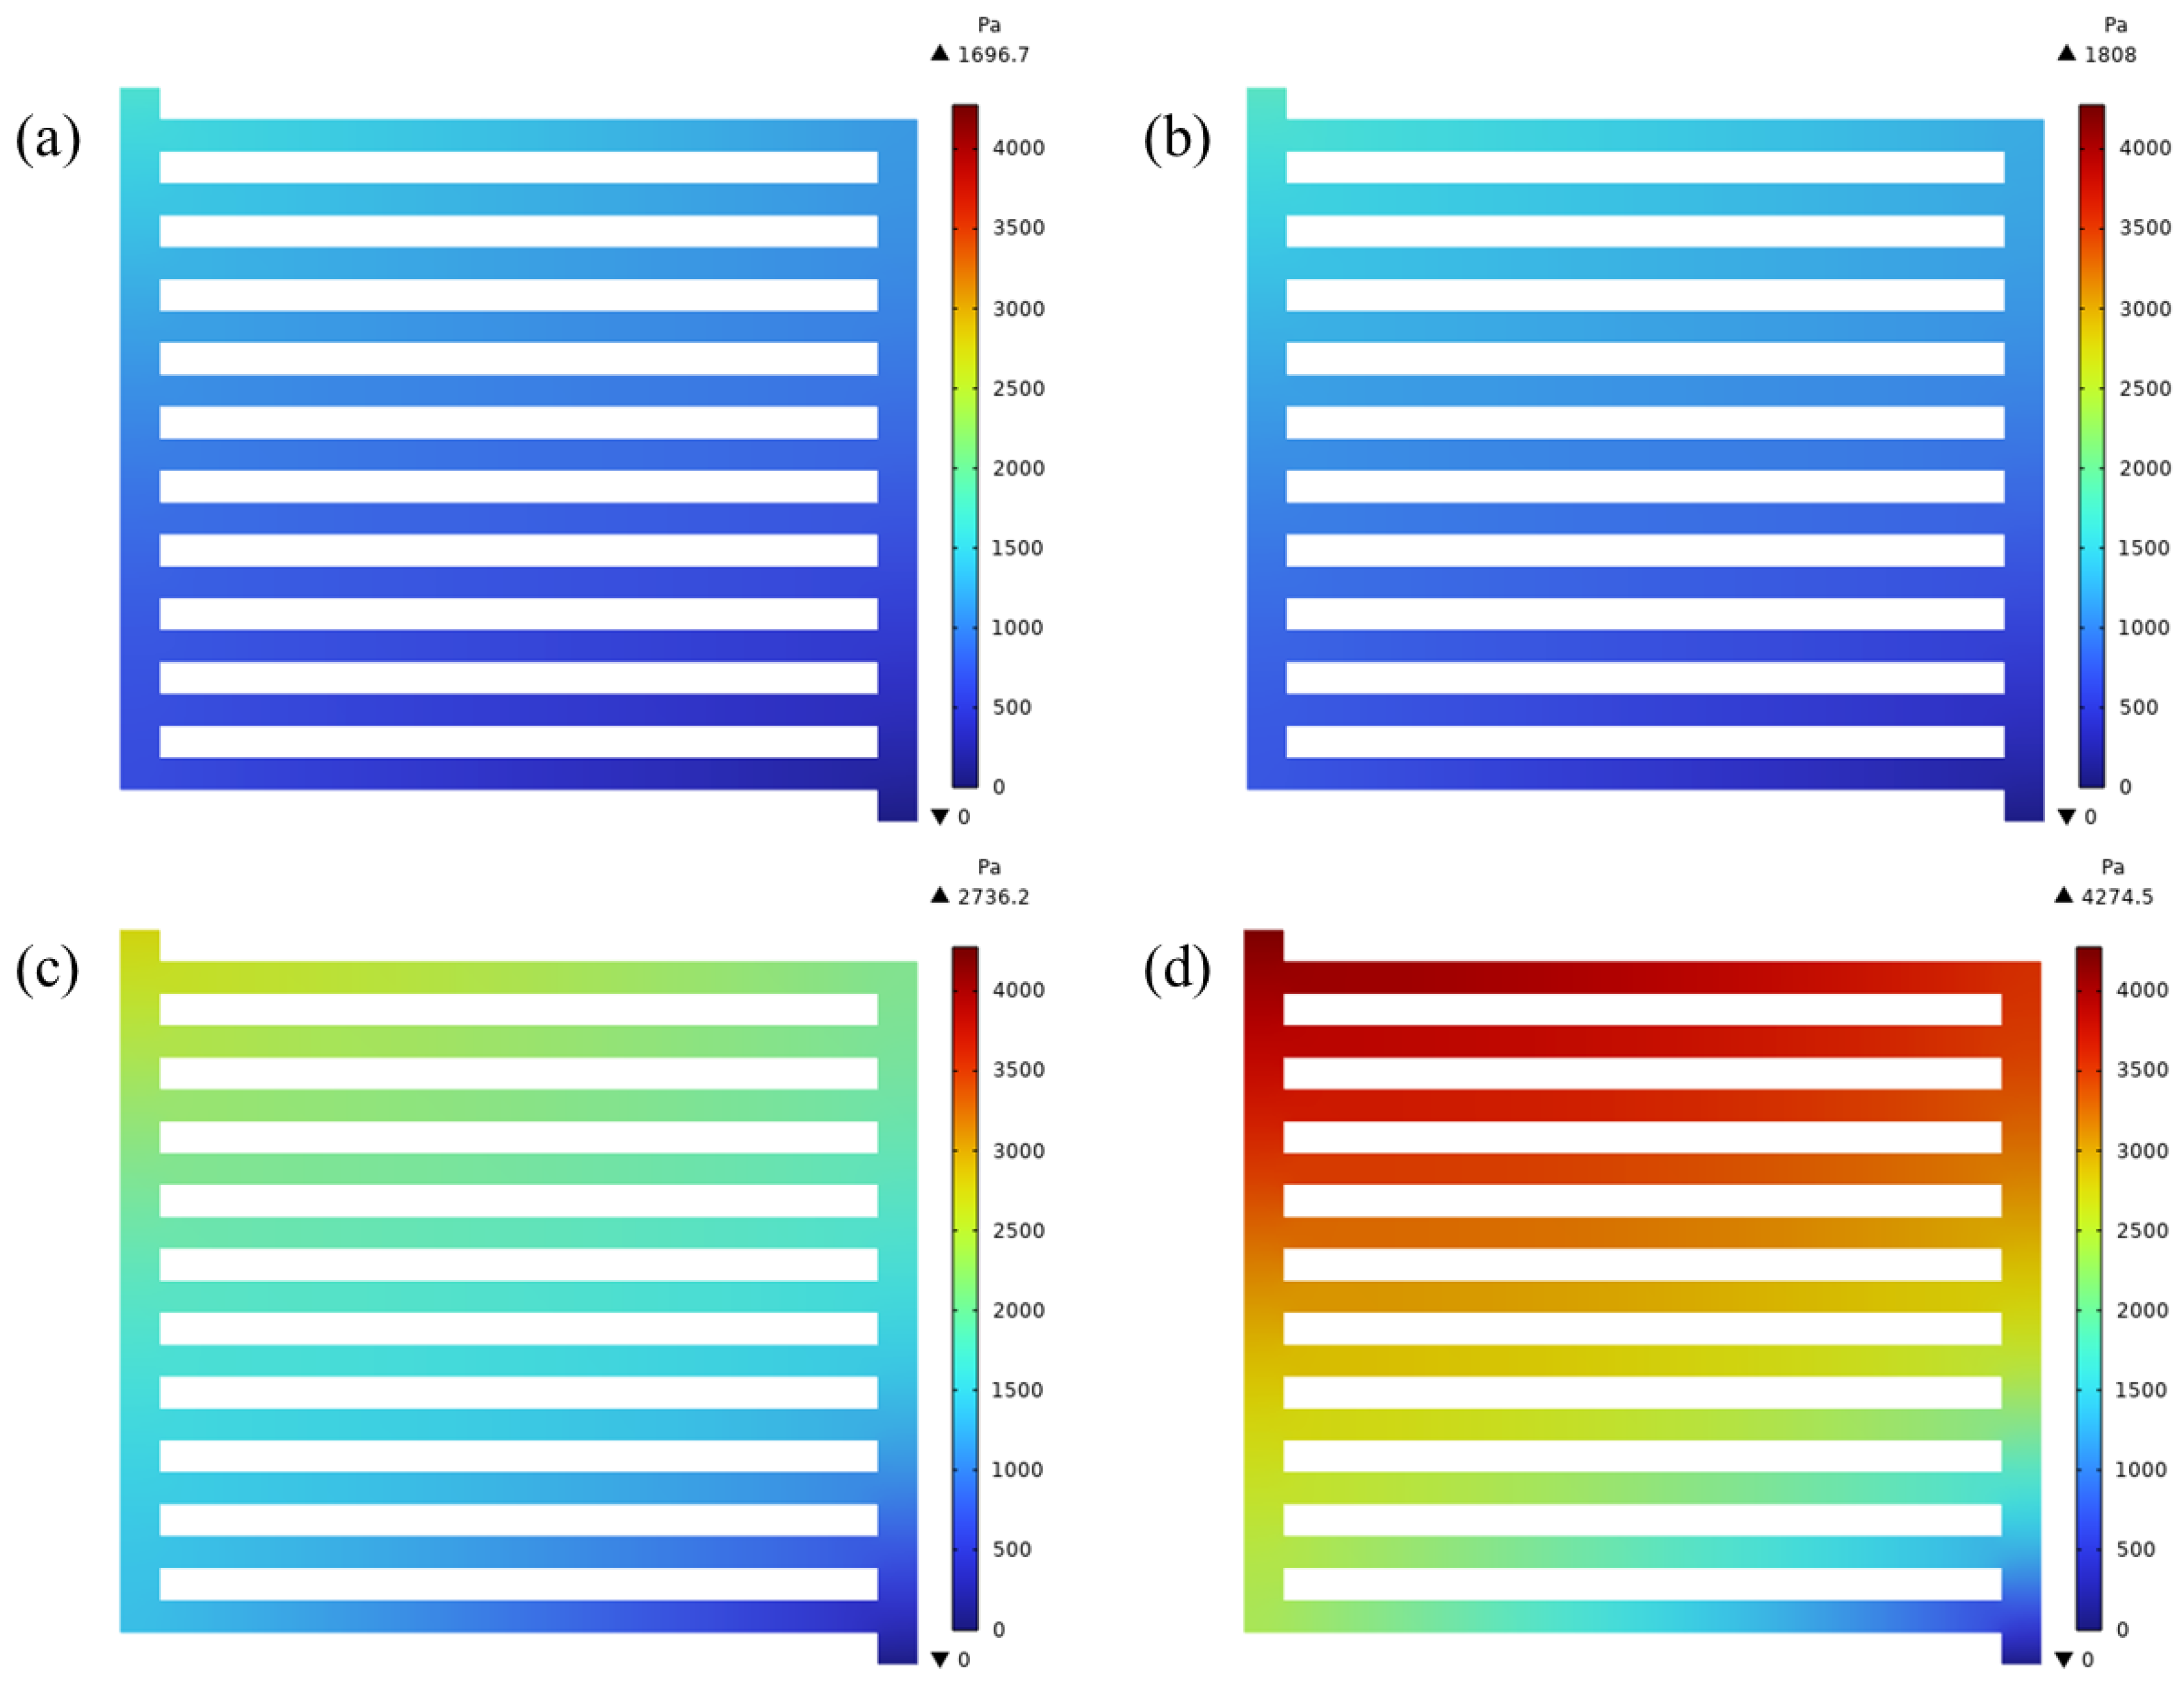
Figure 4 shows pressure distribution of the CH at different electrolysis voltages at an inlet temperature of 333 K and flow rate of 0.6 mL/s. It could be found that the pressure decreased gradually from the inlet to the outlet. The pressure difference increased gradually with the increase in voltage. In fact, due to the structural characteristics of the parallel flow field, the distribution of liquid water in the flow channel was uneven. Hence, the current density of the catalytic layer was also different in each part [30]. The change in the oxygen generation rate at different active sites caused different channel pressure distributions.
Figure 5 shows the variation of the average velocity of the mixture at the same inlet flow rate. It can be found that the mixture’s velocity on both sides of the flow channel is higher than that in the middle flow channel, and velocity is lower in the middle part of the flow channel. From Figure 5a,b, it could be found that velocity of channel_1 is slightly larger than that of channel_11. The whole flow velocity was approximately symmetrically distributed in the middle. When voltage was increased to 2.0 V and 2.2 V, the velocity of channel_11 was greater than that of channel_1. With the increase in voltage, the overall velocity distribution of CH was reversed. There is a reason that the fluid flow state is changed because of the acceleration of the electrochemical reaction. Since there are only oxygen and liquid water on the anode side, there are two main reasons for this difference: one is the change in liquid water flux in the flow channel caused by the inlet flow rate and the other is the change in oxygen flux in the flow channel.

4.2. Oxygen Flux and Liquid Water Flux at Different Voltages

Figure 6 shows the oxygen mass flux and water mass flux at the same inlet flow rate and different voltages. As shown in Figure 6a–d, the oxygen mass flux of the channel was basically the same at different voltages, and the overall characteristics were small in the middle and large on both sides. The oxygen mass flux of channel_11 was greater than channel_1. The oxygen mass flux of channel_11 was 2 times, 2.02 times, 2.28 times, and 2.82 times that of channel_1 when the voltage was 1.6 V, 1.8 V, 2 V and 2.2 V, respectively. It could be known from Figure 6e–h that the changes in liquid water flux and oxygen flux were not same. Although the liquid water flux in the middle channel was the minimum, the water mass flux in channel_1 was greater than that in channel_11 at low voltages; when the voltage was 2.2 V and 2.4 V, the water mass flux of channel_1 was gradually lower than that of channel_11. Combined with the velocity distribution, the distribution characteristics of liquid water mass flux and velocity were consistent at different voltages, and so the velocity of the mixture was mainly affected by the liquid water distribution characteristics.

4.3. Temperature Distribution at Different Voltages

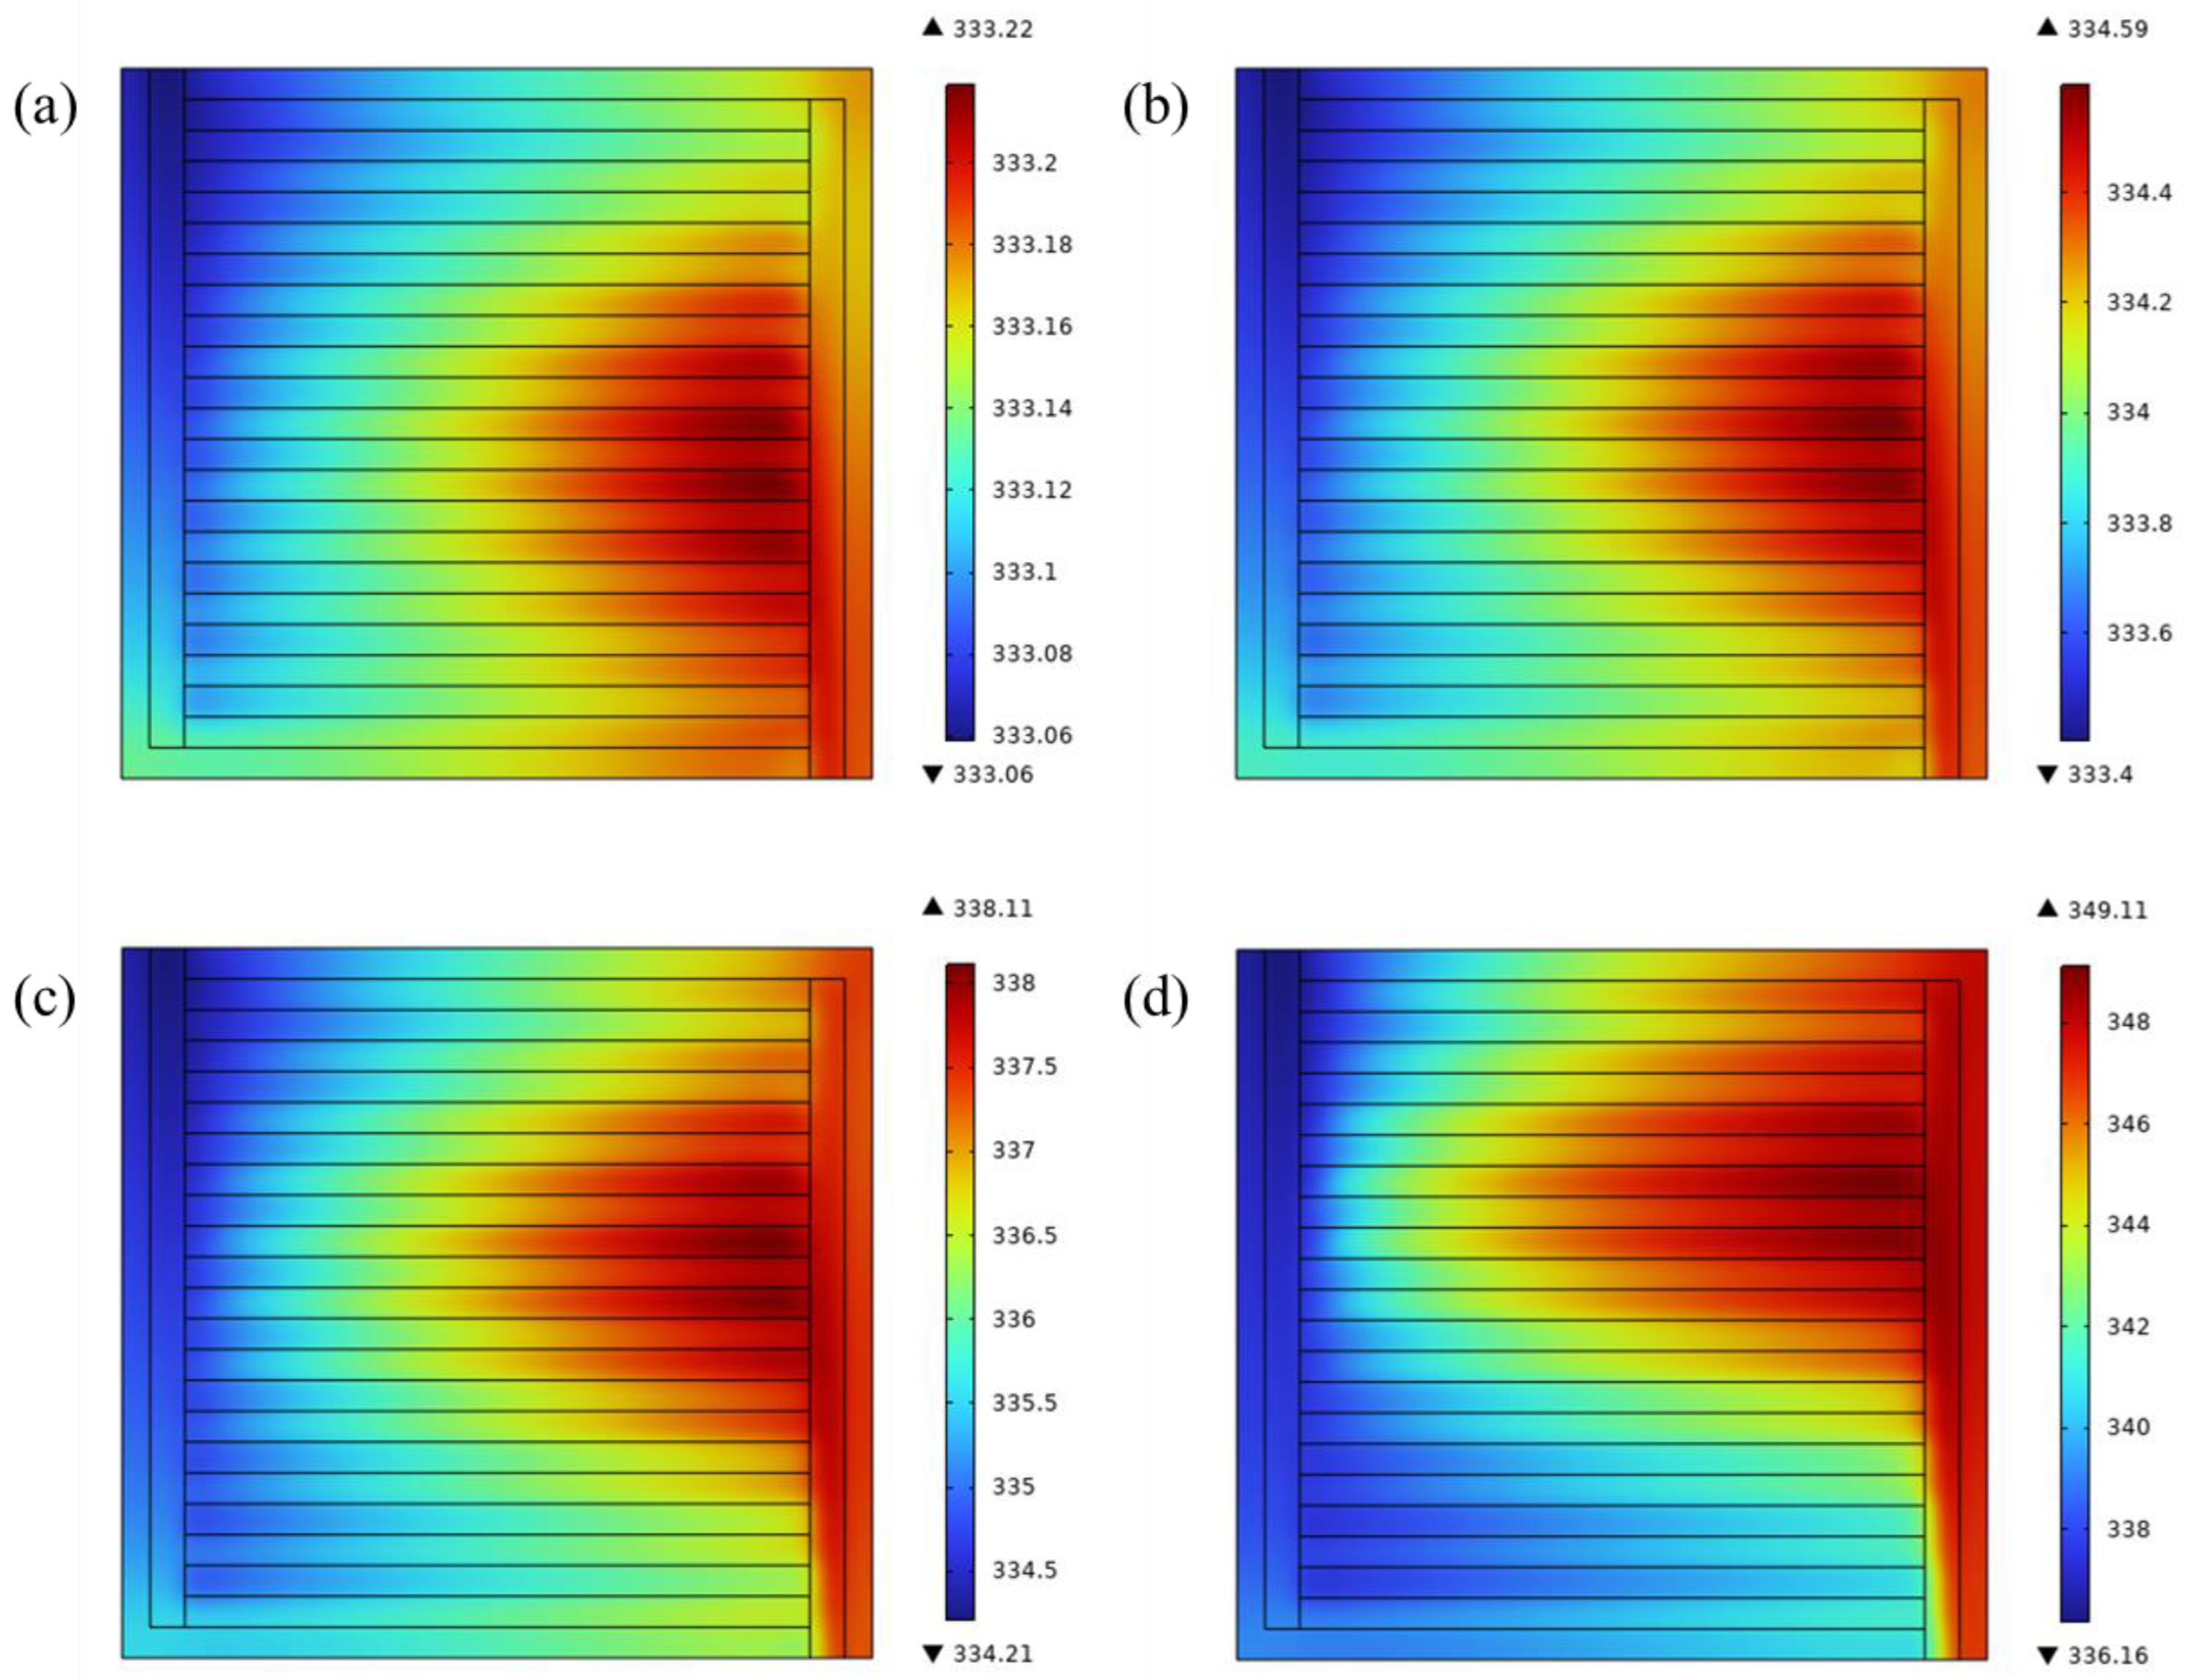
Figure 7 shows the temperature distribution of the catalytic layer at different voltages and the same flow rate. Considering the lower liquid water content fully exchanging heat with the liquid water along the flow direction [31], the inlet region was lower and the outlet region was higher. In the electrolysis process, heat transfer mainly included conduction and convective heat transfer. Because the liquid water mass flux of the parallel flow field was small in the middle and large on both sides, it was smaller for the middle channel to conduct heat exchange, resulting in the higher temperature of the middle part. It could be described that when voltage was 1.6 V and 1.8 V, the temperature difference of the CL was smaller, and the highest temperature reached 338 K and 349 K at 2.0 V and 2.2 V. With the increase in voltage, the surface temperature of the catalytic layer increased exponentially. The reason was that as the voltage increased, the average current density increased, and the ohmic heat was more obvious. Although the surface active sites of the CL could be increased at high temperature, an increase in the local temperature would also lead to an uneven distribution of thermal stress on the membrane surface and accelerate the performance degradation of the membrane [32]. Hence, a proper water flow rate must be considered to ensure safety.
The above results indicated that the liquid water demand was different at different voltages, and the heat and mass transfer behavior of the PEMEC also had certain differences. A reasonable water flow rate could not only ensure the supply of reactants but also improved water and thermal management ability of the PEMEC. In order to further explore the influence of the water flow rate on the flow field and water and thermal management of the electrolysis cell, the heat and mass transfer and flow field distribution characteristics of the PEMEC at different flow rates should be researched.

4.4. Water and Thermal Management Performance at Different Water Flow Rates

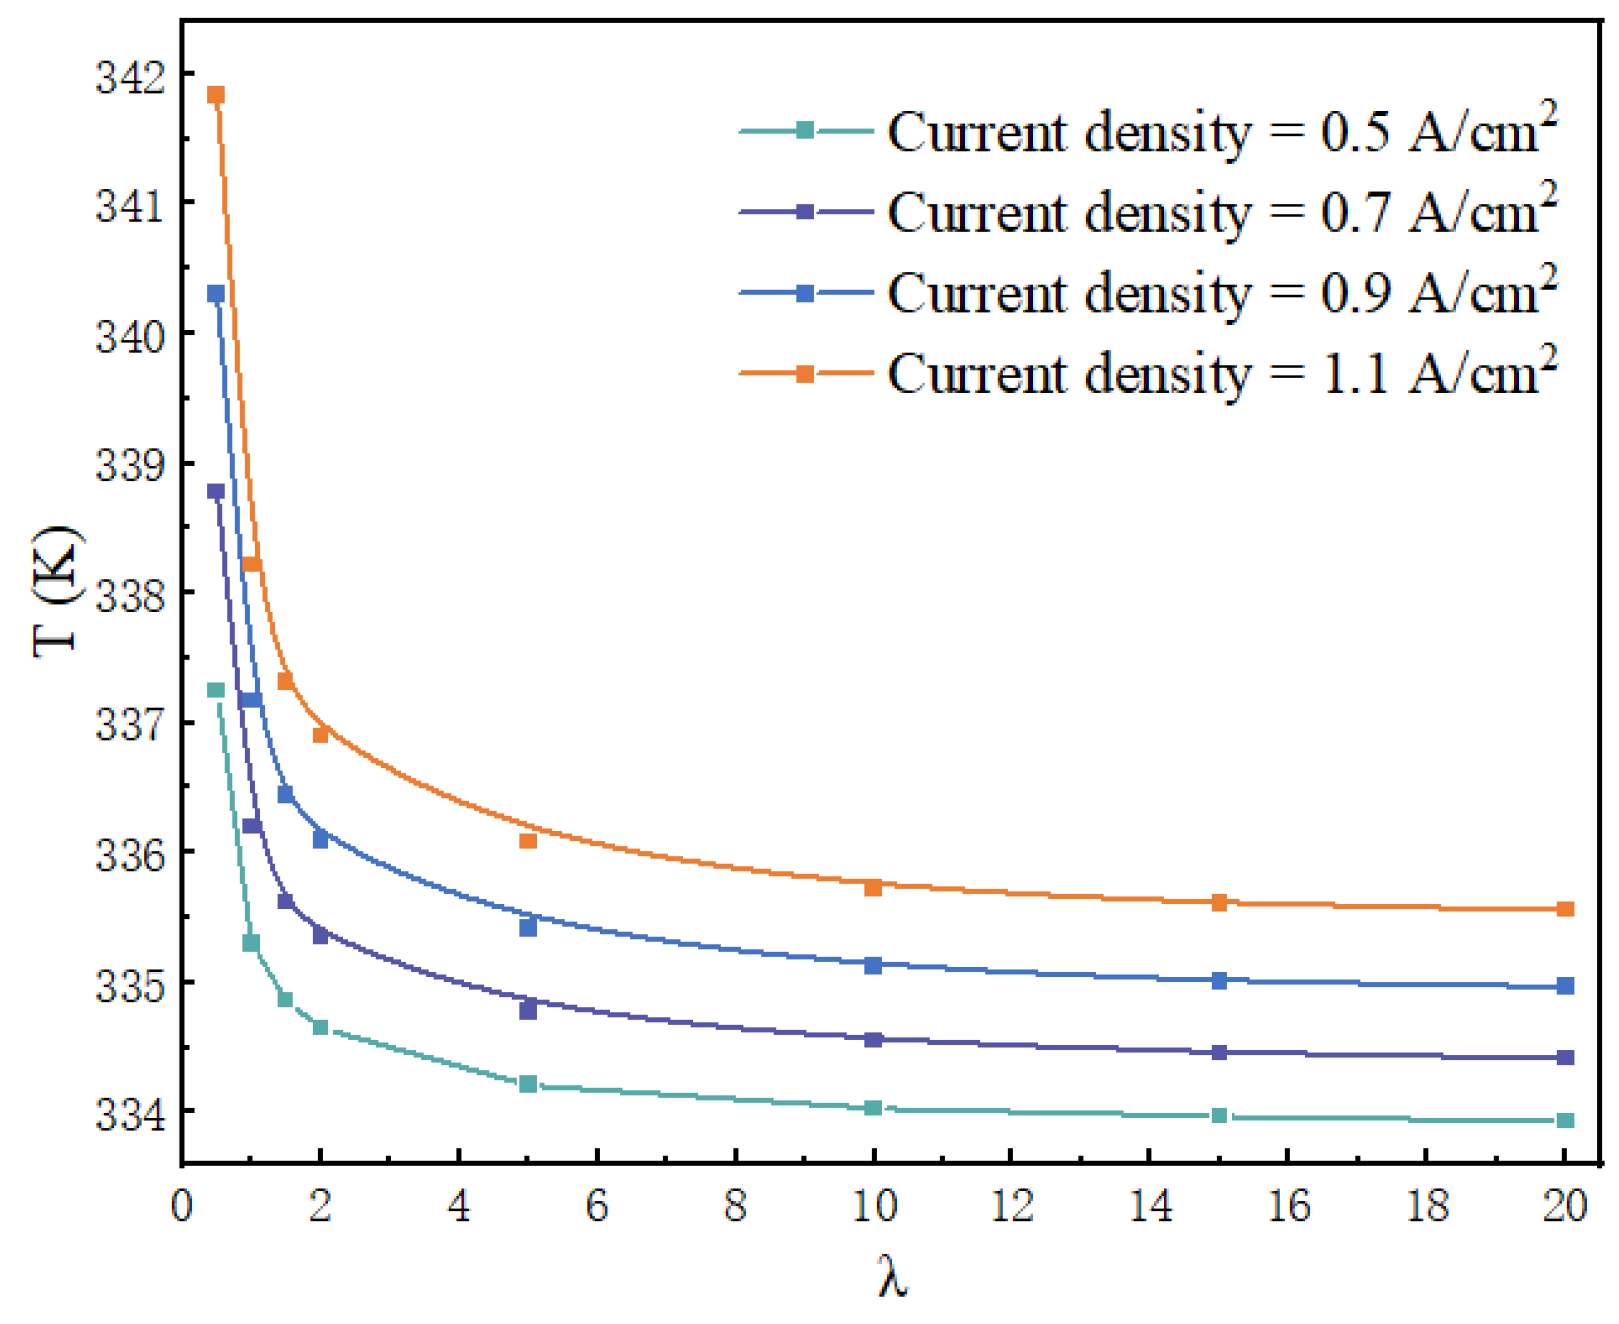
To further determine the influence of the water flow rate on the water and thermal management performance of the electrolysis cell, the relationship between the average temperature and the stoichiometric number λ was described in Figure 8. It could be acquired that when λ was certain, temperature of the CL increased with the increase in current density owing to two reasons: one was that the increase in current density led to a bigger ohmic heat, and the other was that the higher the current density was, the faster the electrochemical reaction rate was, and further the greater the electrochemical heat was, resulting in a higher temperature of CL. When λ was less than two, the average temperature of the CL decreased rapidly, which was caused by liquid water diffusing to the surface of CL. The work capacity of the electrolysis cell was weakened, and the current heat loss increased. Nevertheless, with the increase in λ, the liquid water gradually increased, and the surface temperature of the CL was more uniform. Compared to that of λ = 20, the temperature difference was only 0.24 °C, 0.36 °C, 0.45 °C and 0.52 °C when λ was 20. Therefore, when the water flow rate increased to a certain number, increasing the water flow rate could not obviously improve the water and heat management of the PEMEC.

4.5. The Changes in Velocity and Mass Transfer Characteristics at Different Water Flow Rates

Figure 9 shows the relationship between the flow rate and the average velocity of the mixture at different voltages. As described in Figure 10, the average velocity of the channel at different λ was basically the same with a change in the operating voltage. When the stoichiometric number was 0.5, the water flow rate could not meet the liquid water flux required under the actual electrolysis conditions. The average velocity of channel_11 was faster than channel_1. With the increase in λ, the flow velocities of channel_1 and channel_11 were basically the same. When the stoichiometric number was five, the velocity distribution in the channel was approximately symmetrical in the middle field. The average velocities of channel_11 were 0.75, 1.1 and 1.2 times the channel velocity of channel_1, respectively. Hence, the water flow rate was the main factor affecting the velocity distribution of the parallel flow field, which played an important role in the timely discharge of oxygen and the improvement of electrolysis performance.
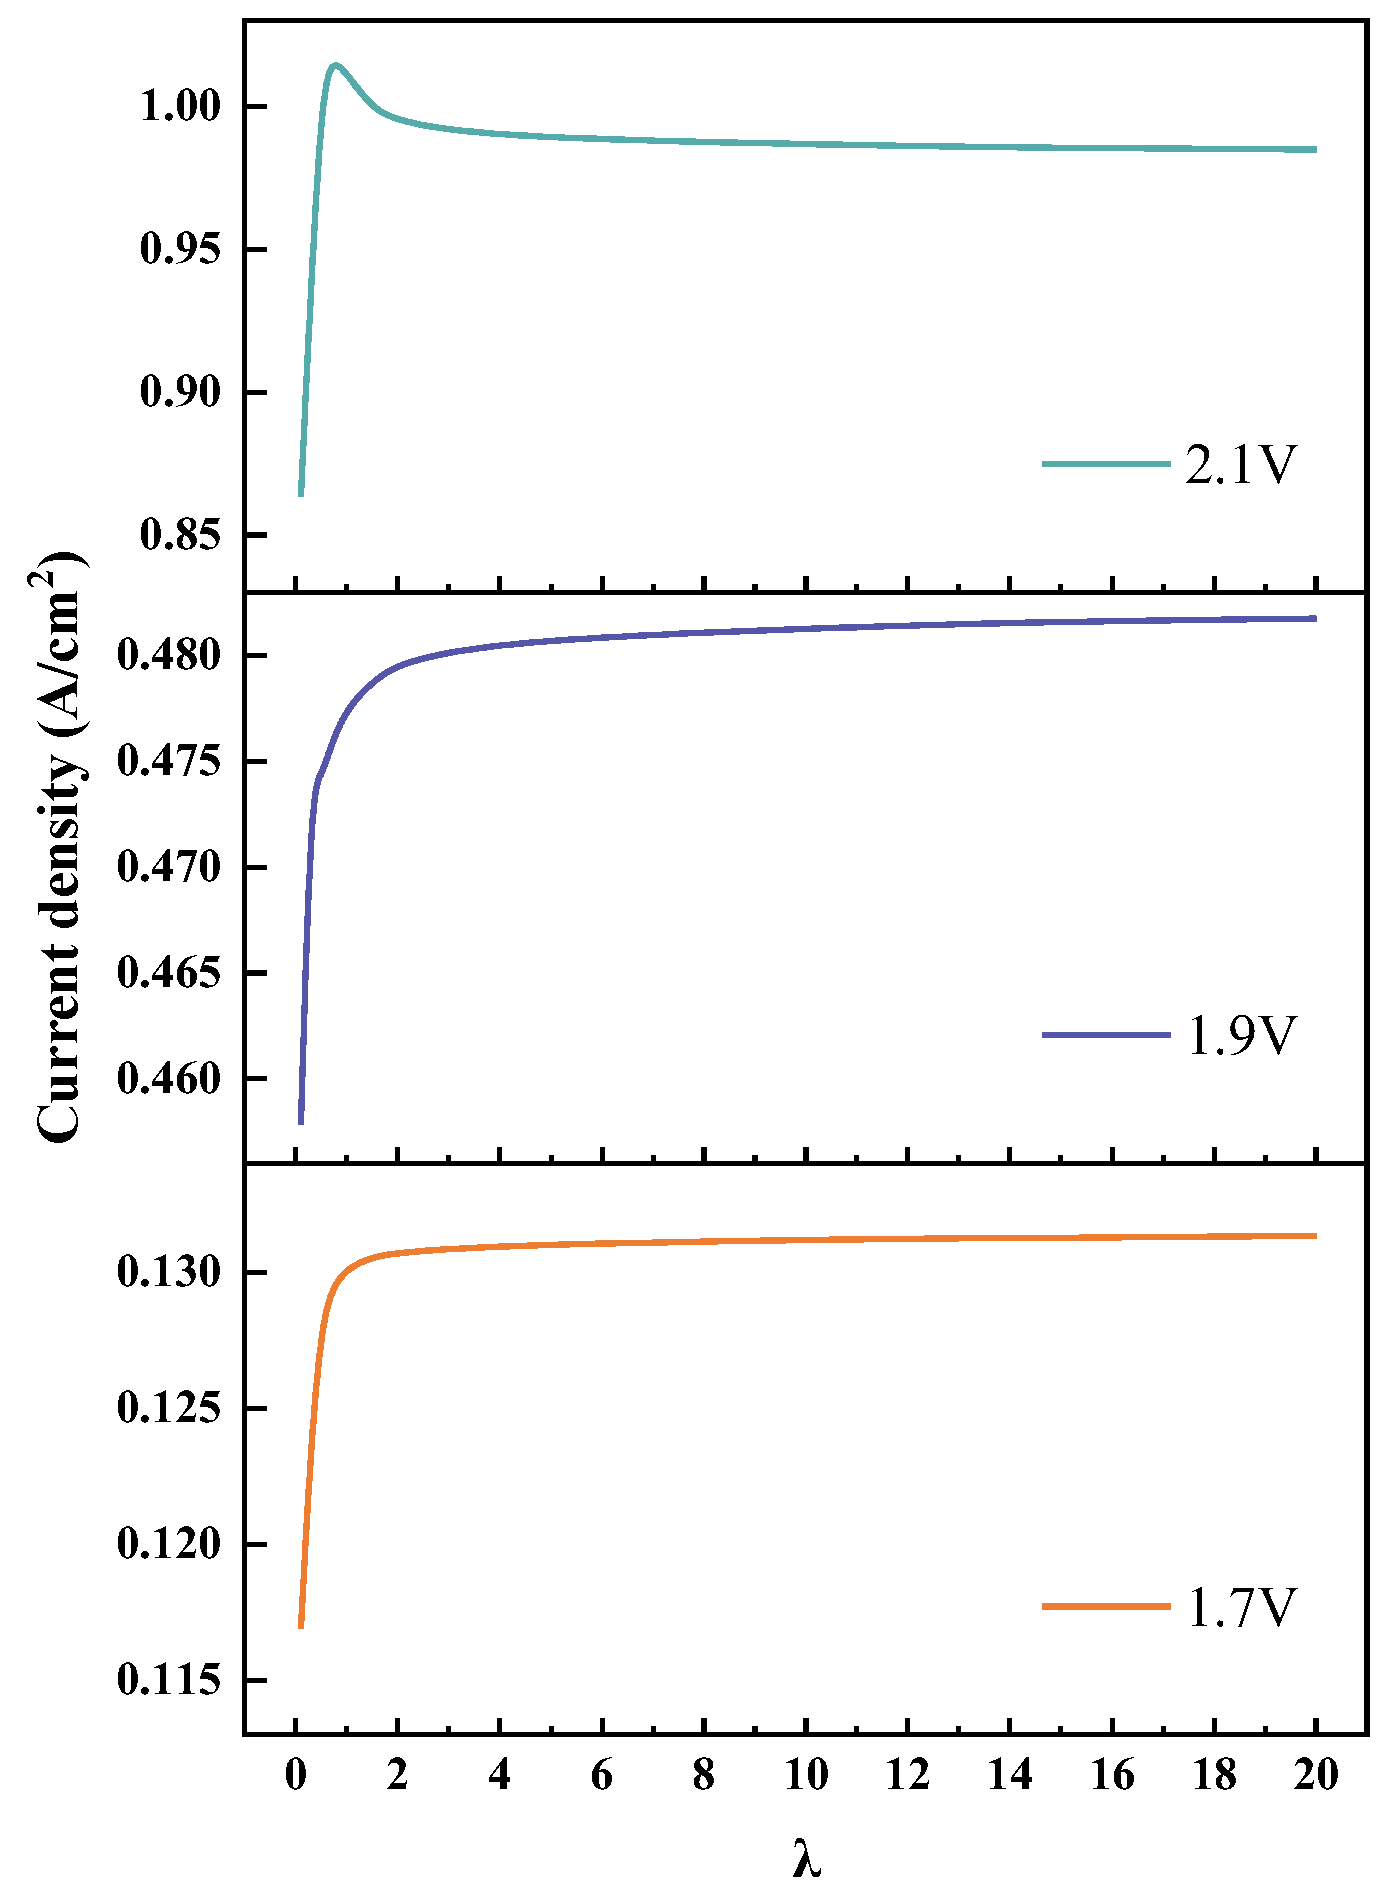
Figure 10 describes the relationship between the current density and λ at 1.7 V, 1.9 V and 2.1 V. We could find that the current density increased rapidly and then tended to be stable with the increase in λ. the reactant was the main factor affecting the electrochemical reaction when the water flow rate was small. With the increase in λ, the water content on the surface of the CL was much larger than the liquid water consumed by the electrochemical reaction. It could be found that when the voltage was 2.1 V, the current density reached the maximum at λ = 0.7. Nevertheless, the current density gradually decreased and then tended to be stable with the increase in λ. The main reason was that the oxygen generation rate was accelerated, causing more complicated heat and mass transfer phenomena at a high current density. When gas volume fraction grew, a counter-current occurred at the corner of the flow channel due to the gas–liquid interaction. This phenomenon further caused circulation flow and a deterioration of the gas–liquid two-phase mass transfer process in some regions [12].
Due to the stoichiometric number, there may be changes in the water flow rate. combined with the results in Figure 8, Figure 9 and Figure 10, it could be found that the water flow rate was vital for the PEMEC to improve the mass transfer process and water and thermal management ability. When λ was less than two, the flow rate close to the inlet section was much lower than the flow rate near the inlet section, and the average temperature and current density of the CL had obvious changes. With the increase in λ, the flow rate close to the inlet section was close to or greater than flow rate close to the outlet section. When λ was greater than five, the average temperature and average current density of CL were little affected by the water flow rate, and the water and thermal management performance and electrolysis performance of the PEMEC were greatly promoted. Therefore, in the parallel flow field, the increase in the inlet water flow rate was beneficial for the safe and efficient operation of the electrolysis cell. However, an increase in the water flow rate would lead to a rise in the pressure difference and higher consumption of the pump power. An appropriate water flow rate could better improve the production efficiency. In some special cases, the distribution law between the water flow rate and the channel velocity could be utilized to approximately estimate the water and thermal management and electrolysis characteristics.

5. Conclusions

A three-dimensional numerical model of heat and mass transfer and electrochemistry in the parallel flow field of a PEMEC was established in this manuscript. The velocity, liquid water flux and oxygen flux of the PEMEC were concretely analyzed at the same flow rate and different voltages. Then, the flow field distribution and water and thermal management performance of the PEMEC were further discussed at different flow rates. The following main conclusions were drawn:
(1)
The mass flux of oxygen and water in the channel was lower in the middle region. The oxygen mass flux of channel_11 was always higher than that of channel_1. The relative velocity of channel_1 and channel_11 was determined by the inlet water flow.
(2)
The pressure distribution decreased diagonally from the inlet to the outlet. The pressure difference at 2.2 V was 2.5 times that at 1.6 V at the same inlet flow rate. Because of the flow characteristics of parallel flow field, the mass flux and pressure difference of the middle channel were smaller than others.
(3)
The average temperature and average current density of the CL decreased rapidly and then gradually stabilized with the increase in the water flow rate. When the voltage was 2.1 V, the current density came to the highest value at a stoichiometry of 0.7, and then gradually decreased until stable. When λ was greater than five, the temperature and current density of the CL changed slowly.
(4)
Electrolysis performance and water and thermal management characteristics could be estimated according to the flow velocity distribution features. When the average temperature and current density of the CL were less affected by the inlet flow rate, the velocity of channel_1 was higher than that of channel_11.

Author Contributions

Conception, L.H. and G.Z.; Writing—original draft, K.H., D.S. and J.Z.; Writing—review & editing, D.S., J.L., K.H. and K.P.; Supervision, L.H. and J.Z.; Funding acquisition, L.J., W.J. and Y.W. All authors have read and agreed to the published version of the manuscript.

Funding

This research was financially supported by the Science and Technology Program of Guangzhou, China (202201011357), Science and Technology Project of Guangdong Administration for Market Regulation (2023ZZ06), and Zhuhai Science and Technology Planning Project in the Field of Social Development (2220004000343 and ZH22036201210039PWC).

Data Availability Statement

Data are contained within the article.

Conflicts of Interest

Authors Jun Liu and Kang Peng were employed by the company Guangdong Greenway Technology Co., Ltd. Author Yuliang Wen was employed by the company Dongguan Guixiang Insulation Material Co., Ltd. The remaining authors declare that the research was conducted in the absence of any commercial or financial relationships that could be construed as a potential conflict of interest.

References

  1. Wang, Y.; Guo, C.H.; Chen, X.-J.; Jia, L.-Q.; Guo, X.-N.; Chen, R.-S.; Zhang, M.-S.; Chen, Z.-Y.; Wang, H.-D. Carbon peak and carbon neutrality in China: Goals, implementation path and prospects. China Geol. 2021, 4, 720–746. [Google Scholar] [CrossRef]
  2. Wu, Z.; Huang, X.J.; Chen, R.; Mao, X.; Qi, X. The United States and China on the paths and policies to carbon neutrality. J. Environ. Manag. 2022, 320, 115785. [Google Scholar] [CrossRef] [PubMed]
  3. Alexander, B.; Hartmut, S. Current status of water electrolysis for energy storage, grid balancing and sector coupling via power-to-gas and power-to-liquids: A review. Renew. Sustain. Energy Rev. 2018, 82, 2440–2454. [Google Scholar]
  4. Kumar, S.S.; Himabindu, V. Hydrogen Production by PEM Water Electrolysis—A Review. Mater. Sci. Energy Technol. 2019, 2, 442–454. [Google Scholar]
  5. Ahmad Kamaroddin, M.F.; Sabli, N.; Tuan Abdullah, T.A.; Siajam, S.I.; Abdullah, L.C.; Abdul Jalil, A.; Ahmad, A. Membrane-Based Electrolysis for Hydrogen Production: A Review. Membranes 2021, 11, 810. [Google Scholar] [CrossRef] [PubMed]
  6. Grigoriev, S.; Fateev, V.; Bessarabov, D.; Millet, P. Current status, research trends, and challenges in water electrolysis science and technology. Int. J. Hydrogen Energy 2020, 45, 26036–26058. [Google Scholar] [CrossRef]
  7. García-Salaberri, P.A. 1D two-phase, non-isothermal modeling of a proton exchange membrane water electrolyzer: An optimization perspective. J. Power Sources 2022, 521, 230915. [Google Scholar] [CrossRef]
  8. Lopata, J.; Kang, Z.; Young, J.; Bender, G.; Weidner, J.W.; Cho, H.S.; Shimpalee, S. Resolving Anodic Current and Temperature Distributions in a Polymer Electrolyte Membrane Water Electrolysis Cell Using a Pseudo-Two-Phase Computational Fluid Dynamics Model. J. Electrochem. Soc. 2021, 168, 054518. [Google Scholar] [CrossRef]
  9. Sönke, G.; Sebastian, S.; Matthias, B.; Oberschachtsiek, B.; Heinzel, A. Proton Exchange Membrane Water Electrolysis Modeling for System Simulation and Degradation Analysis. Chem. Ing. Tech. 2018, 90, 1437–1442. [Google Scholar]
  10. Upadhyay, M.; Kim, A.; Paramanantham, S.S.; Kim, H.; Lim, D.; Lee, S.; Moon, S.; Lim, H. Three-dimensional CFD simulation of proton exchange membrane water electrolyser: Performance assessment under different condition. Appl. Energy 2022, 306, 118016. [Google Scholar] [CrossRef]
  11. Toghyani, S.; Afshari, E.; Baniasadi, E.; Atyabi, S.; Naterer, G. Thermal and electrochemical performance assessment of a high temperature PEM electrolyzer. Energy 2018, 152, 237–246. [Google Scholar] [CrossRef]
  12. Toghyani, S.; Afshari, E.; Baniasadi, E.; Atyabi, S.A. Thermal and electrochemical analysis of different flow field patterns in a PEM electrolyzer. Electrochim. Acta 2018, 267, 234–245. [Google Scholar] [CrossRef]
  13. Toghyani, S.; Afshari, E.; Baniasadi, E. Metal foams as flow distributors in comparison with serpentine and parallel flow fields in proton exchange membrane electrolyzer cells. Electrochim. Acta 2018, 290, 506–519. [Google Scholar] [CrossRef]
  14. Toghyani, S.; Afshari, E.; Baniasadi, E. Three-dimensional computational fluid dynamics modeling of proton exchange membrane electrolyzer with new flow field pattern. J. Therm. Anal. Calorim. 2019, 135, 1911–1919. [Google Scholar] [CrossRef]
  15. Xu, Y.; Zhang, G.; Wu, L.; Bao, Z.; Zu, B.; Jiao, K. A 3-D multiphase model of proton exchange membrane electrolyzer based on open-source CFD. Digit. Chem. Eng. 2021, 1, 100004. [Google Scholar] [CrossRef]
  16. Nie, J.H.; Chen, Y.T. Numerical modeling of three-dimensional two-phase gas–liquid flow in the flow field plate of a PEM electrolysis cell. Int. J. Hydrogen Energy 2010, 35, 3183–3197. [Google Scholar] [CrossRef]
  17. Jia, Y.; Zeng, M.; Barnoon, P.; Toghraie, D. CFD simulation of time-dependent oxygen production in a manifold electrolyzer using a two-phase model. Int. Commun. Heat Mass Transf. 2021, 126, 105446. [Google Scholar] [CrossRef]
  18. Lafmejani, S.S.; Olesen, A.C.; Kær, S.K. VOF modelling of gas–liquid flow in PEM water electrolysis cell micro-channels. Int. J. Hydrogen Energy 2017, 42, 16333–16344. [Google Scholar] [CrossRef]
  19. Aubras, F.; Deseure, J.; Kadjo, J.J.A.; Dedigama, I.; Majasan, J.; Grondin-Perez, B.; Chabriat, J.-P.; Brett, D. Two-dimensional model of low-pressure PEM electrolyser: Two-phase flow regime, electrochemical modelling and experimental validation. Int. J. Hydrogen Energy 2017, 42, 26203–26216. [Google Scholar] [CrossRef]
  20. Wu, L.Z.; Zhang, G.B.; Xie, B.; Tongsh, C.; Jiao, K. Integration of the detailed channel two-phase flow into three-dimensional multi-phase simulation of proton exchange membrane electrolyzer cell. Int. J. Green Energy 2021, 18, 541–555. [Google Scholar] [CrossRef]
  21. Olesen, A.C.; Rømer, C.; Kær, S.K. A numerical study of the gas-liquid, two-phase flow maldistribution in the anode of a high pressure PEM water electrolysis cell. Int. J. Hydrogen Energy 2016, 41, 52–68. [Google Scholar] [CrossRef]
  22. Toghyani, S.; Baniasadi, E.; Afshari, E. Numerical simulation and exergoeconomic analysis of a high temperature polymer exchange membrane electrolyzer. Int. J. Hydrogen Energy 2019, 44, 31731–31744. [Google Scholar] [CrossRef]
  23. Nagy, E. Basic Equations of Mass Transport through a Membrane Layer, 2nd ed.; Elsevier: Amsterdam, The Netherlands, 2019; 68p. [Google Scholar]
  24. Coker, A.K. Physical Properties of Liquids and Gases—ScienceDirect. In Ludwig’s Applied Process Design for Chemical and Petrochemical Plants, 4th ed.; Gulf Professional Publishing: Houston, TX, USA, 2007; Volume 17, pp. 103–132. [Google Scholar]
  25. Weber, A.Z.; Newman, J. Transport in Polymer-Electrolyte Membranes II. Mathematical Model. J. Electrochem. Soc. 2004, 151, A311–A325. [Google Scholar] [CrossRef]
  26. Maier, M.; Meyer, Q.; Majasan, J.; Tan, C.; Dedigama, I.; Robinson, J.; Dodwell, J.; Wu, Y.; Castanheira, L.; Hinds, G.; et al. Brett. Operando flow regime diagnosis using acoustic emission in a polymer electrolyte membrane water electrolyser. J. Power Sources 2019, 424, 138–149. [Google Scholar] [CrossRef]
  27. Xing, L.; Liu, X.; Alaje, T.; Kumar, R.; Mamlouk, M.; Scott, K. A two-phase flow and non-isothermal agglomerate model for a proton exchange membrane (PEM) fuel cell. Energy 2014, 73, 618–634. [Google Scholar] [CrossRef]
  28. Wrubel, J.A.; Kang, Z.Y.; Witteman, L.; Zhang, F.-Y.; Ma, Z.; Bender, G. Mathematical modeling of novel porous transport layer architectures for proton exchange membrane electrolysis cells. Int. J. Hydrogen Energy 2021, 46, 25341–25354. [Google Scholar] [CrossRef]
  29. Fan, L.H.; Zhang, G.B.; Jiao, K. Characteristics of PEMFC operating at high current density with low external humidification. Energy Convers. Manag. 2017, 150, 763–774. [Google Scholar] [CrossRef]
  30. Olesen, A.C.; Frensch, S.H.; Kær, S.K. Towards uniformly distributed heat, mass and charge: A flow field design study for high pressure and high current density operation of PEM electrolysis cells. Electrochim. Acta 2018, 293, 476–495. [Google Scholar] [CrossRef]
  31. Nie, J.H.; Chen, Y.T.; Cohen, S.; Carter, B.D.; Boehm, R.F. Numerical and experimental study of three-dimensional fluid flow in the bipolar plate of a PEM electrolysis cell. Int. J. Therm. Sci. 2009, 48, 1914–1922. [Google Scholar] [CrossRef]
  32. Chandesris, M.; Médeau, V.; Guillet, N.; Chelghoum, S.; Thoby, D.; Fouda-Onana, F. Membrane degradation in PEM water electrolyzer: Numerical modeling and experimental evidence of the influence of temperature and current density. Int. J. Hydrogen Energy 2015, 40, 1353–1366. [Google Scholar] [CrossRef]
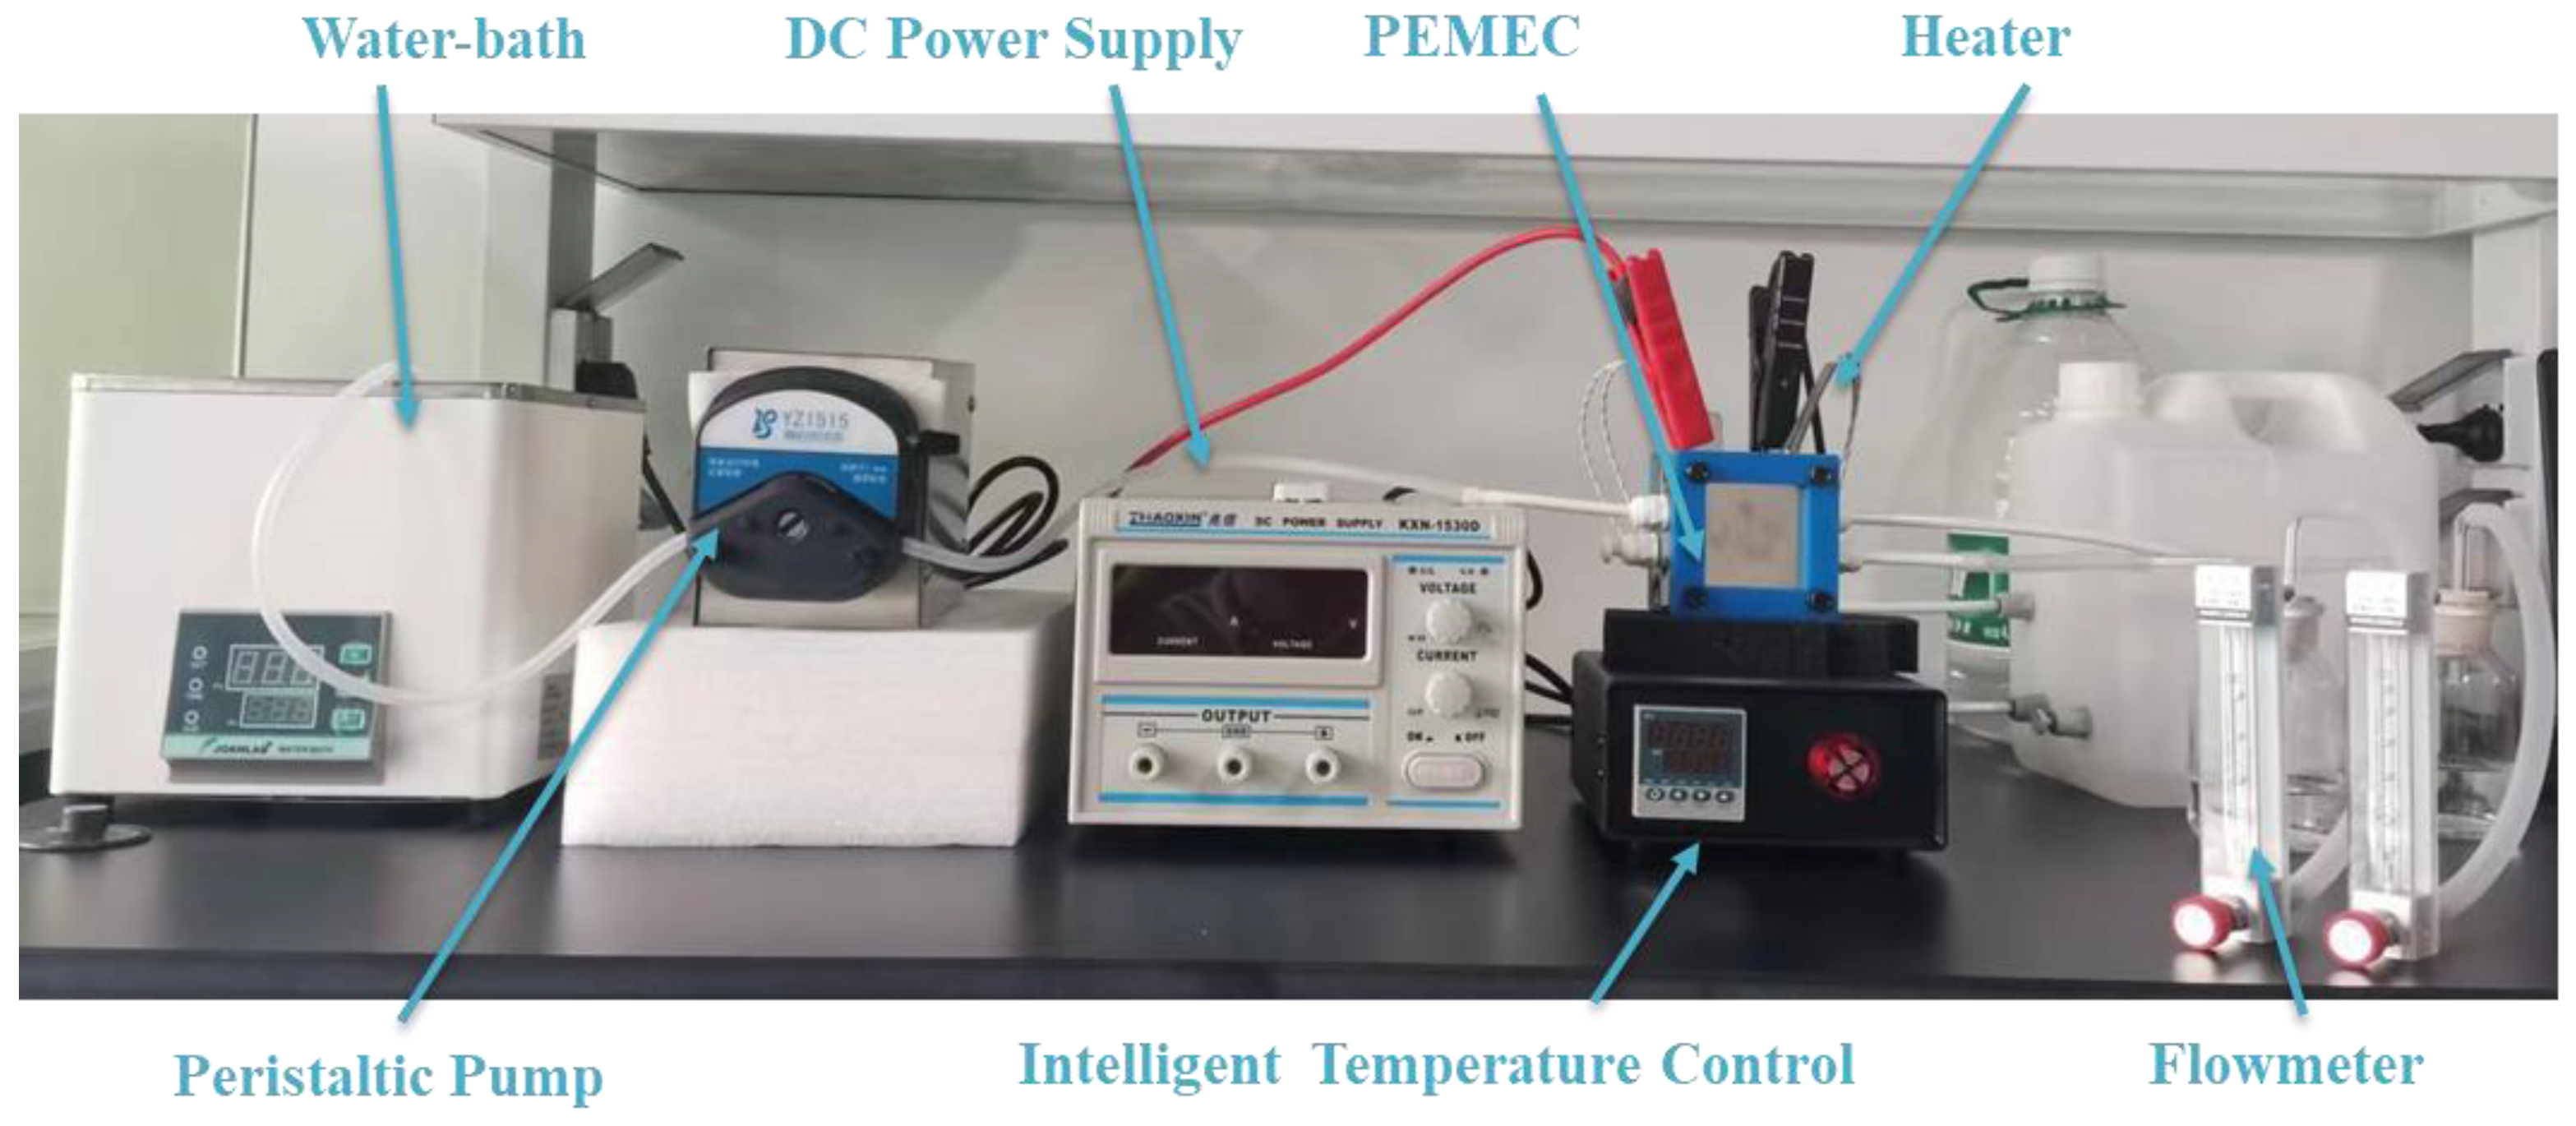
Figure 1. Experimental system of the PEM electrolysis cell.
Energies 17 03428 g001
Figure 2. (a) Frid map and (b) model validation of the PEMEC.
Energies 17 03428 g002
Figure 3. The channel numbers in the flow channel.
Energies 17 03428 g003
Figure 4. Pressure distributions at different voltages: (a) 1.6 V, (b) 1.8 V, (c) 2.0 V and (d) 2.2 V.
Energies 17 03428 g004
Figure 5. Mixture flow rates at different voltages: (a) 1.6 V, (b) 1.8 V, (c) 2.0 V and (d) 2.2 V.
Energies 17 03428 g005
Figure 6. Oxygen mass flux and liquid water mass flux at different voltages. (a) Oxygen mass flux at 1.6 V, (b) 1.8 V, (c) 2.0 V and (d) 2.2 V, and liquid water mass flux at (e) 1.6 V, (f) 1.8 V, (g) 2.0 V and (h) 2.2 V.
Energies 17 03428 g006
Figure 7. Temperature distribution of the CL at the same flow rate and different voltages: (a) 1.6 V, (b) 1.8 V, (c) 2.0 V and (d) 2.2 V.
Energies 17 03428 g007
Figure 8. The average surface temperature of the CL at different stoichiometric numbers.
Energies 17 03428 g008
Figure 9. The relationship between λ and the flow velocity at different voltages: (a) 1.7 V, (b) 1.9 V and (c) 2.1 V.
Energies 17 03428 g009
Figure 10. Average current density on the surface of the CL at different stoichiometric numbers.
Energies 17 03428 g010
Table 1. Instrument information.
InstrumentSpecificationsAccuracy
Water bathWB100-1±0.5 °C
Peristaltic pumpBT100±2%
Stable DC power supplyKXN-1530D±0.5%
Temperature controlMainz-TC±0.01 °C
FlowmeterKD800±4%
Table 2. Parameters of the numerical model.
ParametersSymbolValue
GDL porosityεgdl0.6 [20]
CL porosityεcl0.2 [20]
GDL intrinsic permeabilityκgdl1 × 10−12
CL intrinsic permeabilityκcl1 × 10−13
Anode transfer coefficientαa0.3
Cathode transfer coefficientαc0.5
Electrical conductivity of the BP (S/m) σ b p 20,000 [26]
Electrical conductivity of the GDL (S/m) σ g d l 10,000 [26]
Electrical conductivity of the CL (S/m) σ c l 5000 [26]
Heat capacity of oxygen (J/(mol·K))CO2 4.281 × 10 6 T 2 + 1.371 × 10 2 T + 25.431  [27]
Heat capacity of hydrogen (J/(mol·K))CH2 1.914 × 10 6 T 2 8.314 × 10 4 T + 28.890  [27]
Water content in the membrane λ mem 40.382 ( R H ) 3 47.486 ( R H ) 2 + 21.611 ( R H )  [28]
Dynamic viscosity of water (Pa·m) μ 1 2.414 × 10 5 × 10 247.8 / ( T 140 )  [29]
Thermal conductivity of O2 (W/(m·K))kO2 6.204 × 10 5 T + 8.83 × 10 3  [27]
Thermal conductivity of H2 (W/(m·K))kH2 3.777 × 10 4 T + 7.444 × 10 2  [27]
Thermal conductivity of H2O (W/(m·K))kH2O 1.118 × 10 5 T 2 + 8.388 × 10 3 T 0.9004  [27]
Electrical conductivity of the membrane (S/m) σ m ( 0.5139 λ 0.326 ) e x p ( 1268 ( 1 303 1 T ) )
Electro-osmotic drag coefficient n d 2.5 λ m e m / 22  [20]
Table 3. Geometric parameters.
ParameterValue
Channel width (mm)0.8
Channel height (mm)0.8
Channel length (mm)18
Rib width (mm)0.4
Bipolar plate height (mm)1.2
GDL thickness (μm)300
Catalyst thickness (μm)10
Membrane thickness (μm)127
Active surface area (cm2)4
Channel number11
Disclaimer/Publisher’s Note: The statements, opinions and data contained in all publications are solely those of the individual author(s) and contributor(s) and not of MDPI and/or the editor(s). MDPI and/or the editor(s) disclaim responsibility for any injury to people or property resulting from any ideas, methods, instructions or products referred to in the content.