Article

Optimal Scheduling for Increased Satisfaction of Both Electric Vehicle Users and Grid Fast-Charging Stations by SOR&KANO and MVO in PV-Connected Distribution Network

1
College of Information Engineering, Henan University of Science and Technology, Luoyang 471000, China
2
State Grid Integrated Energy Planning and D&R Institute Co., Ltd., Beijing 100052, China
3
State Grid Hengshui Electric Power Co., Ltd., Hengshui 053401, China
*
Author to whom correspondence should be addressed.
Energies 2024, 17(14), 3413; https://doi.org/10.3390/en17143413
Submission received: 5 June 2024 / Revised: 5 July 2024 / Accepted: 8 July 2024 / Published: 11 July 2024
(This article belongs to the Section E: Electric Vehicles)

Abstract

:
The surge in disordered EV charging demand, driven by the rapid growth in the ownership of electric vehicles (EVs), has highlighted the potential for significant disruptions in photovoltaic (PV)-connected distribution networks (DNs). This escalating demand not only presents challenges in meeting charging requirements to satisfy EV owners and grid fast-charging stations (GFCSs) but also jeopardizes the stable operation of the distribution network. To address these challenges, this study introduces a novel model called SOR&KANO for charging decisions, which focuses on addressing the dual-sided demand of GFCSs and EVs. The proposed model utilizes the salp swarm algorithm-convolutional neural network (SSA-CNN) to predict the PV output and employs Monte Carlo simulation to estimate the charging load of EVs, ensuring accurate PV output prediction and efficient EV distribution. To optimize charging decisions for reserved EVs (REVs) and non-reserved EVs (NREVs), this study applies the multi-verse optimizer (MVO) in conjunction with time-of-use (TOU) tariff guidance. By integrating the SOR&KANO model with the MVO algorithm, this approach enhances satisfaction levels for GFCSs by balancing the charging demand, increasing utilization rates, and improving voltage quality within the DN. Simultaneously, for EVs, the optimized scheduling strategy reduces charging time and costs while addressing concerns related to range anxiety and driver fatigue. The efficacy of the proposed approach is validated through a simulation on a modified IEEE-33 system, confirming the effectiveness of the optimal scheduling methods proposed in this study.

1. Introduction

Developing the application of renewable energy and changing the energy structure have become global priorities as resource and environmental problems worsen. The efficient and sustainable use of energy is crucial in addressing current energy issues [1,2,3]. Photovoltaics (PV) and electric vehicles (EVs) are commonly utilized in distribution networks (DNs) as effective solutions [4]. The integration of large-scale EVs and PV into DNs has led to complications in the existing energy structure, operation modes, and dispatch methods of DNs. Consequently, the optimization of EV scheduling and PV forecasting in DNs has emerged as a key area of research in response to these challenges [5,6].
In DNs characterized by a high penetration of PV, the unpredictable nature of PV output presents considerable obstacles, underscoring the critical importance of employing a highly precise prediction method for PV output. Physical models are traditionally preferred for their accuracy, as they require extensive data and complex mathematical formulations to describe PV output. However, in many cases, especially in high-PV-penetration scenarios, the available data may be insufficient to develop a robust physical model. Additionally, physical models often involve significant computational resources and longer simulation times, making them impractical for real-time or near-real-time applications. Among the array of methodologies for PV output prediction, machine learning-based techniques have gained significant traction [7]. This is attributed to their capacity to effectively navigate nonlinear and intricate data configurations, rendering them well suited for the accurate forecasting of PV output. Huang suggested a PV prediction method using an enhanced quantile convolutional neural network (CNN) that leverages the CNN’s feature extraction structure to identify key factors in PV prediction, thereby enhancing prediction accuracy [8]. Suresh employed a CNN with a sliding window method and data preprocessing technique for PV prediction. The results indicate a notable enhancement in the accuracy of short-term and medium-term predictions [9]. Wang developed a PV prediction model using a long short-term memory recurrent neural network and incorporated a correction method based on temporal correlation principles. This approach notably enhanced the accuracy of predictions [10]. Dong developed a novel framework by establishing a convolutional neural network framework based on meteorological data from surrounding stations and various sampling times. To enhance the prediction accuracy, Dong employed a genetic algorithm–particle swarm algorithm to optimize the hyperparameters of the framework for a notable improvement in the accuracy of predictions [11]. This paper utilizes the SSA innovatively to optimize CNN hyperparameters, enhancing prediction accuracy, robustness, and efficiency.
To account for the unpredictable charging demand of EVs, a charging demand model was developed based on an analysis of their travel patterns for effective EV distribution. Han, Anand, and Hafeez utilized the Markov chain approach to assess the transportation layer of the spatial–temporal distribution of EVs and the grid layer of EVs’ charging demand. Their studies aimed to predict the number of EVs in various parking lots and time slots, enabling a more precise estimation of the EVs’ charging load [12,13,14]. For the error in predicting the charging load due to the en-route charging decisions of EVs [15], Yi, Li, and Zhang considered significant influencing factors, such as time, location, temperature, road condition, weekday/weekend, and demographics, to establish a spatial–temporal distribution model of the charging load demand. Subsequently, they applied Monte Carlo simulation techniques to obtain the spatial and temporal charging loads of EVs. The results of their study demonstrate that the accuracy of EV charging load predictions was significantly enhanced [16,17,18]. Fischer and Gschwendtner demonstrated how socio-economic, technological, and spatial factors influence charging behavior and location [19,20]. In previous studies on EV energy consumption prediction, a common limitation is the consideration of a single scenario. This limitation results in inaccuracies in calculating the driving time and energy consumption, subsequently impacting the accuracy of EV distribution predictions. In contrast, our study takes a comprehensive approach by examining how energy consumption varies across multiple scenarios. Additionally, we utilize a queuing model to analyze the complete trip cycle of EVs. This approach enables us to more accurately determine the charging patterns of EVs and assess their distribution’s impact on the power grid.
Utilizing sequential EV charging and discharging strategies in grid fast-charging stations (GFCSs) enhances voltage quality by shifting EV charging loads to off-peak hours and EV discharging loads to peak hours, as proven by research [21,22]. Li proposed a bilayer coordinated operation scheme with comprehensive uncertainty sources. The first layer involves a stochastic-weighted robust optimization-based day-ahead operation. In this layer, initial operational decisions are made based on uncertain factors. In the second layer, these decisions are further refined hourly through electricity transactions between the microgrid and the utility grid, accounting for uncertainty realizations. Case studies showcased the operational effectiveness of this bilayer approach, highlighting its high computational performance and ability to mitigate uncertainties effectively [23]. Shang proposed FedPT-V2G for real-time vehicle-to-grid (V2G) dispatch, which addresses non-IID data. This solution utilizes the Proximal algorithm and Transformer model to tackle data distribution discrepancies within the V2G scheduling prediction task. The results demonstrate comparable performance to centralized learning on both balanced and imbalanced datasets [24]. Shang proposed an edge computing framework in a distributed manner to ensure efficient dispatching and provide raw dataset flexibility. By applying a long short-term memory network to make predictions based solely on past and present power data, the proposed V2G scheme was demonstrated through experiments with real datasets to achieve highly satisfactory dispatching performance and high prediction accuracy [25]. Yan and Firouzjah suggested two-stage schemes that address the charging power allocation and scheduling problems in GFCSs, respectively [26,27]. Xiang, Cui, and Liu developed an optimal scheduling and trading scheme for microgrids combined with urban transportation, which is based on multiple intelligences. In this approach, the focus lies on optimal energy scheduling and trading over multiple cycles, where microgrids and GFCSs are integrated. Energy trading and charging tariffs are adjusted according to the supply–demand relationship through a Game Theory mechanism in this framework. The primary objective of this scheme is to facilitate optimal decisions that maximize benefits for all parties involved [28,29,30].
In terms of EV charging scheduling, prior studies have typically concentrated on the demand response (DR) and GFCSs for optimizing energy usage or revenue, overlooking EV users’ subjective feelings and motivations, such as mileage anxiety, environmental awareness, and fatigue index, when establishing their optimization targets, which could result in a lack of incentive for EV users to engage in scheduling activities and adversely affect the overall charging management and scheduling efficiency. Zhang, Fazeli, and Zhao developed a subjective decision-making model for EVs that considers various factors, such as EV drivers’ individual attitudes, preference variability, EV status, transportation attributes, parking location attributes, and charging service levels. Their model aims to understand how these elements influence decision-making behavior related to EV charging. Furthermore, their research emphatically demonstrates the significant impact of subjective decision-making intentions on the charging behavior of EV users [31,32,33]. Dai integrated indicators of previous users’ satisfaction with charging facilities and users’ risk attitudes to demonstrate their influences on charging choice preferences and the overall charging load of electric vehicles (EVs). To analyze the preferred charging choices of EV users, Dai constructed a logit model using survey data that considers various factors, including vehicle attributes, destination activities, and subsequent travel information [34].
In the context of optimization, Abdel-Basset introduced a new modified multi-verse optimization (MVO) technique designed to address the 0-1 knapsack problem and multidimensional knapsack problems. The outcomes of the modified MVO exhibited notable advantages when utilized to solve both binary tests and real-world problems [35]. Sundaram implemented a robust multi-objective MVO approach to tackle the intricacies associated with combined economic emission dispatch and combined heat and power economic emission dispatch problems. The algorithm yields Pareto-Optimal solutions that are distinguished by their well-distributed and diverse nature, showcasing superiority over alternative optimization methodologies [36]. Similarly, Xu introduced a multi-objective MVO algorithm based on the integration of Gridded Knee Points and Plane Measurement techniques. The results indicate that this method excels in terms of convergence performance, stability, and the uniformity of the Pareto Front [37]. Moreover, Fu devised a stochastic biobjective optimization problem focusing on maximizing disassembly profit and minimizing energy consumption. To address this challenge, a multi-objective MVO incorporating stochastic simulation was proposed, delivering superior performance compared to existing state-of-the-art algorithms [38]. The literature above discusses the MVO’s optimization capability across various domains, demonstrating its superior solution performance and potential for addressing multidimensional complex problems.
In this study, a PV prediction model based on the salp swarm algorithm (SSA)-CNN algorithm and an EV charging load prediction model based on Monte Carlo are proposed to estimate the PV output and EV charging load first. Following this, an SOR&KANO charging decision-making model is presented based on the subjective and objective factors of EVs and GFCSs. Finally, the charging decision-making of non-reserved EVs (NREVs) and the spatial and temporal reservation quota of reserved EVs (REVs) are determined using an MVO with TOU, ensuring optimal satisfaction for EVs and GFCSs.
The main contributions of this study can be outlined as follows:
  • A novel CNN prediction model based on the SSA is proposed to enhance the accuracy of PV prediction;
  • An EV driving model is developed to capture various scenarios, such as weekdays, weekends, and holidays, with the introduction of Monte Carlo simulation to estimate the charging load distribution of EVs;
  • A spatial–temporal model of EVs is constructed to comprehensively simulate the charging process, covering the stages of entering, queuing, charging, staying, and exiting, thus providing insights into the spatial–temporal status of EVs;
  • An SOR&KANO decision model is introduced to consider the charging scheduling of EVs and GFCSs by taking into account both subjective and objective factors;
  • An MVO is proposed to guide NREVs and REVs in optimizing their charging and discharging behaviors based on TOU, resulting in the determination of scheduled spatial–temporal charging and discharging loads for NREVs and REVs.
This study is structured as follows: Section 2 describes the SSA-CNN utilized for PV prediction. Section 3 describes multi-scenario Monte Carlo simulations for the spatial–temporal load prediction of EVs. Section 4 proposes the SOR&KANO decision model. Section 5 presents the MVO for the optimal scheduling of NREVs/REVs and GFCSs. Following this, Section 6 presents simulations and analyzes the results. Finally, the conclusion is presented in Section 7.

2. Prediction of PV Output

A high-accuracy prediction method for PV output is crucial for dealing with the randomness of PV output. The development of studies on CNNs has led to continuous improvements in the accuracy of neural networks in PV prediction [7,8,9,10,11]. The SSA, as a swarm intelligence optimization algorithm with few parameters and high search performance, has shown excellent performance in addressing local optimization challenges [39,40]. Hence, in this study, a novel prediction method is proposed using a CNN for short-term PV prediction.

2.1. Convolutional Neural Network

In this study, the input is a matrix, with its length denoting the time span of the input data. The width represents global horizontal irradiance, diffuse horizontal irradiance, wind speed, wind direction, humidity, temperature, and rainfall. The CNN structure comprises an input layer, convolutional layers, batch normalization layers, relu layers, maxpooling layers, a fully connected layer, and an output layer [7,8,9,10,11].

2.2. Salp Swarm Algorithm

Developed with the predatory behavior of salps at its core [41], the SSA is based on a mathematical model of salp chains, which consist of a leader and followers. The leader is positioned at the front of the chain, while the other salps are followers that trail behind. As the followers move toward the leader in front of them, a new leader emerges if a follower gets closer to the food source than the current leader. This process results in a continuous change of leadership until all salps converge near the food source.
The leader location updating formula is shown in Equation (1):
x j 1 = F j + c 1 ub j lb j c 2 + lb j , c 3 0 F j c 1 ub j lb j c 2 + lb j , c 3 < 0
where x j 1 is the position of the leader in the j -th dimension. F j is the position of the food in the j -th dimension. ub j and lb j are the upper and lower limits in the j -th dimension, respectively. c 1 , c 2 , and c 3 are coefficients.
c 2 and c 3 are random numbers that are uniformly distributed within [0, 1]. c 1 is updated by Equation (2):
c 1 = 2 e ( 4 l L ) 2
where l is the current number of iterations. L is the maximum number of iterations.
The follower location updating formula is shown in Equation (3).
x j i = 1 2 x j i + x j i 1
where x j i and x j i 1 are the positions of the i -th and ( i 1 ) -th followers in the j -th dimension, respectively.

2.3. Salp Swarm Algorithm–Convolutional Neural Network

To make significant improvements in CNN efficiency, this study utilizes the SSA to optimize hyperparameters, specifically the initial learning rate and mini-batch size. Normalization is applied to address the variability in the data distribution and the variable size across CNN layers, aiming to prevent a negative learning performance resulting from differences in weight coefficients. Figure 1 illustrates the flowchart of the SSA-CNN. The process of PV prediction is carried out using the SSA-CNN following a series of steps.
Step 1
Input the historical data;
Step 2
Establish the basic structure of the CNN;
Step 3
Set L , ub , lb , i max , and j max of the SSA;
Step 4
Initialize the locations of salps;
Step 5
Calculate salp fitness and classify the leader and followers (hyperparameters);
Step 6
Input hyperparameters into the CNN and predict PV output to obtain the loss and accuracy;
Step 7
Repeat Steps 4–6 and update the positions of salps in Equations (1) and (3) until the current iteration reaches the maximum iteration number;
Step 8
Output the optimal prediction.

3. EVs’ Spatial–Temporal Distribution

3.1. Trip Chain

According to the statistics provided in [42], Chinese residents’ trips serve various purposes, which can be categorized into nine main types: going to work, going to school, official business, shopping, recreation and sports, visiting friends and relatives, visiting the doctor, returning, and others. For this study, two prevalent trip types that make up 93% of the total trips were identified and defined. These are trips with the aim of commuting to work, termed the commuting chain, and trips for recreational purposes, referred to as the recreational chain. The commuting chain encompasses traveling from a residential zone to a work location, parking at the workplace, and then returning from the workplace to the residential zone. On the other hand, the recreational chain involves making the journey from a residential zone to a recreational destination, parking at the recreational site, and then returning from the recreational destination back to the residential zone.
Random trips in commuting and recreational chains are assumed to not impact the final destination of the trip. To simplify, random distances are incorporated into the trip chain to represent these random trips.
The extracted temporal correlation parameters from the trip chain consist of the initial departure time, arrival time, return time, travel time, and parking time. The spatial correlation parameters comprise the initial departure point, destination, and travel distance.

3.1.1. Initial Departure Time

According to the statistics in [42,43], the departure time of electric vehicles (EVs) on weekdays shows distinctive morning and evening peaks. The traffic flow begins to increase at 6:00 and peaks sharply at 7:00 during the morning peak period. Conversely, the evening peak occurs between 17:00 and 18:00. Comparatively, the traffic volume on weekends and holidays is approximately 70% of that seen on weekdays, with EV trips demonstrating similar morning and evening peak patterns during these periods as well. Therefore, in this study, EV trips are divided into morning trips and evening trips, and the probability density of the initial departure time t id follows a normal distribution, as described in Equation (4):
f t id = 1 2 π σ t id 2 e ( t id μ t id ) 2 2 σ t id 2
where μ t id is the mathematical expectation of the initial departure time. σ t id is the standard deviation of initial departure time.

3.1.2. Initial Departure/Destination

This paper defines study zones as residential, working, and recreational. It is assumed that a day trip starts in the residential zone, with its destination being either the recreational or working zone. EVs obey a uniform distribution in these zones. The probability density functions are described in Equations (5) and (6):
f x = 1 b a ,   a x b 0 ,   else
f y = 1 d c ,   c y d 0 ,   else
where a , b , c , and d are the zone boundaries to the west, east, south, and north. [ x , y ] are the EV position coordinates.

3.1.3. Parking Time

The EV parking time T pa determines its return time, which is one of the factors affecting the spatial–temporal trajectory of EVs [12,13]. Based on [42], this study assumes that the probability density of T pa within each zone obeys a general extreme value distribution, and the probability density function is described in Equation (7):
  f T pa = e ( 1 + ξ T pa T pa μ T pa σ T pa ) 1 ξ T pa , 1 + ξ T pa T pa μ T pa σ T pa   >   0
where μ T pa is the mathematical expectation of parking time. σ T pa is the standard deviation of parking time. ξ T pa is the shape parameter of parking time.

3.1.4. Initial SOC

In [14,15], it was found that electric vehicles (EVs) have the capacity to meet the travel demands of city trips lasting 3 days or more, even when not fully charged each day. In this study, the probability density of EVs’ initial SOC, SOC id , obeys a normal distribution, as shown in Equation (8).
f SOC id = 1 2 π σ SOC id 2 e ( SOC id μ SOC id ) 2 2 σ SOC id 2
where μ SOC id is the mathematical expectation of the initial SOC. σ SOC id is the standard deviation of the initial SOC.

3.2. EV Energy Consumption

The EV SOC refers to the percentage of available capacity at time t , which can be categorized into charging, discharging, driving consumption, and idle status based on the change in EVs’ available capacity. References [44,45,46,47,48] demonstrate the notable impact of EVs on energy consumption across various settings. In this study, an energy consumption model is established to obtain the accurate SOC change by factoring in key variables, namely, temperature and driving speed.

3.2.1. Temperature Model

References [44,45,46] indicate that the temperature influences battery performance, leading to variations in the energy consumption of electric vehicles under the same driving conditions, thereby impacting SOC prediction. In this study, the energy consumption E i , as the unit mileage of EVs in scenario i affected by temperature T , is described as Equation (9).
E i = λ 0 + λ 1 T i + λ 2 ( T i ) 2 + λ 3 ( T i ) 3
where T i is the daily average temperature in scenario i . λ 0 , λ 1 , λ 2 , and λ 3 are coefficients.

3.2.2. Traveling Speed Model

Various road categories exhibit varying traveling speeds and traffic flows. References [47,48] describe the association between electric vehicles’ speed and the traveled distance under different traffic conditions. The traveling speed on road K , with q K , t as the traffic flow, is derived in Equation (10):
V K , t = V f K 1 + α q K , t C K β
where V K , t is the traveling speed on road K at time t . V f K is the zero-flow speed of road K . C K is the capacity of road K . q K , t is the traffic flow on road K at time t . α and β are road congestion factors.
The ratio of V K , t to the zero-flow speed donates the traffic congestion level on the road, and the equivalent traveling distance W K is shown in Equation (11):
W K = W f K t = 0 T W f K V K , t V f K
where W f K is the length of the road. T W f K is driving time cost of W f K .

3.2.3. Status of Charge

In EV research [13], the SOC is described as the ratio of available capacity to battery capacity, as shown in Equation (12):
SOC t = E t E max
where E t is the current capacity of the battery. E max is EV battery capacity.
  • Charging Status
For the charging status, the multiplication of charging power, charging efficiency, and charging time denotes the charging capacity. The SOC change, SOC t , c , is described in Equation (13):
SOC t , c = η ch P ch t , n t ch E max
where η ch is charging efficiency. P ch t , n is the charging power of EV n at time t . t ch is the charging duration.
  • Discharging Status
For the discharging status, the discharging duration is t dis , and the SOC change, SOC t , d , is described in Equation (14):
SOC t , d = P dis t , n t dis η dis E max
where η dis is the discharge efficiency. P dis t , n is the discharge power of EV n at time t .
  • Driving Status
For the driving status, the capacity consumed by traveling in t is shown in Equation (15), and the SOC change, SOC t , dr , is described in Equation (16):
E dr = E i W K
SOC t , dr = E dr E max
where E dr is capacity consumed by driving.
  • Idle Status
For the queuing and parking slot of t , there is no energy consumption, and the SOC at time t is equal to SOC t t , as shown in Equation (17):
SOC t = SOC t t
where SOC t t is the SOC at t t .

3.3. EV Queuing Model

According to [49], GFCSs have been rapidly expanding, but the uneven construction and distribution of charging piles at GFCSs result in queues that impact the charging time of EVs due to charging loads accumulating. The DDSK model [50,51] was developed to solve the queuing problem.
In this study, a GFCS consists of charging piles, parking spots, and EVs. The GFCS operational states are measured in terms of GFCS service intensity ρ , GFCS idleness probability P 0 , EVs’ average waiting time, and the average queue length of the GFCS. The charging behavior of EVs includes the arrival status, the queuing status, the charging status, and the departure status.
DDSK is introduced to obtain temporally correlated variables of the charging behavior of EVs to solve the utilization problem in a GFCS. The first D in DDSK denotes the EV arrival time distribution, the second D denotes the service time distribution, S denotes the number of charging piles N pile , and K denotes the maximum number of parking spots N park .
When the number n of queuing EVs is smaller than N pile and bigger than 0, the probability distribution P n of queuing EVs is described by Equation (18). When the number of queuing n EVs is smaller than N park and bigger than N pile , the probability distribution P n of queuing EVs is described by Equation (19):
If 0     n     N pile ,
P n = ρ n n ! P 0
If N pile     n     N park ,
P n = ρ n N pile ! N pile n N pile P 0
P 0 = n = 1 N pile 1 ρ n n ! + ( ρ ) N pile 1 ρ N pile N park N pile + 1 N pile ! 1 ρ N pile 1 , ρ N pile 1 n = 1 N pile 1 ρ n n ! + ( ρ ) N pile N park N pile + 1 N pile ! 1 ,   ρ N pile = 1
The service intensity ρ N pile of N pile is described in Equation (21):
ρ N pile = ρ N pile
ρ = N ev μ
where N ev is the number of arriving EVs of GFCS. μ is the average service time.
For simplicity, it is assumed that the charging piles in GFCSs have the same power, and the average service time μ is described in Equation (23):
μ = η ch P ch SOC ch ¯ E max
SOC ch ¯ = n = 1 N ev SOC ch N ev
where P ch is the charging power. SOC ch ¯ is the average required SOC of EVs. SOC ch is the required SOC of EVs.
The average waiting time T w of EVs is the expectation value and is described in Equation (25):
T w = n = N pile N park n N pile P n + N pile + P 0 n = 1 N pile 1 n N pile ρ n n ! N ev 1 ρ N pile N pile ρ N pile N park N pile N pile ! N pile N park N pile 1 μ

3.4. Monte Carlo Simulation

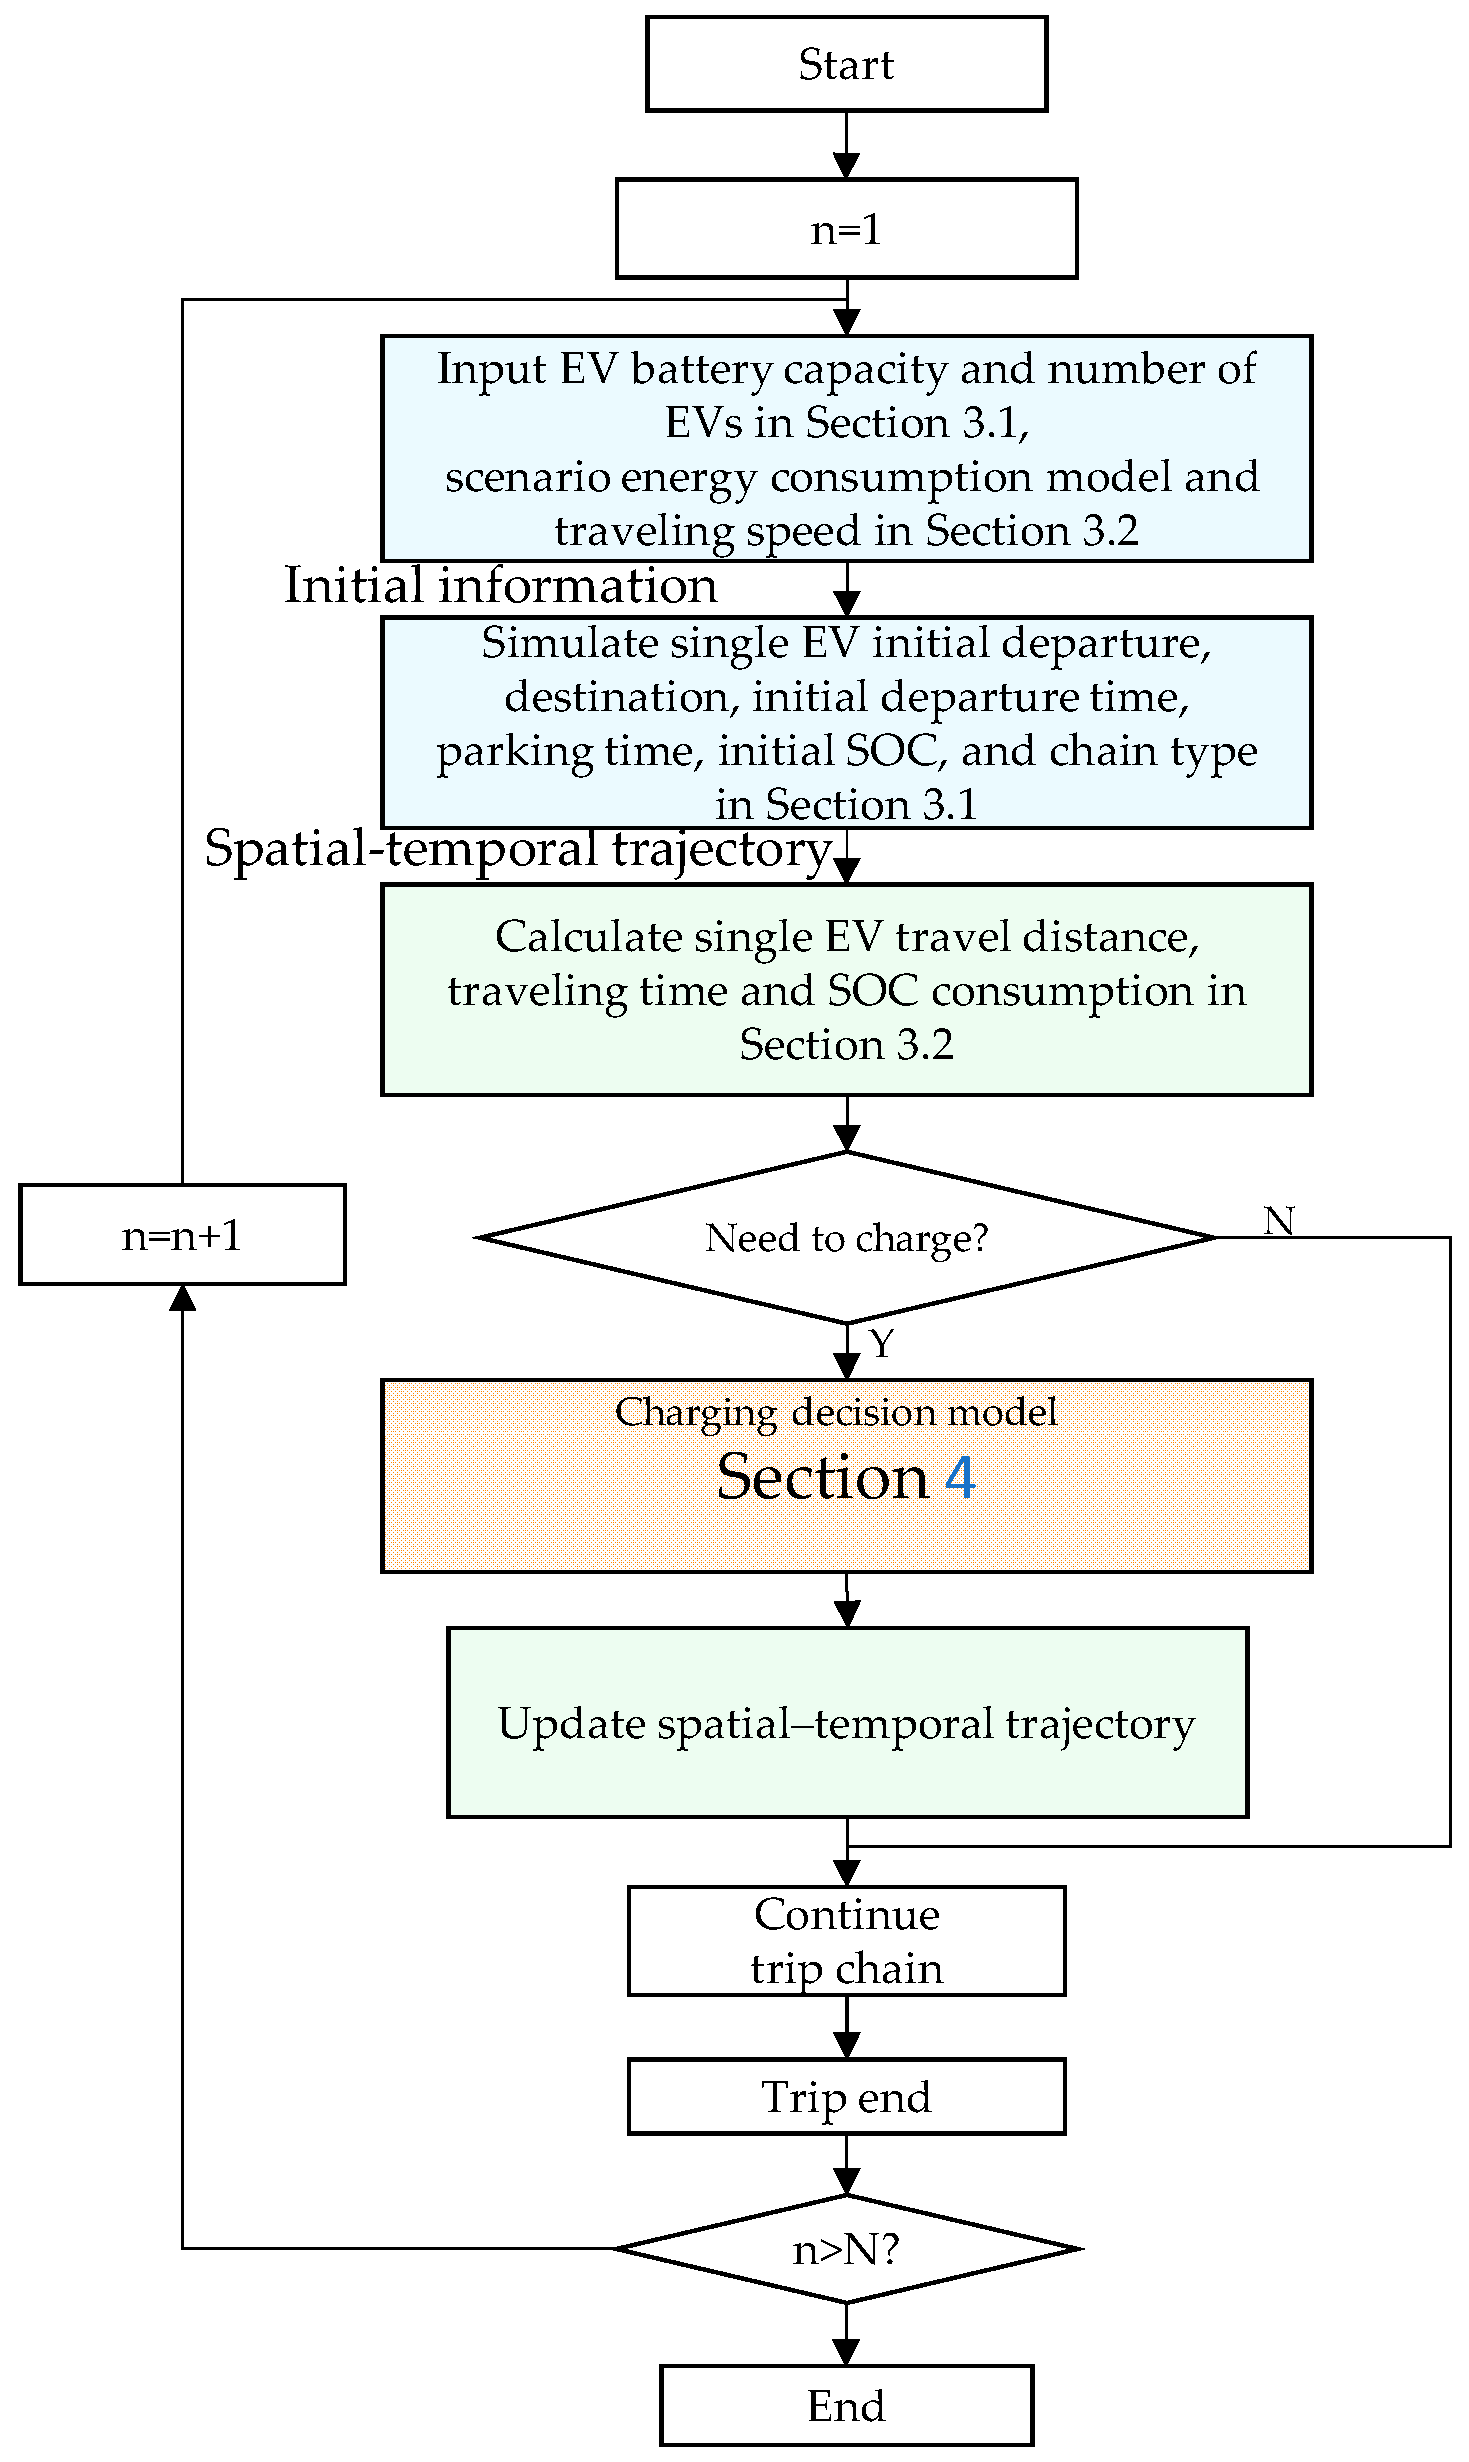
EV trip chains are simulated according to Section 3.1, and EV information is updated according to Section 3.2. When charging is required, the information on trip chains is updated according to Section 3.1, Section 3.2 and Section 3.3. The EV charging load is obtained through the following steps and as shown in Figure 2.
Step 1
Input the EV battery capacity and the number of EVs, as described in Section 3.1, and the scenario energy consumption model and traveling speed, as described in Section 3.2;
Step 2
Simulate a single EV’s initial departure, destination, initial departure time, parking time, initial SOC, and chain type, as described in Section 3.1;
Step 3
Calculate a single EV’s travel distance, traveling time, and SOC consumption, as described in Section 3.2;
Step 4
Judge whether the EV is charged, as described in Section 4. If so, update spatial–temporal trajectories; if not, continue the trip until completion;
Step 5
Update the initial trip chain of each EV;
Step 6
Repeat Steps 2–5 for the next EV until all EVs are simulated.

4. SOR&KANO for Charging/Discharging Decision-Making of EVs and GFCSs

The limitation of charging piles in a GFCS has resulted in severe queuing of EVs with charging demands due to the increasing quantitative growth in EVs [5]. This situation often occurs during peak periods, leading to the phenomenon of peak-on-peak. Consequently, there is a further deterioration in voltage quality in PV-connected distribution systems, causing a decrease in satisfaction among EV and GFCS users. To address these challenges, this study proposes the utilization of the SOR&KANO method.

4.1. Disordered Decision-Making

Reference [52] has found that EVs have a high probability of charging when their SOC is low. In this paper, the mileage anxiety threshold ε is proposed, and EVs are judged before traveling to determine whether their SOC falls below the threshold and triggers mileage anxiety during the trip to determine their charging demands.
When the SOC of an EV after traveling to the destination is larger than ε , as described in Equation (26), then the EV does not require charging:
SOC t SOC des > ε
SOC des = E i W des E max
where SOC des is SOC consumed by the EV traveling from the initial departure point to the destination. W des is the distance from the initial departure point to the destination.
When the SOC is smaller than ε and larger than SOC min after traveling to the destination, as described in Equation (28), the EV requires charging and charges at the destination GFCS.
SOC min <   SOC t SOC des ε
where SOC min is the lower-limit SOC.
When the SOC is smaller than SOC min after traveling to the destination, as described in Equation (29), the EV requires emergency charging and charges at the GFCS at departure.
SOC t SOC des   SOC min
Disordered decision-making in EV charging is carried out in this manner. However, it poses various issues for both EVs and GFCSs.
On the EV side, the SOC of the EV may surpass the mileage anxiety threshold boundary ε throughout the trip chain, thereby triggering the EV user’s mileage anxiety. On the other hand, congestion from the EV charging load at the GFCS [28] results from a significant number of unorganized EVs without scheduling aggregation and a limited availability of charging piles, leading to queuing at the GFCS and a deterioration in voltage quality. Consequently, disordered decision-making culminates in reduced satisfaction levels for both GFCSs and EVs.
This paper proposes an innovative cooperative scheduling strategy based on SOR and KANO, which guides EVs to charge at their desired GFCS through an SOR decision-making model to reduce EV charging/time costs, mileage anxiety, and the fatigue index and directs EVs to charge at the GFCS desired by GFCSs through a KANO decision-making model to improve charging/time costs, response speed, and voltage quality.

4.2. SO(TPB)R Decision-Making

Previous research [31,32,33] has predominantly examined EVs’ intention to participate in scheduling or solely focused on charging benefits. However, these studies have neglected to consider EV users’ charging demand or their psychological state during scheduling participation. Furthermore, the impact of EV users’ psychological state on their charging decisions has been largely overlooked. To address these gaps, this study introduces the Stimulus–Organism–Response (SOR) framework as a novel approach to analyzing EV users’ decision-making process and identifying the most favorable charging choices.
The SOR model [53,54,55] involves a Stimulus (S), an Organism (O), and a Response (R). In this study, S represents external environmental factors, which are expressed as the state of EVs during decision-making. O, as the mediating link, represents the psychological changes in EV users’ decision-making. R represents the result of EV users’ decision-making.
  • S
The main factors considered in this study include the SOC of EVs, the waiting time, the tariff, the traveling distance to the destination, and the traveling distance to the GFCS.
  • O
The Theory of Planned Behavior (TPB) model [56,57,58] is introduced. The TPB model refers to the transformation of internal and external stimuli into specific behaviors, including Attitudes, Subjective Norms, and Perceived Behavioral Control. The TPB model suggests that Behavioral Intention directly affects decision-making, and Behavioral Intention is determined by one’s Attitude, Subjective Norm, and Perceived Behavioral Control.
Attitude refers to the attitude that EV users have in their decision-making, which is described by the charging cost and time cost in this study. If the charging cost is low, EV users have a positive attitude toward it. Otherwise, it is negative. The same applies to the time cost, and the function is described in Equation (30):
A = M cost + T cost
where M cost is the cost of charging. T cost is the time cost of charging.
M cost consists of the cost of energy consumption in the trip chain, as described in Equation (31):
M cost = E p , fcs t fcs SOC exp ε E max + E p , fcs t fcs ε SOC t fcs E max + E p , fcs t fcs W des E i + E p , fcs t fcs W des E i
W des = ( x des x fcs ) 2 + ( y des y fcs ) 2
W des = ( x des x t ) 2 + ( y des y t ) 2
where E p , fcs t fcs is the tariff at time t fcs in fcs . t fcs is the time of arrival at the GFCS. SOC exp is the expected SOC of EVs during charging. SOC t fcs is the SOC at time t fcs . W des is the distance between the EV’s current location and its destination. W des is the distance between the destination and the GFCS. x t and y t are the horizontal and vertical coordinates of the current location, respectively. x des and y des are the horizontal and vertical coordinates of the destination, respectively. x fcs and y fcs are the horizontal and vertical coordinates of the GFCS, respectively.
The cost of time consumption, including the waiting time T w , fcs t fcs , charging time T ch , and deviated driving time T devi , is shown in Equation (34).
T cost = T w , fcs t fcs + T ch + T devi + T fcs ω
T devi = 0 ( W des W des ) W K , t V K , t
where ω is the time cost coefficient, and T w , fcs t fcs is the waiting time in fcs from time t fcs . W K , t is the equivalent driving distance at time t . T fcs is the time cost of traveling to fcs .
Subjective Norm refers to the social pressure that EV users perceive in their decision-making, and in this study, environmental consciousness is adopted to represent the Subjective Norm for EVs. EV users choose a GFCS with an extended range to consume additional electricity, contradicting the environmental goals of energy conservation and emission reduction. The CO 2 emission commutation [59] is used to characterize the Subjective Norm function S as shown in Equation (36).
S = W fcs + W des W des E i F CO 2
F CO 2 = T E   T c φ T F t M η ch 1 i tr
W fcs = ( x fcs x t ) 2 + ( y fcs y t ) 2
where F CO 2 is a CO 2 commutation factor. W fcs is the distance from the GFCS. T E is the standard coal consumption of thermal power. T c is the CO 2 emission factor of fuel coal. φ is the ratio of thermal power generation. T F is the CO 2 emission factor of fuel. t M is the conversion coefficient between fuel coal and standard coal. i tr is the line loss factor.
Perceived behavioral control refers to EV users’ past experiences and anticipated hindrances. In this study, the fatigue index and mileage anxiety describe EV users’ past experiences and anticipated hindrances, respectively. The longer the distance that EV users have traveled, the higher their fatigue index, and the lower their intention to travel to a faraway GFCS. The same applies to mileage anxiety. The Perceived Behavioral Control function P consists of the mileage anxiety of EV users Anx ( SOC t , W fcs ) and the fatigue index of EV users Fat ( W fcs , ( W des W des ) ) , as described in Equation (39):
P = Anx ( SOC t , W fcs ) +   Fat ( W fcs , ( W des W des ) )
The mileage anxiety considers the SOC of EVs, energy consumption, and the traveling distance to the GFCS, as described in Equation (40) from [60]:
Anx = exp E i W fcs / V K , t ε SOC t / ε 1
The fatigue index is described in Equation (41) by the ratio of an EV’s driving time to the average driving time of all EVs.
Fat = W fcs + W des W des V K , t t ¯
t ¯ = n = 1 N 0 W n W K , t V K , t N
where t ¯ is the average traveling time of EVs’ overall trip chains. W n is the total traveled distance of EV n . N is the total number of EVs.
Behavioral Intention refers to the weight coefficients assigned in Equation (43). B a , B s , and B p are weight coefficients of Behavioral Intention relative to Attitude, Subjective Norm, and Perceived Behavioral Control, respectively.
SOR SOC t , T w , fcs t , E p , fcs t , W fcs = B a A + B s S + B p P
B a + B s + B p = 1
where E p , fcs t is the tariff at time t in fcs , and T w , fcs t is the waiting time from time t in fcs .
  • R
The final decision-making guides EVs to travel to a GFCS by comparing the function values of the GFCS, as described in Equation (45):
D cf n = min SOR SOC t , T w , fcs t , E p , fcs t , W fcs
where D cf n is the index of the selected charging GFCS for EV n .

4.3. KANO Decision-Making

KANO [61,62,63] analyzes GFCS expectations in terms of Attractive Quality, One-dimensional Quality, and Must-be Quality. Through the analysis, EVs are drawn to charge at the desired GFCS.
  • Attractive Quality
When GFCS decisions meet the demand, the expectation value of the GFCS increases greatly. Otherwise, the expectation value of the GFCS is not affected. In this study, the distance W fcs is selected as the Attractive Quality. GFCSs draw EVs that are closer to them and have a faster response speed to charge. The Attractive Quality function is described in Equation (46):
CS AQ = a a e b a AQ
AQ = W fcs
where a a and b a are coefficients.
  • One-dimensional Quality
When GFCS decisions meet the demand, the GFCS expectation value increases. Otherwise, the GFCS expectation value decreases. In this study, the waiting time T w t and tariff E p t are selected as the One-dimensional Quality to direct EVs to charge at the GFCS where the in-station EVs are fewer to alleviate the overall queuing at GFCSs. In this paper, TOU is adopted, and the tariff is divided into peak, flat, and valley tariffs. The One-dimensional Quality function is described in Equation (48):
CS OQ = a o OQ
OQ = a 1 T w , fcs t + a 2 E p , fcs t
where a o , a 1 , and a 2 are coefficients.
  • Must-be Quality
When GFCS decisions meet the demand, the GFCS expectation value does not increase. Otherwise, the GFCS expectation value significantly decreases. In this study, the voltage fluctuation rate of a PV-connected DN is selected as the essential demand. When the voltage fluctuation rate of the GFCS is high, the expectation value decreases significantly, and when the voltage fluctuation rate of the GFCS is low, it meets its essential demand. The function of Must-be Quality is described in Equation (50):
CS MQ = a m ln b m MQ + 1
MQ = t = 1 T f t T
f t = U t U - U -
U - = t = 1 T U t T
where a m and b m are coefficients. U t is the voltage of the GFCS at time t . T is the total sampling times. t is the sampling spot.
The KANO function is shown in Equation (54), and the minimum value of Equation (55) determines a GFCS’s expected decision:
KANO U t , T w , fcs , E p , fcs t , W fcs = CS AQ + CS OQ + CS MQ
D cf n = min KANO U t , T w , fcs t , E p , fcs t , W fcs
s.t.
E p , lb E p Valley E p , fcs t E p , ub E p Valley ,   if   t Valley   period
E p , lb E p Flat E p , fcs t E p , ub E p Flat ,   if   t Flat   period
E p , lb E p Peak E p , fcs t E p , ub E p Peak ,   if   t Peak   period
where E p , lb and E p , ub are the minimum and maximum coefficients of the tariff, respectively. E p Valley , E p Flat , and E p Peak are the tariffs of the valley period, flat period, and peak period, respectively.

4.4. SOR&KANO Decision-Making

In this study, a cooperative strategy combining the SOR and KANO decision-making models is proposed to address the challenges faced by EVs and GFCS. The SOR decision-making function plays a crucial role in decreasing factors such as charging cost, charging time cost, mileage anxiety, and the fatigue index of EVs by determining the ideal GFCS to select. Meanwhile, the KANO decision-making model focuses on achieving charging load balancing among GFCSs to enhance voltage quality, reduce charging costs, and improve response speed. The joint application of these models aims to optimize the decision-making process for both EVs and GFCSs, as demonstrated by Equation (59), which defines their collaborative function:
D cf n = min ω EVs SOR SOC t , T w , fcs t , E p , fcs t , W fcs + ω GFCS KANO U t , T w , fcs t , E p , fcs t , W fcs
ω EVs + ω GFCS = 1
where ω EVs and ω GFCS are decision-making weight coefficients of EVs and GFCSs, respectively.

5. Objective Function in Optimal Scheduling for Increased Satisfaction of GFCSs and NREV/REV Users

Section 4.2, Section 4.3 and Section 4.4 present decision models that determine individual optimal decisions for EVs and GFCSs. This section aims to achieve global optimal decisions by considering all EVs and GFCSs.

5.1. EVs’ Objective Function

The EVs’ secondary objective function in this study involves the charging time, the idle rate, and the average value of the SOR function. The charging time idle rate, T f , refers to the ratio of EVs’ ineffective charging time to the in-station time, and the minimization of T f cuts down the total time cost of EV charging. SOR is the mean value of the SOR function, which aims to maintain individual optimized decisions. The satisfaction objective function for EVs is described in Equation (61). Normalization is adopted to deal with T f and SOR .
min F EVs = S 1 T f + S 2 SOR
T f = n = 1 N ch T f n N ch
T f n = T w T ch , T w < T ch 1 , T w T ch
SOR = n = 1 N ch SOR SOC t , T w , fcs t , E p , fcs t , W fcs N ch
where S 1 and S 2 are the weighting coefficients of the charging time idle rate and the mean value of the SOR function, respectively. T f n is the charging time idle rate for EV n . N ch is the total number of EVs.

5.2. GFCSs’ Objective Function

The GFCS side’s objective function comprises the GFCS charging pile utilization rate use r , voltage exceedance rate th c , and the mean value of the KANO function. The GFCS charging pile utilization rate describes the utilization rate of the charging piles, and the purpose is to improve the utilization rate to maximize the benefit to GFCSs. The voltage exceedance rate describes the frequency of voltage exceedance, which is a basic requirement for the regular operation of GFCSs. The mean value of the KANO function is to maintain individual optimized KANO decisions while achieving the global equilibrium of GFCSs. The satisfaction objective function is described in Equation (65). Normalization is adopted to deal with use r , th c , and KANO .
min F GFCS = S 3 use r + S 4 th c + S 5 KANO
where S 3 , S 4 , and S 5 are the weight coefficients of the charging pile utilization rate, voltage exceedance rate, and mean value of the KANO function, respectively.
use r = t = 1 T use t T
use t = pile = 1 N pile γ pile t N pile
γ pile t = 0 ,   idle   state 1 ,   usage   status
where use t is the proportion of charging piles being used at time t . γ pile t is the usage status of the pile at time t .
The node voltage exceedance rate th c is the ratio of the voltage exceedance time to the total time. The calculation process is shown in Equation (69). N u t is used to judge whether the node voltage exceeds the limit at time t .
th c = t = 1 T N u t T
N u t = 1 , U t < U min 1 , U t > U max 0 , U min < U t < U max
where U min and U max are the lower limit and upper limit of the voltage, respectively.
The mean value of the KANO function is shown in Equation (71):
KANO = n = 1 N ch KANO U t , T w , fcs t , E p , fcs t , W fcs N ch

5.3. Optimal Scheduling of NREVs and REVs

5.3.1. Optimal Scheduling of NREVs

In this study, NREVs’ spatial–temporal distribution is calculated by Monte Carlo. NREVs start the trip chains set in Section 3.1, and charging decisions are made according to SOR&KANO when there are charging demands. The charging load of NREVs is described in Equation (72).
P ch t = n = 1 N ch t P ch t , n
where P ch t is the total charging load at time t . N ch t is the total number of EVs charging at time t . P ch t , n is the charging load of NREV n at time t .
To improve the satisfaction of both EV users and GFCSs, the objective function, G NREVs , of NREVs is shown in (73):
min G NREVs = ω EVs F EVs + ω GFCS F GFCS
s.t.
0 < P ch t N ch , max t P ch t , n
N ch t < N ch , max t
E p , lb E p Valley E p , fcs t E p , ub E p Valley ,   if   t Valley   period
E p , lb E p Flat E p , fcs t E p , ub E p Flat ,   if   t Flat   period
E p , lb E p Peak E p , fcs t E p , ub E p Peak , if   t Peak   period
where N ch , max t is the maximum number of charging NREVs at time t .

5.3.2. Optimal Scheduling of REVs

GFCSs push reservations to EVs, which guides EVs to reserve spots to charge or discharge and provides tariff discounts to REVs. The charging and discharging power of REVs is described in Equations (79) and (80), respectively:
P res , ch t = n = 1 N res , ch t P ch t , nres
P res , dis t = n = 1 N res , dis t P dis t , nres
where P res , ch t and P res , dis t are the total charging and discharging power of REVs at time t , respectively. N res , ch t and N res , dis t are the total number of REVs reserved for charging and discharging at time t , respectively. P ch t , nres and P dis t , nres are the charging and discharging power of REV n at time t .
The charging/discharging tariff E p , res t is described in Equation (81):
E p , res t = D c E p t , if   charging D d E p t , if   discharging
where D c and D d are the discounts given to charging REVs and discharging REVs.
GFCS-contracted EVs, known as REVs, are granted preferential treatment to ensure customer satisfaction. In this context, the optimization of the charging and discharging reservation quota is solely focused on the GFCS side. The optimal quota is determined by minimizing the objective function outlined in Equation (65), which guides EVs to make their reservations effectively:
s.t.
N res , dis , max t P dis t , n P res , dis t < 0
0 < P res , ch t N res , ch , max t P ch t , n
N res , dis t < N res , dis , max t
N res , ch t < N res , ch , max t
where N res , ch , max t and N res , dis , max t are the maximum charging and discharging reservation quotas at time t , respectively.

5.4. Multi-Verse Optimizer

In this study, the MVO [64] is used to guide the charging behavior of NREVs and optimize the bilateral objective functions of GFCSs and EVs, using tariffs as a covariate. The MVO, known for its few parameters, simple structure, and high efficiency, is chosen for its ability to effectively address the multi-peak problem. It is considered superior to other intelligent algorithms due to its faster convergence speed and stronger exploitability [35,36,37,38].
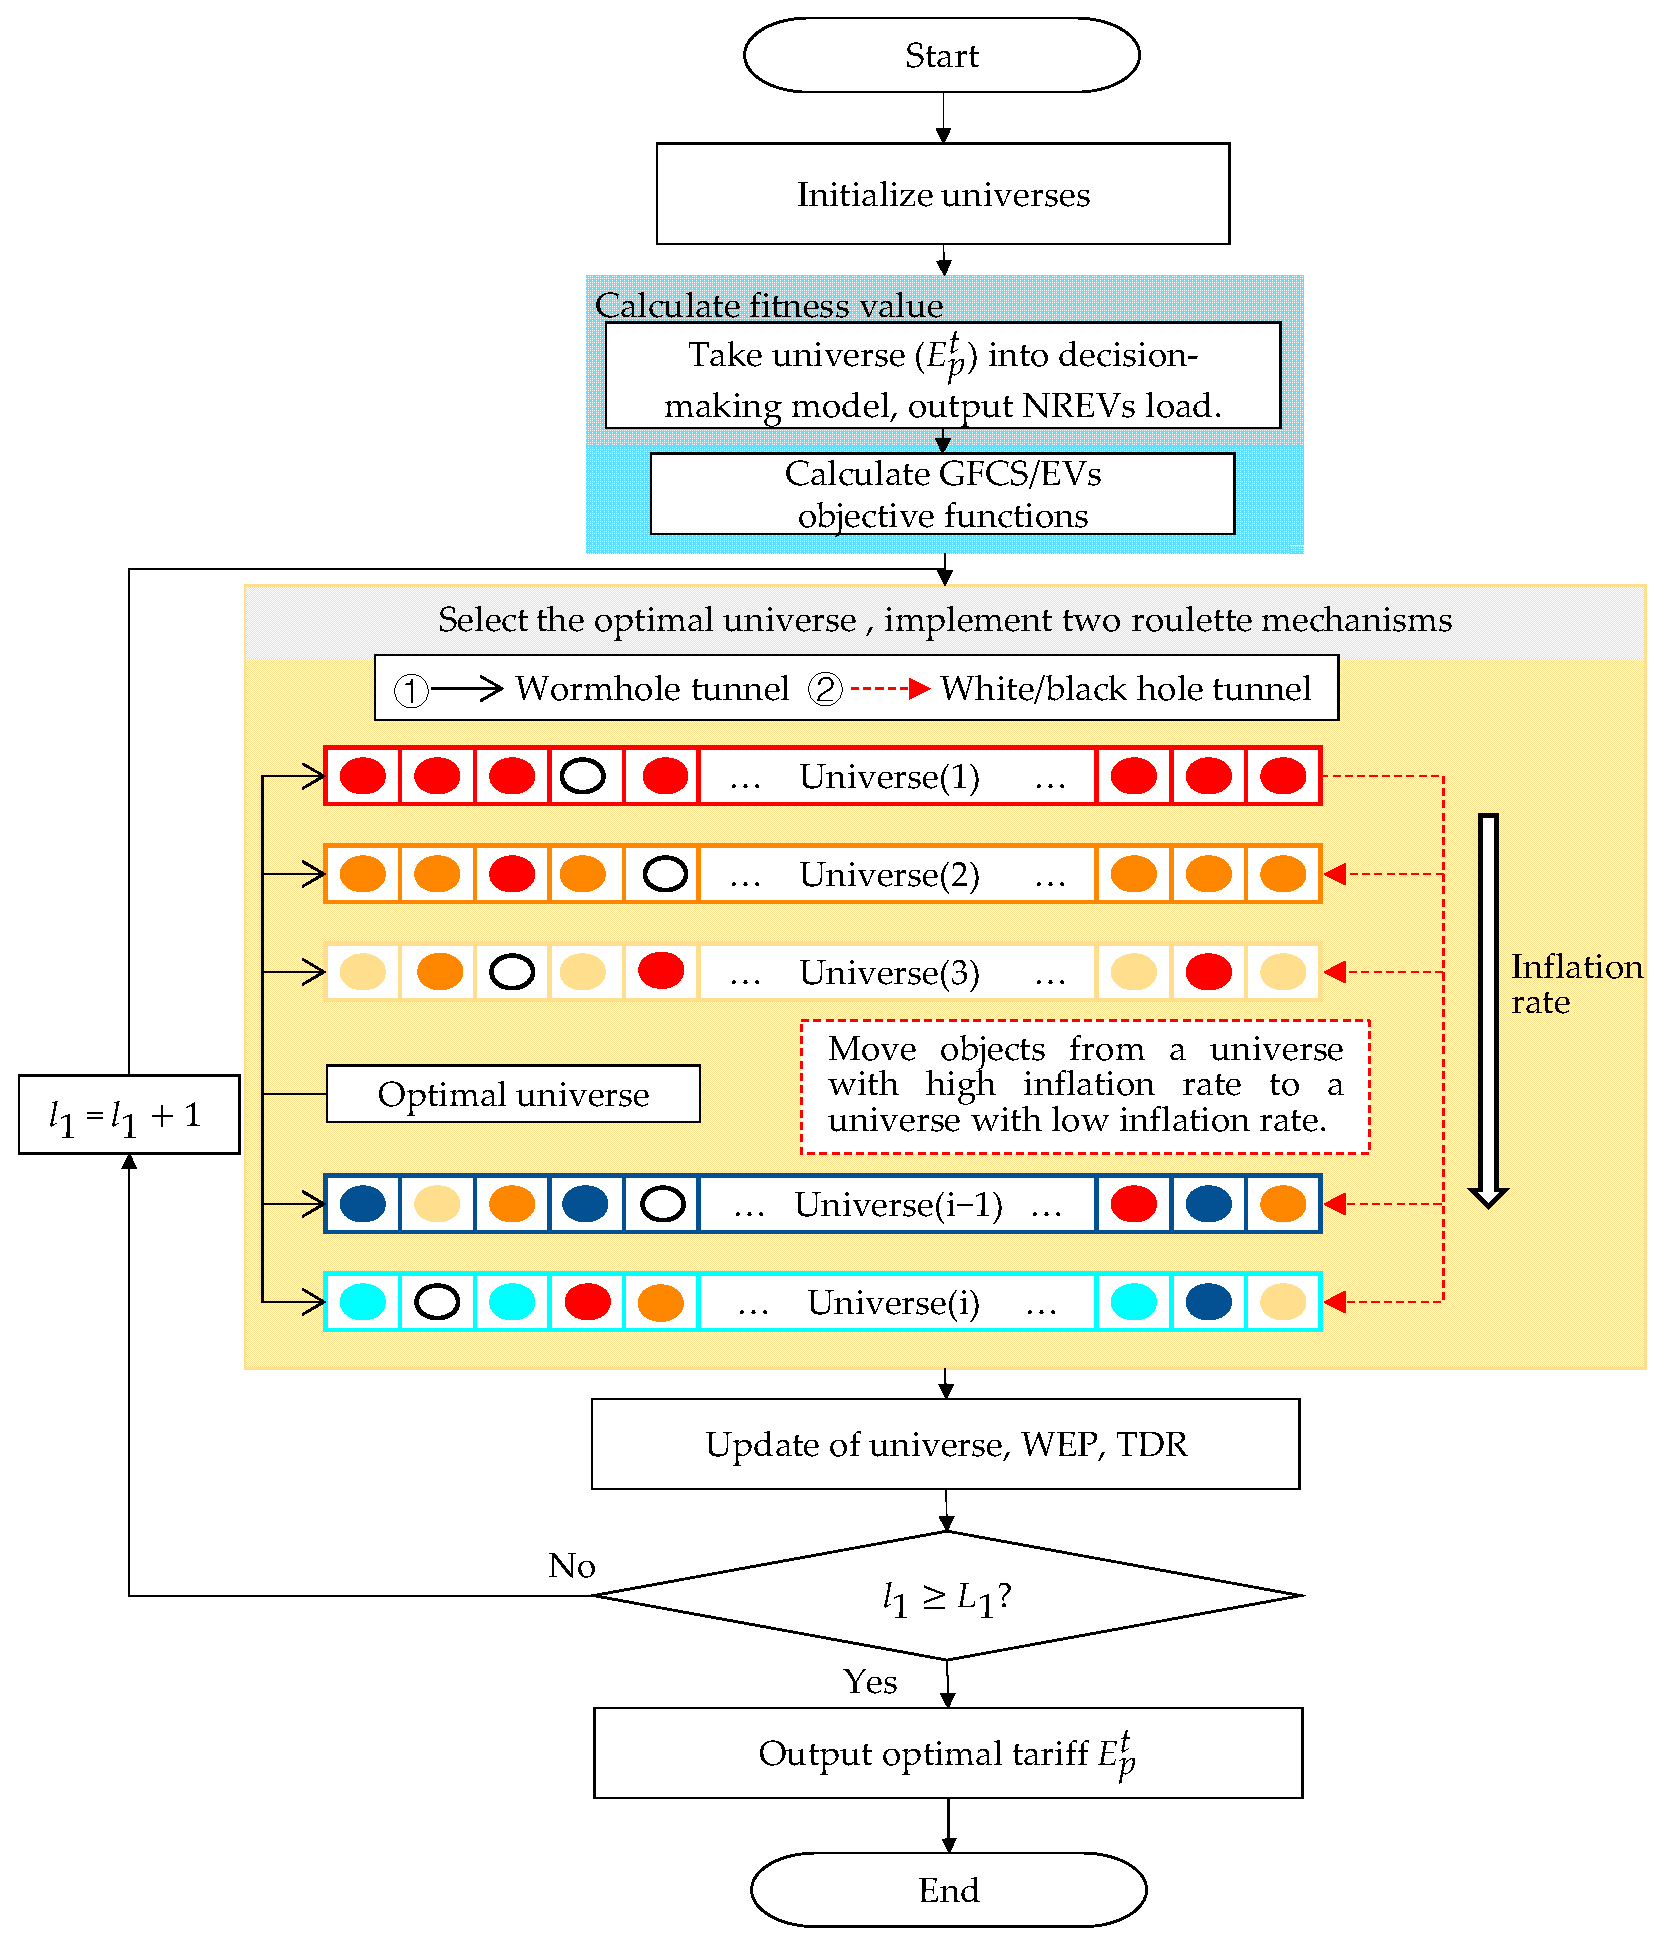
The MVO optimizes the optimal tariffs, as shown in Figure 3, with the following steps.
Step 1
Set the MVO parameters, the maximum number of objects o max and universes m max , and iterations L 1 , where the upper and lower limits of o are U b o and L b o , respectively;
Step 2
Initialize the universes, output each universe M m o in turn, and calculate the initial value of the objective function;
Step 3
Input the universe M m o (tariffs) and simulate the NREV charging load in that universe;
Step 4
Input the NREV charging load to calculate the value of the EV side’s objective function, as described in Section 5.1, and the value of the GFCS side’s objective function, as described in Section 5.2;
Step 5
According to the function value, to obtain the expansion rate of the universe, select the optimal universe and execute the roulette mechanism;
Step 6
Update the universes, the wormhole existence rate WEP , and the travel distance rate TDR ;
Step 7
Determine whether the abort condition is reached or not, and if not, repeat Steps 3–6;
Step 8
Output the optimal tariffs.
The optimization of reserved quotas of REVs is the same as that of NREVs.
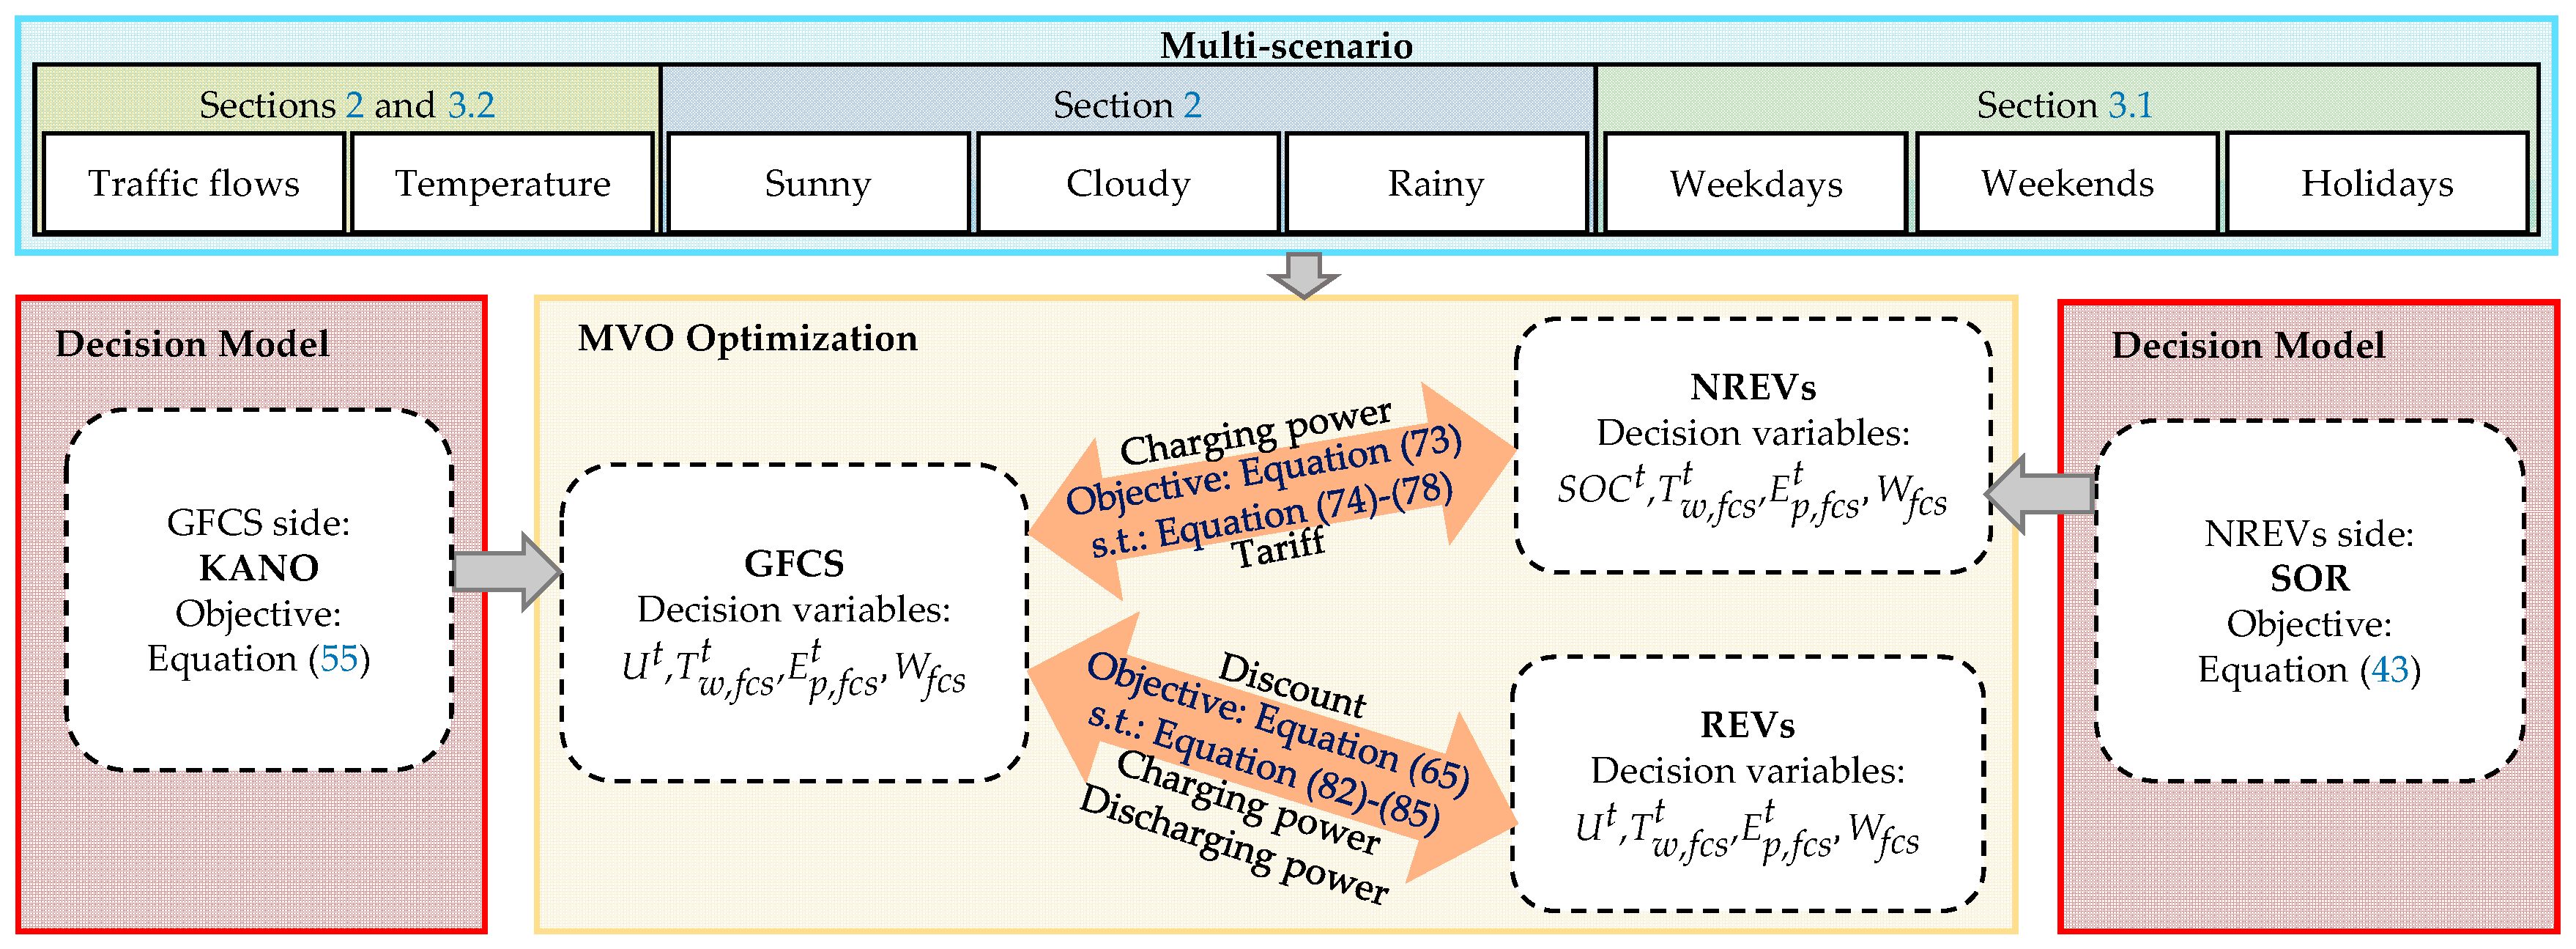
The multi-scenario optimal scheduling for increasing EV users’ and GFCSs’ satisfaction is shown in Figure 4. The MVO with SOR&KANO is utilized to realize the optimal scheduling of EVs and ensure the optimal comprehensive satisfaction of EV users and GFCSs.

6. Case Study

6.1. Simulation System

In the modified IEEE-33 distribution system shown in Figure 5, three types of zones are depicted: residential, working, and recreational; all of them are square areas with a side length of 3 km. Each zone contains a GFCS positioned at its center. When an EV begins a trip chain, it travels between zones, crossing boundaries. During this journey, the EV’s distance from the GFCS destination exceeds 3 km.

6.2. Case Settings

This study considers three types of scenarios:
  • In the weekday scenario, which is dominated by the commuting chain, the number of total EVs is set to 15,000, of which 3000 are REVs and 12,000 are NREVs. The proportion of NREVs is set to 9600 in the commuting chain, 1200 in the recreational chain for morning trips, and 1200 in the recreational chain for afternoon trips.
  • In the weekend scenario, which is dominated by the recreational chain, the number of total EVs is set to 10,000, with 2000 REVs and 8000 NREVs. The proportion of NREVs is set to 1600 in the commuting chain, 3200 in the recreational chain for morning trips, and 3200 in the recreational chain for afternoon trips.
  • In the holiday scenario, which is dominated by local EVs in the recreational chain and an extra influx of tourist EVs, the number of total EVs is set to 20,000, with 2000 REVs, 8000 NREVs, and 10,000 tourist NREVs. The proportion of NREVs is set to 1600 in the commuting chain, 9200 in the recreational chain for morning trips, and 7200 in the recreational chain for afternoon trips.
The parameters are set as follows:
  • μ t id is 10 and σ t id is 1.5 in morning trip; μ t id is 16 and σ t id is 1.5 in afternoon trip.
  • μ T pa , σ T pa , and ξ T pa are set to 439, 168, and 0.234 for parking time in the working zone, respectively; μ T pa , σ T pa , and ξ T pa are set to 69, 45, and 0.644 for parking time in the recreational zone.
  • μ SOC id is set to 0.5, and σ SOC id is set to 0.1 for the initial SOC.
  • Scenario parameters: the temperature T i is set to 25 °C, and the weather is set to sunny.
  • The load is 46 MW, and PV is 65.7 MW. EVs’ fast-charging power is 70 kW. The charging and discharging efficiency are both 0.9. The residential GFCS has 45 charging piles, the working GFCS has 65 charging piles, and the recreational GFCS has 80 charging piles.
The simulation interval is set to 1 min. The tariff-optimization interval is set to 60 min. The simulation duration is 24 h for a whole day. The upper and lower limits of SOC are set to 0.9 and 0.1, respectively. The mileage anxiety threshold ε is set to 0.25. All simulations are based on MATLAB R2022b. Table 1 gives the cases used to verify the proposed method in this study.

6.3. The Result of PV Output Prediction

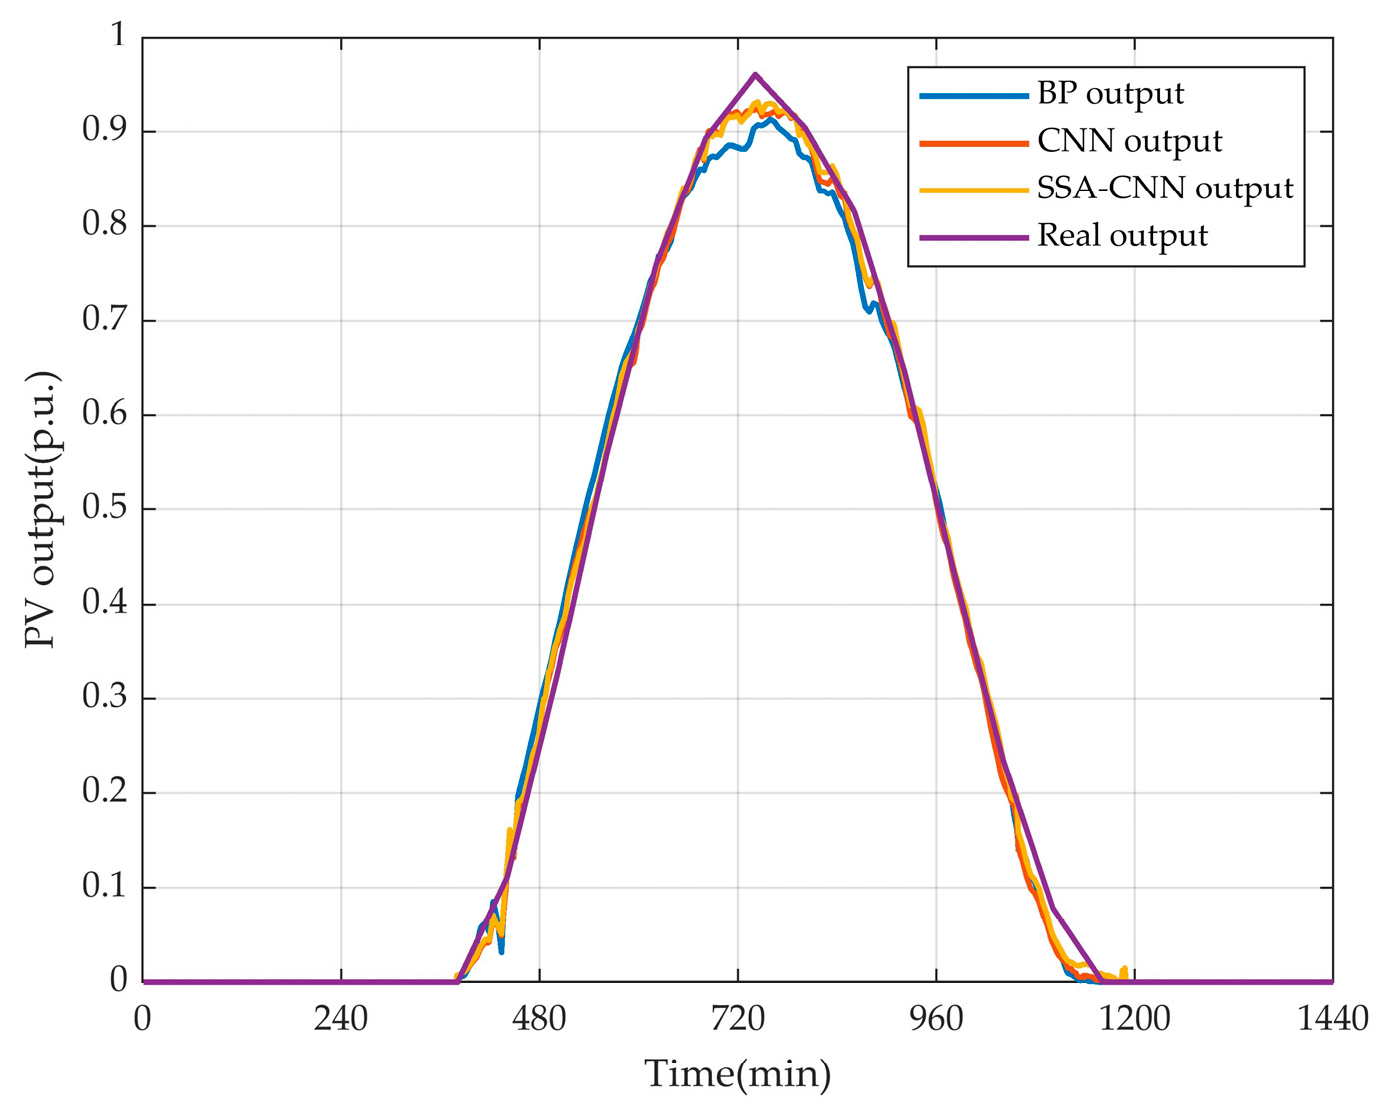
Figure 6 depicts the comparison of PV output by a backpropagation neural network (BPNN), a CNN, and the SSA-CNN, respectively. The salp population size of the SSA is set to 50, and the number of iterations is set to 200. The maximum number of epochs of the BPNN, CNN, and SSA-CNN is set to 300. From the comparison of the results, it can be seen that the SSA-CNN proposed in this study is 40% lower than BPNN and 15% lower than the original CNN in terms of RMSE. Figure 5 shows the maximum error at 434 min, and the error rate reaches 6.74% for the BPNN, 4.99% for the CNN, and 4.78% for the SSA-CNN. Hence, the SSA-CNN has significantly improved the prediction accuracy of PV.

6.4. Comparison of Optimization Algorithms

Figure 7 depicts the comparison of fitness convergence curves of the sparrow search algorithm (SS), ant lion optimizer (ALO), and the MVO in tariff optimization. The algorithms were all run on an Intel (R) Core (TM) i5-13500H 2.60GHz CPU. The swarm/universe size of each algorithm is set to 50, and the number of iterations is 200. The optimization completion time of the MVO is 34,985 s, that of the SS is 38,657 s, and that of the ALO is 42,984 s, and the optimization speed of the MVO algorithm is better than those of the SSA and ALO. At the same time, it can be seen in Figure 7 that the convergence accuracy of the MVO is better than those of the SSA and ALO. Therefore, the MVO has the fastest optimization speed and the best accuracy.

6.5. Case Study

6.5.1. Case 1: NREVs with No Scheduling and REVs with No Scheduling

Figure 8 shows the distribution of the EVs. In Figure 8a, on weekdays, from 400 min to 960 min, EVs are centrally charged at the working GFCS, reaching 168 EVs at 710 min. From 720 min to 1440 min, EVs gradually increase in the residential GFCS, reaching a peak of 279 at 1129 min. The distribution of EVs over a whole day in the recreational zone is less. In Figure 8b, on weekends, the residential GFCS and the recreational GFCS have a significant bimodal distribution of the number of charging EVs from 480 min to 1200 min, and EVs in the residential zone outnumber those in the recreational zone. The working GFCS has EVs only during 480 min–960 min, and the number is less. As shown in Figure 8c, on holidays, the recreational GFCS has a significant increase in the number of EVs compared to the other scenarios.
Figure 9, Figure 10 and Figure 11 show the mileage anxiety of the arriving EV users, as calculated by Equation (40), at the destination GFCS under disordered decision-making according to Section 4.1. In Figure 9, Figure 10 and Figure 11, for both residential and working zones, EVs make inter-zone trips, and the departure distance of EVs is longer than 3 km to the destination GFCS; the longer departure distance leads to a low SOC, which increases mileage anxiety. In contrast, the appearance of EVs with distances less than 3 km in Figure 10c is due to the influx of tourist EVs, and this category of EVs does not make inter-zone trip chains.
In Case 1, on weekdays, the EV users’ average mileage anxiety is 39.2%, the fatigue index is 69.7%, and the charging time idle rate is 55.6%. The voltage fluctuation rate is 3.1%, and the voltage exceedance rate is 23.1%. The utilization of the residential GFCS is 81.8%, the utilization of the working GFCS is 23.8%, and the utilization of the recreational GFCS is 9.1%. On weekends, the average mileage anxiety is 40.8%, the fatigue index is 63.7%, and the charging time idle rate is 33.0%. The voltage fluctuation rate is 3.2%, and the voltage exceedance rate is 23.1%. The utilization of the residential GFCS is 68.5%, the utilization of the working GFCS is 7.1%, and the utilization of the recreational GFCS is 22.0%. On holidays, the average mileage anxiety is 27.9%, the fatigue index is 67.3%, and the charging time idle rate is 37.1%. The voltage fluctuation rate is 3.2%, and the voltage exceedance rate is 25.6%. The utilization of the residential GFCS is 67.2%, the utilization of the working GFCS is 6.1%, and the utilization of the recreational GFCS is 67.9%.

6.5.2. Case 2: NREVs with No Scheduling and REVs with Scheduling

Figure 12 depicts the distribution of NREVs at each GFCS. Due to the disordered distribution, NREVs show a similar feature to Case 1 in Figure 8.
On weekdays, REVs are scheduled to discharge at working and recreational GFCSs from 960 min to 1300 min to avoid congestion at the residential GFCS, as shown in Figure 12a. To balance the charging load of each GFCS, on weekends, the distribution of REVs in the working zone and recreational zone is larger than in the residential zone, and on holidays, there are basically no REVs in the recreational zone and residential zone.
Figure 13 depicts the distribution of REVs at each GFCS, which improves charging pile utilization at GFCSs, as shown in Table 2, and improves the voltage fluctuation rate by 5.4% and the voltage exceedance rate by 44.9%, as shown in Table 3. The satisfaction of GFCSs has improved significantly according to Section 5.3.2; however, the satisfaction of NREV users is the same as in Case 1.

6.5.3. Case 3: NREV Scheduling by SOR and REV Scheduling

Figure 14 depicts the distribution of NREVs, and Figure 15 depicts tariffs for NREVs in each scenario with SOR. The tariff is set according to the local tariff, and E p , ub is 2 and E p , lb is 0.5.
Compared to Figure 12a, in Figure 14a, on weekdays, EVs are dominated by commuting chains. From 1080 min to 1300 min, the residential GFCS only has 45 charging piles with 81 NREVs to charge, and therefore, the residential GFCS has severe queuing. The tariff in the residential zone is adjusted to be higher than that in the working zone to reduce EVs that decide to charge at the residential GFCS, as Figure 15a shows. The higher tariff in the recreational zone is to avoid decreasing the EV side’s satisfaction due to the long traveling distance to the recreational GFCS for charging.
On weekends, NREVs are dominated by recreational chains, as Figure 14b shows. The residential GFCS tariffs in Figure 15b are overall lower than those in the recreational zone to balance NREVs with the charging demand. In the working GFCS, the tariff is at a high level to prevent EVs from traveling long distances to its GFCS with high mileage anxiety, charging cost, fatigue index, and charging time idle rate.
In Figure 14c, due to the influx of tourist EVs in the recreational zone, there is congestion if charging at the recreational GFCS. In order to alleviate the charging time idle rate, NREVs are directed to the working GFCS at 600 min–1300 min. The residential GFCS also has a lot of NREVs to charge because the departure and end points of the travel chain are both residential zones.
The distributions of NREVs charging at the departure GFCS of each zone are shown in Figure 16, Figure 17 and Figure 18. According to Section 4.2, NREVs charge at the departure GFCS by SOR, and NREVs’ SOC remains at a high level throughout the whole day, which alleviates mileage anxiety, as shown in Figure 19, Figure 20 and Figure 21.
The distributions of NREV users’ mileage anxiety with the charging demand of each zone are shown in Figure 19, Figure 20 and Figure 21. From Equation (40), NREV users’ mileage anxiety is calculated. Compared to Case 1, in Case 3, NREVs are scheduled at the departure GFCS for charging, which significantly reduces the number of NREV users with mileage anxiety when they arrive at the GFCS. When decision-making is carried out during the trips, the distance between NREVs and GFCSs is less than 3 km, and the distribution of mileage anxiety within 3 km appears.
As shown in Table 4, compared to Case 1, SOR improves mileage anxiety by 51.2% on weekdays, 58.6% on weekends, and 45.5% on holidays; improves the fatigue index by 68.8% on weekdays, 48.5% on weekends, and 29.9% on holidays; and improves the charging time idle rate by 63.3% on weekdays, 22.5% on weekends, and 34.9% on holidays. Therefore, SOR has significantly improved NREV users’ satisfaction.
Figure 22 depicts the distribution of REVs after guidance. REVs aim to improve voltage quality and the charging pile utilization of GFCSs. On weekdays, REVs charge in 600 min–750 min and discharge in 980 min–1280 min. On weekends, the number of REVs in the working zone and recreational zone is larger than that in the residential zone. On holidays, there are basically no REVs in the residential zone. Compared with Case 2, as shown in Figure 13, it is obvious that the maximum number of REVs charging/discharging is almost the same, and it also shows that NREV charging decision-making by SOR does not consider GFCSs’ satisfaction.

6.5.4. Case 4: NREV Scheduling by KANO and REV Scheduling

Figure 23 depicts the distribution of NREVs. Figure 24 depicts tariffs for NREVs with KANO decision-making.
On weekdays, as Figure 23a shows, compared to Case 2 in Figure 11a, at 480 min to 1000 min, KANO directs NREVs to charge at the relatively idle GFCSs in the working zone and recreational zone with low tariffs.
On weekends, as Figure 23b shows, compared to Case 2, the number of NREVs charging at the working GFCS increases significantly starting at 840 min, and the number of NREVs charging at the recreational GFCS increases significantly starting at 480 min, which improves the charging pile utilization of GFCSs in the working zone and recreational zone.
On holidays, as Figure 23c shows, compared to Case 2, the number of NREVs charging at the working GFCS increases significantly starting at 840 min, but the number of NREVs charging at the recreational GFCS is extremely high.
Figure 25, Figure 26 and Figure 27 depict the distribution of NREVs charging at the departure GFCSs. It significantly reduces the number of NREV users who are anxious when arriving at GFCSs, and then the overall anxiety of EV users is reduced. Compared with Figure 16, Figure 17 and Figure 18 in Case 3, the number of NREVs charging in the departure zone has decreased, which indicates that NREV users’ satisfaction when using KANO is lower than that when using SOR.
Figure 28, Figure 29 and Figure 30 depict the mileage anxiety of NREVs. By comparing them with Case 1 in Figure 9, Figure 10 and Figure 11, it can be seen that the overall anxiety of NREV users is mitigated. On weekdays, NREV users’ mileage anxiety has improved by 25.6%; on weekends, NREV users’ mileage anxiety has improved by 43.6%; and on holidays, NREV users’ mileage anxiety has improved by 20.9%. However, the improvement in the anxiety of all NREV users is lower compared with Case 3 in Figure 19, Figure 20 and Figure 21.
Compared to Case 1, with KANO decision-making, on weekdays, the voltage fluctuation rate is improved by 15.0%, and the voltage exceedance rate is improved by 41.4%. On weekends, the voltage fluctuation rate is improved by 7.4%, and the voltage exceedance rate is improved by 35.1%. On holidays, the voltage fluctuation rate is improved by 11.3%, and the voltage exceedance rate is improved by 21.8%, as shown in Table 3. The improvement in the charging pile utilization of GFCSs is shown in Table 2.
Figure 31 depicts the distribution of REVs. On weekdays, compared to Figure 22a in Case 3, the distribution of REVs involved in the demand response for improving the GFCS satisfaction is less, as shown in Figure 31a. On weekends, fewer REVs discharge at the residential GFCS. On holidays, the residential GFCS and recreational GFCS have congestion, and therefore, almost all REVs are scheduled at the working GFCS to improve the working GFCS utilization and alleviate congestion.
KANO shows significant effectiveness in improving voltage quality and charging pile utilization, while SOR shows significant effectiveness in improving the EV charging/time costs, mileage anxiety, fatigue index, and charging time idle rate. Therefore, this study proposes coordination decision-making by SOR and KANO to simultaneously improve the satisfaction of both sides, the effectiveness of which is verified in Case 5.

6.5.5. Case 5: NREV Scheduling by SOR&KANO and REV Scheduling

Figure 32 depicts the distribution of NREVs. Figure 33 depicts tariffs for NREVs with SOR&KANO decision-making. The weight coefficients, ω EVs and ω GFCS , are both set to 0.5.
On weekdays, in Figure 32a, compared to Case 2 in Figure 12a, NREVs are rarely directed to the residential GFCS for charging from 960 min to 1200 min, where congestion occurs, as shown in Figure 12a, and NREVs are directed to the working GFCS from 960 min to 1200 min, where the utilization is relatively poor, as shown in Figure 12a, to avoid congestion as well as increase GFCSs’ total utilization.
On weekends, as shown in Figure 32b, compared to Case 2 in Figure 12b, NREVs are guided to the relatively empty working GFCS for charging from 840 min to 900 min and 1300 min to 1400 min, aiming to improve the working GFCS’s utilization.
On holidays, in Figure 32c, compared to Case 2 in Figure 12c, with the extra influx of NREVs in the recreational zone, the number of NREVs charging at the recreational GFCS is consistently high. NREVs are guided to working and residential GFCSs to share the recreational-zone NREVs so that queuing is effectively mitigated.
Figure 34, Figure 35 and Figure 36 depict the distribution of NREVs charging at the departure point with SOR&KANO to reduce the number of NREV users who are anxious when arriving at GFCSs. The number of NREVs charging at the departure point with SOR&KANO is higher than that charging at the departure point with KANO compared with Figure 25, Figure 26 and Figure 27 but lower than that charging at the departure point determined by SOR compared with Figure 16, Figure 17 and Figure 18.
Figure 37, Figure 38 and Figure 39 depict the mileage anxiety of NREV users with the SOR&KANO decision-making model. Compared with Case 1, NREV users’ mileage anxiety has improved by 33.6% on weekdays, 46.9% on weekends, and 35.5% on holidays. Compared with Case 4, as Figure 28, Figure 29 and Figure 30 show, it can be seen that the overall anxiety of EV users is mitigated, but the improvement in the overall anxiety of EV users is lower than that in Case 3, as Figure 19, Figure 20 and Figure 21 show.
Compared with Case 1, NREV charging decision-making by SOR&KANO improves mileage anxiety by 33.6% and the charging time idle rate by 47.9% on weekdays, as shown in Table 4; improves the voltage fluctuation rate by 10.5% and voltage exceedance rate by 36.9% on weekdays, as shown in Table 3; and improves charging pile utilization, as shown in Table 2.
Figure 40 depicts the distribution of REVs. SOR&KANO guides REVs to improve the GFCSs’ satisfaction; the distribution of REVs involved in the demand response for improving the GFCSs’ satisfaction in the residential zone is less than that in Case 3 and larger than that in Case 4.

6.5.6. Case Evaluation

Figure 41 shows the comprehensive evaluation of SOR, KANO, and SOR&KANO in each scenario.
  • The GFCS side’s voltage fluctuation rate and voltage exceedance rate are ranked as NREVs> NREVs (SOR) > NREVs (SOR&KANO) > NREVs (KANO);
  • The EV side’s mileage anxiety and charging time idle rate are ranked as NREVs > NREVs (KANO) > NREVs (SOR&KANO) > NREVs (SOR).
The difference in the appearance of sorting in spending/revenue is due to the looser range of tariffs set in MVO optimization. The reason that the spending/revenue is higher in the SOR model than in the KANO model is that EVs are mainly limited by anxiety in the SOR decision-making model, and when EV users have higher mileage anxiety, they will not consider the tariffs. On holidays, the significant increase in spending/revenue is influenced by the scenario characteristics, where EVs are charging in the recreational zone even though the tariffs are high.
The mechanism for REVs significantly improves the satisfaction of GFCSs in Case 2, and the results prove the effectiveness of REV guidance, as shown in Table 2 and Table 3. In Case 3, the decision-making by SOR significantly improves the satisfaction of EV users, as shown in Table 4. In Case 4, the decision-making by KANO significantly improves the satisfaction of GFCSs, as shown in Table 2 and Table 3. In Case 5, the decision-making by SOR&KANO not only improves the satisfaction of EV users, as shown in Table 4, but also improves the satisfaction of GFCSs, as shown in Table 2 and Table 3.
The evaluation cases verify the effectiveness of SOR, KANO, and SOR&KANO in dealing with the utilization of GFCSs, voltage quality, mileage anxiety, the fatigue index, and the charging time idle rate. The superiority of SOR&KANO is illustrated, and, therefore, SOR&KANO is selected as the optimal decision-making model.
In Figure 42, Figure 43 and Figure 44, a comparison of the node-18 voltages in Case 1–Case 5 is depicted. Figure 42a,b compare the voltage before and after the addition of REVs. The voltage in Case 2 is better than in Case 1, as depicted in Figure 42, Figure 43 and Figure 44 and Table 3. Figure 42c–e display the voltages with the inclusion of REVs, with Case 4 exhibiting superior voltage quality compared to Case 3 and Case 5, with Case 5 outperforming Case 3. These results, as depicted in Figure 42, Figure 43 and Figure 44, validate the effectiveness of the proposed REV mechanism, KANO, and SOR&KANO in enhancing voltage quality.

7. Conclusions

The rapid expansion of EVs, GFCSs, and their associated facilities has made the development of an efficient scheduling strategy for charging and discharging a pressing research focus in the field of EV scheduling. This paper addresses this issue within a DN characterized by a high penetration of distributed PVs. To address the stochastic nature of EV charging loads, we propose the SOR&KANO decision-making model, which comprehensively takes into account the satisfaction of EV users and GFCSs, categorizes EVs into NREVs and REVs, and solves the optimal satisfaction of both EV users and GFCSs by the MVO.
In this paper, the SSA-CNN prediction algorithm is proposed, which shows a significant improvement in PV prediction accuracy, and the prediction RMSE is 40% lower than that of the BPNN and 15% lower than that of the original CNN algorithm.
The SOR&KANO decision model proposed in this paper improves the satisfaction of both EV users and GFCSs. From the results in Table 2, Table 3 and Table 4, it can be seen that SOR has a bias toward increased EV user satisfaction, while KANO has a bias toward increased GFCS satisfaction. SOR&KANO shows its highlight on the satisfaction increase of both sides.
The MVO optimization algorithm has the advantages of faster convergence and shorter search times than other algorithms; the results verify that the final convergence fitness value is the smallest, and the MVO search time is 10.49% faster than the SS algorithm and 22.86% faster than the ALO.
Beyond this study, there is further work that needs to be pursued. Firstly, to enhance the precision of predicting EV distribution, it is essential to provide more detailed clarification of the transportation network. Secondly, a robust coupling relationship between the traffic network and distribution network must be established to facilitate optimal energy distribution alongside voltage management. Additionally, the integration of multi-objective optimization algorithms could be a valuable approach for achieving the outlined research objectives. These are currently being undertaken as part of our research.

Author Contributions

Conceptualization, Q.Y. and Y.G.; methodology, Q.Y.; software, Y.G. and B.X.; validation, Q.Y., Y.G. and L.X.; formal analysis, Q.Y. and L.X.; investigation, Q.Y. and Y.G.; data curation, Y.L. and W.C.; writing—original draft preparation, Q.Y. and Y.G.; writing—review and editing, Q.Y.; supervision, Q.Y.; funding acquisition, Q.Y. and B.X. All authors have read and agreed to the published version of the manuscript.

Funding

This research was funded by the Key Science and Technology Program of Henan Province (No.232102241020) and the PhD research foundation of Henan University of Science and Technology (No.13480014).

Data Availability Statement

The data presented in this study are available on request from the corresponding author due to privacy.

Conflicts of Interest

Author Yanxue Li was employed by the company State Grid Integrated Energy Planning and D&R Institute Co., Ltd. Author Weili Chen was employed by the company State Grid Hengshui Electric Power Co., Ltd. The remaining authors declare that the research was conducted in the absence of any commercial or financial relationships that could be construed as a potential conflict of interest.

References

  1. Hu, R.; Cai, T.; Xu, W. Exploring the Technology Changes of New Energy Vehicles in China: Evolution and Trends. Comput. Ind. Eng. 2024, 191, 110178. [Google Scholar] [CrossRef]
  2. Chen, X.H.; Tee, K.; Elnahass, M.; Ahmed, R. Assessing the Environmental Impacts of Renewable Energy Sources: A Case Study on Air Pollution and Carbon Emissions in China. J. Environ. Manag. 2023, 345, 118525. [Google Scholar] [CrossRef]
  3. Wu, J.; Su, H.; Meng, J.; Lin, M. Electric Vehicle Charging Scheduling Considering Infrastructure Constraints. Energy 2023, 278, 127806. [Google Scholar] [CrossRef]
  4. National Energy Administration. Transcript of the National Energy Administration’s Q1 2024 Press Conference. Available online: https://www.nea.gov.cn/2024-01/25/c_1310762019.htm (accessed on 25 January 2024).
  5. Fachrizal, R.; Shepero, M.; Van Der Meer, D.; Munkhammar, J.; Widén, J. Smart Charging of Electric Vehicles Considering Photovoltaic Power Production and Electricity Consumption: A Review. eTransportation 2020, 4, 100056. [Google Scholar] [CrossRef]
  6. Secchi, M.; Barchi, G.; Macii, D.; Petri, D. Smart Electric Vehicles Charging with Centralised Vehicle-to-Grid Capability for Net-Load Variance Minimisation under Increasing EV and PV Penetration Levels. Sustain. Energy Grids Netw. 2023, 35, 101120. [Google Scholar] [CrossRef]
  7. Gaboitaolelwe, J.; Zungeru, A.M.; Yahya, A.; Lebekwe, C.K.; Vinod, D.N.; Salau, A.O. Machine Learning Based Solar Photovoltaic Power Forecasting: A Review and Comparison. IEEE Access 2023, 11, 40820–40845. [Google Scholar] [CrossRef]
  8. Huang, Q.; Wei, S. Improved Quantile Convolutional Neural Network with Two-Stage Training for Daily-Ahead Probabilistic Forecasting of Photovoltaic Power. Energy Convers. Manag. 2020, 220, 113085. [Google Scholar] [CrossRef]
  9. Suresh, V.; Janik, P.; Rezmer, J.; Leonowicz, Z. Forecasting Solar PV Output Using Convolutional Neural Networks with a Sliding Window Algorithm. Energies 2020, 13, 723. [Google Scholar] [CrossRef]
  10. Wang, F.; Xuan, Z.; Zhen, Z.; Li, K.; Wang, T.; Shi, M. A Day-Ahead PV Power Forecasting Method Based on LSTM-RNN Model and Time Correlation Modification under Partial Daily Pattern Prediction Framework. Energy Convers. Manag. 2020, 212, 112766. [Google Scholar] [CrossRef]
  11. Dong, N.; Chang, J.-F.; Wu, A.-G.; Gao, Z.-K. A Novel Convolutional Neural Network Framework Based Solar Irradiance Prediction Method. Int. J. Electr. Power Energy Syst. 2020, 114, 105411. [Google Scholar] [CrossRef]
  12. Han, X.; Wei, Z.; Hong, Z.; Zhao, S. Ordered Charge Control Considering the Uncertainty of Charging Load of Electric Vehicles Based on Markov Chain. Renew. Energy 2020, 161, 419–434. [Google Scholar] [CrossRef]
  13. Anand, M.P.; Bagen, B.; Rajapakse, A. Probabilistic Reliability Evaluation of Distribution Systems Considering the Spatial and Temporal Distribution of Electric Vehicles. Int. J. Electr. Power Energy Syst. 2020, 117, 105609. [Google Scholar] [CrossRef]
  14. Hafeez, G.; Alimgeer, K.S.; Khan, I. Electric Load Forecasting Based on Deep Learning and Optimized by Heuristic Algorithm in Smart Grid. Appl. Energy 2020, 269, 114915. [Google Scholar] [CrossRef]
  15. Li, H.; Yu, L.; Chen, Y.; Tu, H.; Zhang, J. Uncertainty of Available Range in Explaining the Charging Choice Behavior of BEV Users. Transp. Res. Part A Policy Pract. 2023, 170, 103624. [Google Scholar] [CrossRef]
  16. Yi, T.; Zhang, C.; Lin, T.; Liu, J. Research on the Spatial-Temporal Distribution of Electric Vehicle Charging Load Demand: A Case Study in China. J. Clean. Prod. 2020, 242, 118457. [Google Scholar] [CrossRef]
  17. Li, B.; Chen, M.; Kammen, D.M. Electric vehicle’s impacts on China’s electricity load profiles based on driving patterns and demographics. Energy Rep. 2022, 8, 26–35. [Google Scholar] [CrossRef]
  18. Zhang, J.; Yan, J.; Liu, Y. Daily electric vehicle charging load profiles considering demographics of vehicle users. Appl. Energy 2020, 274, 115063. [Google Scholar] [CrossRef]
  19. Fischer, D.; Harbrecht, A.; Surmann, A.; McKenna, R. Electric Vehicles’ Impacts on Residential Electric Local Profiles—A Stochastic Modelling Approach Considering Socio-Economic, Behavioural and Spatial Factors. Appl. Energy 2019, 233–234, 644–658. [Google Scholar] [CrossRef]
  20. Gschwendtner, C.; Knoeri, C.; Stephan, A. The Impact of Plug-in Behavior on the Spatial–Temporal Flexibility of Electric Vehicle Charging Load. Sustain. Cities Soc. 2023, 88, 104263. [Google Scholar] [CrossRef]
  21. Zhang, Z.; Lv, L. Status and Development of Research on Orderly Charging and Discharging of Electric Vehicles. Electronics 2023, 12, 2041. [Google Scholar] [CrossRef]
  22. Zhou, C.; Qi, S.; Zhang, J.; Tang, S. Potential Co-Benefit Effect Analysis of Orderly Charging and Discharging of Electric Vehicles in China. Energy 2021, 226, 120352. [Google Scholar] [CrossRef]
  23. Li, Z.; Wu, L.; Xu, Y.; Zheng, X. Stochastic-Weighted Robust Optimization Based Bilayer Operation of a Multi-Energy Building Microgrid Considering Practical Thermal Loads and Battery Degradation. IEEE Trans. Sustain. Energy 2022, 13, 668–682. [Google Scholar] [CrossRef]
  24. Shang, Y.; Li, S. FedPT-V2G: Security Enhanced Federated Transformer Learning for Real-Time V2G Dispatch with Non-IID Data. Appl. Energy 2024, 358, 122626. [Google Scholar] [CrossRef]
  25. Shang, Y.; Shang, Y.; Yu, H.; Shao, Z.; Jian, L. Achieving Efficient and Adaptable Dispatching for Vehicle-to-Grid Using Distributed Edge Computing and Attention-Based LSTM. IEEE Trans. Ind. Inform. 2022, 18, 6915–6926. [Google Scholar] [CrossRef]
  26. Yan, D.; Yin, H.; Li, T.; Ma, C. A Two-Stage Scheme for Both Power Allocation and EV Charging Coordination in a Grid-Tied PV–Battery Charging Station. IEEE Trans. Ind. Inf. 2021, 17, 6994–7004. [Google Scholar] [CrossRef]
  27. Firouzjah, K.G. Profit-based electric vehicle charging scheduling: Comparison with different strategies and impact assessment on distribution networks. Int. J. Electr. Power Energy Syst. 2022, 138, 107977. [Google Scholar] [CrossRef]
  28. Xiang, Y.; Yang, J.; Li, X.; Gu, C.; Zhang, S. Routing Optimization of Electric Vehicles for Charging with Event-Driven Pricing Strategy. IEEE Trans. Automat. Sci. Eng. 2022, 19, 7–20. [Google Scholar] [CrossRef]
  29. Cui, Y.; Hu, Z.; Duan, X. Optimal Pricing of Public Electric Vehicle Charging Stations Considering Operations of Coupled Transportation and Power Systems. IEEE Trans. Smart Grid 2021, 12, 3278–3288. [Google Scholar] [CrossRef]
  30. Liu, Y.; Wang, Y.; Li, Y.; Gooi, H.B.; Xin, H. Multi-Agent Based Optimal Scheduling and Trading for Multi-Microgrids Integrated with Urban Transportation Networks. IEEE Trans. Power Syst. 2021, 36, 2197–2210. [Google Scholar] [CrossRef]
  31. Zhang, Y. Estimating charging demand from the perspective of choice behavior: A Framework combining rule-based algorithm and Hybrid Choice Model. J. Clean. Prod. 2022, 376, 134262. [Google Scholar] [CrossRef]
  32. Fazeli, S.S.; Venkatachalam, S.; Chinnam, R.B.; Murat, A. Two-Stage Stochastic Choice Modeling Approach for Electric Vehicle Charging Station Network Design in Urban Communities. IEEE Trans. Intell. Transport. Syst. 2021, 22, 3038–3053. [Google Scholar] [CrossRef]
  33. Zhao, H.; Hao, X. Location Decision of Electric Vehicle Charging Station Based on a Novel Grey Correlation Comprehensive Evaluation Multi-Criteria Decision Method. Energy 2024, 299, 131356. [Google Scholar] [CrossRef]
  34. Dai, Y.; Qi, Y.; Li, L.; Wang, B.; Gao, H. A Dynamic Pricing Scheme for Electric Vehicle in Photovoltaic Charging Station Based on Stackelberg Game Considering User Satisfaction. Comput. Ind. Eng. 2021, 154, 107117. [Google Scholar] [CrossRef]
  35. Abdel-Basset, M.; El-Shahat, D.; Faris, H.; Mirjalili, S. A Binary Multi-Verse Optimizer for 0-1 Multidimensional Knapsack Problems with Application in Interactive Multimedia Systems. Comput. Ind. Eng. 2019, 132, 187–206. [Google Scholar] [CrossRef]
  36. Sundaram, A. Multiobjective Multi-Verse Optimization Algorithm to Solve Combined Economic, Heat and Power Emission Dispatch Problems. Appl. Soft Comput. 2020, 91, 106195. [Google Scholar] [CrossRef]
  37. Xu, W.; Yu, X. A Multi-Objective Multi-Verse Optimizer Algorithm to Solve Environmental and Economic Dispatch. Appl. Soft Comput. 2023, 146, 110650. [Google Scholar] [CrossRef]
  38. Fu, Y.; Zhou, M.; Guo, X.; Qi, L.; Sedraoui, K. Multiverse Optimization Algorithm for Stochastic Biobjective Disassembly Sequence Planning Subject to Operation Failures. IEEE Trans. Syst. Man Cybern. Syst. 2022, 52, 1041–1051. [Google Scholar] [CrossRef]
  39. Sultan, H.M.; Menesy, A.S.; Kamel, S.; Selim, A.; Jurado, F. Parameter Identification of Proton Exchange Membrane Fuel Cells Using an Improved Salp Swarm Algorithm. Energy Convers. Manag. 2020, 224, 113341. [Google Scholar] [CrossRef]
  40. Tayab, U.B.; Lu, J.; Yang, F.; AlGarni, T.S.; Kashif, M. Energy Management System for Microgrids Using Weighted Salp Swarm Algorithm and Hybrid Forecasting Approach. Renew. Energy 2021, 180, 467–481. [Google Scholar] [CrossRef]
  41. Mirjalili, S.; Gandomi, A.H.; Mirjalili, S.Z.; Saremi, S.; Faris, H.; Mirjalili, S.M. Salp Swarm Algorithm: A Bio-Inspired Optimizer for Engineering Design Problems. Adv. Eng. Softw. 2017, 114, 163–191. [Google Scholar] [CrossRef]
  42. Beijing Transport Institute. The Beijing Transport Development Annual Report of 2023. Available online: https://www.bjtrc.org.cn/List/index/cid/7.html (accessed on 1 August 2023).
  43. U.S. Department of Transportation. Summary of Travel Trends: 2022 National Household Travel Survey. Available online: https://nhts.ornl.gov/ (accessed on 1 January 2024).
  44. Sun, X.; Fu, J. Experiment Investigation for Interconnected Effects of Driving Cycle and Ambient Temperature on Bidirectional Energy Flows in an Electric Sport Utility Vehicle. Energy 2024, 300, 131594. [Google Scholar] [CrossRef]
  45. Lee, G.; Song, J.; Lim, Y.; Park, S. Energy Consumption Evaluation of Passenger Electric Vehicle Based on Ambient Temperature under Real-World Driving Conditions. Energy Convers. Manag. 2024, 306, 118289. [Google Scholar] [CrossRef]
  46. Hao, X.; Wang, H.; Lin, Z.; Ouyang, M. Seasonal Effects on Electric Vehicle Energy Consumption and Driving Range: A Case Study on Personal, Taxi, and Ridesharing Vehicles. J. Clean. Prod. 2020, 249, 119403. [Google Scholar] [CrossRef]
  47. Temelcan, G.; Kocken, H.G.; Albayrak, I. Fuzzy Modelling of Static System Optimum Traffic Assignment Problem Having Multi Origin-Destination Pair. Socio-Econ. Plan. Sci. 2021, 77, 101024. [Google Scholar] [CrossRef]
  48. Modeling the Effect of Autonomous Vehicles (AVs) on the Accessibility of the Transportation Network|Scientific Reports. Available online: https://www.nature.com/articles/s41598-024-60069-8 (accessed on 24 June 2024).
  49. The People’s Government of Henan Province. Implementation Plan for Accelerating the Development of New Energy Vehicles in Henan Province. Available online: https://www.henan.gov.cn/2022/05-19/2451587.html (accessed on 19 May 2022).
  50. Abdel-Aal, M.M.M. Survey-Based Calibration of a Parking Entry as a Single-Server Mathematical Queuing Model: A Case Study. Alex. Eng. J. 2020, 59, 829–838. [Google Scholar] [CrossRef]
  51. Gnedenko, B.V.; Kovalenko, I.N. Introduction to Queueing Theory; Birkhauser Boston Inc.: Boston, MA, USA, 1989. [Google Scholar]
  52. Sørensen, Å.L.; Sartori, I.; Lindberg, K.B.; Andresen, I. A Method for Generating Complete EV Charging Datasets and Analysis of Residential Charging Behaviour in a Large Norwegian Case Study. Sustain. Energy Grids Netw. 2023, 36, 101195. [Google Scholar] [CrossRef]
  53. Liu, F.; Lai, K.-H.; Wu, J.; Duan, W. Listening to Online Reviews: A Mixed-Methods Investigation of Customer Experience in the Sharing Economy. Decis. Support Syst. 2021, 149, 113609. [Google Scholar] [CrossRef]
  54. Sultan, P.; Wong, H.Y.; Azam, M.S. How Perceived Communication Source and Food Value Stimulate Purchase Intention of Organic Food: An Examination of the Stimulus-Organism-Response (SOR) Model. J. Clean. Prod. 2021, 312, 127807. [Google Scholar] [CrossRef]
  55. Shi, R.; Wang, M.; Liu, C.; Gull, N. The Influence of Short Video Platform Characteristics on Users’ Willingness to Share Marketing Information: Based on the SOR Model. Sustainability 2023, 15, 2448. [Google Scholar] [CrossRef]
  56. Zhang, L.; Yang, X.; Fan, Y.; Zhang, J. Utilizing the Theory of Planned Behavior to Predict Willingness to Pay for Urban Heat Island Effect Mitigation. Build. Environ. 2021, 204, 108136. [Google Scholar] [CrossRef]
  57. Liu, X.; Wang, Q.-C.; Jian, I.Y.; Chi, H.-L.; Yang, D.; Chan, E.H.-W. Are You an Energy Saver at Home? The Personality Insights of Household Energy Conservation Behaviors Based on Theory of Planned Behavior. Resour. Conserv. Recycl. 2021, 174, 105823. [Google Scholar] [CrossRef]
  58. Bai, S.; Li, F.; Xie, W. Green but Unpopular? Analysis on Purchase Intention of Heat Pump Water Heaters in China. Energies 2022, 15, 2464. [Google Scholar] [CrossRef]
  59. State Administration for Market Regulation; Standardization Administration of the People’s Republic of China. Conversion Methods for Energy Consumption of Electric Vehicles (GB/T37340—2019); Ministry of Health of the People’s Republic of China: Beijing, China, 2019. (In Chinese)
  60. Wang, X.; Wang, X.; Liang, L.; Yue, X.; Van Wassenhove, L.N. Estimation of Deprivation Level Functions Using a Numerical Rating Scale. Prod. Oper. Manag. 2017, 26, 2137–2150. [Google Scholar] [CrossRef]
  61. Slevitch, L. Kano Model Categorization Methods: Typology and Systematic Critical Overview for Hospitality and Tourism Academics and Practitioners. J. Hosp. Tour. Res. 2024. [Google Scholar] [CrossRef]
  62. Li, X.; Zhu, S.; Yüksel, S.; Dinçer, H.; Ubay, G.G. Kano-Based Mapping of Innovation Strategies for Renewable Energy Alternatives Using Hybrid Interval Type-2 Fuzzy Decision-Making Approach. Energy 2020, 211, 118679. [Google Scholar] [CrossRef]
  63. Encinas, F.; Marmolejo-Duarte, C.; Aguirre-Nuñez, C.; Vergara-Perucich, F. When Residential Energy Labeling Becomes Irrelevant: Sustainability vs. Profitability in the Liberalized Chilean Property Market. Sustainability 2020, 12, 9638. [Google Scholar] [CrossRef]
  64. Mirjalili, S.; Mirjalili, S.M.; Hatamlou, A. Multi-Verse Optimizer: A Nature-Inspired Algorithm for Global Optimization. Neural Comput. Appl. 2016, 27, 495–513. [Google Scholar] [CrossRef]
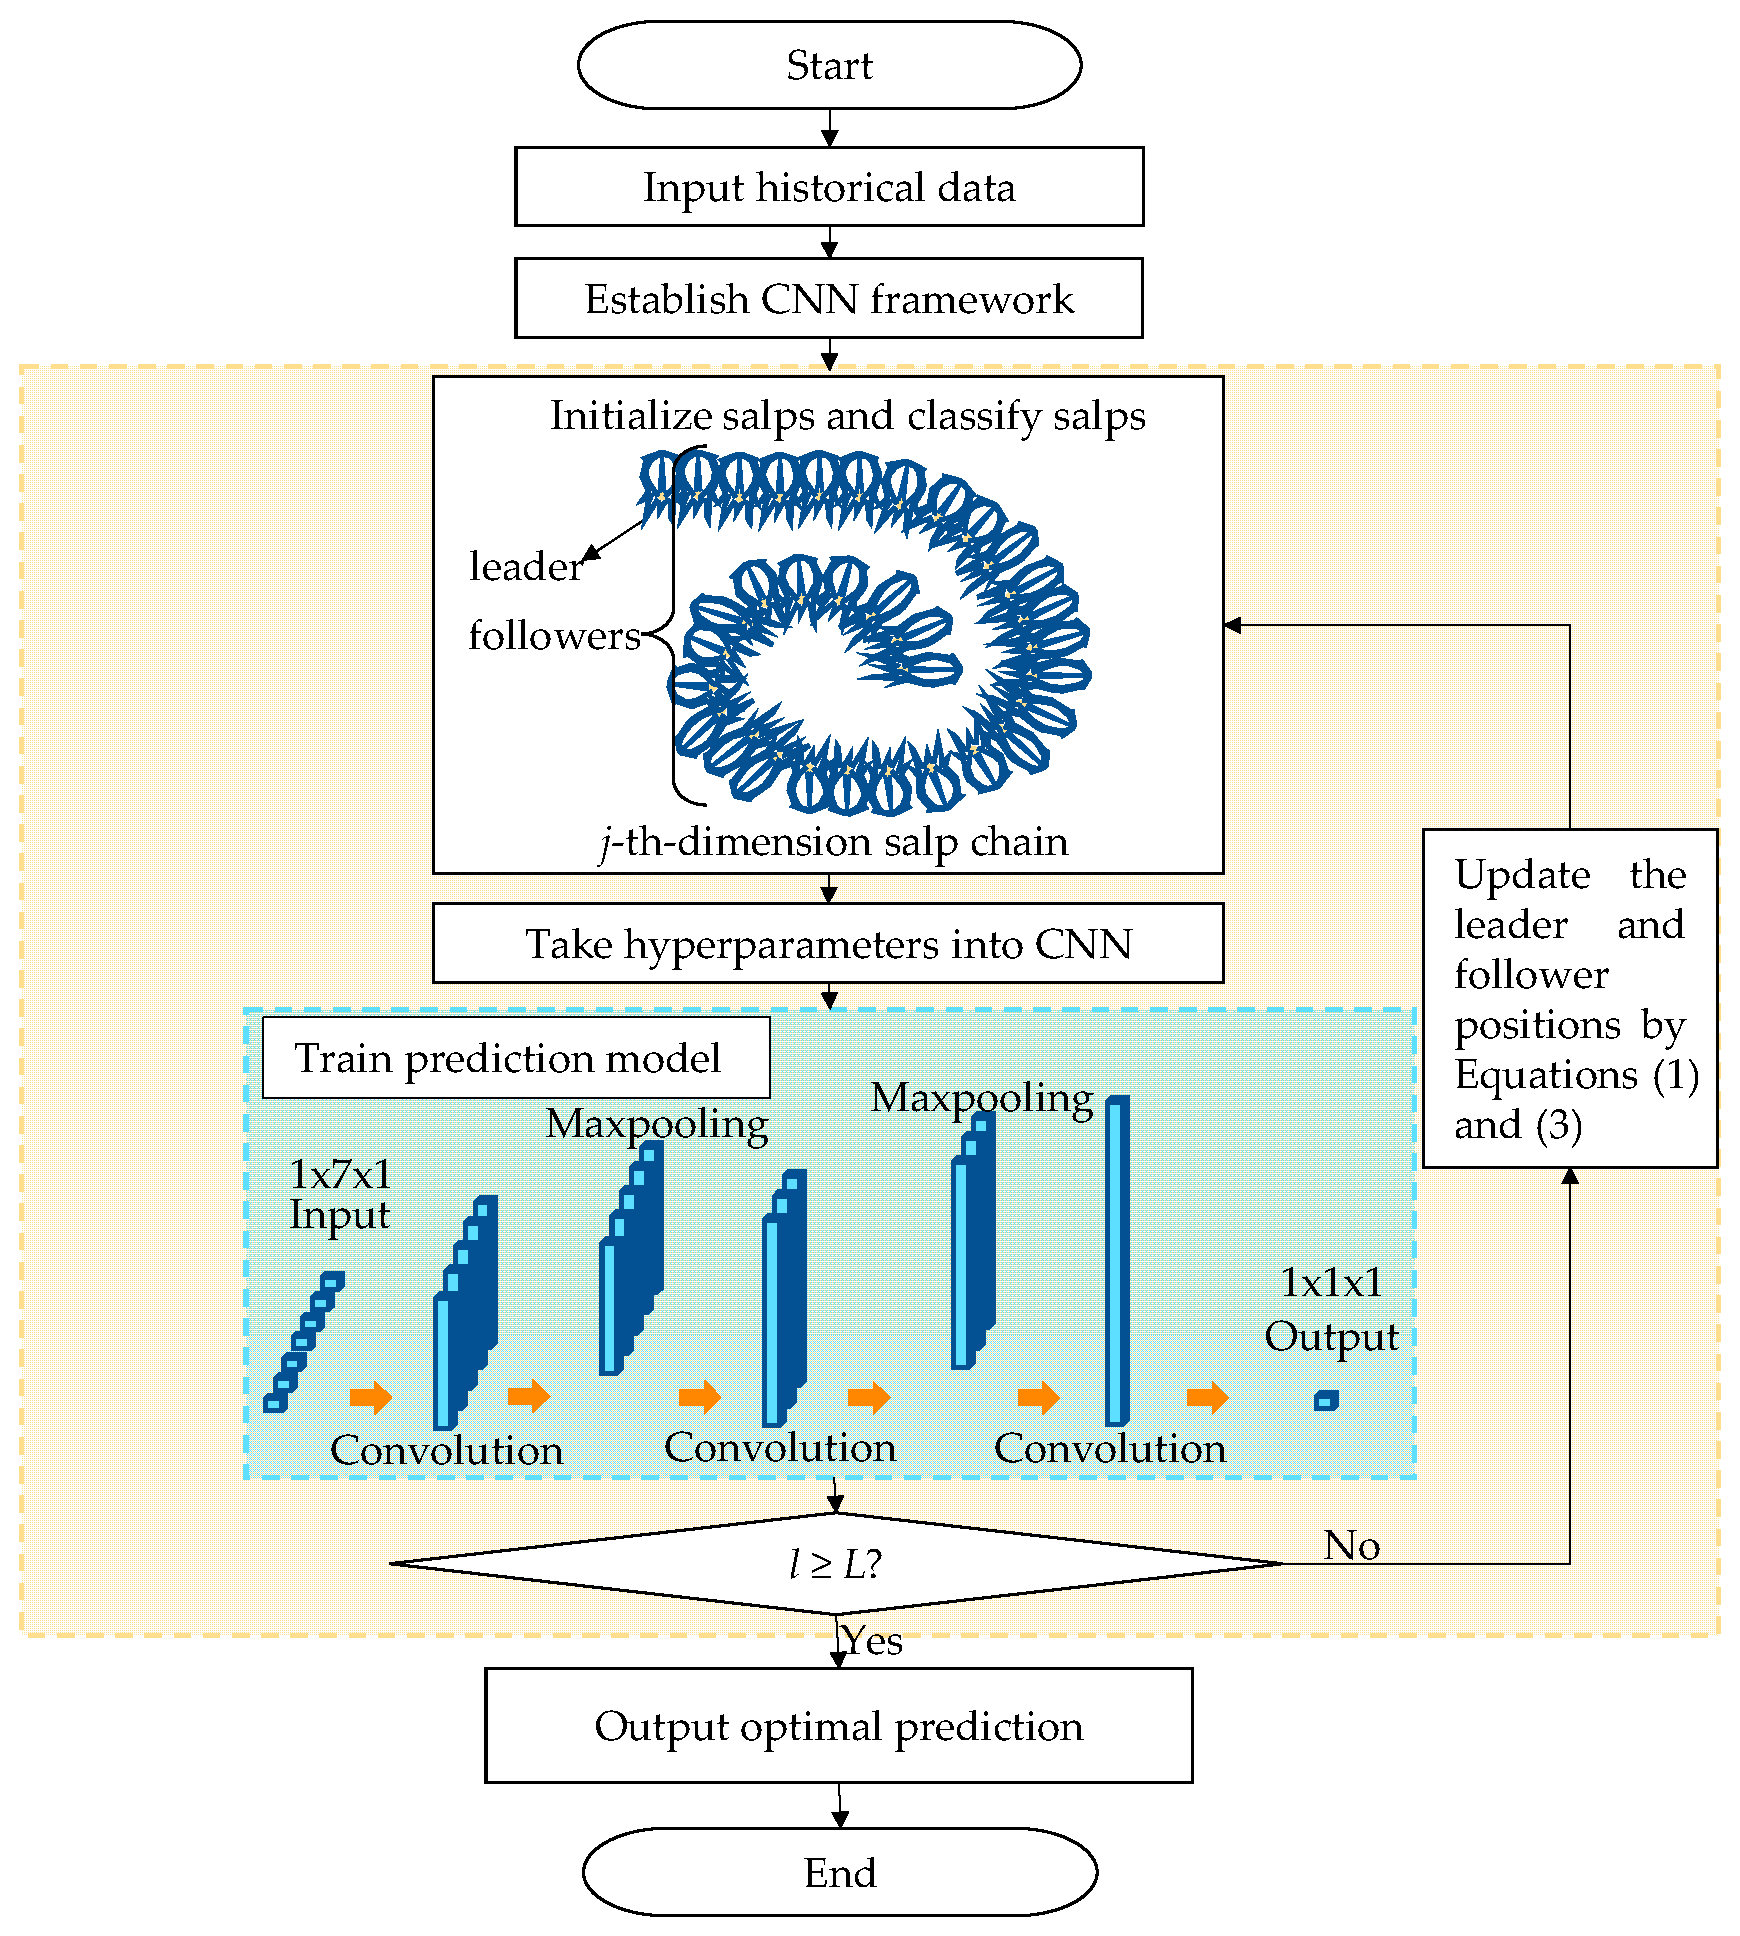
Figure 1. The SSA-CNN flowchart.
Energies 17 03413 g001
Figure 2. The flowchart of Monte Carlo.
Energies 17 03413 g002
Figure 3. The MVO optimization flowchart.
Energies 17 03413 g003
Figure 4. The multi-scenario optimal scheduling of a GFCS, NREVs, and REVs.
Energies 17 03413 g004
Figure 5. Simulation system.
Energies 17 03413 g005
Figure 6. A comparison of the results of PV output prediction.
Energies 17 03413 g006
Figure 7. A comparison of fitness curves with different algorithms.
Energies 17 03413 g007
Figure 8. The distribution of EVs at the GFCS in each scenario in Case 1.
Energies 17 03413 g008
Figure 9. EV users’ mileage anxiety at residential GFCS in Case 1.
Energies 17 03413 g009
Figure 10. EV users’ mileage anxiety at working GFCS in Case 1.
Energies 17 03413 g010
Figure 11. EV users’ mileage anxiety at recreational GFCS in Case 1.
Energies 17 03413 g011
Figure 12. The distribution of NREVs in Case 2.
Energies 17 03413 g012
Figure 13. The distribution of REVs in Case 2.
Energies 17 03413 g013
Figure 14. The distribution of NREVs in Case 3.
Energies 17 03413 g014
Figure 15. Tariffs for the optimal scheduling of NREVs in Case 3.
Energies 17 03413 g015
Figure 16. The number of NREVs charging at the residential GFCS in Case 3.
Energies 17 03413 g016
Figure 17. The number of NREVs charging at the working GFCS in Case 3.
Energies 17 03413 g017
Figure 18. The number of NREVs charging at the recreational GFCS in Case 3.
Energies 17 03413 g018
Figure 19. NREV users’ mileage anxiety at the residential GFCS in Case 3.
Energies 17 03413 g019
Figure 20. NREV users’ mileage anxiety at the working GFCS in Case 3.
Energies 17 03413 g020
Figure 21. NREV users’ mileage anxiety at the recreational GFCS in Case 3.
Energies 17 03413 g021
Figure 22. Distribution of REVs in Case 3.
Energies 17 03413 g022
Figure 23. The distribution of NREVs in Case 4.
Energies 17 03413 g023
Figure 24. The optimal tariffs for NREVs in Case 4.
Energies 17 03413 g024
Figure 25. The number of NREVs charging at the residential GFCS in Case 4.
Energies 17 03413 g025
Figure 26. The number of NREVs charging at the working GFCS in Case 4.
Energies 17 03413 g026
Figure 27. The number of NREVs charging at the recreational GFCS in Case 4.
Energies 17 03413 g027
Figure 28. NREV users’ mileage anxiety at the residential GFCS in Case 4.
Energies 17 03413 g028
Figure 29. NREV users’ mileage anxiety at the working GFCS in Case 4.
Energies 17 03413 g029
Figure 30. NREV users’ mileage anxiety at the recreational GFCS in Case 4.
Energies 17 03413 g030
Figure 31. The distribution of REVs in Case 4.
Energies 17 03413 g031
Figure 32. The distribution of NREVs in Case 5.
Energies 17 03413 g032
Figure 33. The optimal tariffs for NREVs in Case 5.
Energies 17 03413 g033
Figure 34. The number of NREVs charging at the residential GFCS in Case 5.
Energies 17 03413 g034
Figure 35. The number of NREVs charging at the working GFCS in Case 5.
Energies 17 03413 g035
Figure 36. The number of NREVs charging at the recreational GFCS in Case 5.
Energies 17 03413 g036
Figure 37. NREV users’ mileage anxiety when arriving at the residential GFCS in Case 5.
Energies 17 03413 g037
Figure 38. NREV users’ mileage anxiety when arrived at the working GFCS in Case 5.
Energies 17 03413 g038
Figure 39. NREV users’ mileage anxiety when arriving at the recreational GFCS in Case 5.
Energies 17 03413 g039
Figure 40. The distribution of REVs in Case 5.
Energies 17 03413 g040
Figure 41. The evaluation of decision-making models.
Energies 17 03413 g041
Figure 42. The node-18 voltages in the weekday scenario.
Energies 17 03413 g042
Figure 43. The node-18 voltages in the weekend scenario.
Energies 17 03413 g043
Figure 44. The node-18 voltages in the holiday scenario.
Energies 17 03413 g044
Table 1. Simulation cases.
CaseREV
No Scheduling
NREV
No Scheduling
REV
Scheduling
NREV
Scheduling
Case 1
Case 2
Case 3
Case 4
Case 5
Table 2. The charging pile utilization of each GFCS in each scenario.
ScenarioCaseResidential GFCS
Utilization
Working GFCS
Utilization
Recreational GFCS
Utilization
WeekdaysCase 280.7%33.0%16.3%
Case 3 (No-REVs)56.7%35.0%4.1%
Case 4 (No-REVs)36.1%34.6%14.8%
Case 5 (No-REVs)36.5%41.8%8.5%
WeekendsCase 266.3%18.3%25.9%
Case 3 (No-REVs)65.5%1.1%31.6%
Case 4 (No-REVs)40.5%25.5%12.0%
Case 5 (No-REVs)50.4%10.6%21.6%
HolidaysCase 265.6%30.0%68.5%
Case 3 (No-REVs)70.5%21.1%36.8%
Case 4 (No-REVs)46.8%23.3%63.5%
Case 5 (No-REVs)54.4%22.7%63.7%
Table 3. The node-18 voltage exceedance rate and voltage fluctuation rate in each scenario.
ScenarioCase Compared with Case 1Node-18 Voltage Fluctuation Rate ImprovementNode-18 Voltage Exceedance Rate Improvement
WeekdaysCase 25.4%44.9%
Case 3 (No-REVs)3.5%11.2%
Case 4 (No-REVs)15.0%41.4%
Case 5 (No-REVs)10.5%36.9%
WeekendsCase 27.3%56.0%
Case 3 (No-REVs)3.2%23.7%
Case 4 (No-REVs)7.4%35.1%
Case 5 (No-REVs)4.5%25.8%
HolidaysCase 225.1%6.7%
Case 3 (No-REVs)5.9%3.6%
Case 4 (No-REVs)11.3%21.8%
Case 5 (No-REVs)7.3%8.9%
Table 4. EV users’ mean mileage anxiety and the charging time idle rate in each scenario.
ScenarioCase Compared with Case 1Mileage Anxiety ImprovementFatigue Index ImprovementCharging Time Idle Rate Improvement
WeekdaysCase 351.2%68.8%63.3%
Case 425.6%60.6%41.7%
Case 533.6%63.2%47.9%
WeekendsCase 358.6%48.5%22.5%
Case 443.6%23.2%7.7%
Case 546.9%31.2%18.9%
HolidaysCase 345.5%29.9%34.9%
Case 420.9%9.3%6.5%
Case 351.2%68.8%63.3%
Disclaimer/Publisher’s Note: The statements, opinions and data contained in all publications are solely those of the individual author(s) and contributor(s) and not of MDPI and/or the editor(s). MDPI and/or the editor(s) disclaim responsibility for any injury to people or property resulting from any ideas, methods, instructions or products referred to in the content.