Article

The Degradation Prediction of Proton Exchange Membrane Fuel Cell Performance Based on a Transformer Model

1
School of Electrical Engineering and Automation, Harbin Institute of Technology, Harbin 150001, China
2
Suzhou Research Institute, Harbin Institute of Technology, Suzhou 215104, China
*
Authors to whom correspondence should be addressed.
Energies 2024, 17(12), 3050; https://doi.org/10.3390/en17123050
Submission received: 1 June 2024 / Revised: 19 June 2024 / Accepted: 19 June 2024 / Published: 20 June 2024
(This article belongs to the Section D2: Electrochem: Batteries, Fuel Cells, Capacitors)

Abstract

:
Proton exchange membrane fuel cells have attracted widespread attention due to their cleanliness and high energy density, but the performance degradation during operation greatly limits their commercialization. Therefore, the reliable degradation prediction of fuel cell performance is of great significance. The recovery phenomenon of the reversible voltage loss that occurs during the operation of fuel cells has posed great difficulties for model training and prediction. Moreover, the models may easily and erroneously learn the combined trends in the recovery of reversible voltage loss and performance degradation. To address this issue, this paper employs the Transformer model to predict the performance degradation of fuel cells. By utilizing the unique self-attention structure and masking mechanism of the Transformer model, the signal for the recovery of the reversible voltage loss is adopted as the input for the model to avoid interference from information before voltage recovery on subsequent predictions. Experimental results show that the model has the highest prediction accuracy at various prediction starting points. Meanwhile, it can predict the accelerated performance degradation of fuel cells, which has positive implications for health management.

1. Introduction

As efficient and clean energy conversion devices, proton exchange membrane fuel cells (PEMFCs) play an increasingly important role in the development of modern energy technology [1,2,3,4]. Compared with traditional internal combustion engines and secondary batteries, fuel cells can directly convert chemical energy into electrical energy, with higher energy conversion efficiency and lower pollution emissions [5,6,7]. This gives fuel cells broad application prospects in fields such as transportation, distributed power generation, and portable power sources.
Although fuel cell technology has made significant progress in the past few decades, its commercialization process still faces many challenges, one of which is the issue of fuel cells’ short lifespan [8,9,10,11,12]. Specifically, fuel cells will experience a gradual decline in performance during long-term operation. This performance degradation is caused by a variety of complex factors, including the degradation of electrode materials, a loss of catalysts, mechanical damage to the membrane electrode assembly, and fluctuations in operating conditions [13,14]. Performance degradation not only affects the efficiency and output power of fuel cells, but also shortens their service life and increases maintenance and replacement costs [15]. Therefore, the accurate prediction of fuel cell performance degradation has important theoretical and practical significance [16].
At present, there are three methods for the prediction of fuel cell performance degradation: model-based methods, data-driven methods, and hybrid methods. Model-based methods generally establish models, including physical, semi-empirical, or empirical ones, which combine statistical and filtering methods for prediction [17]. M. Chandesris studied the degradation of the catalyst layer of proton exchange membrane fuel cells under various operating conditions, focusing on the effects of voltage, pressure, and humidity on the degradation rate. Through experimental methods such as electrochemical technology, post-analysis, fluoride release measurement, and other experimental methods, a semi-empirical model was proposed to quantitatively describe the impact of these factors on membrane degradation [18]. Mingyang Ou [19] proposed a prediction method based on a semi-empirical model to predict the performance degradation and remaining lifespan of proton exchange membrane fuel cells under automotive operating conditions. By introducing the degradation model of electrochemical surface area and equivalent resistance, a voltage prediction model was established and its accuracy was verified through experiments. Mathieu Bressel [20] proposed a lifespan prediction method for PEMFCs based on an extended Kalman filter to estimate the health state and remaining lifespan. Through simulation and experimental verifications, it can be proved this method can quickly and accurately predict the degradation trend and remaining service life of the fuel cells under various operating conditions. Since the fuel cell degradation is a multi-physics, multi-scale, multi-component, and multi-factor process, it is a complex and challenging task to establish an accurate degradation model.
The data-driven approach avoids the complex degradation mechanism of fuel cells and uses machine learning methods to establish a black box model to complete the prediction based on the fuel cell aging experimental data. At present, machine learning, especially deep learning, has been increasingly applied in the field of fuel cells. The common methods for the lifespan prediction of PEMFCs include long short-term memory (LSTM) neural network, gated recurrent unit (GRU) neural network, convolutional neural network (CNN), and echo state network (ESN). Chu Wang [21] generated navigation sequences through the ARIMAX model to improve the long-term prediction performance of LSTM, which has the best performance compared with the original LSTM, ESN, and nonlinear autoregressive exogenous input (NARX) models. Jian Zuo [22] combined LSTM and GRU with the attention mechanism to improve the accuracy of voltage degradation prediction under dynamic load cycles. The results show that the accuracy of this method is superior to that of the original LSTM and GRU methods. Khaled Benaggoune [23] adopted dilated CNN to predict the short-term and long-term performance degradation of fuel cells. The results showed that it was superior to LSTM in terms of accuracy and computing speed. Rania Mezzi [24] proposed a method based on ESN and Markov chain for predictions under dynamic load conditions. The results indicated that the remaining service life of fuel cells can be accurately predicted. Meanwhile, this method can achieve good prediction results even without prior knowledge of load configuration. Zhongliang Li [25] extracted health indicators under dynamic working conditions through a linear parameter change model and employed an integrated ESN model to improve the adaptability of ESN. The results demonstrated that this method can effectively predict the health status of fuel cells under different operating modes. Data-driven approaches generally have high requirements for data quality and require a large amount of data.
The hybrid method refers to the combination of the above two approaches to fully leverage the advantages of both. Daming Zhou [26] combined the empirical voltage degradation model and the neural network to predict the aging trend of fuel cells in the long term, which accurately described the local nonlinear characteristics of the degradation voltage in short and medium time ranges. The final results demonstrated that this method performed well in predicting both the long- and short-term voltage degradation trend of the fuel cells. Yujie Cheng [27] adopted least squares support vector machines for preliminary prediction and then used the regularized particle filter for processing. This method not only completed the prediction, but also provided the probability distribution of uncertainty. However, the hybrid method increased the complexity of the algorithm and also possessed higher requirements for the fusion strategies.
During the operation of the fuel cells, polarization curve testing, shutdown, and other operations will lead to the recovery phenomenon of the reversible voltage loss for the fuel cells, and the voltage will exhibit a segmented decrease characteristic. This poses great difficulties for the training and prediction of the model, and it is prone to learning the superimposed trend for the recovery of the reversible voltage loss and performance degradation, without reflecting the staged decline.
To address the above issues, this paper adopts the Transformer model for predicting the performance degradation of fuel cells. By utilizing the unique self-attention structure and masking mechanism of Transformer models, the signal for the recovery of the reversible voltage loss is adopted as the input for the model; in this way, the information known the voltage recovery does not interfere with the subsequent prediction. Ultimately, the prediction performance of the model is significantly improved. The main contributions of this paper are:
  • Taking the moment at which the recovery of the reversible voltage loss takes place as the boundary point, the fuel cell aging data are segmented and filtered to retain important information while filtering out noise effectively.
  • When the recovery of reversible voltage loss occurs, it is used as input for the model, and the information before the recovery of reversible voltage loss is masked, thereby improving the model performance.
  • The Transformer model is used to predict the performance degradation of fuel cells, and the influencing effects of the masking degree on the model performance are studied.
The remaining part of this paper is organized as follows: Section 2 introduces the method for predicting the performance degradation of fuel cells. Section 3 presents the experimental results and discussion, and Section 4 is the conclusion of this paper.

2. Method

2.1. Fuel Cell Aging Experiment

The fuel cell aging test/experimental data used in this paper were sourced from the IEEE 2014 Data Challenge [28]. The testing system used is shown in Figure 1, and both fuel cell stacks used in the test are composed of five single cells. Each cell has an active area of 100 cm 2 . The PEMFC stack is assembled with commercial membranes, gas diffusion layers, and machined flow distribution plates. The nominal current density of the cells is 0.7 A / cm 2 , and the maximum current density is 1 A / cm 2 .
The first fuel cell was operated under static conditions, with the current density maintained at 0.7 A / cm 2 , and other conditions were kept constant. In detail, the inlet and outlet flow rate of H 2 were 4.8 and 2.1 L/min, and the inlet and outlet flow rate of air were 23 and 21 L/min. Therefore, the main factor leading to voltage decay was the aging of the fuel cell, and voltage can be used as a health indicator. The fuel cell voltage throughout the entire experiment is shown in Figure 2. Meanwhile, polarization curve tests and electrochemical impedance spectroscopy tests were conducted on the fuel cell at 49, 186, 349, 516, 659, 824, and 992 h during the aging experiments. It can be seen that the recovery phenomenon of the reversible voltage loss for the fuel cells occurred at the corresponding moment of the voltage–time graph, and the degree of recovery became increasingly severe as the experiment progressed. Therefore, the voltage of the fuel cells exhibited the characteristics of phased decline over time. In addition, the first-order difference of the voltage is shown in Figure 2 as well. The first-order difference of voltage refers to the difference between the present voltage value and the voltage value at the previous time step, u ( t ) u ( t 1 ) , and it was employed to indicate the change in voltage. It can be observed that the differential value corresponding to the moment for the recovery of the reversible voltage loss is much larger than that at other moments. Therefore, by examining the difference, it is possible to verify whether the recovery of the reversible voltage loss has occurred.

2.2. Data Preprocessing

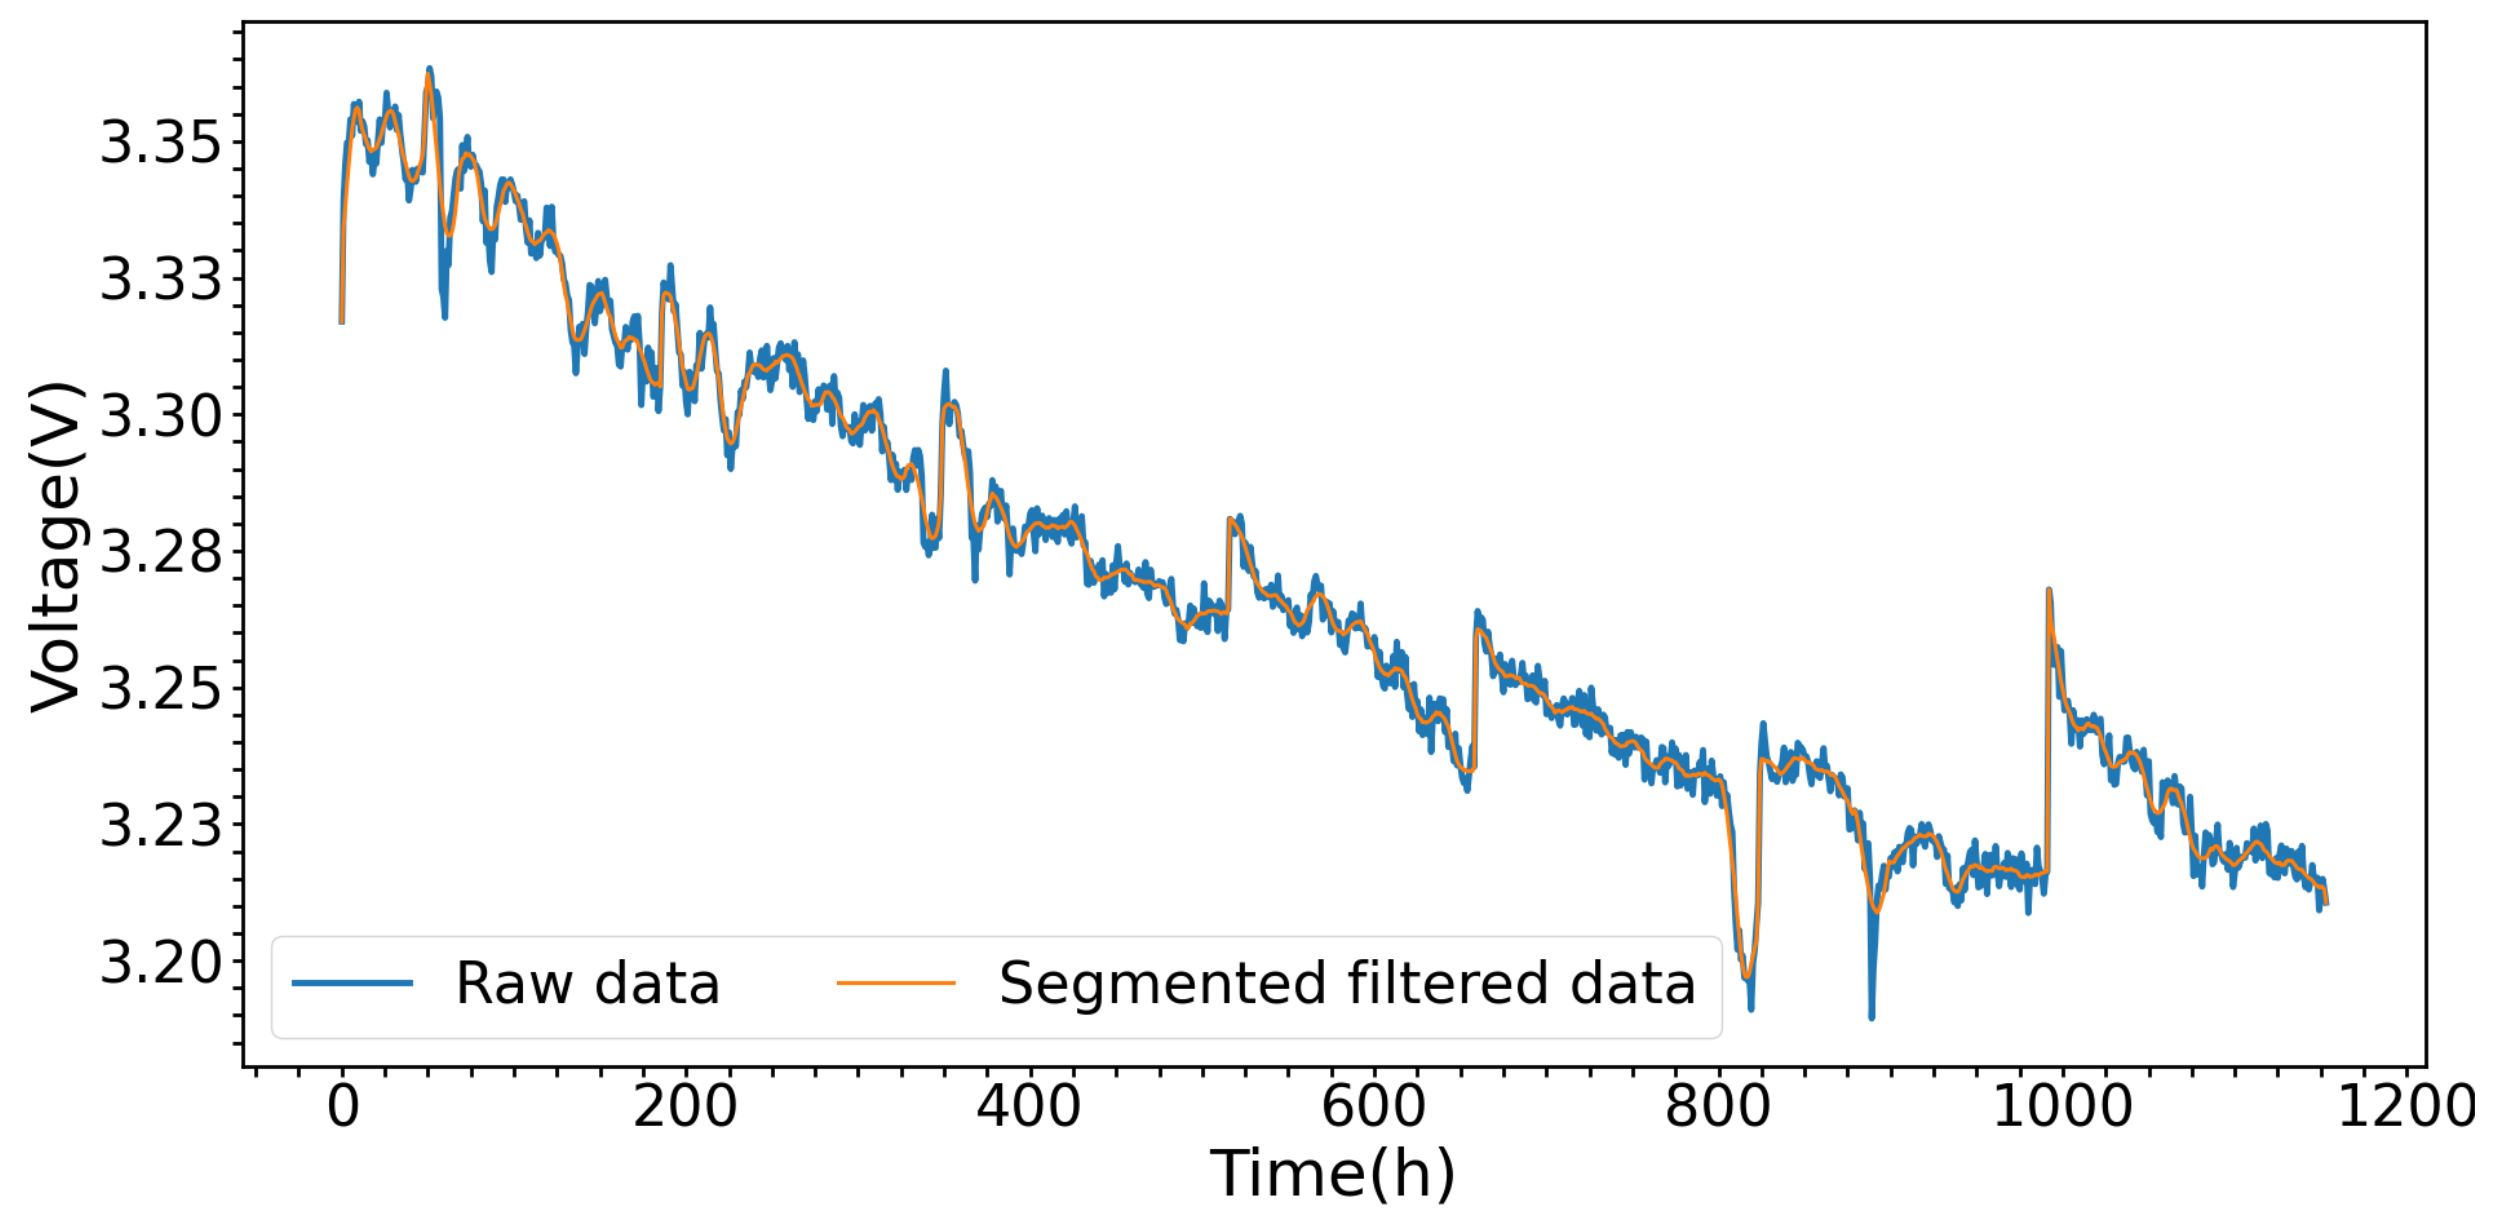
Since the performance degradation of fuel cells is a long-term process, the original voltage data were resampled at intervals of 1 h. Meanwhile, filtering is required to remove noise from the signal. However, if global filtering is performed directly, the signal near the moment when the recovery of the reversible voltage loss takes place will be improperly changed. Therefore, this paper uses the recovery time as the boundary point to perform segmented filtering on the signal. The Savitzky–Golay method was adopted for the filtering process, with a sliding window length of 20 h, and cubic function was selected as the fitting function. The results are shown in Figure 3.

2.3. Transformer

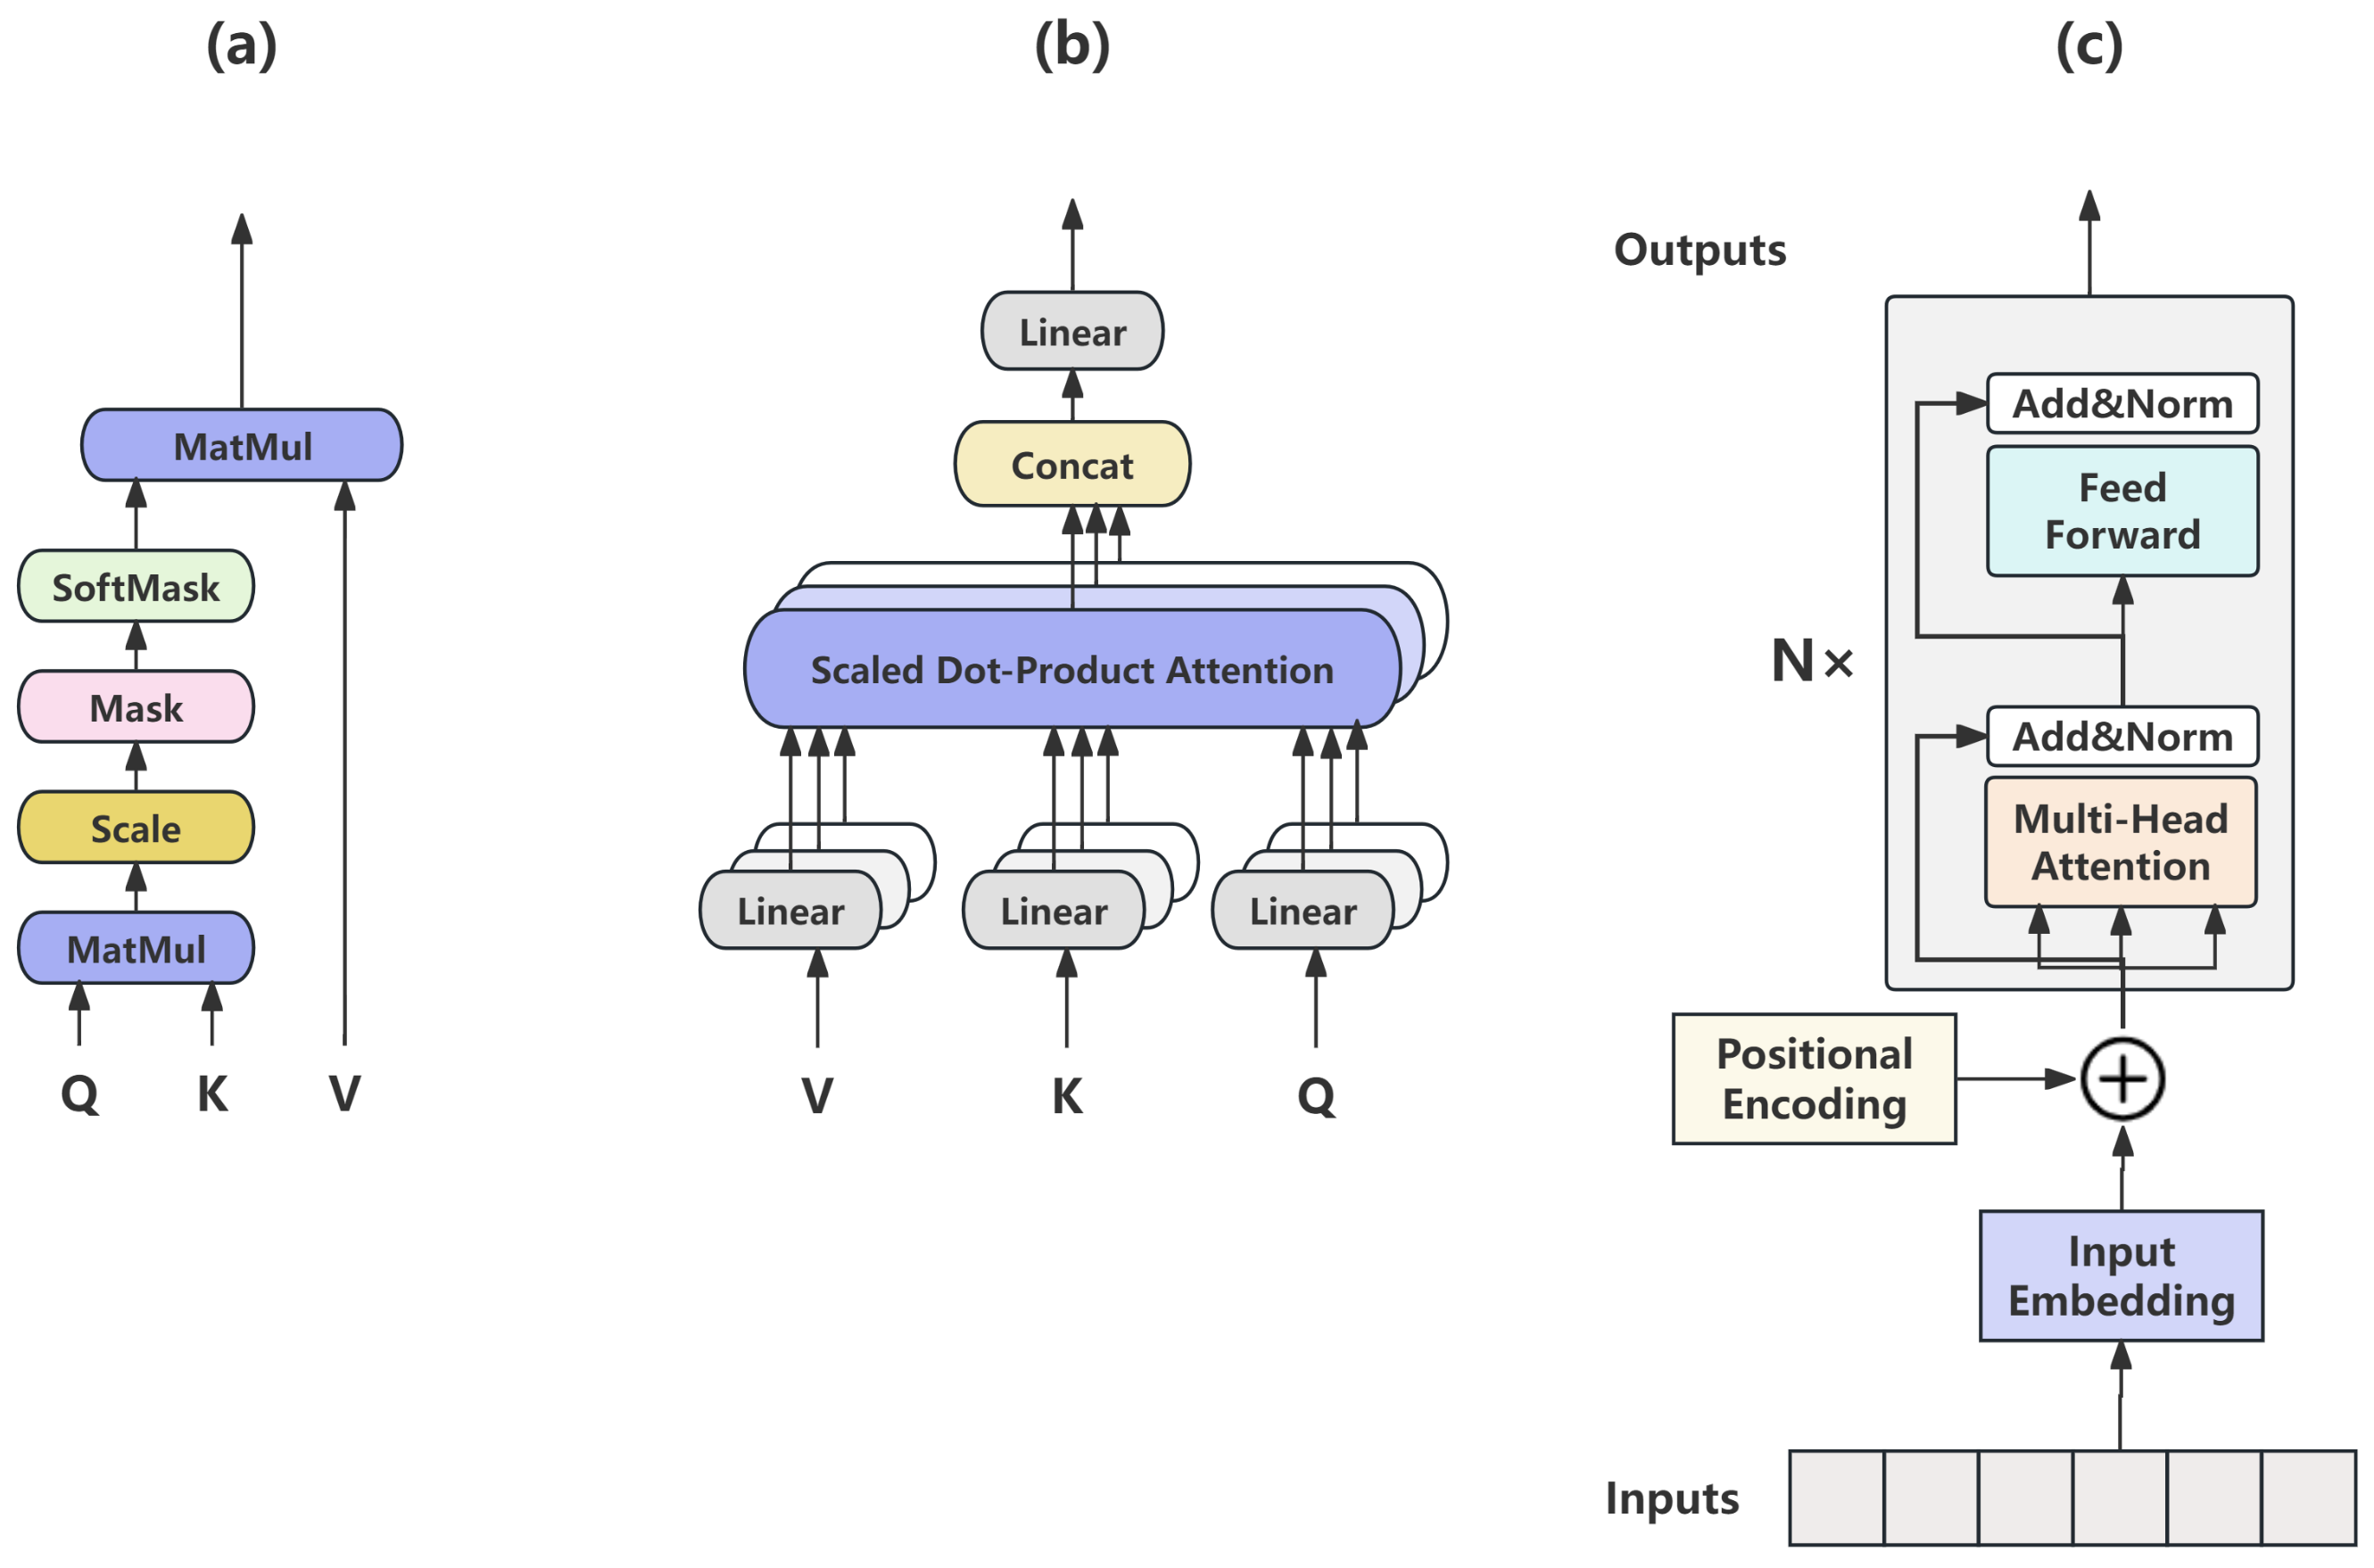
The Transformer model [29] was proposed by Google in 2017, and possesses a unique self-attention mechanism. The specific mechanism enables the model to efficiently perform parallel computing operations and effectively capture long-distance dependencies, achieving great success in fields such as NLP and time series prediction. Since the experimental data are limited, while the Transformer model requires a relatively large amount of data, only the encoder part of the Transformer is selected.
The structure of the Transformer encoder is shown in Figure 4c, and its core structure, the multi-head self-attention mechanism, is shown in Figure 4b. The concatenated multiple self-attention calculation results are shown in Figure 4a. The self-attention calculation formula is as follows:
a t t e n t i o n ( Q , K , V ) = s o f t m a s k ( Q K T d k ) V
where Q, K, and V correspond to the query matrix, key matrix, and value matrix, respectively, all of which are derived from the linear transformation of the input. d k is the dimension of K.
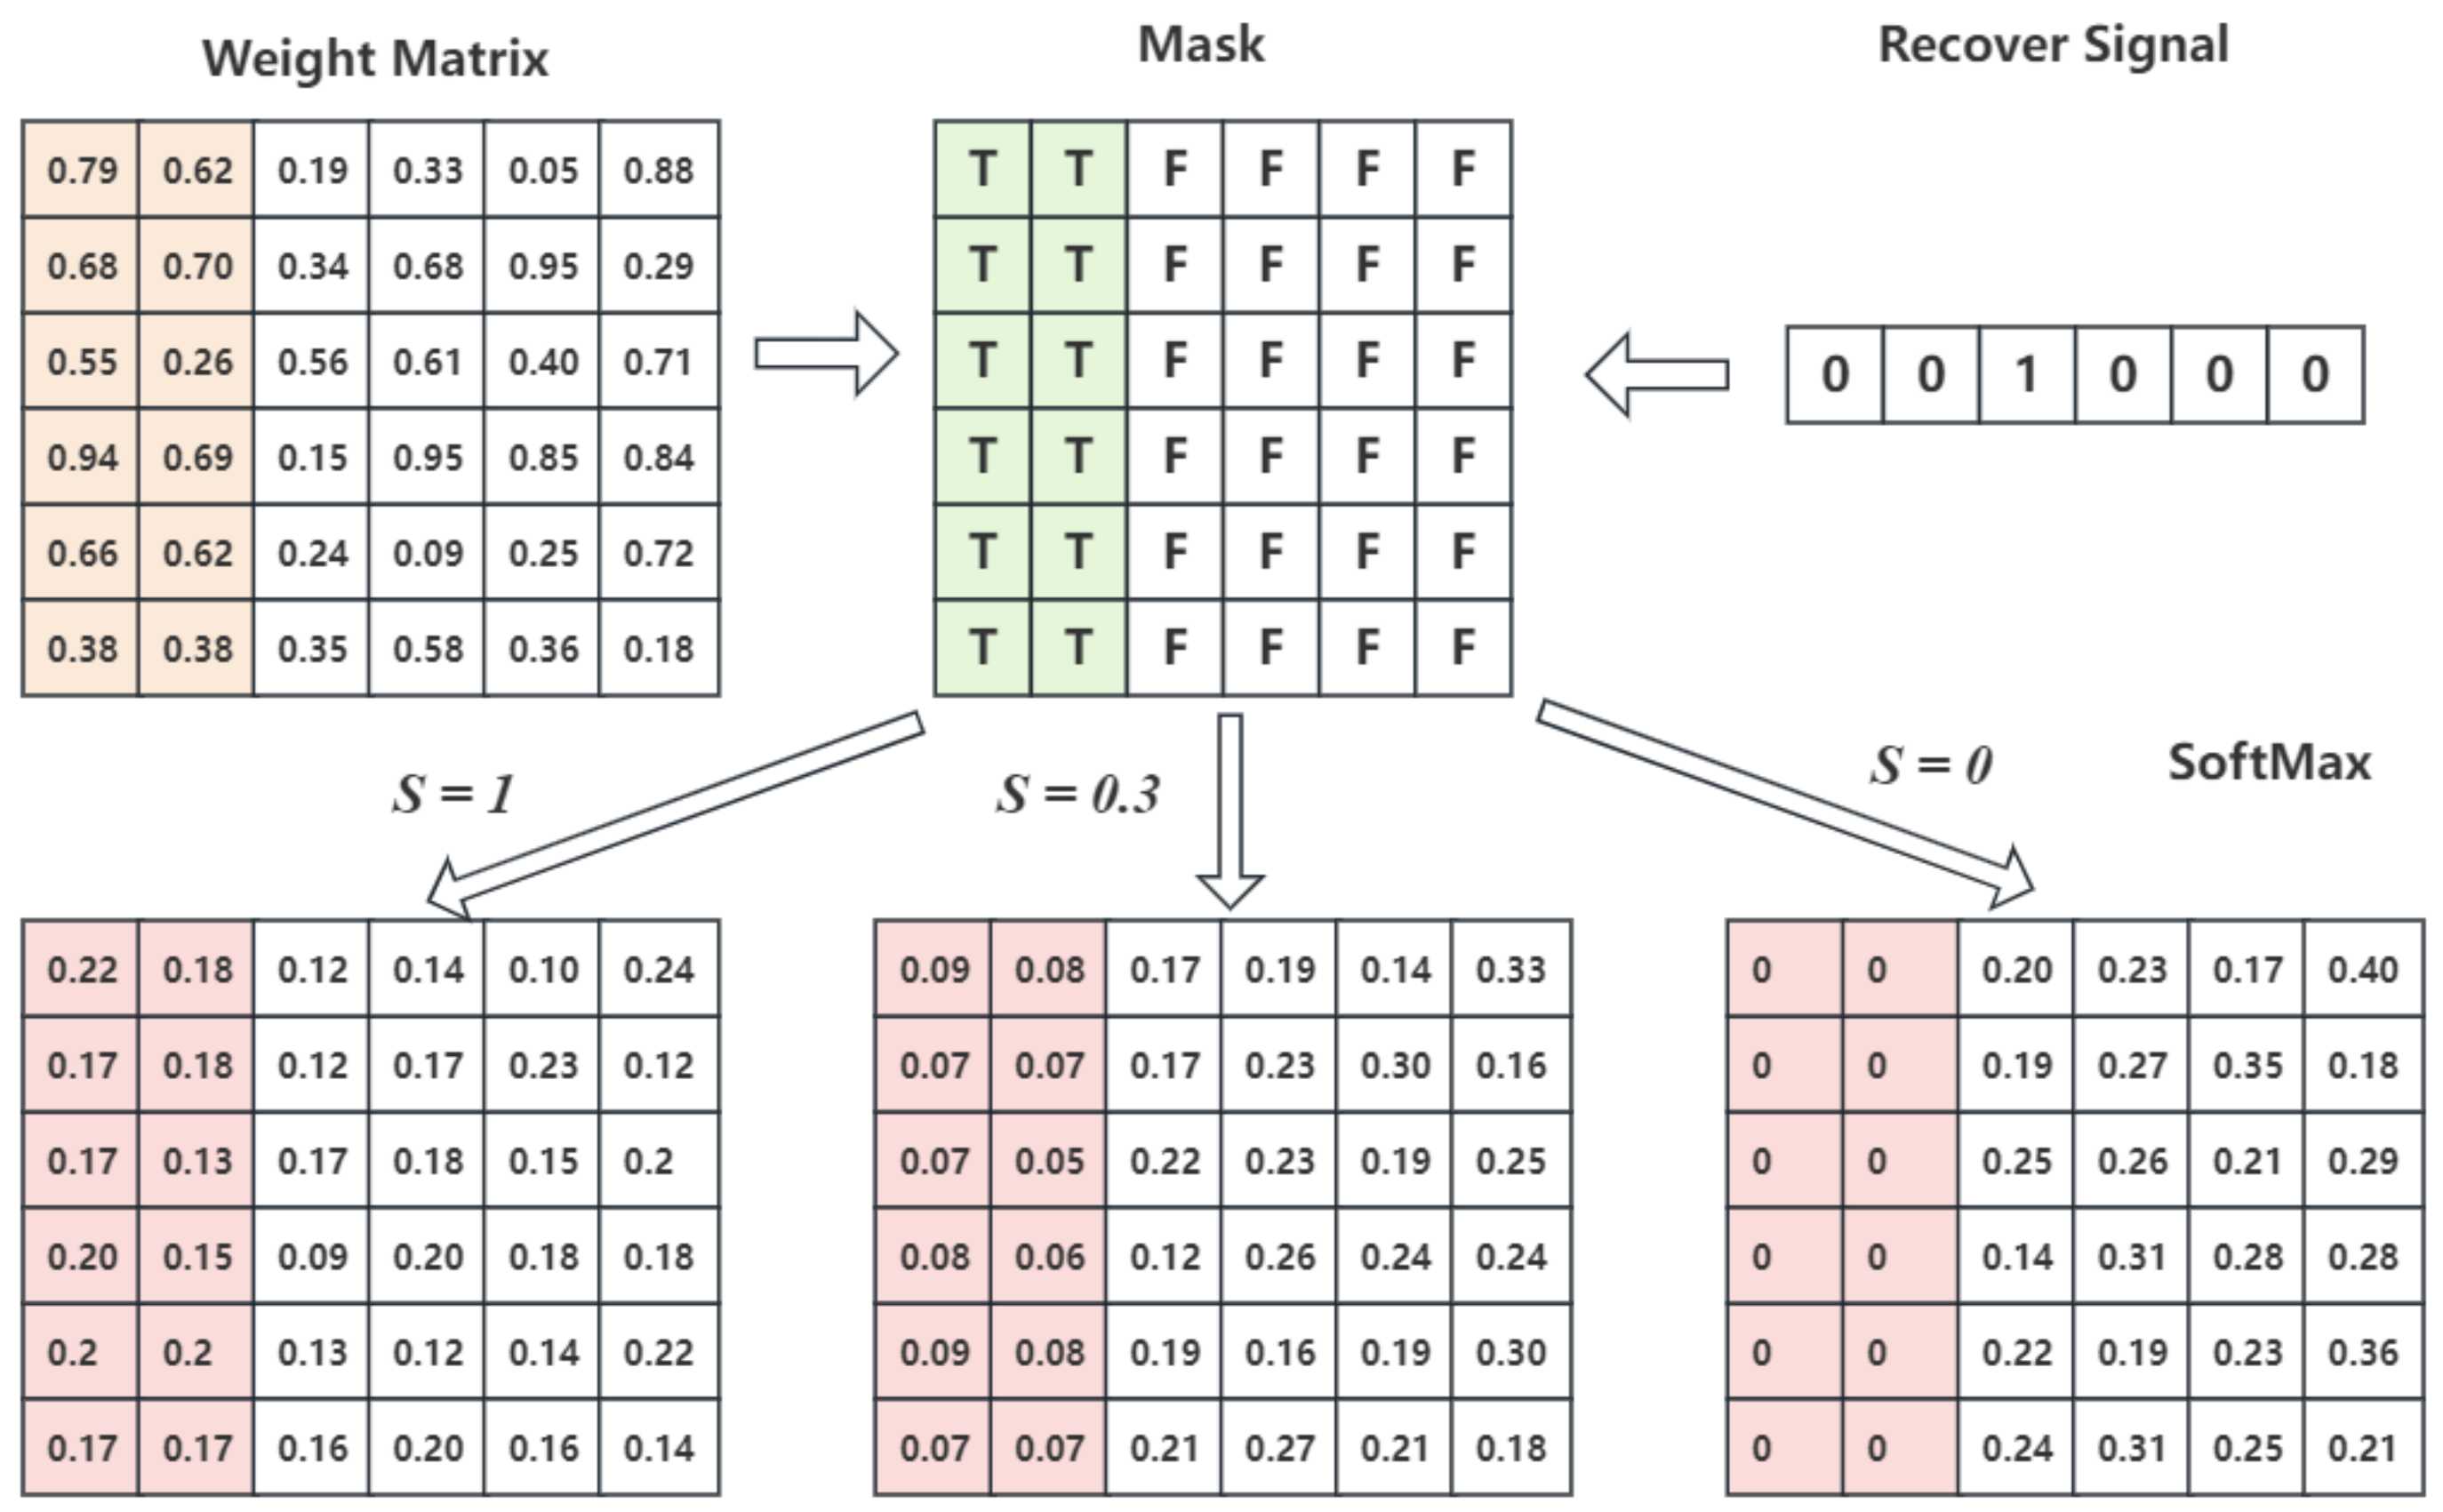
In NLP problems, padding is required to unify length due to the original input lengths being inconsistent. However, to prevent the model from considering the padding information, the weight matrix Q K T d k needs to be masked when passing through the attention mechanism. In this paper, due to the small correlation between the information before and after the recovery moment of the reversible voltage loss, the interference can be induced, and thus it is also necessary to mask the information before recovery. Therefore, this paper takes whether the voltage recovery occurs at each moment as the input signal. The corresponding signal value at the time of occurrence is set as 1; otherwise, it is set as 0. The mask is calculated by the recovery signal of the reversible voltage loss, and the process is shown in Figure 5. To investigate the impact of previous information retention on model performance, the corresponding calculation of the weight matrix at the masking point is as follows:
( Q K T d k ) i , j = ( Q K T d k ) i , j + l n ( s )
where s represents the degree of preservation, and when s 0 , it indicates that the information is completely masked. When s = 1 , it means that no masking is performed.
Since the self-attention mechanism is insensitive to the position information of the input sequence, it is necessary to encode each position of the input sequence and add it to the original information. The encoding formula is as follows:
P E p o s , 2 i = s i n ( p o s / 10000 2 i / d m o d e l )
P E p o s , 2 i + 1 = c o s ( p o s / 10000 2 i / d m o d e l )
where p o s represents the position of the sequence, i represents the dimensional position of the sequence, and d m o d e l represents the dimension of the input after embedding.

2.4. Model

The final design model of this paper is shown in Figure 6. The voltage is adopted as the input for the encoder after embedding and position encoding. The voltage recovery information corresponding to the input voltage is used to generate a mask and the output is passed into the multi-head attention structure inside the decoder. Since the phenomenon for recovery of the reversible voltage loss is a human intervention operation, it should be employed as input to the model. Meanwhile, to enable the linear layer to learn the voltage recovery value, the voltage data are directly passed through the linear layer. The output of the Transformer encoder is also added to the voltage recovery through the linear layer to obtain the final output.

2.5. Evaluation Indicators for Prediction Results

To evaluate the accuracy of the model for the prediction results in terms of performance degradation, this paper selects RMSE, MAE, and MAPE as indicators. The calculation formula is as follows:
RMSE = 1 N i = 1 N ( y i y ^ i ) 2
MAE = 1 N i = 1 N | y i y ^ i |
MAPE = 1 n i = 1 n y i y ^ i y i × 100 %
where N is the predicted voltage sequence length, y ^ i is the predicted voltage, and y i is the true voltage, value.

3. Results and Discussion

The performance degradation of fuel cells is a complex process involving the degradation of multiple components such as catalysts, membrane electrode assemblies, gas diffusion layers, and bipolar plates. Catalyst particles may agglomerate and dissolve during operation, leading to a decrease in surface area and catalytic activity. Proton exchange membranes are susceptible to chemical degradation and mechanical stress during long-term use, resulting in microcracks and decreased mechanical properties. Moreover, operating conditions such as relative humidity, temperature, and start–stop cycles also have a significant impact on the fuel cell performance. These factors interact with each other and cause fuel cells to gradually degrade during operation. Meanwhile, during the startup and shutdown process of the fuel cell, a brief voltage recovery phenomenon may occur. This is because the startup and shutdown process can help remove accumulated substances on the electrode surface or redistribute reactants, temporarily improving fuel cell performance. During the operation, the catalyst surface may be covered with contaminants or oxidized after long-term operation, which will reduce its catalytic activity. Through polarization curve testing or pulse voltage operation, these contaminants can be removed or the catalyst surface state can be modified so that the catalysts can be reactivated and the voltage can be increased/recovered.
Since the voltage of the fuel cell is constantly declining, directly selecting the voltage as the target will result in the range of the training set and the test set being completely separated, increasing the difficulty of model prediction. Therefore, this paper chooses the difference between the predicted value and the corresponding voltage at the last moment of the input as the output target. It should be noted that the voltage of fuel cells undergoes a severe recovery phenomenon after 1000 h, which has no predictive significance. Therefore, the data before 1000 h are selected as the research object. The prediction process adopts the training set to train the model, and then completes the performance degradation prediction within the entire test set according to the multi-step rolling prediction strategy.

3.1. The Influence of Masking Degree s on Model Prediction Results

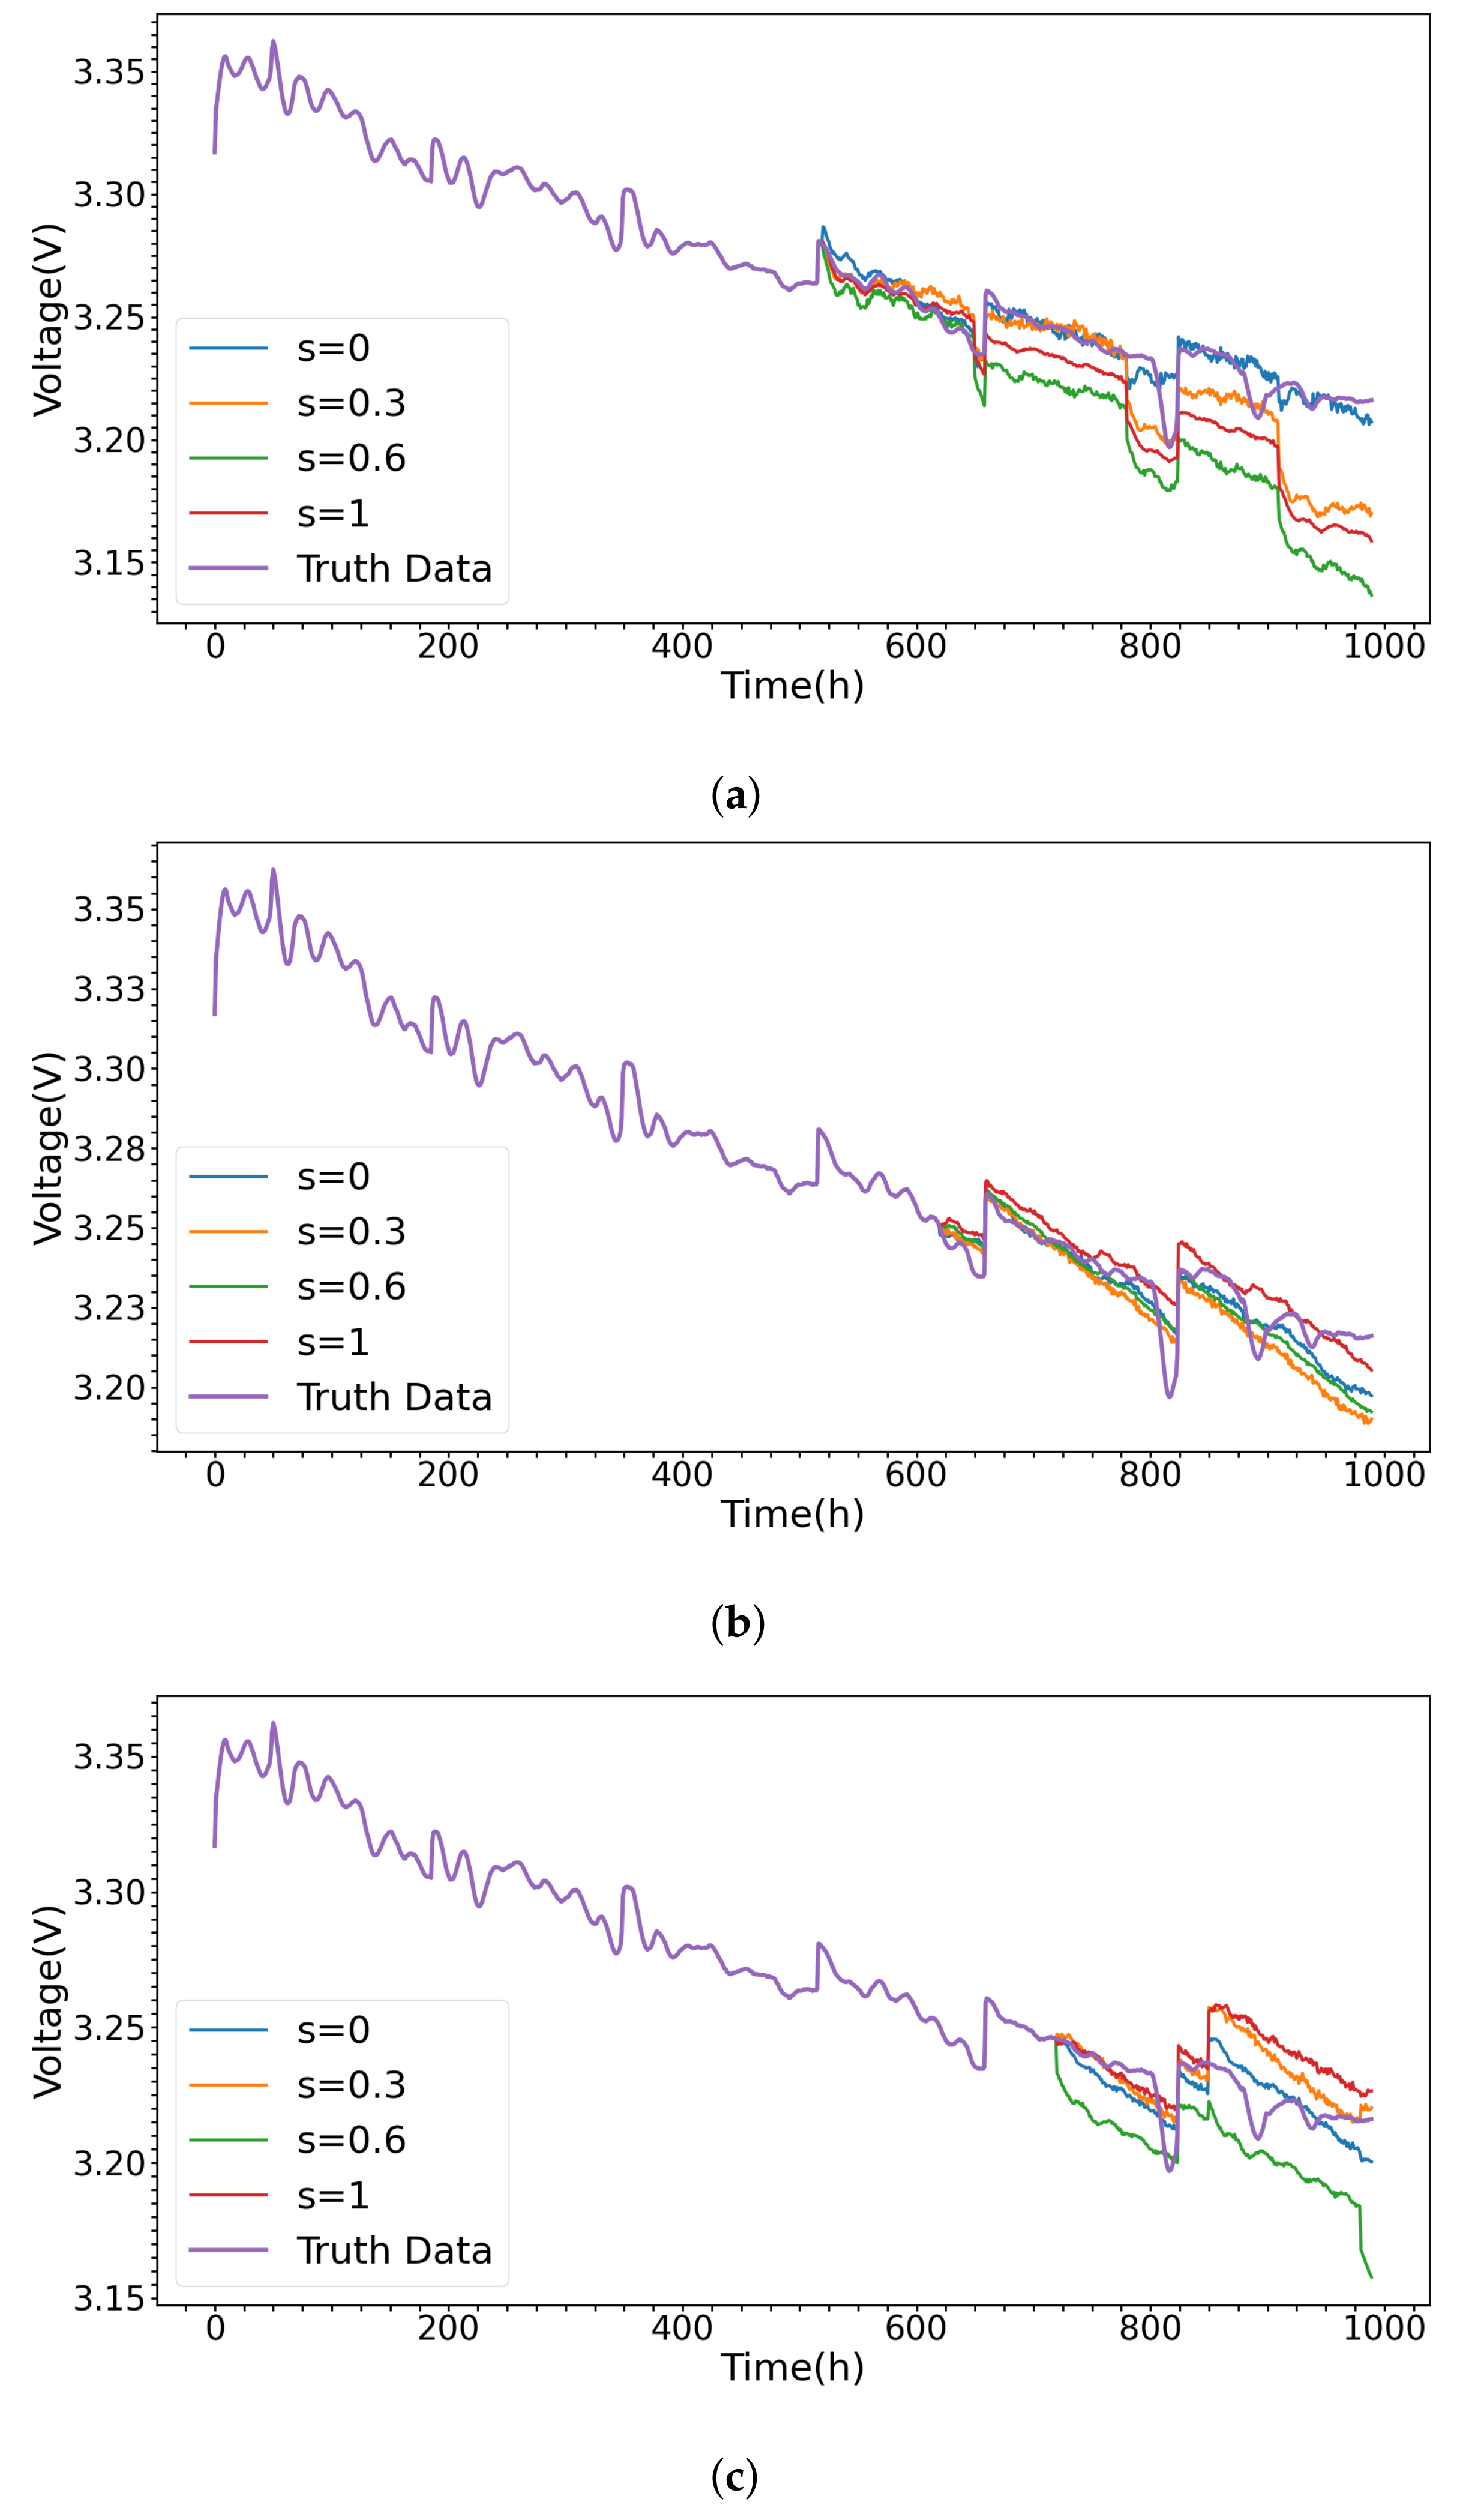
To investigate the extent to which the information before the recovery moment of the reversible voltage loss should be retained, the retention degree s is set to 0, 0.3, 0.6, or 1, respectively. Meanwhile, 520 h, 620 h, and 720 h are selected as the boundary points, and the period before the cut-off point is used as the training set. Furthermore, the period after the cut-off point is used as the test set. Finally, the prediction results of the performance degradation are shown in Figure 7. The errors between the prediction results and the true values are shown in Table 1.
From Figure 7, it can be observed that since the model is provided with the predicted time when the recovery of the reversible voltage loss occurs within the prediction range, each model is able to predict the characteristics of the voltage stages and the recovery phenomenon at the corresponding time. Nevertheless, when the model input includes voltage recovery, this may bring various degrees of interference to the model prediction since different masking degrees are set for the data before recovery. It can be found that when it is completely masked, i.e., s 0 , the model does not focus on the information before the voltage recovery, and the prediction results of performance degradation are closest to the true values.
Meanwhile, observing the error results of each prediction in the table, it can be found that starting from 520 h, the prediction errors of s 0 are the smallest, and the RMSE, MAE, and MAPE are 0.006, 0.004, and 0.001, respectively. The prediction result with s = 0.6 possesses the highest number of errors. When predicting from 620 h onwards, the errors of the model are reduced due to the increase in the training set. The prediction errors of s 0 are still the smallest, and the errors of s = 0.3 are currently the largest. When predicting from 720 h onwards, the prediction errors are the smallest for s 0 , and the errors become the largest again for s = 0.6 . Hence, due to the uncertainty of interference, the degree of retention corresponding to the maximum error constantly changes, but the complete masked situations always maintain the minimum errors and have the best prediction results for the performance degradation.
This verifies the significance of completely masking the data before voltage recovery in this paper, indicating that due to the polarization curve test operation of the fuel cell, the internal state has been redistributed and the surface state of the catalyst has been changed. The voltage information before the operation is not beneficial for subsequent predictions.

3.2. Comparison of Predictive Performance for Different Models

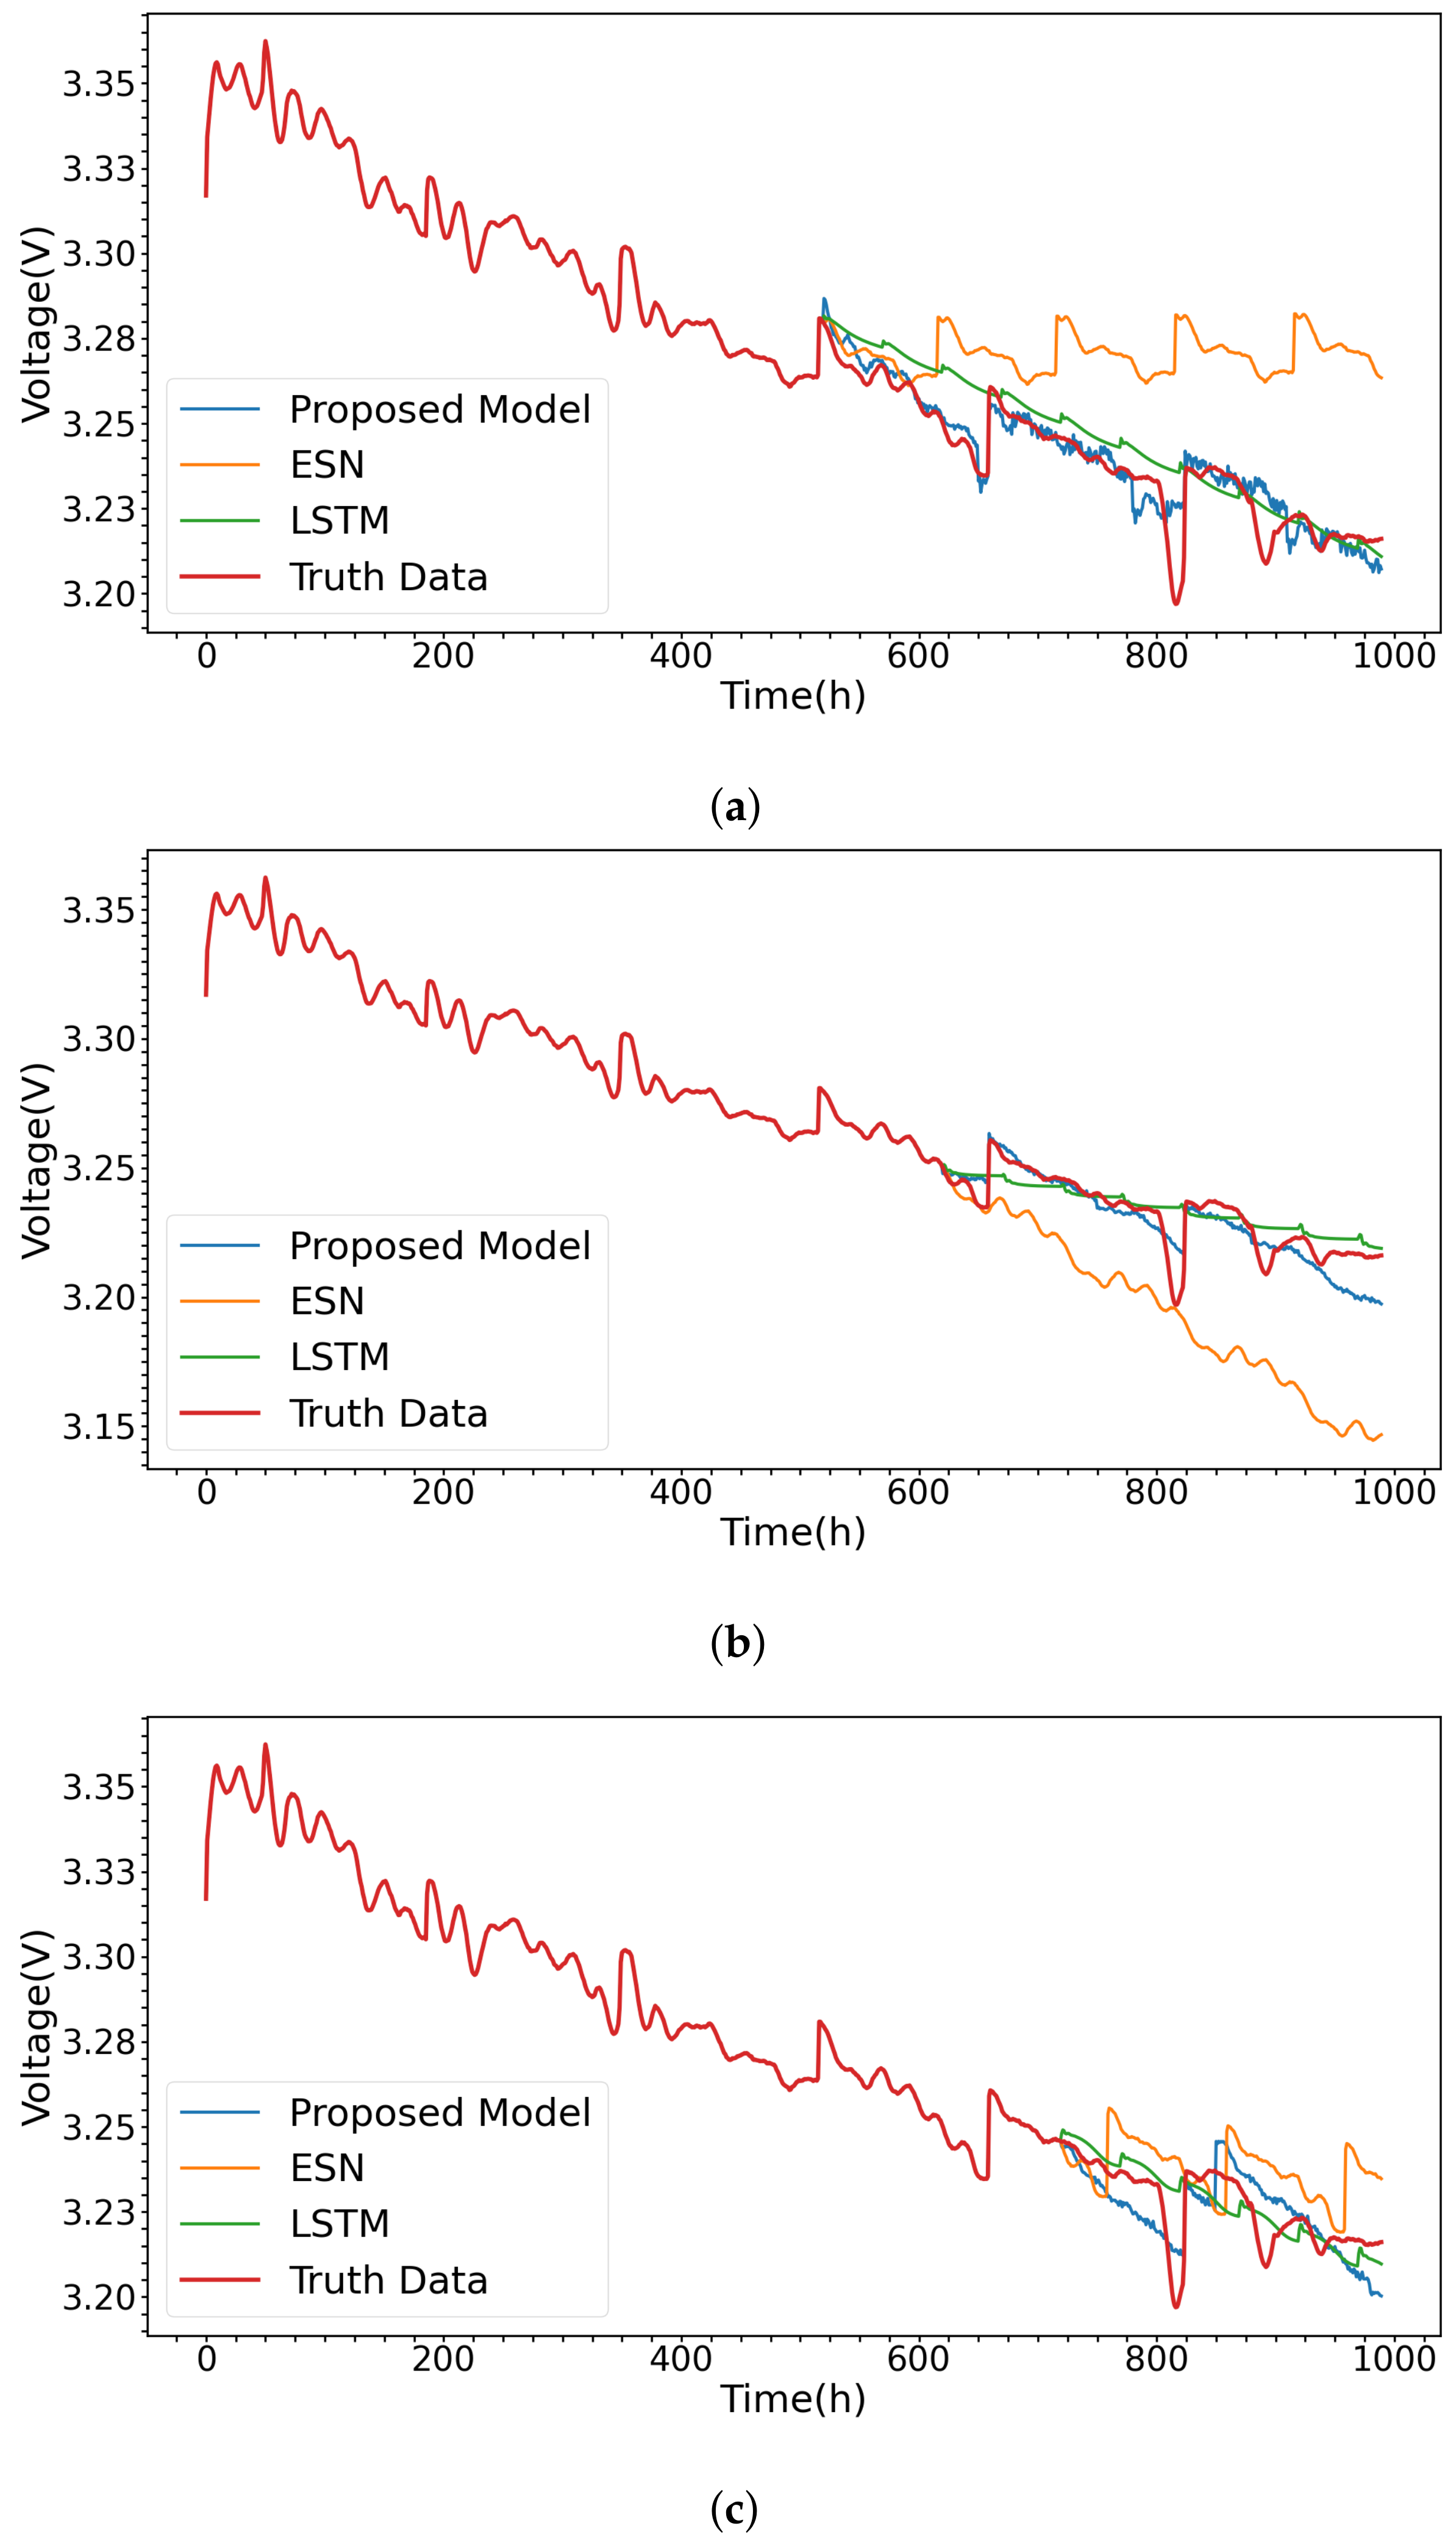
To verify the accuracy of the model proposed in this paper, the LSTM models under the ESN and Seq2Seq frameworks were used to make predictions according to the same training set and test set. 520 h, 620 h, and 720 h were selected as the boundary points. The data before the boundary points were used as the training set, and the data after the boundary points were used as the test set. Finally, the prediction results of performance degradation are shown in Figure 8. The errors between the prediction results and the true values are shown in Table 2.
When the prediction starts from 520 h, the prediction results of the proposed model, including RMSE, MAE, and MAPE, are the smallest among the three models. In Figure 8a, ESN fails to predict the correct decay trend due to interference at the predicted starting point near the voltage recovery. Although the prediction results contain fluctuation characteristics similar to voltage recovery, the prediction of the recovery time is not accurate due to the unknown voltage recovery time. LSTM can predict the correct degradation trend, but this is the superposition of the aging and voltage recovery of the fuel cell performance and does not reflect the trend of accelerated performance degradation of the fuel cell in the later stage. The prediction results of the model proposed in this paper are almost consistent with the real data, demonstrating excellent performance.
When predicting from 620 h, the RMSE, MAE, and MAPE of the LSTM model are 0.009, 0.006, and 0.002, respectively. The RMSE, MAE, and MAPE of the proposed model are 0.007, 0.005, and 0.001, respectively. The errors of the two are very close, and lower than the errors of ESN. To further compare the performance of the prediction results, it is necessary to analyze according to the information in the figure. In Figure 8b, both ESN and LSTM predict that the fuel cell performance is constantly declining, while LSTM is, relatively speaking, closer to the actual result. The model proposed in this paper successfully predicts the staged decline characteristics of the fuel cells. Meanwhile, the proposed model can also predict the acceleration degradation characteristics of fuel cell performance, and thus it has the best performance.
When predicting from 720 h onwards, the prediction errors of the three models basically decrease as the content of the dataset is enriched. The RMSE, MAE, and MAPE of the LSTM model are 0.009, 0.006, and 0.002, respectively. The RMSE, MAE, and MAPE of the proposed model are 0, 0.008, 0.007, and 0.002, respectively. The above-mentioned errors still remain lower than the prediction errors of ESN. In Figure 8c, the fuel cell voltage performance deteriorates sharply around 800h. The accurate prediction for this situation is of great significance for the health management of fuel cells [30]. It is found that only the model proposed in this paper predicts this sharp decline result accurately.
In summary, based on the reported error values in Table 2, the model proposed in this paper demonstrates the best prediction results, which can avoid information interference before voltage recovery and accurately predict the subsequent voltage recovery phenomena. It grasps the characteristics of the segmented degradation of fuel cell performance and the trend of accelerated degradation in the later stage precisely, providing reliable support for early intervention in fuel cell failures.

4. Conclusions

This paper proposes a prediction method for fuel cell performance degradation based on the Transformer model. Through segmented filtering and masking mechanisms, the interference which appeared during the recovery phenomenon of the reversible voltage loss on model prediction is effectively solved. Experimental results show that this method can significantly improve the prediction accuracy and successfully predict the staged decline characteristics of fuel cell performance. The model performance under different masking levels verifies the effectiveness of completely masking the data before voltage recovery. In addition, compared with the traditional ESN and LSTM models, the Transformer model proposed in this paper shows better prediction results in terms of fuel cell performance degradation, and can capture the variation trend of PEMFC performance degradation more accurately, especially in dangerous situations of severe performance degradation. In summary, the method proposed in this paper has important application value in fuel cell health management and performance prediction.

Author Contributions

Conceptualization, X.M. and J.M.; methodology, X.M.; software, X.M., J.M. and X.T.; validation, X.M. and X.T.; formal analysis, X.M.; investigation, X.M. and J.J.; resources, C.S.; data curation, X.M., J.M. and X.T.; writing—original draft preparation, X.M. and C.S.; writing—review and editing, X.M., C.S., J.J. and X.T.; visualization, X.M.; supervision, C.S., J.J. and K.S.; project administration, C.S. and K.S.; funding acquisition, C.S. and K.S. All authors have read and agreed to the published version of the manuscript.

Funding

This work was supported in part by the National Natural Science Foundation of China under Grant 52238002, in part by the Fundamental Research Funds for the Central Universities under Grant 2022FRFK060001, and by the Digital Power Grid Fund of CSG under Grant DPGCSG-2024-KF-25. The authors also acknowledge the 2023 Youth Talent Introduction Scientific Research Startup Fee (Grant No. AUGA2160100623) and 2023 Support Funds for Talent Introduction in Heilongjiang Province (Grant No. AUGA2160501723) provided by the Harbin Institute of Technology.

Data Availability Statement

The data presented in this study are available on request from the corresponding author, since the data are not publicly available due to privacy or ethical restrictions.

Conflicts of Interest

The authors declare no conflicts of interest.

References

  1. Yan, S.; Yang, M.; Sun, C.; Xu, S. Liquid water characteristics in the compressed gradient porosity gas diffusion layer of proton exchange membrane fuel cells using the lattice boltzmann method. Energies 2023, 16, 6010. [Google Scholar] [CrossRef]
  2. Zhang, X.; Yu, Z.; Chen, W. Life prediction based on ds elm for pemfc. Energies 2019, 12, 3752. [Google Scholar] [CrossRef]
  3. Barzegari, M.M.; Rahgoshay, S.M.; Mohammadpour, L.; Toghraie, D. Performance prediction and analysis of a dead-end pemfc stack using data-driven dynamic model. Energy 2019, 188, 116049. [Google Scholar] [CrossRef]
  4. Tang, X.; Yang, M.; Shi, L.; Hou, Z.; Xu, S.; Sun, C. Adaptive state-of-health temperature sensitivity characteristics for durability improvement of pem fuel cells. Chem. Eng. J. 2024, 491, 151951. [Google Scholar] [CrossRef]
  5. Ma, R.; Xie, R.; Xu, L.; Huangfu, Y.; Li, Y. A hybrid prognostic method for pemfc with aging parameter prediction. IEEE Trans. Transp. Electrif. 2021, 7, 2318–2331. [Google Scholar] [CrossRef]
  6. Li, H.; Liu, L.; Zhang, L.; Xie, L.; Chen, Q. A fusion intelligent degradation interval prediction method based on hybrid health indicator for proton exchange membrane fuel cells. IEEE Trans. Transp. Electrif. 2024, in press. [CrossRef]
  7. Zhang, H.; Sun, C. Cost-effective iron-based aqueous redox flow batteries for large-scale energy storage application: A review. J. Power Sources 2021, 493, 229445. [Google Scholar] [CrossRef]
  8. Tang, X.; Zhang, Y.; Xu, S. Temperature sensitivity characteristics of pem fuel cell and output performance improvement based on optimal active temperature control. Int. J. Heat Mass Transf. 2023, 206, 123966. [Google Scholar] [CrossRef]
  9. Rao, M.; Wang, L.; Chen, C.; Xiong, K.; Li, M.; Chen, Z.; Dong, J.; Xu, J.; Li, X. Data-driven state prediction and analysis of sofc system based on deep learning method. Energies 2022, 15, 3099. [Google Scholar] [CrossRef]
  10. Kanani, H.; Shams, M.; Hasheminasab, M.; Bozorgnezhad, A. Model development and optimization of operating conditions to maximize pemfc performance by response surface methodology. Energy Convers. Manag. 2015, 93, 9–22. [Google Scholar] [CrossRef]
  11. Wang, T.; Zhou, H.; Zhu, C. A short-term and long-term prognostic method for pem fuel cells based on gaussian process regression. Energies 2022, 15, 4844. [Google Scholar] [CrossRef]
  12. Tang, X.; Zhang, Y.; Xu, S. Experimental study of pem fuel cell temperature characteristic and corresponding automated optimal temperature calibration model. Energy 2023, 283, 128456. [Google Scholar] [CrossRef]
  13. Mayur, M.; Gerard, M.; Schott, P.; Bessler, W.G. Lifetime prediction of a polymer electrolyte membrane fuel cell under automotive load cycling using a physically-based catalyst degradation model. Energies 2018, 11, 2054. [Google Scholar] [CrossRef]
  14. Xiao, L.; Bian, M.; Sun, Y.; Yuan, J.; Wen, X. Transport properties evaluation of pore-scale gdls for pemfc using orthogonal design method. Appl. Energy 2024, 357, 122445. [Google Scholar] [CrossRef]
  15. Jia, C.; He, H.; Zhou, J.; Li, K.; Li, J.; Wei, Z. A performance degradation prediction model for pemfc based on bi-directional long short-term memory and multi-head self-attention mechanism. Int. J. Hydrogen Energy 2024, 60, 133–146. [Google Scholar] [CrossRef]
  16. Zhao, J.; Li, S.; Tu, Z. Development of practical empirically and statistically-based equations for predicting the temperature characteristics of pemfc applied in the cchp system. Int. J. Hydrogen Energy 2024, 52, 894–904. [Google Scholar] [CrossRef]
  17. Hua, Z.; Zheng, Z.; Pahon, E.; Péra, M.-C.; Gao, F. A review on lifetime prediction of proton exchange membrane fuel cells system. J. Power Sources 2022, 529, 231256. [Google Scholar] [CrossRef]
  18. Chandesris, M.; Vincent, R.; Guetaz, L.; Roch, J.-S.; Thoby, D.; Quinaud, M. Membrane degradation in pem fuel cells: From experimental results to semi-empirical degradation laws. Int. J. Hydrogen Energy 2017, 42, 8139–8149. [Google Scholar] [CrossRef]
  19. Ou, M.; Zhang, R.; Shao, Z.; Li, B.; Yang, D.; Ming, P.; Zhang, C. A novel approach based on semi-empirical model for degradation prediction of fuel cells. J. Power Sources 2021, 488, 229435. [Google Scholar] [CrossRef]
  20. Bressel, M.; Hilairet, M.; Hissel, D.; Bouamama, B.O. Extended kalman filter for prognostic of proton exchange membrane fuel cell. Appl. Energy 2016, 164, 220–227. [Google Scholar] [CrossRef]
  21. Wang, C.; Li, Z.; Outbib, R.; Dou, M.; Zhao, D. A novel long short-term memory networks-based data-driven prognostic strategy for proton exchange membrane fuel cells. Int. J. Hydrogen Energy 2022, 47, 10395–10408. [Google Scholar] [CrossRef]
  22. Zuo, J.; Lv, H.; Zhou, D.; Xue, Q.; Jin, L.; Zhou, W.; Yang, D.; Zhang, C. Deep learning based prognostic framework towards proton exchange membrane fuel cell for automotive application. Appl. Energy 2021, 281, 115937. [Google Scholar] [CrossRef]
  23. Benaggoune, K.; Yue, M.; Jemei, S.; Zerhouni, N. A data-driven method for multi-step-ahead prediction and long-term prognostics of proton exchange membrane fuel cell. Appl. Energy 2022, 313, 118835. [Google Scholar] [CrossRef]
  24. Mezzi, R.; Yousfi-Steiner, N.; Péra, M.C.; Hissel, D.; Larger, L. An echo state network for fuel cell lifetime prediction under a dynamic micro-cogeneration load profile. Appl. Energy 2021, 283, 116297. [Google Scholar] [CrossRef]
  25. Li, Z.; Zheng, Z.; Outbib, R. Adaptive prognostic of fuel cells by implementing ensemble echo state networks in time-varying model space. IEEE Trans. Ind. Electron. 2019, 67, 379–389. [Google Scholar] [CrossRef]
  26. Zhou, D.; Gao, F.; Breaz, E.; Ravey, A.; Miraoui, A. Degradation prediction of pem fuel cell using a moving window based hybrid prognostic approach. Energy 2017, 138, 1175–1186. [Google Scholar] [CrossRef]
  27. Cheng, Y.; Zerhouni, N.; Lu, C. A hybrid remaining useful life prognostic method for proton exchange membrane fuel cell. Int. J. Hydrogen Energy 2018, 43, 12314–12327. [Google Scholar] [CrossRef]
  28. Gouriveau, R.; Hilairet, M.; Hissel, D.; Jemei, S.; Jouin, M.; Lechartier, E.; Morando, S.; Pahon, E.; Pera, M.C.; Zerhouni, N. IEEE phm 2014 data challenge: Outline, experiments, scoring of results, winners. In Proceedings of the IEEE Conference on Prognostics and Health Management, Cheney, WA, USA, 22–25 June 2014; pp. 1–6. [Google Scholar]
  29. Vaswani, A.; Shazeer, N.; Parmar, N.; Uszkoreit, J.; Jones, L.; Gomez, A.N.; Polosukhin, I.; Kaiser, Ł. Attention is all you need. Adv. Neural Inf. Process. Syst. 2017, 30. [Google Scholar]
  30. Tang, X.; Shi, L.; Zhang, Y.; Li, B.; Xu, S.; Song, Z. Degradation adaptive energy management strategy for FCHEV based on the Rule-DDPG method: Tailored to the current SOH of the powertrain. IEEE Trans. Transp. Electrif. 2024, in press. [CrossRef]
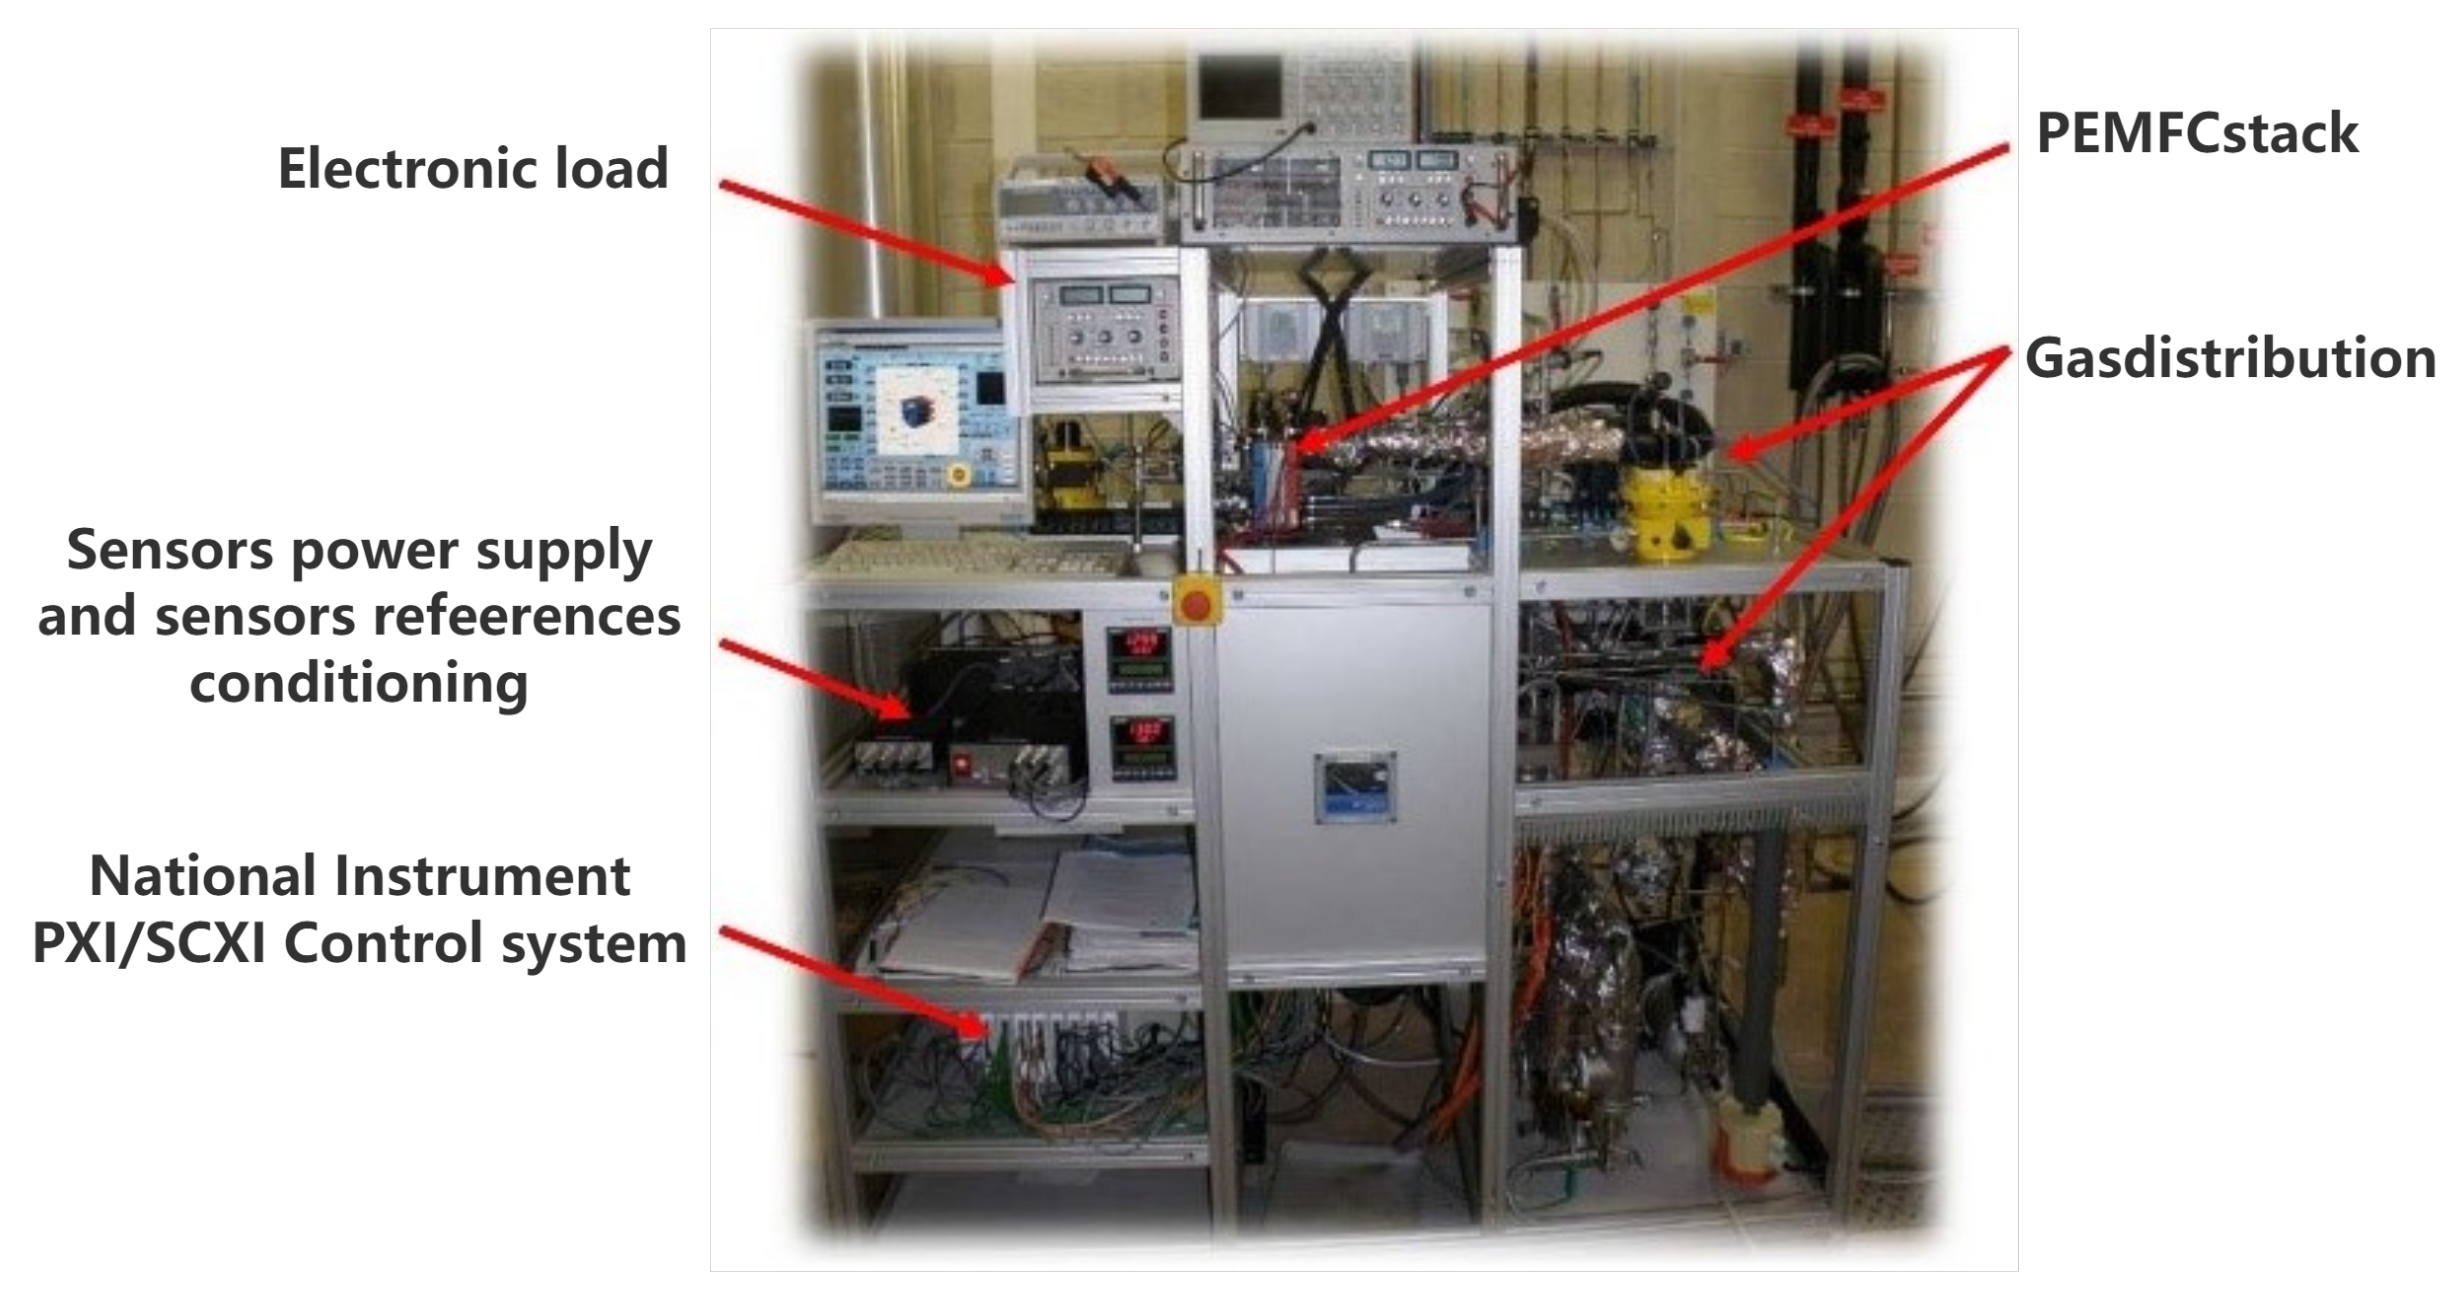
Figure 1. Fuel cell testing system [28].
Energies 17 03050 g001
Figure 2. The relationship between time versus fuel cell voltage and time versus first-order difference of voltage.
Energies 17 03050 g002
Figure 3. Voltage signal after segmented filtering.
Energies 17 03050 g003
Figure 4. (a) Scaled dot-product attention. (b) Multi-head attention. (c) Transformer encoder.
Energies 17 03050 g004
Figure 5. Mask process: 0 and 1 represent no occurrence or recovery of the reversible voltage loss at time T, and F represents whether masking is needed or not in that area.
Energies 17 03050 g005
Figure 6. The proposed degradation prediction model of fuel cell performance.
Energies 17 03050 g006
Figure 7. Performance degradation prediction results for different degrees of masking s. (a) Starting from 520 h for prediction. (b) Starting from 620 h for prediction. (c) Starting from 720 h for prediction.
Energies 17 03050 g007
Figure 8. Prediction results of performance degradation for different models. (a) Starting from 520 h for prediction. (b) Starting from 620 h for prediction. (c) Starting from 720 h for prediction.
Energies 17 03050 g008
Table 1. Errors of the prediction results according to different starting point times and different degrees of masking s.
Start Point Time520 h620 h720 h
s RMSEMAEMAPERMSEMAEMAPERMSEMAEMAPE
00.0060.0040.0010.0070.0050.0010.0080.0070.002
0.30.0200.0140.0040.0110.0080.0030.0130.0090.003
0.60.0370.0300.0090.0090.0070.0020.0230.0210.007
10.0260.0200.0060.0080.0060.0020.0170.0130.004
Table 2. Errors of prediction results according to different starting point times and different models.
Start Point Time520 h620 h720 h
ModelRMSEMAEMAPERMSEMAEMAPERMSEMAEMAPE
Proposed0.0060.0040.0010.0070.0050.0010.0080.0070.002
ESN0.0360.0320.0100.0420.0370.0110.0170.0140.004
LSTM0.0110.0080.0030.0090.0060.0020.0090.0060.002
Disclaimer/Publisher’s Note: The statements, opinions and data contained in all publications are solely those of the individual author(s) and contributor(s) and not of MDPI and/or the editor(s). MDPI and/or the editor(s) disclaim responsibility for any injury to people or property resulting from any ideas, methods, instructions or products referred to in the content.