Article

Paleoenvironment and Hydrocarbon Potential of Salinized Lacustrine Shale with High Terrigenous Input in the Paleogene Biyang Depression (East China): Evidence from Organic Petrography and Geochemistry

1
State Key Laboratory of Shale Oil and Gas Enrichment Mechanisms and Efficient Development, Beijing 100083, China
2
Sinopec Key Laboratory of Shale Oil/Gas Exploration and Production Technology, Beijing 100083, China
3
Key Laboratory of Tectonics and Petroleum Resources, China University of Geosciences, Ministry of Education, Wuhan 430074, China
4
Sinopec Petroleum Exploration and Production Research Institute, Beijing 100083, China
*
Authors to whom correspondence should be addressed.
Energies 2024, 17(12), 3003; https://doi.org/10.3390/en17123003
Submission received: 11 May 2024 / Revised: 1 June 2024 / Accepted: 3 June 2024 / Published: 18 June 2024

Abstract

:
Salinized lacustrine shale (SLS) represents a frontier in the global quest for unconventional hydrocarbon resources. The impact of terrigenous input, which includes terrigenous organic matter (OM) and detrital matter, on the deposition and hydrocarbon potential of SLS is still controversial. Here, we examine this issue using the newly discovered SLS within the Paleogene Biyang Depression, employing a combination of organic petrographic and geochemical analyses. A high influx of terrigenous input (terrigenous OM and detrital matter) promotes the formation of SLS. On the one hand, terrigenous higher plants emerge as the primary source of OM in the SLS, as indicated by the dominance of terrigenous macerals (e.g., terrigenous liptinite) and the abundance of plant-derived biomarkers (e.g., tricyclic terpanes). Additionally, a portion of the OM may originate from bacteria. On the other hand, the rapid input of detrital matter improves the preservation of OM, resulting in the deposition of SLS with high total organic carbon (TOC) contents and low hydrogen index (HI) values. The findings of this study contribute to a deeper understanding of SLS deposition and provide guidance for regional hydrocarbon exploration.

1. Introduction

With the growing demand for energy and the dwindling conventional oil reserves, both the exploration and exploitation of unconventional oil reservoirs become imperative. Among these, salinized lacustrine shale systems stand out for their distinct characteristics, presenting both challenges and opportunities for oil exploration and exploitation [1,2]. Salinity exerts a profound influence on sedimentation, diagenesis, and organic matter preservation, ultimately shaping the composition and distribution of hydrocarbon resources [3]. As such, unravelling the complex relationships between organic matter, depositional environments, and hydrocarbon potential in salinized lacustrine shale is essential for resource assessment and exploration strategies [4]. Note that the term ‘shale’ in this study refers to fine-grained sediments include clay particles (<4 μm), with varying proportions of silt-sized floating grains (up to 62.5 μm) of biogenic and detrital origin [5,6].
Salinized lacustrine shale was extensively deposited during the Paleogene period worldwide, with examples including the Green River Formation of Wyoming in the United States [1]; the Salt IV Formation of the Mulhouse Basin [7] and the Bituminous Limestone of the Camargue Basin in France [8]; the Brown Shale Formation of the Central Sumatra Basin in Indonesia [9]; the Xiaganchaigou Formation of the Qaidam Basin in Northwestern China [10]; and the Kongdian and Shahejie formations of the Bohai Bay Basin [11,12], the Qianjiang Formation of the Jianghan Basin [13], the Funing Formation of the Subei Basin (Eastern China) [14], and the Hetaoyuan Formation of the Nanxiang Basin in Eastern China [15]. Many of these salinized lacustrine shales are renowned for their potential as prolific hydrocarbon source rocks, as well as sources and reservoirs for shale oil resources [4]. Saline lacustrine basins harbor diverse biological organisms and demonstrate significant biological activities. This activity plays a role in enriching the sedimentary organic matter within the basins. The enrichment process includes biological bloom, primary productivity, water stratification, and organic matter preservation. Water stratification in saline lacustrine basins facilitates the preservation of sedimentary organic matter by inducing bottom water anoxia [16].
The Biyang Depression within the Nanxiang Basin represents the first shale oil breakthrough in Eastern China. The Well BYHF1, situated at the center of the depression, achieved a peak daily oil production of 24.2 tons [17]. However, oil production from the well declined rapidly, dropping to less than 5 tons per day after only 100 days [18]. Aside from potential hydraulic fracturing difficulties, the heterogeneity of salinized lacustrine shale is a major contributor to the rapid decline in production [19]. Consequently, in recent years, alongside shale oil exploration and exploitation in the Eh33 and Eh32 strata, which contain salinized lacustrine shale with the highest quality and the largest thickness, preliminary exploration of deeper shale strata (e.g., Eh36 and Eh35) in the depression is also planned [19]. However, there is still a lack of studies on organic matter source, depositional environment, and hydrocarbon potential for these deeper shale strata, significantly impending further shale oil exploration efforts in the Biyang Depression.
This article presents the results of a comprehensive organic petrographic and geochemical study conducted on the newly explored, deeper salinized lacustrine shale strata in the Paleogene Biyang Depression. Through integrated analyses, our objective was to elucidate the origin of organic matter, characterize the depositional environment of the shale strata, and assess their implications for hydrocarbon prospectivity. The findings of this study not only contribute to the understanding of salinized lacustrine shale systems in East China but also provide valuable insights into hydrocarbon exploration and resource assessment in similar geological settings worldwide.

2. Geological Setting

The Nanxiang Basin, situated in East China, is a sedimentary rift basin covering approximately 1.7 × 10⁴ km2 (Figure 1A). It includes the Xiangzao, Nanyang, and Biyang depressions, as well as the Shigang, Xinye, Tanghe, and Sheqi uplifts (Figure 1B). The hydrocarbon-rich Biyang Depression spans nearly 1000 km2 and boasts conventional oil reserves of 306 million tons and shale oil reserves of 285 million tons [16,20]. The depression takes the form of a half-graben rift, further divided into the northern slope belt, central deep sag, and southern steep slope belt (Figure 1C,D).
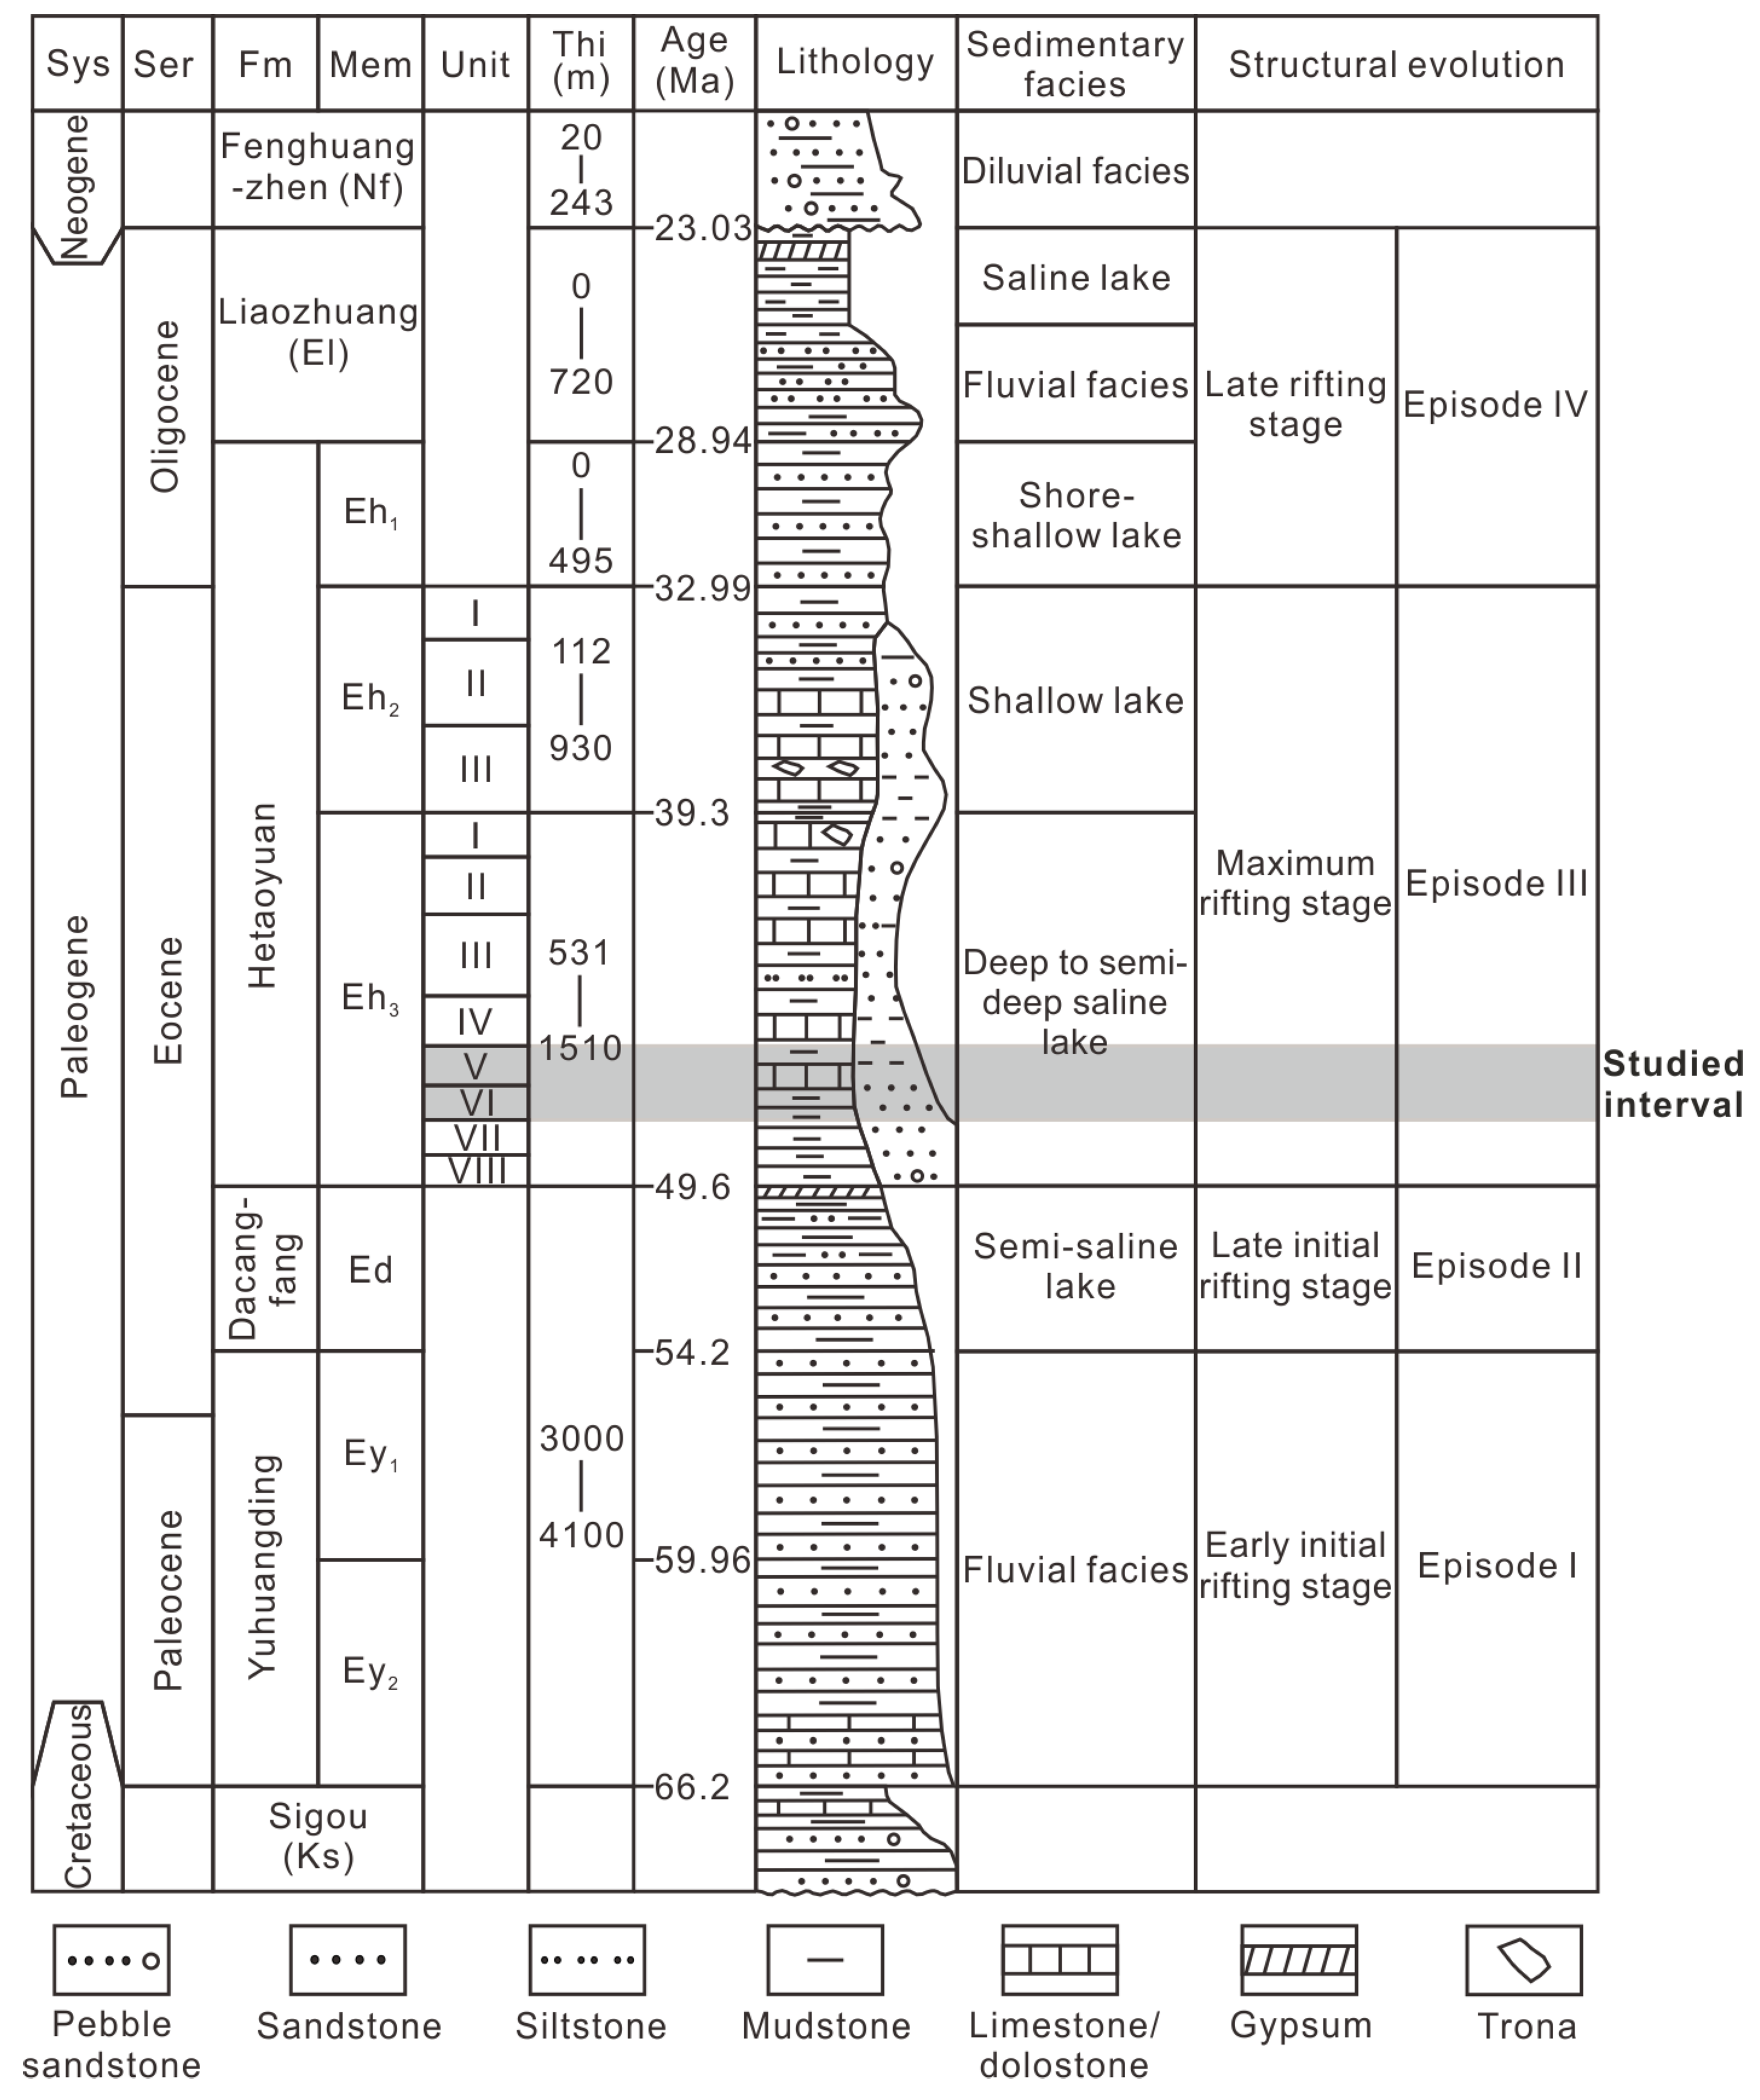
There are four distinct episodes that comprise the structural evolution of a depression. (Episodes I−IV; Figure 2) [21,22,23]. Episode I signifies the early initial rifting stage, extending from the Paleocene to the very Early Eocene. The Yuhuangding Formation (Ey) was deposited during this phase, characterized by the prevalence of yellow-to-red coarse-grained sandstone interbedded with mudstone, suggesting fluvial facies. Episode II represents the late initial rifting stage and aligns with the deposition of the Early Eocene Dacangfang Formation (Ed). The Ed is marked by an abundance of purple-red coarse- and medium-grained sandstone and grey mudstone, with the occurrence of gypsum at the top, deposited in semi-saline lacustrine environments. The peak of the rifting stage, Episode III, spans the Middle-to-Late Eocene and is denoted by the third and second members of the Hetaoyuan Formation (Eh3 and Eh2). The Eh3 mainly comprises grey-to-dark-grey shale interbedded with carbonate rock, deposited in deep-to-semi-deep saline lacustrine environments. The Eh2 consists of greyish-green-to-light-grey mudstone, carbonate rock, and fine-grained sandstone, indicating shallow lacustrine environments. Trona is occasionally found interbedded with dolostone in both the upper Eh3 and Eh2. The late rifting stage, Episode IV during the Oligocene, coincides with the deposition of the first member of the Hetaoyuan Formation (Eh1) and the Liaozhuang Formation (El). The Eh1 exhibits greyish-green-to-light-grey mudstone interbedded with medium and fine sandstone, suggesting shoreline shallow lake environment. The El is characterized by brown-red fine-grained sandstone, mudstone, and gypsum, signifying a transition from a riverine environment to a saline-lake environment.
The Eh3 interval is further subdivided into eight units, denoted as Unit VIII to Unit I from bottom to top (Eh38 to Eh31; Figure 2). This study focuses on the Units VI and V (Eh36 and Eh35), deposited in a deep/semi-deep lake, which comprises salinized lacustrine shale, and they have been prominent targets in recent hydrocarbon exploration efforts [20].

3. Materials and Methods

In the exploration well A3, a total of twenty fine-grained sediments were collected from depths ranging from 3195.2 to 3383.6 m, which is located in the southern part of the central deep sag (Figure 1C). All samples were analyzed for total organic carbon (TOC; wt. %) and Rock-Eval pyrolysis. A Leco CS-230 instrument (LECO Corporation, St. Joseph, MI, USA) was employed to determine the TOC contents after the acidification of samples to eliminate carbonate. A Rock-Eval 6 instrument (Vinci Technologies, Nanterre, France) was used for characterizing free hydrocarbons (S1; mg HC/g rock), hydrocarbons cracked from kerogen (S2; mg HC/g rock), and the maximum temperature of hydrocarbon generation (Tmax; °C).
Ten samples were selected for the organic petrographic analysis. Polished sections were observed using a Nikon microscope (Nikon Corporation, Tokyo, Japan) equipped with reflected and fluorescent light, as well as 20× and 50× oil-immersion lenses. Mean random vitrinite reflectance of six samples was determined in accordance with an established procedure [24].
Major and trace elemental compositions were analyzed in 19 samples. The determination of major-element oxide contents was conducted using a Shimadzu XRF-1800 instrument (Shimadzu, Kyoto, Japan), while a Thermo Fisher Scientific Element XR ICP-MS (Thermo Fisher Scientific, Waltham, MA, USA) was used to determine the concentration of trace elements. To ensure analytical reliability, both standard materials and duplicate determination of samples were employed.
A total of 11 samples underwent biomarker analysis in this study. Initially, powdered samples were subjected to 72-h extraction with chloroform. Asphaltenes were then precipitated from an 80:1 (v:v) solution of hexane and dichloromethane (DCM) and subsequently separated via centrifugation. Soluble components of hexane were further divided into saturates, aromatics, and NSO compounds by silica gel and alumina column chromatography (Al2O3). This separation process involved successive elution with hexane, a DCM–hexane solution (2:1, v:v), DCM, and methanol (MeOH). Subsequently, the saturated and aromatic fractions were subjected to analysis using a gas chromatograph equipped with a 30 m DB-5MS fused silica column (inner diameter 0.25 mm; film thickness 0.25 μm) coupled to an Agilent 7890-5977B gas chromatography–mass spectrometry (GC-MS) system (Agilent, Santa Clara, CA, USA). The oven temperature was programmed to increase from 70 °C to 300 °C at a rate of 3 °C/min, followed by an isothermal period lasting 30 min. The mass spectrometer operated in the electron ionization mode, covering a scan range from mass to charge (m/z) of 50 to m/z 650, with a total scan time of 0.7 s.

4. Results

4.1. Bulk Geochemistry

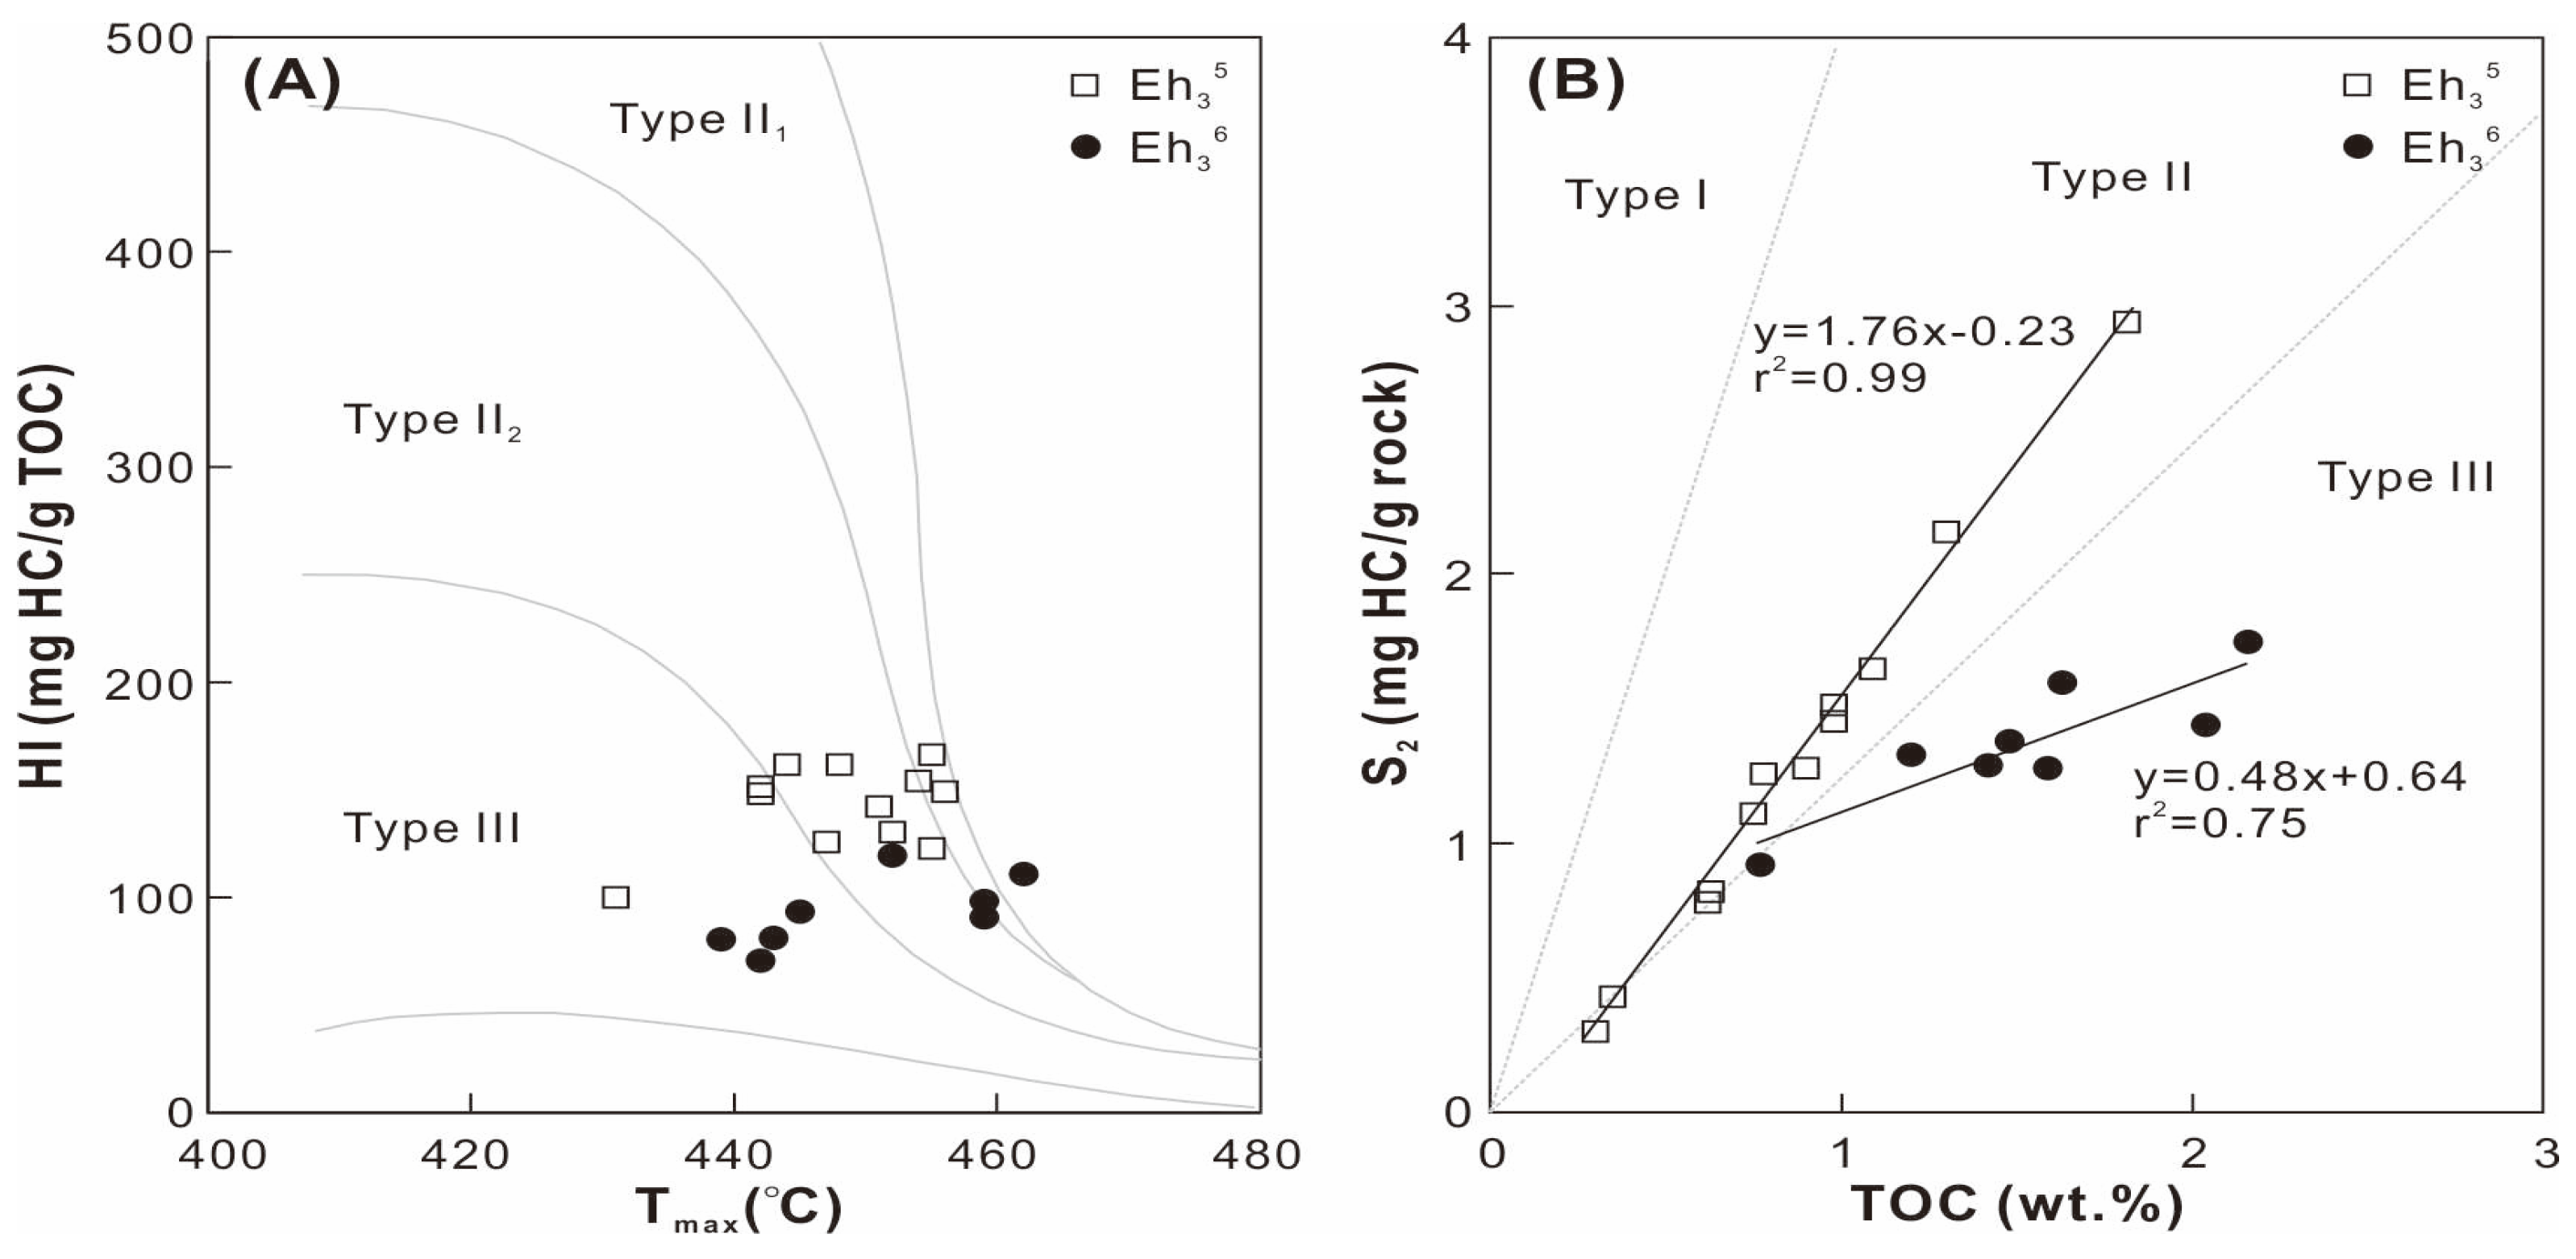
The Eh35 shale contains TOC contents ranging from 0.3 wt. % to 1.8 wt. %, which is lower than that of the Eh36 shale (0.8−2.2 wt. %; Table 1). The S1+S2 values span 1.3−2.5 mg HC/g rock and 0.5−4.1 mg HC/g rock in the Eh36 and Eh35 shale, respectively. The hydrogen index (HI = 100 × S2/TOC) exhibits low values in the Eh36 shale (71−119 mg HC/g TOC) and high values in the Eh35 shale (100−166 mg HC/g TOC). A comparable range of Tmax values are observed in the Eh36 and Eh35 shale, ranging from 439 to 462 °C and from 431 to 456 °C, respectively. Type II2 kerogen predominates in the Eh35 shale, while type III kerogen dominates the Eh36 shale, according to cross-plots of HI versus Tmax and S2 versus TOC (Figure 3).

4.2. Organic Petrography and Vitrinite Reflectance

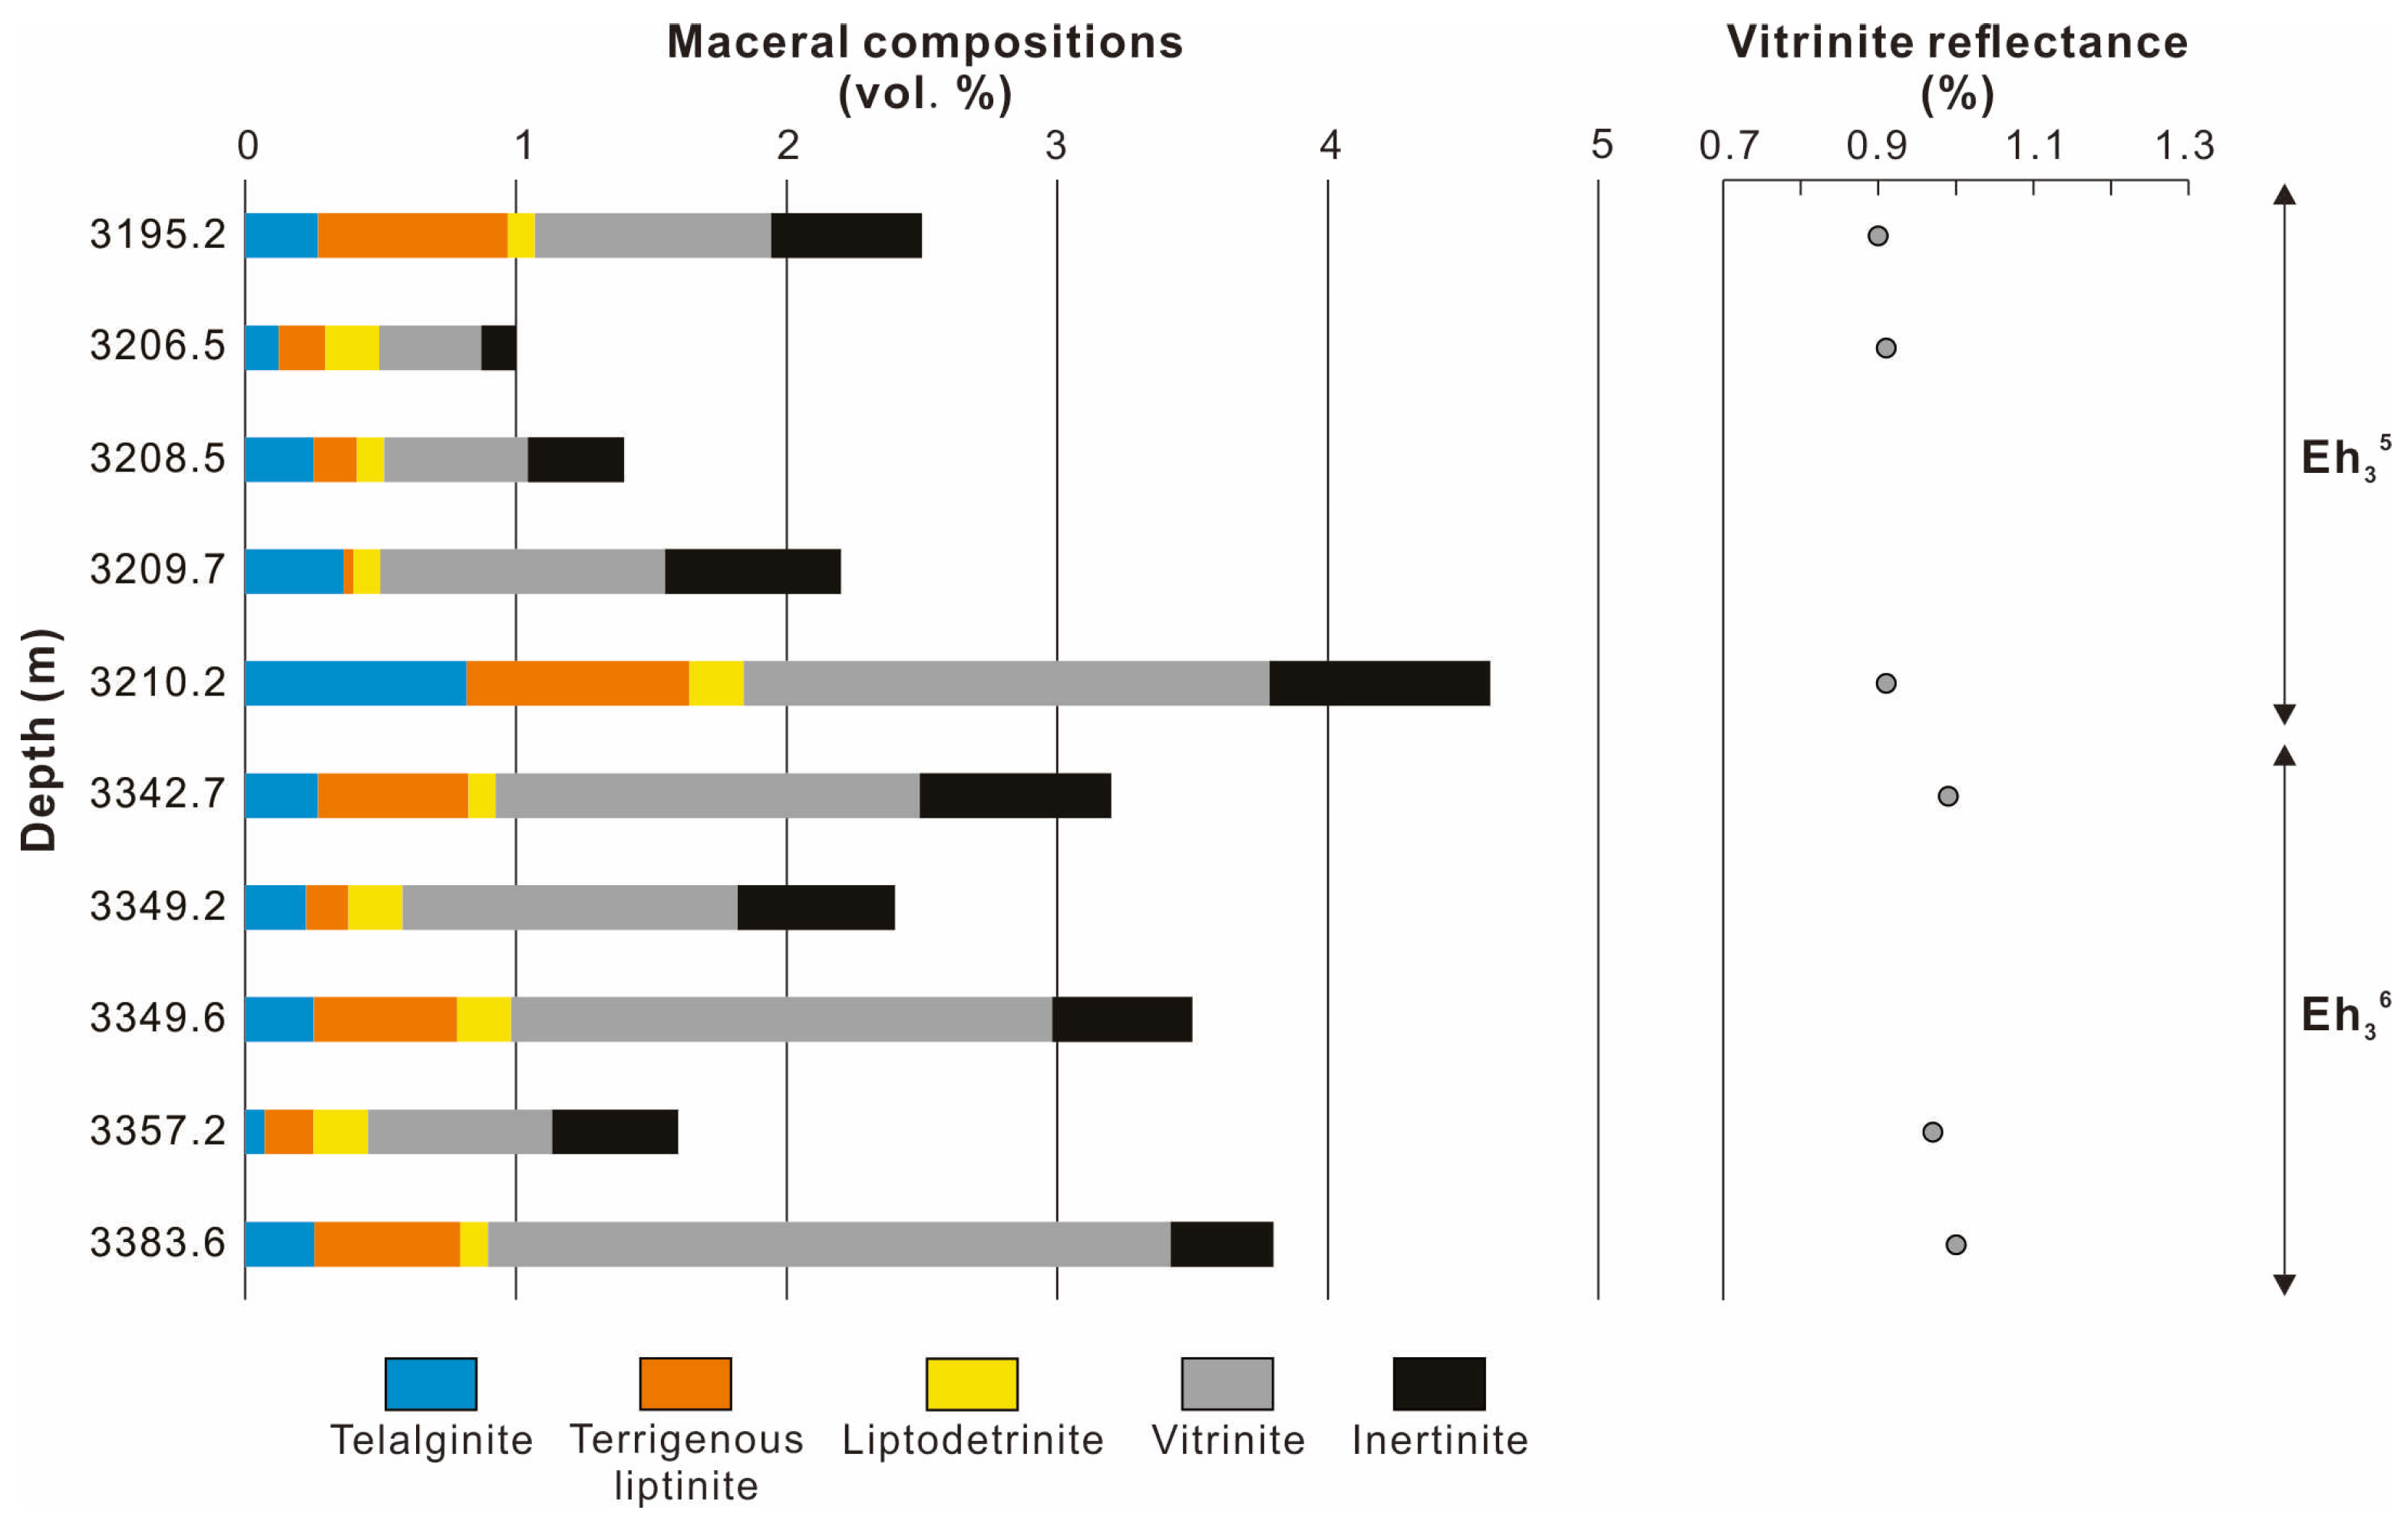
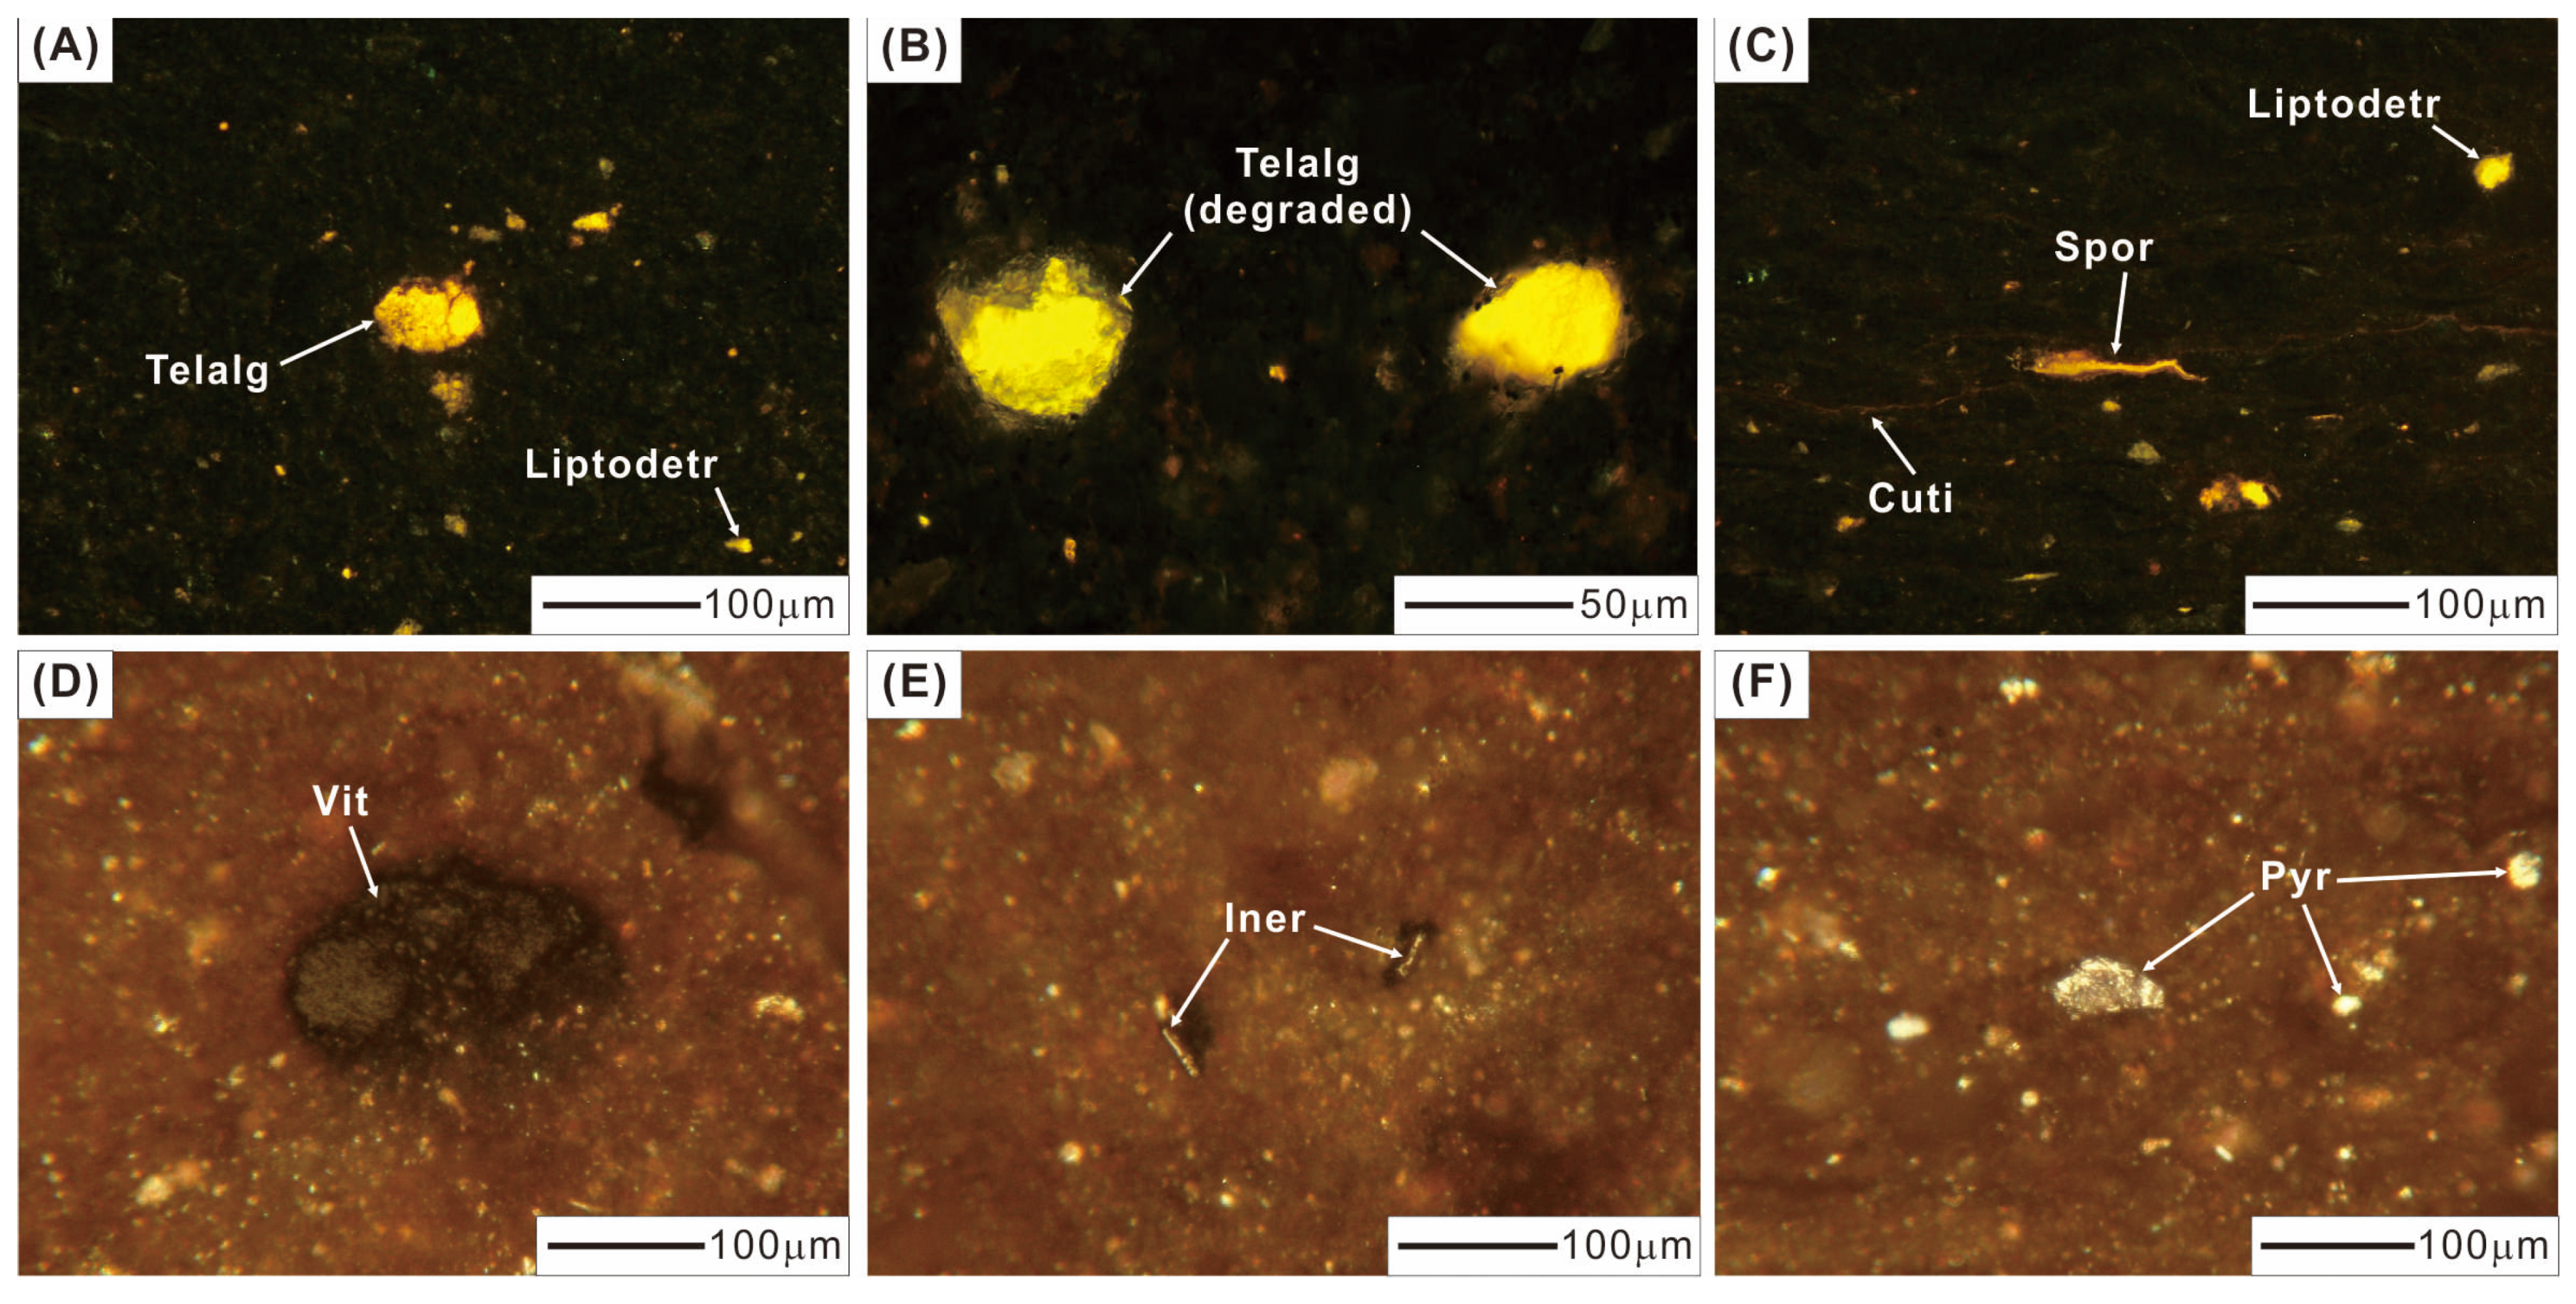
The volume percentages (vol. %) of maceral in the Eh36 and Eh35 shale are less than 5.0 vol. % (Figure 4; Table 1). The Eh35 shale contains a larger concentration of telalginite (including degraded telalginite) than the Eh36 shale, resulting in higher HI values (Figure 3A). Telalginite appears as a unicellular spherical or almost-round shape with yellow-to-orange fluorescence (Figure 5A), whereas degraded telalginite has indistinct boundaries and diminished fluorescence (Figure 5B). Terrigenous liptinite, which is dominated by sporinite and cutinite, ranges from 0.2 to 0.6 vol. % and less than 0.1 to 0.8 vol. % in the Eh36 and Eh35 shale, respectively. Sporinite is distinguished by its elongated thread-like or fusiform shape with yellow-orange fluorescence, whereas cutinite has a serrated edge and poor fluorescent properties (Figure 5C). Both intervals contain trace amounts of liptodetrinite (<0.2 vol. %), which has a small and irregular shape with yellow fluorescence (Figure 5A,C). Among macerals, vitrinite is most prevalent, with values in the Eh36 shale ranging from 0.7 to 2.5 vol. %, and in the Eh35 shale from 0.4 to 1.9 vol. %. The spherical shape of vitrinite suggests that it may transport across long distances, probably suggesting deep-to-semi-deep lacustrine environments (Figure 5D). Inertinite is found in needle-shaped grains and is most likely broken fusinite or semifusinite (Figure 5E). Furthermore, a minor amount of framboidal and semi-cube pyrite is observed, indicating that there were possibly different stages of pyrite formation (Figure 5F). The average values of random vitrinite reflectance (%Rr) vary between 0.9 and 1.0% (Figure 4; Table 1).

4.3. Elemental Compositions

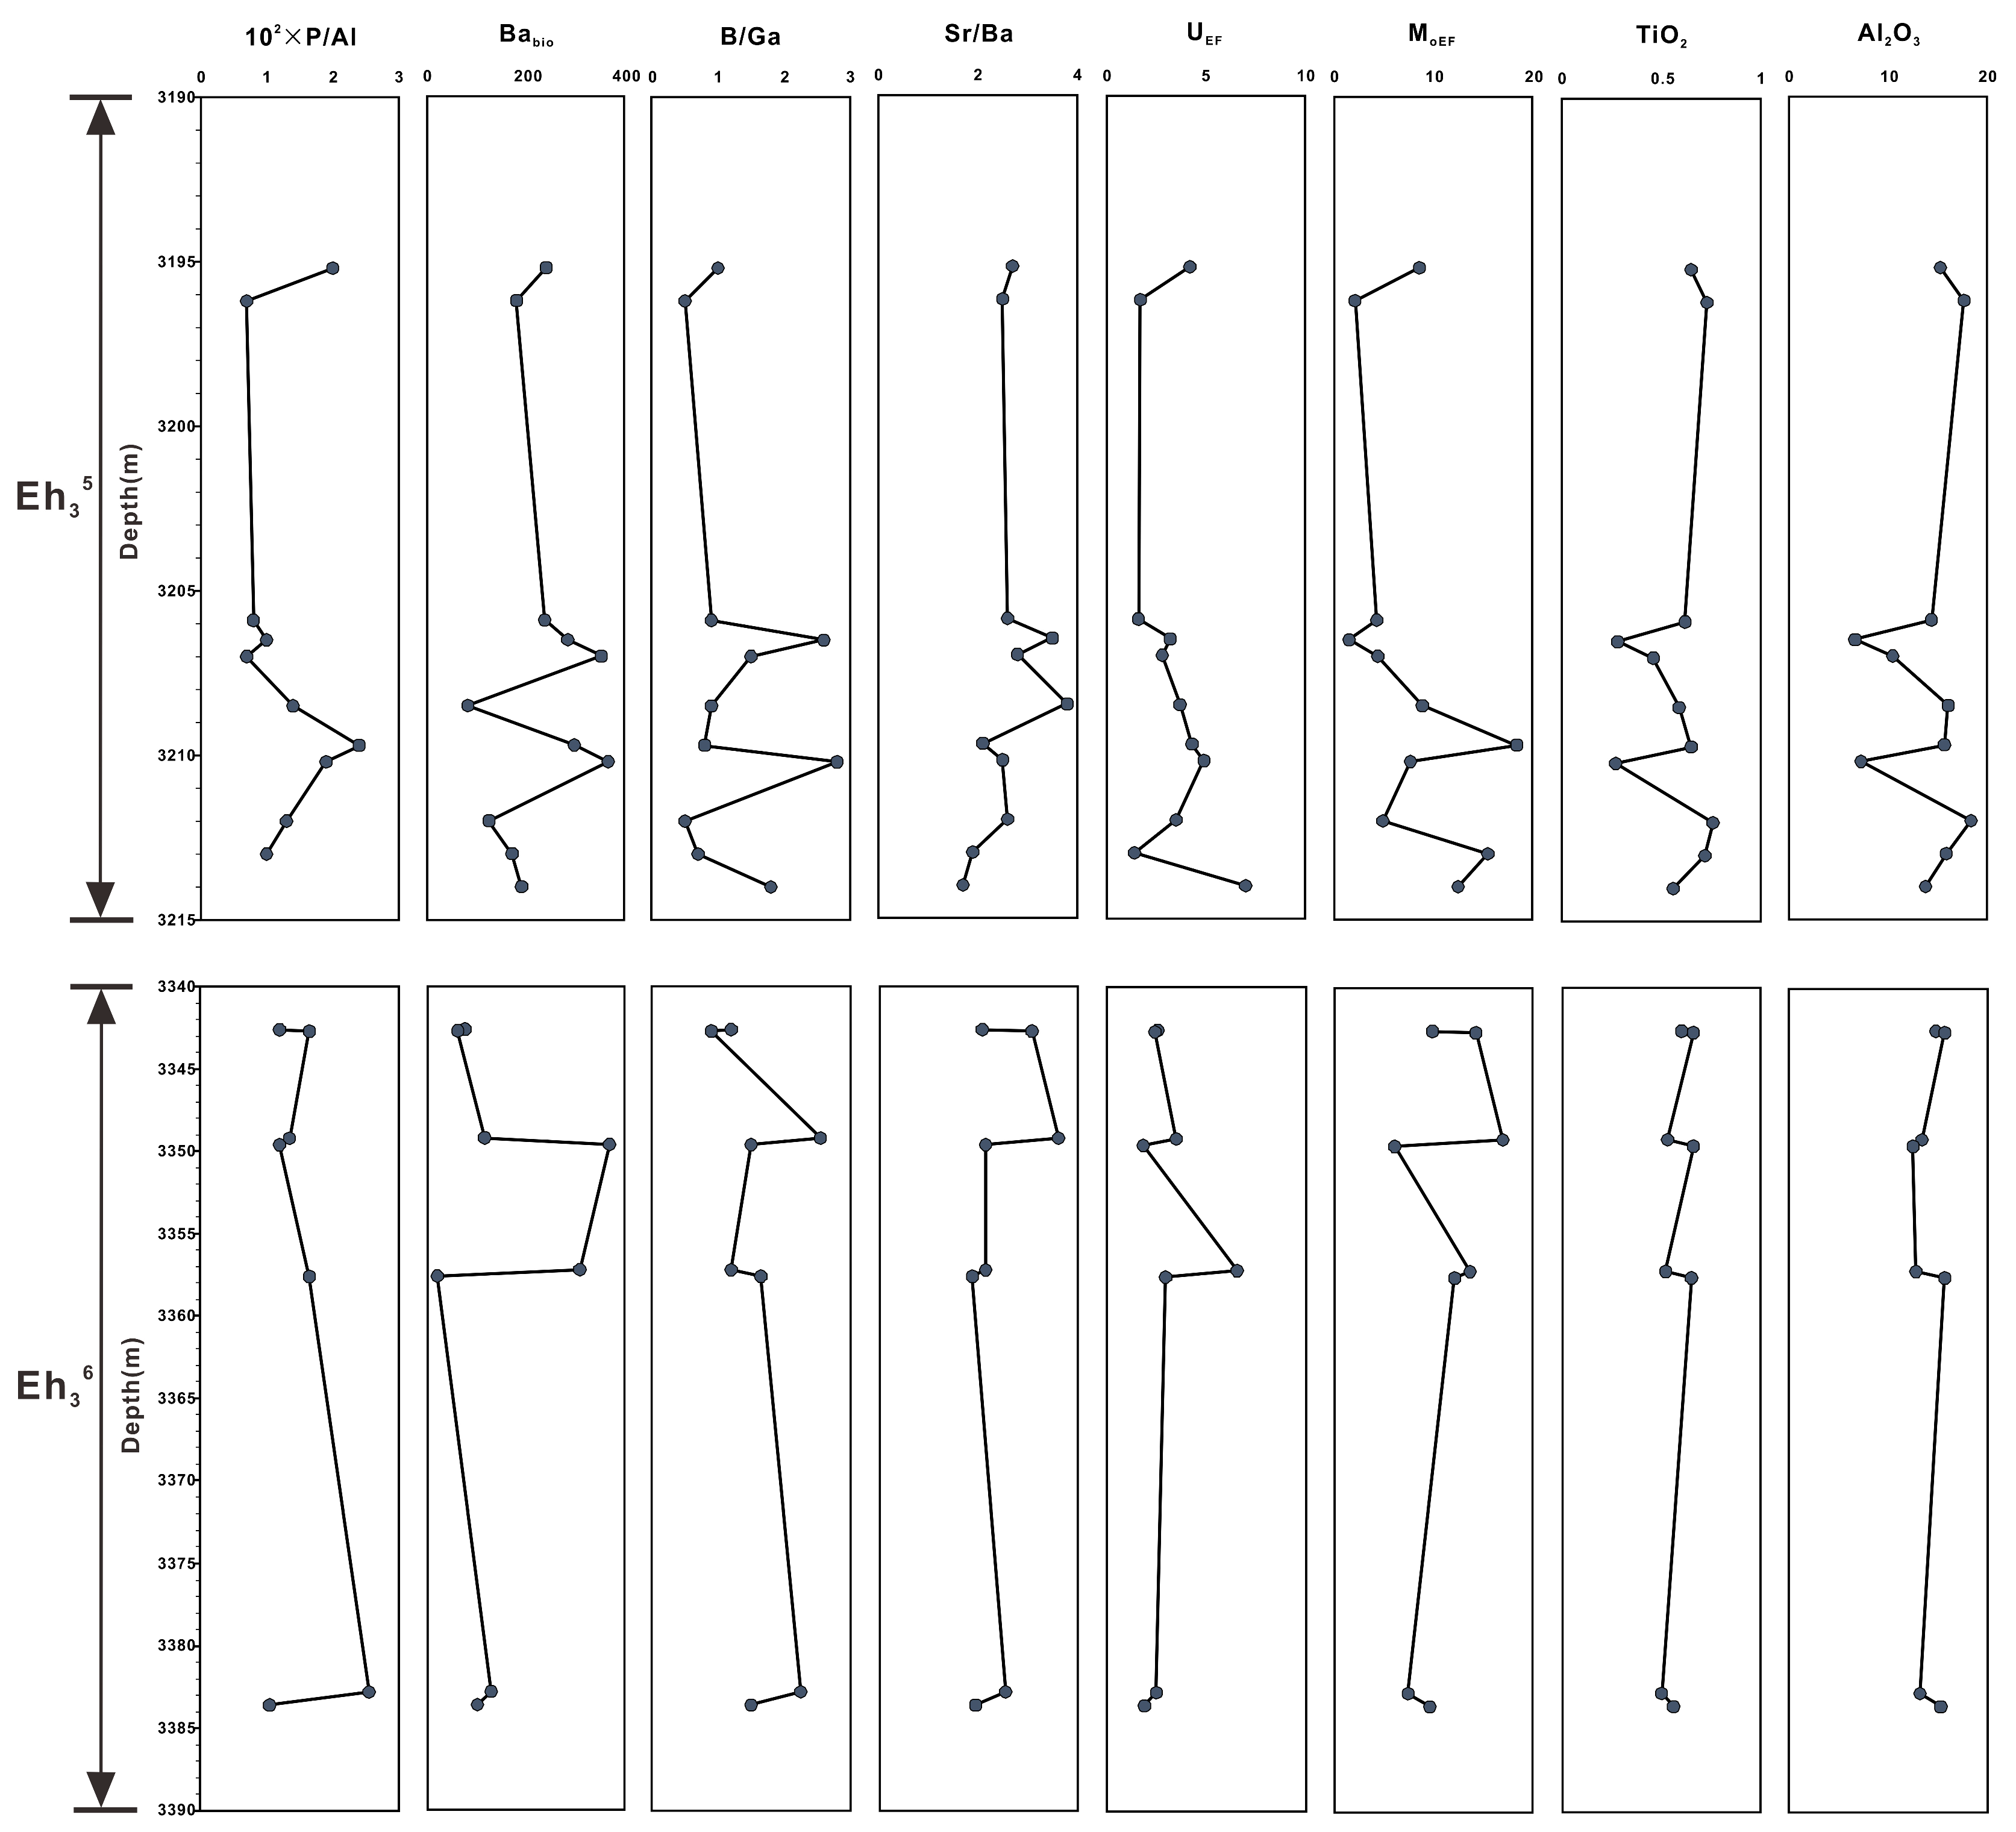
The elemental metrics used as paleoenvironmental indicators are listed in Table 1, including the P/Al ratio; biogenic Ba value (Babio = Batot−Al × (Ba/Al)detrital, where Batot and Al are the total amounts of Ba and Al, and (Ba/Al)detrital is estimated based on the cross-plot of Ba versus Al) [25]; Sr/Ba and B/Ga ratios; enrichment factors of U and Mo (TEEF = (TE/Al)sample/(TE/Al)UCC [26], where TE stands for the U or Mo concentrations, and UCC refers to elemental composition of the Upper Continental Crust) [27]; and TiO2 and Al2O3 contents.
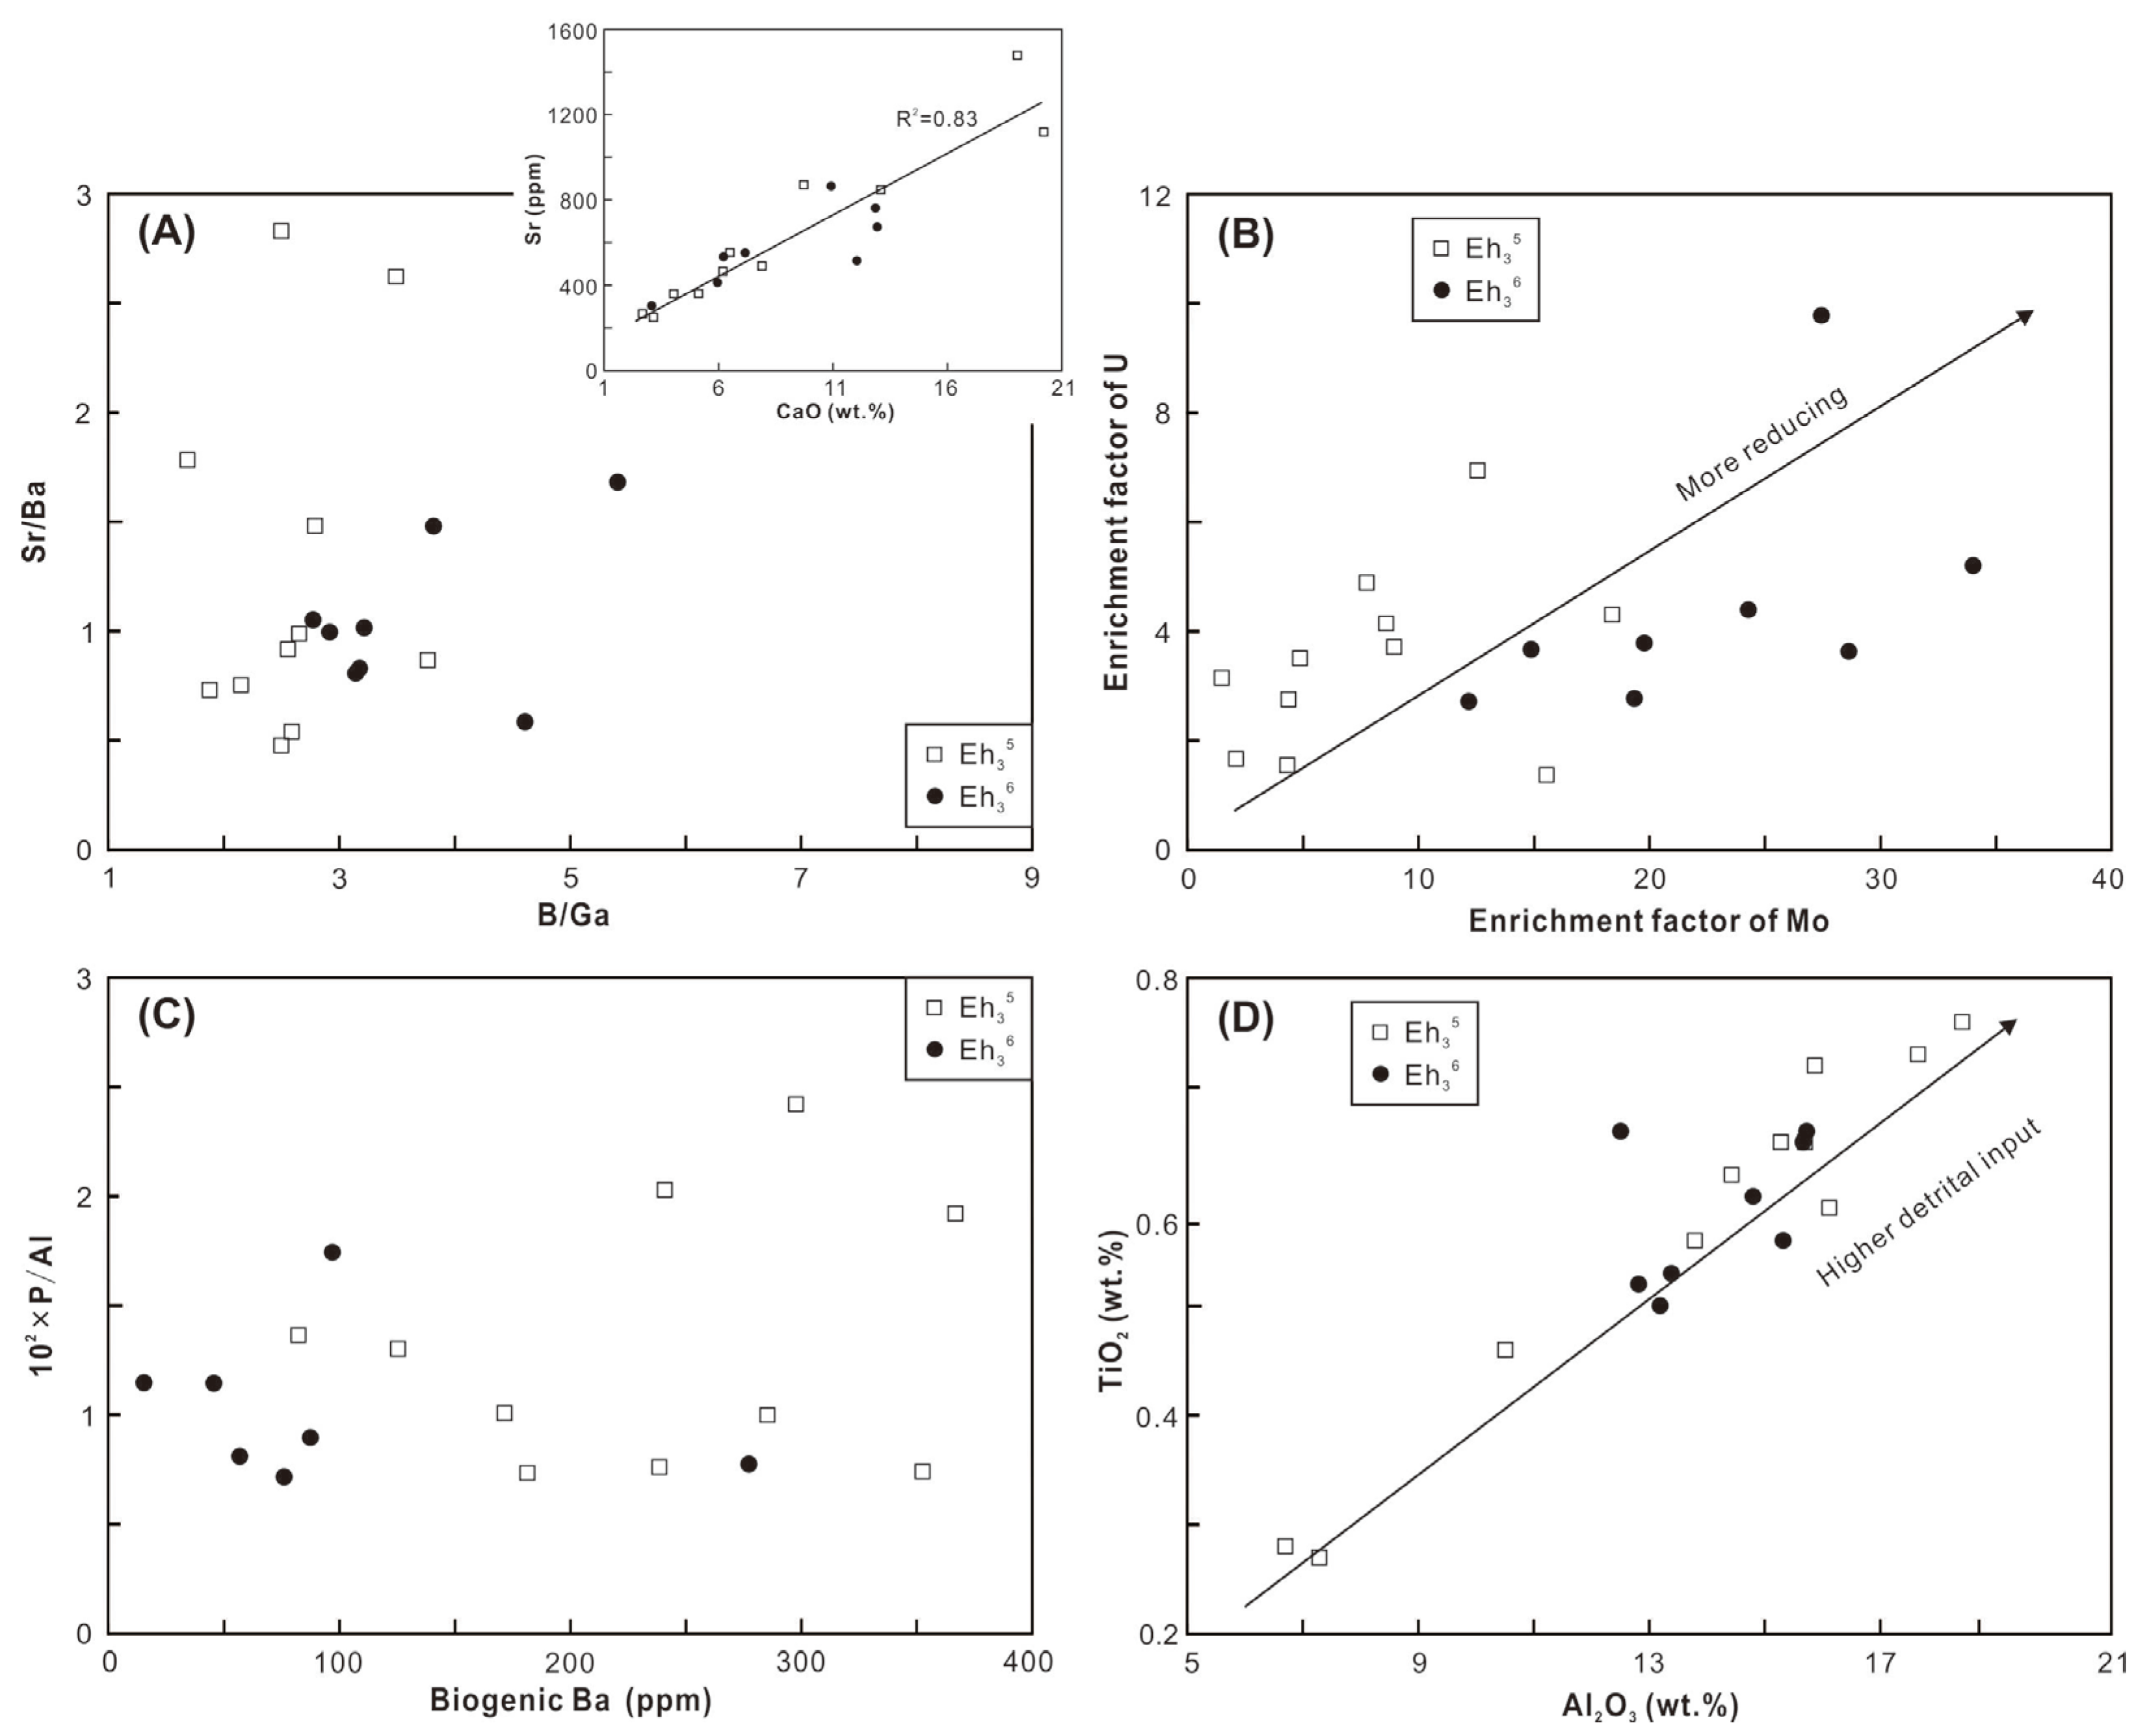
The 100 × P/Al ratios in the Eh36 and Eh35 shale range from 0.7 to 1.7 and from 0.7 to 2.4, respectively. The Eh36 shale has Babio levels ranging from 15 to 277 ppm, which is less than the Eh35 shale’s range, which is from 82 to 367 ppm. The Eh36 and Eh35 shale have Sr/Ba ratios that range from 0.6 to 1.7 and from 0.5 to 2.8, respectively. The B/Ga ratios of the Eh36 shale (2.8–5.4) are greater than those of the Eh35 shale (1.7–3.8). The UEF and MoEF values exhibit the same pattern, with higher values in the Eh36 shale (UEF: 2.7–9.8; MoEF: 12.2–34.0) and lower values in the Eh35 shale (UEF: 1.4–7.0; MoEF: 1.5–18.4). Regarding the TiO2 and Al2O3 contents, the Eh36 shale values range from 0.50 to 0.66 wt. % and from 12.5 to 15.7 wt. %, respectively, while in the Eh35 shale, they range from 0.27 to 0.76 wt. % and from 6.7 to 18.4 wt. %, respectively (Figure 6).

4.4. Biomarkers

The Eh36 and Eh35 shale contain varying levels of chloroform bitumen ‘A’, ranging from 0.10 to 0.17 wt. % and from 0.08 to 0.16 wt. %, respectively (Table 2). The Eh36 shale (87.1–94.4 wt. %) contains higher proportions of hydrocarbon fractions compared to the Eh35 shale (82.0–88.2 wt. %). Both intervals exhibit a prevalence of saturated over aromatic fractions, with saturated/aromatic hydrocarbon ratios varying between 2.8 and 4.5.
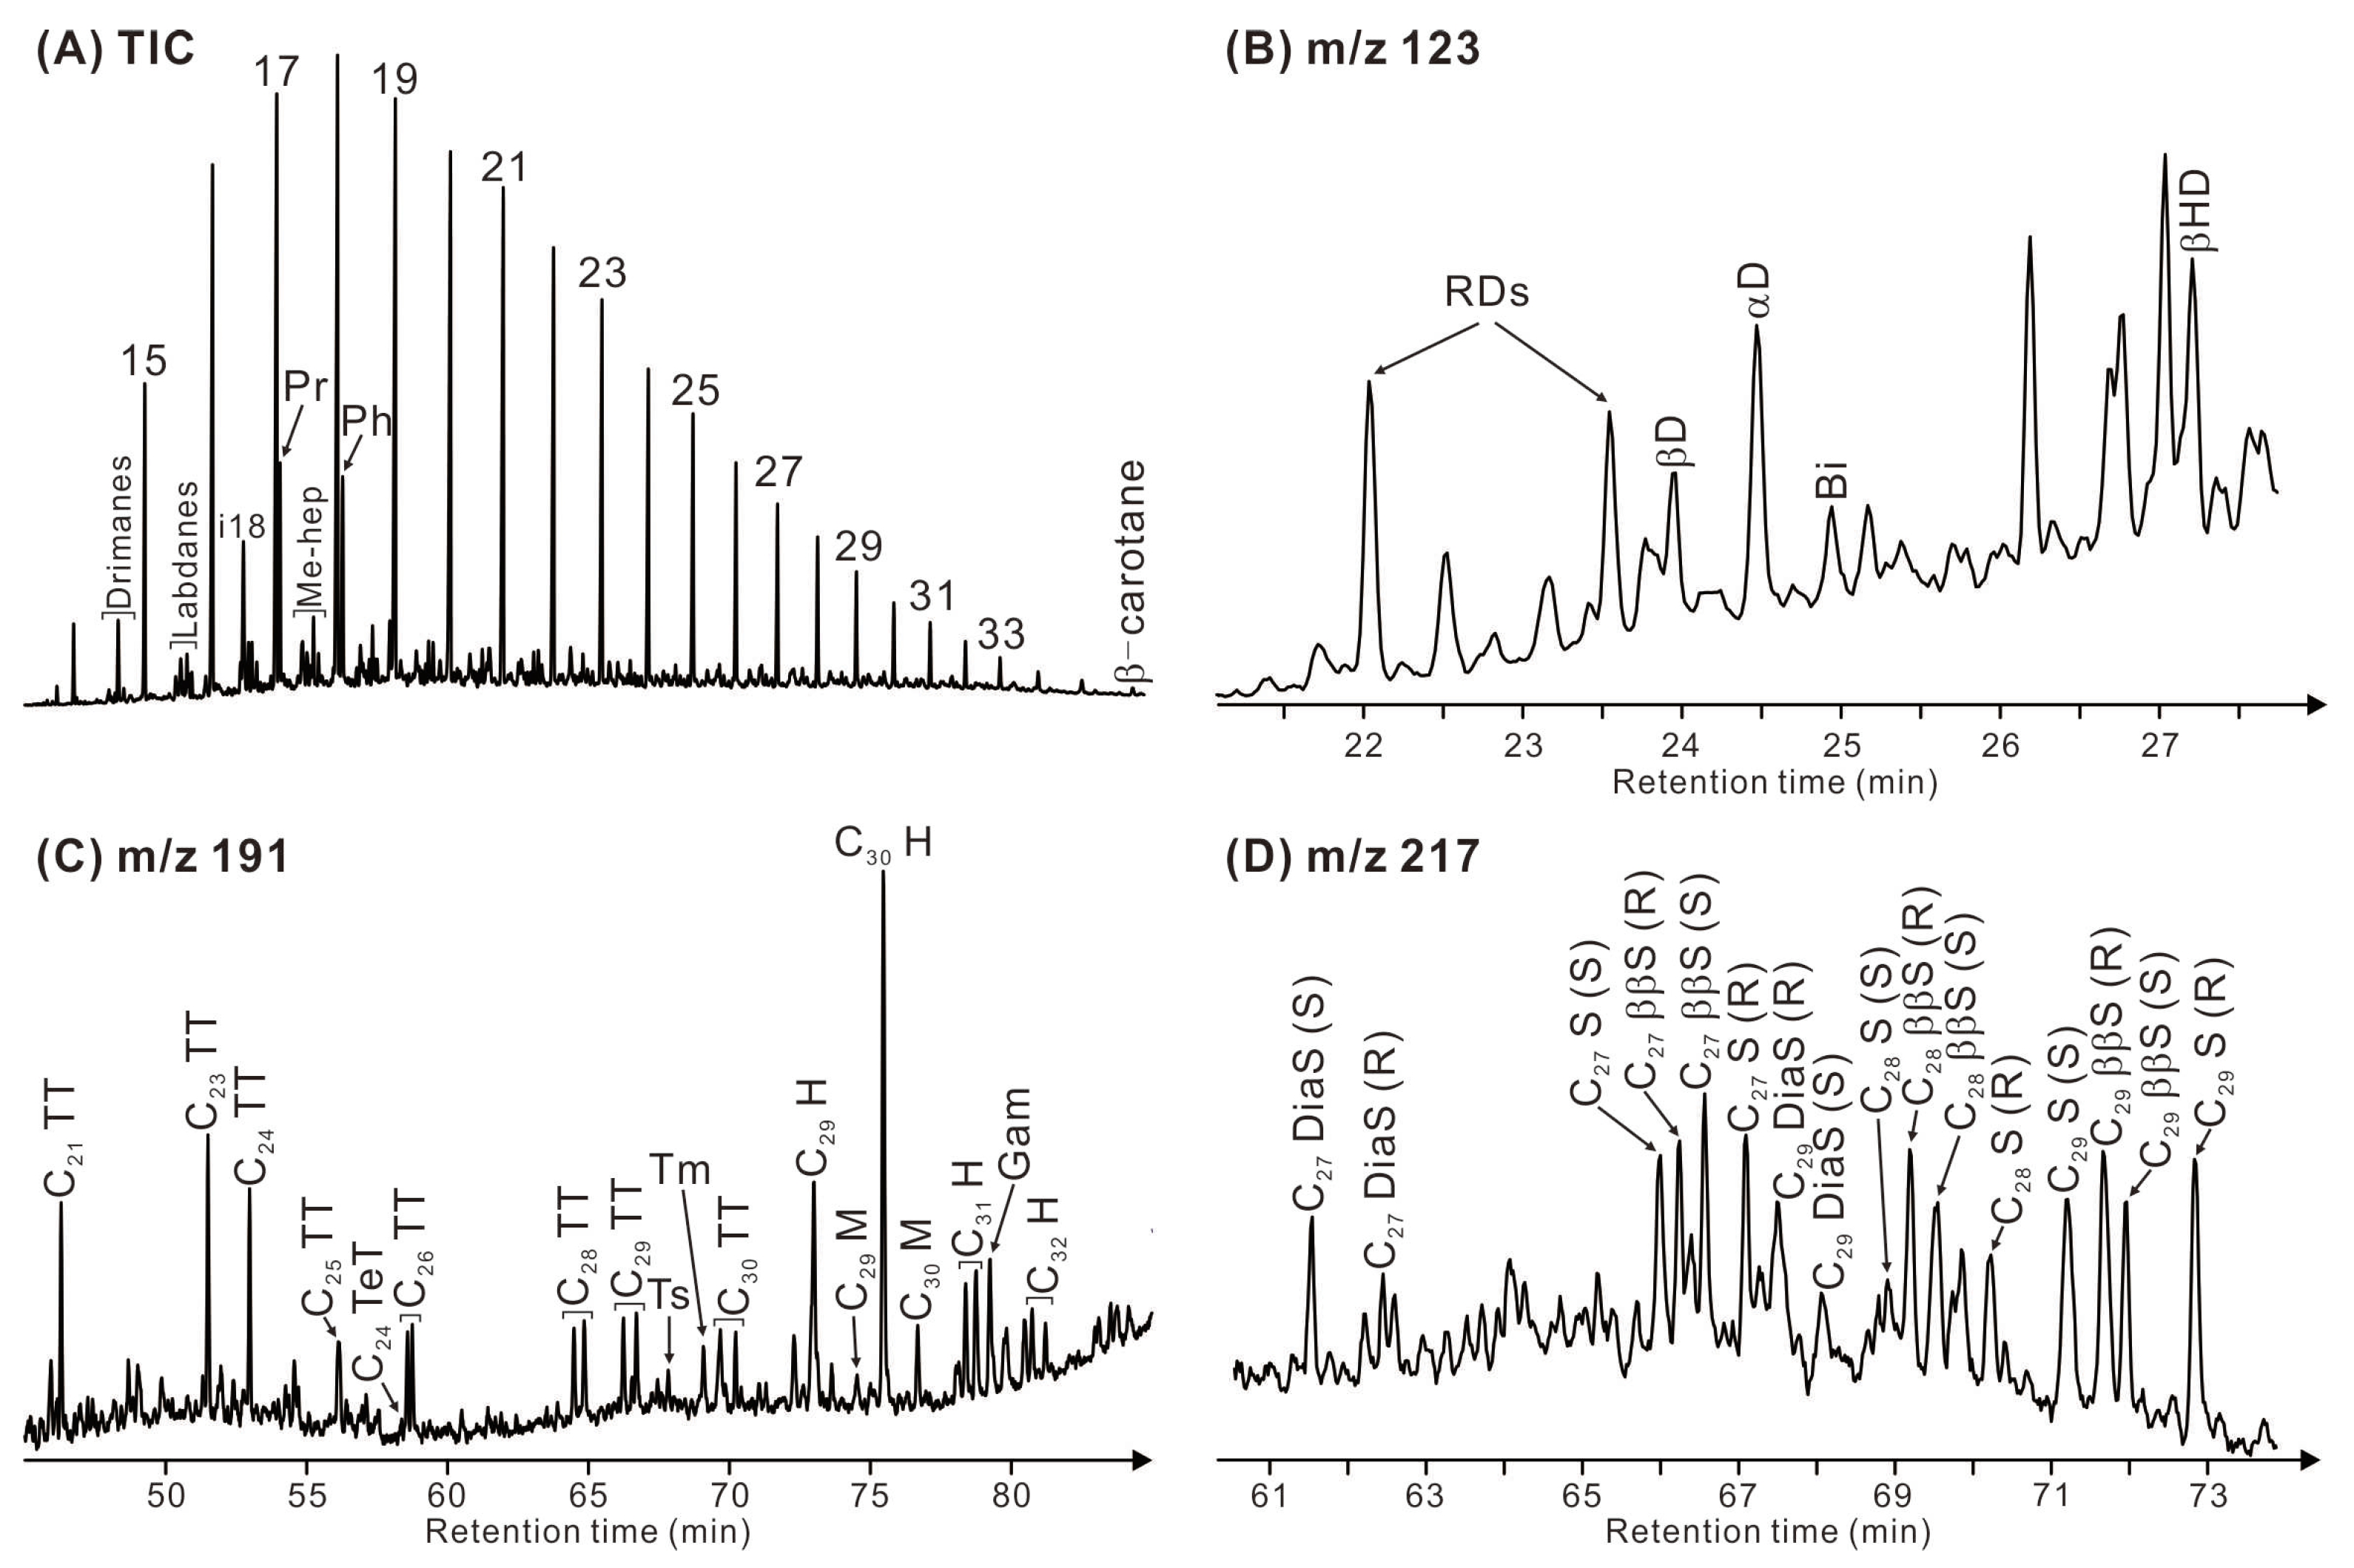
The Eh36 and Eh35 shale are dominated by short-chain n-alkanes (n-C17-23) with a predominance of odd over even (Figure 7A). The acyclic isoprenoid pristane (Pr) exhibits a higher abundance compared to phytane (Ph), with Pr/Ph ratios ranging from 0.87 to 1.01 in the Eh36 shale and from 0.98 to 1.37 in the Eh35 shale (Table 2). The Eh36 shale has ratios of Pr/n-C17 and Ph/n-C18 that fall between 0.12 and 0.31 and between 0.17 and 0.32, respectively. On the other hand, the Eh35 shale exhibits two ratios that vary from 0.36 to 0.51 (Pr/n-C17) and from 0.29 to 0.38 (Ph/n-C18), respectively. Drimanes, labdanes, methylheptadecanes, and b-carotane are also assigned in the TIC chromatogram (Figure 7A).
The mass chromatograms of drimanes (m/z 123; Figure 7B) reveal relatively high abundance of 8a(H)-drimane, followed by rearranged drimanes, 8β(H)-homodrimane, 8β(H)-drimane, and bisabolane. The Eh36 shale has ratios ranging from 1.13 to 1.80 for rearranged drimanes/drimanes and from 1.66 to 2.28 for 8β(H)-homodrimane/8β(H)-drimane. In contrast, two ratios in the Eh35 shale fall between 0.70 and 1.11 and between 1.43 and 1.71, respectively (Table 2).
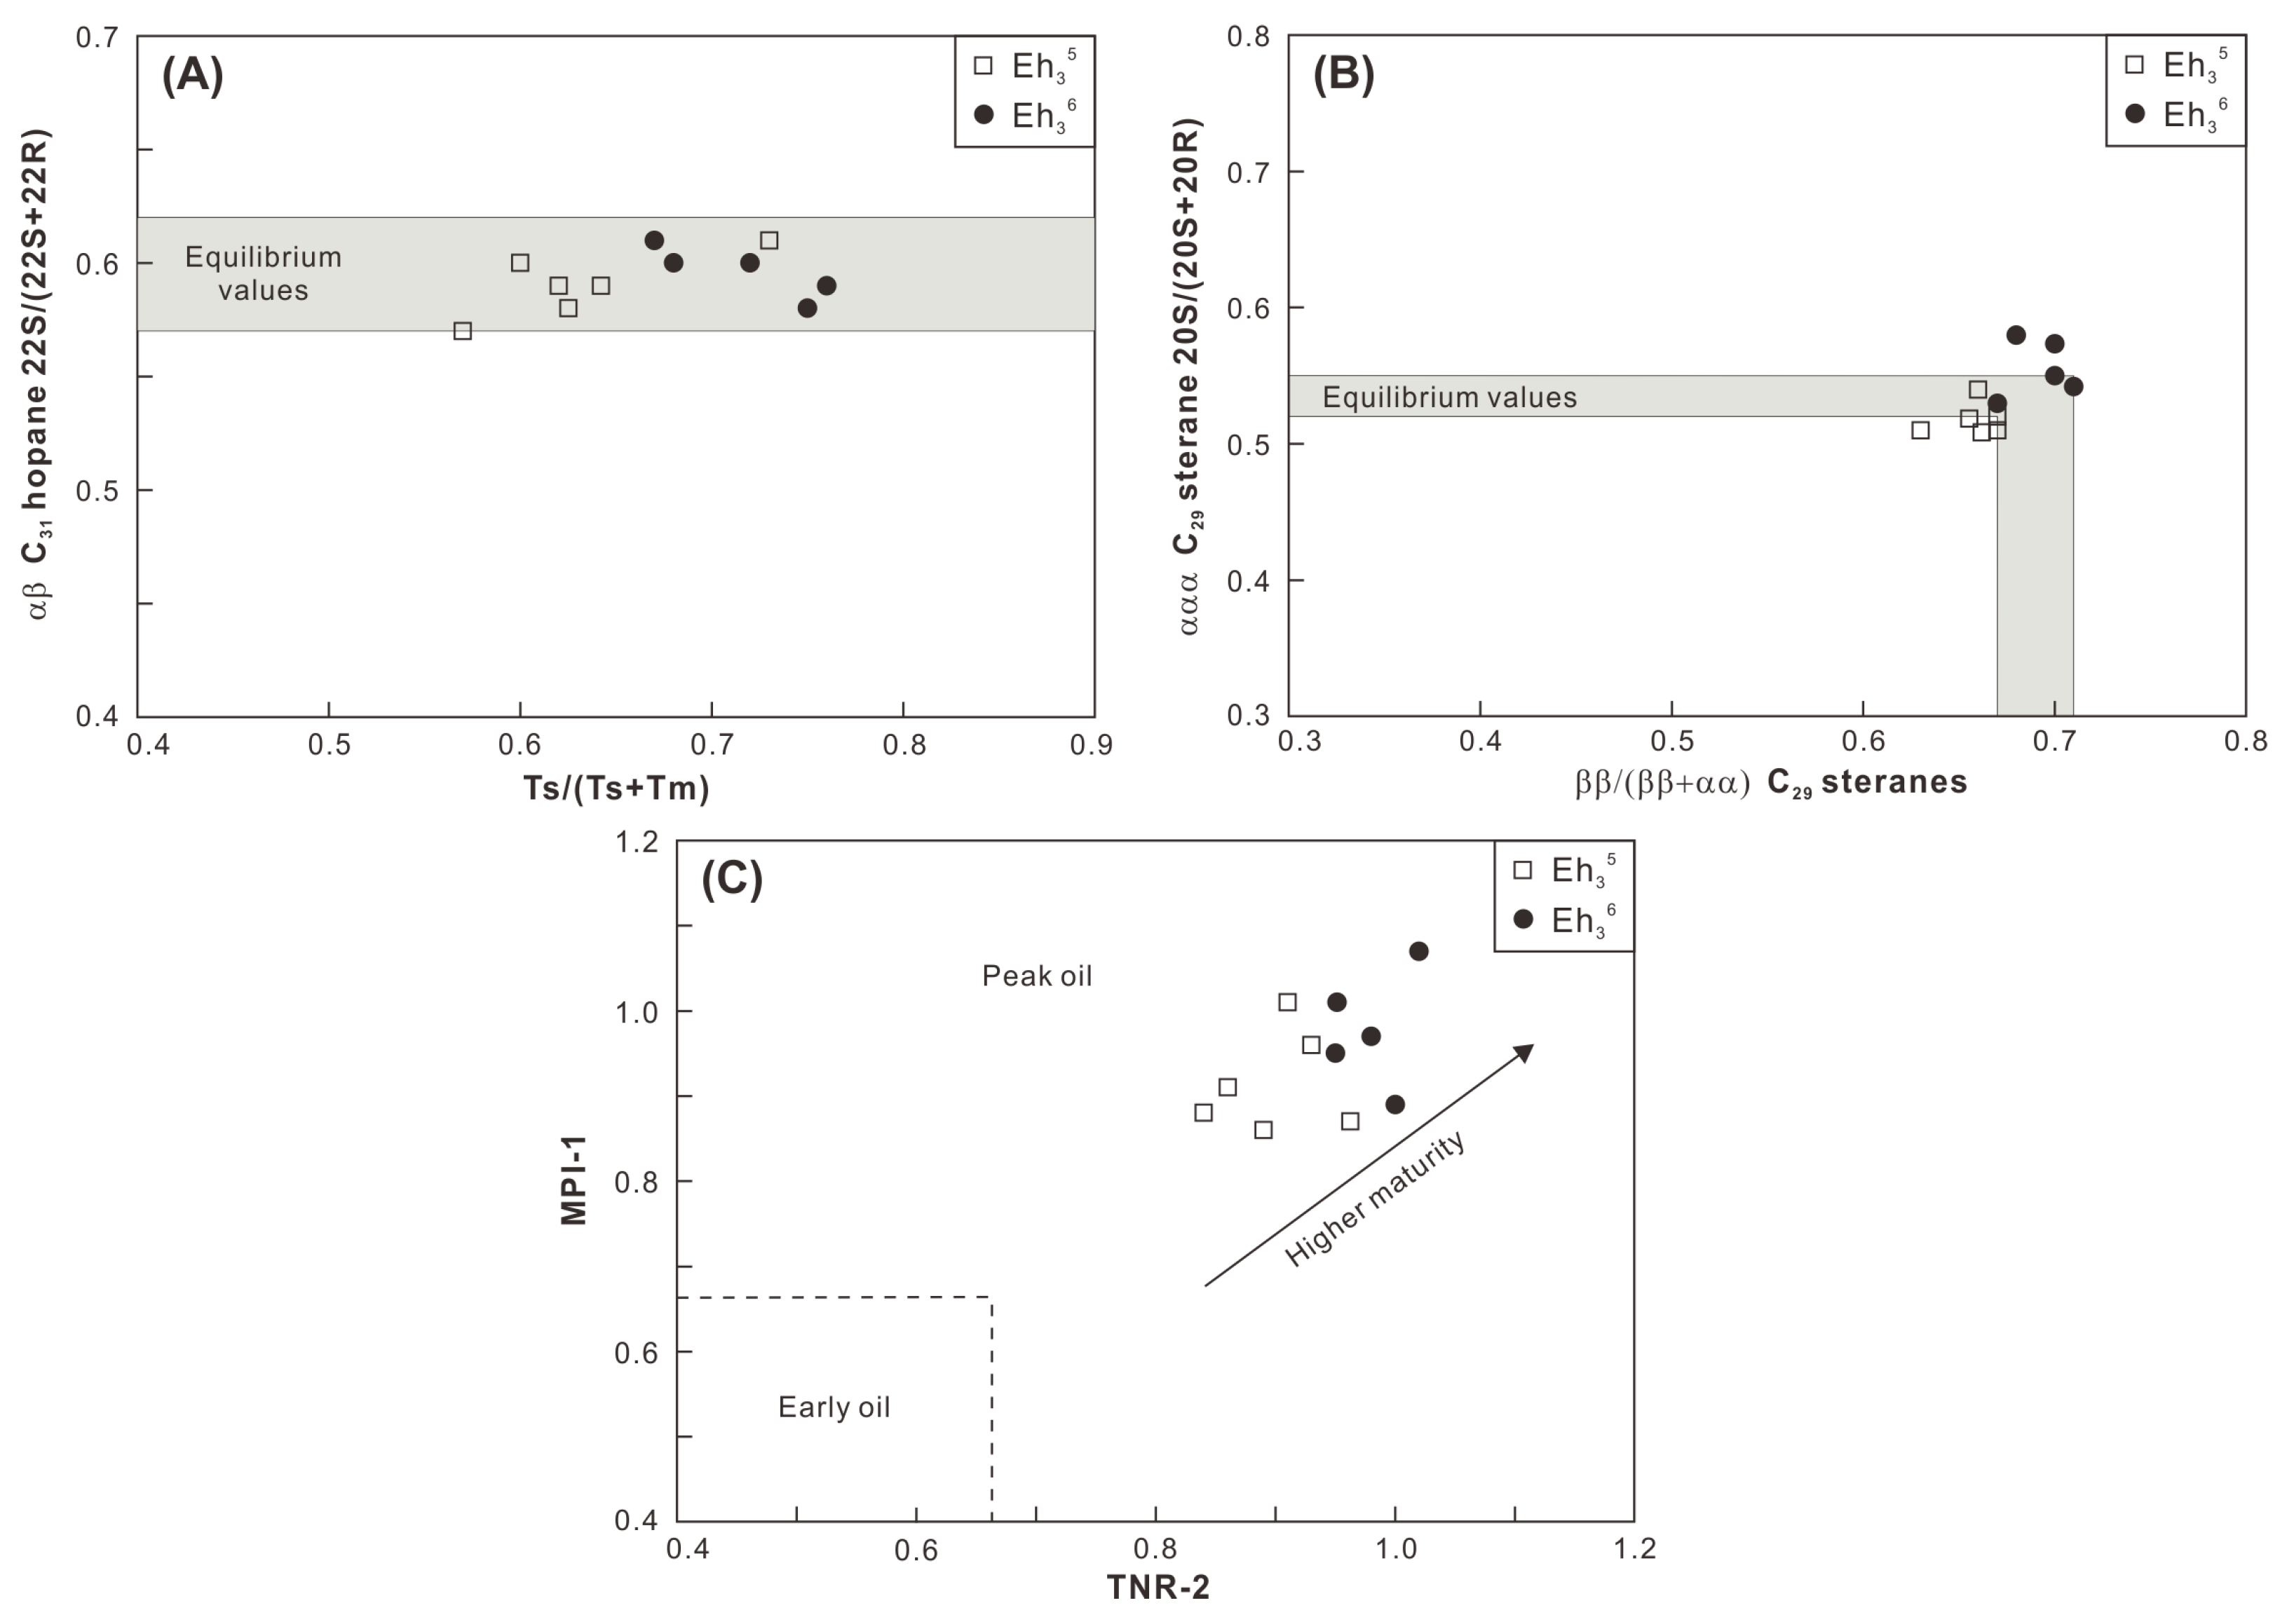
The mass chromatograms of terpenoids (m/z 191; Figure 7C) illustrate that tricyclic terpanes are assigned within the range from C21 to C30 (excluding C22 and C27), along with C24 tetracyclic terpane. Short-chain tricyclic terpanes (<C24) are more abundant compared to their longer-chain homologues. The ratios of C24 tetracyclic/C26 tricyclic terpanes vary from 0.38 to 0.66 in the Eh36 shale and from 0.21 to 0.38 in the Eh35 shale (Table 2). The non-aromatic cyclic triterpenoids are primarily composed of hopanoids. The most abundant hopanoid is 17α, 21β C30 hopane (C30H), followed by 17a, 21β C29 norhopane, 17α, 21β C31-32 homohopane (22S+22R), 17β, 21α C29-30 moretane, and 18α(H)-trisnorhopane (Ts) and 17α(H)-trisnorhopane (Tm). The ratios of Ts/(Ts+Tm) and C31 homohopane 22S/(22S+22R) isomers range from 0.67 to 0.76 and from 0.58 to 0.61 in the Eh36 shale, while in the Eh35 shale, these ratios vary between 0.57 and 0.73 and between 0.57 and 0.61, respectively. Gammacerane (Ga) is also assigned in m/z 191 mass chromatograms, with Ga/C30H ratios of 0.59–0.82 in the Eh36 shale and 0.50–0.71 in the Eh35 shale.
The mass chromatograms of steroids (m/z 217; Figure 7D) indicate the highest abundance of C29 regular steranes, followed by C27 and C28 regular steranes. The ratios of ααα C29/C27 sterane (20R) range from 1.89 to 2.64 in the Eh36 shale and from 1.50 to 2.32 in the Eh35 shale (Table 2). Within the range of C27-29 regular steranes, the 5α,14β,17β(H) steranes (20S+20R) dominate over the 5α,14α,17α(H) steranes (20S+20R). The ratios of aaa C29 steranes 20S/(20S+20R) and ββ/(ββ+αα) C29 steranes fluctuate between 0.53 and 0.58 and between 0.68 and 0.71 in the Eh36 shale, whereas the Eh35 shale exhibits two ratios of 0.51–0.54 and 0.63–0.67, respectively. Additionally, minor proportions of 13α,17β C27 diasteranes (20S+20R) are also assigned.
Phenanthrene (P) and its mono-, di-, and tri-methyl-substituted homologues (MP, DMP, and TMP) are the predominant aromatic compounds (Figure 8), followed by chrysene and its methyl-substituted homologues (MChr), benzo[e]pyrene (B[e]P), fluorene (F), methyl biphenyl (MB), dibenzofuran (DBF), tri- and tetra-methyl naphthalene (TMN, TeMN), and dibenzothiophene (DBT). The Methylphenanthrene Index 1 (MPI-1 = 1.89×(3-MP+2-MP)/[P+1.26×(9-MP+1-MP)]) [28] values in the Eh36 and Eh35 shale ranges from 0.89 to 1.07 and from 0.86 to 1.01, respectively (Table 2). The trimethylnaphthalene ratio-2 (TNR-2 = (2,3,6-TMN+1,3,7-TMN)/(1,3,5-TMN+1,3,6-TMN+ 1,4,6-TMN)) [29] values vary between 0.95 and 1.02 for the Eh36 shale and between 0.84 and 0.93 for the Eh35 shale. Considering F, DBF, and DBT as 100%, the Eh36 shale has a larger percentage of DBT, but the Eh35 shale has a higher concentration of DBF.

5. Discussion

5.1. Maturity

A peak oil window maturity is indicated by the mean values of random vitrinite reflectance (0.9–1.0%) for the Eh36 and Eh35 shale (Figure 4; Table 1). The conclusion is confirmed by the Tmax values, which are mainly distributed between 440 °C and 460 °C (Figure 3). Maturity indicators derived from terpenoids and steroids, including αβ C31 homohopane 22S/(22S+22R), Ts/(Ts+Tm), ααα C29 sterane 20S/(20S+20R), and ββ/(ββ+αα) C29 steranes ratios, are close to the corresponding equilibrium values (Figure 9A,B), all of which suggest a maturity characteristic of the peak oil window [30]. Furthermore, aromatic maturity indicators like MPI-1 and TNR-2 confirm a maturity stage at the peak oil window (Figure 9C). Overall, the Eh36 shale has greater MPI-1 and TNR-2 values than the Eh35 shale, revealing a comparatively higher maturity. The peak oil window maturity is also evidenced by the presence of degraded telalginite (Figure 5B). Considering that the influences of thermal maturity on both intervals are comparable, paleoenvironmental biomarker indicators (e.g., Pr/Ph) are applied to contrast the paleoenvironmental differences between two intervals.

5.2. Organic Matter (OM) Source

In contrast to the Eh33 and Eh32 shales, which exhibit a majority of type I-II1 kerogen [15], the Eh36 and Eh35 shales display dominance by type II2-III kerogen, suggesting that the organic matter is primarily derived from terrigenous higher plants (Figure 3). This inference is supported by the prevalence of terrigenous macerals (e.g., terrigenous liptinite, vitrinite, and inertinite) in both shale intervals, accounting for 82–91 vol.% (mmf = mineral matter free) and 68–85 vol.% (mmf) in the Eh36 and Eh35 shale, respectively. A negative correlation exists between the HI values and the contents of terrigenous macerals, indicating that the decreased HI values are associated with the increased contribution of higher plants (Table 1).
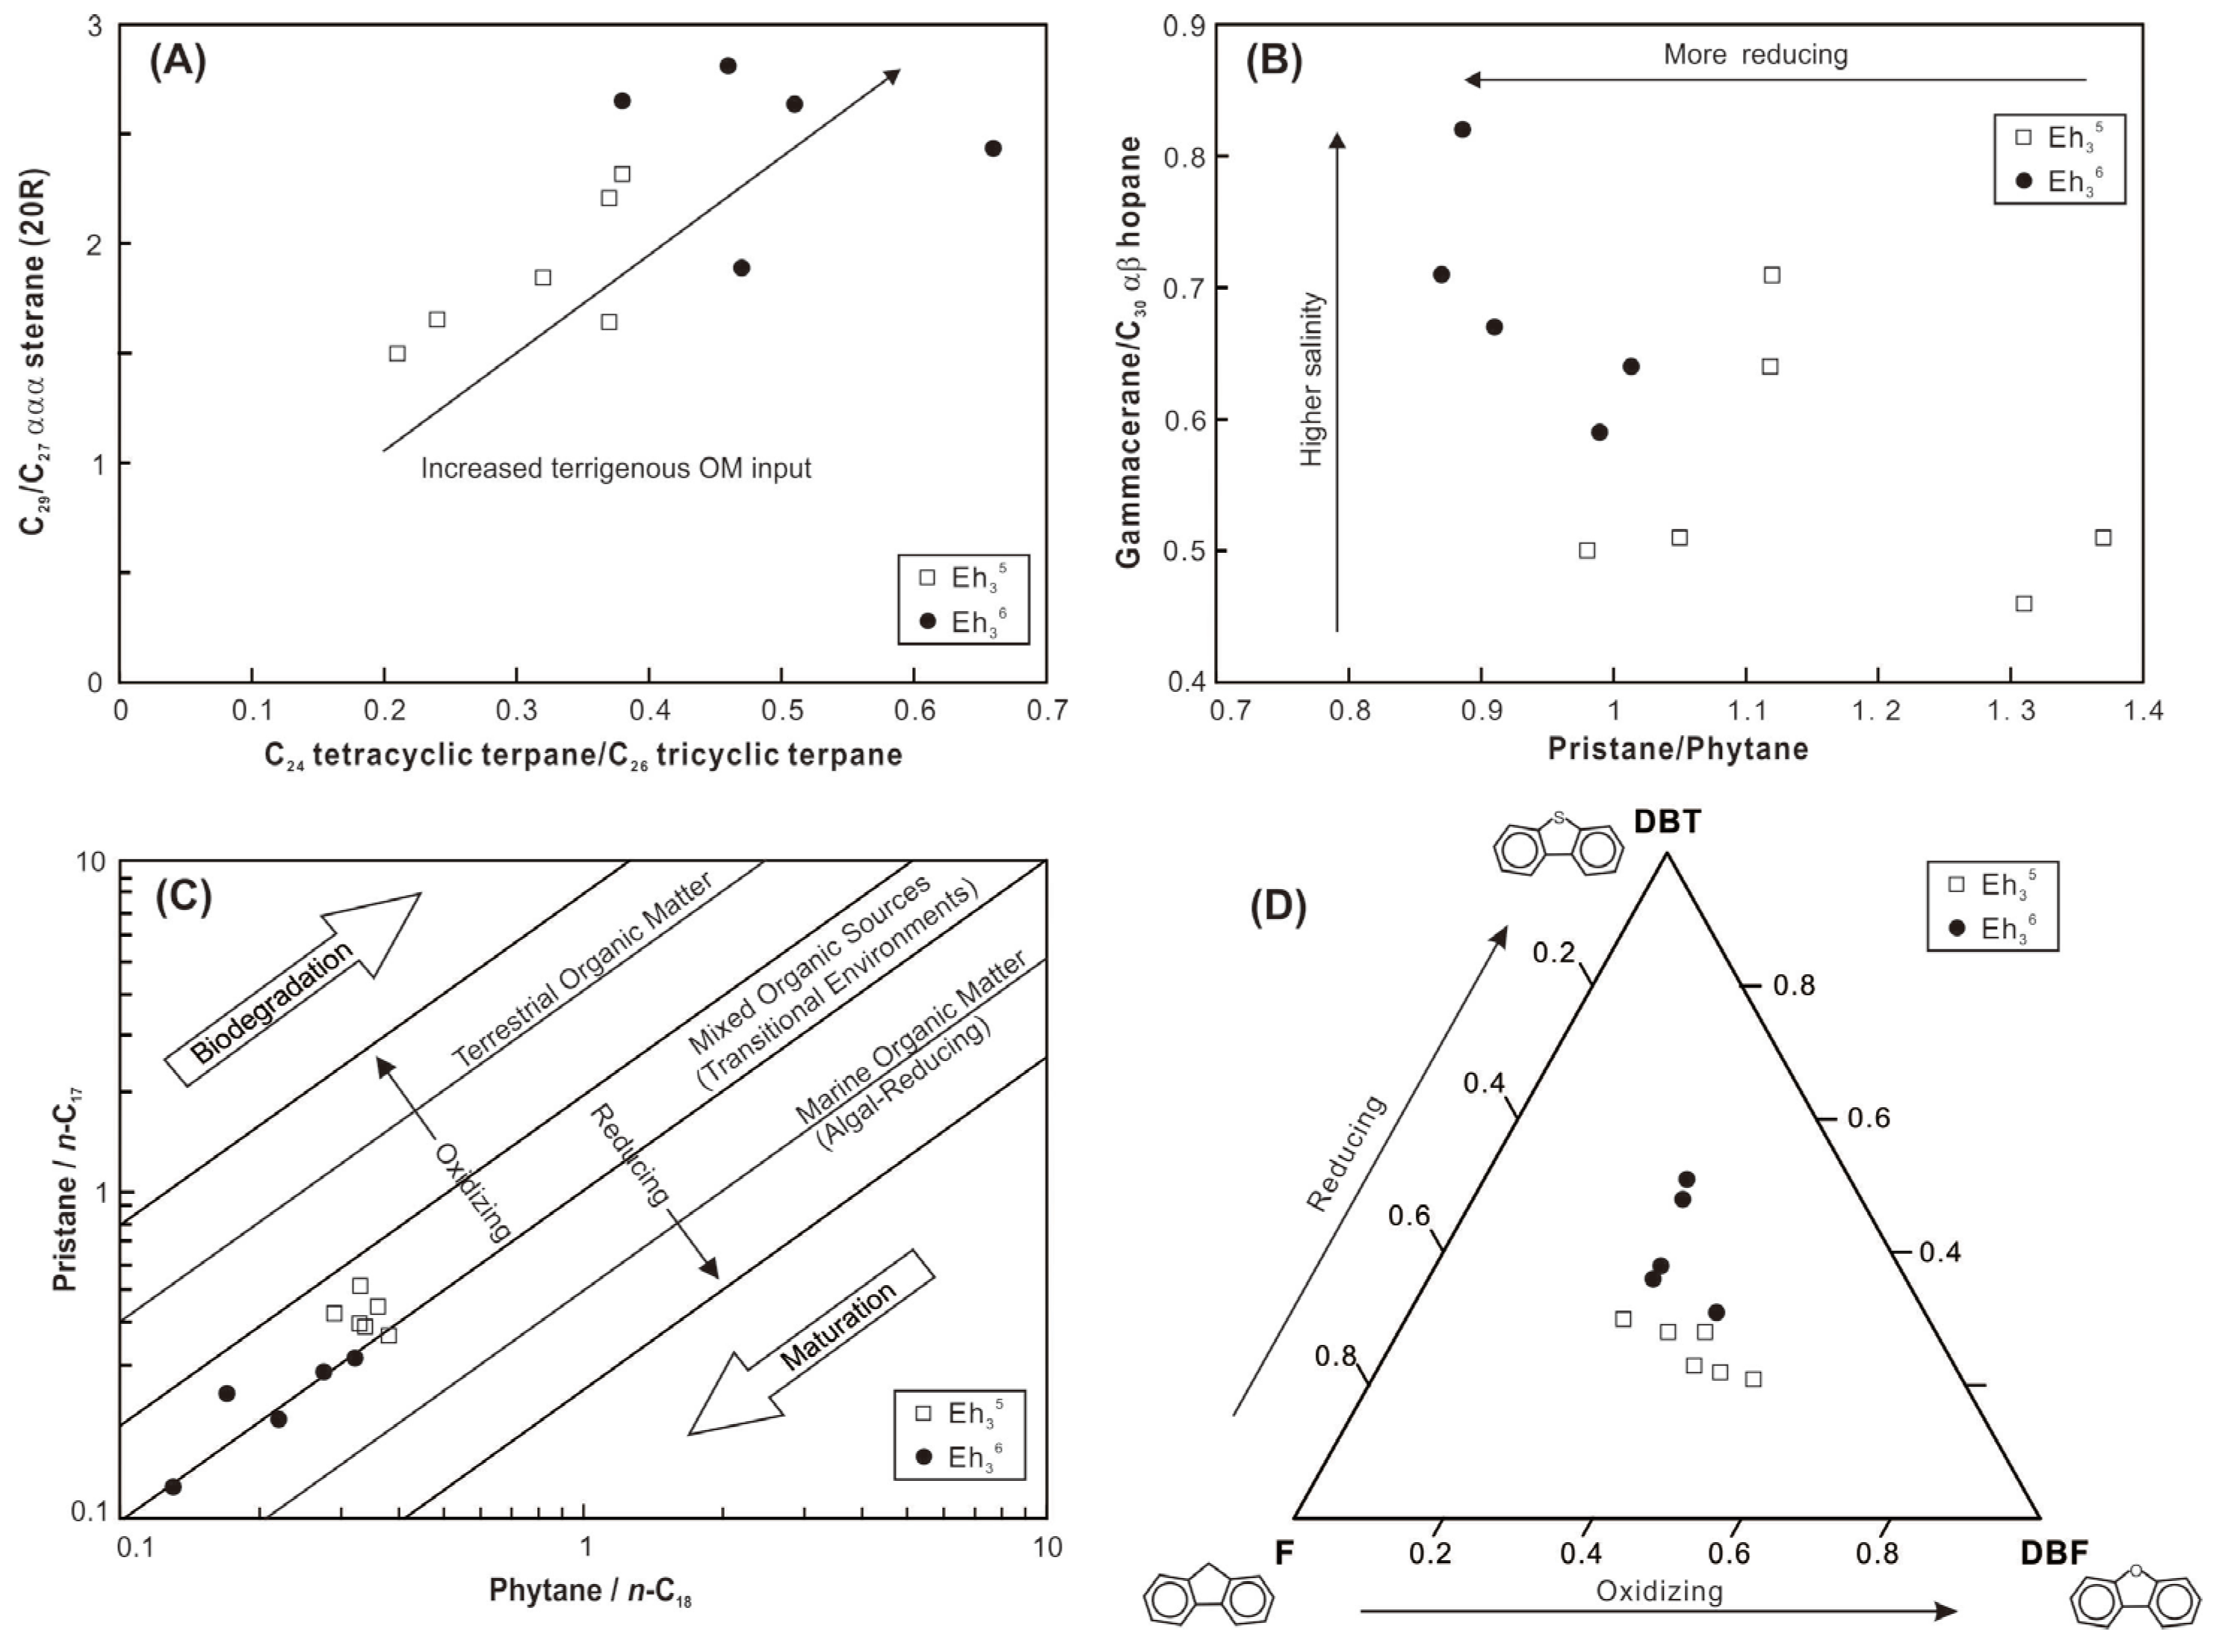
High ratios of C24 tetracyclic/C26 tricyclic terpanes (C24 Tet/C26 TT) are indicative of significant input of terrigenous OM [31]. The Eh36 shale exhibits higher C24 Tet/C26 TT ratios compared to the Eh35 shale, suggesting a substantial influx of terrigenous OM during the shale’s deposition (Figure 10A). It is commonly known that the main source of C27 sterols is algae, whereas higher plants are usually linked to C29 sterols. [32]. While some biomarker studies have revealed elevated levels of 24-ethylesterols in some microalgae species [33], the likelihood of microalgae-derived C29 steranes can be ruled out in this case, given that OM is predominantly sourced from higher plants. Therefore, the elevated ratios of C29/C27 ααα steranes (20R) in the Eh36 shale are consistent with the increased terrigenous OM input, which corroborates the findings of C24 Tet/C26 TT ratios (Figure 10A). Labdanes, which are typical higher plant-derived biomarkers [34], have also been assigned (Figure 7A), further confirming the contribution of terrigenous OM to the shale.
Furthermore, a portion of OM in shale may originate from bacteria, as indicated by the elevated concentrations of hopanoids (particularly αβ C30 hopane) and the assignment of methylheptadecanes (Figure 7A,C) [35]. Hopanoids are mainly produced by prokaryotic organisms such as bacteria [36], whereas 7- and 8-methylheptadecanes are primarily generated by cyanobacteria and are found in significant concentrations in pure cultures of cyanobacteria [37].

5.3. Paleoenvironment Reconstruction

In the middle of the Biyang Depression during the Eh36 and Eh35 periods, deep-to-semi-deep lacustrine environments were generally developed [20,22]. The integration of elemental compositions and biomarkers of shale reflects a variety of depositional environments, including paleosalinity, redox conditions, paleoproductivity, and detrital input. The B/Ga and Sr/Ba ratios, as well as the gammacerane index (GI = Ga/C30H ratios), are utilized to infer paleosalinity levels. The B/Ga ratios range from 2.8 to 5.4 in the Eh36 shale and from 1.7 to 3.8 in the Eh35 shale, indicative of predominantly brackish and freshwater conditions, respectively (Figure 11A; based on the threshold proposed by [38]). This interpretation is corroborated by the higher GI values observed in the Eh36 shale (0.59–0.82) compared to the Eh35 shale (0.50–0.71; Figure 10B). However, the results derived from Sr/Ba ratios differ from those of the preceding parameters (Figure 11A). The impact of carbonate-hosted Sr in the shale is thought to be the cause of this discrepancy, as indicated by a robust positive correlation between the CaO contents and Sr concentrations (the inset figure in Figure 11A).
The Pr/Ph ratios exhibit variability, ranging from 0.87 to 1.0 in the Eh36 shale and 0.98 to 1.37 in the Eh35 shale, suggesting the prevalence of more reducing conditions, probably anoxic (in accordance with the threshold proposed by [39]), during the deposition of Eh36 shale (Figure 10B). Similarly, the cross-plot of Pr/n-C17 versus Ph/n-C18 indicates that the Eh36 shale plots closer to the region representing reducing conditions (Figure 10C). Fluorene (F) tends to convert into dibenzofuran (DBF) under sufficient oxygen conditions, whereas it tends to generate dibenzothiophene (DBT) in oxygen-depleted conditions [40]. Thus, the positioning of shale in the ternary plot of DBT-F-DBF suggests that the Eh36 shale was formed under comparatively more reducing conditions than the Eh35 shale (Figure 10D). Furthermore, the enrichment factors of U and Mo, serving as redox proxies of sediments [41], also indicate the prevalence of more reducing conditions during the deposition of Eh36 shale (Figure 11B).
The P/Al ratio and Babio value are applied to assess paleoproductivity. Overall, the Eh35 shale exhibits high P/Al ratios and Babio values, whereas the Eh36 shale displays comparatively low ratios and values (Figure 11C). These findings possibly suggest that the elevated paleoproductivity prevailed during the deposition of Eh35 shale. However, this conclusion may raise questions, as an essential premise for utilizing P and Ba as productivity indicators is the predominance of aquatic-origin OM [42], which is evidently inconsistent with the studied shale. As discussed in Section 5.2, the primary source of OM is terrigenous higher plants, implying potentially low productivity of aquatic organisms. Therefore, it is postulated that aquatic productivity was low during the deposition of both intervals, potentially exerting limited influence on OM enrichment and shale formation.
Aluminum primarily originates from clay minerals, while titanium mainly occurs in clay and heavy minerals such as rutile. Clay minerals are abundant in both the Eh36 and Eh35 shale, whereas rutile is commonly found in the Eh3 [19,22]. Therefore, the contents of Al and Ti are utilized to reveal detrital influx. The Eh36 shale has a slightly higher average Al2O3 and TiO2 concentration than the Eh35 shale, suggesting an increased detrital supply to the paleo-lake during the deposition of Eh36 shale.
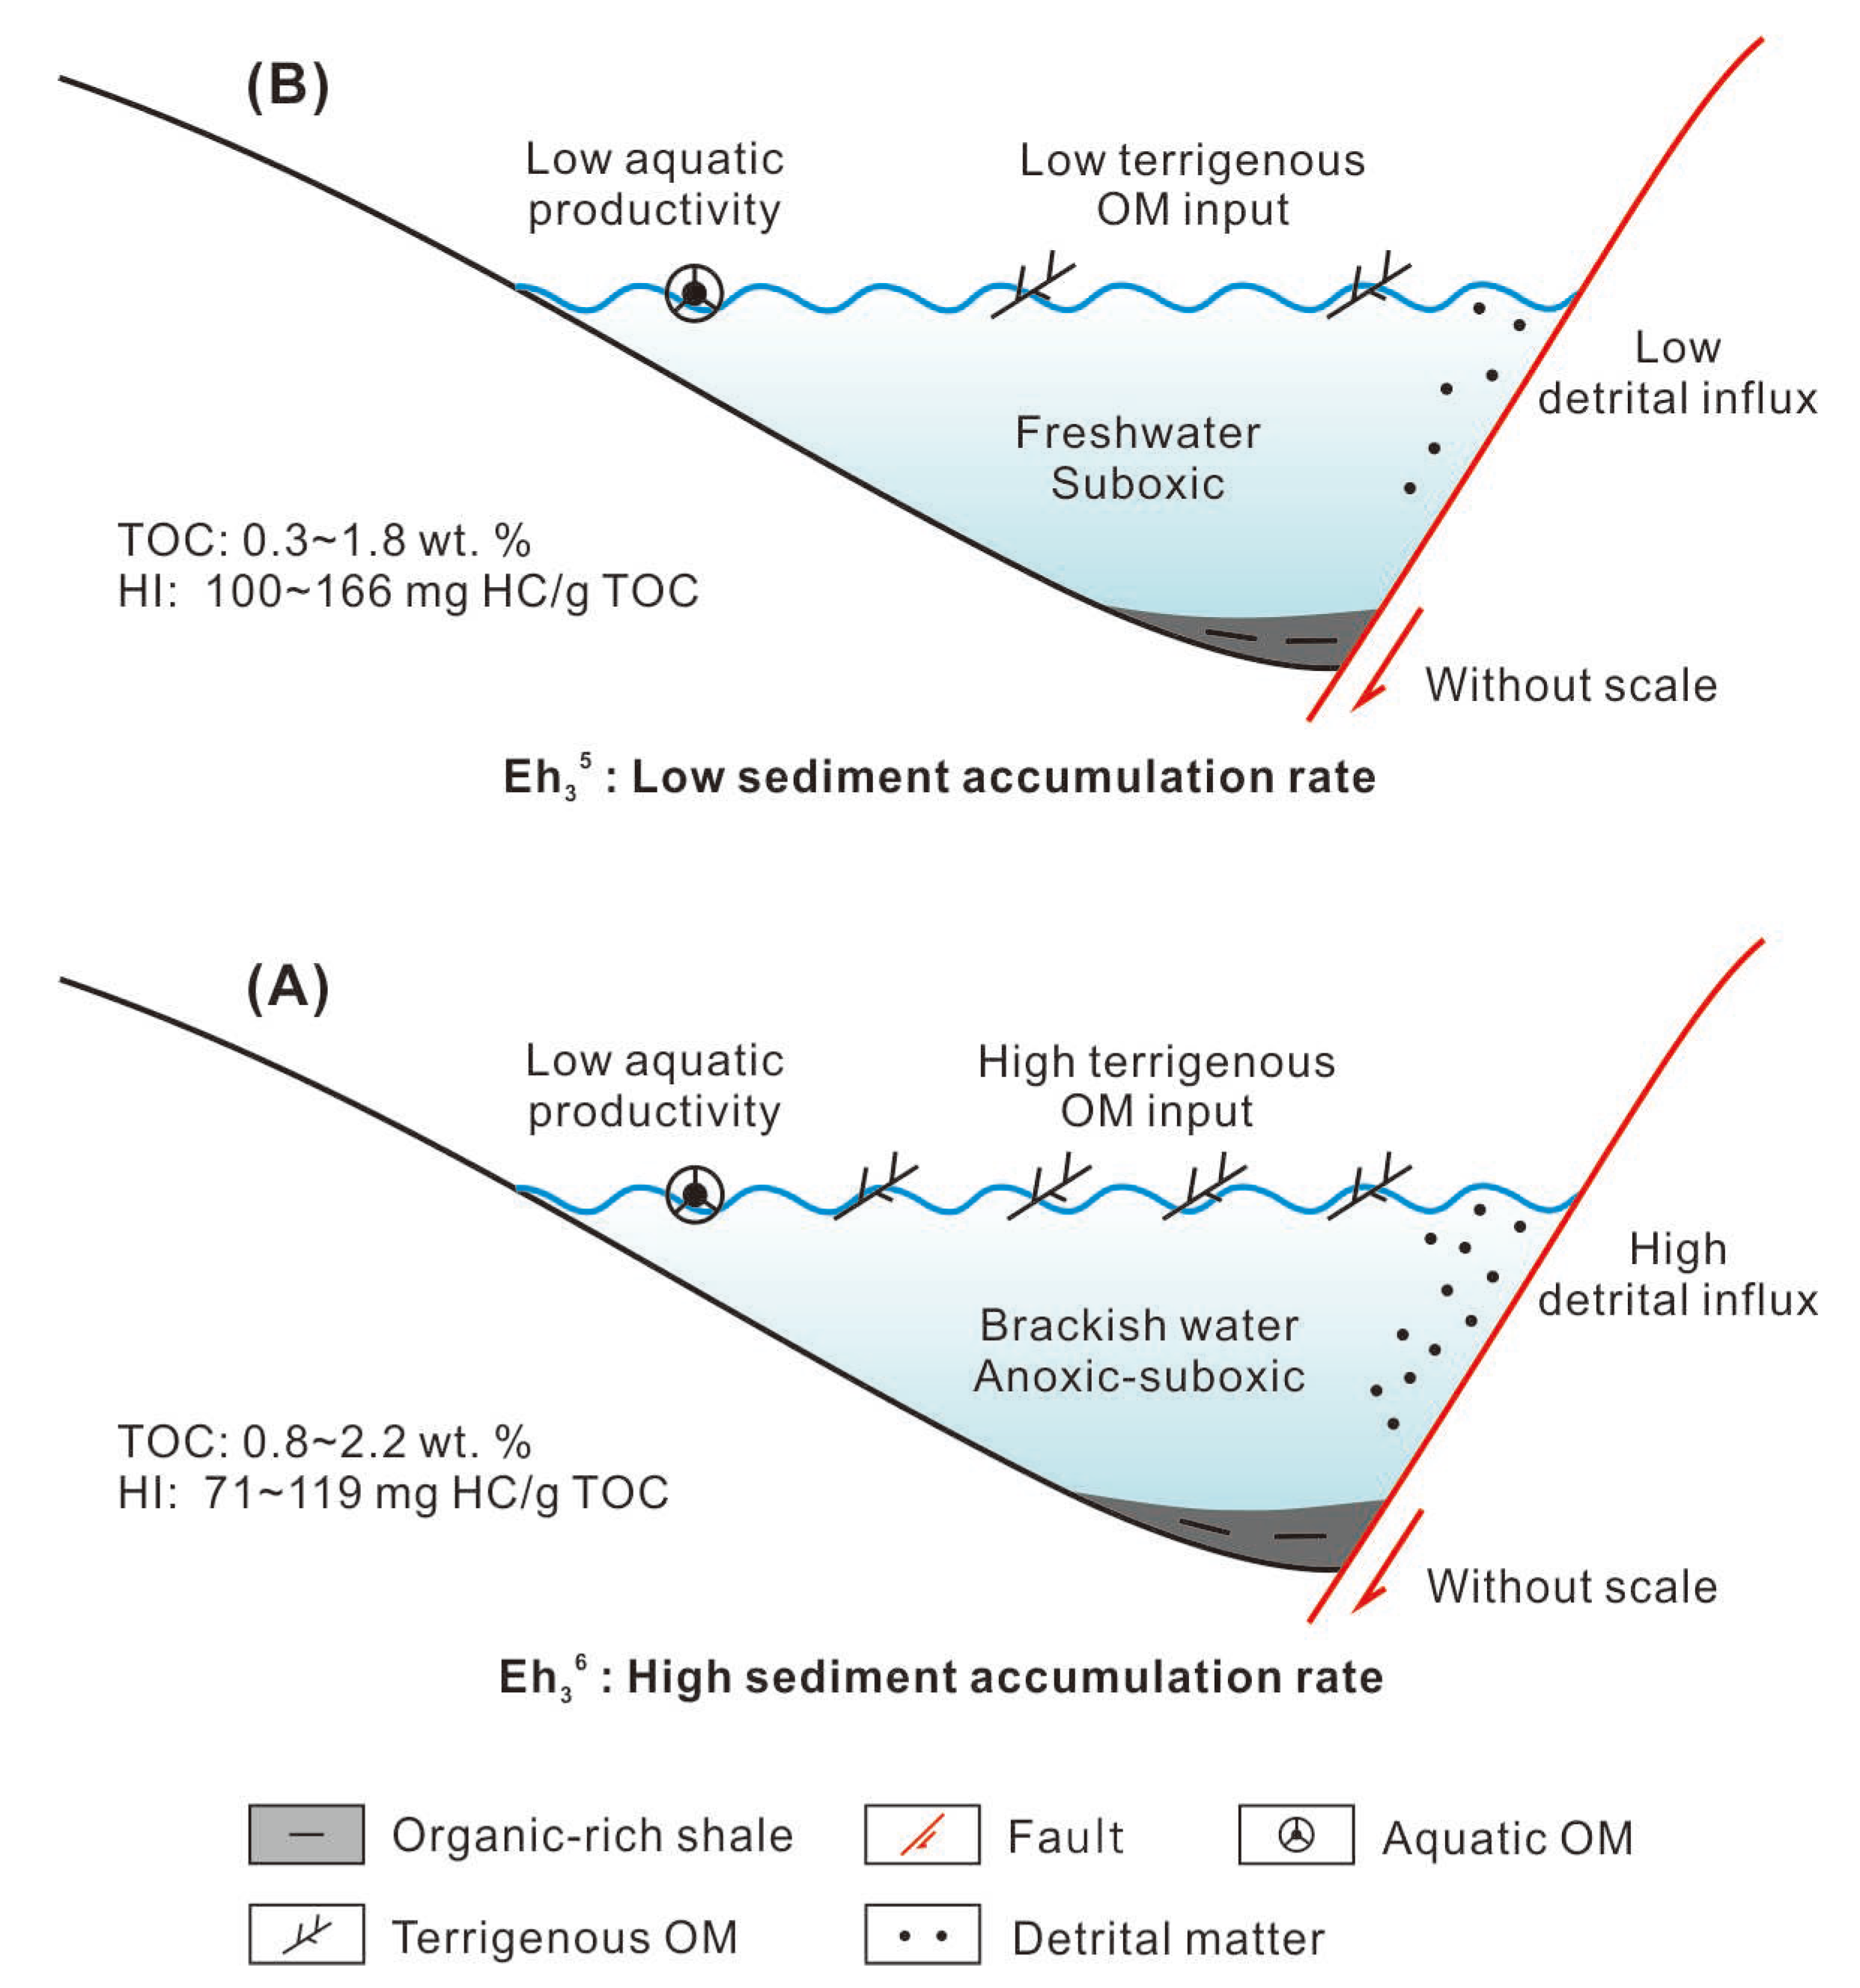
The cartoons illustrating the depositional models of Eh36 and Eh35 shale are depicted in Figure 12. During the deposition of Eh36 shale, there was a notable influx of detrital matter and terrigenous OM into the paleo-lake. Using 2000 Monte Carlo simulations of potential sedimentation rates, the earlier study performed an enhanced correlation coefficient (COCO) analysis for every member of Eh3, resulting in high sediment accumulation rates (SARs), at 17.8 cm/kyr [23]. These high SARs facilitated the rapid burial of terrigenous OM, thus favoring its preservation. Moreover, because of the occurrence of gypsum at the top of the Ed and the relatively dry paleoenvironment, surface runoff may have transported salt ions released through the weathering of parent rock [43], leading to increased salinity in the paleo-lake and potentially promoting water stratification. Accordingly, the deposition of Eh36 shale, which has a high TOC and low HI value, was facilitated by the combination of a large terrigenous OM input and advantageous preservation circumstances (Figure 12A). In contrast, the deposition of Eh35 shale was characterized by comparatively lower detrital matter and terrigenous OM, corresponding to lower SARs [23]. This lower terrigenous OM input, in conjunction with freshwater and suboxic conditions, resulted in the deposition of Eh35 shale with low TOC and relatively higher HI values (Figure 12B).

5.4. Hydrocarbon Potential and Implications for Regional Hydrocarbon Exploration

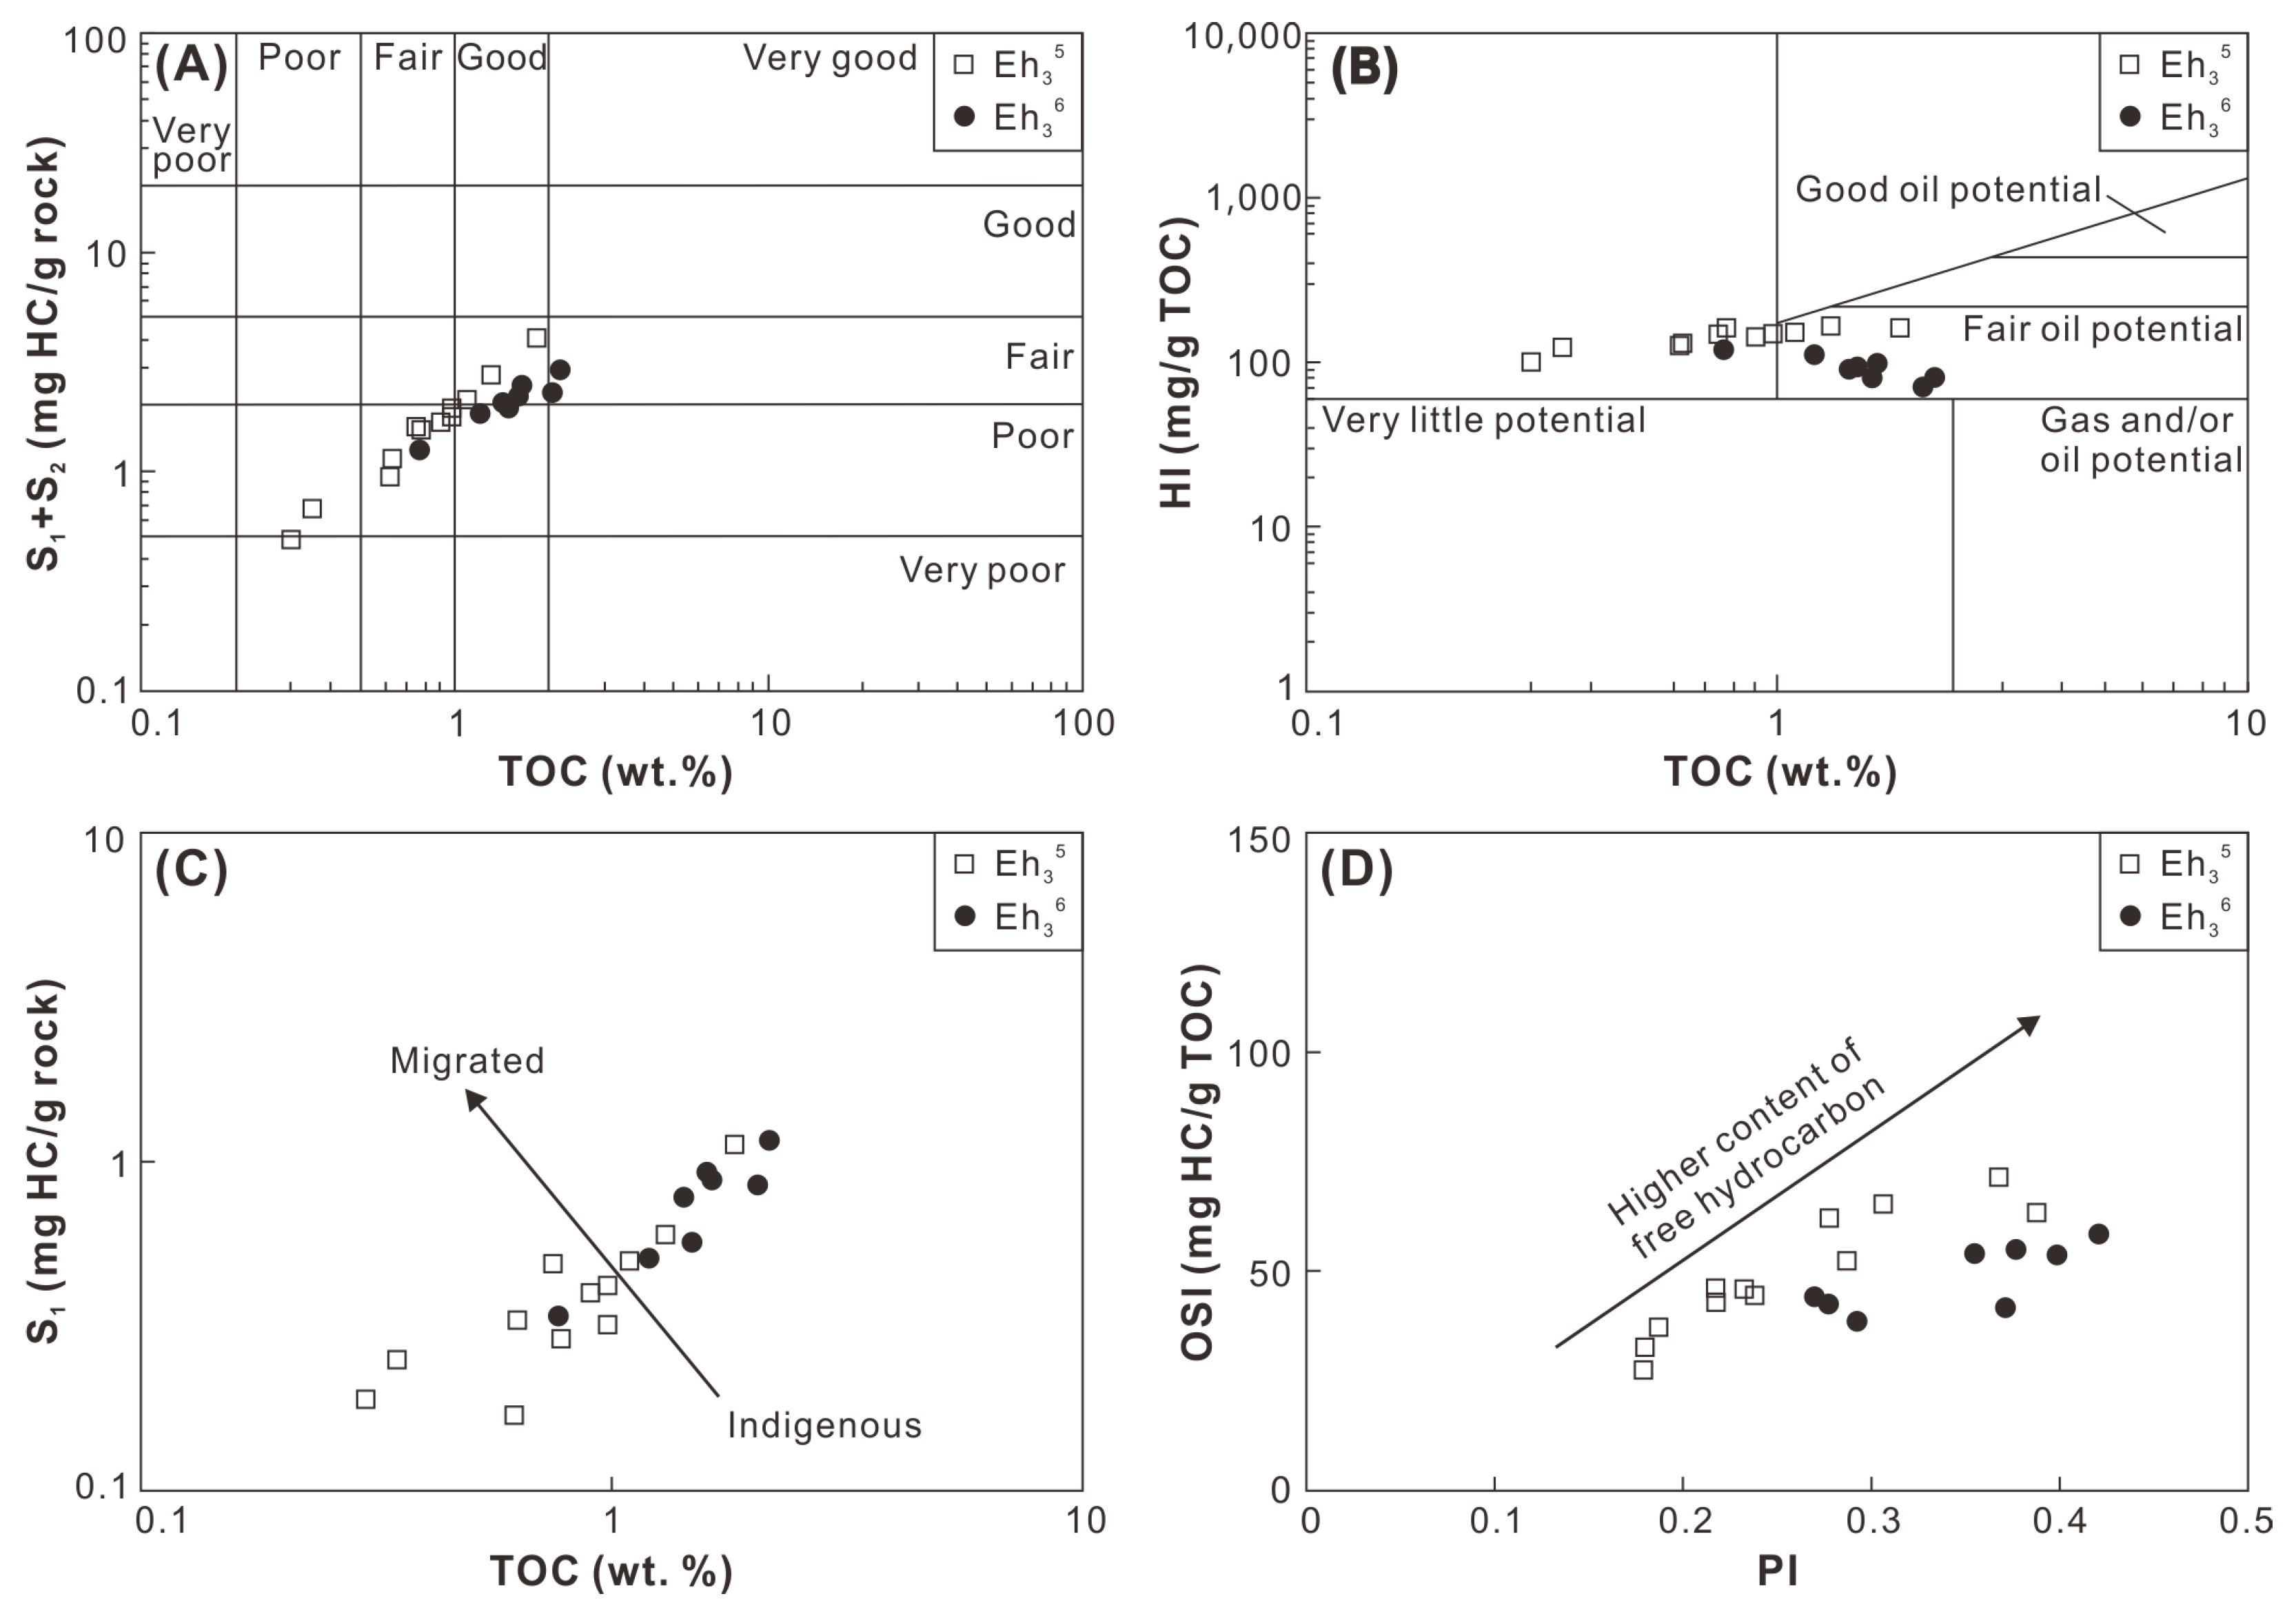
The hydrocarbon generation potential of the Eh36 and Eh35 shale was evaluated using the cross-plot of TOC versus S1+S2 [44]. The Eh36 shale falls within the region characterized by fair potential, whereas the Eh35 shale predominantly exhibits poor-to-fair potential (Figure 13A). This observation is further corroborated by the cross-plot of TOC versus HI, where the Eh36 shale demonstrates fair oil potential, while the Eh35 shale exhibits little-to-fair oil potential (Figure 13B). The hydrocarbon retention potential of the Eh36 and Eh35 shale is assessed through the cross-plots of TOC versus S1 and production index (PI = S1/(S1+S2)) versus oil saturation index (OSI = 100 × S1/TOC). In these figures, comparatively higher contents of free (or migrated) hydrocarbons are evident in the Eh36 shale compared to the Eh35 shale (Figure 13C,D).
Overall, the Eh36 and Eh35 shale studied herein exhibit only poor-to-fair oil potential, suggesting their limited contribution to oil reservoirs in the Biyang Depression. However, given the predominance of type II2-III kerogen, it is hypothesized that these shales may possess significant gas potential in regions where wet/dry gas window maturity is attained. Notably, several gas fields have already been discovered near the Well A3 (Figure 1C). Considering the minimum OSI threshold (~100 mg HC/g TOC) for prospective shale oil successions in the lacustrine basins of China, 4 the studied Eh36 and Eh35 shale exhibit only minimal potential for shale oil exploration. Nevertheless, it is speculated that, in the central region of the paleo-lake, distant from the source area, there may be deposition of salinized lacustrine shale characterized by type I-II1 kerogen and higher free oil contents. Therefore, the Eh36 and Eh35 shale around the Anpeng area, which was the sedimentary depocenter during the period, could represent a promising target for shale oil exploration.

6. Conclusions

The impact of terrigenous input on the deposition of salinized lacustrine shale was investigated using an example from the newly explored strata (Eh36 and Eh35) of the deep regions in the Biyang Depression, East China. The TOC contents of Eh36 and Eh35 shale range from 0.3 to 2.2 wt. %, with a predominance of type II2-III kerogen. Both shale intervals exhibit a peak oil window maturity, as evidenced by vitrinite reflectance, Tmax, and biomarker-derived maturity parameters. The primary source of OM is considered to be terrigenous higher plants for both shale intervals, supported by the dominance of terrigenous macerals (e.g., terrigenous liptinite, vitrinite, and inertinite), low HI values, and biomarker indicators. Additionally, a portion of the OM may originate from bacteria, as indicated by the high abundance of hopanoids and the assignment of 7- and 8-methylheptadecanes. During the deposition of Eh36 shale, a significant influx of detrital matter and terrigenous OM occurred, corresponding to high sediment accumulation rates (SARs). These high SARs facilitated the rapid burial of OM and increased paleosalinity by transporting salt ions from the provenance regions to the paleo-lake, thereby favoring OM preservation. Consequently, the Eh36 shale, characterized by high TOC and low HI values, was deposited under the influence of high terrigenous OM input and favorable preservation conditions. In contrast, the deposition of Eh35 shale involved a comparatively lower flux of detrital matter and terrigenous OM, resulting in shale with lower TOC and relatively higher HI values. Overall, the studied shale exhibits only poor-to-fair potential for hydrocarbon generation and retention. However, areas with higher maturity and a better kerogen type may hold significant potential for conventional gas and shale oil exploration in the Biyang Depression, respectively.

Author Contributions

Conceptualization and writing—original draft preparation, Y.S.; writing—review and editing, P.P.; funding acquisition, S.X.; project administration, S.J.; funding acquisition, B.G.; funding acquisition and methodology, S.L.; investigation, Q.C.; investigation, Z.L.; investigation, L.W.; investigation, C.L. All authors have read and agreed to the published version of the manuscript.

Funding

This research was funded by the general program of National Natural Science Foundation of China (Mechanism and prediction of fracture-induced by in situ heating of shale oil and oil shale reservoirs with different lithofacies), Open funding project of Sinopec Key Laboratory of Shale Oil/Gas Exploration and Production Technology (Reconstruction of biological community structure of organic-rich shale in saline lake basins and its quantitative indication of paleoproductivity), and National Natural Science Foundation of China (Grant Nos. 42072174, 42073067, and 41902139).

Data Availability Statement

The original contributions presented in the study are included in the article; further inquiries can be directed to the corresponding authors.

Acknowledgments

Henan Oilfield Company (SINOPEC) is gratefully appreciated for the permission of sampling.

Conflicts of Interest

The authors declare no conflicts of interest.

References

  1. Ruble, T.E.; Lewan, M.D.; Philp, R.P. New insights on the Green River petroleum system in the Uinta Basin from hydrous pyrolysis experiments. AAPG Bull. 2001, 85, 1333–1371. [Google Scholar] [CrossRef]
  2. Zou, C.; Zhu, R.; Chen, Z.Q.; Ogg, J.G.; Wu, S.; Dong, D.; Qiu, Z.; Wang, Y.; Wang, L.; Lin, S.; et al. Organic-Matter-Rich shales of China. Earth Sci. Rev. 2019, 189, 51–78. [Google Scholar] [CrossRef]
  3. Warren, J.K. Evaporites through time: Tectonic, climatic and eustatic controls in marine and nonmarine deposits. Earth Sci. Rev. 2010, 98, 217–268. [Google Scholar] [CrossRef]
  4. Wang, M.; Guo, Z.; Jiao, C.; Lu, S.; Li, J.; Xue, H.; Li, J.; Li, J.; Chen, G. Exploration progress and geochemical features of lacustrine shale oils in China. J. Pet. Sci. Eng. 2019, 178, 975–986. [Google Scholar] [CrossRef]
  5. Liu, B.; Song, Y.; Zhu, K.; Su, P.; Ye, X.; Zhao, W. Mineralogy and Element Geochemistry of Salinized Lacustrine Organic-Rich Shale in the Middle Permian Santanghu Basin: Implications for Paleoenvironment, Provenance, Tectonic Setting and Shale Oil Potential. Mar. Pet. Geol. 2020, 120, 104569. [Google Scholar] [CrossRef]
  6. Liu, B.; Wang, H.; Fu, X.; Bai, Y.; Bai, L.; Jia, M.; He, B. Lithofacies and Depositional Setting of a Highly Prospective Lacustrine Shale Oil Succession from the Upper Cretaceous Qingshankou Formation in the Gulong Sag, Northern Songliao Basin, Northeast China. AAPG Bull. 2019, 103, 405–432. [Google Scholar] [CrossRef]
  7. Hofmann, P.; Huc, A.Y.; Carpentier, B.; Schaeffer, P.; Albrecht, P.; Kelly, B.; Maxwell, J.R.; Damsté, J.S.S.; de Leeuw, J.W.; Leythaeuser, D. Organic matter of the Mulhouse Basin, France: A synthesis. Org. Geochem. 1993, 20, 1105–1123. [Google Scholar] [CrossRef]
  8. Mascle, A.; Vially, R. The petroleum systems of the southeast basin and Gulf of Lion (France). Geol. Soc. 1999, 156, 121–140. [Google Scholar] [CrossRef]
  9. Rodriguez, N.D.; Philp, R.P. Source Rock Facies Distribution predicted from oil geochemistry in the Central Sumatra Basin, Indonesia. AAPG Bull. 2015, 99, 2005–2022. [Google Scholar] [CrossRef]
  10. Guo, P.; Liu, C.; Gibert, L.; Huang, L.; Zhang, D.; Dai, J. How to find high-quality petroleum source rocks in saline lacustrine basins: A case study from the Cenozoic Qaidam Basin, NW China. Mar. Pet. Geol. 2020, 111, 603–623. [Google Scholar] [CrossRef]
  11. Xin, B.; Hao, F.; Han, W.; Xu, Q.; Zhang, B.; Tian, J. Paleoenvironment evolution of the lacustrine organic-rich shales in the second member of Kongdian Formation of Cangdong Sag, Bohai Bay Basin, China: Implications for organic matter accumulation. Mar. Pet. Geol. 2021, 133, 105244. [Google Scholar] [CrossRef]
  12. Liang, C.; Jiang, Z.; Cao, Y.; Wu, J.; Wang, Y.; Hao, F. Sedimentary characteristics and origin of lacustrine organic-rich shales in the salinized Eocene Dongying Depression. GSA Bull. 2018, 130, 154–174. [Google Scholar] [CrossRef]
  13. Kong, X.; Jiang, Z.; Zheng, Y.; Xiao, M.; Chen, C.; Yuan, H.; Chen, F.; Wu, S.; Zhang, J.; Han, C.; et al. Organic geochemical characteristics and organic matter enrichment of mudstones in an Eocene saline lake, Qianjiang Depression, Hubei Province, China. Mar. Pet. Geol. 2020, 114, 104194. [Google Scholar] [CrossRef]
  14. Guan, M.; Liu, X.; Jin, Z.; Zhao, W.; Liu, W.; Bian, L.; Dong, J.; Zeng, X.; Zeng, B.; Sun, B.; et al. The formation of the Paleocene lacustrine organic-rich shale in the Subei Basin, East China Associated with the Early Late Paleocene event and marine incursions. Mar. Pet. Geol. 2024, 162, 106730. [Google Scholar] [CrossRef]
  15. Song, Y.; Li, S.; Hu, S. Warm-humid paleoclimate control of salinized lacustrine organic-rich shale deposition in the Oligocene Hetaoyuan Formation of the Biyang Depression, East China. Int. J. Coal Geol. 2019, 202, 69–84. [Google Scholar] [CrossRef]
  16. Xu, S.; Wang, Y.; Bai, N.; Wu, S.; Liu, B. Organic matter enrichment mechanism in saline lacustrine basins: A review. Geol. J. 2024, 59, 155–168. [Google Scholar] [CrossRef]
  17. Li, S.; Hu, S.; Xie, X.; Lv, Q.; Huang, X.; Ye, J. Assessment of shale oil potential using a new free hydrocarbon index. Int. J. Coal Geol. 2016, 156, 74–85. [Google Scholar] [CrossRef]
  18. Li, J.; Liu, Z.; Zhang, X.; Feng, G.; Liu, J.; Ma, Y.; Lu, S.; Li, W.; Zhou, N. Effects of paleoenvironment on continental shale oil enrichment and producibility in the Biyang Depression. AAPG Bull. 2022, 106, 2043–2071. [Google Scholar] [CrossRef]
  19. Song, Y.; Cao, Q.; Li, S.; Hu, S.; Zhu, K.; Ye, X.; Wan, L. Salinized lacustrine organic-rich shale influenced by marine incursions: Algal-microbial community, paleoenvironment and shale oil potential in the Paleogene Biyang Depression, East China. Palaeogeogr. Palaeoclimatol. Palaeoecol. 2021, 580, 110621. [Google Scholar] [CrossRef]
  20. Song, Y.; Wan, L.; Xu, S.; Gao, B.; Li, C.; Li, Z.; Paerzhana, P. Lake-level-fluctuation control on shale oil enrichment of the salinized lacustrine organic-rich shale in the Paleogene Biyang Depression, East China. Minerals 2024, 14, 94. [Google Scholar] [CrossRef]
  21. Yuan, Y.Z.; Luo, J.Q.; Zhu, Y.; Liu, G.; Li, L.; Yu, M. Petroleum exploration history and enlightenment of Biyang Sag and Nanyang Sag in Nanxiang Basin. Xinjiang Petro. Geol. 2021, 42, 364–373, (In Chinese with English abstract). [Google Scholar]
  22. Dong, Y.; Zhu, X.; Xian, B.; Hu, T.; Geng, X.; Liao, J.; Luo, Q. Seismic Geomorphology Study of the Paleogene Hetaoyuan Formation, Central-South Biyang Sag, Nanxiang Basin, China. Mar. Pet. Geol. 2015, 64, 104–124. [Google Scholar] [CrossRef]
  23. Xu, K.; Chen, H.; Huang, C.; Ogg, J.G.; Zhu, J.; Lin, S.; Yang, D.; Zhao, P.; Kong, L. Astronomical Time Scale of the Paleogene Lacustrine Paleoclimate Record from the Nanxiang Basin, Central China. Palaeogeogr. Palaeoclimatol. Palaeoecol. 2019, 532, 109253. [Google Scholar] [CrossRef]
  24. Taylor, G.H.; Teichmüller, M.; Davis, A.; Diessel, C.F.K.; Littke, R.; Petrology, P.R. RobertOrganic Petrology. In A New Handbook Incorporating Some Revised Parts of Stach’s Textbook of Coal Petrology; Gebrüder Borntraeger: Berlin, Stuttgart, 1998; Geological Magazine; Volume 136, pp. 697–711. ISBN 3–443–01036–9. [Google Scholar]
  25. Shen, J.; Schoepfer, S.D.; Feng, Q.; Zhou, L.; Yu, J.; Song, H.; Wei, H.; Algeo, T.J. Marine Productivity Changes during the End-Permian Crisis and Early Triassic Recovery. Earth Sci. Rev. 2015, 149, 136–162. [Google Scholar] [CrossRef]
  26. Tribovillard, N.; Algeo, T.J.; Riboulleau, A. Trace metals as paleoredox and paleoproductivity proxies: An update. Chem. Geol. 2006, 232, 12–32. [Google Scholar] [CrossRef]
  27. Rudnick, R.L.; Gao, S. Composition of the continental crust. In Treatise on Geochemistry, 2nd ed.; Newnes: Boston, UK, 2014; pp. 1–51. [Google Scholar]
  28. Cassani, F.; Gallango, O.; Talukdar, S.; Vallejos, C.; Ehrmann, U. Methylphenanthrene maturity index of marine source rock extracts and crude oils from the Maracaibo Basin. Org. Geochem. 1988, 13, 73–80. [Google Scholar] [CrossRef]
  29. Radke, M.; Welte, D.H.; Willsch, H. Maturity Parameters Based on Aromatic Hydrocarbons: Influence of the Organic Matter Type. Org. Geochem. 1986, 10, 51–63. [Google Scholar] [CrossRef]
  30. Peters, K.E.; Walters, C.C.; Moldowan, J.M. The Biomarker Guide: Column 2, Biomarkers and Isotopes in Petroleum Systems and Earth History, 2nd ed.; Cambridge University Press: Cambridge, UK, 2005. [Google Scholar]
  31. Hanson, A.D.; Zhang, S.C.; Moldowan, J.M.; Liang, D.G.; Zhang, B.M. Molecular organic geochemistry of the Tarim Basin, northwest China. AAPG Bull. 2000, 84, 1109–1128. [Google Scholar]
  32. Volkman, J.K.; Allen, D.I.; Stevenson, P.L.; Burton, H.R. Bacterial and algal hydrocarbons from a saline Antarctic lake, Ace Lake. Org. Geochem. 1986, 10, 671–681. [Google Scholar] [CrossRef]
  33. Volkman, J.K.; Barrett, S.M.; Blackburn, S.I. Eustigmatophyte microalgae are potential sources of C29 sterols, C22–C28 n-alcohols and C28–C32 n-alkyl diols in freshwater environments. Org. Geochem. 1999, 30, 307–318. [Google Scholar] [CrossRef]
  34. Otto, A.; Wilde, V. Sesqui-, di-, and triterpenoids as chemosystematic markers in extant conifers; a review. Bot. Rev. 2001, 67, 141–238. [Google Scholar] [CrossRef]
  35. Ourisson, G.; Albrecht, P.; Rohmer, M. The hopanoids: Palaeochemistry and biochemistry of a group of natural products. Pure Appl. Chem. 1979, 51, 709–729. [Google Scholar] [CrossRef]
  36. Rohmer, M.; Bisseret, P.; Neunlist, S. The hopanoids, prokaryotic triterpenoids and precursors of ubiquitous molecular fossils. In Biological Markers in Sediments and Petroleum; Moldowan, J.M., Albrecht, P., Philp, R.P., Eds.; Prentice Hall: Englewood Cliffs, NJ, USA, 1992; pp. 1–17. [Google Scholar]
  37. Shiea, J.; Brassell, S.C.; Ward, D.M. Mid-chain branched mono- and dimethyl alkanes in hot spring cyanobacterial mats: A direct biogenic source for branched alkanes in ancient sediments? Org. Geochem. 1990, 15, 223–231. [Google Scholar] [CrossRef]
  38. Wei, W.; Algeo, T.J. Elemental proxies for paleosalinity analysis of ancient shales and mudrocks. Geochim. Cosmochim. Acta 2020, 287, 341–366. [Google Scholar] [CrossRef]
  39. Didyk, B.M.; Simoneit, B.R.T.; Brassell, S.C.; Eglinton, G. Organic geochemical indicators of paleoenvironmental conditions of sedimentation. Nature 1978, 272, 216–222. [Google Scholar] [CrossRef]
  40. Asif, M.; Alexander, R.; Fazeelat, T.; Pierce, K. Geosynthesis of dibenzothiophene and alkyl dibenzothiophenes in crude oils and sediments by carbon catalysis. Org. Geochem. 2009, 40, 895–901. [Google Scholar] [CrossRef]
  41. Algeo, T.J.; Tribovillard, N. Environmental analysis of paleoceanographic systems based on molybdenum–uranium covariation. Chem. Geol. 2009, 268, 211–225. [Google Scholar] [CrossRef]
  42. Schoepfer, S.D.; Shen, J.; Wei, H.; Tyson, R.V.; Ingall, E.; Algeo, T.J. Total organic carbon, organic phosphorus, and biogenic barium fluxes as proxies for paleomarine productivity. Earth Sci. Rev. 2015, 149, 23–52. [Google Scholar] [CrossRef]
  43. Rosen, M. The importance of groundwater in playas: A review of playa classifications and the sedimentology and hydrology of playas. GSA Bull. 1994, 289, 1–18. [Google Scholar]
  44. Peters, K.E. Guidelines for petroleum source rock using programmed pyrolysis. AAPG Bull. 1986, 70, 318–329. [Google Scholar]
Figure 1. (A) Location of the Nanxiang Basin in East China. (B) Division of structural units in the Nanxiang Basin and location of the Biyang Depression. (C) Division of structural units in the Biyang Depression with locations of discovered oil/gas fields and the sampling well A3. (D) Profiles illustrating the vertical structures of the Biyang Depression. Locations for the profiles are given in (C). El = the Liaozhuang Formation; Eh1,2,3 = first, second, and third member of the Hetaoyuan Formation; Ey = the Yuhuangding Formation; K2 = Lower Cretaceous; Pt = Permian–Triassic.
Energies 17 03003 g001
Figure 2. Stratigraphic section, sedimentary facies, and structural evolution of the Biyang Depression. Sys = system, Ser = series, Fm = formation, Mem = member, and Thi = thickness.
Energies 17 03003 g002
Figure 3. Cross-plots of (A) Tmax versus HI and (B) TOC versus S2.
Energies 17 03003 g003
Figure 4. Vertical variations in maceral compositions and vitrinite reflectance.
Energies 17 03003 g004
Figure 5. Representative photos of maceral. (A) Telalginite (Telalg) and liptodetrinite (Liptodetr), 3342.7 m, Eh36. (B) Degraded telalginite, 3349.2 m, Eh36. (C) Sporinite (Spor), cutinite (Cuti), and liptodetrinite, 3196.2 m, Eh35. (D) Vitrinite (Vit), 3196.2 m, Eh35. (E) Inertinite (Iner), 3196.2 m, Eh35. (F) Pyrite (Pyr), 3357.2 m, Eh36. (AC) Under fluorescent light. (DF) Under white incident light.
Energies 17 03003 g005
Figure 6. Vertical variations in elemental geochemical parameters of the Eh36 and Eh35 shale.
Energies 17 03003 g006
Figure 7. (A) Total ion current (TIC) chromatogram of saturated hydrocarbon fraction of a representative sample (3357.2 m, Eh36). (B) Mass chromatogram (m/z 123) of the corresponding drimanes and bisabolane. (C) Mass chromatogram (m/z 191) of the corresponding terpenoids. (D) Mass chromatogram of the corresponding steranes. A key to labelled peaks in the chromatograms is provided in Table 3.
Energies 17 03003 g007
Figure 8. (A) Total ion current (TIC) chromatogram of aromatic hydrocarbon fraction of a representative sample (3196.2 m, Eh35). (B) Mass chromatogram (m/z 166) of the corresponding fluorene. (C) Mass chromatogram (m/z 168) of the corresponding dibenzofuran and 3- and 4-methylbiphenyl. (D) Mass chromatogram (m/z 170) of the corresponding trimethylnaphthalene. (E) Mass chromatogram (m/z 184) of the corresponding tetramethylnaphthalene and dibenzothiophene. (F) Mass chromatogram (m/z 192) of the corresponding methylphenanthrene. A key to labelled peaks in the chromatograms is provided in Table 3.
Energies 17 03003 g008
Figure 9. Cross-plots of (A) Ts/(Ts+Tm) versus αβ C31 hopane 22S/(22S+22R), (B) ββ/(αα+ββ) C29 steranes versus ααα C29 sterane 20S/(20S+20R), and (C) TNR-2 versus MPI-1.
Energies 17 03003 g009
Figure 10. (A) Cross-plots of C24 tetracyclic terpane/C26 tricyclic terpane versus C29/C27 ααα sterane (20R). (B) Cross-plots of pristane/phytane versus gammacerane/C30 αβ hopane. (C) Cross-plots of phytane/n-C18 versus pristane/n-C17. (D) Ternary plot of dibenzothiophene (DBT), fluorene (F), and dibenzofuran (DBF).
Energies 17 03003 g010
Figure 11. Cross-plots of (A) B/Ga versus Sr/Ba, with the inset figure showing CaO versus Sr; (B) enrichment factor of Mo versus enrichment factor of U; (C) biogenic Ba versus 102 × P/Al; and (D) Al2O3 versus TiO2.
Energies 17 03003 g011
Figure 12. Depositional models of the (A) Eh36 shale and (B) Eh35 shale.
Energies 17 03003 g012
Figure 13. Cross-plots of (A) TOC versus S1+S2, (B) TOC versus HI, (C) TOC versus S1, and (D) PI versus OSI.
Energies 17 03003 g013
Table 1. Bulk geochemical parameters, maceral compositions, vitrinite reflectance, and elemental ratios for the Eh36 and Eh35 shale from the Biyang Depression.
StrataDepth
(m)
TOC
(wt. %)
S1 + S2
(mg/g)
HI
(mg/g TOC)
Tmax
(°C)
PIOSI
(mg/g TOC)
Maceral Compositions (vol. %)102 ×
P/Al
BabioB/
Ga
Sr/
Ba
UEFMoEFTiO2Al2O3
TelalgTer LipLiptoVitrIner
Eh353195.21.0 1.8 149 456 0.18 33 0.3 0.7 0.1 0.9 0.6
3196.20.8 1.6 162 448 0.19 37 2.0 241 1.0 2.7 4.2 8.6 0.65 15.3
3205.90.6 1.2 130 452 0.29 52 0.7 181 0.5 2.5 1.7 2.1 0.73 17.7
3206.50.8 1.6 148 442 0.31 65 0.1 0.2 0.2 0.4 0.1 0.8 238 0.9 2.6 1.6 4.3 0.62 14.4
32070.4 0.7 123 455 0.37 71 1.0 285 2.6 3.5 3.2 1.5 0.28 6.7
3208.50.9 1.7 142 451 0.24 44 0.3 0.2 0.1 0.5 0.4 0.7 353 1.5 2.8 2.8 4.4 0.46 10.5
3209.71.3 2.8 166 455 0.22 46 0.4 0.0 0.1 1.1 0.6 1.4 82 0.9 3.8 3.7 8.9 0.59 16.1
3210.21.8 4.1 162 444 0.28 62 0.8 0.8 0.2 1.9 0.8 2.4 298 0.8 2.1 4.3 18.4 0.65 15.7
32120.6 1.0 126 447 0.18 27 1.9 367 2.8 2.5 4.9 7.7 0.27 7.3
32131.0 1.9 154 454 0.22 43 1.3 125 0.5 2.6 3.5 4.9 0.76 18.4
32140.3 0.5 100 431 0.39 63 1.0 172 0.7 1.9 1.4 15.5 0.72 15.9
3214.51.1 2.2 151 442 0.23 46 191 1.8 1.7 7.0 12.5 0.56 13.8
Eh363342.6 2.2 2.9 81 443 0.40 54 0.8 57 0.8 3.1 3.8 19.8 0.60 14.8
3342.7 2.0 2.3 71 442 0.37 42 0.3 0.6 0.1 1.6 0.7 1.1 46 0.6 4.6 3.6 28.6 0.66 15.7
3349.2 1.5 2.0 93 445 0.29 39 0.2 0.2 0.2 1.2 0.6 0.9 87 1.7 5.4 5.2 34.0 0.53 13.4
3349.6 1.6 2.5 98 459 0.35 54 0.3 0.5 0.2 2.0 0.5 0.8 277 1.0 3.2 2.7 12.2 0.66 12.5
3357.2 1.2 1.8 111 462 0.28 43 0.1 0.2 0.2 0.7 0.5 232 0.8 3.2 9.8 27.4 0.52 12.8
3357.6 0.8 1.3 119 452 0.27 44 1.1 15 1.1 2.8 4.4 24.3 0.65 15.7
3382.8 1.4 2.1 91 459 0.38 55 1.7 97 1.5 3.8 3.7 14.9 0.50 13.2
3383.61.6 2.2 81 439 0.42 58 0.3 0.5 0.1 2.5 0.4 0.7 76 1.0 2.9 2.8 19.3 0.56 15.3
Tel = telalginite. Ter Lip = terrigenous liptinite. Lipto = liptodetrinite. Vitr = vitrinite. Iner = inertinite.
Table 2. Chloroform bitumen ‘A’, group composition, and biomarker ratios for the Eh36 and Eh35 shale from the Biyang Depression.
StrataDepth
(m)
A
(wt. %)
B
(wt. %)
CDEFGHIJKLMNOPQR
(%)
S
(%)
T
(%)
Eh353195.20.10 85.8 3.4 1.31 0.44 0.36 0.88 1.48 0.24 0.60 0.60 0.46 1.66 0.52 0.67 0.88 0.84 32 46 22
3196.20.09 82.0 4.4 1.12 0.39 0.33 0.70 1.43 0.37 0.64 0.59 0.71 2.21 0.52 0.66 0.87 0.96 35 42 23
3206.50.08 85.2 2.9 1.050.360.381.11 1.71 0.370.62 0.59 0.511.64 0.51 0.67 0.91 0.86 41 29 30
3208.50.11 82.7 3.9 1.12 0.38 0.34 1.09 1.47 0.38 0.63 0.58 0.64 2.32 0.51 0.66 0.96 0.93 31 41 28
3209.70.14 85.0 3.4 0.980.420.290.961.66 0.210.73 0.61 0.51.50 0.54 0.66 1.01 0.91 36 36 28
3210.20.16 88.2 3.0 1.370.510.330.88 1.54 0.320.57 0.57 0.511.85 0.51 0.63 0.86 0.89 28 51 21
Eh363342.7 0.13 88.5 3.2 1.01 0.28 0.28 1.80 2.11 0.47 0.76 0.59 0.64 1.89 0.57 0.70 0.95 0.95 34 30 36
3349.2 0.17 94.4 4.5 0.99 0.12 0.13 1.63 2.28 0.51 0.68 0.60 0.59 2.64 0.54 0.71 0.97 0.98 28 41 31
3349.6 0.11 89.7 2.8 0.870.240.171.33 1.66 0.460.670.610.712.81 0.580.681.07 1.02 32 30 38
3357.2 0.10 87.1 3.8 0.89 0.31 0.32 1.13 1.87 0.38 0.75 0.58 0.82 2.65 0.53 0.67 1.01 0.95 24 28 48
3383.60.10 87.1 3.1 0.910.20.221.21 1.97 0.660.720.60.672.43 0.55 0.70.89 1.00 22 27 51
A = chloroform bitumen ‘A’. B = sum of saturated and aromatic hydrocarbon fractions. C = saturated/aromatic hydrocarbons. D = Pr/Ph. E = Pr/n-C17. F = Ph/n-C18. G = rearranged drimanes/drimanes. H = 8β(H)-homodrimane/8β(H)-drimane. I = C24 tetracyclic/C26 tricyclic terpanes. J = Ts/(Ts+Tm). K = C31 homohopane 22S/(22S+22R). L = gammacerane/ab C30 hopane. M = ααα C29/C27 sterane (20R). N = ααα C29 steranes 20S/(20S+20R). O = ββ/(ββ+αα) C29 steranes. P = MPI-1. Q = TNR-2. R = fluorene. S = dibenzofuran. T = dibenzothiophene. The sum of fluorene, dibenzofuran, and dibenzothiophene is 100%.
Table 3. Abbreviations for labelled biomarker compounds in Figure 6 and Figure 7.
Figurem/zAbbreviationCompoundFigurem/zAbbreviationCompound
Figure 7ATIC15-33C15-C33 n-alkanesFigure 7D217C27 ββS (S)5α,14β,17β-cholestane (20S)
i18C18 iso-alkane C27 S (R)5α,14α,17α-cholestane (20R)
PrPristane C28 S (S)24-methyl-5α,14α,17α-cholestane (20S)
Me-hepMethylheptadecanes C28 ββS (R)24-methyl-5α,14β,17β-cholestane (20R)
PhPhytane C28 ββS (S)24-methyl-5α,14β,17β-cholestane (20S)
Figure 7B123RDsRearranged drimanes C28 S (R)24-methyl-5α,14α,17α-cholestane (20R)
βD8β-drimane C29 S (S)24-ethyl-5α,14α,17α-cholestane (20S)
αD8α-drimane C29 ββS (R)24-ethyl-5α,14β,17β-cholestane (20R)
BiBisabolane C29 ββS (S)24-ethyl-5α,14β,17β-cholestane (20S)
βHD8β-homodrimane C29 S (R)24-ethyl-5α,14α,17α-cholestane (20R)
Figure 7C191C21-C30 TTC21-C30 tricyclic terpanesFigure 8ATICTeMNsTetramethylnaphthalenes
C24 TeTC24 tetracyclic terpane PhePhenanthrene
Ts18α-trisnorhopane C2 FlsC2 fluorenes
Tm17α-trisnorhopane C4 FlsC4 fluorenes
C29 H17α,21β-norhopane MPsMethylphenanthrenes
C29 M17β,21α-norhopane DMPsDimethylphenanthrenes
C30 H17α,21β-hopane TMPsTrimethylphenanthrenes
C30 M17β,21α-hopane ChrChrysene
C31 H17α,21β-homohopane (22S+22R) MChrsMethylchrysenes
GamGammacerane B[e]PBenzo[e]pyrene
C32 H17α,21β-bishomohopane (22S+22R)Figure 8C1683-MB3-methylbiphenyl
Figure 7D217C27 DiaS (S/R)13α,17β-diacholestane (20S/20R) 4-MB4-methylbiphenyl
C27 S (S)5α,14α,17α-cholestane (20S)Figure 8D170TMNTrimethylnaphthalene
C27 ββS (R)5α,14β,17β-cholestane (20R)
Disclaimer/Publisher’s Note: The statements, opinions and data contained in all publications are solely those of the individual author(s) and contributor(s) and not of MDPI and/or the editor(s). MDPI and/or the editor(s) disclaim responsibility for any injury to people or property resulting from any ideas, methods, instructions or products referred to in the content.