1. Introduction
Energy needs have grown markedly in recent decades due to economic and population growth. The heavy use of fossil fuels has led to concerns about greenhouse gas emissions [
1]. It is widely accepted that new solutions for clean and sustainable energy are becoming a critical factor for the future of society [
2]. Many researchers predict that the energy market will be based on hydrogen as a primary energy carrier in the future. Water electrolysis [
3,
4,
5,
6] is certainly the cleanest method for hydrogen production, and it is seen as the energy vector of a truly green and efficient energy system, assuming the electricity used in the process comes from renewable sources. Touted as the most favorable future scenarios are large-scale use of renewable energy [
7] and/or biofuels [
8]. In the short term, one measure that can be taken here is to utilize waste energy. Renewable energies such as solar and wind are by nature intermittent, as they are dependent on weather conditions [
9]. Thus, the use of waste heat is a very attractive topic in many areas of power engineering. Usually, it can be achieved by coupling the waste-generating system with closed-cycle externally heated bottoming systems, and there are a few options to suit different output ranges [
10,
11]. In some cases, the gas turbine cycle can be included directly in the host system, facilitating a way to regulate the host system by controlling a compressor inlet flow (guide vane) [
12,
13] and reducing exergy losses of the combustor (using a fuel cell to substitute for this unit) [
14,
15]. Supercritical carbon dioxide at 800 °C can be used for a high-temperature Brayton cycle, which has the potential to achieve a more compact power cycle with higher efficiency than the steam Rankine cycle [
16].
sCO
2 cycles have the potential to bridge the gap in medium-temperature WHR, as sCO
2 systems are more efficient when exploiting medium-temperature heat sources, i.e., above 350 °C [
17]. Research on sCO
2 systems has mainly focused on nuclear energy, which was initiated by Driscoll [
18], who presented a report on cost projections for the supercritical CO
2 Brayton indirect power cycle as applied to GEN-IV advanced reactors. To evaluate the economic competitiveness of the cycle, a cost comparison procedure was adopted in which projections were made based on published cost estimates for related reactor systems coupled with the direct or indirect helium Brayton cycle or the conventional indirect Rankine cycle. A preliminary analysis showed savings of at least 10%, with the dominant parameters being cycle thermodynamic efficiency and turbomachinery capital cost.
In addition to studies on the supercritical CO
2 cycle as a nuclear application, several analyses have been performed of these novel cycles coupled with concentration solar power. Studies were mainly carried out by NREL [
19] and SANDIA [
20].
Another area of research is a supercritical CO
2 cycle application as a bottoming cycle within fuel cell systems [
21,
22]. Sanchez et al. (2009) [
23] expected the CO
2 cycle to perform better than an air cycle for intermediate-temperature heat recovery applications. Their paper showed that, even though the new cycle is coupled with an atmospheric fuel cell [
24], it is still able to achieve the same overall system efficiency and rated power as the best conventional cycles currently being considered. Furthermore, under certain operating conditions, the performance of new hybrid systems beats that of existing pressurized fuel cell hybrid systems with conventional gas turbines. Calculations made by Munoz de Escalona [
25] proved that an indirect supercritical CO
2 Brayton cycle coupled with a molten carbonate fuel cell (MCFC) [
26] could achieve a thermal efficiency of almost 40%, which enables the whole system to approach an overall efficiency of 60%. In addition, the supercritical CO
2 cycle performs better at part load than existing hybrid systems.
sCO
2 technology as a waste heat recovery system was introduced to the market by Echogen [
27], which manufactures and commercializes sCO
2 systems for WHR. Echogen’s sCO
2 system was investigated by Persichilli et al. [
28], whose study confirmed the feasibility of the technology and its potential for WHR compared to steam-based solutions. The authors noted that Echogen solutions are suitable for heat recovery from a wide range of heat sources, with efficiency of up to 30%. A study on waste heat recovery from a reciprocating engine was reported by Kacludis et al. [
29]. The authors concluded the power of a gen set could be increased by 10% without any extra fuel consumption when two 300 kW
el are coupled with the gen set.
The first reported examination of sCO
2 cycle architectures for WHR was carried out by Kimzey [
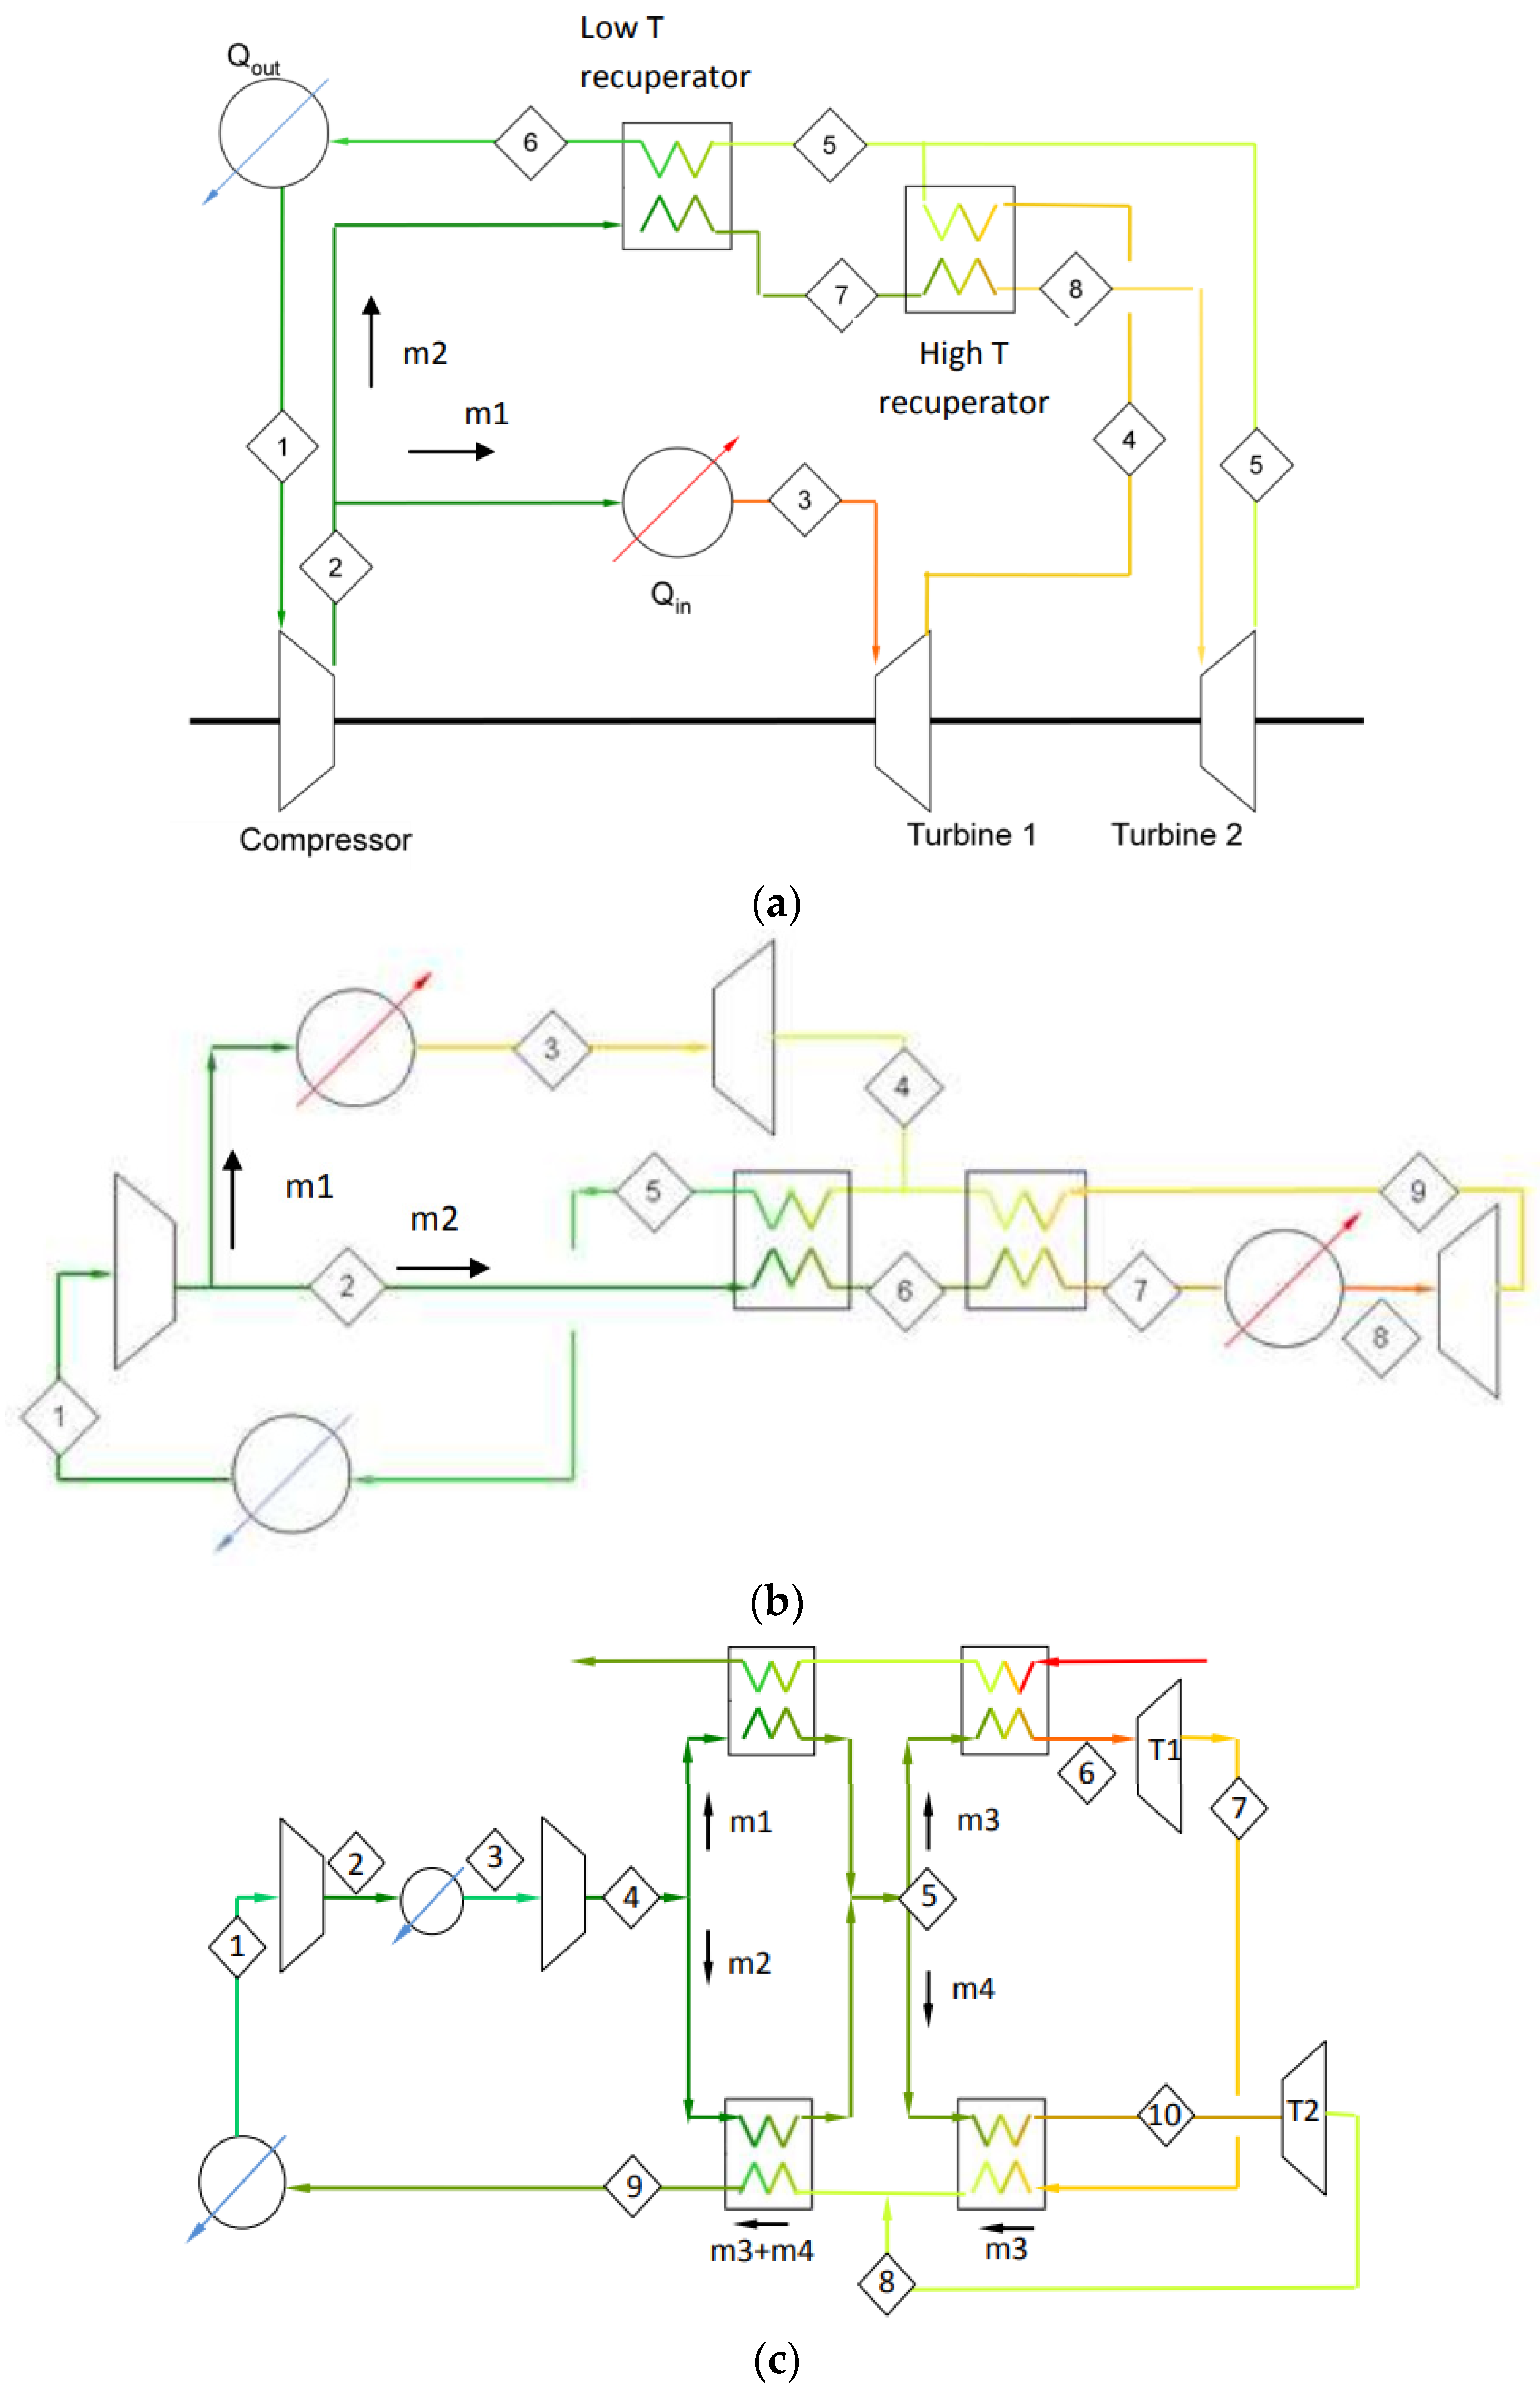
30]. The author used a numerical model developed in MATLAB to examine three possible cycle configurations for WHR (see
Figure 1). The thermodynamic parameters for sCO
2 were calculated directly by the NIST Reference Fluid Thermodynamic and Transport Properties Database 9.0. The author concluded that all of the cycles examined are recommended for further research, along with a cost–benefit analysis with regard to their potential for WHR.
Mohagheghi and Kapat [
31] compared sCO
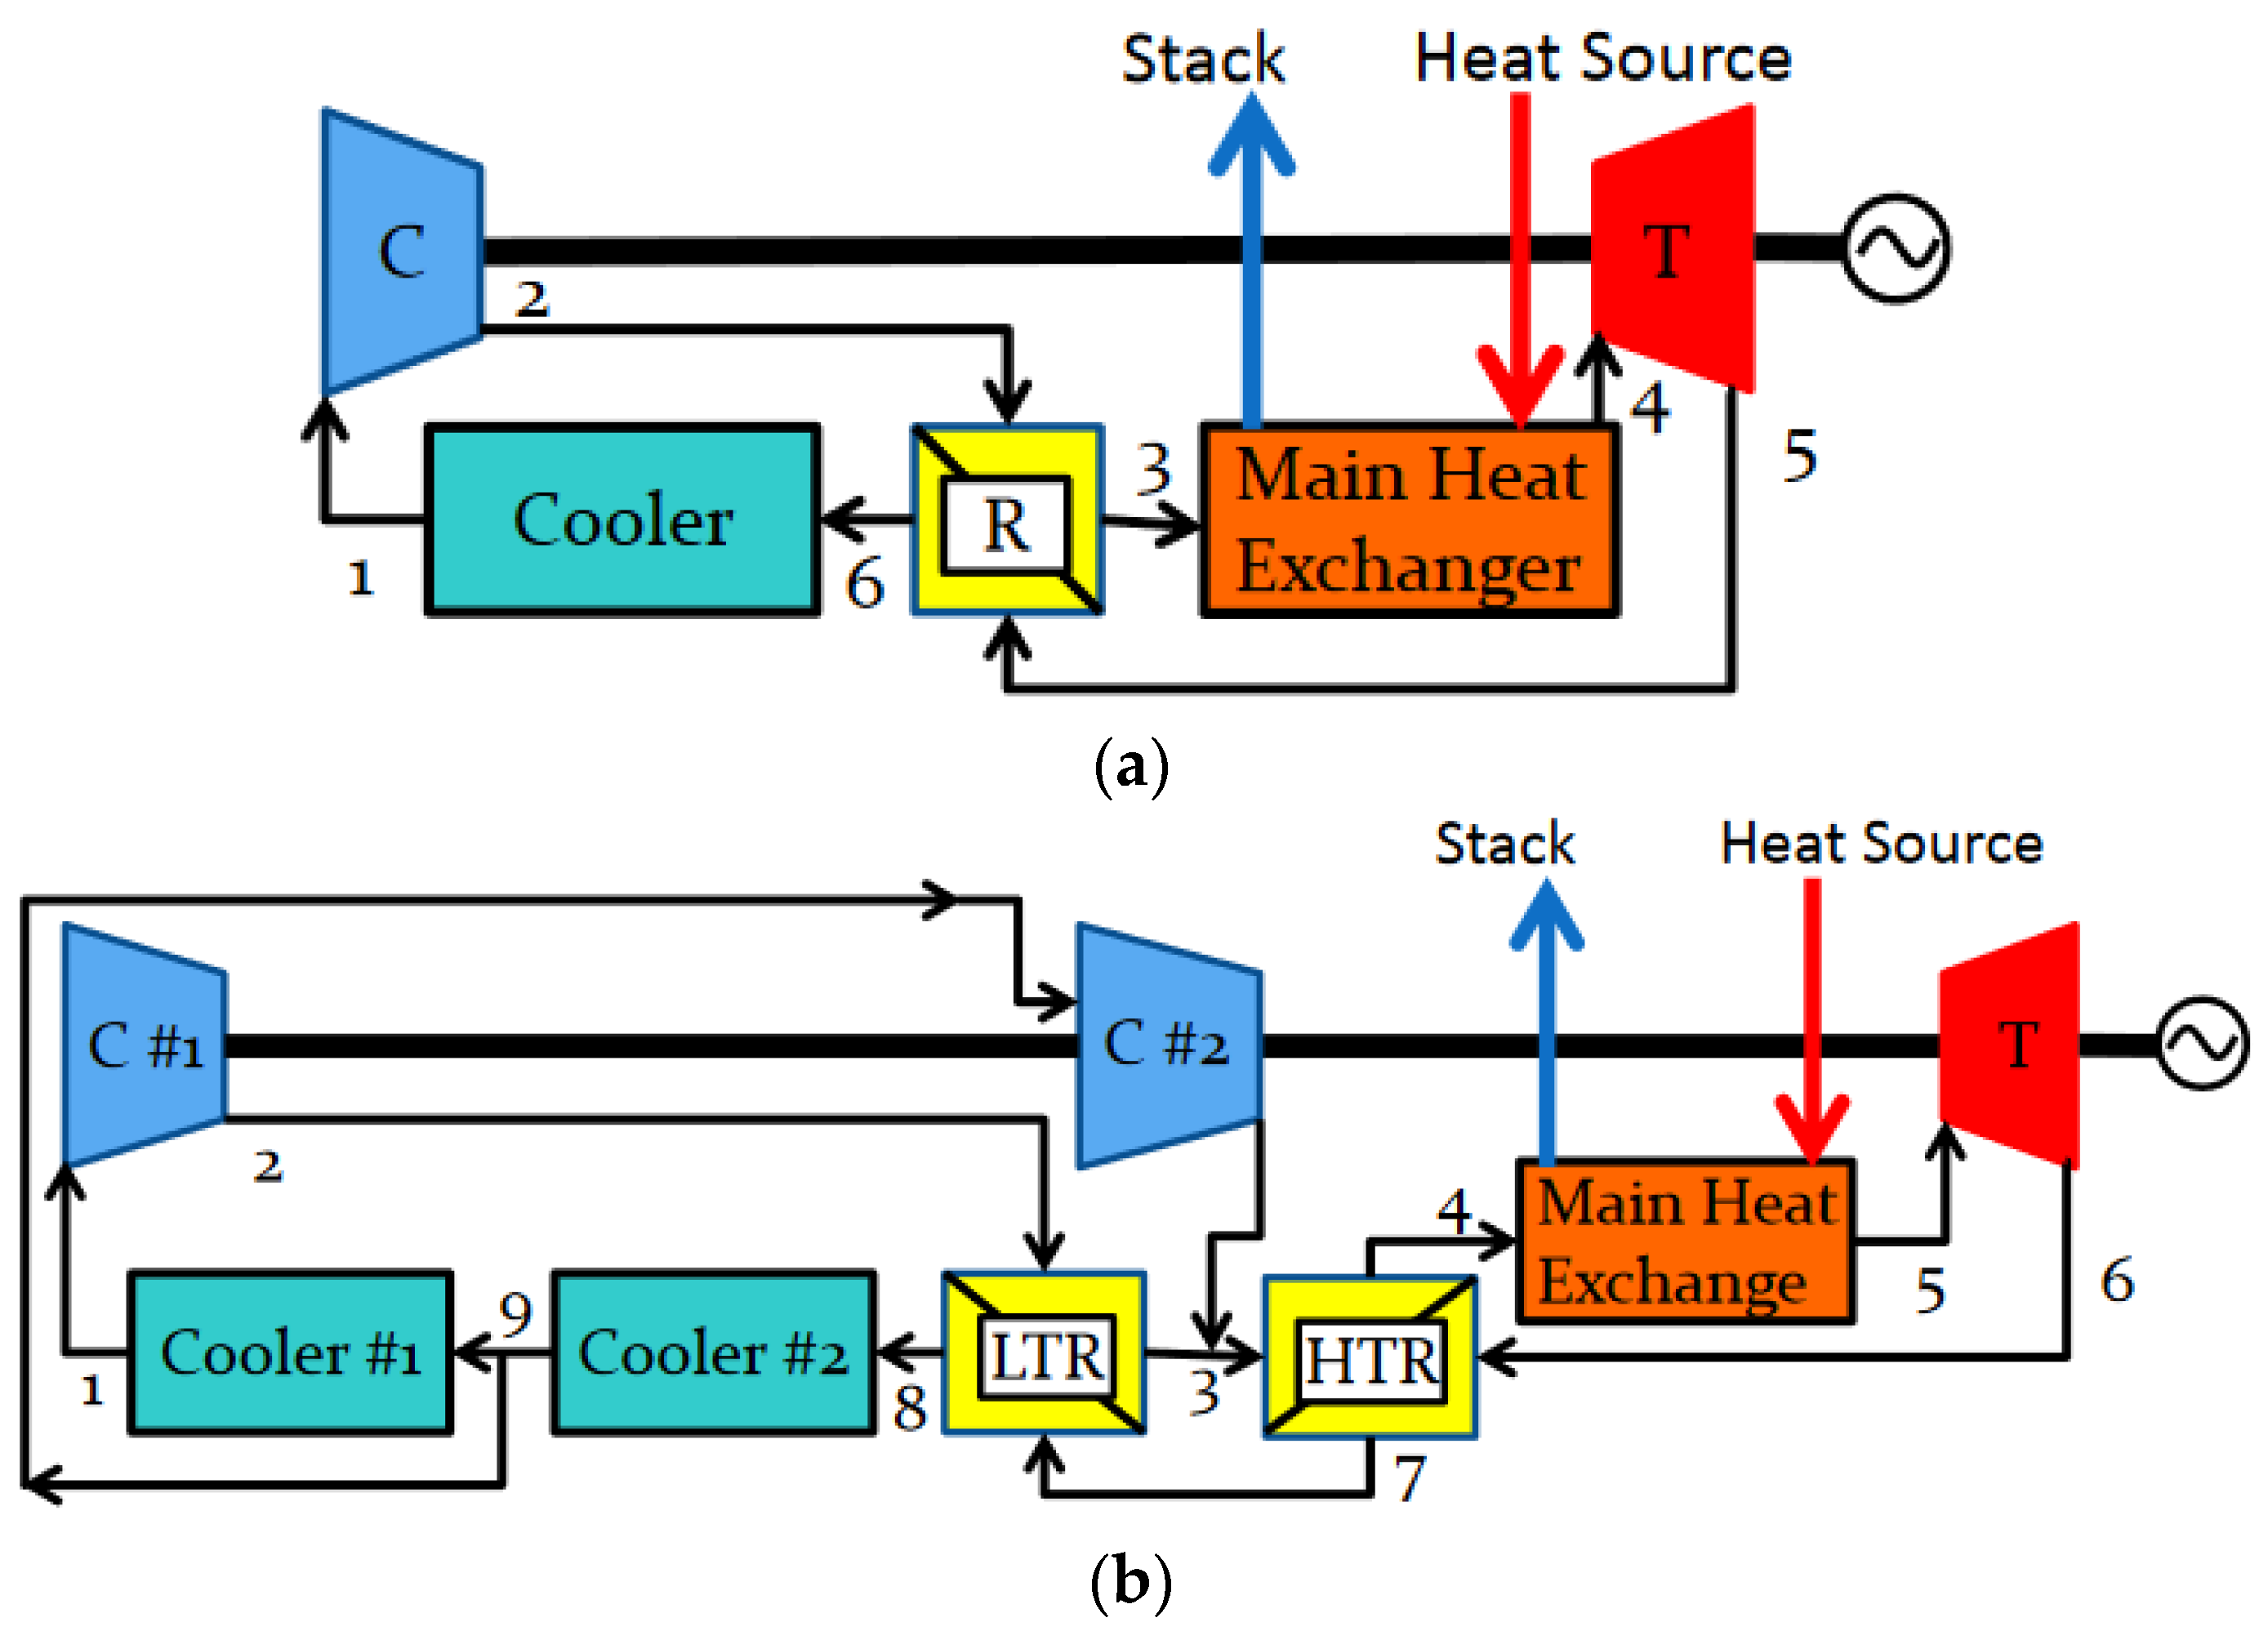
2 cycles in two configurations: a simple recuperative cycle and a recompressed recuperative cycle, see
Figure 2. The systems were compared in terms of exploiting heat from a 100 kg/s flow of flue gases at a temperature range between 225 °C and 825 °C. Their research revealed the simple sCO
2 cycle significantly outperforms the more complex configuration of the sCO
2 cycle regarding net power output.
Wright et al. [
32] reported a thermo-economic analysis of various configurations for sCO
2 waste heat recovery exploiting 40.7 MW
th in flue gas at 549 °C. The results indicated the novel system configuration could raise power output by 22.6% with respect to the simple recuperative cycle. However, the increased capital cost makes those novel configurations less favorable from an economic point of view.
In [
33], the authors scrutinized different layouts of the sCO
2 cycle (simple regenerative, with compression, with reheating, and with recompression and reheating) as bottoming thermodynamic cycles. Their findings show that the simple regenerated sCO
2 power cycle appears to be the most suitable for WHR applications, mainly due to the investment cost and acceptable performance.
Alfani et al. [
34] reported the numerical optimization of a sCO
2 power plant for waste heat recovery. The research is based on a dedicated numerical tool developed in MATLAB R2024. To predict the thermodynamic properties of sCO
2, the authors relied on the REFPROP 9.1 database, using a high fidelity 42 terms reduced Helmholtz energy equation of state. The heat source was assumed to be a flue gas stream of 50 kg/s at 550 °C. The research revealed that not all cycle configurations could be used for WHR applications, e.g., recompressed cycles are ineffective due to poor utilization of the heat source, which results in lower overall plant efficiency.
The literature review shows the potential of sCO2 as a waste heat recovery cycle. The presented work studies, in detail, a potential for sCO2 as a bottoming cycle for a power plant based on a 180 kW reciprocating engine fueled by biogas. The research methodology assumes the development of numerical models in two different software (Aspen HYSYS HYSYS 11 and GT Suits v2023). The models were used for the selection of the sCO2 cycle layout, the optimization of the operating parameters, the off-design study of the selected cycle, and the preliminary design of sCO2 rotating machines.
2. Theoretical Background
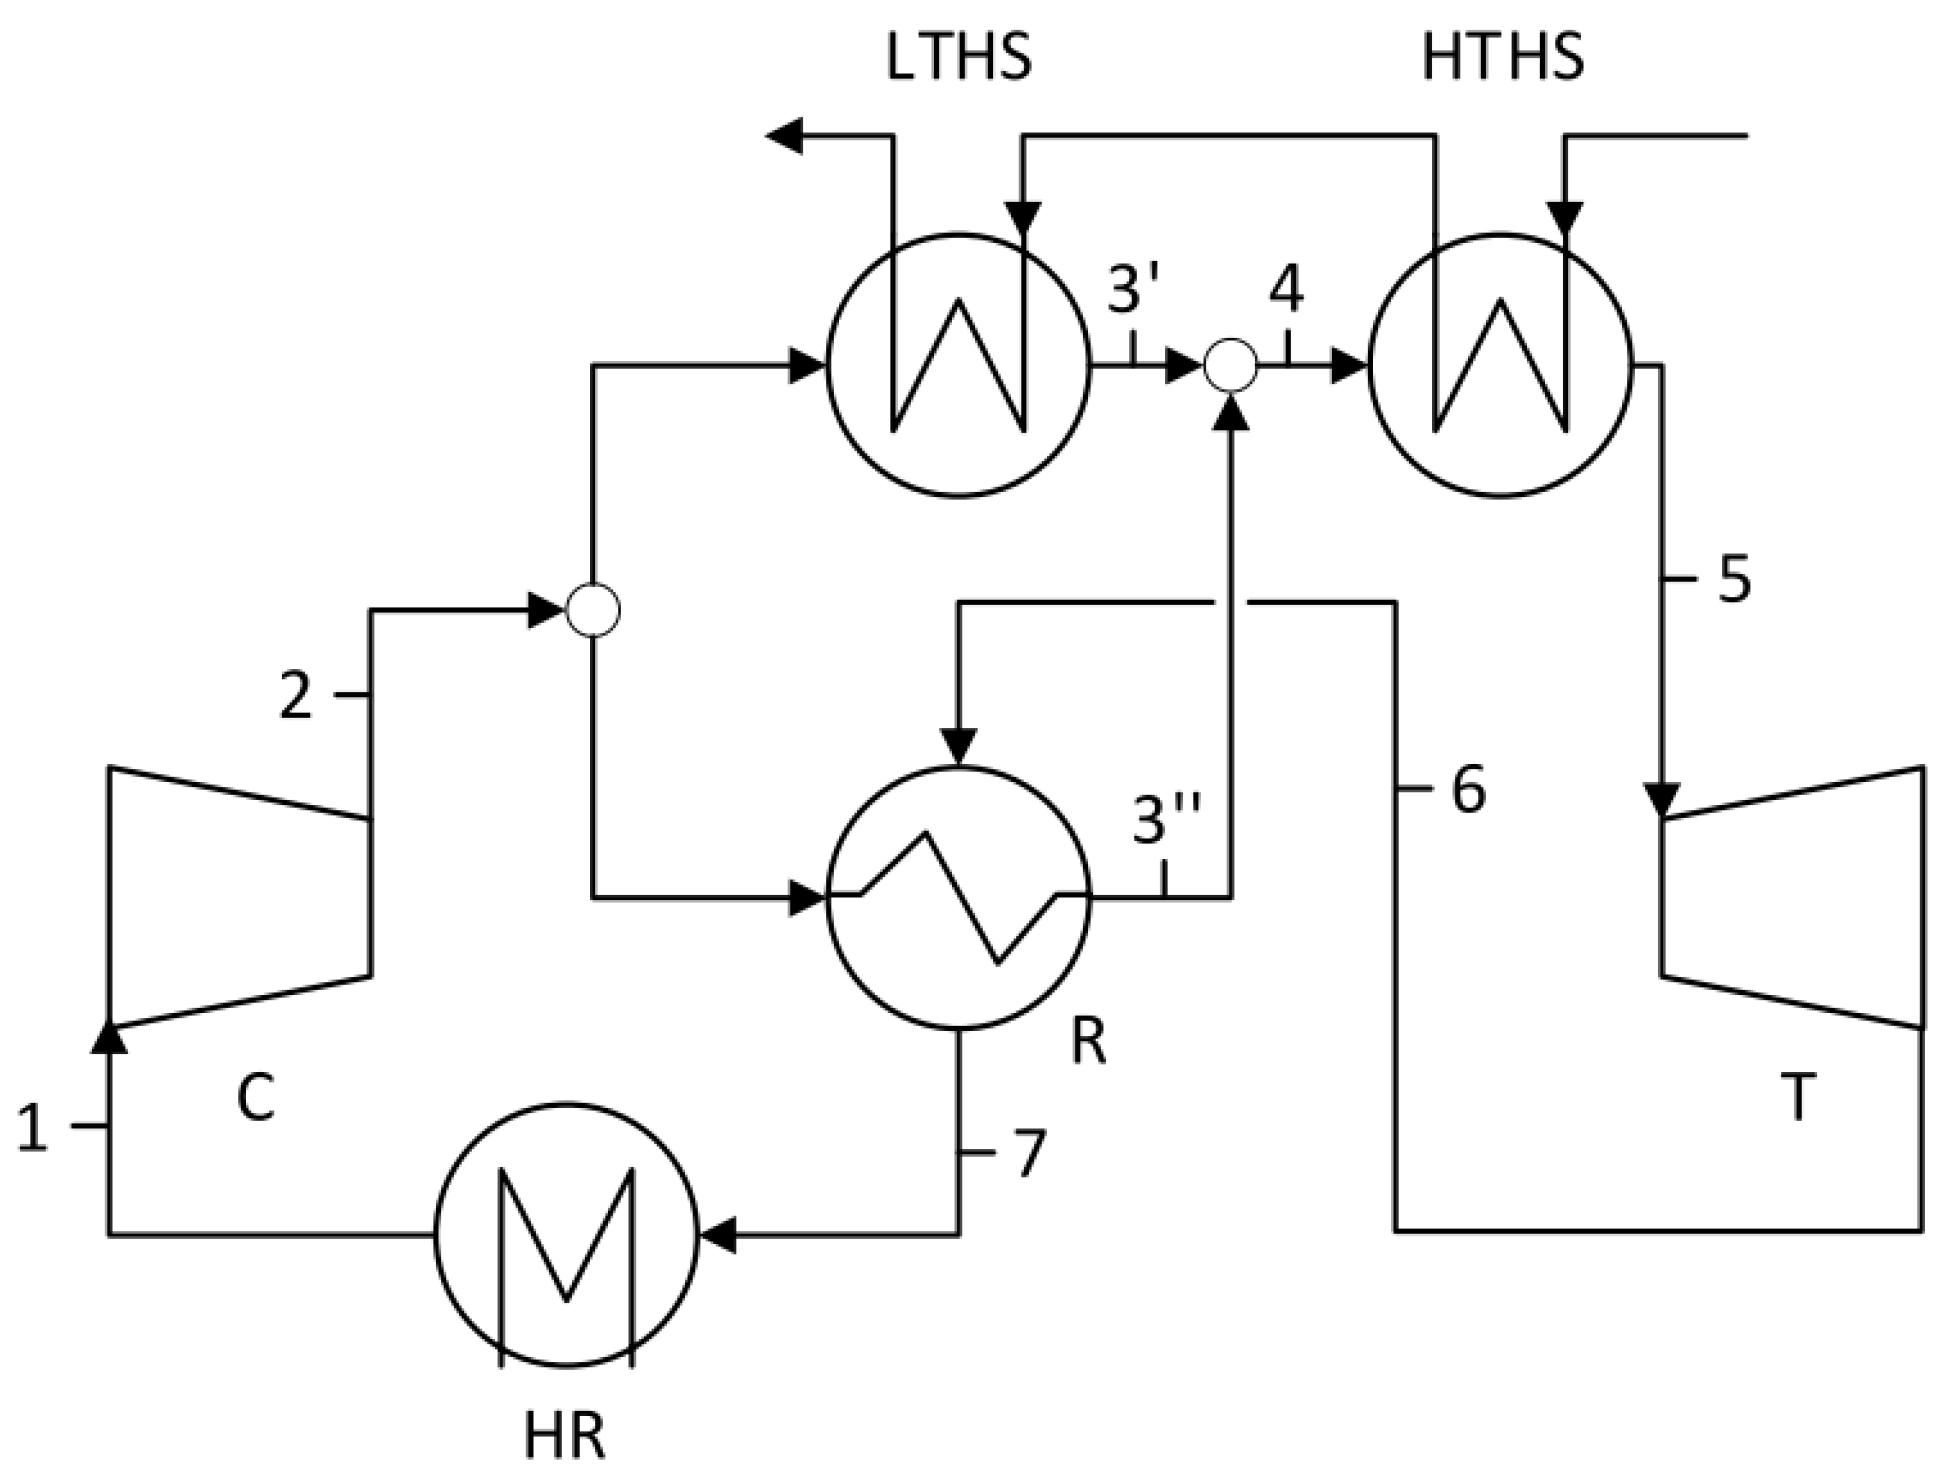
The plant considered consists of six elements in total; there are four heat exchangers (including 2× heaters, 1× cooler, and 1× recuperator), a compressor, and a turbine. A schematic representation of the plant is presented in
Figure 3:
Simulations were performed in two computing environments: GT-Suite and Aspen HYSYS. The equations used in each software are described below.
2.1. Heat Exchanger
Aspen HYSYS is used to calculate the total heat exchanged between a shell and tube (heat exchanger duty), where it can be defined using the total heat transfer coefficient, heat transfer area, and the mean logarithmic temperature difference:
where U is the total heat transfer coefficient, A is the heat transfer area, ΔT
LM is the mean logarithmic temperature difference (LMTD), and F
t is the LMTD correction factor.
In the case of fluids without phase change, the local heat transfer coefficient hi is calculated following the Sieder–Tate formula:
where G
i is the fluid mass velocity in the tubes (velocity * density), µ
i is the fluid viscosity in the tubes (at bulk temperature), µ
i,w is the fluid viscosity in the tubes at the wall, and C
p,I is the fluid specific heat capacity inside the tube.
The overall relationship of the total heat transfer coefficient is as follows:
where U is the overall heat transfer coefficient, h
o is the local heat transfer coefficient outside the tube, h
i is the local heat transfer coefficient inside the tube, r
o is the fouling factor outside tube, r
i is the fouling factor inside the tube, r
w is the wall resistance for the tube, D
o is the outside diameter of the tube, and D
i is the inside diameter of the tube.
In the case of GT-Suite, the heat transfer coefficient for pipes and flow split to their walls is calculated at every timestep; it includes the impact of fluid velocity, wall surface roughness and material, and fluid thermo-physical properties. In the case of smooth pipes, the heat transfer coefficient is calculated using the Colburn analogy:
where C
f is the fanning friction factor of the smooth pipe,
ρ is the density, U
eff is the effective velocity outside boundary layer, C
p is the specific heat, and Pr is the Prandtl number.
The Colburn analogy is applicable in turbulent, laminar, and transitional flows, but the improved laminar heat transfer model provides more accurate results. In that case, the heat transfer coefficient may be calculated using the constant Nusselt number in the laminar regime, where the value of 3.66 is used for a Reynolds number less than 2000, interpolation between the constant Nusselt number, and Colburn analogy between Re = 2000 to Re = 4000. Above Re = 4000, only the Colburn analogy is used.
There are also two corrections available for heat transfer coefficient calculations, which correspond to surface roughness and rectangular cross-sections of pipes. Total heat exchanger heat transfer is calculated as the total heat transfer of multiple piping elements.
2.2. Turbomachinery
Using Aspen HYSYS, both the polytropic and isentropic power of a compressor or expander can be calculated using the formula below:
where n is the volume exponent, CF is the correction factor, p
1 is the inlet pressure, p
2 is the outlet pressure, ρ
1 is the inlet density of the working medium,
is the molar flow rate at the inlet, and M is the molecular weight of the working medium.
The isentropic power is calculated using the volume exponent using the formula below:
where ρ’
2 is the density of the stream at the outlet corresponding to inlet entropy.
The polytropic power is calculated using the volume exponent using the following formula:
where ρ
2 is the density of the stream at the outlet.
The correction factor is expressed by the following equation:
where h’
2 is the outlet enthalpy for the isentropic process, and h
1 is the inlet enthalpy.
Power delivered to the working medium due to compression is described by the equation below:
where
is the molar flow rate at the inlet, h
2 is the outlet enthalpy, h
1 is the inlet enthalpy, and M is the molecular weight of the working medium.
The power obtained because of expansion in the turbine is described as follows:
Using GT Suite, the turbine and compressor performances are modeled using performance maps provided by the user, which are summarized as a series of performance data points, where each point describes operating conditions at a given operating point, including speed, mass flow rate, pressure ratio, and thermodynamic efficiency. The parameters entered by the user work like a system of equations where if the speed and either the mass flow or pressure ratio are known, the efficiency, pressure ratio, or the mass flow rate could be found on the map.
The software engine predicts the turbocompressor velocity and pressure ratio across each piece of turbomachinery (compressor or turbine) at each timestep, making it possible to determine those parameters with respect to the provided performance map. The mass flow rate and efficiency are taken from the map and included in the solution. The software has a code included that is used to make smooth calculations of compressors in case of rapid fluctuations of the results, which is caused by the points where small changes in pressure ratio (due to “flat” speed lines) result in large changes in mass flow rate. The code represents the physical damping nature of the air mass and momentum inside the compressor, achieving mode-accurate results.
The outlet temperature is calculated from the enthalpy difference across the turbine and compressor. The power produced and consumed is calculated from efficiency with the following equations:
Turbine:
where h
in is the inlet enthalpy (known from the upstream conditions), h
out is the outlet enthalpy (predicted from the upstream state conditions and the efficiency), Δh
s is the isentropic enthalpy change, η is the efficiency (from the performance map), P is the power, m is the mass flow rate (from the performance map), PR is the pressure ratio (total or static pressure to match the turbine map), c
p is the specific heat of the incoming gas, ϒ is the specific heat ratio of the incoming gas, T
total,in is the inlet total temperature, T
in is the inlet temperature, and u
in is the inlet velocity.
The set of equations is used to calculate the instantaneous compressor and turbine quantities for each timestep. Calculation results such as turbine and compressor power are time averages of the instantaneous values over the complete cycle.
In the calculations, the torques on the shafts of the turbine and compressor are associated with the powers of the units, where friction torque is calculated using specified mechanical efficiency in the software in the specific object.
2.3. Optimizer
The software used for the simulations contains a multi-variable optimizer whose task is to determine the operating conditions by minimalization (or maximization) of an objective function [
35]. It manipulates the values of a set of primary variables in order to minimize (or maximize) an objective function, which is a function of process variables.
where
x1,
x2, …
xn are the process variables
Additionally, each process variable,
x0, is manipulated within a specified range:
where
is the process variable used to define the objective function, and
is the primary variable which is manipulated by the optimizer.
where
is the constraints function, and
is the variable used to define the constraint function.
The optimizer determines a solution based on the BOX method [
35]. It is a sequential search technique which solves problems with non-linear objective functions subject to non-linear inequality constraints.
2.4. Model of Working Fluid: CO2
Investigating supercritical CO
2 cycles using mathematical models requires the selection of the right working fluid equation of state (EoS). Inaccurate prediction of fluid properties may lead to significant errors in cycle performance and component sizing calculations. This is especially important as near-critical fluid properties vary significantly and do not follow the ideal gas model. Therefore, the best-suited real gas equation of state must be selected to properly calculate CO
2 parameters. Fortunately, this problem was addressed by Zhao et al. [
36] where the authors compared the models based on the equation of state (EoS) as follows:
Peng–Robinson (PR);
Peng–Robinson combined with the Boston–Mathias alpha function (PR–BM);
Soave–Redlich–Kwong (SRK);
Benedict–Webb–Rubin modified by Starling and Nushiumi (BWRS);
Lee–Kesler–Plöcker (LKP);
Span–Wagner (SW).
They concluded that in terms of pure component behavior, among the six studied EoS, the Span–Wagner EoS [
37] is the one that leads to the most accurate predictions of CO
2 properties in the near-critical and supercritical regions. Regarding cycle efficiency, it was observed that the influence of the choice of EoS is limited but not necessarily negligible. However, from a component sizing point of view, it was found that certain deviations can be considered high, leading to economic issues due to over- or under-estimation of equipment costs (by 10%). Thus, the SW EoS is recommended for evaluating the performance of an sCO
2 Brayton cycle to avoid inaccurate predictions with respect to equipment sizing and optimization.
Selecting the design parameters of the super-CO
2 cycle for heat utilization from a 180 kW biogas engine was also outlined (see
Figure 4).
2.5. Simplified Model of a Wola 180 Engine
The flue gas composition and parameters were simulated based on three points: one design point in a nominal state at full power and two measured points of the engine during operation in 91% load and 52% engine load. Following the design parameters concerning biogas composition, biogas flow, air flow, turbine, and compressor with intercooler, the amount of flue gas and their parameters were defined. Those flue gases are energy carriers for super-CO2 circuits. The measured points at 91% and 52% engine load delivered information on CH4, CO2, and O2 amounts in biogas, the amount of biogas used, and the average engine power during measurement. This information could be used to model the total inlet gas amount related to engine load. Function equations were implemented in Aspen HYSYS software. The results were compared with design points and measured data.
The biogas inlet amount to the compressor was approximated with the following equation:
where P
el is the electric power delivered by the gas engine.
Fresh air amount at the inlet to the compressor could be then estimated with the following equation:
Results compared to the measured and documentation data of the gas engine are presented in
Table 1.
3. Numerical Model of the super-CO2 Cycle
The supercritical CO
2 for waste heat recovery was simulated in Aspen HYSYS. The sCO
2 cycle is integrated with a reciprocating engine, which generates 0.3657 kg/s of exhaust gases at a temperature of 520 °C. The waste heat is recovered by means of two heat exchangers: high temperature and low temperature. The layout of the cycle implemented in the software is shown in
Figure 1. The thermodynamic parameters are predicted using the Lee–Kesler–Plocker equation of state. The values of the parameters in points specified in
Figure 1 are listed in
Table 2.
The optimization results are shown in
Figure 5 and
Table 2 and
Table 3. After optimization, it turned out that the low-pressure heater was not necessary here, as the amount of the working medium directed to it was zeroed. It should also be mentioned that optimization was carried out on the assumption that the sCO
2 power should be at the level of 10% of the piston motor power, which provides 18 kW. The exhaust gases are still relatively hot (at the level of 272 °C), but the system is characterized by relatively moderate operating parameters, e.g., the maximum pressure behind the compressor is 142 bar (usually, in this type of system, the pressure is approx. 270 bar).
The analyzed supercritical CO
2 system is presented in
Figure 3. This system consists of four heat exchangers (a cooler, a recuperator, and two heaters). Due to large changes in the specific heat of CO
2 at different pressures, heat removal can be effectively carried out by two heaters, one high-pressure and the other low-pressure. The amount of the working medium directed to them depends on the parameters of the system and the temperature of the heat source. In the analyzed case, the source of heat for the sCO
2 system is exhaust gases from a piston engine with a nominal power of 180 kW. The main task of the sCO
2 system is to collect as much heat as possible from the exhaust gas, while the efficiency of the sCO
2 system itself does not have to be high; greater emphasis is placed on minimizing the costs of the exchangers and the feasibility of the flow devices (from the point of view of rotational speeds and the size of the compressor blades). Therefore, the system with the configuration presented in
Figure 6 was subjected to optimization processes precisely from the point of view of maximizing the power of the system while minimizing the surface of the heat exchangers and maximizing the amount of the working medium flowing through the compressor.
The simulation revealed the sCO
2 would generate an extra 18.03 kW as a waste recovery cycle integrated with a reciprocating engine fueled by biogas. The basic parameters of the simulated cycle are listed in
Table 3.
Two sCO
2 systems were optimized: a simple cycle system and a cycle system with heat regeneration. Both systems were optimized for two different objective functions, for convenience, called max power and max efficiency.
Both objective functions included additional parameters (in addition to the efficiency and power of the system), such as the level of working pressure from the CO2 compressor, heat exchanger areas, and efficiency of rotating devices (compressor and expander). The objective functions were selected in such a way as to obtain the best parameters in terms of the cost of the entire installation in relation to the other parameters. Optimum means that any change in one of the parameters causes unfavorable changes in other parameters that are disproportionately greater.
Table 4 presents the results obtained during the optimization processes for the four analyzed scenarios. The highest power is obtained at a point for max efficiency for the simple cycle configuration; nevertheless, it is related to the very high efficiency of rotating devices (100%, which is a non-physical value). Moreover, this system also requires very high pressure behind the compressor (almost 190 bar) and moderate heat exchanger surfaces. The factor split between HTHX and LTHX is roughly 50:50. The use of less efficient rotating devices means a sharp decrease in power while maintaining high pressure behind the compressor (the second scenario).
The use of a regenerative exchanger enables the use of much less efficient rotating devices (as low as 67%), which seems physically feasible, especially on a small scale. In addition, the operating pressure is reduced by almost half, but at the expense of a larger heat exchange surface. However, it should be noted that in the last analyzed scenario, almost all CO2 is directed to HTHX so that LTHX can be avoided.
Evidently, the final decision on the configuration and parameters of the system to be used would be determined by the economic analysis, which is not the case here, and there are other aspects to consider, such as an increase in costs with an increase in heat exchange surface vs. a decrease in costs with a decrease in operating pressure in the system, etc.
4. Discussion
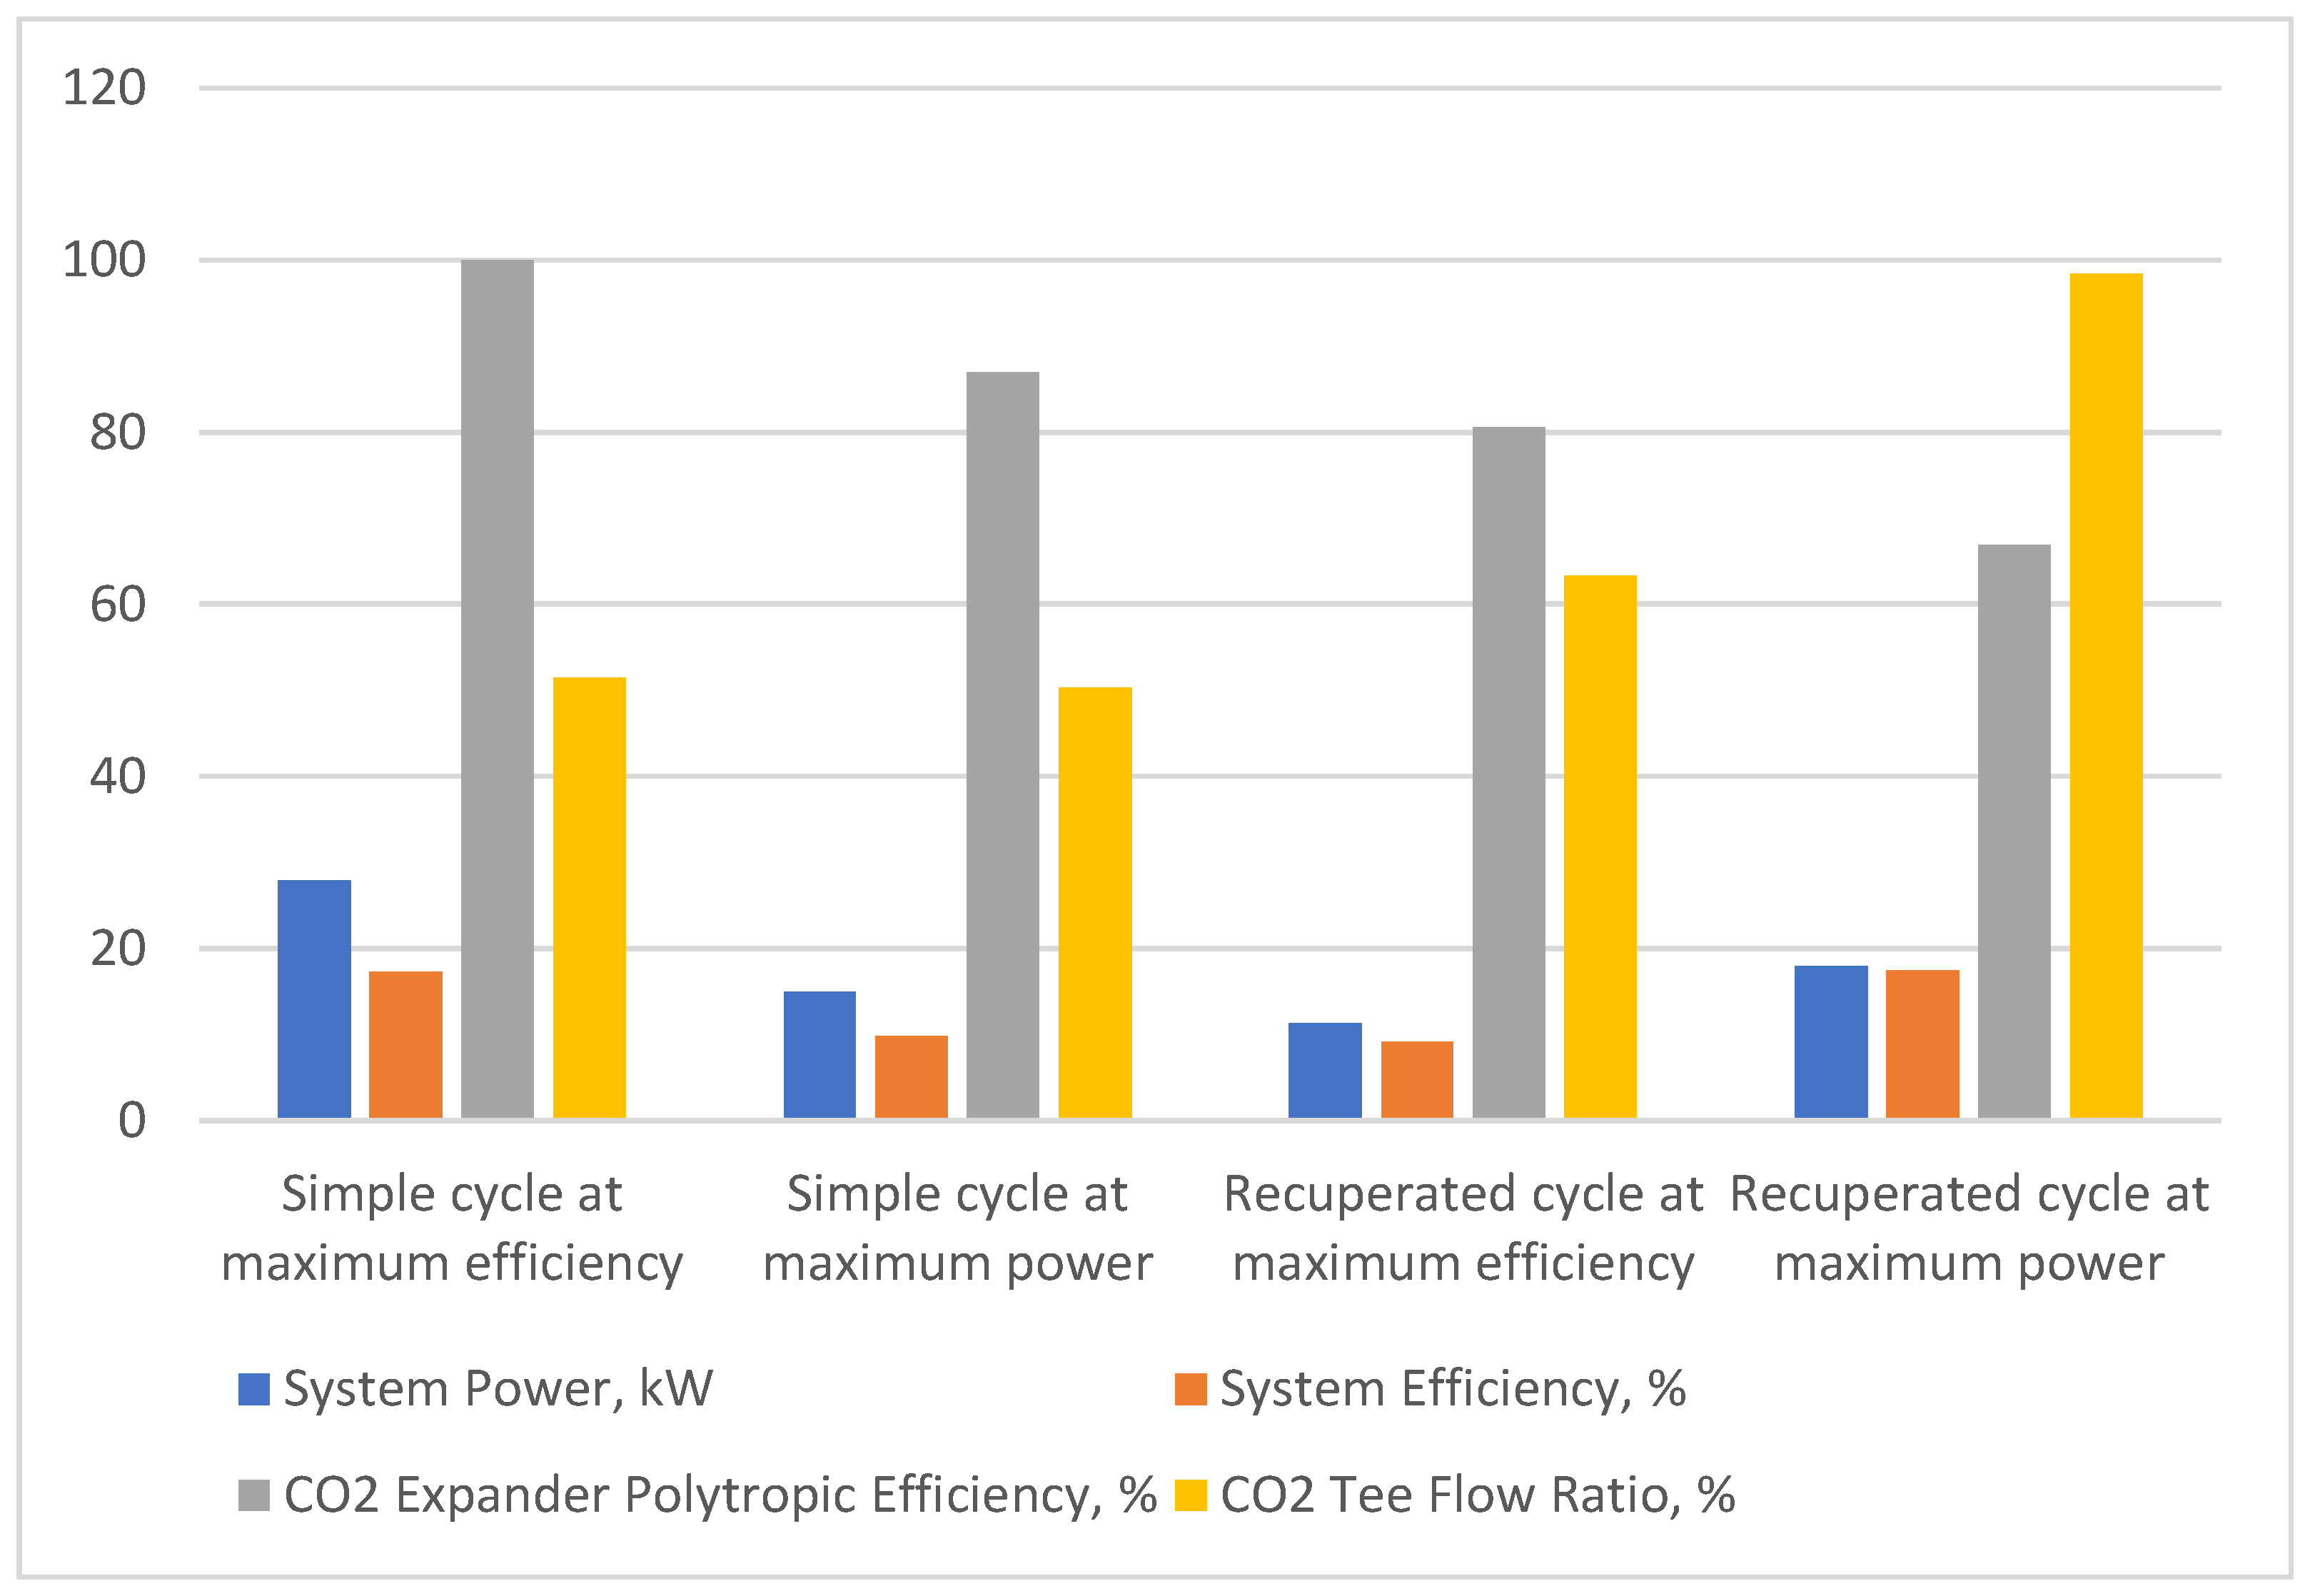
Figure 6 shows the detailed results of the optimization processes carried out for all analyzed scenarios from the point of view of system power, system efficiency, expander and compressor efficiency (for the sake of simplicity, the same values of the polytropic efficiency of these devices were assumed), and the amount of CO
2 stream directed to HTHX. The power of the system varies from 27.9 kW to 11.3 kW. These values do not fully correlate with the efficiency of the system, which ranges from slightly over 9% to over 17%. Optimum compressor and expander efficiencies range from over 60% to 100%. Of course, 100% is physically impossible to achieve; real values depend on the power of the installation and the amount of CO
2 flow. For the considered powers, more real values are in a range below 80%. The most interesting results, however, concern the share of the CO
2 stream directed to the HTHX. For most systems, this ratio is 50:50, but for the last case, it is almost 100%, which means there is no need to use the LTHX exchanger at all.
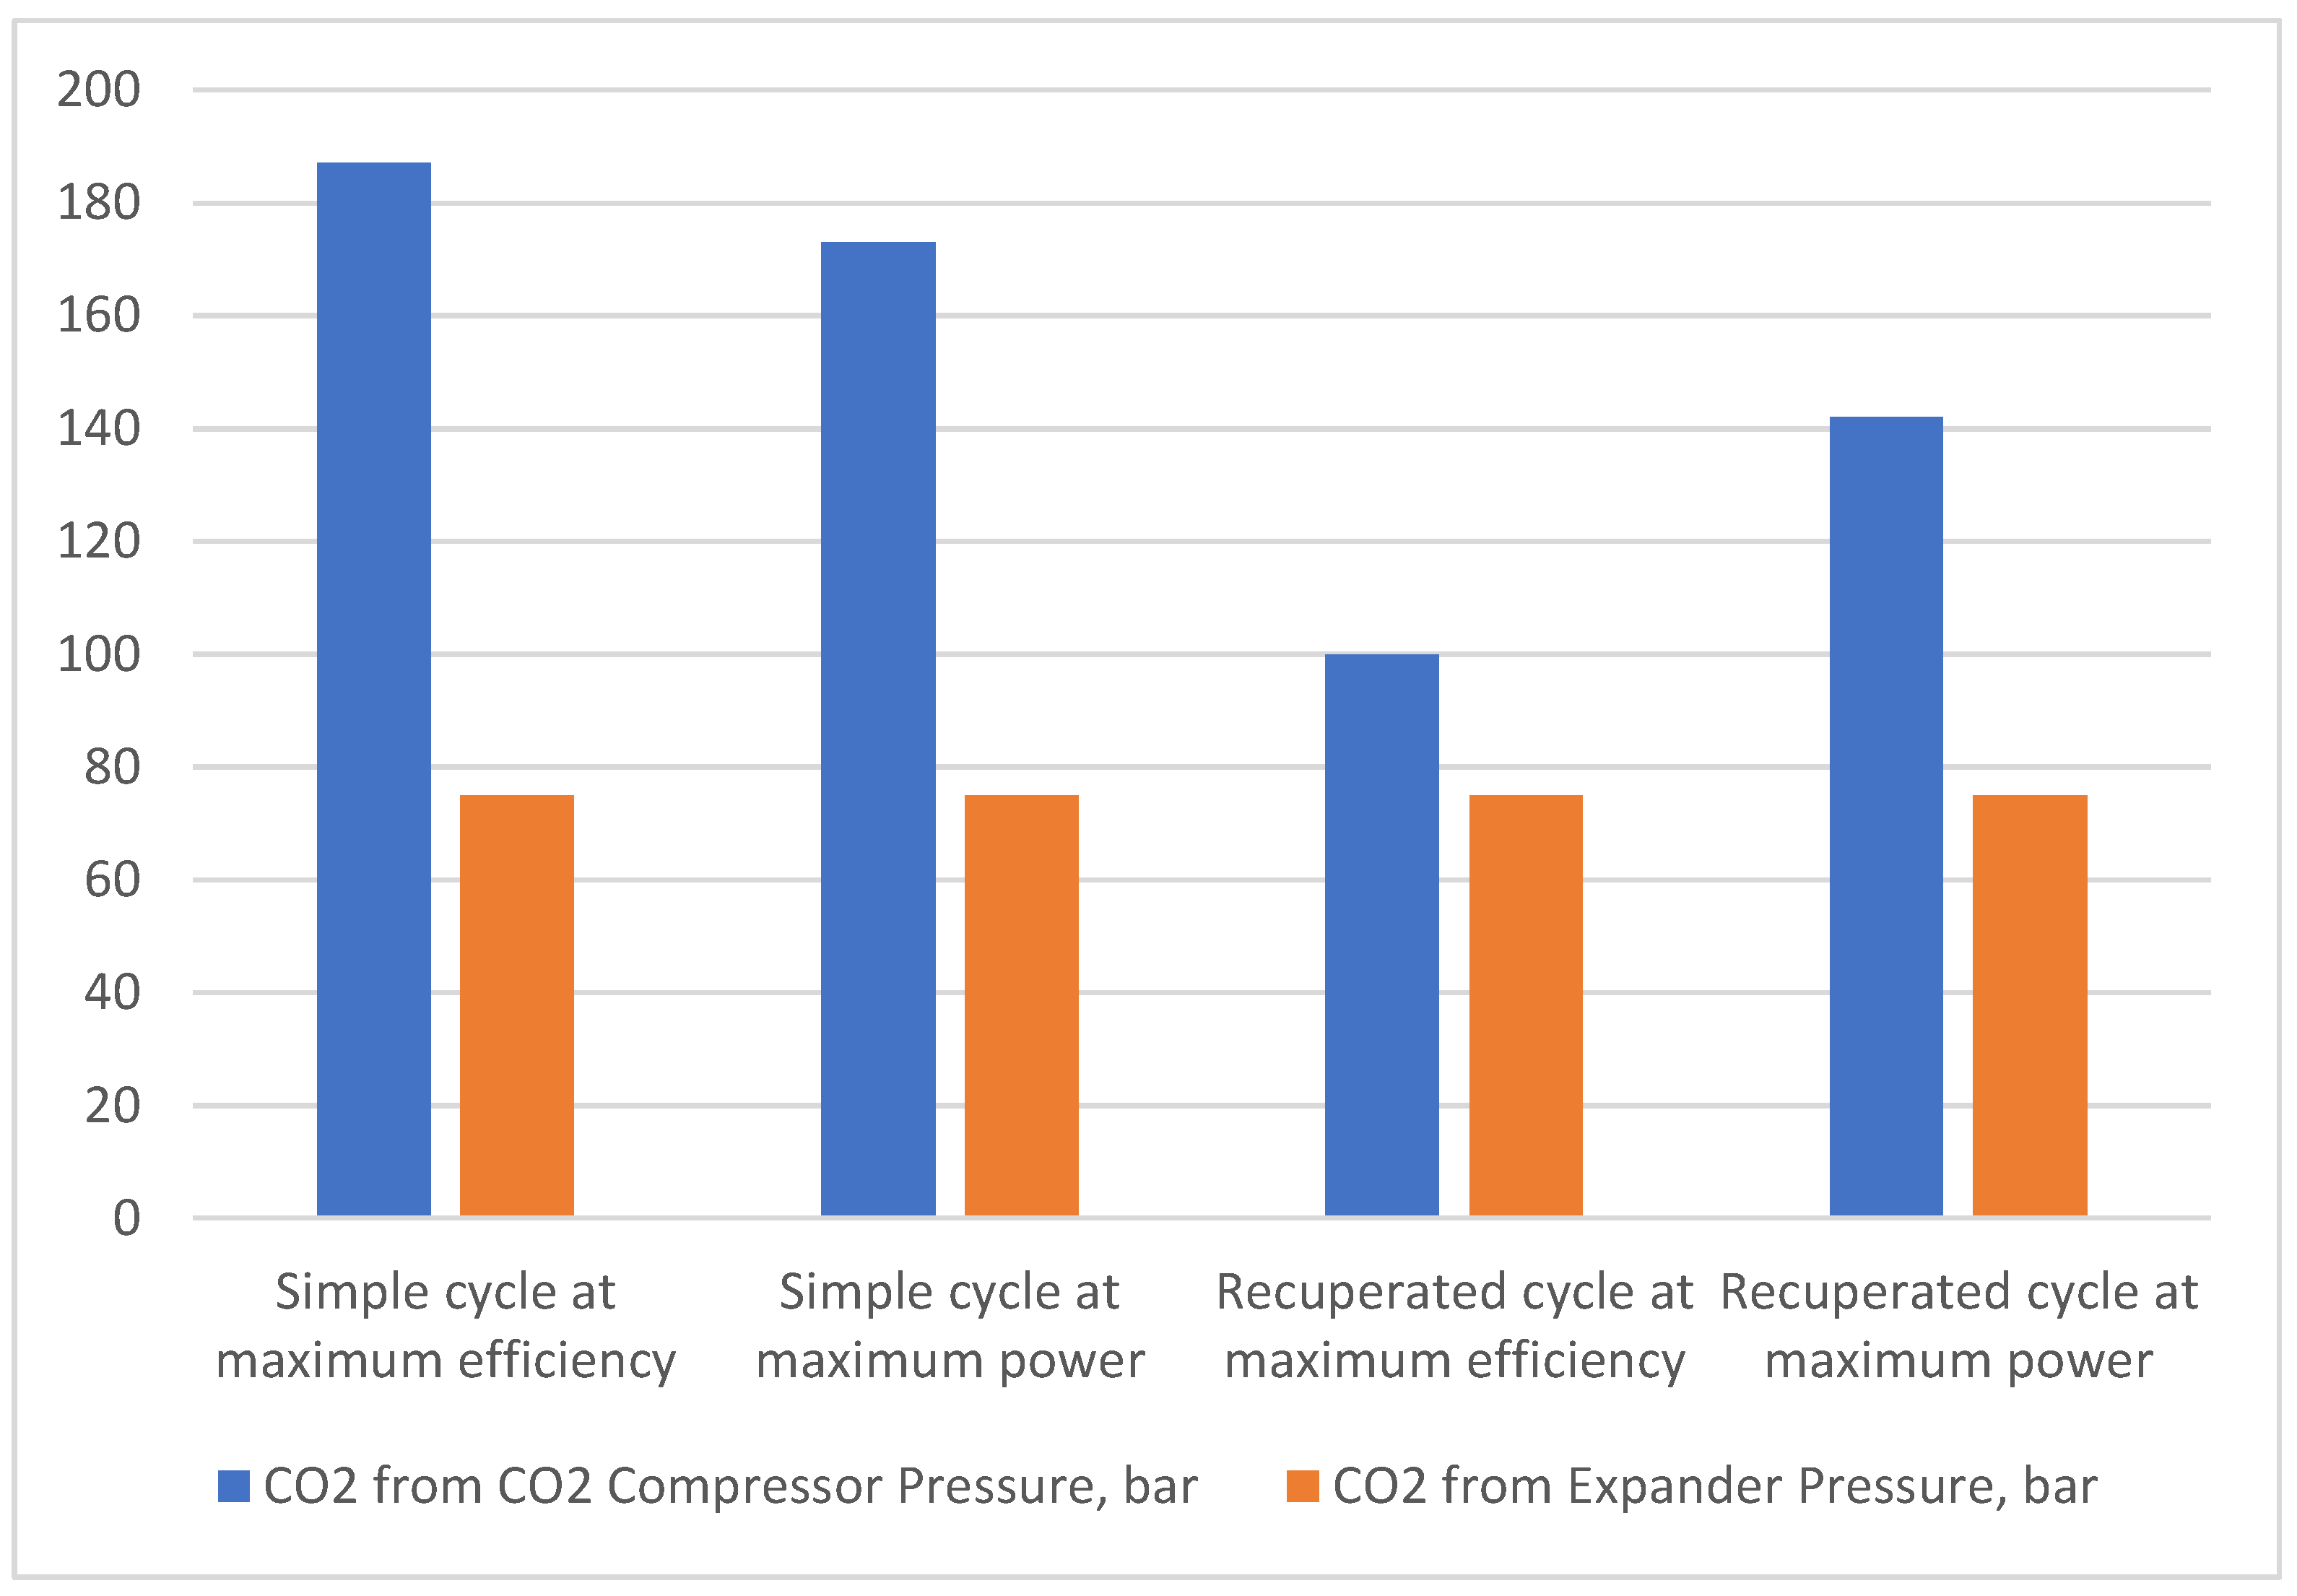
Figure 7 shows the working pressures of all systems obtained through optimization for the provided target functions. The limitation from the bottom was the pressure at the level of 75 bar (to avoid CO
2 condensation), and for all analyzed cases, this value turned out to be the best. Regarding upper pressure (produced by the compressor), its value was sewn into the objective function in such a way that the higher its value, the lower the target function value. The idea was to obtain a system with the lowest possible working pressure. From the point of view of the theory of gas turbines, systems with recuperation should be characterized by lower pressures than the simple cycle, and the results of the performed calculations confirm this relationship. In addition, all this is combined with changes in the specific heat of CO
2 along with pressure, which affects the division of the CO
2 stream between the LTHX and HTHX exchangers. This can be clearly seen in the diagram in
Figure 7, where for the last system (almost the entire CO
2 stream is directed to HTHX there), the working pressure is higher.
Systems including “maximum power” in their name were selected for multiplication of the maximum power and the amount of CO
2 directed to the expander. Thus, the greater the amount of this CO
2 stream, the more “optimal” the system.
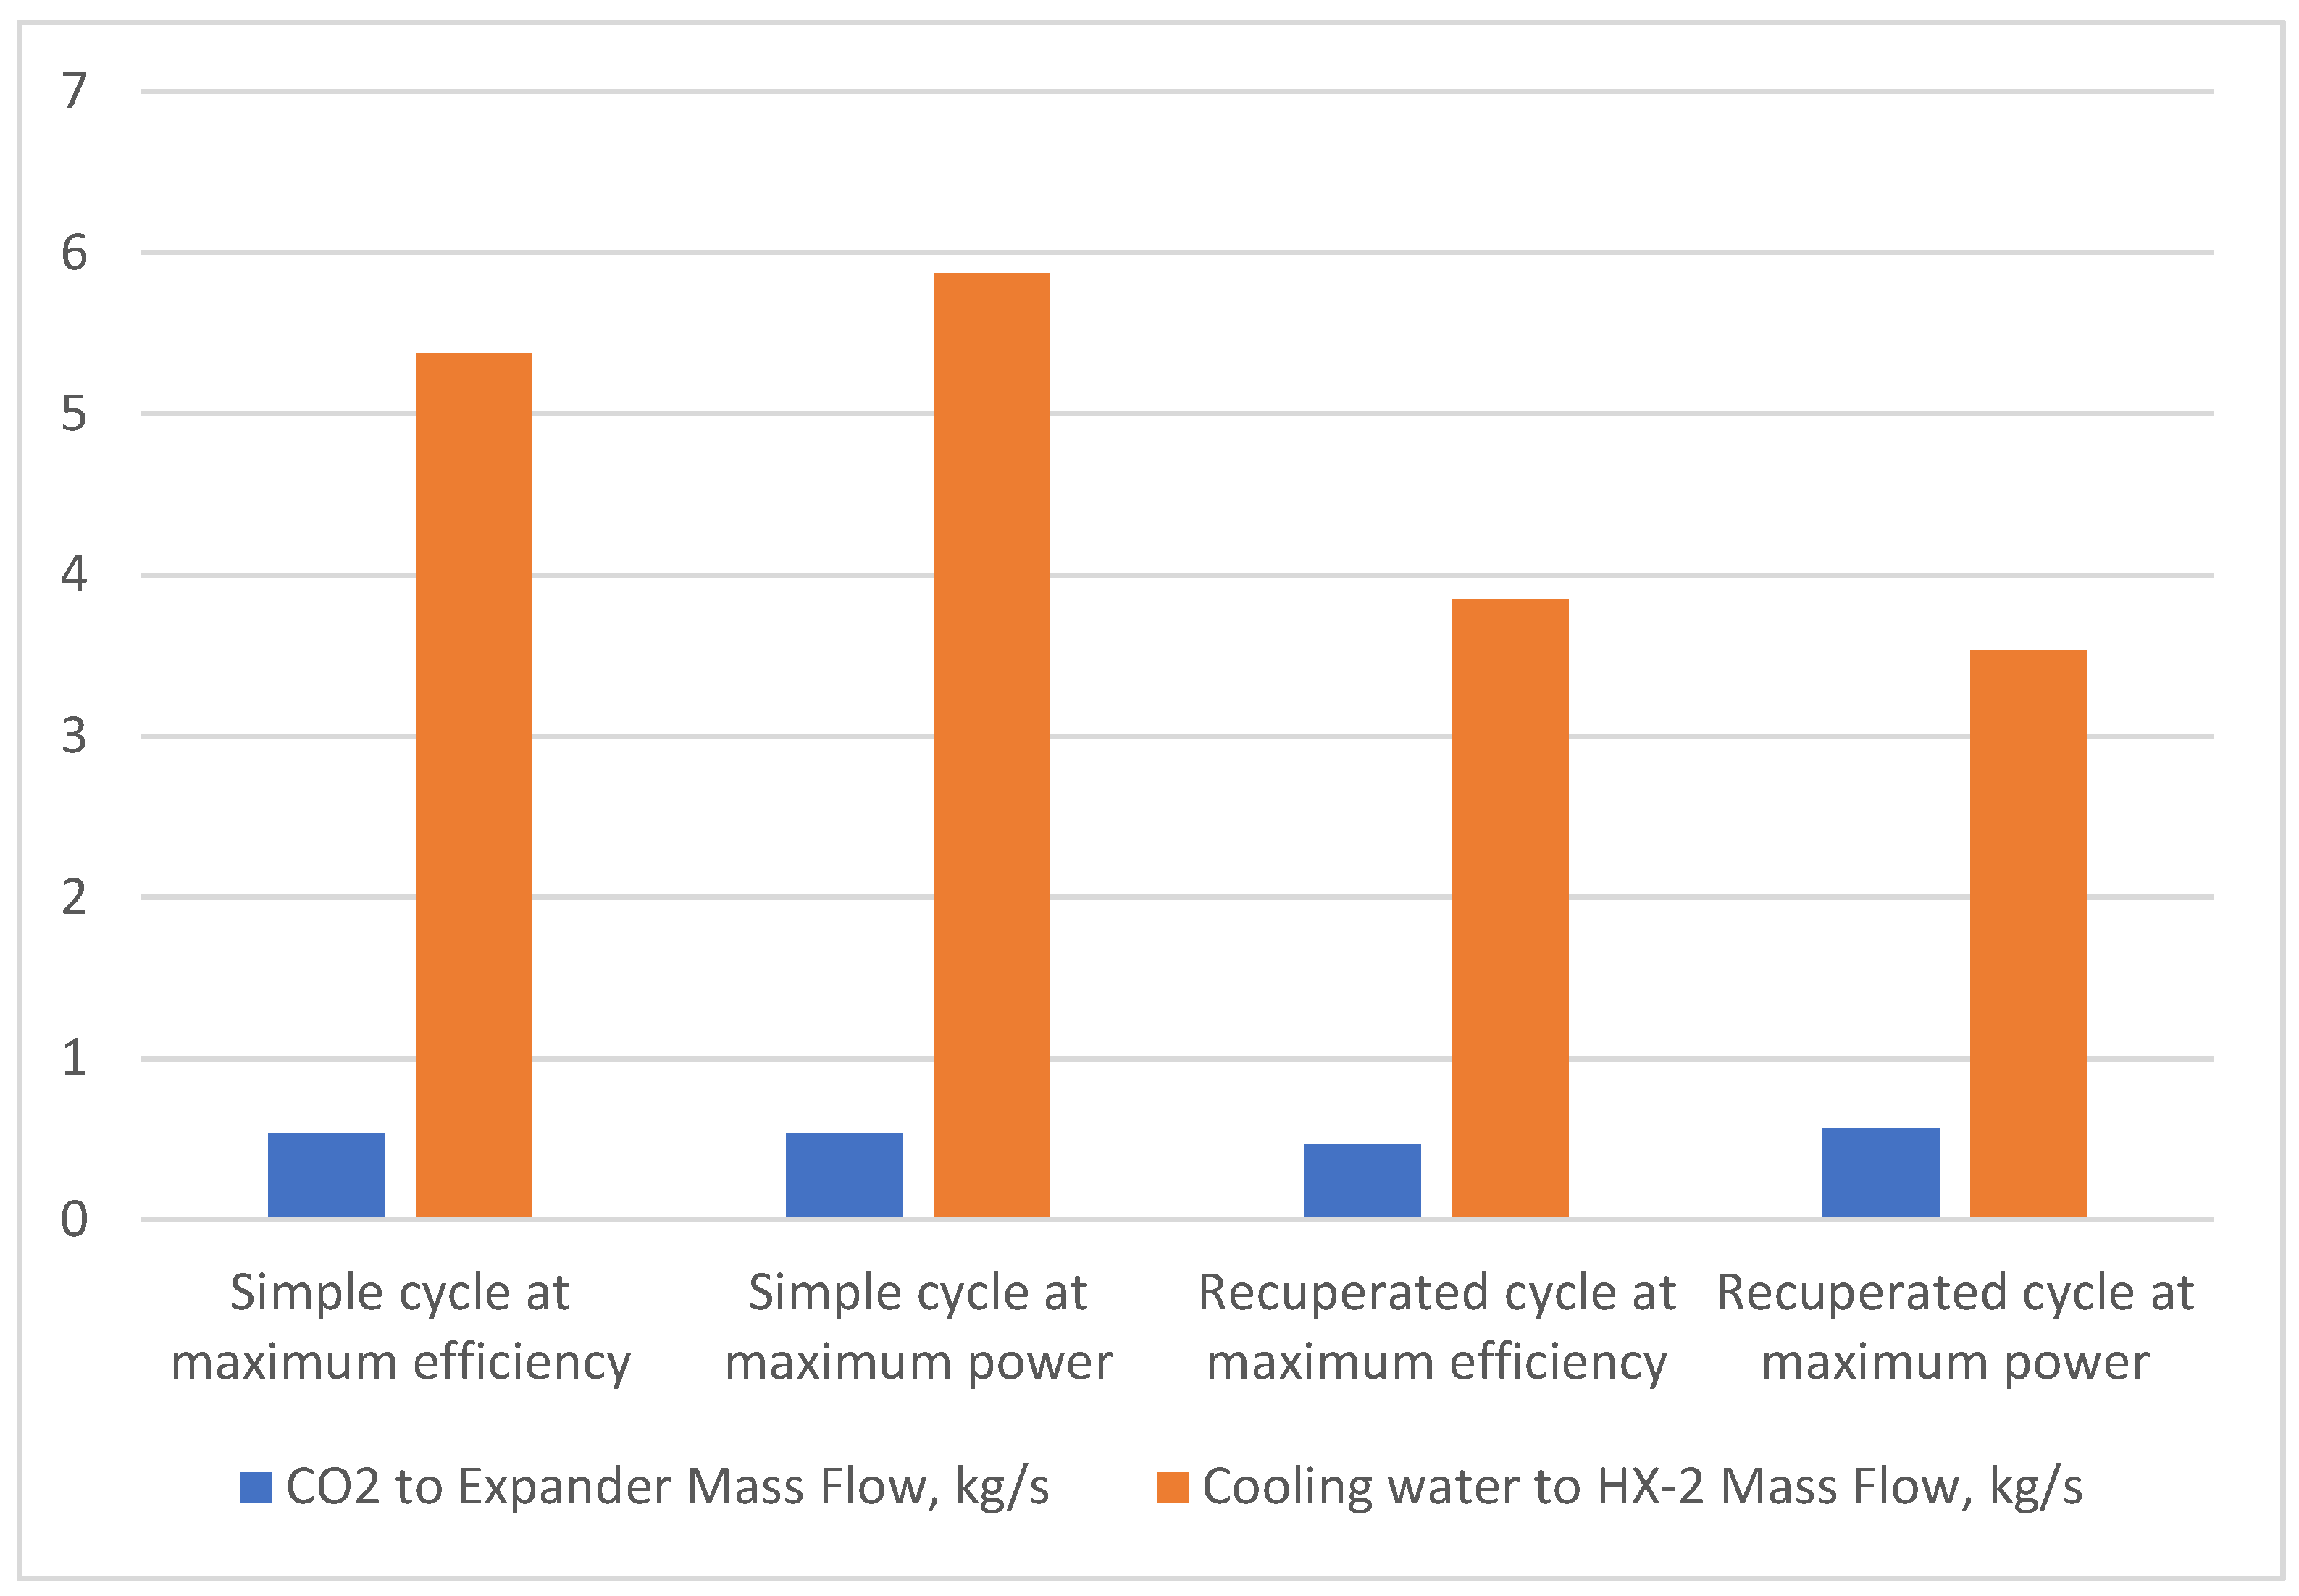
Figure 8 depicts the results obtained, showing that the amount of CO
2 does not change significantly. In addition, the diagram shows the amount of cooling water directed to the cooler and that most water is used in the simple system, which is characterized by the highest power generated from all analyzed systems, and the amount of walking water is correlated with the power of the entire system. Generally, recuperated systems require less cooling water than simple cycles.
The most crucial cost in the construction of sCO
2 systems is heat exchangers. On the one hand, they are simply large; on the other hand, they operate at high pressures. Thus, choosing them correctly can be a truly key issue.
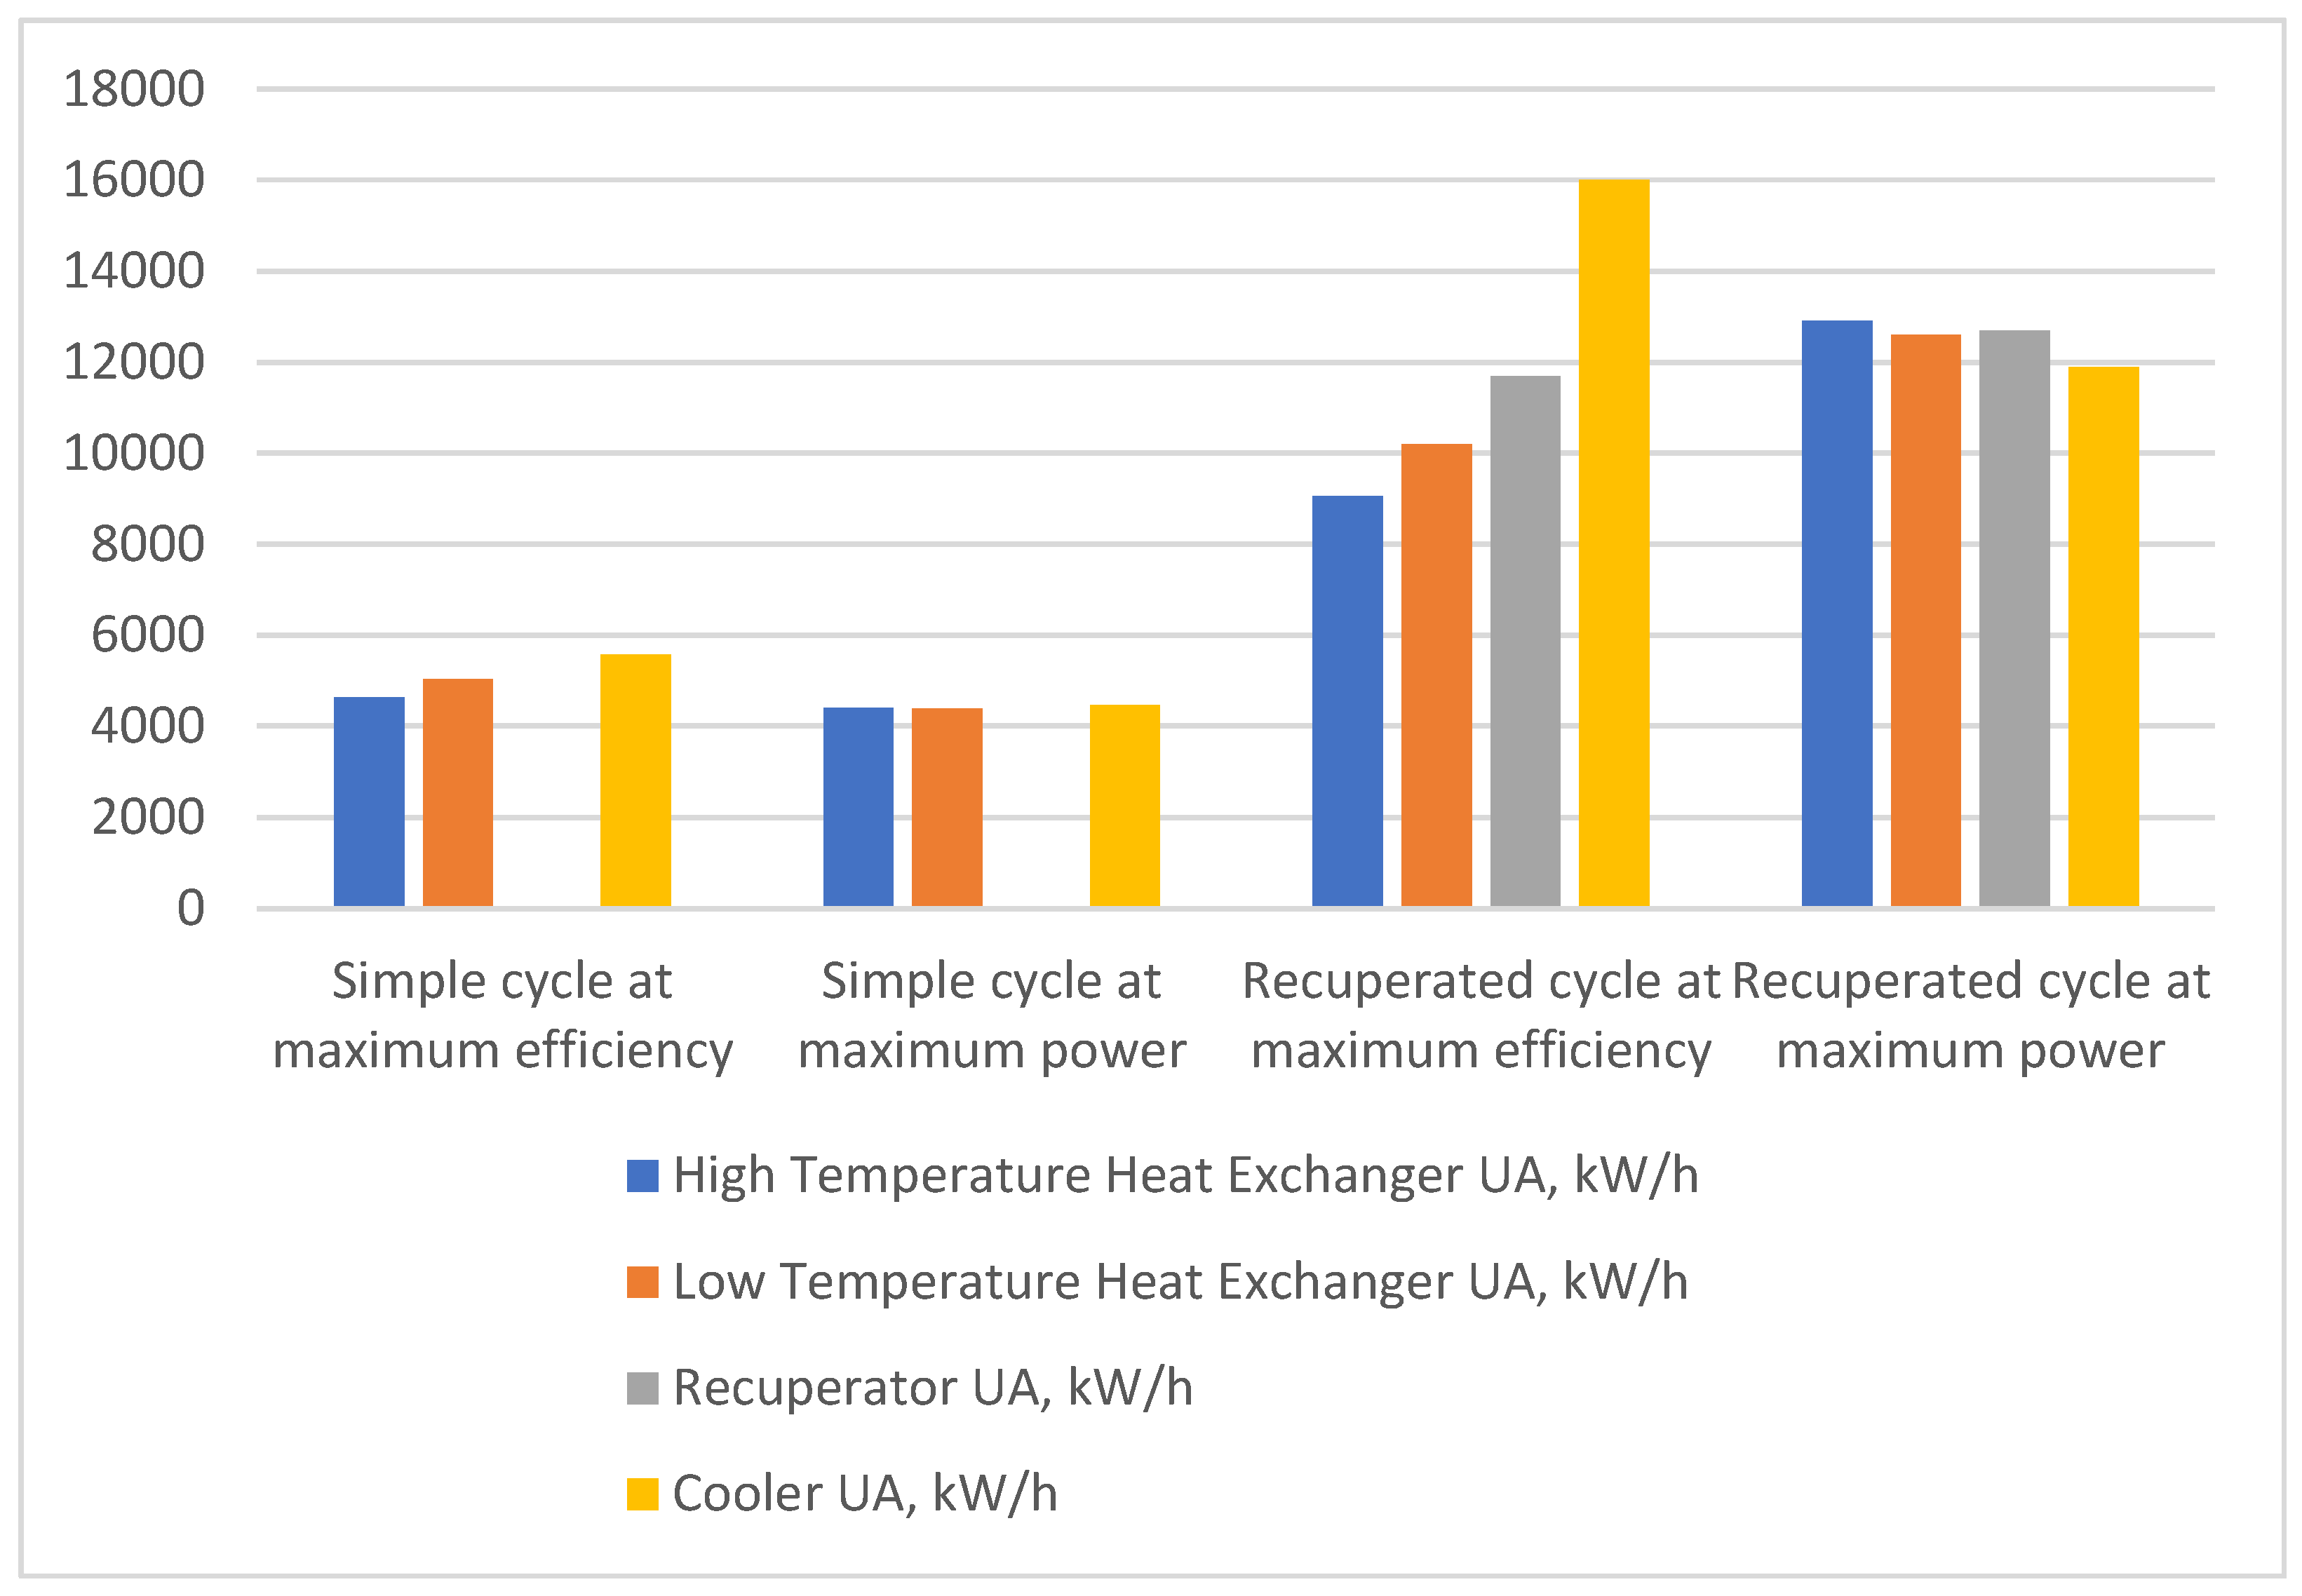
Figure 9 shows the calculation results of the analyzed systems from the point of view of the heat exchange taking place in the main exchangers. The parameter to be assessed is the multiplication of the heat transfer area and the heat transfer coefficient (UA). Simple cycles are characterized by smaller heat exchangers in relation to systems with recuperation. Additionally, in simple systems, there is one exchanger less. From this point of view, simple cycles should be much cheaper, but on the other hand, these exchangers run at higher pressures. However, in one of the last analyzed systems, the low-temperature exchanger (LTHX) can be theoretically avoided.
Based on the calculation, the “Recuperated cycle at maximum power” was chosen for further investigations. The next step of the analysis was analyzing the off-design operation of the system and selecting a turbomachinery design. The goal of this activity was to select optimal parameters and a preliminary turbomachinery design. The optimal cycle operation point requires extremely small turbomachinery dimensions (rotor with a diameter of about 7 mm) and high operating speeds (180,000 rpm), which is a challenge for the mechanical feasibility of the devices. Therefore, cycle parameters are subject to further modification to address turbomachinery design.
To facilitate the calculations, the same polytropic efficiencies for the compressor and expander were assumed, which in a sense corresponds to the reality, as the isentropic efficiency of a compressor is usually lower than its polytropic efficiency, and the opposite is true for turbines. The off-design analysis was already performed for the adiabatic efficiencies, as assumed in
Table 5. This table also contains other parameters taken as output for off-design analyses.
The sensitivity analysis was carried out in the ranges of parameters provided in
Table 6, and on its basis, graphs were created in the form of two-dimensional maps on which changes in key variables were presented.
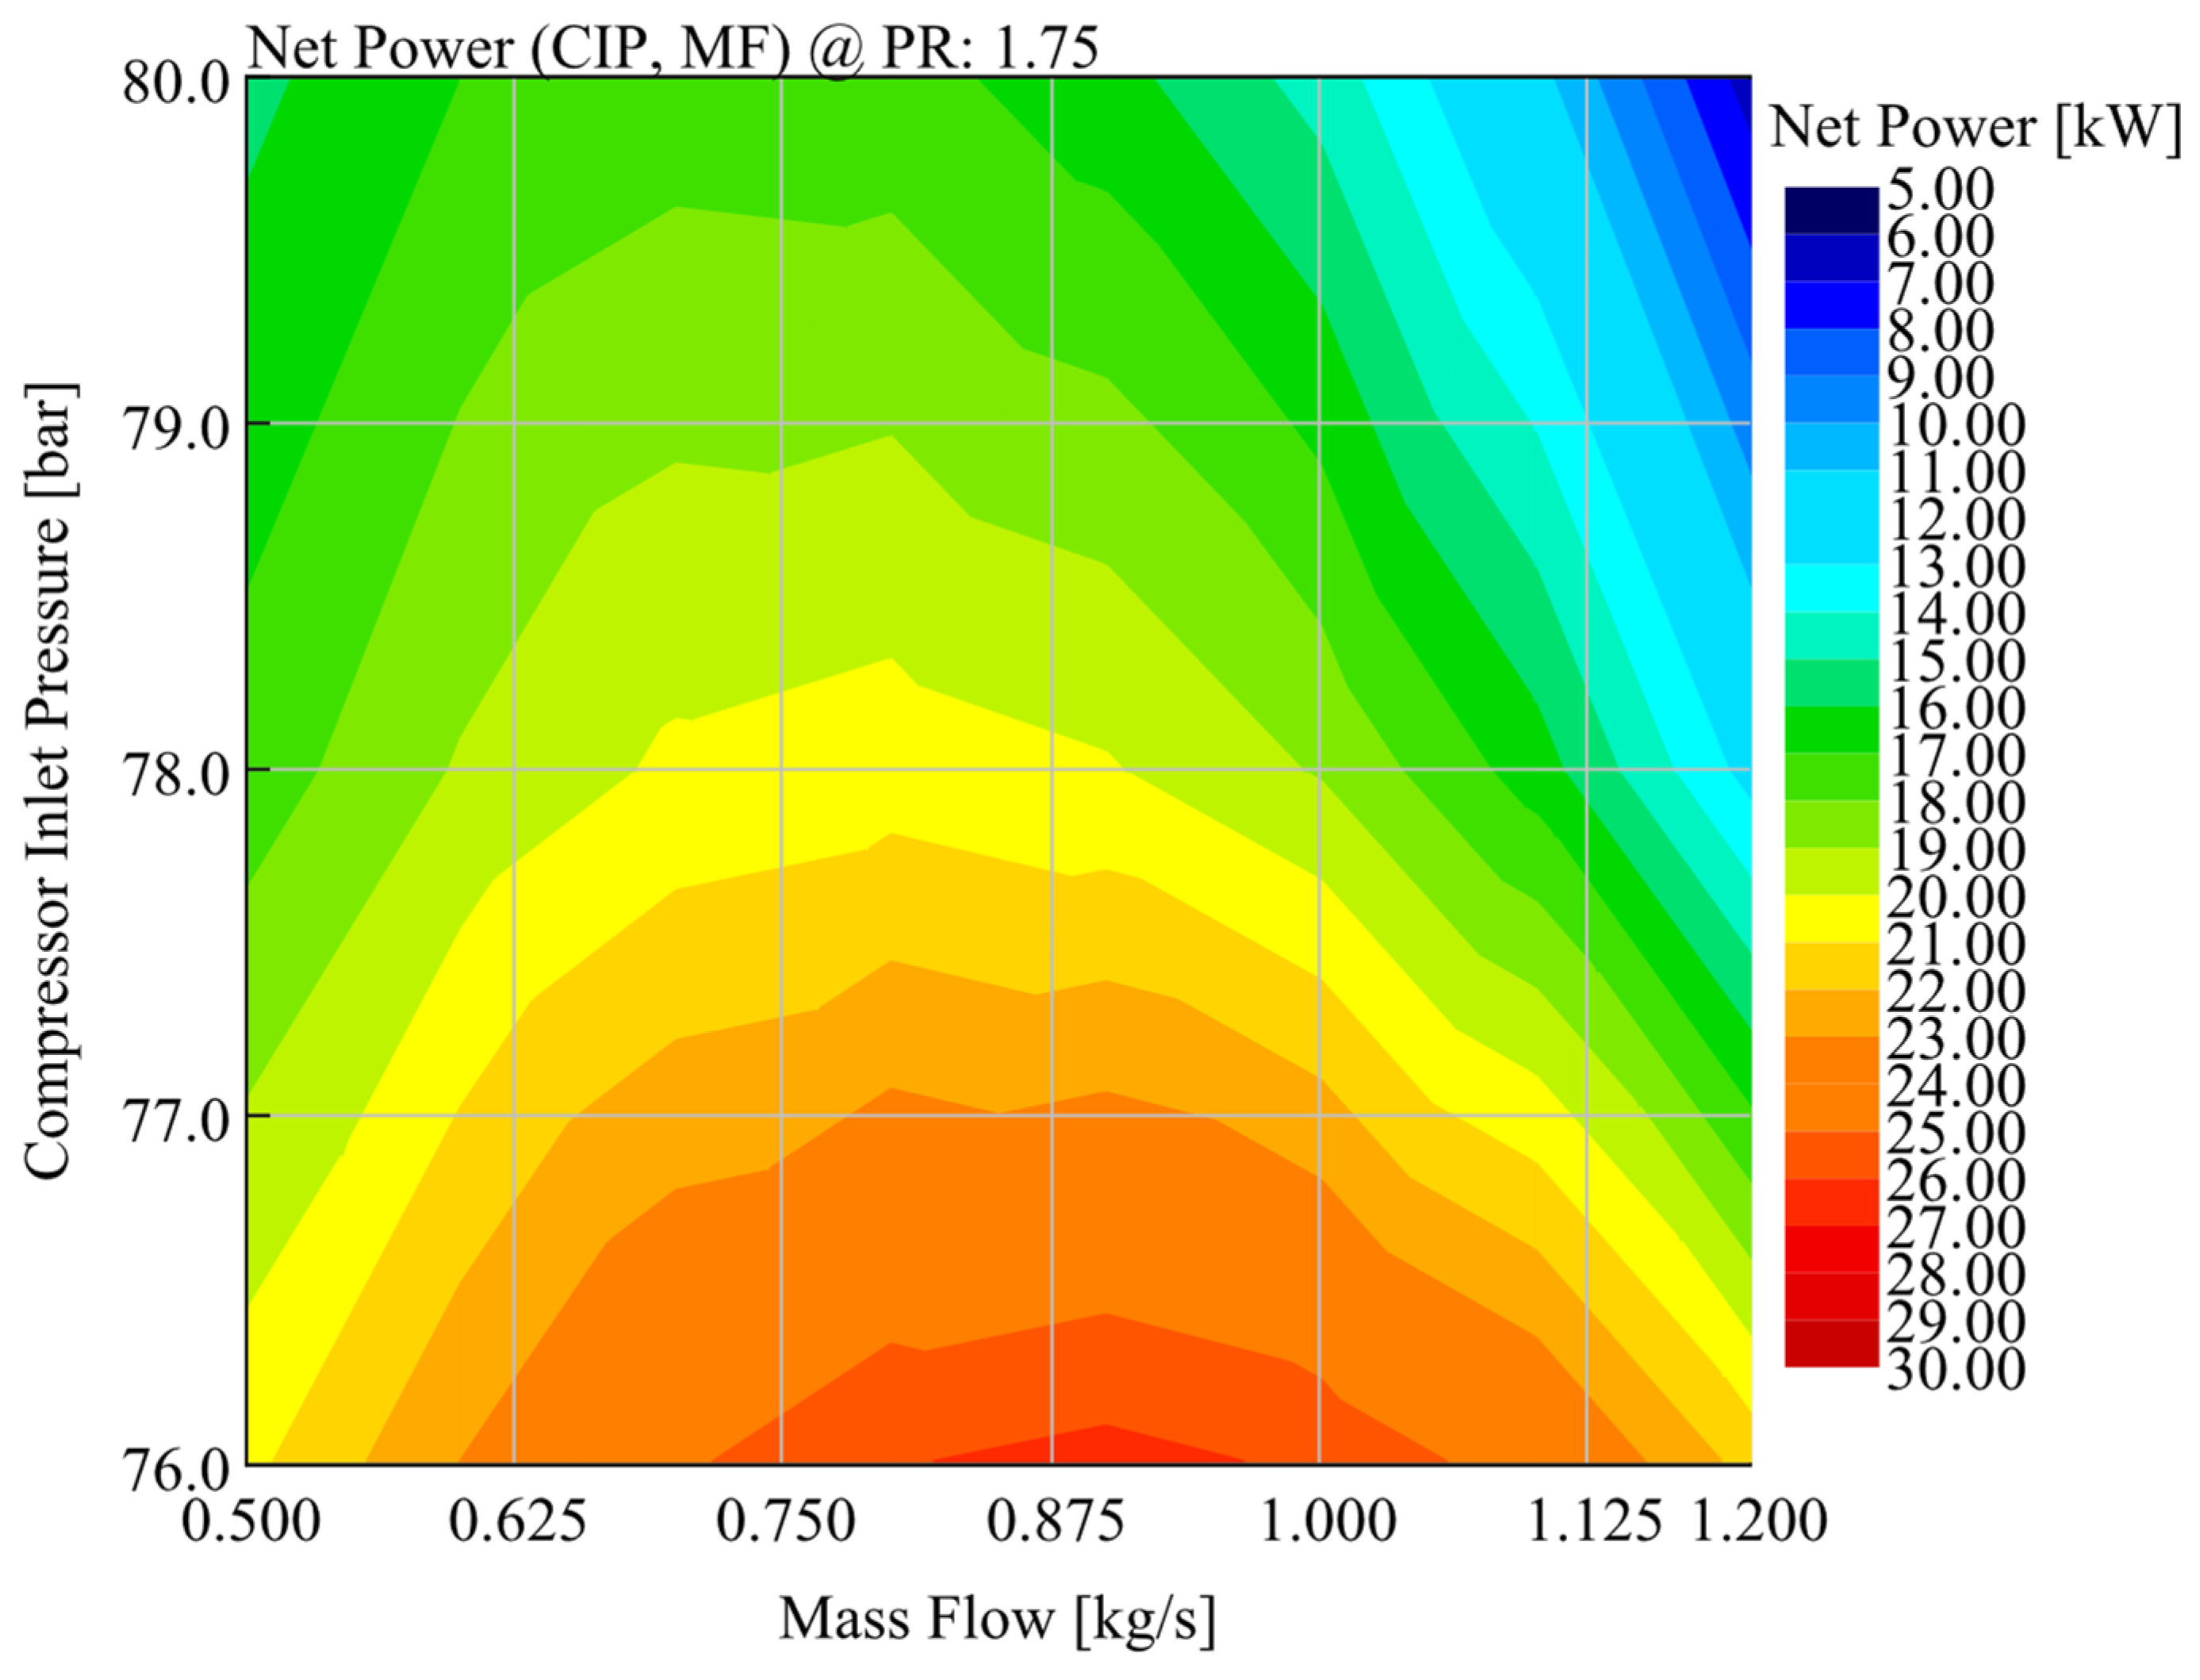
Figure 10 shows a map of the characteristics of the system power changes as a function of the pressure ratio and the amount of the working medium. Depending on the magnitude of these variables, the power of the system varies between 5 and 30 kW (the target is 18 kW). Interestingly, the system achieved maximum power for compression of approximately 1.75 and 0.9 kg/s, but we do not have information about the values of other variables that were selected during optimization processes for the entire system.
Figure 11 shows the effect of pressure in front of the compressor (reminder: in the calculations for optimization, a minimum of 75 bar was assumed). The higher the pressure behind the compressor, the lower the power of the system (this is obvious because the pressure ratio of the entire system drops), and the optimal flow of CO
2 flows for the given pressure in front of the compressor can be found.
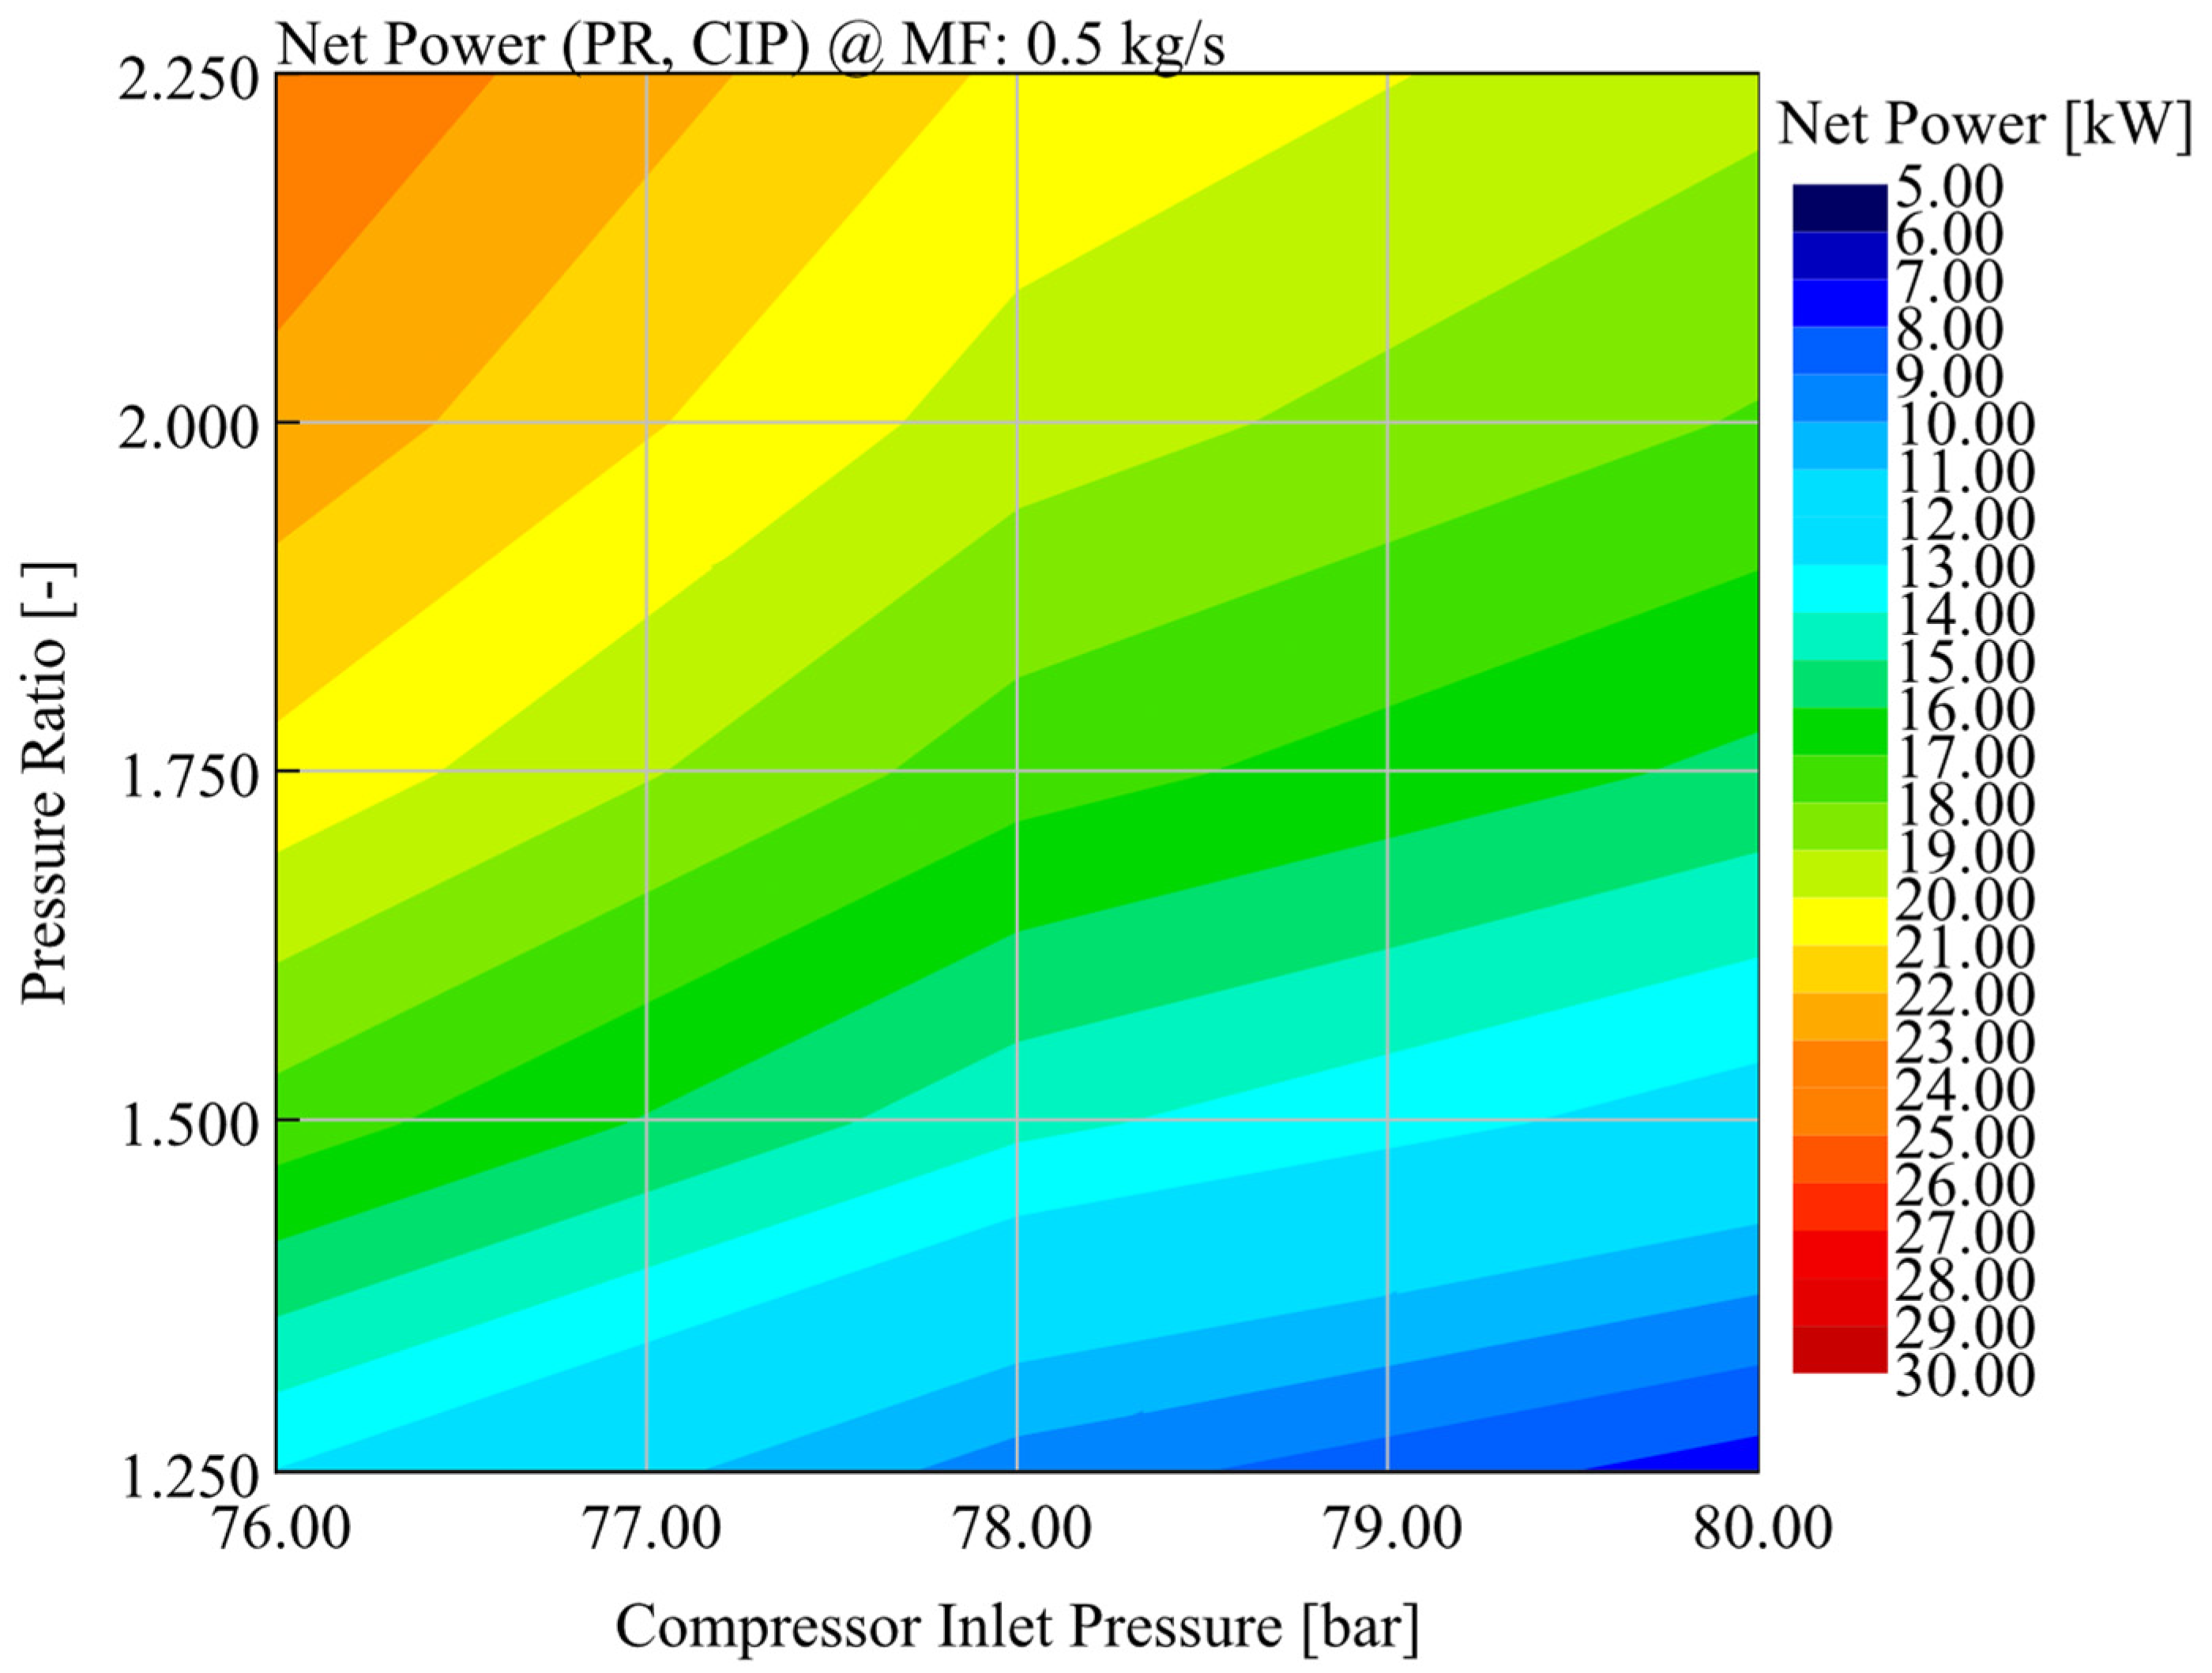
Figure 12 shows the effect of the pressure ratio and inlet pressure on the CO
2 compressor on the power of the system. There are no optimal points here; the higher the pressure ratio, the higher the power of the system. The same goes for the influence of the inlet pressure on the compressor.
Based on the sensitivity analysis carried out for the off-design operation of the turbomachinery, the new design point was selected, as shown in
Table 7. It showed acceptable performance, allowing reasonable turbomachinery size.
In summary, a model of the sCO
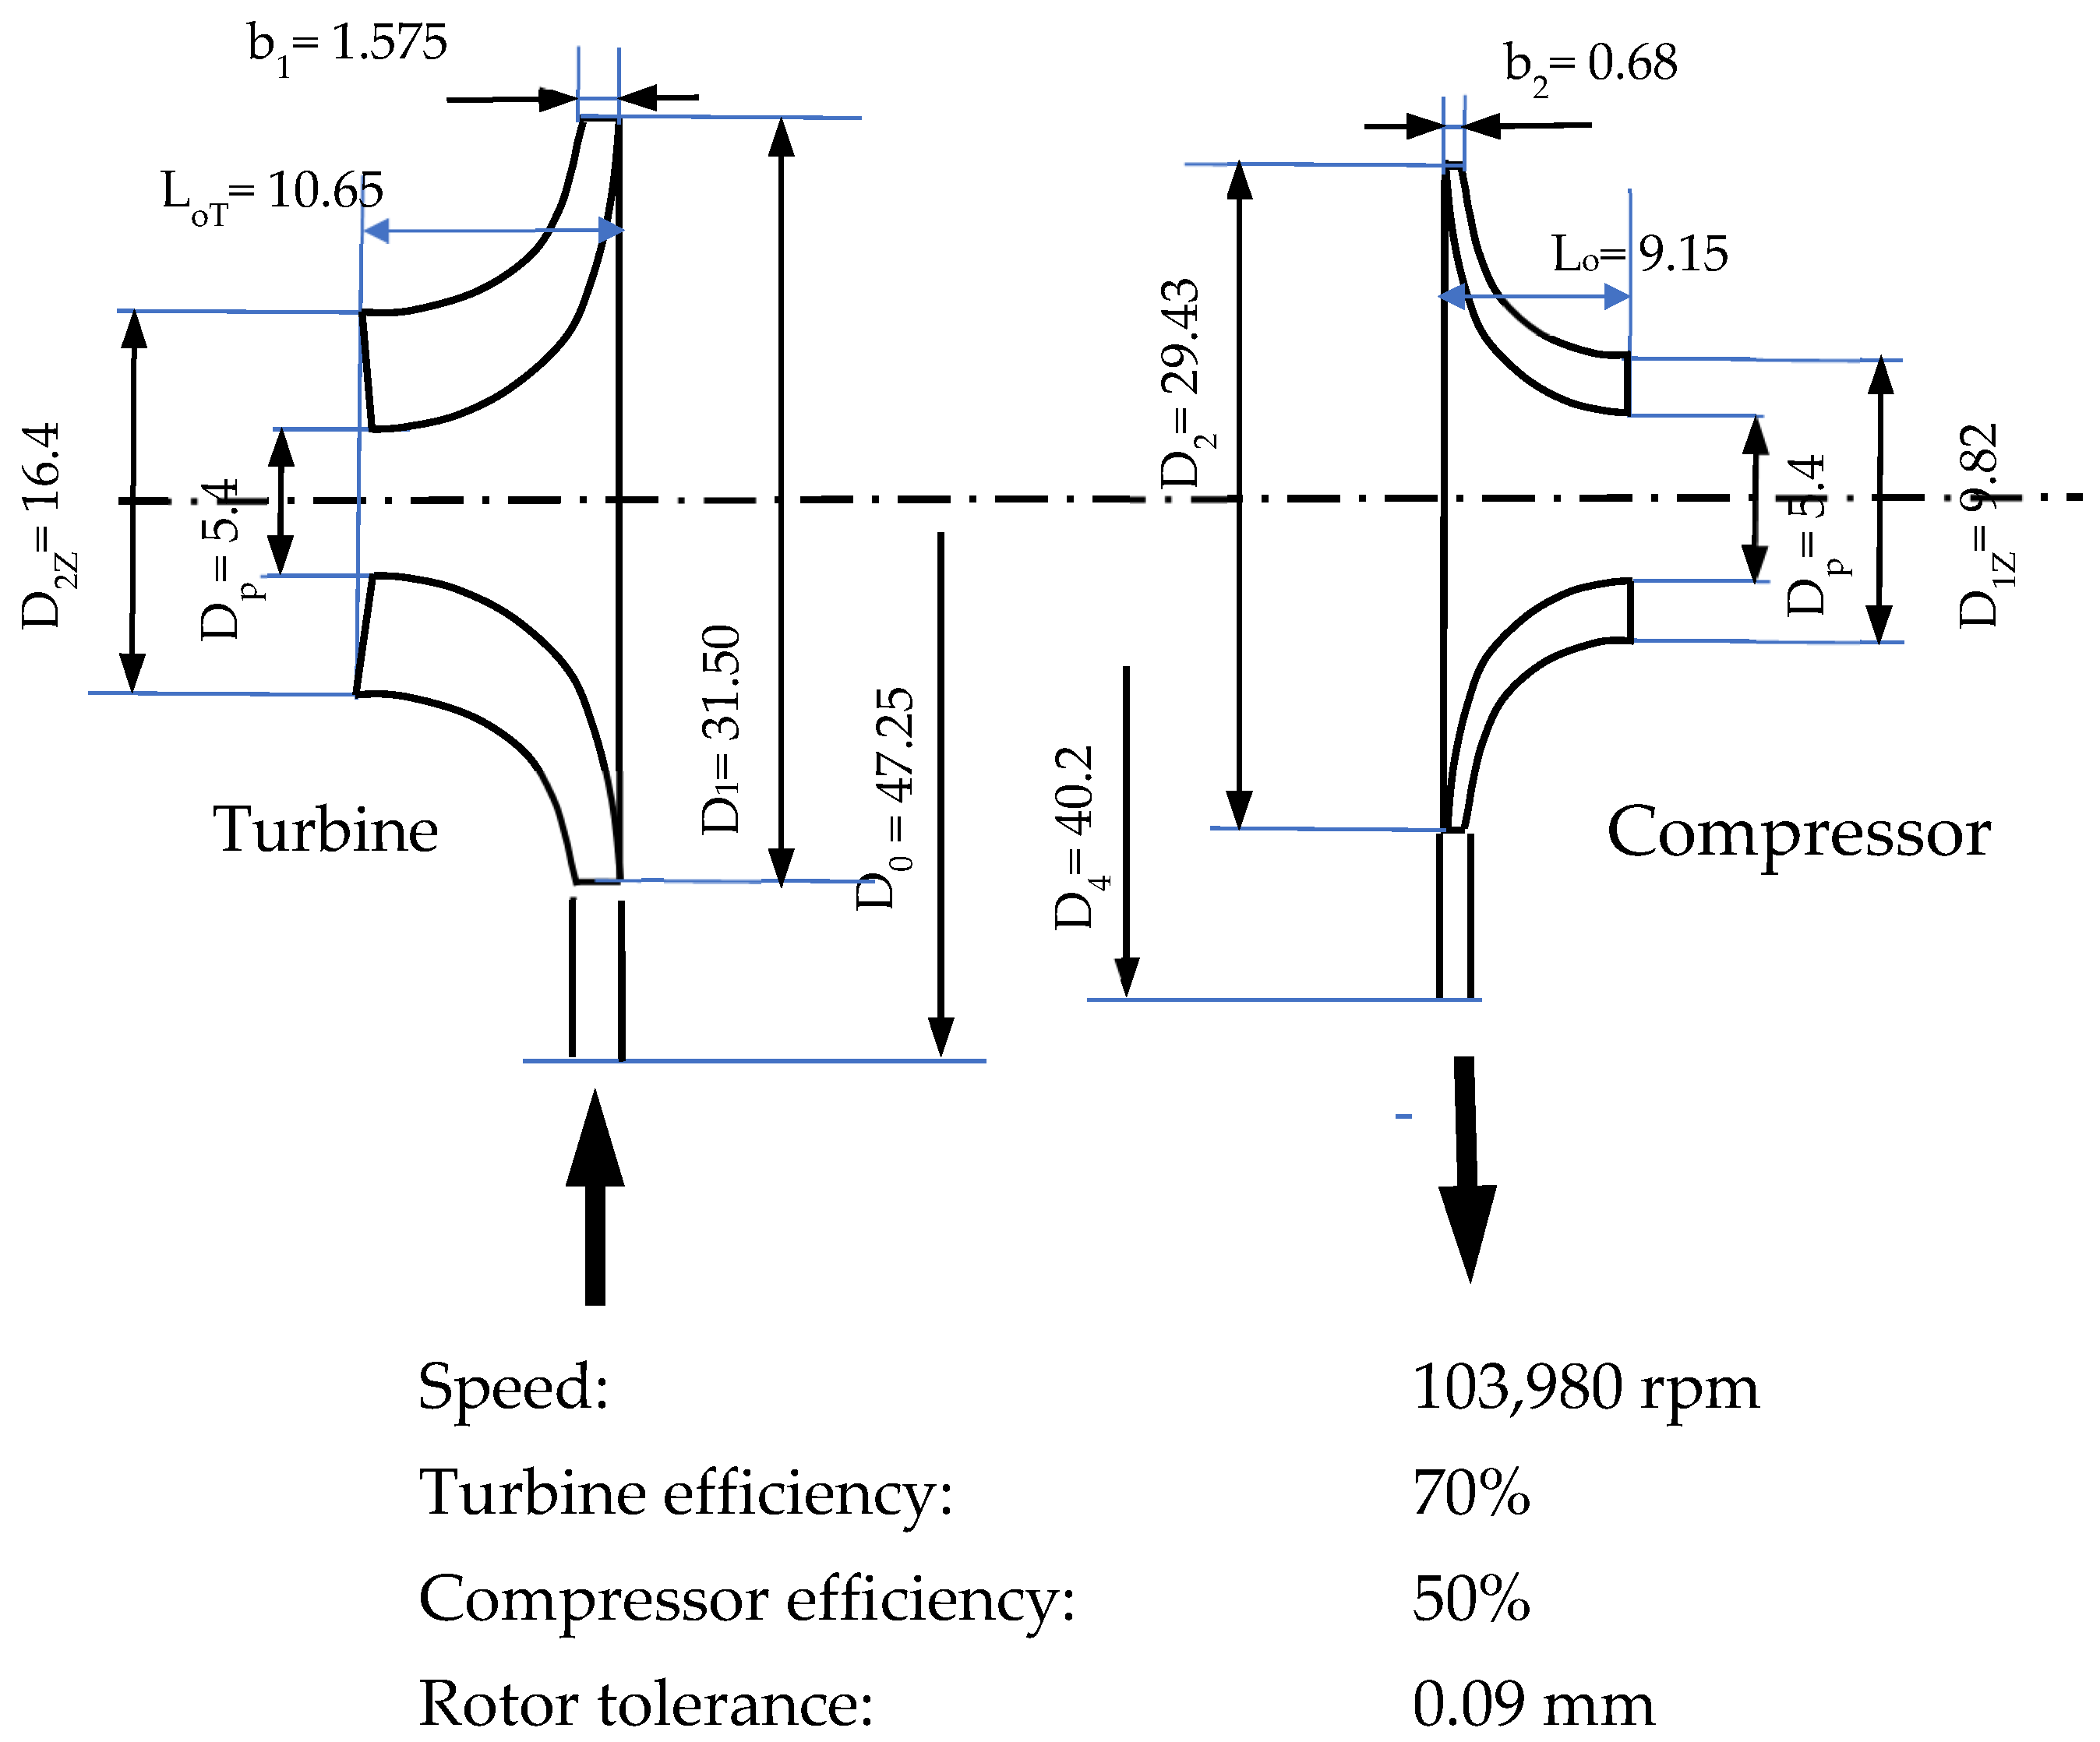
2 system was successfully built, its parameters optimized to minimize investment costs, and then an off-design analysis was performed to select the parameters of the turbomachinery itself. The authors designed the preliminary dimensions of the turbomachinery (see
Figure 13).
The dimensions of the turbomachinery are relatively small, which translates into the high speed of the whole device. Nevertheless, progress can be made towards a more feasible design: the starting point was a rotor dimension of 7 mm, and now it is 16 mm. The speed also dropped from 180,000 to 100,000 rpm. At the same time, the efficiency of the devices lies within the assumed design windows.
5. Conclusions
This study provides critical insights into the application of supercritical CO2 (sCO2) cycles for heat recovery from exhaust gases in a 180-kW piston engine powered by biogas. The innovative approach involved developing models in two distinct computing environments, Aspen HYSYS and GT Suite, to propose a two-stage heat recovery system. This system, characterized by its use of dual heat exchangers with varying CO2 streams, represents a significant advancement in the field of energy recovery.
A key aspect of this research is the optimization of operating parameters, focusing not only on efficiency but also on maximizing power output and CO2 flux through centrifugal machines. This approach led to the identification of a system with the most favorable operational parameters, which includes low-efficiency rotor devices and a reduced number of heat exchangers operating at moderate working pressures. This system stands out for its practical applicability despite encountering some theoretical limitations like the impracticality of 100% efficiency.
The research opens several avenues for future exploration. It highlights the potential scalability of sCO2 cycle systems in larger industrial settings and their integration with renewable energy sources, which could further enhance environmental impacts. Additionally, the study points to the need to investigate long-term operational stability and economic viability across various geographical and climatic conditions. Advancements in materials and technology used in these systems could also lead to increased efficiencies and operational benefits.
More broadly, this research has far-reaching implications for energy efficiency and greenhouse gas reduction. It presents a tangible pathway towards more sustainable energy practices by showcasing the efficacy of sCO2 cycles in waste heat recovery. The study not only contributes to academic knowledge but also has the potential to influence policy and industry standards, encouraging the adoption of efficient and environmentally friendly technologies. Furthermore, it may stimulate innovation in related fields, expanding the application of sCO2 technologies in various industrial processes.
Our study addresses a critical gap in the field of thermal engineering, particularly in the design and optimization of heat exchangers in supercritical CO2 (sCO2) systems. By exploring the simulation, analysis, and optimization of a supercritical CO2 (sCO2) cycle for waste heat recovery integrated with a reciprocating engine, our research offers potential solutions to increase the thermal efficiency of both existing units and those designed in the future. Our solution has potential in decarbonizing the energy industry because, as we have proven, it can successfully work with engines powered by alternative (zero emission) fuels. Moreover, the working medium (CO2) circulating in the system may come from a CO2 capture installation.
In summary, this research on sCO2 cycles in waste heat recovery systems is a pivotal contribution to the energy sector. It emphasizes the capacity for substantial improvements in energy efficiency and reduction in greenhouse gas emissions. These findings are poised to shape future technological development, foster the adoption of sustainable energy practices, inform policymaking, and pave the way for further research and breakthroughs in sustainable energy technologies.
